Project Quant Patch Management Survey
18
© Copyright 2009, http://creativecommons.org/licenses/by-nc-nd/3.0/us/ August 2009 Jeffrey R. Jones, Microsoft http://blogs.technet.com/security Rich Mogull, Securosis http://securosis.com/blog The raw data analyzed in this report is available for your own analysis from the Project Quant site under Create Common licensing at, http://www.securosis.com/projectquant Project Quant Patch Management Survey Summary and Analysis of Results 0 10 20 30 40 50 60 70 80 90 100 Maturity of Patch Management Process N/A: No formal or informal patching. Informal: Lacking both policies and tools; an ad-hoc/as needed exercise. Tool Driven: relies strongly on tools and their workflow, but without defined policies. Policy Driven: relies on adherence to policies, lacking strict workflow or tools/resources. Mature: well defined policies, workflow, and tools/resources. Do not know As part of the Project Quant community effort to develop a well-defined patch management cost model, the project team fielded a survey of patch management questions covering aspects of the patch management process. While we believe this survey, due to self-selective participation, is biased towards companies with active patch management efforts, the results were informative in that context. Key findings from the survey include: Most companies were driven by compliance regulation, usually more than one regulation applied Process maturity was generally high for operating systems, but low for other asset types such as applications and drivers (see chart) Companies tend to utilize multiple vendor and 3 rd -party tools in their patch management process 40% of companies depend on user complaints as one factor for patch validation The survey continues! Help further refine our findings by taking the survey at: http://www.surveymonkey.com/s.aspx?sm=SjehgbiAl3mR_2b1gauMibQw_3d_3d
Transcript of Project Quant Patch Management Survey

© Copyright 2009, http://creativecommons.org/licenses/by-nc-nd/3.0/us/ August 2009
Jeffrey R. Jones, Microsoft
http://blogs.technet.com/security
Rich Mogull, Securosis
http://securosis.com/blog
The raw data analyzed in this report is
available for your own analysis from
the Project Quant site under Create
Common licensing at,
http://www.securosis.com/projectquant
Project Quant Patch Management Survey Summary and Analysis of Results
0
10
20
30
40
50
60
70
80
90
100
Maturity of Patch Management Process
N/A: No formal or informal patching.
Informal: Lacking both policies and tools; an ad-hoc/as needed exercise.
Tool Driven: relies strongly on tools and their workflow, but without defined policies.
Policy Driven: relies on adherence to policies, lacking strict workflow or tools/resources.
Mature: well defined policies, workflow, and tools/resources.
Do not know
As part of the Project Quant community effort to develop a well-defined
patch management cost model, the project team fielded a survey of
patch management questions covering aspects of the patch
management process. While we believe this survey, due to self-selective
participation, is biased towards companies with active patch
management efforts, the results were informative in that context.
Key findings from the survey include:
Most companies were driven by compliance regulation, usually
more than one regulation applied
Process maturity was generally high for operating systems, but low
for other asset types such as applications and drivers (see chart)
Companies tend to utilize multiple vendor and 3rd-party tools in
their patch management process
40% of companies depend on user complaints as one factor for
patch validation
The survey continues! Help further refine our findings by taking the survey at:
http://www.surveymonkey.com/s.aspx?sm=SjehgbiAl3mR_2b1gauMibQw_3d_3d

PROJECT QUANT PATCH MANAGEMENT SURVEY RESULTS 2
Overview ........................................................................................................................ 3
About Project Quant and the Survey ........................................................................................................ 3
About the Authors ......................................................................................................................................... 3
Acknowledgements ..................................................................................................................................... 4
Copyright ........................................................................................................................................................ 4
Survey Details ................................................................................................................ 5
Participant Company Information. ............................................................................................................ 5 Industry Information ................................................................................................................................... 6 Regulatory Requirements ......................................................................................................................... 6
Organizational Patch Management Process Maturity .......................................................................... 6
Patch Management Effectiveness ............................................................................................................ 9
Outsourcing Patch Management.............................................................................................................. 9
Steps in the Patch Management Process .............................................................................................. 10
Monitoring ..................................................................................................................................................... 11
Evaluate ........................................................................................................................................................ 11
Prioritize .......................................................................................................................................................... 12
Test .................................................................................................................................................................. 12
Deployment .................................................................................................................................................. 12
Validation ...................................................................................................................................................... 14
Documentation ........................................................................................................................................... 14
Inclusion or Exclusion ................................................................................................................................... 16
Operational Policies .................................................................................................................................... 16
Final Observations....................................................................................................... 18

© Copyright 2009, http://creativecommons.org/licenses/by-nc-nd/3.0/us/ August 2009
Overview
As part of the Project Quant community effort to develop a well-defined patch management
cost model, the project team fielded a survey of patch management questions covering
aspects of the patch management process. While we believe this survey, due to self-selective
participation, is biased towards companies with active patch management efforts, the results
were informative within that context.
About Project Quant and the Survey
The objective of Project Quant is to develop a cost model for patch management response that
accurately reflects the financial and resource costs associated with the process of evaluating
and deploying software updates (patch management).
As part of maintaining their technology infrastructure, all organizations of all sizes deploy
software updates and patches. The goal of Project Quant is to provide a framework for
evaluating the costs of patch management, while providing information to help optimize the
associated processes. The model is intended to apply to organizations of different sizes,
circumstances and industries. Since patch management processes vary throughout the industry,
Project Quant developed a generalized model that reflects best practices and can be adapted
to different circumstances. The model encompasses the process from monitoring for updates to
confirming complete rollout of the software updates, and should apply to workstations, servers
and other infrastructure devices. Though originally sponsored by Microsoft, the project is
community driven and the model is intended to be vendor and platform-neutral.
A project web site (http://www.securosis.com/projectquant) with a blog and forum was
established as a repository for Project Quant participation, discussions and data. All materials
(including the original of this report) are made publicly available throughout the project site.
Materials are released under a Creative Commons license.
Survey results and interview summaries will be posted on the project site, with certain materials
anonymized to respect the concerns of interview subjects. All interviewees and survey
participants were asked if they wish their responses to remain anonymous, and details only
released with consent.
About the Authors
Rich Mogull has twenty years experience in information security, physical security, and risk
management. He specializes in data security, application security, emerging security
technologies, and security management. Prior to founding Securosis, Rich was a Research Vice
President at Gartner on the security team where he also served as research co-chair for the
Gartner Security Summit. Rich is the Security Editor of TidBITS, a monthly columnist for Dark
Reading, and a frequent contributor to publications ranging from Information Security Magazine
to Macworld. He is a frequent industry speaker at events including the RSA Security Conference
and DefCon, and has spoken on every continent except Antarctica (where he’s happy to
speak for free - assuming travel is covered).
Jeff Jones is a Director in Microsoft’s Trustworthy Computing group. In this role, Jeff draws upon
his years of security experience to work with enterprise CSOs and Microsoft's internal security
teams to drive practical and measurable security improvements into Microsoft process and
products. Prior to his position at Microsoft, Jeff was the vice president of product management
for security products at Network Associates where his responsibilities included PGP, Gauntlet and

PROJECT QUANT PATCH MANAGEMENT SURVEY RESULTS 4
Cybercop products, and prior to that, the corporate McAfee anti-virus product line. These latest
positions cap a 20 year hands on career in security, performing risk assessments, building custom
firewalls and being involved in DARPA security research projects focused on operating system
security while part of Trusted Information Systems. Jeff is a frequent global speaker and writer on
security topics ranging from the very technical to more high level, CxO-focused topics such as
Security TCO and metrics.
Acknowledgements
Fielding a survey without a big marketing budget, a dedicated call team or even incentives
presents a challenge in terms of garnering participation. We set ourselves a goal of getting a
minimum of 100 survey participants from patch management professionals before analyzing
and summarizing the results and we achieved that in our target timeframe because of the help
of the community. In particular, we want to thank these organizations that promoted the survey
to their member communities:
IANS, the Institute for Applied Network Security, http://www.ianetsec.com/
The New School of Information Security, http://newschoolsecurity.com
The securitymetrics.org community, http://www.securitymetrics.org
The patchmanagement.org community, http://patchmanagement.org
Copyright
This report is licensed under the Creative Commons Attribution-Noncommercial-No Derivative Works 3.0 license.
http://creativecommons.org/licenses/by-nc-nd/3.0/us/

© Copyright 2009, http://creativecommons.org/licenses/by-nc-nd/3.0/us/ August 2009
Survey Details
As part of the Project Quant process of developing a patch management cost model, many
smart people in the community drew on their own experience to help define a common patch
management lifecycle and to identify and discuss issues that were thought to be important to
any and all organizations dealing with patch management.
With that information as a framework, the team decided that it might be good to see if we
could validate our findings by asking patch management professionals themselves via a survey.
The survey itself will continue to be open beyond the publication of this initial report and we
encourage you to participate by taking the survey:
http://www.surveymonkey.com/s.aspx?sm=SjehgbiAl3mR_2b1gauMibQw_3d_3d
At the time of this report, we achieved 100 survey responses from a wide variety of companies
(see next section for details), which we set as the minimum bar for analysis. We will release the
full raw data (anonymized) soon after this summary report, and will keep the data updated as
new entries continue to come in.
Throughout the rest of this report, we share the questions that were asked in the survey, the
results that we have and, where appropriate, we share our thoughts on what the results might
mean.
With that in mind, we want to say right up front that we believe these survey results reflect a bias
towards companies that are actively concerned about patch management, due to the way
we promoted the survey and the self-selection that occurs. That means that we do NOT believe
the results and percentages in this report reflect companies in general. The corollary to this
interpretation is that we believe the broader industry is probably LESS mature in their patch
management process than reflected here.
Keep that in mind as we review results.
Participant Company Information.
Please provide the following size information on your organization. This will help us map
processes based on the scale of an organization (rough estimates are fine):
Answer Options Response
Average
Response
Total
Response
Count
Number of employees/users 13,280.81 1,314,800 99
Number of managed desktops 10,531.15 1,053,115 100
Number of data centers 13.77 1,377 100
How many IT staff 491.74 49,174 100
Number of IT staff dedicated to patching 8.01 801 100
The survey participants definitely tended towards larger companies, with the median number of
managed desktops in an organization reported as 1569 and the median number of IT staff
reported as 40. Interestingly, the median number of staff dedicated to Patch Management was
1, indicating that much of the patch management process is carried out by non-dedicated IT
staff.

PROJECT QUANT PATCH MANAGEMENT SURVEY RESULTS 6
Industry Information
Out of the 99 respondents identifying an industry, the top industries identifed:
26 were financial (including accounting, banking and insurance)
10 were healthcare
10 were education
9 were government or military
There were several others mentioned including manufacturing, telcos, transportation, utilities and
a Church.
Regulatory Requirements
Regulations that affect or require your patching process:
15 mention PCI
10 mention SOX
8 mention HIPAA
Also mentioned were FFIEC, Basle II, FDCC, HSPD, GLBA, FISMA, OMB A-130, SP 800-53, SP 800-40,
ISO 9001, ISO 270001, as well as company policies and several local government requirements.
Organizational Patch Management Process Maturity
We had two questions dealing with maturity of the Patch Management process, a broad one
and then one that breaks answers out by asset types.
Generally, 85% of organizations rated themselves as having some level of maturity, with 45%
having either broad or focused maturity that includes defined policies workflow and tools across
the organization.
These results were probably higher than we might have expected across all organizations, and
supports our overall impression that the results are biased towards participants that tend to care
about patch management.

© Copyright 2009, http://creativecommons.org/licenses/by-nc-nd/3.0/us/ August 2009
0%
10%
20%
30%
40%
50%
60%
70%
80%
90%
100%
My organization's patch management process can be generally characterized as:
Tool Driven: relies strongly on tools and their workflow, but without defined policies.
Policy Driven: relies on adherence to policies, lacking strict workflow or tools/resources.
Focused Mature, with well defined policies, workflow, and tools/resources, but only for certain kinds of software/systems (e.g. desktops).
Broadly Mature, with well defined policies, workflow, and tools/resources across the entire organization.
Do not know

PROJECT QUANT PATCH MANAGEMENT SURVEY RESULTS 8
The second question yielded some very interesting results, showing some stark differences in
maturity for some of the different asset types under management.
The red areas indicated where either informal or no processes are in place and we can see that
Workstation and Server operating systems seem to be well in hand. For almost all other asset
types, 40% or more of those surveyed have informal or no patch management process in place.
When considered in the context of recent trends1 showing vulnerability disclosures moving away
from operating systems and towards application level software, this identifies an area that needs
some focus in order to mitigate ongoing risk.
1 See Microsoft Security Intelligence Report v6, http://www.microsoft.com/sir
0
10
20
30
40
50
60
70
80
90
100
Wo
rkst
atio
n O
S
WS
Ap
plic
atio
ns
Dri
vers
/Fir
mw
are
Serv
er O
S
Serv
er A
pp
licat
ion
s
Serv
er D
rive
rs
DB
MS
EAS
(ER
P, C
MS,
etc
)
Web
Ap
p S
erve
r
Net
wo
rk H
W
Infr
astr
uct
ure
Ser
vers
Using the following criteria, categorize the maturity of your patch management process for the specified areas:
N/A: No formal or informal patching.
Informal: Lacking both policies and tools; an ad-hoc/as needed exercise.
Tool Driven: relies strongly on tools and their workflow, but without defined policies.
Policy Driven: relies on adherence to policies, lacking strict workflow or tools/resources.
© Copyright 2009, http://creativecommons.org/licenses/by-nc-nd/3.0/us/ August 2009
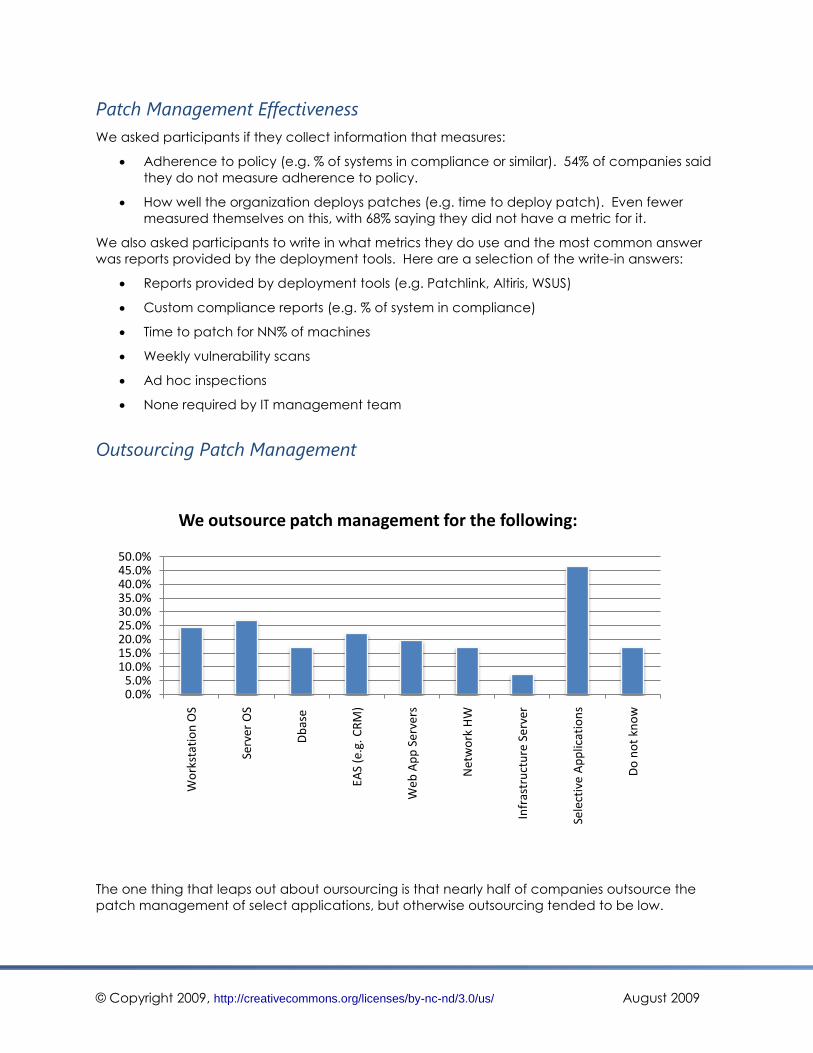
Patch Management Effectiveness
We asked participants if they collect information that measures:
Adherence to policy (e.g. % of systems in compliance or similar). 54% of companies said
they do not measure adherence to policy.
How well the organization deploys patches (e.g. time to deploy patch). Even fewer
measured themselves on this, with 68% saying they did not have a metric for it.
We also asked participants to write in what metrics they do use and the most common answer
was reports provided by the deployment tools. Here are a selection of the write-in answers:
Reports provided by deployment tools (e.g. Patchlink, Altiris, WSUS)
Custom compliance reports (e.g. % of system in compliance)
Time to patch for NN% of machines
Weekly vulnerability scans
Ad hoc inspections
None required by IT management team
Outsourcing Patch Management
The one thing that leaps out about oursourcing is that nearly half of companies outsource the
patch management of select applications, but otherwise outsourcing tended to be low.
0.0%5.0%
10.0%15.0%20.0%25.0%30.0%35.0%40.0%45.0%50.0%
Wo
rkst
atio
n O
S
Serv
er O
S
Db
ase
EAS
(e.g
. CR
M)
Web
Ap
p S
erve
rs
Net
wo
rk H
W
Infr
astr
uct
ure
Ser
ver
Sele
ctiv
e A
pp
licat
ion
s
Do
no
t kn
ow
We outsource patch management for the following:

PROJECT QUANT PATCH MANAGEMENT SURVEY RESULTS 10
Steps in the Patch Management Process
As part of Project Quant, we developed a detailed patch management lifecycle and defined
several stages as shown here:
In an effort to validate these stages, we asked participants if they implemented each in their
own patch management process. Four of the stages were implemented by more than 80%:
Monitor, Evaluate, Acquire and Deploy. Three additional were implemented by more than 60%:
Prioritize, Test, and Confirm.
The several following questions are ones where we tried to gather more detailed information
concerning the phases of patch management.
0.0%10.0%20.0%30.0%40.0%50.0%60.0%70.0%80.0%90.0%
100.0%
Mo
nit
or
Eval
uat
e
Acq
uir
e
Pri
ori
tize
/Sch
edu
le
Test
/Ap
pro
ve
Pac
kage
Dep
loy
Co
nfi
rms
Cle
an u
p
Do
cum
ent
The following is a list of potential steps in a patch management process (see the diagram above). Please let us know which steps
you use in your

© Copyright 2009, http://creativecommons.org/licenses/by-nc-nd/3.0/us/ August 2009
Monitoring
We use the following sources and methods to know when patches are released:
Answer Options Response Percent
Vendor email lists 79.6%
Vendor blogs 41.8%
Internal software notifications (e.g. a version check popup window)
49.0%
Third party email lists (paid subscription) 20.4%
Third party email lists (free) 65.3%
Third party services (managed service) 17.3%
Third party tool (e.g. a patch management tool with an internal update feed)
52.0%
Media/news 39.8%
CVE/NVD 24.5%
US-CERT Advisories 59.2%
Information Assurance Vulnerability Messages 20.4%
Information Security Vulnerability Messages 34.7%
None 1.0%
Do not know 0.0%
Clearly, vendor email lists are one of the most important sources of information, followed closely
by 3rd-party free email lists. The other important finding here was that everyone depends on
multiple sources of intelligence for monitoring.
Evaluate
When a patch is released, the following roles/teams are involved in evaluating the patch for possible deployment:
Answer Options Response Percent
Security 42.3%
Network operations 28.9%
Workstation/systems administration 54.6%
Application owners (including DBAs) 34.0%
General IT management (e.g. CIO) 20.6%
All/some of the above, depending on the involved
software 47.4%
Do not know 2.1%
With our own security backgrounds, the results of this question were somewhat surprising, in that
the security folks are not even involved in patch evaluation in over half of the companies
surveyed.
Upon reflection, though, this should not be surprising for a general patch management process,
when we consider that many, if not more, vendor patches are not released for security reasons.

PROJECT QUANT PATCH MANAGEMENT SURVEY RESULTS 12
Prioritize
Please rank how the following factors help determine a
patch priority (rank in order, with 1 being the most important):
Answer Options Response
Average
Value of the asset being patched (e.g. a financial
system vs. low-value application) 3.08
The criticality/importance of the patch (stability,
functionality) 2.23
The security priority/importance of the patch 1.83
Resources required to roll out the patch 4.39
Potential costs (resources/time) 4.66
Business unit requests 5.68
Business unit resistance 5.47
For prioritizing, we asked participants to rank these issues from 1 to 7 – so unanimous results could
theoretically have awarded a 1 to the most important factor. We didn’t get that, but we did
get a pretty clear demarcation for the top three factors of importance:
1. Security priority/importance of a patch
2. Criticality/importance of a patch in terms of stability & functionality
3. Value of the asset being patched
Test
How are patches and/or deployment packages tested before
deployment?
Answer Options Response
Percent
Regression testing 13.3%
Stability testing 35.7%
Interoperability testing 29.6%
No formal testing 25.5%
Testing varies by asset 52.0%
25% of surveyed participants don’t do any testing at all before rolling out a patch. Based on
interviews and conversations outside of the survey, we believe testing varies greatly depending
on the platform, but due to how we worded the question we were unable to quantitatively
validate this assumption.
Deployment
We found that companies use a variety of tools for deployment from vendor tools to 3rd-party
tools and of those that detailed what tools they used, it nearly always included multiple tools.

© Copyright 2009, http://creativecommons.org/licenses/by-nc-nd/3.0/us/ August 2009
While we knew everyone used tools for patch management, we wondered how this varied by
asset type and asked this question. Reflecting the earlier results for maturity of patch
management process, operating systems seem to have a high degree of coverage, while other
areas seem to lack tools.
There seems to be an implied relationship between availability of good tools for patching an
asset and how the participants rated maturity of their processes for that asset type. This seems
to be an area of focus for improvement and cooperation between vendors and customers.
Our patch management tool(s) cover the following platforms:
Answer Options Response
Percent
Desktops/laptops (operating system) 94.7%
Desktops/laptops (other software) 71.6%
Desktops/laptops (device drivers) 44.2%
Servers (host operating system) 88.4%
Database Servers 43.2%
Enterprise Application Servers (e.g. ERP, CRM,
document management, other business applications)
28.4%
Web Application Servers 44.2%
Networking Hardware/Software (routers, switches, 26.3%
0
20
40
60
80
100
120W
ork
stat
ion
OS
WS
Ap
plic
atio
ns
WS
Dri
vers
/fir
mw
are
Serv
er O
S
Serv
er A
pp
ls
Serv
er d
rive
rs/f
irm
war
DB
MS
EAS
Web
Ap
p S
erve
rs
Net
wo
rk H
W
Infr
astr
uct
ure
Ser
vers
Please describe which kinds of tools you use for:
Vendor/product patch management tool for specific products (e.g. an external patch management tool for the product by the same vendor)
Vendor/product feature of our software (e.g. built-in autoupdate mechanism)
Third party, single platform patch management tool
Third party, cross platform patch management tool
PROJECT QUANT PATCH MANAGEMENT SURVEY RESULTS 14
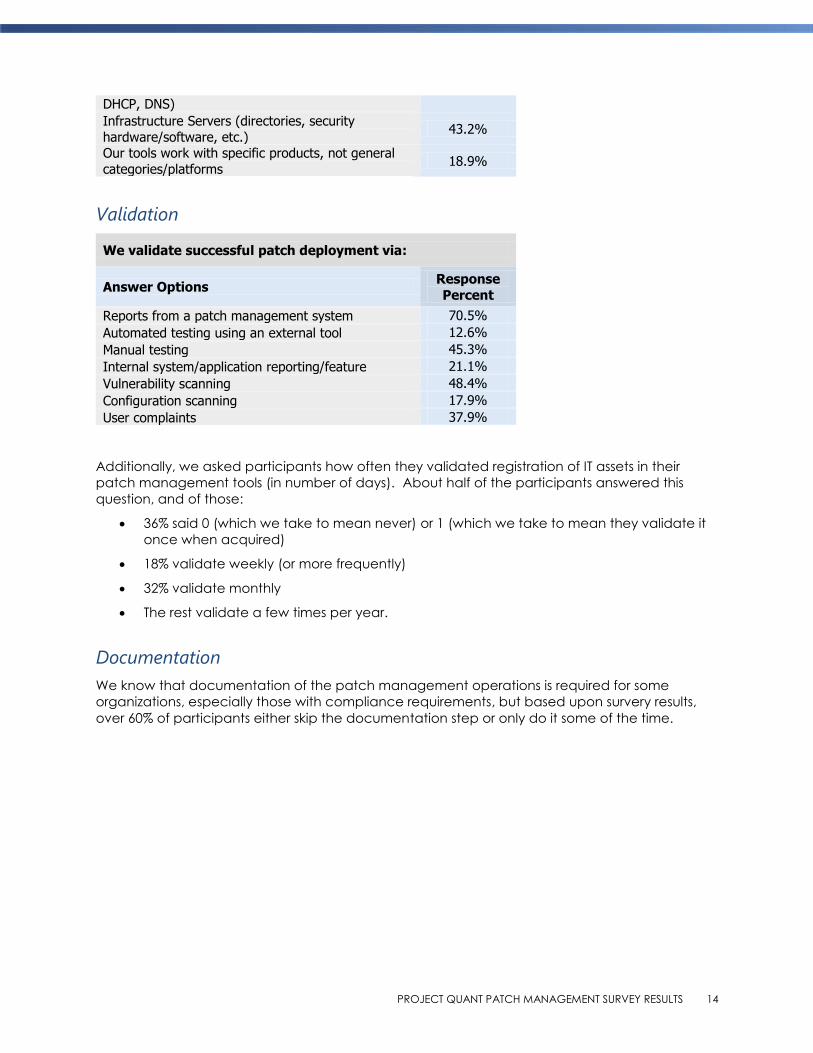
DHCP, DNS)
Infrastructure Servers (directories, security
hardware/software, etc.) 43.2%
Our tools work with specific products, not general
categories/platforms 18.9%
Validation
We validate successful patch deployment via:
Answer Options Response
Percent
Reports from a patch management system 70.5%
Automated testing using an external tool 12.6%
Manual testing 45.3%
Internal system/application reporting/feature 21.1%
Vulnerability scanning 48.4%
Configuration scanning 17.9%
User complaints 37.9%
Additionally, we asked participants how often they validated registration of IT assets in their
patch management tools (in number of days). About half of the participants answered this
question, and of those:
36% said 0 (which we take to mean never) or 1 (which we take to mean they validate it
once when acquired)
18% validate weekly (or more frequently)
32% validate monthly
The rest validate a few times per year.
Documentation
We know that documentation of the patch management operations is required for some
organizations, especially those with compliance requirements, but based upon survery results,
over 60% of participants either skip the documentation step or only do it some of the time.

© Copyright 2009, http://creativecommons.org/licenses/by-nc-nd/3.0/us/ August 2009
This was the final question specifically related to validating the phases of the patch
management process, but we did have a few more interesting questions.
We formally document configuration changes
Always
Often
Sometimes
Never
PROJECT QUANT PATCH MANAGEMENT SURVEY RESULTS 16
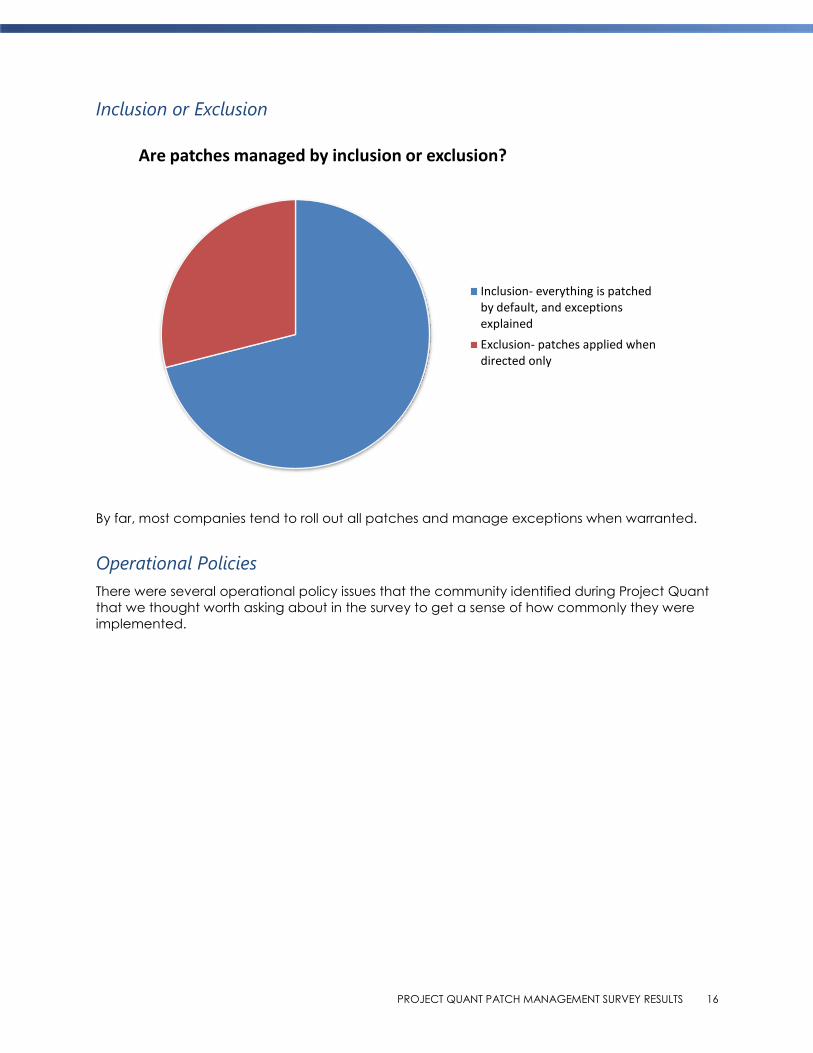
Inclusion or Exclusion
By far, most companies tend to roll out all patches and manage exceptions when warranted.
Operational Policies
There were several operational policy issues that the community identified during Project Quant
that we thought worth asking about in the survey to get a sense of how commonly they were
implemented.
Are patches managed by inclusion or exclusion?
Inclusion- everything is patched by default, and exceptions explained
Exclusion- patches applied when directed only

© Copyright 2009, http://creativecommons.org/licenses/by-nc-nd/3.0/us/ August 2009
Looking at the chart of results above, we find that a majority of companies:
implement formal change control,
use a defined patch window for deployment
use a defined reboot window
do NOT apply patches during business hours
do force reboots, while allowing some discretion to users
have reboot requirements that vary by asset type, and
do NOT report on patch compliance metrics
0%10%20%30%40%50%60%70%80%90%
100%
For your Patch Management process, do you implement:
Yes
No
PROJECT QUANT PATCH MANAGEMENT SURVEY RESULTS 18
Final Observations
Beyond the questions reflected in this report, we also asked participants if they would be willing
to participate in one on one interviews to discover more details about their processes. It was
quite encouraging that we found that roughly 20% of participants were willing to participate in a
detailed discussion to get further detail. We’ve not yet proceeded with the interviews in support
of Project Quant, but that process should help us further refine question we have such as what
software participants considered “application” versus “part of the operating system.”
Reviewing our key findings from the survey:
Most companies were driven by compliance regulation, usually more than one
regulation applied. This implies to us that regulations may apply to a broader set of
companies than may be aware and that all companies should perform a review to
understand what regulation might affect their existing patch management processes.
Process maturity was generally high for operating systems, but low for other asset types
such as applications and drivers. Particularly in light if recent vulnerability trends, this
identifies a priority call to action for companies to improve their patch management
process and tools for asset types beyond operating systems.
40% of companies depend on user complaints for patch validation. This points to a need
need for better compliance assessment and reporting tools, but it also probably is tied
closely to the testing policy for the 25% of companies that did no testing prior to patch
deployment. That may be a reasonable and practical testing choice in many situations
– roll it out and let the users tell us if it breaks something.
Companies tend to utilize multiple vendor and 3rd-party tools in their patch management
process. Given the variety of assets managed this is not surprising, but does emphasize
the value that a heterogenous patch management tool could provide to organizations.
In closing, we want to encourage readers to help drive further progress on Project Quant goals
by visiting the project site at http://www.securosis.com/projectquant and becoming an active
community participant. One key way you can help is to provide your own experience to the
community by taking the survey featured in this report at:
http://www.surveymonkey.com/s.aspx?sm=SjehgbiAl3mR_2b1gauMibQw_3d_3d


![arXiv:1701.06806v3 [quant-ph] 28 Jul 2017arXiv:1701.06806v3 [quant-ph] 28 Jul 2017 A Survey of Quantum Learning Theory Srinivasan Arunachalam* Ronald de Wolf† Abstract This paper](https://static.fdocuments.us/doc/165x107/5e7c650687c0935c4834a5c1/arxiv170106806v3-quant-ph-28-jul-2017-arxiv170106806v3-quant-ph-28-jul-2017.jpg)