PROJECT PORTFOLIO SELECTION TECHNIQUES: A REVIEW A ... · PROJECT PORTFOLIO SELECTION TECHNIQUES: A...
54
PROCT PORTFOLIO SELECTION TECIQUES: A VIEW A SUGGESTED TEGRATED APPROACH by N.P.Archer d F. Ghaseadeh Innovation Resech Working Group WORNG PER NO. 46 Feb, 1996 The Working Paper series is intended a mes whereby a resecher may communicate his or her thoughts d dings to interested readers r their comments. e paper should be considered prelimin in nature d may require substtial revision. Accordingly, this Working Paper should not be quoted nor the data reed to without the written consent of the author. Your comments. d suggestions e welcome and should be directed to the author. f n·s H P 5 �wv57 o, McMASTER UlVERS Ꜳ l
Transcript of PROJECT PORTFOLIO SELECTION TECHNIQUES: A REVIEW A ... · PROJECT PORTFOLIO SELECTION TECHNIQUES: A...
PROJECT PORTFOLIO SELECTION TECHNIQUES:
A REVIEW AND A SUGGESTED
INTEGRATED APPROACH
by
N.P.Archer and F. Ghasemzadeh
Innovation Research Working Group
WORKING PAPER NO. 46
February, 1996
The Working Paper series is intended as a means whereby a researcher may communicate his or her thoughts and findings to interested readers for their comments. The paper should be considered preliminary in nature and may require substantial revision. Accordingly, this Working Paper should not be quoted nor the data referred to without the written consent of the author. Your comments. and suggestions are welcome and should be directed to the author.
f nl\l·s HP Lt5
�wv57 l)o, 'fb McMASTER Ul'llVERStl.Y. t:teAAR'll

PROJECT PORTFOLIO SELECTION TECHNIQUES:
A REVIEW AND A SUGGESTED INTEGRATED APPROACH
by N.P. Archer and F. Ghasemzadeh
Michael G. DeGroote School of Business
McMaster University
Hamilton, Ontario, Canada LSS 4M4
This work was funded by a research grant from the Innovation Research Centre, Michael G.
DeGroote School of Business, McMaster University.

ABSTRACT
Project portfolio selection is an important issue for many firms. Tools for project
portfolio selection and management are a widely recognized need in researc� development,
production, and marketing activities for manufacturing firms and in other sectors such as
engineering, construction, and software development. They are also used in the public sector, in
government, health care, and the military. Such a diversity of applications has generated many
differing methods for portfolio selection. The objective of this paper is to review a sample of
these methods and to suggest an approach which builds on the strengths of existing methods to
develop an integrated strategy that can be used to support managers in making critical decisions
concerning project portfolio selection. The strategy allows flexibility in the selection of the
methods to suit the culture and environment of the particular organization. It is a three stage
approach which includes in the first or Pre-Process stage, before project considerations begin, the
choice of models and model structures suitable to the organizational environment. A second
component of the first stage is Pre-Screening to eliminate clearly infeasible projects and reduce
task complexity. The second or Process stage includes Individual Project Evaluation
calculations, Screening to eliminate projects which do not meet certain specified criteria, and
finally integrated considerations of the remaining projects in Portfolio Selection. The final or
Post-Process stage provides portfolio balancing or adjustment under the direct control of the
decision makers, using sensitivity analysis with possible iterations back to the portfolio selection
process.
Page2

Table of Contents
� � 1 . Introduction 4
2. Literature Review 9
2.1 Benefit Measurement Models 9
2.1.1 Comparative Approaches 10
Analytic Hierarchy Process 10
2.1.2 Scoring Models 13
2.1.3 Benefit Contribution Models 13
2.1. 4 Market Research Approaches 14
2.2 Project Selection/ Resource Allocation Models 1 5
2.2.1 Ad Hoe Approaches 1 5
2.2.2 Strategic Planning Tools 16
Portfolio Matrices 17
2.2.3 Optimization Models 19
Zero-One Integer Programming 20
2.3 Summary of Project Portfolio Selection Techniques 22
2.3 .1 Explicitly Supported Project/Portfolio Characteristics 24
2.3 .2 Decision Support Characteristics 27 3. Conclusions From The Review 29
4 . An Integrated Approach to Project Portfolio Selection 31
References 3 6
Appendices 41
I.1 Strategic Decision Group (SDG) Project Portfolio Matrix Method 41
I.2 Arthur D. Little (ADL) Project Portfolio Matrix Method 43
II 0-1 Integer Linear Programming Optimization Method 4 7
Page3

1. Introduction
In its broadest sense, a project can be defined as "a complex effort, usually less than three
years in duration, made up of interrelated tasks, performed by various organizations, with a well
defined objective, schedule, and budget." A program is "a long-term undertaking which is usually
made up of more than one project." A task is "a short-term effort (a few weeks to a few months)
performed by one organization, which may combine with other tasks to form a project." The
foregoing definitions are from Archibald (1992). A project portfolio is a group of projects,
and/or it could also be projects in one or more programs, that are carried out under the
sponsorship and/or management of an organization. Hence these projects must compete for
scarce resources (people, finances, time, etc.) available from the sponsor, since it is rare that there
are enough resources to carry out every project that may be proposed and which meets the
organization's minimum requirements for certain criteria such as potential profitability, etc. This
results in a need to select among available projects in order to meet the organization's objectives
in some optimal manner, however that may be defined.
Project portfolio selection and the associated activity of managing selected projects
throughout their life cycles are important activities in many organizations (Martino 1995; Cooper
1993; Meredith and Mantel 1995). There is much evidence indicating that these organizations are
making serious but widely divergent efforts to estimate, evaluate, and choose project portfolios
optimally (Dos Santos, 1989; Cooper, Edgett, & Kleinschmidt 1995). In fact, it has been
suggested (Roussel, Saad, & Erikson 1991) that project portfolio analysis and planning will grow
in the 1990s to become the powerful tool that business portfolio planning became in the 1970s
and 1980s. Some of the criteria that are addressed in the process of portfolio selection include the
organization's objectives and priorities, financial benefits, intangible benefits, availability of
resources, and risk levels (Schniederjans and Santhanam, 1993 ) .
In order to discuss project portfolios, we must first understand the generic properties of
projects. The attributes that characterize projects include (based on Meredith & Mantel 1995):
I) Life cycle. From an initial beginning, a project may progress through a series of more
or-less well-defined phases through a buildup in size and resource consumption, and then begin to
Page 4
decline after a peak activity and finally to terminate. The generic definition of project phases
includes: Concept, Definition, Desi� Development/Manufacture, Application/Installation, and
Post Completion (Archibald 1992). The actual activities carried out within each phase will differ,
depending upon the general class or type of project. Project classes include (Archibald 1992):
a) Commercial and government projects under contract for products or services (e.g.
telecommunication equipment contracts),
b) Research, product development, engineering, and marketing (e.g. R&D for new
products or services),
c) Capital facilities design and construction (e.g. major building construction),
d) Infonnation systems (e.g. development and installation of an executive information ·-- - - -
system in a large firm),
e) Management projects (e.g. business process re-engineering projects), and
t) Major maintenance projects (e.g. renovation and expansion of a stadium).
2) Interdependencies. Projects often interact with other projects which may be carried out
simultaneously by the organization. And there is often an interaction between the project
organization (e.g. the research and development department) and other functional areas (e.g.
marketing, production, finance) which have a vested interest in one way or another in the project.
That is, a project may be carried out on the functional area' s behalf, and/or it may consume
resources which they control.
3) Uniqueness. Every project has some characteristics which are unique and require
special attention in selecting it for inclusion in the development portfolio, or which requires some
customization in the way it is managed if it is selected.
4) Conflict. Every project selected must compete for scarce resources and for the
attention of management at every phase of its life cycle. The amount and type of resources
required, and the type and intensity of management activity, including progress reviews, depends
upon the phase of the project.
Among the published methodologies, there has been little progress towards achieving an
integrated framework that simultaneously considers all the different criteria in determining the
Pages
most suitable project portfolio. This is partly because there are many complexities in making a
selection, including:
1 . There are multiple and often conflicting objectives (or criteria) associated with portfolio
selection,
2. Even when all the objectives have been identified, there are still problems associated
with determining the trade-offs among the various criteria. In this respect, the importance of
guidance from pre-determined organizational policies and budget controls cannot be over
emphasized, in establishing selection guidelines. But there are still other non-tangible trade-offs;
for example, are economic objectives more important than political objectives (as in the relative
importance of undertaking at least one project for each department involved, as compared to an
emphasis on the projects with the most overall strategic significance to the corporation). How
important are these considerations, relative to overall economic considerations?
3 . The evaluation of proposed individual projects is complicated by two additional factors.
First, some of the criteria are qualitative, as opposed to quantitative, in nature. The comparison
of qualitative (often intangible) factors, usually based on the judgement of one or more
stakeholders, is normally quite different from comparing quantitative factors, for which data or
analytical models may be available to assist in the judgement process. Second, each project has
risk (the probability of failure) associated with its undertaking, and there may be a large amount of
uncertainty associated with the both the level of this risk and the scoring of individual projects on
each specific criterion. Assessing both risk and uncertainty may be difficult. There are risks
associated with both the development process (technical risk) and the marketplace (commercial
risk). Uncertainty in estimating project parameters tends to decline as the project moves from its
early to later life cycle stages, but risk in the application of the product or service (in the
marketplace or installing it in a business) can rarely be assessed until the project is complete. For
example, there is normally a high risk associated with the likely technical or market success of a
new product that is in an early developmental phase, and the uncertainty in the estimated risk will
also be high, depending upon the organization's experience with this type of product.
4 . Projects may be highly interdependent with other projects. This could be due to value
contribution or resource utilization. As an example in information systems, developing and
implementing an Executive Information System (EIS) might require several precursor projects
Page6

(e.g., a number of Transaction Processing Systems (TPS), and so on), each of which could have
benefits in its own right.
5 . In addition to the difficulties associated with project objectives, often several constraints
must be considered. Major constraints which are normally very important include overall project
budgets, scheduling, and program considerations. Other important constraints include the market,
and limitations on the workforce and its technological capabilities.
6. The number of feasible projects, especially in big organizations, is often very large, and
there may be an enormous number of possible combinations of the projects to be considered for
the portfolio. For example, there are potentially 2100 possible portfolios ifthere are 100
individual candidate projects. Hence, it is important to eliminate projects from consideration
independently on other grounds where it is feasible to do so before the portfolio selection process
begins, in order to reduce the total number of projects to be considered.
7. Selection ot: or adjustments to, a project portfolio is a process which recurs at more or
less regular intervals. Projects which have previously been included in the portfolio should also be
re-evaluated at appropriate "milestones" or "gates" to determine whether they continue to merit further development, in competition with projects which have not previously been included.
Cancellation decisions are probably the most difficult to implement, since they often involve
serious behavioural and organizational consequences.
8 . Finally, portfolio selection is usually not the sole responsibility of one individual. It is
frequently a committee process, where objective criteria such as predicted rate of return and
expected project cost are mingled with subjective criteria relating to the needs (e.g. a proposed
project may be needed to support services related to an existing product) of the different
organizations represented on the project selection committee.
One underlying assumption in this discussion will be that the projects being selected are
from one particular class. The overall allocation of resources to each class is assumed to be an
overall strategic decision arrived at by some means such as top-down planning external to the
portfolio selection process. That is, in our analysis we do not expect to compare between classes
such as internal information systems projects, consumer product research and development
projects, and construction projects in the same portfolio selection process unless there is a direct
Page 7

relationship among them, such as a support association or direct competition for resources in the
same organization. Otherwise it would be impossible to develop a consistent approach that fairly
judges among the competing projects in making a selection decision. (For completeness, we do
_ include several portfolio selection methods which can be used for strategic decisions concerned
with allocation among classes.) It is also probable that the methodologies most useful in
developing a portfolio for one class of projects may not be the best for another class (e.g. payback
period may be useful for comparing long term major capital projects, but it may be irrelevant for
short term consumer product development projects; development projects carried out under
contract have virtually no commercial risk, while a company carrying out development for
products it intends to market must consider commercial risk).
A second important assumption is that there is unlikely to be a single best way of portfolio
selection. Each organization must choose, within the project class( es) being considered, the methodologies that suit its culture and that allow it to consider the project attributes it believes
are the most important in making selection decisions. For this reason, although it is not feasible to
consider all project portfolio or selection methodologies in this paper, we will provide a relatively
broad review of a sample of project selection methodologies. This is followed by a general
discussion and an approach to portfolio selection will be outlined that allows an organization to
design its own decision support approach by choosing among available methodologies. Tools for
decision support, not decision making tools, are emphasized in this discussion, since the thought
processes in decision making should be supported and not supplanted by the tools used. This
support is provided through models, data, and management of the large amounts of available
information so the decision maker can make logical decisions based on what are regarded as the
most important facts. In this respect, the human-computer interface plays an important role in
displaying the required information in the most meaningful manner, without explicitly requiring
the user to consider such distractions as known constraints or complex project interactions which
can be managed automatically by the decision support system.
The objectives of this paper are: a) to evaluate the current state of the art in project
portfolio selection methods and relevant computer decision support systems, and b) to suggest an
Page 8

integrated approach to providing decision support for portfolio selection which allows decision
makers to utilize a desired subset of available methodologies in a logical manner.
In this paper, the existing literature is briefly reviewed. Some of the most popular models
used for project evaluation and portfolio selection that are relevant to this work are discussed
briefly, and the advantages, disadvantages, and limitations of each method are described. Then a
logical approach is proposed which integrates the best aspects of these methods in a manner that
allows a choice of methodologies. An integrated approach would help decision maker( s) to select
a suitable balanced project portfolio based on both quantitative and qualitative objectives, subject
to resource limitations and project interdependencies which could be automatically managed and --- - - - · -
displayed by a decision support system during the portfolio selection process.
2. Literature Review
There have been many published articles and books on the subject of project evaluation
and selection, discussing well over one hundred different techniques (Cooper, 1993) . Attempts at
categorizing these techniques have been only partially successful. But it does seem possible to
classify these techniques into two primary categories: benefit measurement techniques and project
selection/resource allocation techniques (Baker and Freeland, 1 975). Although some of the
techniques we will discuss belong to both of these categories, the first category tends to deal more
with the evaluation of individual projects on some basis (economic or otherwise), while the
second category deals with the development of project portfolios based on known evaluations of
candidate projects.
2.1 Benefit Measurement Techniques Benefit measurement methods can be described as systematic procedures for obtaining and
integrating subjective and objective benefit data. Baker and Freeland ( 1 975) suggest the following
classification ofbenefit measurement techniques on the basis of the thought processes that are
imposed on the respondents, although it is possible for a particular benefit measurement method
to belong to more than one of these classifications.
Page 9

2 1 1 Comparative Approaches
This category includes approaches such as Q-Sort (Souder 1984 ), ranking (Martino 1995:
pairwise comparison, and the Analytic Hierarchy Procedure or AHP), dollar metric, standard
gamble, and successive comparison (Churchman & Ackoff 1954 ; Pessemier & Baker 1971). Of
these techniques, Q-Sort is most adaptable to achieving consensus in a group situation. In these
methods, first the alternatives are compared and then a set of project benefit measures is
computed that is based on the stated preferences. In principle, once the projects have been
arranged on a comparative scale, the decision maker( s) can proceed from the top of the list,
selecting projects until available resources are exhausted. The AHP approach is discussed in more
detail below.
Advantages: a) Most of these techniques are relatively easy to understand and use, and
b) they allow the integration of quantitative and qualitative attributes.
Disadvantages: a) the large number of comparisons involved in these techniques makes
them difficult to use when there are a large number of projects to compare,
b) any time a project is added or deleted from the list, the entire process must be repeated,
c) risk is not explicitly considered, and
d) they do not answer the question "Are any of these projects really good projects?"
Analytic Hierarchy Process (AHP)
The Analytic Hierarchy Process ( AHP) is a comparative approach which was developed
by Thomas Saaty in the 1970s (Saaty, Rogers, & Pell 1980). Since that time, it has received much
attention, has been applied in a variety of areas (Golden et al. 1989), and a voluminous body of
literature on it has appeared (Zahedi 1986). Its main use is in selecting one project from a list.
The use of AHP in solving a decision problem involves the following steps (Johnson 1980):
Step 1- Setting up the decision hierarchy by breaking down the decision problem into a hierarchy
of interrelated decision elements.
Step 7- Collecting input data by pairwise comparisons of decision elements.
Step 3- Using the "eigenvalue" method to estimate the relative weights of decision elements.
Step 4- Aggregating the relevant weights of decision elements to arrive at a set of ratings for the
Page 10

decision alternatives.
The AHP method has been discussed briefly (Harker 1989), and in detail (Saaty 1990).
Example uses of AHP for project portfolio selection have also been described (Brenner 1994;
Martino 1 995). Commercial software (Expert Choice®), which is an implementation of AHP, is
readily available. It also addresses some of the concerns with AHP to be discussed below.
Despite the logical and scientific foundations of AHP and its wide application, a number of
criticisms of this approach have also appeared. However, the major advantages of AHP are:
a) The AHP structures the decision problem in levels that correspond to an understanding -
of the situation: goals, criteria, sub criteria, and alternatives. By breaking the problem into levels,
the decision maker can focus on smaller sets of decisions (Harker 1989). The evidence from
psychology suggests that humans can only compare about seven items at a time (Miller 1956),
b) In pairwise comparison only two factors are compared at each time. This helps analysts
and decision makers to better focus, understand, and discuss issues,
c) People may often disagree on certain judgments, but these judgments usually have little
or no impact on the final decisions (Harker 1 989). AHP allows for performing sensitivity analysis,
reducing the rhetoric in debates that can often arise in group settings (Harker 1989),
d) AHP is quite accessible and conducive to consensus building (Bard & Sousk 1990),
e) AHP handles qualitative as easily as quantitative factors .
The following disadvantages are associated with the use of the AHP method:
a) Relative ranking of alternatives may be altered by the addition of other alternatives.
This issue, perhaps the most controversial aspect of AHP, has been discussed in a number of
articles by both critics and proponents of AHP (Dyer 1 990),
b) The bounded 9 point scale used in the AHP method inherently may give results that are
outside accepted consistency standards. The problem is most severe with large numbers of
alternatives, but it can exist when there are only three (Murphy 1993). Experimentation may be
necessary to reach a consensus on the numerical values to be associated with the AHP semantic
scale (Harker & Vargas 1987),
Page 11

c) As the number of criteria and alternatives increases, the number of pairwise
comparisons required of the decision maker quickly becomes burdensome (Lim Kai & Swenseth
1993). For example, in a hierarchy with 4 levels and 6 alternatives on each level, the decision
maker must make (4*6*5)/2 = 60 comparisons (Harker 1 989). In order to reduce this problem in
large scale AHP problems, Saaty and Vargas ( 198 1) have developed a modification of the method
in which fewer comparisons are performed. If this method is used, the analyst has to strike a
comparison between robustness of the estimates and speed of the procedure in order to determine
how many comparisons to perform (Kamenetzky 1982).
A set of techniques are available which reduce the number of pairwise comparisons in
AHP that the decision maker must make during the analysis of a large hierarchy. This allows the
decision maker to reduce the effort involved in the elicitation of pairwise comparisons but also
allows redundancy, an important component of AHP (Harker 1 987a; Harker 1987b; Harker
1989). Lim Kai and Swenseth (1993) found a point where one alternative becomes dominant to
such a degree that, regardless of the effects of the remainder of the comparisons, it can not be overtaken as the preferred choice. While this dominance point differs for every problem, results
indicate that, in this way, an average of about 50% of the comparisons can be eliminated,
d) The AHP method implicitly assumes that evaluators are inconsistent in expressing their
preferences. Once some level of consistency is achieved through consistency checks, no errors
should exist in the input data (Zahedi 1986). This is not actually the case in practice, since not all
random errors are likely to be eliminated by consistency checks,
e) When decision makers select a project portfolio, they must often deal with some
interdependency among projects . To our knowledge, this issue is not addressed in the AHP literature, and decision makers must explicitly or implicitly assume independence, and
f) The AHP method does not address resource limitations in portfolio selection. We do
not know whether the best portfolio of projects should only involve the projects ranked at the top
of the list.
g) The AHP method does not address the important issues of project interdependence.
Page 12

-�
2.1 2 Scorini Models
These approaches (Martino 1995) assume that a relatively small number of decision
criteria, such as cost, work force availability, probability of technical success, etc., can be defined
which will be used to specify the desirability of each alternative project. The merit of each project
is determined with respect to each criterion. The scores are then combined (when different
weights are used for each criterio� the technique is called "Weighted Factor Scoring", probably
the most commonly used scoring model) to yield an over� benefit measure for each project.
Advantages: a) Although the benefit measures are relative, projects can be added or
deleted without affecting the benefit scores of other alternatives,
b) they allow the integration of quantitative and qualitative attributes, and
c) these techniques are relatively easy to understand and use.
Disadvantages: a) Risk is not explicitly considered,
b) weights are required, which are cumbersome and difficult to evaluate,
c) these techniques are not well suited for situations where selection of one project
influences the desirability of another, and
d) they do not answer the question "Are any of these projects really good projects?"
2.1 3 Benefit Contribution Models
Project benefit with these methods is measured in terms of contributions to a number of
project or program objectives. The resulting measure may or may not be relative depending on the
specific approach. Alternatives may be added or deleted without influencing the benefit score of
other alternatives. This category includes methods such as:
i) Economic return (Martino 1995; Remer et al 1993): Net present value (NPV), Internal
rate of return (IRR) Return on original investment (ROI), Return on average investment (RAI),
Payback period (PBP), and Expected value (EV). The latter allows a consideration of risk at
various project stages, usually based on either IRR or NPV. The Capital asset pricing model
(CAPM) can also be used (Sharpe 1964; Khan & Fiorino 1992). It has the advantage that it
includes a provision for risk, but it does not appear to be suitable for discrete project
comparisons. A 1991 industry survey of the use of the above techniques (not including CAPM)
indicated recent movement towards the use ofNPV, a moderate reduction in the use of IRR, and
Page 13

a significant reduction in the use of PBP (Remer et al 1 993) when compared to a 1978 survey.
ii) Benefit/Cost techniques (Canada & White 1980). These techniques involve the
calculation of a ratio of benefits to costs, where the inputs may in fact be derived from present
value calculations of both benefits and costs, in order to transform them to the same time basis.
Advantages of i) and ii): a) comparisons are in an easily understood language, and
b) with certain techniques, the best projects are clearly identified by the calculated
measure, depending upon the class of projects being considered.
Disadvantages of i) and ii): a) it is difficult to include non-tangible benefits, and
b) detailed data are needed for estimated cash flows, etc.
iii) Risk analysis, including decision theory/Bayesian statistical theory/trees (Canada &
White 1980; Hess 1 993; Martino 1995; Riggs et al 1 994 ), and decision theory combined with
influence diagram approaches (Krumm & Rolle 1992; Rzasa, Faulkner & Sousa 1990). These
approaches involve a succession of choices, where the probabilities of particular outcomes must
be estimated.
Advantages: a) More than one stage in a project can be considered, and
b) the expected values of outcomes at each stage can be determined.
Disadvantages: a) these approaches require estimates of probabilities of possible
outcomes, which may be difficult to determine, and
b) the Bayesian approach is not universally regarded by mathematicians as valid.
2 1 4 Market Research Approaches
There are a wide variety of market research approaches which can be used to generate
data for forecasting the demand for new products or services, based on concepts or prototypes
that can be presented to potential customers to gauge the potential market for the product or
service. Techniques used include consumer panels, focus groups, perceptual maps, and
preference mapping, among many others. Wind, Mahajan, and Cardozo ( 198 1) give a good
exposition on this topic, including related techniques for data analysis.
Advantages: a) the market is the driving force for any new product or service. Resources
should not be wasted on developing products or services with little or no demand,
Page 14

b) projections of market demand and pricing are essential to the determination of
resources that can be devoted to development projects,
Disadvantages: a) market research does not consider other factors such as development,
production, and distribution costs and timing,
b) these techniques are useful only for market-driven products and services and
cannot be used for internally consumed products and services, such as information
systems,
c) unless the product or service being considered is similar to one already in the
market, the uncertainty in the forecasted customer acceptance rate will be extremely high.
2. 2 Project Selection/Resource Allocation Techniques Although they may be used in their own right in certain cases, project selection/resource
allocation techniques may be used to represent a second stage in portfolio selection, with inputs
which can be the outputs of first stage benefit measurement methods. A number of these
approaches have been suggested in the literature, and several will be discussed briefly here.
2 2 1 Ad Hoe Approaches
i) Pro.files (Martino 1995). This is a crude form of scoring model, where limits are set for
the various attribute levels of a project, and any projects which fail to meet these limits are
eliminated. The human-computer interface aspects of related approaches have been investigated
by Todd & Benbasat ( 1993 ) , who found that users prefer an approach which minimizes effort, and
not necessarily the one which provides an optimal solution.
Advantages: a) it is very efficient, and
b) it judges all projects on the same basis, given the values of particular attributes.
Disadvantages: a) it is very arbitrary, and requires specific limits to be set on various
criteria. These may be difficult to determine.
ii) Interactive selection (Hall & Nauda 1990). This involves an interactive process
between the managers championing projects and decision maker(s) responsible for choosing the
portfolio . The key feature is that selection criteria are better articulated as the process continues.
Page 15

Advantages: a) Project managers have an incentive to make their projects look more
attractive to the decision maker (this may be a disadvantage!),
b) it helps managers to become very familiar with all aspects of the project, and
c) the projects are more likely to fit the strategic objectives of the decision maker(s).
Disadvantages: a) this may make all the projects look more alike than they really are.
2 2 2 Stratewc Piannimi Tools
The strategic implications of portfolio selection are complex and varied. The best sources
of related material appear in Hax & Majluf ( 1984) and Hax & Majluf ( 1996), who discuss a
number of techniques for developing strategies, including the use of portfolio matrices, to be
discussed below. The first two of the following relate to other tools which have been discussed in
the literature.
i) Cognitive modeling or policy capturing (Martino 1995; Schwartz & Vertinsky 1977).
This is a method which examines global decisions to determine the components (actual decision
processes) that went into them. There are two approaches: replication of decisions, and
evaluation of decisions. The intent is to calibrate the decision process so future decisions can be
consistent within the context of previous decisions.
Advantages: a) Allow the analysis of global decisions in order to understand how they
were made
Disadvantages: a) Only past decisions can be examined, and it requires a relatively large
number in order to get the maximum benefit, and
b) these approaches are of little use in relatively new situations.
ii) Cluster analysis (Mathieu & Gibson 1993). This is a method which helps in selecting
projects that support the strategic positioning of the firm.
Advantages: a) Assists in maintaining the firm's strategic direction.
Disadvantages: a) Only helps in finding clusters of similar projects, but doesn't select
specific projects from within the clusters.
Page 16

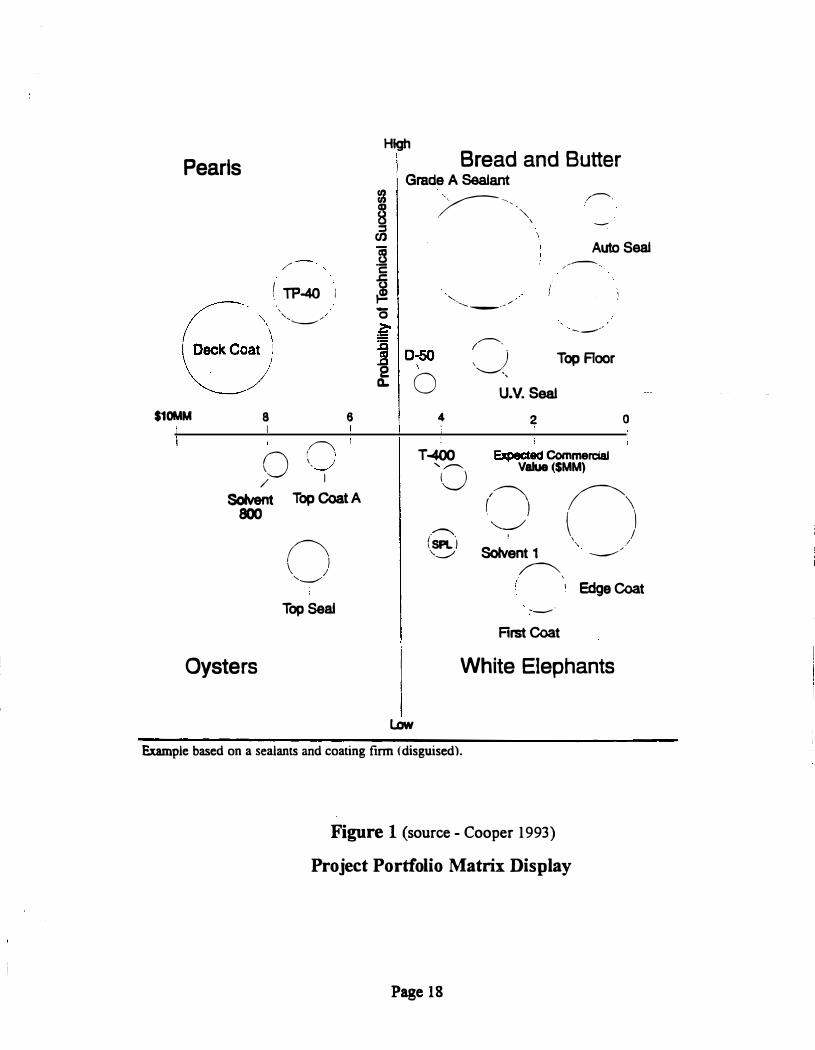
iii) Portfolio Matrices
Portfolio matrix methods can be used to prioritize and allocate resources among
competing projects. The use of these methods has been promoted by several noted consulting
firms during the last few years (Cooper 1993). The Strategies Decision Group (SDG) and Arthur
D. Little Corp. have both developed well-known and widely used portfolio matrix methods for
project portfolio selection, and their implementations are described briefly in Appendix I.
Portfolio matrices are basically two-dimensionsal pictorial representations of all the
projects under consideration. Figure 1 is an example of an SDG matrix model. In a portfolio
matrix, usually one dimension represents the likelihood of success, and the second represents the
economic value of the project. In all such matrix approaches, the position of a project within a
matrix suggests the pursuit of a certain strategy. The intent is that, by using these methods, a
reasonable mix of projects on the dimensions represented can be selected by decision makers.
Independent of the specific type of matrix display used, the advantages of project portfolio
matrices are:
a) Portfolio matrices are well organized, disciplined methodologies that facilitate the
selection of a portfolio of projects,
b) Managers often neglect to use a rational economic approach. Portfolio matrices lead
managers to make decisions that are more rational than if they use unaided judgment,
c) Portfolio matrix methods are judged to be successful for strategic planning by those
who use them. A sutvey ofFortune 1000 companies showed that almost all respondents believe
their use of portfolio planning methods has a positive impact (Haspelagh 1982),
d). Portfolio matrices present information to decision makers in a "user-friendly'' manner.
They can also be used by groups of managers in decision-making meetings,
e) Portfolio matrices give an overall perspective of all projects underway on a single map,
and
f) Portfolio matrices tend to enforce a strategic discipline in decision making. They also
provide a commonly understood vocabulary to facilitate idea exchange among decision makers.
The major disadvantages associated with project portfolio matrices are:
a) The scope of portfolio matrices ignores other relevant strategic issues,
Page 17
Pearls
$10MM 8 I
/
( TP-40 I
', .... ....__.......,,,,
I� 0 < __ ;' / I
6
Solvent Top Coat A 800
() \ I ,..__,,.
Top Seal
Oysters
High Bread and Butter
Grade A Sealant � �
(/)
B c .c
.! 0 �
�--,_ . ""
"--'-- --- "'
\
/--'
- ·
Auto Seal ,.--
----
�10� £ 0
/,,..--,_ \� Top Floor
U.V. Seai
Low
4
T-400 ...... ,,,,...--.._
{0
.�, (sPLl '-._/
2 0 '
Expected CommerciaJ Value ($MM) I� ( ) '-..._./
I
Solvent 1 �'
:--·
First Coat
�) \ / \ . "
..__,,,.
Edge Coat
White Elephants
Example based on a sealants and coating firm <disguised).
Figure 1 (source - Cooper 1993)
Project Portfolio Matrix Display
Page 18

i 1
b) Portfolio matrices have little theoretical or empirical support (Armstrong & Brodie
1994),
c) Use of project labels (e.g., pearl, oyster, and so on), common in this approach, are
appealing and easy to use, but they may lead decision makers to overlook profit maximization
(Armstrong & Brodie 1994 ),
d) No single empirical study has demonstrated that portfolio matrices are valuable as a
decision aid (Armstrong & Brodie 1994 ),
e) Research showed that the BCG matrix approach interferes with profit maximizing, as
may other matrix methods (Hax & Majluf 1983). As a result, some researchers have advised
against using matrix methods under all circumstances, until evidence is produced that they give
superior results (Armstrong & Brodie 1994 ),
t) Thus far, portfolio matrix techniques have seen limited success (Cooper 1993 ),
g) Excessive rigidity, which is inherent in these methods, could lead to a mechanistic type
of thinking which would stifle rather than enhance creativity. When used by uninitiated decision
makers, portfolio matrices could hinder a truly creative way of thinking (Hax & Majluf 1984), and
h) Portfolio matrices are sensitive to the operational definition of the dimensions, cut-off
points, weighting scheme and the specific model used. For example, using different portfolio
models in strategic planning could classify the same project as a dog, star, cash cow, or problem
child (Wind, Mahajan, & Swire 1983).
2 2 3 Optimization Models
The objective of an optimization model is to select from the list of candidate projects a set
that provides maximum benefit (e.g. maximum net present value) to the firm. Optimization
models are generally based on some form of mathematical programming, which not only supports
the optimization process, but takes into account project interactions such as resource
dependencies, budget constraints, technical interactions, market interactions, or program
considerations (Martino 1995). These models also generally support sensitivity analysis (Canada
& White 1980), an important aspect of making choices when the portfolio is being fine-tuned.
Optimization models based on a variety of mathematical programming techniques or combinations
of these have appeared in the literature (see Martino 1995, Chapter 5, for a partial list). However,
Page 19

most of these models do not seem to be used extensively in practice (Souder 1973). Probable
reasons for their disuse include the need to collect massive amounts of input data, the inability of
most such models to include considerations of risk, and in some cases the model complexity.
There are potential uses of mathematical programming in conjunction with other
approaches. For example, 0-1 integer programming could be used to apply constraints such as
resource utilization and project interactions, and goal programming allows multiple objectives to
be considered simultaneously (Santhanam et al 1989), while a project matrix approach is used.
Applications of 0- 1 integer programming are described in more detail below.
Advantages: a) mathematical programming approaches maximize overall portfolio
objectives, and
b) they allow for interdependencies and other constraints on projects.
Disadvantages: a) these approaches don't deal with tradeoffs between risk and return,
b) don't provide for evaluation of non-tangible benefits and costs,
c) may require data that aren't available,
d) normally cannot include risk considerations (an exception is stochastic programming),
e) with the exception of goal programming, these don't handle multiple criteria, and
t) there is danger that the results may give a false sense of accuracy, even if the input
data are highly uncertain.
Zero-one Integer Programming
Zero-one (0- 1) integer programming is an optimization approach to project portfolio
selection. Such an optimal portfolio is a feasible one (i.e., satisfying all constraints input by the
decision maker) which optimizes an overall objective function. This overall objective function
could also be defined as a weighted function of various sub-objectives or criteria (i.e. a goal
programming approach).
The 0-1 approach is chosen for elaboration here because, from the wide range of possible
mathematical programming models, fractional solutions cannot. be used in project portfolio
selection, unlike the related financial portfolio problem. That is, projects are either selected or not
Page 20

selected. This rules out continuous techniques such as linear and nonlinear programming. Several
cases are reported in the literature in which 0- 1 integer programming has been used for project
portfolio selection (Evans and Fairbairn 1989; Mukherjee 1994; Schniederjans and Santhanam
1993 ) . A comprehensive discussion of 0- 1 programming and a classification of different solution
methods for 0-1 multiple criteria problems has been given by Rasmussen ( 1986).
In the following we will limit our discussion to advantages and disadvantages of the 0-1 integer linear programming (0-1 ILP) model. A more detailed discussion of 0- 1 ILP
applications to portfolio selection is given in Appendix II.
-Advantages of 0-1 ILP are:
a) Using 0-1 ILP for project portfolio selection allows implicit consideration of a
multitude of different combinations of candidate projects,
b) The model structures the decision problem in a very clear and understandable manner,
c) The model allows for sensitivity analysis, creating the opportunity to analyze effects of
changing the supply of one or more resources,
d) The model handles interdependence among projects, and mutually exclusive projects,
e) Mandatory and ongoing projects can be considered, and
t) The model explicitly considers resource limitations throughout the entire planning
period, and also in each individual period if desired.
The disadvantages of 0-1 ILP are:
a) The model does not explicitly handle qualitative factors such as political or social
issues, which are usually important and sometimes critical in portfolio selection,
b) The model does not take risk and uncertainty factors into consideration, and
c) The majority of solution methods developed for 0- 1 programming problems thus far are
not applicable to large problems (RaSmussen 1986).
Page 21

2.3 Summary of Project Portfolio Selection Techniques
In this section we will summarize the characteristics of some of the portfolio selection
techniques we have discussed. This discussion is relatively general, in that we do not consider
special adaptations of the techniques mentioned, which may have been made to broaden and
enhance the application of the technique mentioned. Column one of Table 1 shows some of the
project selection techniques previously discussed, and column two indicates whether the
technique has a rigorous theoretical grounding. For each technique an indication is given of
which of the set of project or portfolio characteristics shown in columns three to eleven are taken
into consideration. Columns 12 to 17 are decision support characteristics which the technique
may provide to decision makers. In the best of all possible worlds, a good portfolio selection
technique would consider all of the project/portfolio characteristics, and provide decision support
of all the types indicated. In practice this has not been the case, as shown in the table, but we will
discuss this further in the next section. The following is a brief discussion of the characteristics
considered and decision support supplied, in the order of the columns in the table.
Theoretical Basis of the Portfolio Selection Method: The existence of a sound theoretical
basis for a portfolio selection method greatly increases the likelihood that its application will produce a result which can be trusted by decision makers. On the other hand, even if the method
is theoretically strong, if it is complex to apply or requires large amounts of highly uncertain input
data, decision makers will be less likely to consider using it. For example, optimization techniques
are well-grounded in theory, but they are not widely used in general because of the large amount
of data required, much of which may be highly uncertain. And most of these techniques do not
allow the explicit consideration of uncertainty or risk .
Page 22

�
<! �
A Comparison of Project Selection Methods Project/Portfolio Characteristic
Method
Pairwise
.._ a u +:: Cl) ... 0 ,Cl) e Cl) IQ)
� 'iii c. .2!: a +:: o
al :::::s Q) :0 0
Q)
��Q)�CJ)I
... -0 > > u c 2!: u c: ea ·- '- o .., Q) Q) U> ::> ·t:: ea o c. a ..:! o B � � Q) :::::s u U> ·- ea u. -c >< Q) E :::::s ... w ·-Q) _J ... c: Cl) i ! 0 :::::s ...
..c Q) ·c: E � :::::s
t; Cl) '6' ... 0..
Co�parison t_f_f._f_(_y_I±(__§_ Scoring t_(_y_f._f_(_y_ Y �
Analytic
Cl) ... ea E >
ti � �u G� .E Q> CI) Q)� ea O' ea O' .!!! Qi ii � .c ... a: ... u u. O.. Cl) c E ::J ea ... if
Support Characteristic
� CJ) I Cl - ·- 0 c � � o ·u c;; ea c c c 0 .!2 � <( &1 >- � Q)
la Q) ·� c: u ea u Q) ea '- Q) � � � � I ... '-'- c Q) Q) - 0.. �
t c. 0 ::> Q. 0 a.
� �
Hierarchy I Y I Y I I I Y I Y I S-M I I I I Y I I Y I Y I Y Process
y y ---�-·�-------�-
y y y y y
CJ) c:
� .g Cl ra Q) '-... Q) co -0 '- ·-
1/) � 0
u
fiiillimmamamilimmmm11mmmmmmmm1mam a. '. .... -.·: .. =;=;·_:< :.M: .=: m.:111!!111!'!1!·· ::11!!1111'-'-'-'11i
�m�'..�;: ;;=m..,�!!'.l!l'.11�1m ·=;:1·�1!!1 :.: ..
. :m. .... �·:� m..:� ... 1•m..= .. :·!!'.l!l� ;'.:�·11�m. .. .":i•11!'!1!-.1!l'l!'.IM11!1l! .. ,:!l'l!'.l�;.i1•*m.·J�il!!l.�: .
. :�!'.'.'.�*�l!!IM'.l!dm.�f:�l!!l'.'.� m.Jl!!l .��� :1i1•u!.'.'.lm 1'"'-'!11 11!.'.'.lml!P.P.!tm•<l!!l:w'"'-'Mi�Ml!P.P.!@�.�'.Ji�
Portfolio Matrix
Cognitive
Modeling ·Cluster
y y
y
y s y
y S-M y y y y y y
y M-L y y y y
Analysis Y Y Y M-L Y Y
Profiles Y ..... -� ....... . ·.-� .. ·:·f.f.i;r ........ tWfi' l
. ... _=··,···w.1£---- .... . L, rzm I * 0-1 Integer LP y Goal Programming y y
y y y y
y S-M y y y S-L y y y
Table 1

2.3 !Explicitly Supported Project/Portfolio Characteristics
Multiple Objectives: In selecting projects, more than one objective may be considered
simultaneously in making portfolio selection decisions. Examples of objectives include maximize
net present value, maximize profitability, maximize market share, minimize cost, etc. Objectives
used will depend upon the organization, but these criteria obviously must be uniform across the
entire project portfolio.
Project Interdependence: In some cases, projects may not be independent of one another.
For example, one project may need to be completed before another project can begin. Other
examples include situations where the success of one project may change the likelihood of success
of another project (e.g. enhancing or cannibalizing sales), or there may be resource overlap where
work done on one project can be used in another related project.
Mutually Exclusive Projects: A good example of mutually exclusive projects arises when
several alternative approaches are proposed to solve a particular problem. Then the choice must
be made among the alternatives, with only one being chosen. Optimization techniques can handle
this type of constraint, even when it is considered in the context of a number of other unrelated
projects.
Resource Limitations: Resource limitations are ever-present, but are not explicitly
considered by methods which consider only one project at a time, such as benefit contribution and
market research methods. On the other hand, constraints such as these can be handled by
comparison techniques, which rank projects according to some objective(s). Then resources are
typically allocated to the top ranked projects in order until they are exhausted. Some methods
such as AHP address the allocation of single resources in this manner, but not multiple resources.
Qualitative Attributes: Some project attributes such as resource requirements may be
expressed quantitatively. But qualitative attributes may be needed to express project
characteristics such as those for which there may be considerable uncertainty or which are
Page 24

normally expressed as "fuzzy'' values (e .g. consumer attitude towards a proposed product may be
described as "lukewarm" or "enthusiastic" rather than a quantitative estimate of sales volume) or
political characteristics (such as "the capability and experience of a product champion").
Number of Projects: The number of projects that can be considered during portfolio
development depends upon the technique used. Smaller numbers help to reduce information
overload for decision makers, making it easier to use a broader selection of selection methods.
For medium to large numbers of projects, decision makers need the type of support that allows
them to consider the most relevant information without being buried by it. In Table 1, the number
of prQje�s typically handled _by eac� method is shown as S (small - less than 10), M (��!�� - 10
to less than 30), and L (large - 30 or more). There are few methods which successfully handle
large numbers of projects without using relatively arbitrary selection criteria. Hence, it is
important to use screening to eliminate as many projects as possible on other logical grounds not
related to overall considerations (e.g. projects which have failed to pass a go-nogo decision at a
decision gate).
Project Phases: Most projects, unless they are very small, are broken down into phases,
for ease of management control. Some of these phases represent points at which the project has
reached some recognized state of completion and can be evaluated against measures of objectives
achieved, such as resource consumption, perceived quality of the product or service under
consideration, and degree of satisfaction with the project to that point. This allows decisions to
be made on committing further resources to the next phase, putting the project on hold, or
abandoning it. These decision points may be called "Gates" (Cooper 1993), or "Milestones"
(Meredith & Mantel 1995). Each project which has reached a gate should be re-considered in
relation to other projects, in the context of the entire project portfolio selection process. But it is
also necessary at that time to consider the entire remaining life cycle in evaluating each project.
This can only be done by explicitly considering the costs and benefits of all the remaining phases,
which can be done with more certainty as each project phase is completed. Several of the benefit
contribution and optimization techniques allow this to be done explicitly.
Page 25

Project Risk: Risk should play a large role in making project selection decisions. This is
very clear from the portfolio matrix approaches which frequently use risk as one of the dimensions
displayed. The reason for its importance is that projects with potential for break-throughs often
have a high payoff, but this is often associated with higher risk. We will define project "risk'' as
the probability that a project will fail. This can be estimated conditionally for each phase of the
project and then combined into an overall project risk. A related measure is the "downside risk'',
which is the product of the amount at stake and the probability of failure. There are two
important sub-categories of risk: "technical risk", which is the probability that a project will not
successfully complete the development process, and "commercial risk" which is the probability
that the products or services will not be successful in the marketplace, given that it has been · - - - ---
successfully developed and manufactured. Technical risk is normally higher during the early
phases of a project, declining as the project successfully progresses through its phases.
Commercial risk can be estimated through market studies or by evaluation of similar products.
The estimation of risk for the purpose of portfolio selection is a topic which requires further study
and elaboration, and will be the topic of an additional paper.
Uncertainty: We will define uncertainty as the innaccuracy in the estimates of resource
requirements, risk, and any other parameters associated with a project. Uncertainty in most
parameters should also decline as the project moves through its phases, because decision makers
have more accurate data upon which to base their predictions as the project moves closer to
completion. Uncertainty will also depend upon the amount of past organizational experience with
similar projects, technologies, and markets. How uncertainty in project parameter estimates can
affect project outcome criteria such as risk, benefit/cost, cash flow, etc. may be calculated either
through simulation techniques, or by considering extremes in the uncertainty ranges of the
parameter estimates. Clearly, the overall estimate of gain or loss if a project is undertaken will be
subject to both risk and uncertainty.
Page 26

2 3 2 Decision Support Characteristics
Sensitivity Analysis: The value of a portfolio 's objective function is an estimate of the sum
of contributions from all the projects in the portfolio. Clearly, this will be dependent upon the
values used for each of the independent variables or attributes of each project, such as payoffs,
costs, risks, etc. Sensitivity analysis provides a means of measuring how robust the objective
function is to changes in these parameters. If it is very sensitive to particular parameters, then
close attention must be paid to improving the accuracy of parameter estimates. If not, then the
inevitable inaccuracies in parameter estimates may not seriously impact the overall result.
Sensitivity analysis also allows a determination of the impact of additional resources on the
portfolio objective function. If additional resources such as financing can improve_ the objective
significantly more than the cost of these resources, then it may be cost effective to invest more in
an expanded portfolio.
Portfolio Balancing: Portfolio balance is important on certain portfolio dimensions, such
as risk, size of project, and short term vs. long term projects. For example, the proportion of high risk projects should not be too high due to the fact that failures of a large number of these
projects could be extremely dangerous to the future of the company. On the other hand, low risk
projects may not carry the high return that is often typical of risky projects, so the expected return
from the portfolio may be too low if project selection is too conservative on the risk dimension.
Balance on project size is also important, because the commitment of a high proportion of
resources to a few large projects can be catastrophic to the firm if more than one fails. And too
many long term projects, no matter how promising they are, may cause cash flow problems.
User-Friendly Interface: Decision makers with the responsibility for making portfolio
selection typically are managers who are not highly experienced computer users, but in recent
years they have come to expect to use computers as decision support tools. For this reason, the
computer interface must be very easy to use, should present information in a highly
understandable manner (graphical, or easily read concise forms of data if at all possible) and
should be based on graphical user interfaces for ease of use. A decision support system with an
interface without these characteristics may not be used by managers if its use is optional.
Page 27

Overall Perspective: Selecting a project portfolio is a strategic decision, and the relevant
information must be presented so it allows decision makers to develop an overall view of the
portfolio without overloading them with related information unless they specifically need it . An
overall view is encouraged by simple plots or matrices on the general dimensions of interest to the
decision makers, such as those seen in portfolio matrix plots.
Group Support: As mentioned earlier, a large proportion of portfolio selection decisions
are made by groups of managers. This requires that all the managers involved in the decision
should have ready access to relevant information, and that they be able to contribute their
knowledge in the decision making process. This involvement can range from using simpl�JOQ_ls
that support rating the relative merits of the projects on various attributes, to more complex tools
available through group decision support systems, often set up with multiple computer monitors
and displays in "decision rooms", complete with human facilitator support. Characteristics of
successful Group Decision Support Systems or GDSS have been determined through research
studies (Buckley & Yen 1990).
Strategic Considerations: Certain methods such as Q-Sort lend themselves to overall
considerations of the set of projects proposed for the portfolio, thus being qualified as strategic
methods. These methods provide a means for high level classification of projects into strategic
categories. Strategic planning approaches such as cognitive modeling and cluster analysis also
take a broad strategic perspective (Souder 1978; Martin 1984). A more comprehensive study of
concepts and tools which can be used in making relevant strategic decisions relevant to project
choices is given in Hax and Majluf (1984). As discussed previously, we believe that portfolio
approaches should only be applied to groups of projects which have been assigned to particular
strategic categories, to avoid apple and orange comparisons.
Page 28

3. Conclusions From The Review The following are the conclusions we drew from our examination of existing project
portfolio selection methods:
a) Popular Use of Existing Techniques. A review of Table 1 indicates that there are sparse
areas of coverage by most of the methods examined. It also reveals why certain methods may have been proposed, because they cover project characteristics or they provide support in certain
areas that other methods do not. For example, project interdependence and mutually exclusive
projects are handled by optimization techniques, while project phases are explicitly handled by only same of the benefit contribution and optimization models. Parameter uncertainty_ i� _ _
recognized as one of the more important measures in portfolio selection and management
(Meredith & Mantel 1995), yet only the risk analysis technique evaluates it explicitly (see Canada
& White 1980). And only risk analysis and portfolio matrix techniques explicitly consider project
risk. On the other hand, a number of techniques can be applied to projects with qualitative
attributes. AHP and portfolio matrices are popular among decision makers, partly because of
their ability to consider a broader range of project/portfolio characteristics, and partly because
they offer more decision support coverage, as can be seen in Table 1. However, A.HP does not
allow the consideration of multiple resource constraints. Although some of the benefit
measurement techniques such as scoring, economic return, etc. are widely used because of their
simplicity, they do not offer the comprehensiveness that is necessary to make appropriate choices
and to achieve the required balance in complex portfolio situations.
b) Information Overload. Helping to reduce the amount of information that managers
need to consider in making their decisions has been shown to be attractive to decision makers,
since they tend to favour a least-effort approach (Todd and Benbasat 1993). On the other hand, it
is important to ensure that decision makers do not forget or ignore important information during
the selection process. For complicated problems which involve many projects or interrelated
projects, implicit model support may be necessary if a method is to perform well. Any suggested
approach to portfolio selection needs to address this issue and to provide support across the areas
suggested in Table 1. That is, it should provide a user-friendly interface that is adaptable to group
Page 29
support, in a system that gives an overall strategic perspective and avoids information overload,
but at the same time allows the decision maker to do sensitivity analysis and to balance portfolios.
None of the techniques we have considered are close to filling these requirements, although the
analytic hierarchy process (AHP) and portfolio matrix techniques could be considered to be the
best. The following is a brief summary of the aspects of these more widely used techniques as
they relate to the issues we have raised.
c) Analytic Hierarchy Process. AHP is well-grounded theoretically although it has its
critics (see our previous discussion on AHP). It also has the advantage that it has been
incorporated into a relatively usable and frien�ly software package called Expert Ch_oi�e®, it
offers support for a reasonable number of project/portfolio c�aracteristics, and its decision
support characteristics are good. Unfortunately it does not address the project risk issue which is
normally an important dimension in adjusting portfolio balance, it does not consider multiple
resource constraints, and AHP is time consuming to use when there is more than a small number
of projects.
d) Portfolio Matrix Techniques. It is well-known that matrix techniques are popular for
portfolio selection, but it is not so well-known that these techniques appear to be counter
productive in terms of meeting stated objectives such as profit maximization (Armstrong &
Brodie 1994). Table 1 shows one reason for the popularity of matrix methods - they consider a
number of important project/portfolio dimensions and they provide decision support in a majority
of the categories identified. Unfortunately, the lack of a solid theoretical grounding is a drawback
which leads to a lack of confidence in this type of approach.
e) Group Decision Support. The more successful portfolio selection techniques have some
provision for group support, which is essential if committee decisions are to be made. In AHP for
example, painvise comparisons of projects on several criteria can be made by several people and
the re_sults combined to provide a group result. With portfolio matrix techniques, graphical results
may be viewed on a screen, providing an opportunity for input from all committee members.
Page 30

f) Project Data Bases. Although it has not been discussed in detail in this report, the
portfolio selection techniques which can be used are constrained by the availability of suitable data
on current and previous projects. A comprehensive data base, that records the history of the
organization's projects completed and in process, can support the estimation of parameters for
current and new projects. Coupling this database to the portfolio selection system through
appropriate data analysis packages would help to widen the base of portfolio selection techniques
that could be considered by the organization, and would ease the data collection burden when
portfolio selection is carried out. This in tum might make it possible to re-balance the portfolio at
more frequent intervals (currently, most organizations do this on an annual basis), and thus
decrease the time taken to get promising projects underway.
4. An Integrated Approach to Project Portfolio Selection
The previous discussion has covered a variety of existing portfolio selection approaches,
identified a number of related problems, and given some reasons why certain techniques are more
popular than others. One solution to the problems identified would be to use an integrated
approach which takes advantage of the best characteristics of several existing methods. This
approach would make use methods which have a good theoretical base, combined with other
methods that may not be strong theoretically, but which have desirable decision support
characteristics, for example. Our proposal is to use a staged approach, where the most relevant
methods can be selected by the organization and used at each stage in order to build a portfolio
with which decision makers could be confident. Other attempts to build decision support systems
for portfolio selection have been reported (Kira et al 1990; De Maio et al 1994). However, these
have been quite limited and perhaps too specific in the methods that were used, rather than
providing flexible choices for the users. In the following, we consider the portfolio selection
process as a three-stage process, beginning with pre-processing, and going on to processing and
post-processing. This is illustrated in Figure 2. We discuss model selection and development,
(the choice of techniques used in this process according to organizational needs), in part e) below.
The important activities in the portfolio selection process (see Figure 2) include :
a) Pre-Screening-. This is used to eliminate infeasible projects before the selection process
begins, based on preliminary information. This helps to reduce the number which must be
Page 3 1

!"
fl
Pre-Screening
Model Selection
a Development
, ... • Individual Project Evaluation
Screening
Portfolio Selection
Portfolio Balancing
a Adjustment
· . . . . . . . . . . . . . . . . . . . . . . . · '· . . . . . . . . . . . . . . . . .
Pre-Process Stage
I , _ - - - - - - - - - - - - - - - .I
Process Stage
Figure 2
Post-Process Stage
Proposed Project Portfolio Selection Process
Page 32

. l .,
. _ ,
. � • 1!'>
·, .
considered in the selection process, thereby reducing workload and information overload
problems. For example, in-process projects which are at a gate or milestone could be elirnin�ted !
if they are complete, to be �erminated, or put on the backbumer due to unsatisfactory progress. I
Also, large projects which d0 not yet have a champion,.or which have not yet undergone a
feasibility analysis could be screened out ai this &tage. However, interdependence o� projects, and
whether or not projects were mandatory would need to be identified first.
b) Individual Project Evaluation: . During this process, input data from individual projects
are analyzed and processed into a common form which �s suitable for further analysis. For
example, if the method of choice were a combination of net present value combined with risk
analysis, the inputs would be estimates of costs and r�tums at each development phase and the
commercialization phase of a product or service, and the risks at each phase, or more simply the
development and commercial .risks. Uncertainty could also be input in the form of likely ranges for
the uncertain parameters. Other inputs could include qualitative variables such as policy or
political measures. Quantitative output from this stage would be (for example) each project's
expected net value, risk, and resource requirements over the time frame of the project, along with
· ,, ... � calculated uncertainties in these output results, and any input qualitative variables on a common
scale.
c) Screening: During this activity, economic calculations from the previous stage are used
to eliminate any non-mandatory projects or inter-related families of projects which do not meet
pre-set economic criteria such as estimated rate of return.
d) Portfolio Selection: This process combines the outputs of the previous stage in a
manner that selects a portfolio, based on the objectives of the organization. This could involve
extensive interactions with committee members in comparing potential projects on a number of
objectives, or it could involve little direct intervention if an optimization technique such as 0-1
ILP were used. The output of this stage would be a preliminary ranking of the projects, based on {!
the objective(s) specified for the portfolio, and an initial allocation of resources up to the � .
maximum available. This would provide only a first cut at the problem, which would then
proceed to the post-processing stage where final adjustments are made by decision maker( s ), and
re-calculations carried out as necessary to provide support during sensitivity analysis and portfolio
balancing.
Page 3 3
e) Portfolio Balancing and Adjustment: At this stage decision makers apply judgment to
make the final adjustments to the portfolio. The decision support display would be in the form of
one or more portfolio matrices, which would display graphically the critical decision variables
selected by the organization for this purpose. Any interactions among the projects, such as
interdependence and mutual exclusivity, have already been taken into account in previous
activities and could be displayed during this stage upon request. Portfolio balancing is a judgment
problem which requires feedback to the decision maker( s) on the consequences of making
deletions and/or additions at this point. Data on this would come from sensitivity calculations,
using the same model applied in the portfolio selection process. Hence there could be a
substantial amount of iteration between the processing and the post-processing stage during the
final adjustment process.
t) Model Selection & Development
Before beginning the portfolio selection process, the organization needs to decide which
techniques it wishes to use in each stage of the process. This would probably be a one-time
process (with minor and infrequent adjustments), which would depend upon the organization's
culture, experience, and the availability of information needed as input. This is complicated by the
fact that there is more uncertainty about projects which are proposed but not yet underway, as
compared to projects which are already underway and for which there is more data available.
This may require a combination of techniques to be used, depending upon uncertainty in the
estimates. For example, simple checklists of must-meet criteria could be used during the early
days of the project, while more sophisticated models might be used for more advanced projects
(Cooper 1 993). The important point is that the data provided for later stages in portfolio
selection must be in a common format so appropriate comparisons can be made among projects.
Considering the selection process shown in Figure 2, pre-screening would likely be an
administrative decision based on specific guidelines. Individual project evaluation could be done
by a variety of benefit contribution techniques. The screening process would again probably
depend on certain guidelines which might eliminate all non-mandatory projects with an internal
rate of return less than 15%, for example (if this benefit contribution technique were being used).
Page 34

During portfolio selection, all remaining projects would be compared on some basis through one
of the comparative techniques such as AHP or pairwise comparison, or by optimization. During
portfolio balancing and adjustment all the projects, including those surviving the screening process
but not selected during portfolio selection, would be displayed on certain dimensions such as
those used for portfolio matrices, as chosen by the organization. Information available to the
users while the final balancing process is underway should include the amount of each resource
consumed and the sensitivity of the objective function to changes caused by adding or deleting
projects. This might require iteration back to the previous stage to refine the portfolio
calculations.
Since decision makers should be directly involved with the selection process at each of its
stages, support tools will be essential to implement each technique used, and the intention should
be to leave the choice of specific techniques up to the decision makers. We believe that this
generic approach would allow the best parts of each technique chosen to be integrated into a
system which provides far better and more acceptable project portfolios than those which can be
generated by any single technique we have discussed. Further studies are being done to evaluate
the potential of this flexible and integrated approach, and will be reported in the near future.
Page 3 5
REFERENCES
Archibald, Russell D. ( 1992). Managing High-Technology Programs and Projects
(Second Edition), New York, NY: Wiley.
Armstrong, I.Scott, & Brodie, Roderick J. ( 1994). Effects of portfolio planning methods
on decision making: Experimental results, International Journal of Research in Marketing, 1 1 ,
73-84.
Baker, N. R., & Freeland, J. ( 1975). Recent advances in R&D benefit measurement and
project selection methods. Management Science, 21 , 1 164-1 175 .
Bard, Jonathan F., & Sousk, Stephen F . (1990). A tradeoff analysis for rough terrain
cargo handlers using the AHP: An example of group decision making, IEFE Transactions on
Engineering Management, 37(3), 222-227.
Brenner, Merrill S. (1994). Practical R&D project prioritization, Reasearch. Technology
Management, 37(5), 3 8-42.
Buckley, S .R., & Yen, D. (1990). Group Decision Support Systems: Concerns for
success, The Information Society, 7, 109-123 .
Canada ; John �-, & White, John A. (1980). Capital Investment Decision Analysis for
Management and Engineering, Englewood Cliffs, N.J. : Prentice-Hall.
Churchman, C.W., & Ackoff, R.L. ( 1954), An approximate measure of value, Operations
Research, 2.
Cooper, Robert G. ( 1993). Winning At New Products (Second Ed.), Reading, MA: Addison-Wesley.
Cooper, R., Edgett, S., & Kleinschmidt, E. (1995). Private Communication.
De Maio, Adriano, Verganti, Roberto, & Corso, Mariano ( 1994). A multi-project
management framework for new product development, European Journal of Operational
Research, 78, 178-191 .
Dos Santos, B.L. ( 1989). Selecting information system projects: problems, solutions and
challenges, Proceedings of the Hawaii Conference on System Sciences, 1 13 1- 1 140.
Dyer, James S. ( 1990). Remarks on the Analytic Hierarchy Process, Management Science,
36(3), 249-258.
Page 36

Evans, Gerald W., & Fairbairn, Robert (1 989). Selection and scheduling of advanced
missions for NASA using 0- 1 integer linear programming, Journal of the Operational Research
Socie"/y, 40(1 1 ), 971-98 1 .
Golden, Bruce L., Wasil, Edward A., & Levy, Doug E . (1989). Applications of the
Analytic Hierarchy Process: A Categorized, Annotated Bibliography. The Analytic Hierarchy
Process: Applications and Studies (Golden, Bruce L., Wasil, Edward A., & Harker, Patrick T.,
Eds).
Hall, D.L., & Nauda, A. (1990). An interactive approach for selecting IR & D projects,
IEEE Transactions on Engineering Management, 37(2), 126- 1 3 3 .
Harker, Patrick T . (1987a). Alternative modes of questioning in the Analytic Hierarchy
Process. Mathematical Modelling, 9, 3 53-360.
Harker, Patrick T. (1987b). Incomplete pairwise comparisons in the Analytic Hierarchy
Process, Mathematical Modelling, 9, 83 7-848 .
Harker, Patrick T . , & Vargas, Luis G. (1987). The theory of ratio scale estimation: Saaty's
Analytic Hierarchy Process, Management Science, 33, 1 383-1403 .
Harker, Patrick T. (1989). The art and science of decision making: The Analytic Hierarchy
Process. In Analytic Hierarchy Process: Applications And Studies (Golden,Bruce L., Wasil,
dward A., & Harker Patrick T., Eds.).
Haspelagh, P. (1982). Portfolio planning: Uses and limits, Harvard Business Review,
60(1), 5 8-73 .
Hax, Arnoldo C., & Majluf, Nicolas S . (1984). Strategic Management: An Integrative
Perspective, Englewood Cliffs, N.J. : Prentice-Hall.
Hax, Arnoldo C. & Majluf, Nicolas S . (1996). The Strategy Concept and Process: A
Pragmatic Approach (Second Ed.), Upper Saddle River, N.J. : Prentice-Hall.
Hess, Sidney W. (1993). Swinging on the branch of a tree: Project selection applications,
Interfaces 23(6), 5-12.
Johnson, C.R. (1980). Constructive critique of a hierarchical prioritization scheme
employing paired comparisons, Proceedings of the International Conference of Cybernetics and Sociery, New York, NY: IEEE.
Page 37
Kamenetzky, Ricardo D. ( 1982). The relationship between the Analytic Hierarchy Process
and the additive value function, Decision Sciences, 13, 702-71 2.
Keeney, R.L., & Raiffa, H. ( 1976). Decisions With Multiple Objectives: Preference And
Value Tradeoffs, New York: Wiley.
Khan, Arshad M., & Fiorino, Donald P. ( 1992). The capital asset pricing model in project
selection: A case study, The Engineering Economist, 37(2), 145-1 59.
Kira, Dennis S., Kusy, Martin I. , Murray, David H., & Goranson, Barbara J. (1990). A
specific decision support system (SDSS) to develop an optimal project portfolio mix under
uncertainty, IEEE Trans. Engineering Management, 37(3), 2 1 3 -221 .
Krumm, F.V., & Rolle, C.F. ( 1992). Management and application of decision and risk
analysis in Du Pont, Interfaces, 22( 6), 84-93 .
Lim Kai, H., & Swenseth, Scott R. (1993). An iterative procedure for reducing problem
size in large scale AHP problems, European Journal of Operational Research, 61, 64-67.
Martino, Joseph P. (1995). R&D Project Selection, New York, NY: Wiley.
Matheson, James E., & Menke, Michael M. (1994). Using decision quality principles to
balance your R&D portfolio, Research Technology Management, (May-June), 38-43 .
Matthieu, R.G., & Gibson, J.E. (1993). A methodology fo r large-scale R&D planning
based on cluster analysis, IEEE Transactions on Engineering Management, 40(3), 283-292.
Meredith, Jack R., & Mantel, Samuel J. , Jr. ( 1995). Project Management: A Managerial
Approach (Third Ed.), New York, NY: Wiley.
Miller, G.A. (1956). The magical number seven, plus or minus two: Some limitations on
our capacity for processing information, Psychology Review 63, 8 1 -97.
Morison, A., & Wensley, R. ( 1991) . Boxing up or boxed in? A short history of the Boston
Consulting Group share/growth matrix, Journal of Marketing Management, 1, 105-129.
Mukherjee, Kampan (1994). Application of an interactive method for MOLIP in project
selection decision: A case from Indian coal mining industry, International Journal of Production
Economics, 36, 203-2 1 1 .
Murphy, Catherine Kuenz (1993). Limits on the analytic hierarchy process from its
consistency index, European Journal of Operational Research, 65, 1 3 8- 1 39.
Page 38

Pessemier, E.A., & Baker, N.R. ( 197 1) . Project and program decisions in research and
development, R & D Management, 2( 1 ).
Rasmussen, L.M. ( 1986). Zero-one programming with multiple criteria, European Journal
of Operational Research, 26, 83-95 .
Remer, Donald S. , Stokdyk, Scott B. , & Van Oriel, Mike ( 1993). Survey of project
evaluation techniques currently used in industry. International Journal of Production Economics
32, 103-1 1 5 .
Riggs, Jeffi"ey L., Brown, Sheila B . , & Trueblood, Robert P . ( 1994). Integration of
technical, cost, and schedule risks in project management, Computers & Operations Research,
21(5), 521-533 .
Roussel, P.,Saad, K., & Erickson, T . ( 1991). Third Generation R&D: Managing the Link
to Corporate Strategy, Cambridge, MA: Harvard Business School Press and Arthur D. Little Inc . .
Rzasa, Philip V., Faulkner, Terrence W., & Sousa, Nancy L . (1990). Analyzing R&D portfolios at Eastman Kodak, Research Technology Management, (Jan.-Feb.) 27-32.
Santhanam, R., Muralidhar, K., & Schniederjans, M. (1989). A zero-one goal
programming approach for information system project selection, OMEGA, 17(6), 583-593 .
Saaty, Thomas L. (1990). An exposition of the AHP in reply to the paper "Remarks on
the analytical hierarchy process, Management Science, 36(3), 259-268.
Saaty, Thomas L. , Rogers, Paul C. , & Pell, Ricardo. (1980). Portfolio selection through
hierarchies, The Journal of Portfolio Management, 6(3), 1 6-2 1 .
Schniederjans, Mark J., & Santhanam, Radhika ( 1993). A multi-objective constrained
resource information system project selection method. European Journal of Operational
Research, 70, 244-253 . .
Schwartz, S .L., & Vertinsky, I. (1977). Multi-attribute investment decisions: A study of
R&D project selection, Management Science, 24, 285-3 0 1 .
Sharpe, W.F. (1964). Capital asset prices: A theory of market equilibrium under
conditions of risk, Journal of Finance, 425-442.
Souder, W.E. (1973). Analytical effectiveness of mathematical models for R&D project
selection, Management Science 19(8), 907-923 .
Page 3 9

Souder, William E. ( 1975). Achieving organizational consensus with respect to R & D
project selection criteria. Management Science 21 ( 6), 669-68 1 .
Souder, W.E. (1978). A system for using R&D project evaluation methods, Research
Management, 20(5), 29-37.
Souder, William E. (1984). Project Selection and Economic Appraisal, New York, NY:
Van Nostrand Reinhold.
Todd, Peter, & Benbasat, Izak (1993). An experimental investigation of the relationship
between decision makers, decision aids, and decision making effort, INFOR, 3 1(2), 80-100.
Wensely, R. (1981). Strategic marketing: Betas, boxes, or basics? Journal of Marketing,
45, 173- 1 8 1 .
Wind, Y., & Mahajan, V . (198 1 ). Designing product and business portfolios, Harvard
Business Review, 59, 1 55-165.
Wind, Yoram, Mahajan, Vijay, & Cardozo, Richard N. ( 198 1 ). New Product Forecasting,
Lexington, MA: LexingtonBooks.
Wmd, Y., Mahajan, V., & Swire, D.J. (1983). An empirical comparison of standardized
portfolio models, Journal of Marketing, 47, 89-99.
Zahedi, Fatemeh (1986). The Analytic Hierarchy Process - A survey of the method and its
applications, Interfaces, 16(4), 96-108.
Page 40

APPENDIX
I 1 Strate�c Decision Group (SDG) Project Portfolio Method
This discussion is an adaptation of material from a variety of sources (Cooper 1993 ; Hax & Majluf 1 984; Matheson & Menke 1994). The SDG portfolio matrix consists of two
dimensions. The first dimension represents the Expected Commercial Value (Net Present Value or
NPV) of the project given technical success. The second dimension represents the Probability of
Technical Success of the project.
The two factors mentioned above are calculated for each candidate project and then all of
the c�di�ate projects are plotted in-� bubble dia�am. The size of the bubbles or circles denotes
the amount of financial resources devoted to each project, hence serving as a third dimension, the
size of the project.
Figure l (see page 18) depicts a typical SDG matrix. In this figure, each quadrant has a
certain name. These names might be different depending on the country or company where the
matrix is being used, but the strategy that should be followed for a project falling into that
quadrant is the same since projects in the same category tend to have similar characteristics.
Commonly used labels for SDG quadrants are as follows:
Cl) Pearl- Highly desirable projects that have both high commercial value and high
probability of technical success. Identified revolutionary commercial applications and proven
technological advancement projects are typical projects in this category.
�) Bread and Butter- Projects with high probability of technical success but low
commercial value. Evolutionary improvements in process or product, modest extensions of
existing technology or applications, and minor projects are typically in this category. These
projects are often necessary because they provide the cash flow that fuels operations of the firm . y) Oyster- Projects with low probability of success but high commercial value are
considered oysters. Revolutionary commercial applications and innovative technological
advancement projects are typical of this category. Oysters must be cultivated to yield pearls to
ensure the future of the firm. 5) White Elephant- These projects have neither high probability of technical success nor
high commercial value. Oysters that are found to be commercially overstated, and bread and
Page 41

butter projects with overstated probability of success fall into this category.
The decision rule could be to seek as many pearls as possible, invest in some oysters, try
to cut back on the bread and butter ones (there are usually too many of these), and delete white
elephants.
The major advantages of using the SDG portfolio matrix are:
a) It considers technological risk explicitly. This is important, especially for R&D, and
b) The model reflects the project's commercial value. In most cases this is the main
reason for carrying out the project.
The most important disadvantages of the SDG method are:
a) The model does not provide any assistance as to how many oysters and/or which ones
should be selected or how many bread and butters and/or which ones should be cut,
b) The model assumes that all critical resource absorption can be expressed with a single
index (financial). In reality there might be other critical resources such as work force and technical
resources that should also be considered,
c) The SDG method does not address the important issue of interdependence among
projects. For example, what should the decision maker do if a project is a pearl but another
project that gives some required inputs to that project is a white elephant?
d) The issue of mutually exclusive projects is not clear in the SDG model. For example, if two mutually exclusive projects fall into the pearl quadrant which one should be selected?
e) The SDG model only considers the probability of technical success. The probability of
commercial success, which is an important risk factor and is sometimes more critical, is ignored,
t) Commercialization and R&D costs are not reflected in the commercial value that is
represented by NPV, so some improvements are necessary in the definition of commercial value,
g) A critical limitation arises when the model is to be used as a prescriptive methodology.
This limit is implicit in the difficulty of estimating a project's probability of technical success,
h) The range of uncertainty for research more than a year or two in the future is so
substantial that use of NPV as a selection factor becomes not only meaningless but possibly
harmful (Roussel et al., 1991),
i) The capital and marketing investment required to exploit technological success is not
explicitly considered in the model.
Page 42

1 "1
I 2 Artbur D Little (ADL) Proiect Portfolio Matrix Method
The following description of the ADL method is adapted primarily from chapter six of
Roussel, Saad, & Erickson ( 1991 ). The ADL approach first examines each individual project, then
places each project within portfolio structures that accommodate strategic elements most critical
to the specific company and its industry. Individual projects are evaluated in terms of four key
elements:
1 . Competitive technological strength
2. Technology maturity
3 . Competitive impact of technology
4. R&D project attractiveness
Elements of attractiveness and their importance depend on the specific company and
industry. However, the most common elements of attractiveness are presented in Figure 3 . The
first element- fit of the project with the business or corporate strategy- is a decisive one. The
remaining criteria come into consideration only if the fit is good to excellent, otherwise the project
must be rejected outright.
As different attractiveness criteria have different importance, typically each criterion is
weighted, say from 1 to 5, based on the type of the firm and the industry in which it competes. A
simple scoring system can then be applied to give a rough ranking of the projects under
consideration.
The criteria that decide project attractiveness may be used collectively or as individual
components during portfolio considerations (Figure 3) . These elements typically may
beconsidered and balanced duing R&D project portfolio selection.
After identifying the portfolio variables that should be balanced, these variables are plotted
against each other on two-dimensional grids. Then the proposed projects are examined in these
different portfolio matrices. No single display can possibly convey all the complexities of the
proposed portfolio but each individual matrix raises some interesting questions. For example, is it
prudent to concentrate a major part of resources in high risk projects?
Figure 4 illustrates one of several different matrices that can be applied with regard to the
above mentioned criteria. Each circle in the matrix depicts a project and the recommended budget
is symbolized by the area within the circle. The improved portfolio is also illustrated in the Figure
Page 43

J>, � � : . Ellmenta. of R&D . ·1 Protect Attractiveness ; Fit with business or corporate
strategy
Inventive merit and strategic
importance to the business
Durability of the competitive
advantage sought
Reward
Competitive impact of
technologies
Uncertainty
; •,f, IJ�t=™=:•� • A judgment ranging from excellent to poor
• The potential power of the sought-after result to:
a) improve the competitive position of the business
b) be applicable to more than one business
c) provide the foundation for new businesses
• A judgment from high to low
• Years. If the R&D result can be quickly and easily initiated by
competitors. the project is less attractive than one that
provides a protected. long-term advantage
• Usually financial, but sometimes "necessity work· (e.g., _ _ _ _ _
satisfying regulatory bodies) or building a knowledge base that becomes the foundation for applied work
• Base, key, pacing, embryonic. If a project is made up
entirely of the application of base technologies. it is classified
as ·base·: if a project contains at least one key or pacing technology. the entire project is classified as ·key• or ·pacing•
Probability of technical success I • Probability units. 0. 1 • 0.9. The probability that the objective will be achieved as defined
Probability of commercial I • Probability units. 0.1 • 0.9. The probability of commercial
success success if the project is technically successful
Probability of overall success I • Probability units. 0. 1 • 0.9. The product of technical and commercial probabilities
Exposure R&D costs to completion or key I • Dollars
decision point
Time-to-completion or key I • Time
decision point
Capital and/or marketing I ·• Dollars
investment required to exploit
technical success
Figure 3 (source - Roussel et al 1 99 1 )
Typical Elements of R&D Project Attractiveness
Page 44

c: 0 :€ en 0 a.. CD .2! -s 8. E 0 (.) � "8> 0 c:: .t::. � I-
Domrnant
Strong
Favorabte
Tenable
Weak
Original Haber R&O Proposal Revised Haber R&O Portfolio
I ...
Embryonic Growth Mature Aging Embryonic Growth Mature
� Technological Uncertainty Increases ----
• Technological Uniqueness Increases ----
...
Aging
j -� en c Q) .t::. en u ea � � - c o --� :g = n � � O U)
- "-----·· - -�
Manufacturing c:cst - vanillin 6 Beef natural essence 1 1 Enzyme Beta (noncalorrc fat substrMe)
2 Cola extract
3 Maple extract
4 Raspt>erry extract
5 Bluebeny extract
7 Shrimp natural essence 1 2 Salt mimrc
8 Salmon natural essence 1 3 Cost reduction - Sweetane
9 Lobster natural essence 13A Radical cost reduct10n - Sweetane
10 Crab natural essence 14 Fundamental (cocoa tree genetics)
.,& Technical service to customers
Figure 4 (source - Roussel et al 1 99 1 )
Sample ADL Project Portfolio Matrix Display
Page 45

beside the elementary portfolio, in the same form. Improvements are based on discussions
of different issues raised when decision makers concentrate on different matrices. Typical
improvements include abandoning a project, adding the resources that are taken from the rejected
projects to the retained projects, improving technological competitive position, and reducing the
exposure in some projects by forming an R&D partnership to reduce the costs.
Major advantages of the ADL method are:
a) ADL considers a number of qualitative characteristics of each project that make a
project attractive, instead of NPV that is not suitable for R&D projects,
b) Decision makers are forced to consider R&D costs to completion explicitly, and also
the capital and marketing investment required to exploit technical success, --- -
c) The portfolio can be balanced from different points of view, and
d) The ADL model considers the probability of technical success as well as the probability
of commercial success, which is another important risk factor.
The disadvantages of the ADL method are:
1 . Since several matrices are used in this approach, the method can be time consuming and
boring. This also leads to infonnation overload since users have difficulty in keeping all the
information in mind at one time, thus detracting from the method,
b) The model assumes that all critical resource absorption can be expressed financially.
There might also be other critical resources such as work force and technical resources that
should be considered during the selection process,
c) The ADL method does not address interdependence among projects,
d) The issue of mutually exclusive projects is not clear in the ADL model, which does not
provide any assistance to prevent mutually exclusive projects from being selected, and
e) A critical limitation arises if the model is to be used prescriptively. This limit is implicit
in the difficulty of estimating the probability of technical and commercial success.
Page 46

II 0- 1 Inteier Linear Pro�amminG Optimization Method
The 0-1 ILP model includes decision variables, an objective function, and constraints.
These components are described in detail below (adapted from Evans and Fairbairn, 1989).
Decision Variables
The decision variables are defined by
� = {1 if project i is included in the portfolio
0 otherwise
for i = 1, . . . , N, where N is the total number of projects being considered.
Objective function
Project portfolio selection problems are essentially multi-objective problems involving
maximization of benefits in several categories as well as minimization of cost and other resources.
These objectives are conflicting in nature. For example, one might select all possible projects in
order to maximize the benefits, but this solution would also result in maximization of cost.
In addition, specific projects, if undertaken, may increase benefits in some categories but
also will use resources that could have been used for projects that would have increased benefits in other categories. The objective of minimization of the use of resources can be treated implicitly
through the use of constraints on resources. A value function approach (Keeney and Raffia,
1976) can be applied to the problem ofbenefit maximization in the various categories to reduce
the multi-attribute problem to single-attribute (Evans and Fairbairn, 1 989). This overall objective
function could be a weighted function of various sub-objectives or criteria. Therefore, written in
an explicit form, the objective function can be given by
Maximize Z = :t ab ( fqib x) b = 1 i = l
Where Z is the value function that should be maximized; B is the number of benefit categories;
a,, denotes the "importance of benefit category b" to the decision maker; and q ibrepresents "the
amount of benefit" contributed by project i to category b. One could employ the AHP method to
obtain estimates ofa,, and cu, (Evans and Fairbairn, 1989). Within the scheme of the Expert Choice®
software implementation of AHP, a,, is the global priority of benefit category b, while Clio is the local
priority of project i with respect to category b.
Page 47
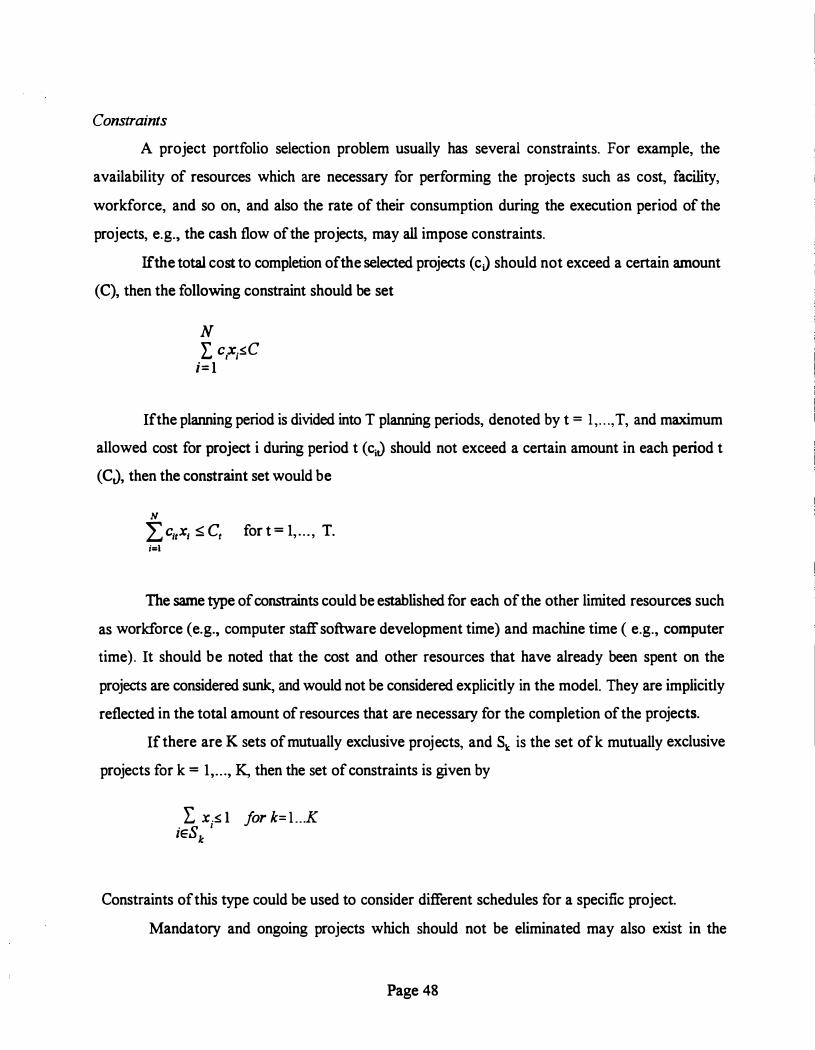
Constraints
A project portfolio selection problem usually has several constraints. For example, the
availability of resources which are necessary for performing the projects such as cost, facility,
workforce, and so on, and also the rate of their consumption during the execution period of the
projects, e.g., the cash flow of the projects, may all impose constraints.
If the total cost to completion of the selected projects ( cJ should not exceed a certain amount
(C), then the following constraint should be set
N L, c,x;-s.C
i= l
Ifthe planning period is divided into T planning periods, denoted by t = l , . . . ,T, and maximum
allowed cost for project i during period t ( ciJ should not exceed a certain amount in each period t
(CJ, then the constraint set would be
N
L citxi � et for t = 1, . . . , T. i=l
The same type of constraints could be established for each of the other limited resources such
as workforce (e.g., computer staff software development time) and machine time ( e.g., computer
time) . It should be noted that the cost and other resources that have already been spent on the
projects are considered sunk, and would not be considered explicitly in the model. They are implicitly
reflected in the total amount of resources that are necessary for the completion of the projects.
If there are K sets of mutually exclusive projects, and Sk is the set of k mutually exclusive
projects for k = 1, . . . , K, then the set of constraints is given by
L x .-s. l for k= l . . .K iESk I
Constraints of this type could be used to consider different schedules for a specific project.
Mandatory and ongoing projects which should not be eliminated may also exist in the
Page 48

portfolio. These projects must remain in the model and can be added to the portfolio once it is
select� because they consume resources that should be considered explicitly. The following set of
constraints guarantees the inclusion of these types of projects in the selected portfolio.
XieS = 1 •
where Sm is the set of mandatory projects, and
X1eS = 1 •
Here, S0 is the set of ongoing projects that should be continued.
Projects which must be discontinued can be eliminated by the following constraint
xi e s = 0 '
where Sd is the set of ongoing projects that should be eliminated from consideration. This constraint
could also be useful in sensitivity analysis.
Interdependent projects can also be considered in the model. Let P / be the set of precursor
projects for a particular project /, where /= 1, . . . , L. In other words if project I is to be selected, then
all of the projects in set P / must be selected. This is controlled by the following set of constraints.
L X/�.N(P1) *x1 for l= l . .L iEP1
where N (P 1) is the number of projects contained in the set P 1•
If only one project from a set of projects, � , must be chosen before project m can be
selected, this can be managed by
L x1 � xm i e R111 for m = 1 , . . . , M.
Many other types of constraints could be defined for this model, depending on the situation.
For example, one could specify required relationships for different types of projects (e.g., the number
of projects in a certain category must be at least twice the number of projects in another category).
Enlarging the constraint set does facilitate obtaining an optimal solution (Evans and Fairbairn, 1989).
Page 49

INNOVATI ON RESEARCH WORKI NG GROUP WORKING PAPER SER I E S
1 . R . G . Cooper and E . J . Kl e ins chmidt , " How the New Product Impac t s on Success and Fai lure in t he Chemical Industry " , February , 1 9 9 2 .
2 . R . G . Cooper and E . J . Kle ins chmi dt , " Maj or New Produc t s : What Dist ingu i she s the Winners in the Chemi c a l Industry" , February , 1 9 9 2 .
3 . J . Mi l t enburg , " On the Equival ence Technologies for Reduc ing Was t e s in 1 9 9 2 .
o f JIT and Manu f acturing �
MRP as March,
4 . J . B . Kim , I . Krinsky and J . Lee , " Valuat ion o f Ini t i a l Pub l i c Of f erings : Evidenc e from Korea " , February , 1 9 9 2 .
5 . M . Basadur and S . Robinson , " The New Creat ive Thinking Ski l l s Needed f o r Total Quality Management to Become Fact , Not Jus t Philosophy " , April , 1 9 9 2 .
6 . S . Edgett and S . Parkinson , " The Deve l opment o f New Services Dist inguishing Between Suc c e s s and Fai lure " , Apri l , 1 9 9 2 .
7 . A . R . Montazemi and K . M . Gupta , " Pl anning and Deve l opment o f Information Syst ems Towards Strategic Advant age o f a Firm " , April , 1 9 9 2 .
8 . A . R . Montazemi , " Re ducing the Compl exity o f MIS Innovat ion Through Hypermedia and ExPert Sys tems " , May , 1 9 9 2 .
9 . M . Basadur and Bruce Pat on , " Creat ivity Boosts Pro f i t s in Reces s i onary Time s - Broadening the P l aying Fie l d " , June , 1 9 9 2 .
1 0 . Robert G . Cooper and Elko Kl e ins chmidt , " Stage -Gat e Syst ems for Product Innovat ion : Rat iona l e and Re sul t s " , June , 1 9 9 2 .
1 1 . S . A . W . Drew , " The S trateg i c Management o f Innovat i on in the F inanc i al Services Indust ry : An Emp ir i cal S tudy " , July , 1 9 9 2 .
12 . M . Shehata and M . E . Ibrahim , " The Impact o f Tax Pol icies on Firms ' R & D Spending Behavior : The Cas e of R & D Tax Credit " , July , 1 9 9 2 .
1 3 . Wil l i H . . Wiesne r , " Deve lopment Interview Technology : Impl icat ions for Innovat ive Organi z at ions " , July , 1 9 9 2 .

14 . I s ik U . Zeyt inog lu , " Techno logi c a l I nnova t i on and t he Creat ion o f a New Type o f Employment : Te l ework " , Augu s t , 1 9 9 2 .
1 5 . John W . Medco f , " An Int egrated Mode l f or Teaching the Management of Innovat ion in the I ntroduc t ion t o Organ i z at i onal Behavi our Course " , October , 1 9 9 2 .
1 6 . Min Bas adur , " The Why - What ' s S t opp ing Analys i s : A New Methodo l ogy for Formulat ing I l l - S t ructured Problems " , October , 1 9 9 2 .
1 7 . S t ephen A . W . Drew , " Strategy , Innovat i on and Organi z at ional Learning an Integrat ive Framework , Case Hi stories and D i re c t i ons for Res earch " , November , 1 9 9 2 .
1 8 . S t ephen A . W . Drew , 11 Innovat ion and S t rategy in F inanc ial Services " , November , 1 9 9 2 .
1 9 . Scott Edgett , " New Product Deve lopment P ract ices for Retail F i nanc i a l Services " , November , 1 9 9 2 .
2 0 . Robert G . Cooper and Elko J . Kl e inschmidt , " New Product Winners and Losers : The Rel at ive Import ance of Success Factors - Percept ion vs . Real ity " , November , 1 9 9 2 .
2 1 . Robert G . Cooper and Elko J . Kl e inschmidt , " A New Product Suc c e s s Factors Model : An Emp irical Val i dation " , November , 1 9 9 2 .
2 2 . Robert G . Cooper & Elko J . Kle inschmidt , " Stage Gat e Syst ems : A Game P l an for New Product Suc ce s s " , November , 1 9 9 2 .
2 3 . Min Basadur , " Opt imal I deat ion - Eva luat i on Rat ios 11 , March , 1 9 9 3 .
2 4 . Christopher K . Bart , " Gagging on Chaos " , March , 1 9 9 3 .
2 5 . Yuf e i Yuan , " The Role of Informat i on Technology i n Bus ine s s Innovat i on " , July , 1 9 9 3 .
2 6 . I s ik Url a Zeyt inoglu , " Innovat i on in Emp loyment : , A Telework Experiment in Ontario " , July , 1 9 9 3 .
2 7 . John Milt enburg and David Sparl ing , " Managing and Reducing Total Cyc le Time : Moles and Analys i s " , August , 1 9 9 3 .
2 8 . R . G . Cooper , C . J . Eas ingwood , s . Edgett , E . J . Kleinschmidt and C . Storey , " What Dist ingui shes the Top Perf ormers in F inanc ial Servi ces " , September , 1 9 9 3 .
2 9 . B . E . Lynn , " Innovat ion and Account ing Research " , S ept ember , 1 9 9 3 .

3 0 . Min Bas adur and Pet er Haus dorf , " Measur ing Addit i onal D ivergent Thinking Att i tude s Re l at ed to Creat ive Prob lem So lving and Innovat ion Management " , November , 1 9 9 3 .
3 1 . R . G . Cooper and E . J . Kl e inschmidt , " De t e rminant s o f Time E f f i c i ency in Product Deve lopment " , Decemb e r , 1 9 9 3
3 2 . Christopher K . Bart , " Back to t he Future : Time l e s s Les sons for Organizat ional Succe s s " , February , 1 9 9 4 .
3 3 . Ken R . Deal and Scot t J . Edgett , " De t e rmining Succ e s s Criteria for New Financial Produc t s ; A Comp arat ive Analys i s o f CART , Legit and D i s criminant Analys i s " , February , 1 9 9 5 .
3 4 . Christopher K . Bart and Mark c . B aet z , " Do e s M i s s ion Mat t e r ? " , February , 1 9 9 5 .
3 5 . Christopher K . Bart , " Control l ing New P roduc t s : A Contingency Approac h " , February , 1 9 9 5 .
3 6 . Chri s topher K . B art , " I s Fortune Magaz ine Right ? An Inve stigat ion into the App l i c at i on o f Deut s chman ' s 1 6 High Tech Management Practice s " , February , 1 9 9 5 .
3 7 . Christopher K . Bart , " The Impact o f Mi s s ion on Firm Innovat ivenes s " , February , 1 9 9 5 .
3 8 . John W . Medcof , " Transnat ional Techno logy Networks " , Apri l , 1 9 9 5 .
3 9 . R . G . Cooper and E . J . Kl eins chmidt , " Benchmarking t he Cri t ical Succes s Factors o f Firms ' New Product Deve l opment Programs " , Apr i l , 1 9 9 5 .
4 0 . John W . Medcof , " Trends in S e l e c t ed High Technology Industries " , July , 1 9 9 5 .
4 1 . Robert C . Cooper & E . J . Kl e inschmidt , " Benchmarking Firms ' New Product Performance & Prac t ices " , S ep t ember , 1 9 9 5 .
4 2 . Min Bas adur and Darryl Kirkl and , Divergent Thinking Att itude s o f November , 1 9 9 5 .
" Training Ef fect s on the S outh Amer i can Managers " ,
4 3 . Min Basadur , " Organi zat i onal D eve l opment I nt ervent ions for Enhanc ing Creat ivity in the Workp l ac e " , November , 1 9 9 5 .
4 4 . Min Basadur , " Training Manager i al Evaluat ive and Ideat ional Ski l ls in Creat ive Probl em S olving : A Caus a l Mode l " , December , 1 9 9 5 .

4 5 . Min Bas adur , Pam P ringle and S imon Taggar , " Improving t he Re l i ab i l ity o f Three New Scal e s Whi ch Measure Three New Divergent Thinking At t i tude s Re l a t e d to Organ i zat i onal Creat ivi ty , December , 1 9 9 5 .