
Project planning & system evaluation - Stanford … planning & system eval May 4 Due: Lit review ......
118
Project planning & system evaluation Bill MacCartney CS224U 13 April 2015
-
Upload
truongkien -
Category
Documents
-
view
218 -
download
1
Transcript of Project planning & system evaluation - Stanford … planning & system eval May 4 Due: Lit review ......

Project planning &system evaluation
Bill MacCartneyCS224U
13 April 2015

Project timeline
Today Workshop 1:Project planning & system eval
May 4 Due: Lit review (15%)
May 16 Workshop 2:Writing up & presenting your work
May 23 Due: Project milestone (10%)
May 25 & Due: Oral presentations (5%)June 1
June 6 Due: Final project paper (30%)2

Forming teams
● You can work in teams of size 1, 2, or 3, but ...
● We heartily encourage teams of 3!
● Collaboration is the norm in scientific research,and in engineering and product development
● You can just get a lot more done: build bigger systems, explore more alternative choices, ...
● Leverage Piazza to find teammates
3

Goals for today
● Get you thinking concretely about what you want to accomplish
● Identify productive steps you can take even if you’re still deciding on a topic or approach
● Try to help you avoid common pitfalls for projects
● Emphasize the importance of planning for system evaluation early
● Start building momentum for the final project!!
4

Inspiration
It’s nice if you do a great job and earn an A on your final project, but let’s think bigger:
● Many important and influential ideas, insights, and algorithms began as class projects
● Getting the best research-oriented jobs will likely involve giving a job talk. Your project can be the basis for one
● You can help out the scientific community by supplying data, code, and results (including things that didn’t work!)
5

Inspiring past projects
See: https://cs224u.stanford.edu/restricted/past-final-projects/
● Semantic role labeling● Unsupervised relation extraction● Solving standardized test problems● Humor detection● Biomedical NER● Sentiment analysis in political contexts● Learning narrative schemas● Supervised and unsupervised compositional semantics● …
Don’t neglect topics from later in quarter (e.g. semantic parsing)!
6

Agenda
● Overview● Lit review● Data sources● Project set-up & development● Evaluation● Dataset management● Evaluation metrics● Comparative evaluations● Other aspects of evaluation● Conclusion
7

The literature review
● A short (~6-page) single-spaced paper summarizing and synthesizing several papers in the area of your final project.
● Groups of one should review 5 papers; groups of two, 7 papers; and groups of three, 9 papers.
● Preferably fuel for the final project, but graded on its own terms.
8

The lit review: what to include
Tips on major things to include:
● General problem / task definition
● Concise summaries of the papers
● Compare & contrast approaches (most important!)
● Future work: what remains undone?
More details at the homepage [link]
9

Our hopes
● The lit review research suggests baselines and approaches.
● The lit review helps us understand your project goals.
● We’ll be able to suggest additional things to read.
● The prose itself can be modified for inclusion in your final paper.
10

Finding the literature
The relevant fields are extremely well-organized when it comes to collecting their papers and making them accessible:
● ACL Anthology: http://www.aclweb.org/anthology/
● ACL Anthology Searchbench: http://aclasb.dfki.de/
● ACM Digital Library: http://dl.acm.org/
● arXiv: http://arxiv.org/
● Google Scholar: http://scholar.google.com/
11

Best-first search algorithm
Until you get a core set of lit review papers:
1. Do a keyword search on the ACL Anthology
2. Download the papers that seem most relevant
3. Skim the abstracts, intros, & previous work sections
4. Identify papers that look relevant, appear often,& have lots of citations on Google Scholar
5. Download those papers
6. Return to step 3
12

Agenda
● Overview● Lit review● Data sources● Project set-up & development● Evaluation● Dataset management● Evaluation metrics● Comparative evaluations● Other aspects of evaluation● Conclusion
13

The importance of data
● Your investigation should be empirical — i.e., data-driven
● We are scientists!○ Well, or engineers — either way, we’re empiricists!○ Not poets or philosophers :-)
● You’re trying to solve a real problem○ Need to verify that your solution solves real problem instances
● So evaluate the output of your system on real inputs○ Realistic data, not toy data or artificial data○ Ideally, plenty of it
414

Sources of data
Three strategies for obtaining data:
1. Find it (the easiest way!)2. Create it (the laborious way)3. Pay others to create it (the expensive way)
(Our discussion will focus primarily on labeled data for supervised learning, but applies to unlabeled data too.)
15

Finding datasets
Linguistic Data Consortium: http://www.ldc.upenn.edu/
● Very large and diverse archive● Especially rich in annotated data● Expensive (but often free for Stanford)
Other useful starting points:
● http://kevinchai.net/datasets● https://datahub.io/dataset?tags=nlp● http://research.microsoft.com/en-US/projects/data-
science-initiative/datasets.aspx
16

Stanford Linguistics corpora
● We subscribe to the LDC and so have most of their data sets: https://linguistics.stanford.edu/resources/corpora/corpus-inventory
● To get access, follow the instructions at this page: https://linguistics.stanford.edu/resources/corpora/accessing-corpora
● When you write to the corpus TA, cc the CS224U course staff address. Don’t forget this step!
● Write from your Stanford address. That will help the corpus TA figure out who you are and how to grant you access.
17

Some NLU datasets (open web)
● Google Wikilinks corpus: http://www.iesl.cs.umass.edu/data/wiki-links
● MSR Entity Recognition and Disambiguation Challenge: http://web-ngram.research.microsoft.com/erd2014/Datasets.aspx
● Google Ngrams data: https://books.google.com/ngrams
● PPDB: The Paraphrase Database: http://www.cis.upenn.edu/~ccb/ppdb/
● WikiAnswers Paraphrase Corpus: http://knowitall.cs.washington.edu/paralex/
● The SemEval-2014 SICK dataset: http://alt.qcri.org/semeval2014/task1/
● The Stanford NLI Corpus: http://nlp.stanford.edu/projects/snli/
● Abstract Meaning Representation (AMR) corpora: http://amr.isi.edu/download.html
● Winograd schemas: http://www.cs.nyu.edu/faculty/davise/papers/WS.html
● WebQuestions (semantic parsing): http://nlp.stanford.edu/software/sempre/
18

More NLU datasets (open web)
● Wikipedia data dumps: http://en.wikipedia.org/wiki/Wikipedia:Database_download
● Stack Exchange data dumps: https://archive.org/details/stackexchange
● Switchboard Dialog Act Corpus: http://www.stanford.edu/~jurafsky/ws97/
● Pranav Anand & co.: http://people.ucsc.edu/~panand/data.php○ Internet Argument Corpus○ Annotated political TV ads○ Focus of negation corpus○ Persuasion corpus (blogs)
● Data Chris has made available as part of other courses and projects:○ Extracting social meaning and sentiment: http://nasslli2012.
christopherpotts.net○ Computational pragmatics: http://compprag.christopherpotts.net○ The Cards dialogue corpus: http://cardscorpus.christopherpotts.net
19

Some NLU datasets (on AFS)
Get access from the corpus TA, as described earlier:
● Nate Chambers’ de-duped and dependency parsed NYT section of Gigaword: /afs/ir/data/linguistic-data/GigawordNYT
● Some data sets from Chris:○ /afs/ir/data/linguistic-data/mnt/mnt4/PottsCorpora
README.txt, Twitter.tgz, imdb-english-combined.tgz, opentable-english-processed.zip
○ /afs/ir/data/linguistic-data/mnt/mnt9/PottsCorpora opposingviews, product-reviews, weblogs
● Twitter data collected and organized by Moritz (former CS224Uer!) /afs/ir/data/linguistic-data/mnt/mnt3/TwitterTopics/
20

Twitter API
● https://dev.twitter.com/
● To stream random current tweets into a local file:curl http://stream.twitter.com/1/statuses/sample.json -uUSER:PASS
I think this will deliver ≈7 million tweets/day.
● But Twitter data requires extensive pre-processing:○ Filter heuristically by language (don’t rely only on “lang”
field)
○ Filter spam based on tweet structure (spam warnings: too many hashtags, too many usernames, too many links)
○ Handle retweets in a way that makes sense given your goals
21

Other APIs
● Kiva (micro-loans): http://build.kiva.org/
● eBay: http://developer.ebay.com/common/api/
● Yelp: http://www.yelp.com/developers/documentation
● Stack Exchange: http://api.stackexchange.com/
● Reddit: https://www.reddit.com/dev/api
22

Scraping
● Link structure is often regular (reflecting database structure)
● If you figure out the structure, you can often get lots of data!
● Once you have local copies of the pages:○ Beautiful Soup (Python) is a powerful tool for parsing DOMs○ Readability offers an API for extracting text from webpages
● Use rate limiting / request throttling !!!!!
● Read site policies! Be a good citizen! Don’t get yourself (or your school) banned! Don’t go to jail! You will not like it.
● For more on crawler etiquette, see Manning et al. 2009 (http://nlp.stanford.edu/IR-book/)
23

Agenda
● Overview● Lit review● Data sources● Project set-up & development● Evaluation● Dataset management● Evaluation metrics● Comparative evaluations● Other aspects of evaluation● Conclusion
24

Project set-up
Now that you’ve got your dataset more or less finalized, you can start building stuff and doing experiments!
25

Data management
● It will pay to get your data into an easy-to-use form and write general code for reading it.
● If your dataset is really large, considering putting it in a database or indexing it, so that you don’t lose a lot of development time iterating through it.
26

Automatic annotation tools
● If you need additional structure — POS tags, named-entity tags, parses, etc. — add it now.
● The Stanford NLP group has released lots of software for doing this:http://nlp.stanford.edu/software/index.shtml
● Can be used as libraries in Java/Scala.Or, can be used from the command-line.
● Check out CoreNLP in particular — amazing!
27

Conceptualizing your task
Domingos 2012 28

Off-the-shelf modeling tools
While there’s some value in implementing algorithms yourself, it’s labor intensive and could seriously delay your project. We advise using existing tools whenever possible:
● Stanford Classifier (Java): http://nlp.stanford.edu/software/classifier.shtml● Stanford Topic Modeling Toolbox (Scala): http://nlp.stanford.
edu/software/tmt/tmt-0.4/● MALLET (Java): http://mallet.cs.umass.edu/● FACTORIE (Scala): http://factorie.cs.umass.edu/● LingPipe (Java): http://alias-i.com/lingpipe/● NLTK (Python): http://nltk.org/● Gensim (Python): http://radimrehurek.com/gensim/● GATE (Java): http://gate.ac.uk/● scikits.learn (Python): http://scikit-learn.org/● Lucene (Java): http://lucene.apache.org/core/
29
Iterative development
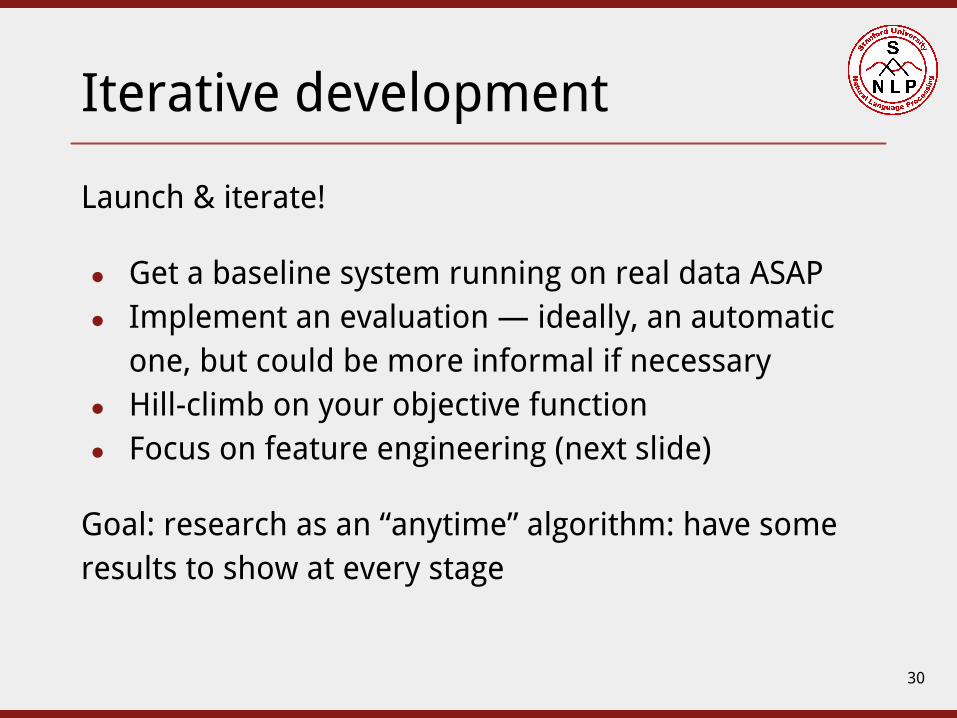
Launch & iterate!
● Get a baseline system running on real data ASAP● Implement an evaluation — ideally, an automatic
one, but could be more informal if necessary● Hill-climb on your objective function● Focus on feature engineering (next slide)
Goal: research as an “anytime” algorithm: have some results to show at every stage
30

The feature engineering cycle
Add new features
Error analysis
Identify categories of
errors
Evaluate on development
dataset
Brainstorm solutions
31

Focus on feature engineering
● Finding informative features matters more than choice of classification algorithm
Domingos (2012:84): “At the end of the day, some machine learning projects succeed and some fail. What makes the difference? Easily the most important factor is the features used.”
● Do error analysis and let errors suggest new features!
● Look for clever ways to exploit new data sources
● Consider ways to combine multiple sources of information
32

More development tips
● Construct a tiny toy dataset for development○ Facilitates understanding model behavior, finding bugs
● Consider ensemble methods○ Develop multiple models with complementary expertise○ Combine via max/min/mean/sum, voting, meta-classifier, ...
● Grid search in parameter space can be useful○ Esp. for “hyperparameters”○ Esp. when parameters are few and evaluation is fast○ A kind of informal machine learning
33

Agenda
● Overview● Lit review● Data sources● Project set-up & development● Evaluation● Dataset management● Evaluation metrics● Comparative evaluations● Other aspects of evaluation● Conclusion
36

Why does evaluation matter?
In your final project, you will have:
● Identified a problem● Explained why the problem matters● Examined existing solutions, and found them wanting● Proposed a new solution, and described its implementation
So the key question will be:
● Did you solve the problem?
The answer need not be yes, but the question must be addressed!
35

Who is it for?
Evaluation matters for many reasons, and for multiple parties:
● For future researchers○ Should I adopt the methods used in this paper?○ Is there an opportunity for further gains in this area?
● For reviewers○ Does this paper make a useful contribution to the field?
● For yourself○ Should I use method/data/classifier/... A or B?○ What’s the optimal value for parameter X?○ What features should I add to my feature representation?○ How should I allocate my remaining time and energy?
36
The role of data in evaluation
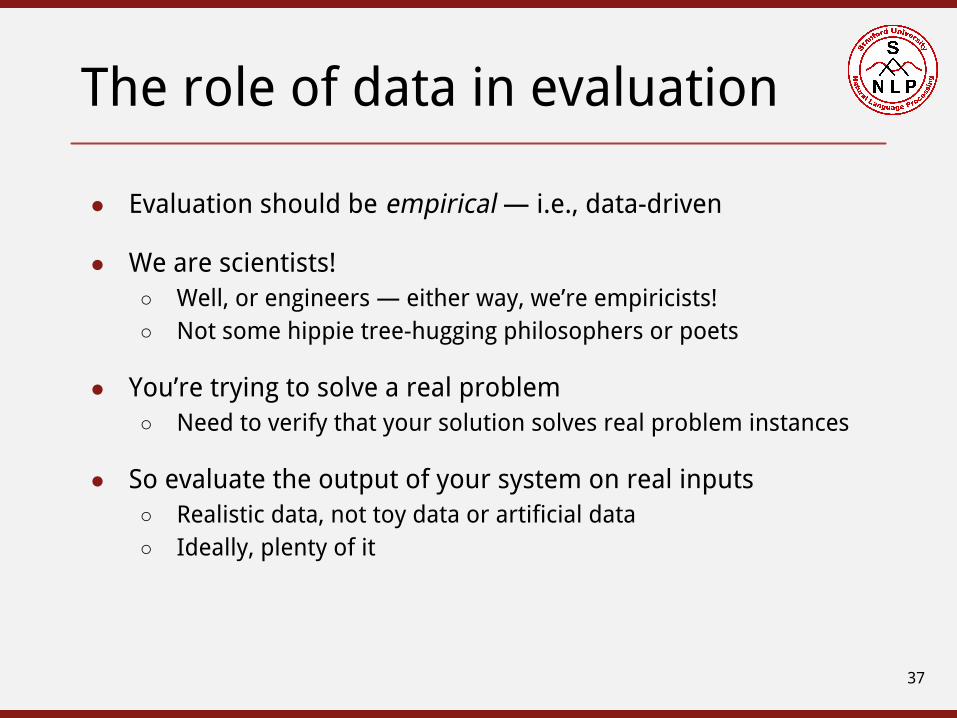
● Evaluation should be empirical — i.e., data-driven
● We are scientists!○ Well, or engineers — either way, we’re empiricists!○ Not some hippie tree-hugging philosophers or poets
● You’re trying to solve a real problem○ Need to verify that your solution solves real problem instances
● So evaluate the output of your system on real inputs○ Realistic data, not toy data or artificial data○ Ideally, plenty of it
37

Automatic vs.
Summative
Kinds of evaluation
38
Quantitative
Intrinsic
Formative
Qualitative
Manual
Extrinsic
vs.
vs.
vs.

Quantitative vs. qualitative
● Quantitative evaluations should be primary○ Evaluation metrics — much more below○ Tables & graphs & charts, oh my!
● But qualitative evaluations are useful too!○ Examples of system outputs○ Error analysis○ Visualizations○ Interactive demos
■ A great way to gain visibility and impact for your work■ Examples: OpenIE (relation extraction), Deeply Moving (sentiment)
● A tremendous aid to your readers’ understanding!
39

Examples of system outputs
40from Mintz et al. 2009

Examples of system outputs
41from Yao et al. 2012

Example of visualization
from Joseph Turian 42

Automatic vs. manual evaluation
● Automatic evaluation○ Typically: compare system outputs to some “gold standard”○ Pro: cheap, fast○ Pro: objective, reproducible○ Con: may not reflect end-user quality○ Especially useful during development (formative evaluation)
● Manual evaluation○ Generate system outputs, have humans assess them○ Pro: directly assesses real-world utility○ Con: expensive, slow○ Con: subjective, inconsistent○ Most useful in final assessment (summative evaluation)
43
Automatic evaluation
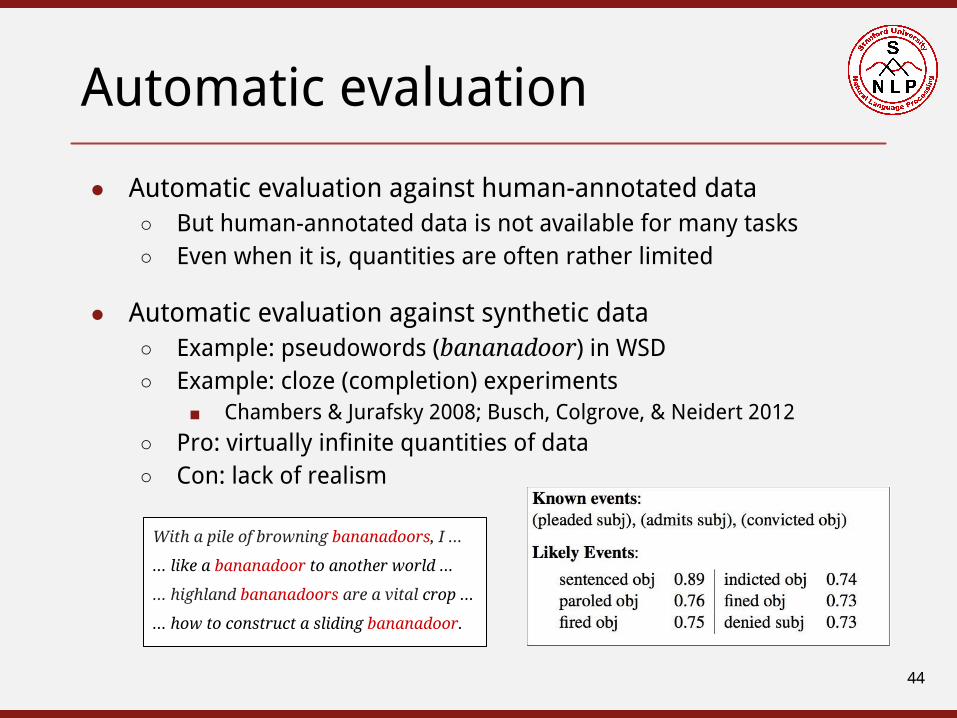
● Automatic evaluation against human-annotated data○ But human-annotated data is not available for many tasks○ Even when it is, quantities are often rather limited
● Automatic evaluation against synthetic data○ Example: pseudowords (bananadoor) in WSD○ Example: cloze (completion) experiments
■ Chambers & Jurafsky 2008; Busch, Colgrove, & Neidert 2012
○ Pro: virtually infinite quantities of data○ Con: lack of realism
44
With a pile of browning bananadoors, I ...
... like a bananadoor to another world ...
... highland bananadoors are a vital crop ...
... how to construct a sliding bananadoor.

Manual evaluation
45
● Generate system outputs, have humans evaluate them
● Pros: direct assessment of real-world utility
● Cons: expensive, slow, subjective, inconsistent
● But sometimes unavoidable! (Why?)
● Example: cluster intrusion in Yao et al. 2012
● Example: Banko et al. 2008

Intrinsic vs. extrinsic evaluation
● Intrinsic (in vitro, task-independent) evaluation○ Compare system outputs to some ground truth or gold standard
● Extrinsic (in vivo, task-based, end-to-end) evaluation○ Evaluate impact on performance of a larger system of which your
model is a component○ Pushes the problem back — need way to evaluate larger system○ Pro: a more direct assessment of “real-world” quality○ Con: often very cumbersome and time-consuming○ Con: real gains may not be reflected in extrinsic evaluation
● Example from automatic summarization○ Intrinsic: do summaries resemble human-generated summaries?○ Extrinsic: do summaries help humans gather facts quicker?
46

Formative vs. summative evaluation
When the cook tastes the soup, that’s formative;when the customer tastes the soup, that’s summative.
● Formative evaluation: guiding further investigations○ Typically: lightweight, automatic, intrinsic○ Compare design option A to option B○ Tune parameters: smoothing, weighting, learning rate
● Summative evaluation: reporting results○ Compare your approach to previous approaches○ Compare different variants of your approach
47

Agenda
● Overview● Lit review● Data sources● Project set-up & development● Evaluation● Dataset management● Evaluation metrics● Comparative evaluations● Other aspects of evaluation● Conclusion
48

The train/test split
● Evaluations on training data overestimate real performance!○ Need to test model’s ability to generalize, not just memorize○ But testing on training data can still be useful — how?
● So, sequester test data, use only for summative evaluation○ Typically, set aside 10% or 20% of all data for final test set○ If you’re using a standard dataset, the split is often predefined○ Don’t evaluate on it until the very end! Don’t peek!
● Beware of subtle ways that test data can get tainted○ Using same test data in repeated experiments○ “Community overfitting”, e.g. on PTB parsing○ E.g., matching items to users: partition on users, not matches
49

Development data
● Also known as “devtest” or “validation” data
● Used as test data during formative evaluations○ Keep real test data pure until summative evaluation
● Useful for selecting (discrete) design options○ Which categories of features to activate○ Choice of classification (or clustering) algorithm○ VSMs: choice of distance metric, normalization method, ...
● Useful for tuning (continuous) hyperparameters○ Smoothing / regularization parameters○ Combination weights in ensemble systems○ Learning rates, search parameters
50

10-fold cross-validation (10CV)
51
83.1 81.2 84.4 79.7 80.2 75.5 81.1 81.0 78.5 83.3
minmaxmedianmeanstddev
75.5084.4081.0580.80
2.58

k-fold cross-validation
● Pros○ Make better use of limited data○ Less vulnerable to quirks of train/test split○ Can estimate variance (etc.) of results○ Enables crude assessment of statistical significance
● Cons○ Slower (in proportion to k)○ Doesn’t keep test data “pure” (if used in development)
● LOOCV = leave-one-out cross-validation○ Increase k to the limit: the total number of instances○ Magnifies both pros and cons
52

Agenda
● Overview● Lit review● Data sources● Project set-up & development● Evaluation● Dataset management● Evaluation metrics● Comparative evaluations● Other aspects of evaluation● Conclusion
53

Evaluation metrics
● An evaluation metric is a function: model × data → ℝ
● Can involve both manual and automatic elements
● Can serve as an objective function during development○ For formative evaluations, identify one metric as primary○ Known as “figure of merit”○ Use it to guide design choices, tune hyperparameters
● You may use standard metrics, or design your own○ Using standard metrics facilitates comparisons to prior work○ But new problems may require new evaluation metrics○ Either way, have good reasons for your choice
54

Evaluation metrics
Classification problems
● Contingency tables● Confusion matrices● Accuracy● Precision & recall● F-measure● AUC (area under ROC curve)● Sensitivity & specificity● PPV & NPV (+/– predictive value)● MCC (Matthews corr. coeff.)
56
Clustering problems
● Pairwise metrics● B3 metrics● Intrusion tasks
Regression problems
● Pearson’s R● Mean squared error
Ranking problems
● Spearman’s rho● Kendall’s tau● Mean reciprocal rank

Example: evaluation metrics
Evaluation metrics are the columns of your main results table:
55from Yao et al. 2012

Agenda
● Overview● Lit review● Data sources● Project set-up & development● Evaluation● Dataset management● Evaluation metrics● Comparative evaluations● Other aspects of evaluation● Conclusion
57

Comparative evaluation
● Say your model scores 77% on your chosen evaluation metric
● Is that good? Is it bad?
● You (& your readers) can’t know unless you make comparisons○ Baselines○ Upper bounds○ Previous work○ Different variants of your model
● Comparisons are the rows of your main results table○ Evaluation metrics are the columns
● Comparisons demand statistical significance testing!
58

Baselines
● 77% doesn’t look so good if a blindfolded mule can get 73%
● Results without baseline comparisons are meaningless
● Weak baselines: performance of zero-knowledge systems○ Systems which use no information about the specific instance○ Example: random guessing models○ Example: most-frequent class (MFC) models
● Strong baselines: performance of easily-implemented systems○ Systems which can be implemented in an hour or less○ Sentiment example: hand-crafted lexicon with +1/–1 weights○ NLI example: bag-of-words
59

Upper bounds
● 77% doesn’t look so bad if a even human expert gets only 83%
● Plausible, defensible upper bounds can flatter your results
● Human performance is often taken as an upper bound○ Or inter-annotator agreement (for subjective labels)○ (BTW, if you annotate your own data, report the kappa statistic)○ If humans agree on only 83%, how can machines ever do better?○ But in some tasks, machines outperform humans! (Ott et al. 2011)
● Also useful: oracle experiments○ Supply gold output for some component of pipeline (e.g., parser)○ Let algorithm access some information it wouldn’t usually have○ Can illuminate the system’s operation, strengths & weaknesses
60

Comparisons to previous work
● Desirable, but not always possible — you may be a pioneer!
● Easy: same problem, same test data, same evaluation metric○ Just copy results from previous work into your results table○ The norm in tasks with standard data sets: ACE, Geo880, RTE, ...
● Harder: same problem, but different data, or different metric○ Maybe you can obtain their code, and evaluate in your setup?○ Maybe you can reimplement their system? Or an approximation?
● Hardest: new problem, new data set○ Example: double entendre identification (Kiddon & Brun 2011)
○ Make your data set publicly available!○ Let future researchers can compare to you
61

● Helps to shed light your model’s strengths & weaknesses
● Lots of elements can be varied○ Quantity, corpus, or genre of training data○ Active feature categories○ Classifier type or clustering algorithm○ VSMs: distance metric, normalization method, ...○ Smoothing / regularization parameters
Different variants of your model
62

Relative improvements
● It may be preferable to express improvements in relative terms○ Say baseline was 60%, and your model achieved 75%○ Absolute gain: 15%○ Relative improvement: 25%○ Relative error reduction: 37.5%
● Can be more informative (as well as more flattering!)○ Previous work: 92.1%○ Your model: 92.9%○ Absolute gain: 0.8% (yawn)○ Relative error reduction: 10.1% (wow!)
63

Statistical significance testing
● Pet peeve: small gains reported as fact w/o significance testing○ “... outperforms previous approaches ...”○ “... demonstrates that word features help ...”
● How likely is the gain you observed, under the null hypothesis?○ Namely: model is no better than baseline, and gain is due to chance
● Crude solution: estimate variance using 10CV, or “the bootstrap”
● Analytic methods: McNemar’s paired test, many others ...
● Monte Carlo methods: approximate randomization○ Easy to implement, reliable, principled○ Highly recommended reading: http://masanjin.net/sigtest.pdf
64

Significant skepticism
Lately there’s been some healthy skepticism about the value of p-values. For example:
http://www.nature.com/news/scientific-method-statistical-errors-1.14700
Lesson: p < 0.05 may not be a reliable indicator of a truly significant result.
But p > 0.05 still means you haven’t proven s---.
And you should still do significance testing!
65

Still not significant
If the result ain’t significant, just admit it!No weasel words!
(barely) not statistically significant (p=0.052)a borderline significant trend (p=0.09)a certain trend toward significance (p=0.08)a clear tendency to significance (p=0.052)a clear, strong trend (p=0.09)a decreasing trend (p=0.09)a definite trend (p=0.08)a distinct trend toward significance (p=0.07)a favorable trend (p=0.09)a favourable statistical trend (p=0.09)a little significant (p<0.1)a margin at the edge of significance (p=0.0608)a marginal trend (p=0.09)a marginal trend toward significance (p=0.052)a marked trend (p=0.07)a mild trend (p<0.09)a near-significant trend (p=0.07)a nonsignificant trend (p<0.1)a notable trend (p<0.1)a numerical increasing trend (p=0.09)a numerical trend (p=0.09)a positive trend (p=0.09)a possible trend toward significance (p=0.052)a pronounced trend (p=0.09)a reliable trend (p=0.058)a robust trend toward significance (p=0.0503)a significant trend (p=0.09)
just lacked significance (p=0.053)just marginally significant (p=0.0562)just missing significance (p=0.07)just on the verge of significance (p=0.06)just outside levels of significance (p<0.08)just outside the bounds of significance (p=0.06)just outside the level of significance (p=0.0683)just outside the limits of significance (p=0.06)just short of significance (p=0.07)just shy of significance (p=0.053)just tendentially significant (p=0.056)leaning towards significance (p=0.15)leaning towards statistical significance (p=0.06)likely to be significant (p=0.054)loosely significant (p=0.10)marginal significance (p=0.07)marginally and negatively significant (p=0.08)marginally insignificant (p=0.08)marginally nonsignificant (p=0.096)marginally outside the level of significancemarginally significant (p>=0.1)marginally significant tendency (p=0.08)marginally statistically significant (p=0.08)may not be significant (p=0.06)medium level of significance (p=0.051)mildly significant (p=0.07)moderately significant (p>0.11)
slightly significant (p=0.09)somewhat marginally significant (p>0.055)somewhat short of significance (p=0.07)somewhat significant (p=0.23)strong trend toward significance (p=0.08)sufficiently close to significance (p=0.07)suggestive of a significant trend (p=0.08)suggestive of statistical significance (p=0.06)suggestively significant (p=0.064)tantalisingly close to significance (p=0.104)technically not significant (p=0.06)teetering on the brink of significance (p=0.06)tended toward significance (p=0.13)tentatively significant (p=0.107)trend in a significant direction (p=0.09)trending towards significant (p=0.099)vaguely significant (p>0.2)verging on significance (p=0.056)very narrowly missed significance (p<0.06)very nearly significant (p=0.0656)very slightly non-significant (p=0.10)very slightly significant (p<0.1)virtually significant (p=0.059)weak significance (p>0.10)weakly significant (p=0.11)weakly statistically significant (p=0.0557)well-nigh significant (p=0.11)
http://mchankins.wordpress.com/2013/04/21/still-not-significant-2/ 66

Agenda
● Overview● Lit review● Data sources● Project set-up & development● Evaluation● Dataset management● Evaluation metrics● Comparative evaluations● Other aspects of evaluation● Conclusion
67

Learning curves
● Plot evaluation metric as function of amount of training data
● May include multiple variants of model (e.g. classifier types)
● Provides insight into learning properties of model
● Pop quiz: what does it mean if ...○ ... the curve is flat and never climbs?○ ... the curve climbs and doesn’t ever level off?○ ... the curve climbs at first, but levels off quite soon?
68

Learning curve example
from Ng & Zelle 1997 69

Feature analysis
● Goal: understand which features are most informative
● Easy, but potentially misleading: list high-weight features○ Implicitly assumes that features are independent
● Per-feature statistical measures○ E.g., chi-square, information gain○ Again, ignores potential feature interactions
● Ablation (or addition) tests○ Progressively knock out (or add) (categories of) features○ Do comparative evaluations at each step — often expensive!
● L1 regularization, Lasso, & other feature selection algorithms○ Which features are selected? What are the regularization paths?
70

Example: high-weight features
from Mintz et al. 2009 71

Example: feature addition tests
from Zhou et al. 2005 72

Visualizations
● Helpful in making multiple formal and informal comparisons, identify overlooked relationships
● t-SNE for 2d visualization of high-dimensional data: http://homepage.tudelft.nl/19j49/t-SNE.html
● Gephi: http://gephi.org/
● Visualization tools from Jeff Heer’s group: http://hci.stanford.edu/jheer/
73
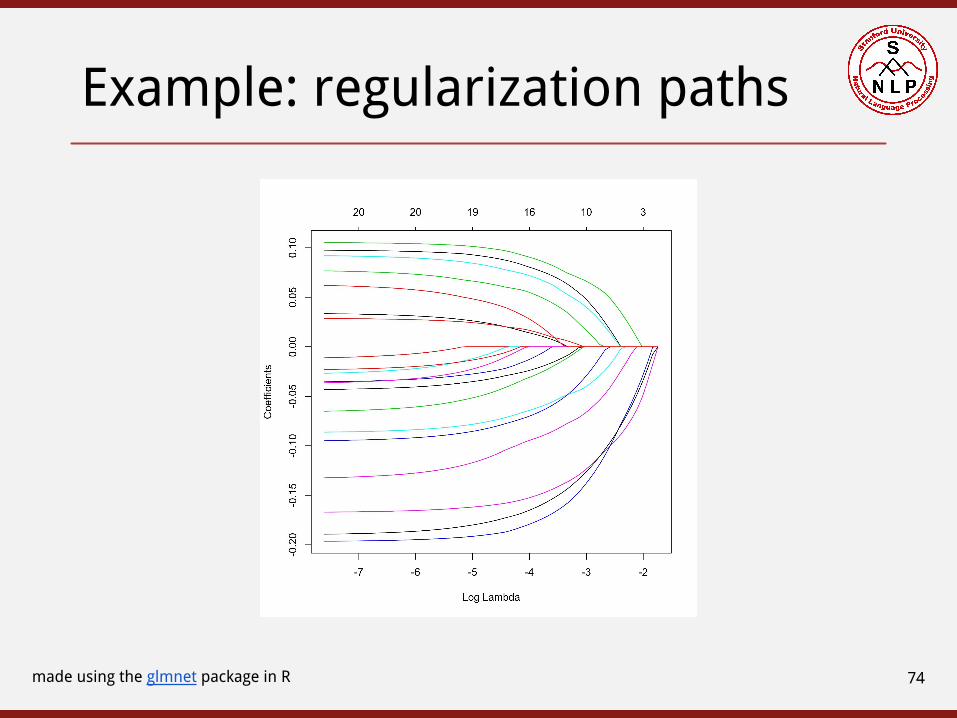
Example: regularization paths
made using the glmnet package in R 74

Error analysis
● Analyze and categorize specific errors (on dev data, not test!)
● A form of qualitative evaluation — yet indispensable!
● During development (formative evaluation):○ Examine individual mistakes, group into categories○ Can be helpful to focus on FPs, FNs, common confusions○ Brainstorm remedies for common categories of error○ A key driver of iterative cycles of feature engineering
● In your report (summative evaluation):○ Describe common categories of errors, exhibit specific examples○ Aid the reader in understanding limitations of your approach○ Highlight opportunities for future work
75

Error analysis example
from Yao et al. 2012 76

Agenda
● Overview● Lit review● Data sources● Project set-up & development● Evaluation● Dataset management● Evaluation metrics● Comparative evaluations● Other aspects of evaluation● Conclusion
77

Don’t fear negative results
Research is the process of going up alleys to see if they are blind.— Marston Bates, American zoologist, 1906-1974
● Sometimes the results aren’t as good as you’d like○ Sometimes you can’t show a statistically significant gain
○ Sometimes you can’t even beat the weak baseline :-(
● Your research work can still have value!○ Especially if what you tried was a reasonable thing to try
○ Save future researchers from going up the same blind alleys○ Worst case: error analysis is most valuable part of your paper
● Resist the temptation to optimize on test data○ This is basically intellectual fraud
78

Plan for evaluation early
Evaluation should not be merely an afterthought;it must be an integral part of designing a research project.
You can’t aim if you don’t have a target;you can’t optimize if you don’t have an objective function.
First decide how to measure success;then pursue it relentlessly!
Whoa, dude, that’s some serious Yoda shit
79

Game plan
● Form a team of 3 and choose a topic
● Survey previous work — lit review due May 4
● Identify data sources soon
● Leverage off-the-shelf tools where possible
● Launch & iterate — “anytime” research process
● Plan for evaluation early!
80

Appendix: data annotation

Annotating data
If you can’t find suitable annotated data, you might consider annotating your own data. But:
● The quantity will be small → harder to learn from● Your evaluations will be less convincing — no
comparison to prior work● It’s a pain in the ass!● You must not let this be a bottleneck!
Later we’ll discuss crowdsourcing, which is less risky (but more limited in what it can accomplish).
87

Setting up an annotation project
● Plan to have multiple annotators! (Enlist your friends.)
● Annotate a subset of the data yourself. This will reveal challenges and sources of ambiguity.
● Writing a detailed annotation manual will save you time in the long run, even if it delays the start of annotation.
● Consider a training phase for annotators, following by discussion.
● Consider whether your annotators should be allowed to collaborate and/or resolve differences among themselves.
● brat rapid annotation tool: http://brat.nlplab.org
24

Assessing annotation quality
● Cohen’s kappa is the standard measure of inter-annotator agreement in NLP. It works only where there are exactly two annotators and all of them did the same annotations.
● Fleiss’ kappa is suitable for situations in which there are multiple annotators, and there is no presumption that they all did the same examples.
● Both kinds of kappa assume the labels are unordered. Thus, they will be harsh/conservative for situations in which the categories are ordered.
● The central motivation behind the kappa measures is that they take into account the level of (dis)agreement that we can expect to see by chance. Measures like “percentage choosing the same category” do not include such a correction.
25

Sources of uncertainty
● Ambiguity and vagueness are part of what make natural languages powerful and flexible.
● However, this ensures that there will be uncertainty about which label to assign to certain examples.
● Annotators might speak different dialects, and thus have different linguistic intuitions.
● Such variation will be systematic and thus perhaps detectable.
● Some annotators are just better than others.
26

Pitfalls
● Annotation projects almost never succeed on the first attempt. This is why we don’t really encourage you to start one now for the sake of your project.
● (Crowdsourcing situations are an exception to this, not because they succeed right way, but rather because they might take just a day from start to finish.)
● Annotation is time-consuming and expensive where experts are involved.
● Annotation is frustrating and taxing where the task is filled with uncertainty. Uncertainty is much harder to deal with than a simple challenge.
27

Crowdsourcing
If ...
● You need new annotations● You need a ton of annotations● Your annotations can be done by non-experts
… crowdsourcing might provide what you need,provided that you go about it with care.
28
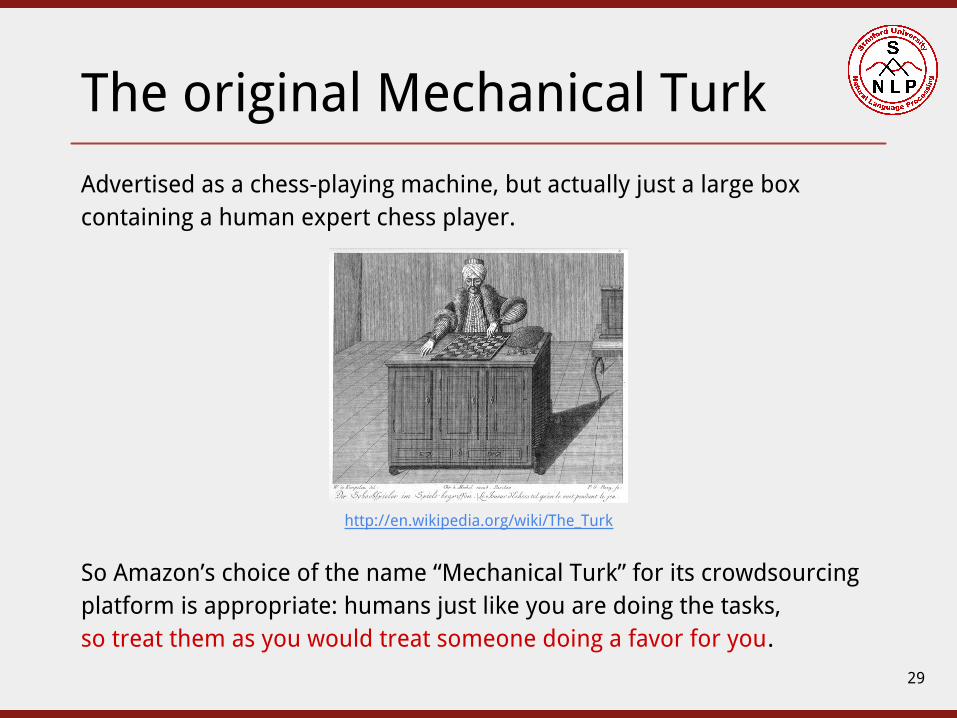
The original Mechanical Turk
So Amazon’s choice of the name “Mechanical Turk” for its crowdsourcing platform is appropriate: humans just like you are doing the tasks,so treat them as you would treat someone doing a favor for you.
Advertised as a chess-playing machine, but actually just a large box containing a human expert chess player.
http://en.wikipedia.org/wiki/The_Turk
29

Crowdsourcing platforms
There are several, including:
● Amazon Mechanical Turk: https://www.mturk.com/
● Crowdflower (handles quality control): http://crowdflower.com/
● oDesk (for expert work): https://www.odesk.com
30

Who turks?
http://waxy.org/2008/11/the_faces_of_mechanical_turk/
31

Papers
● Munro and Tily (2011): history of crowdsourcing for language technologies, along with assessment of the methods
● Crowd Scientist, a collection of slideshows highlighting diverse uses of crowdsourcing: http://www.crowdscientist.com/workshop/
● 2010 NAACL workshop on crowdsourcing: http://aclweb.org/anthology-new/W/W10/#0700
● Snow et al. (2008): early and influential crowdsourcing paper: crowdsourcing requires more annotators to reach the level of experts, but this can still be dramatically more economical
● Hsueh et al. (2009): strategies for managing the various sources of uncertainty in crowdsourced annotation projects
32

Managing projects on MTurk
If you’re considering running a crowdsourcing project on Mechanical Turk, please see much more detailed slides from last year’s slide deck:
http://web.stanford.edu/class/cs224u/2014/slides/2013/cs224u-slides-02-05.pdf
And consult with Chris, who has experience in this!
33

Will crowdsourcing work?
● One hears that crowdsourcing is just for quick, simple tasks.
● This has not been our (Chris’) experience. We have had people complete long questionnaires involving hard judgments.
● To collect the Cards corpus, we used MTurk simply to recruit players to play a collaborative two-person game.
● If you post challenging tasks, you have to pay well.
● There are limitations, though:○ If the task requires any training, it has to be quick and easy
(e.g., learning what your labels are supposed to mean).○ You can’t depend on technical knowledge.○ If your task is highly ambiguous, you need to reassure workers
and tolerate more noise than usual.
34

Appendix: evaluation metrics

Evaluation metrics for classification
● Contingency tables & confusion matrices
● Accuracy
● Precision & recall
● F-measure
● AUC (area under ROC curve)
● Sensitivity & specificity
● PPV & NPV (positive/negative predictive value)
● MCC (Matthews correlation coefficient)
68

Contingency tables
● In binary classification, each instance has actual label (“gold”)
● The model assigns to each instance a predicted label (“guess”)
● A pair of labels [actual, predicted] determines an outcome○ E.g., [actual:false, predicted:true] → false positive (FP)
● The contingency table counts the outcomes
● Forms basis of many evaluation metrics: accuracy, P/R, MCC, ...
69
guess
false true
goldfalse TN
true negativeFP
false positive
true FNfalse negative
TPtrue positive
guess
false true
goldfalse 51 9
true 4 36

guess
Y N U
gold
Y 67 4 31 102
N 1 16 4 21
U 7 7 46 60
75 27 81 183
Confusion matrices
● Generalizes the contingency table to multiclass classification
● Correct predictions lie on the main diagonal
● Large off-diagonal counts reveal interesting “confusions”
70from MacCartney & Manning 2008

accuracy = = 70.5%67 + 16 + 46
183accuracy = = 89.0%
86 + 3
100
Accuracy
● Accuracy: percent correct among all instances
● The most basic and ubiquitous evaluation metric
● But, it has serious limitations (what?)
71
guess
Y N U
gold
Y 67 4 31 102
N 1 16 4 21
U 7 7 46 60
75 27 81 183
guess
F T
goldF 86 2 88
T 9 3 12
95 5 100

recall = = 25.0%3
12
precision = = 60.0%3
5
Precision & recall
● Precision: % correct among items where guess=true
● Recall: % correct among items where gold=true
● Preferred to accuracy, especially for highly-skewed problems
72
guess
F T
goldF 86 2 88
T 9 3 12
95 5 100

F1
● It’s helpful to have a single measure which combines P and R
● But we don’t use the arithmetic mean of P and R (why not?)
● Rather, we use the harmonic mean: F1 = 2PR / (P + R)
73
recall = = 25.0%3
12
precision = = 60.0%3
5
guess
F T
goldF 86 2 88
T 9 3 12
95 5 100
F1 = 35.3%

Why use harmonic mean?
74from Manning et al. 2009

F-measure
● Some applications need more precision; others, more recall
● Fβ is the weighted harmonic mean of P and R
● Fβ = (1 + β2)PR / (β2P + R)
75
0.10 0.30 0.60 0.90
0.100.100.100.10
0.210.150.12
0.300.170.12
0.350.180.12
0.300.120.150.21
0.300.300.30
0.500.400.33
0.640.450.35
0.600.120.170.30
0.330.400.50
0.600.600.60
0.820.720.64
0.900.120.180.35
0.350.450.64
0.640.720.82
0.900.900.90
β = 2.0 (favor recall)β = 1.0 (neutral)β = 0.5 (favor precision)
recall
prec
isio
n

F-measure
● Some applications need more precision; others, more recall
● Fβ is the weighted harmonic mean of P and R
● Fβ = (1 + β2)PR / (β2P + R)
76
β = 0.5 (favor precision)
β = 1.0 (neutral) β = 2.0 (favor recall)

Precision vs. recall
● Typically, there’s a trade-off between precision and recall○ High threshold → high precision, low recall○ Low threshold → low precision, high recall
● P/R curve facilitates making an explicit choice on trade-off
● Always put recall on x-axis, and expect noise on left (why?)
77from Manning et al. 2009

Precision/recall curve example
78from Snow et al. 2005

from Mintz et al. 2009
Precision/recall curve example
79

ROC curves and AUC
● ROC curve = receiver operating characteristic curve○ An alternative to P/R curve used in other fields (esp. EE)
● AUC = area under (ROC) curve○ Like F1, a single metric which promotes both P and R○ But doesn’t permit specifying tradeoff, and generally unreliable
80from Davis & Goadrich 2006

Sensitivity & specificity
● Sensitivity & specificity look at % correct by actual label○ Sensitivity: % correct among items where gold=true (= recall)○ Specificity: % correct among items where gold=false
● An alternative to precision & recall○ More common in statistics literature
81
guess
F T
goldF 86 2 88
T 9 3 12
95 5 100
specificity = = 97.7%86
88
sensitivity = = 25.0%3
12

PPV & NPV
● PPV & NPV look at % correct by predicted label○ PPV: % correct among items where guess=true (= precision)○ NPV: % correct among items where guess=false
● An alternative to precision & recall○ More common in statistics literature
82
guess
F T
goldF 86 2 88
T 9 3 12
95 5 100
NPV = = 90.5%86
95PPV = = 60.0%
3
5

Matthews correlation coefficient (MCC)
● Correlation between actual & predicted classifications
● Random guessing yields 0; perfect prediction yields 1
83
MCC 0.05 0.35 0.65 0.95
0.05 -0.90 — — —
0.35 -0.11 -0.30 — —
0.65 0.08 0.22 0.30 0.36
0.95 0.21 0.55 0.74 0.90
prec
isio
n
recall
with prevalence = 0.50
MCC 0.05 0.35 0.65 0.95
0.05 -0.06 -0.15 — —
0.35 0.10 0.28 0.38 0.76
0.65 0.17 0.45 0.61 0.74
0.95 0.22 0.57 0.78 0.94
prec
isio
n
recall
with prevalence = 0.10

accuracy proportion of all items predicted correctlyerror proportion of all items predicted incorrectly
sensitivity accuracy over items actually truespecificity accuracy over items actually false
PPV accuracy over items predicted trueNPV accuracy over items predicted false
precision accuracy over items predicted truerecall accuracy over items actually trueF1 harmonic mean of precision and recall
MCC correlation between actual & predicted classifications
84
Recap: metrics for classifiers

accuracy
specificity
sensitivity = recall
Recap: metrics for classifiers
85
guess
F T
goldF #tn #fp
T #fn #tp
100
NPV PPV= precision Fβ

Multiclass classification
● Precision, recall, F1, MCC, ... are for binary classification
● For multiclass classification, compute these stats per class○ For each class, project into binary classification problem○ TRUE = this class; FALSE = all other classes
● Then average the results○ Macro-averaging: equal weight for each class○ Micro-averaging: equal weight for each instance
● See worked-out example on next slide
86

Multiclass classification
87
guess
Y N U
gold
Y 67 4 31 102
N 1 16 4 21
U 7 7 46 60
75 27 81 183
class precision
Y 67/75 = 89.3%
N 16/27 = 59.3%
U 46/81 = 56.8%
Macro-averaged precision:
= 68.5%3
89.3 + 59.3 + 56.8
= 70.5%183
75⋅89.3 + 27⋅59.3 + 81⋅56.8
Micro-averaged precision:

Evaluation metrics for retrieval
● Retrieval & recommendation problems○ Very large space of possible outputs, many good answers○ But outputs are simple (URLs, object ids), not structured
● Can be formulated as binary classification (of relevance)
● Problem: can’t identify all positive items in advance○ So, can’t assess recall — look at coverage instead○ Even precision is tricky, may require semi-manual process
● Evaluation metrics for ranked retrieval○ Precision@k○ Mean average precision (MAP)○ Discounted cumulative gain
88

Evaluation metrics for complex outputs
● If outputs are numerous and complex, evaluation is trickier○ Text (e.g., automatic summaries)○ Tree structures (e.g., syntactic or semantic parses)○ Grid structure (e.g., alignments)
● System outputs are unlikely to match gold standard exactly
● One option: manual eval — but slow, costly, subjective
● Another option: approximate comparison to gold standard○ Give partial credit for partial matches○ Text: n-gram overlap (ROUGE)○ Tree structures: precision & recall over subtrees○ Grid structures: precision & recall over pairs
89

Evaluation metrics for clustering
● Pairwise metrics (Hatzivassiloglou & McKeown 1993)
○ Reformulate as binary classification over pairs of items○ Compute & report precision, recall, F1, MCC, ... as desired
● B3 metrics (Bagga & Baldwin 1998)
○ Reformulate as a set of binary classification tasks, one per item○ For each item, predict whether other items are in same cluster○ Average per-item results over items (micro) or clusters (macro)
● Intrusion tasks○ In predicted clusters, replace one item with random “intruder”○ Measure human raters’ ability to identify intruder
● See Homework 2, Yao et al. 2012
90

Other evaluation metrics
● Regression problems○ When the output is a real number○ Pearson’s R○ Mean squared error
● Ranking problems○ When the output is a rank○ Spearman’s rho○ Kendall’s tau○ Mean reciprocal rank
91