
Homeostasis-Bifurcation Singularities and Identi ability ...
Project Planning

Project Planning
Project Definition
Set of interrelated activities whose execution satisfies a set of organizationalgoals.
• construction of a building;
• launching a new product on the market;
• organizing an exhibition.

Project
• Characteristics:
– limited duration;
– uniqueness, as a result of the specificity of objectives; of the activitiesto be undertaken; of the resources needed and/or available and of theorganization charged with carrying it out.
• Main objective
– complete it on time
– with a cost as low as possible

Project Planning
• Planning
– Identification and characterization of objectives, activities, resourcesavailable and needed
– defining and proposing a plan of action
• Control
– detection and interpretation of deviations from the planned
– triggering corrective actions (dynamically redo the plan)

Phases of Project Planning and Control
• project initiation
• planning
• starting the implementation of activities
• implementation of activities
• information collection
• results evaluation
• redo plan
• end project
• process the information and initiation of new projects

Network Diagrams
• Requirements
– detailed knowledge of the work to be performed
– identification of activities in which the project is decomposed
• Activities Characterization:
– interdependence with other activities (precedence relations)
– duration
– use of resources
– execution cost

Network Diagrams – Example
Activity Description Duration (weeks) Immediately
Preceding
Activities
A Organize the sales department 6 -
B Hiring sales staff 4 A
C Train staff hired 7 B
D Selecting an advertising agency 2 A
E Planning hype 4 D
F Run hype 10 E
G Designing packaging 2 -
H Mounting on the packaging process 10 G
I Acquire the product to the manufacturer 13 -
J Packing the initial stock 6 H,I
K Select distributors 9 A
L Sell the product to distributors 3 C,K
M Send the product to distributors 5 J,L

Network DiagramsExample - Gantt Chart
A
B
C
D
E
F
G
H
I
J
K
L
M
5 10 15 20 25Tempo(semanas)Time (weeks)
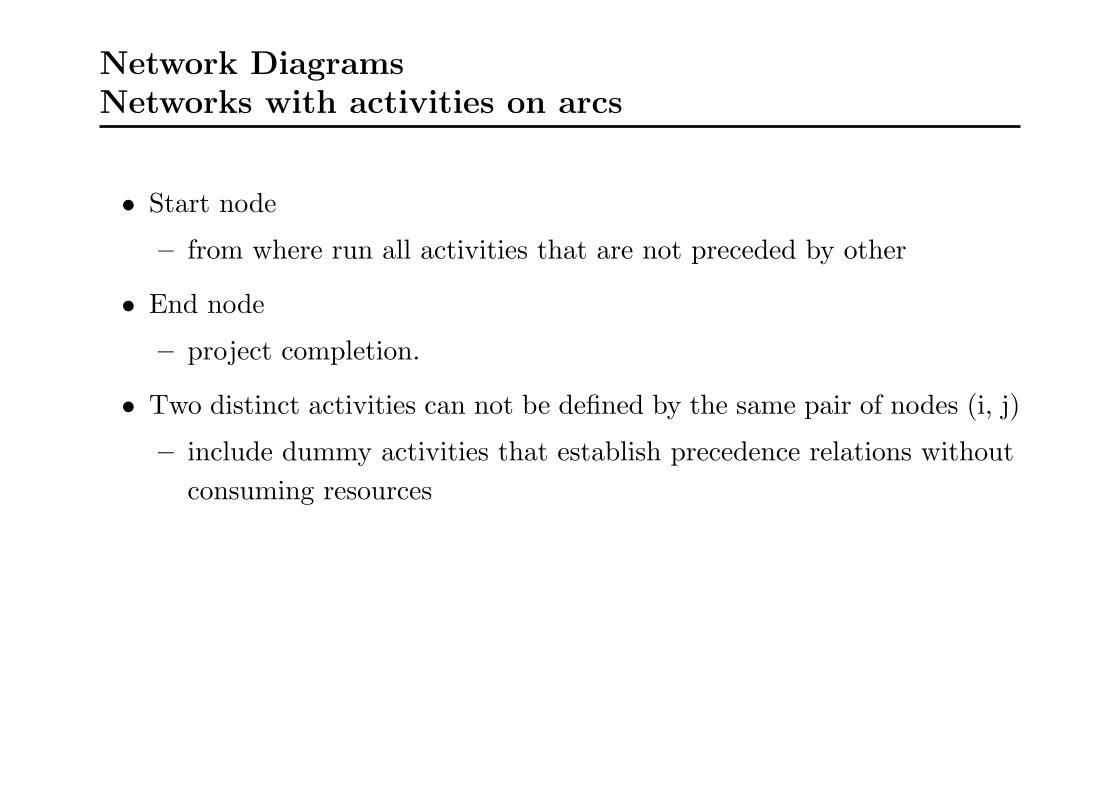
Network DiagramsNetworks with activities on arcs
• Start node
– from where run all activities that are not preceded by other
• End node
– project completion.
• Two distinct activities can not be defined by the same pair of nodes (i, j)
– include dummy activities that establish precedence relations withoutconsuming resources

Network DiagramsExample - Networks with activities on arcs
1
2
3
5
6
8
4 7
9 10
A
G
H
I
B
K
D
E
LC
J
M
F

Networks with activities on arcsInclusion of Dummy Activities
A precedes C and D, but B precedes only D.
1 3 A 5 C
2 4 B 6 D
A and B are parallel activities, but they cannot be defined by the same pairof nodes (i,j).
3 A
1 2 B

Network DiagramsExample - Network Diagrams with activities on nodes
Start
A
I
G
D
K
B
E
C
L
F
M
J
H
End

Network DiagramsNetwork Diagrams with activities on nodes
FS (finish/start) - start of B depends on the end of A.A
B
SS (start/start) - start of B depends on start of A.
A
B
FF (finish/finish) - End of B depends on end of A.
A
B

CPM MethodESi - earliest start | EFi - earliest finish
Earliest start of activity i.
Is the length of the longest path between START NODE and node i.
ESm
dm
m
ESn
dn
n
ESi
di
i
k
EFm
EFn
EFi
EFk = ESk + dk
ESi = maxk∈{m...n}EFk,∀i
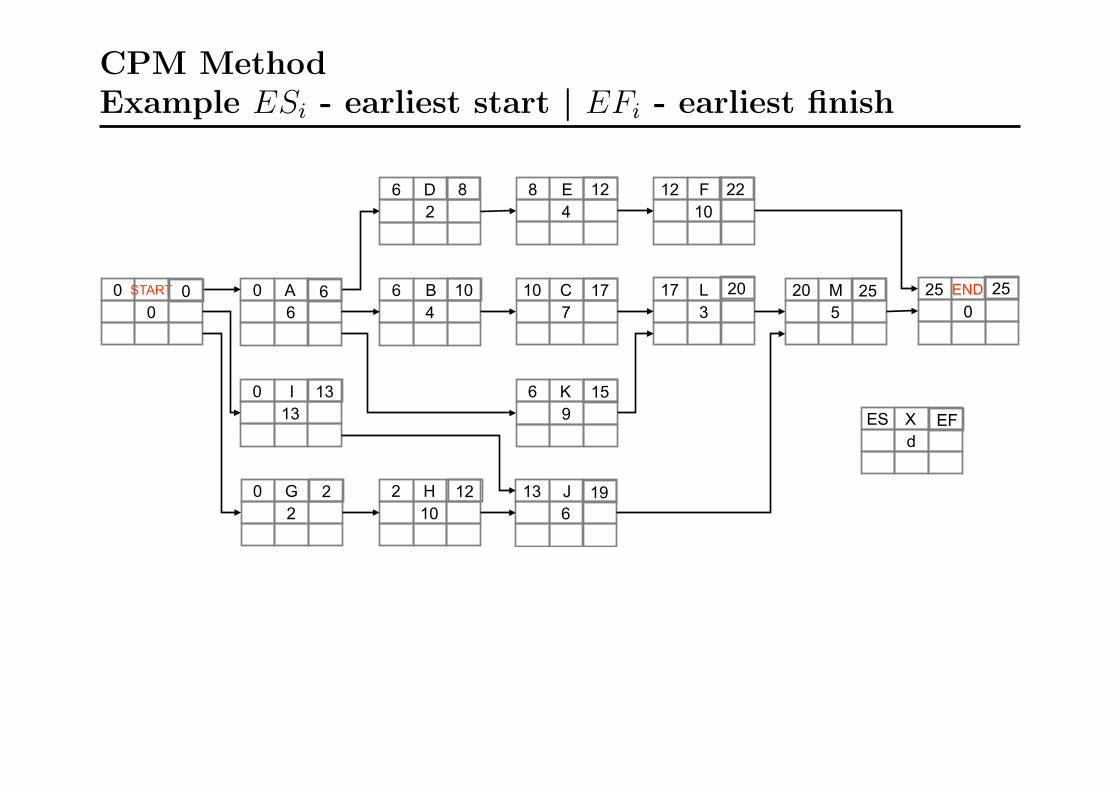
CPM MethodExample ESi - earliest start | EFi - earliest finish
0 START
0 0 A
6 6 B
4 10 C
7
6 D 2
8 E 4
12 F 10
17 L 3
20 M 5
25 END 0
0 G 2
2 H 10
13 J 6
0 I 13
6 K 9 ES X
d EF
0 6
13
2
8
10
12 19
15
17
12 22
20 25 25

CPM MethodLFi - latest finish | LSi - latest start
Latest finish of activity i.
Is the last date for finishing the activity i without delaying the project.
LFi
di
i LFm
dm
m
LFn
dn
n
k
LSm
LSn
LSk = LFk − dkLFi = mink∈{m...n}LSk,∀i

CPM MethodExample LFi - latest finish | LSi - latest start
0 Start 0 0
0 0
0 A 6 6
0 6
6 B 10 4
6 10
10 C 17 7
10 17
6 D 8 2
9 11
8 E 12 4
11 15
12 F 22 10
15 25
17 L 20 3
17 20
20 M 25 5
20 25
25 End 25 0
25 25
0 G 2 2
2 4
2 H 12 10
4 14
13 J 19 6
14 20
0 I 13 13
1 14
6 K 15 9
8 17 ES X EF
d LS LF

CPM Method – Activity slacks
Total Slack maximum delay, relative to its earliest finish EF , that the finishdate of an activity may suffer, without delaying the project.
TSi = LFi − EFiFree Slack maximum delay, relative to its earliest finish EF , that the finishdate of an activity may suffer, without preventing subsequentactivities to begin at their earliest start ES.
FSi = mink∈{m...n}(ESk)− EFi
ESm
dm
m
ESn
dn
n
ESi
di
i
k
EFm
EFn
EFi
LSm LFm
LSn LFn
LSi LFi
FSn TSn
FSm TSm
FSi TSi
Notice that:
FSi ≤ TSi

CPM MethodExample - Activity slacks
0 Start 0 0 0 0 0 0
0 A 6 0 6 0 0 6
6 B 10 0 4 0 6 10
10 C 17 0 7 0
10 17
6 D 8 0 2 3 9 11
8 E 12 0 4 3 11 15
12 F 22 3 10 3
15 25
17 L 20 0 3 0
17 20
20 M 25 0 5 0
20 25
25 End 25 0 0 0
25 25
0 G 2 0 2 2 2 4
2 H 12 1 10 2 4 14
13 J 19 1 6 1
14 20
0 I 13 0 13 1 1 14
6 K 15 2 9 2 8 17
ES X EF FL d FT LS LF
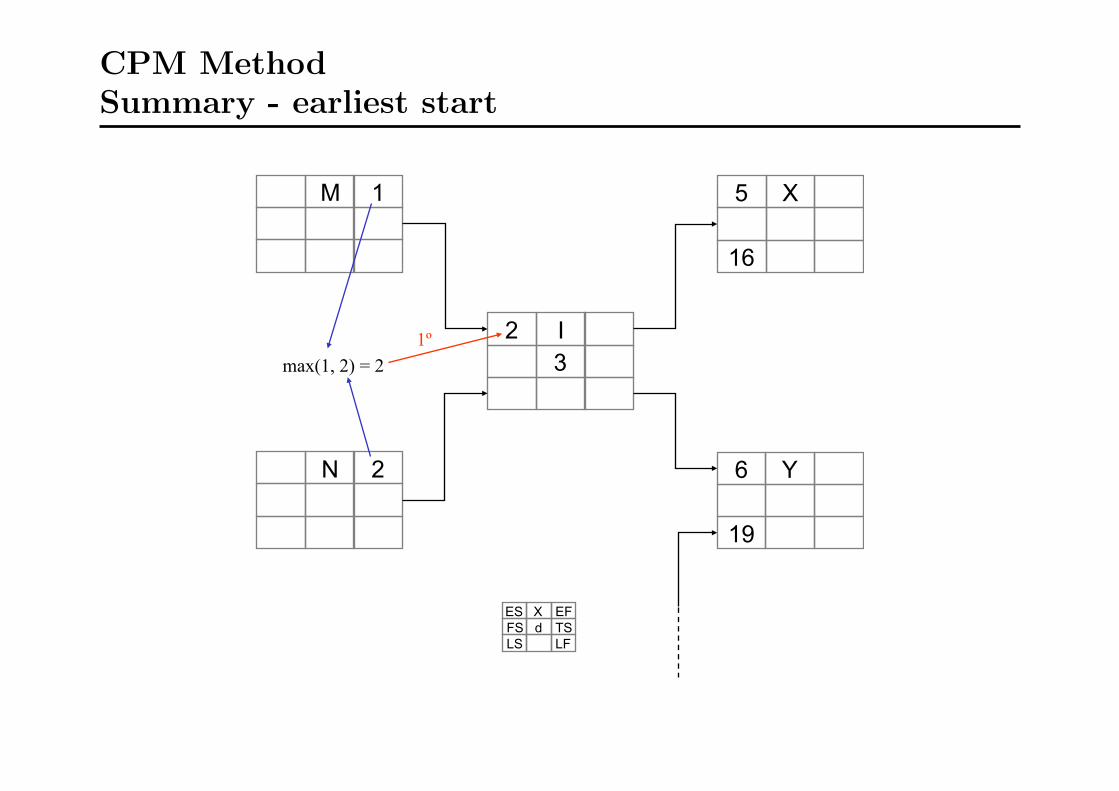
CPM MethodSummary - earliest start
ES X EF FS d TS LS LF
5 X
16
6 Y
19
2 I 3
N 2
M 1
max(1, 2) = 2 1º

CPM MethodSummary - earliest finish
ES X EF FS d TS LS LF
5 X
16
6 Y
19
2 I 5 3
N 2
M 1
2º
2 + 3 = 5

CPM MethodSummary - latest finish
ES X EF FS d TS LS LF
5 X
16
6 Y
19
2 I 5 3
16
N 2
M 1
min(16, 19) = 16
3º

CPM MethodSummary - latest start
ES X EF FS d TS LS LF
5 X
16
6 Y
19
2 I 5 3
13 16
N 2
M 1
16 - 3 = 13 4º

CPM MethodSummary - total slack
ES X EF FS d TS LS LF
5 X
16
6 Y
19
2 I 5 3 11
13 16
N 2
M 1
16 - 5 = 11
5º
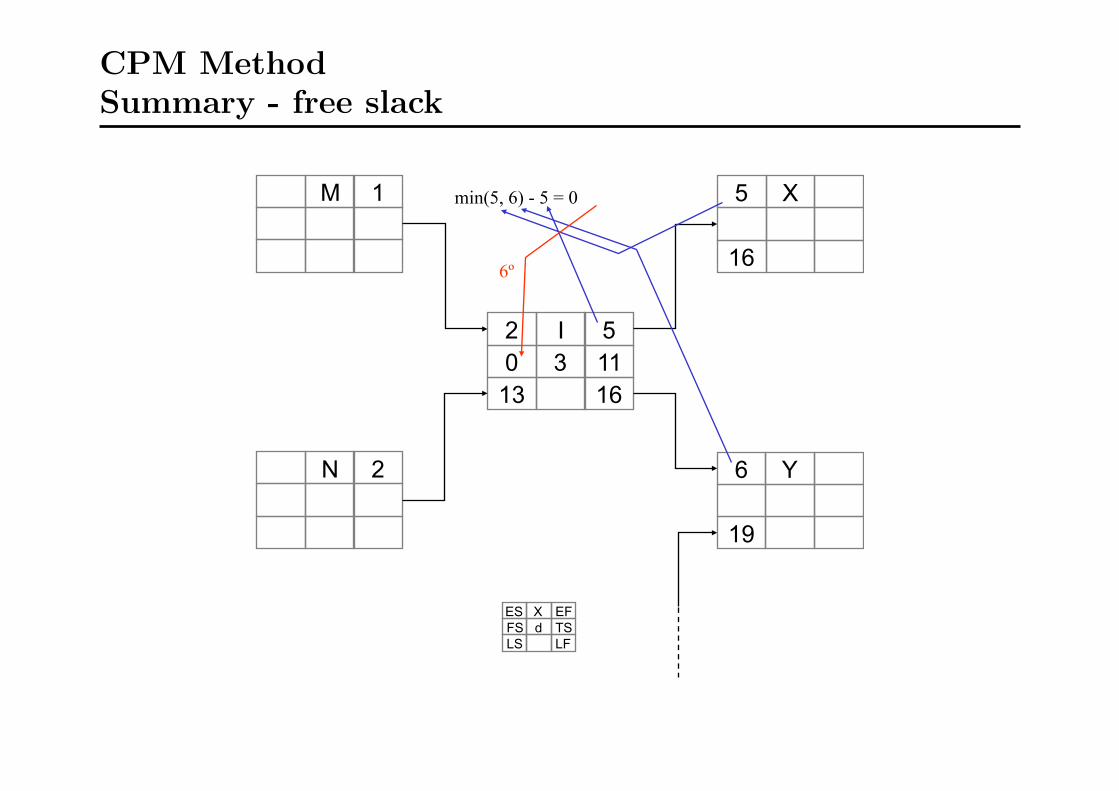
CPM MethodSummary - free slack
ES X EF FS d TS LS LF
5 X
16
6 Y
19
2 I 5 0 3 11 13 16
N 2
M 1 min(5, 6) - 5 = 0
6º

CPM MethodCritical Path
Longest path connecting START NODE to END NODE.
The critical path determines the minimum completion time of the projectand includes the critical activities.
The critical activities have a total slack equal to zero.

CPM MethodExample - Critical path
0 START 0 0 0 0 0 0
0 A 6 0 6 0 0 6
6 B 10 0 4 0 6 10
10 C 17 0 7 0
10 17
6 D 8 0 2 3 9 11
8 E 12 0 4 3 11 15
12 F 22 3 10 3
15 25
17 L 20 0 3 0
17 20
20 M 25 0 5 0
20 25
25 END 25 0 0 0
25 25
0 G 2 0 2 2 2 4
2 H 12 1 10 2 4 14
13 J 19 1 6 1
14 20
0 I 13 0 13 1 1 14
6 K 15 2 9 2 8 17
ES X EF FS d TS LS LF

PERT(Program Evaluation and Review Technique)

CPM method assumes deterministic durations for activities
PERT is a method of planning and control projects that takes into accountthe uncertainty of the duration of the activities.

PERT – Activity duration
• Dop – optimistic estimate of activity duration. Chance of completion ofthe activity within shorter time is negligible;
• Dpe – pessimistic estimate of the activity duration. Chance ofcompletion of the activity within longer time is negligible;
• Dmp – the most likely time in which the activity can be completedunder normal circumstances.
Assuming that the activity duration can be described statistically by adistribution Beta:
µ = Dop+4Dmp+Dpe6 σ2 = (Dpe−Dop)2
36

Stochastic analysis of activities networks
Total duration of the project is equal to the sum of the durations ofactivities of the critical path:
DT = D1 +D2 +D3 + . . .+Dn
As the durations of activities are random variables, DT will also be arandom variable with mean µT given by:
µT = µ1 + µ2 + µ3 + . . .+ µn
Assuming that the durations of activities are independent random variables,the variance of the total duration σ2
T will be:
σ2T = σ2
1 + σ22 + σ2
3 + . . .+ σ2n
Central Limit Theorem: The sum of independent random variables tendsto a normal distribution if the number of addends is large enough.
Total duration of the project can be described by a normal distribution withmean µT and variance σ2
T .

Start
0
A 8
D 9
F 11
E 20
End
0
C 6
H 12
B 8
G 9
Activ. Durations
Dop Dmp Dpe µ σ2
A 6 7 14 8 1.77
B 2 9 10 8 1.77
C 4 6 8 6 0.44
D 3 10 11 9 1.77
E 18 19 26 20 1.77
F 9 10 17 11 1.77
G 3 10 11 9 1.77
H 9 12 15 12 1
Average duration of the project:
µT = µA +µD +µG +µH = 38
Variance of the duration of the
project:
σ2T = σ2
A +σ2D +σ2
G +σ2H = 6.31
Prob(DT < 34) =
Prob(D′T < 34−38√6.31
) =
Prob(D′T < −1.59) ≈0.5− 0.4441 ≈ 6%

The ShopShopping cleaning
When a mall closes to the public at the end of the day you need to clean it, empty containers, replenish stocksin stores, do maintenance operations, etc.
These tasks have to be carried out in an organized way and respecting some precedences among them. Theirdurations are not deterministic, but the experience from other malls establishes that the duration of each taskfollows a normal distribution with known mean and standard deviation.
The following table presents this information:
Task (Immediately)Preceding µ σ
Tasks (hours) (hours)
Waste collection (WC) — 2 0.5
Wash windows (WW) F,AS 3 1
Clean the floor (CF) WW,D,SR 4 0.5
Fumigation (F) — 2 0
Assembly of structures (AS) — 1 0
Electrical Maintenance (EM) AS 2 1
Stock replenishment (RS) WC 2 1
Decoration (D) WC,EM,F,AS 1 1
1. What is the expected value for the duration of the project consisting of these tasks? Calculate the valuesof the free and total slacks for each task.
2. What is the probability of this set of tasks not to be completed in the 10 hours that the mall is closed?
CPM method of time-cost trade-offs

The duration of an activity depends on the amount of resources assigned toit. There is a trade-off between its duration and the cost of the assignedresources. More precisely, the more resources have been assigned to theactivity, leading to an overall increase in the cost, the lower the expectedduration of the activity.
Problem to solve: to determine the activity durations (how much to reducenormal duration of activities) and to schedule the activities in order tominimize the increase of direct project costs, given a predefined projectdeadline constraint.

CPM time-cost trade-offs Problem
Data• activities i and their their immediately preceding activities;
• di, activity durations i;
• marginal reduction costs ci and maximum reduction Ri of each activity i;
• D, required project deadline.
Decison variables• ri, reduction of the normal duration of each activity i.
Auxiliary variables• xi, start of each activity i.
Objective function• Minimize total reduction costs of the activities: min
∑i ciri.
Constraints• For each activity i, its reduction ri must be ≤ its maximum reduction Ri;
• For each pair of activities i e j, in which j only can start immediately after the end of i,xj ≥ xi + (di − ri);
• The duration of the project must be less or equal to D, xFIM ≤ D, where xFIM is a dummy activitywith dFIM = rFIM = 0, which ends the project.
• Project starts at 0. xINI = 0, where xINI is a dummy activity, with dINI = rINI = 0, which startthe project.
• For each activity i, ri e xi ≥ 0.

CPM time-cost trade-offs – Example 1
Spreadsheet
The project shown in figure, whose mini-
mum duration is 38 days, must be com-
pleted in 34 days. The aim is to identify
the strategy that will lead to, at mini-
mum cost, the intended reduction in the
duration of the project.
The information required to analyze the
reducing the duration of the project is
shown in the following table:
Start
A
B
C
D E
F End
Dura%on (days) Cost (€)
Ac%vity i Normal with maximim reduc%on
Maximum reduc%on Normal with maximim
reduc%on Reduc%on Cost
per day
di di-‐Ri Ri ci
START 0 0 0 -‐ € -‐ € -‐ € A 6 4 2 400 € 600 € 100 € B 9 7 2 700 € 850 € 75 € C 8 7 1 600 € 750 € 150 € D 7 6 1 500 € 600 € 100 € E 10 8 2 800 € 1.000 € 100 € F 12 9 3 1.000 € 1.600 € 200 €
END 0 0 0 -‐ € -‐ € -‐ €
Maximum dura%on of the project: 34 Decison variables: ri reduc%on of ac%vity i Auxiliary variables: xi start of ac%vity i

CPM time-cost trade-offs – Example 1 – LP Model
min 0rSTART + 100ra + 75rb + 150rc + 100rd + 100re + 200rf + 0rEND
ri ≤ Ri
rv ≤ 0
ra ≤ 2
rb ≤ 2
rc ≤ 1
rd ≤ 1
re ≤ 2
rf ≤ 3
rEND ≤ 0
xEND ≤ 34
xSTART = 0
ri ≥ 0∀i
xj ≥ xi + (di − ri)
xa ≥ xSTART + (0 − rSTART )
xb ≥ xSTART + (0 − rSTART )
xc ≥ xa + (6 − ra)
xd ≥ xa + (6 − ra)
xc ≥ xb + (9 − rb)
xd ≥ xb + (9 − rb)
xf ≥ xc + (8 − rc)
xe ≥ xd + (7 − rd)
xf ≥ xe + (10 − rd)
xEND ≥ xf + (12 − rf )

CPM time-cost trade-offs - Example 1An optimal solution
Decision variables ri, duration reduction
of each activity i
rSTART = 0
ra = 0
rb = 2
rc = 0
rd = 1
re = 1
rf = 0
rEND = 0
Auxiliary variables xi, start of each acti-
vity i
xSTART = 0
xa = 0
xb = 0
xc = 7
xd = 7
xe = 13
xf = 22
xEND = 34
Value of objective function∑
i ciri = 350

CPM time-cost trade-offs – Example 2
Spreadsheet
It is intended to reduce from 38 to 22 weeks
the duration of the project shown in the fi-
gure, minimizing the increase of direct costs.
Start
0
A 8
D 9
F 11
E 20
End
0
C 6
H 12
B 8
G 9
Activ. Marginal Maximum
Cost Reduction
A 9 5
B 2 4
C 4 3
D 6 7
E 3 7
F 1 5
G 7 5
H 8 7


![Lionheart [Van Damme][1990][FullHD] - Identi](https://static.fdocuments.us/doc/165x107/563db8cd550346aa9a971890/lionheart-van-damme1990fullhd-identi.jpg)


