Project: Patient Satisfaction with Pain Management … Patient Satisfaction with Pain Management...
65
Project: Patient Satisfaction with Pain Management Name of Green Belt(s): Donna Grochow & Maurice Espinoza Name of Champion: Karen Grimley & Zeev Kain, MD Date: March 18, 2013 Attachment EP13v, Lean Six Sigma Patient Satisfaction with Pain Management Project Summary.pdf 1
-
Upload
truongmien -
Category
Documents
-
view
217 -
download
0
Transcript of Project: Patient Satisfaction with Pain Management … Patient Satisfaction with Pain Management...

Project: Patient Satisfaction with Pain Management
Name of Green Belt(s): Donna Grochow & Maurice
Espinoza
Name of Champion: Karen Grimley & Zeev Kain, MD
Date: March 18, 2013
Attachment EP13v, Lean Six Sigma Patient Satisfaction with Pain Management Project Summary.pdf
1

Define Phase
Attachment EP13v, Lean Six Sigma Patient Satisfaction with Pain Management Project Summary.pdf
2

Problem Statement • What is the problem? Low patient satisfaction with pain management has been
identified as an organizational problem.
• How do we know it is a problem? The baseline patient satisfaction scores aggregated at the organizational level for satisfaction with overall pain management are at the 26th percentile when compared nationally. 4th Quarter 2011 baseline Top Box score =59.08 compared to Avatar Top Box 68.10.
• The baseline Top Box scores for “How often staff did everything they could to help with pain” aggregated at the organizational level for 4th Quarter 2011 baseline Top Box score =69.83 compared to Avatar Top Box 78.13.
• What data to we have on baseline performance? National comparative data from the HCAHPS Patient Satisfaction survey is available at the organizational and unit level. Additionally, nursing has been involved in a multi-center research problem sponsored by the National Database of Nursing Quality Indicators which has resulted in data regarding pain management.
• What “pain” does it cause? (impact to patient and/or bottom line): 74% of other benchmarked facilities receive better scores from the patient in regards to pain management, causing the patient to perceive less than optimal care was provided which can lead to poor satisfaction scores, poor publically reported data, decreased reimbursement, and a potential increase in length of stay.
DEFINE
Attachment EP13v, Lean Six Sigma Patient Satisfaction with Pain Management Project Summary.pdf
3

Why is this important?
• Include Voice of the Customer (VOC): Patients are not satisfied with the pain management that is provided.
• Why this, why now? (“Burning Platform”): Scores have been low for a long time, Publically reported, Reimbursement issues, Quality of care issues, Affects Magnet Status
• What will happen if we don’t fix this? Potential loss of patients to other providers, Probable decrease in revenue due to decreased reimbursement, Increase length of stay, loss of magnet designation, etc.
DEFINE
Attachment EP13v, Lean Six Sigma Patient Satisfaction with Pain Management Project Summary.pdf
4

Project Charter Project Name: Patient Satisfaction with Pain
Management Champion: Karen Grimley & Zeev Kain, MD
Belt: Donna Grochow & Maurice Espinoza Master Black Belt: Laura Winner/Henry Alvarez
Problem Statement:
The 4th quarter 2011 Top Box patient satisfaction scores aggregated at the organizational level for satisfaction with pain management are 64.91 (26th percentile) when compared nationally. Three units, DH32, Tower & Tower 5 have a Top Box score of 56.78 (<7th percentile). The baseline Top Box scores for “How often staff did everything they could to help with pain” aggregated at the organizational level for 4th Quarter 2011 baseline Top Box score =69.83 compared to Avatar Top Box 78.13. Three units, DH32, Tower 4 & 5 have a Top Box score of 68.43.
Project Goal:
To improve the Top Box score in overall pain management to 68.10 (50th percentile) on selected units. To increase Top Box scores for “How often staff did everything to help with pain” to 78.13 (50th percentile) on selected units To show improvement in the mean scores of the 3 Path Y statements.
Project Y / Path-Y:
Project Y: Patient satisfaction scores with pain management. Path-Y: Mean percent of patients with positive response to the statements: • “My Healthcare team involved me in the decisions about controlling my
pain”. • “My nurse suggested approaches to help manage my pain”. • “My nurse believed my reports about my pain”.
Scope:
Limited to these areas with current satisfaction scores <7th percentile: DH 32, Tower 4, & 5
Team Members:
Nursing: Physician:
Donna Grochow S. Liao, MD Maurice Espinoza I. De Alba MD Charlene Miranda-Wood Patient Relations:
Khaled Al Eid Carla Camarillo Van Le Pharmacy
Holly Wicklas Lan Zheng Dan Bernsein
Benefits:
Improved patient pain satisfaction scores Decreased length of stay Improved physiological and psychological healing Decreased rate of readmission Decreased rate of outpatient visits
Timeline:
Define/Measure July-September 2011 Analyze September-December 2011 Improve/Control January-March 2012
DEFINE
Attachment EP13v, Lean Six Sigma Patient Satisfaction with Pain Management Project Summary.pdf
5

Voice of Customer
Patients
Nursing
Physicians
Pharmacists
DEFINE
Attachment EP13v, Lean Six Sigma Patient Satisfaction with Pain Management Project Summary.pdf
6

Voice of Customer • What We Currently Have Available:
– Patient Satisfaction Data (HCAHPS)
– National Database of Nursing Quality Indicators (NDNQI): Patient Satisfaction with Pain Management Survey
• Participated in research study to identify issues with pain management
• All eligible medical-surgical patients were surveyed on 1 day in April 2011 and November 2011
• Baseline data available for review
• What We Need: – VOC from nursing, MD group, pharmacists
• Next Steps: – Focus groups with key stakeholders: MDs, nurses, pharmacist, etc
– Continue to conduct patient interviews & data collection as part of NDNQI study
– Continue HCAHPS data collection
DEFINE
Attachment EP13v, Lean Six Sigma Patient Satisfaction with Pain Management Project Summary.pdf
7

Voice of Customer (VOC): RN, MD, Pharmacist Focus Group Results
paste
Themes 1. Communication 2. Knowledge/Education 3. Process 3. Patient Condition 4. Influence of Supervisors 5. Equipment 6. Complementary Therapy
Focus groups were held in August 2011 with staff from DH32, 4T, 5T & MICU, MD groups and patient interviews. The focus group consisted of a written survey and verbal roundtable discussion
The following themes affecting pain management were identified from the focus groups:
MEASURE
Attachment EP13v, Lean Six Sigma Patient Satisfaction with Pain Management Project Summary.pdf
8
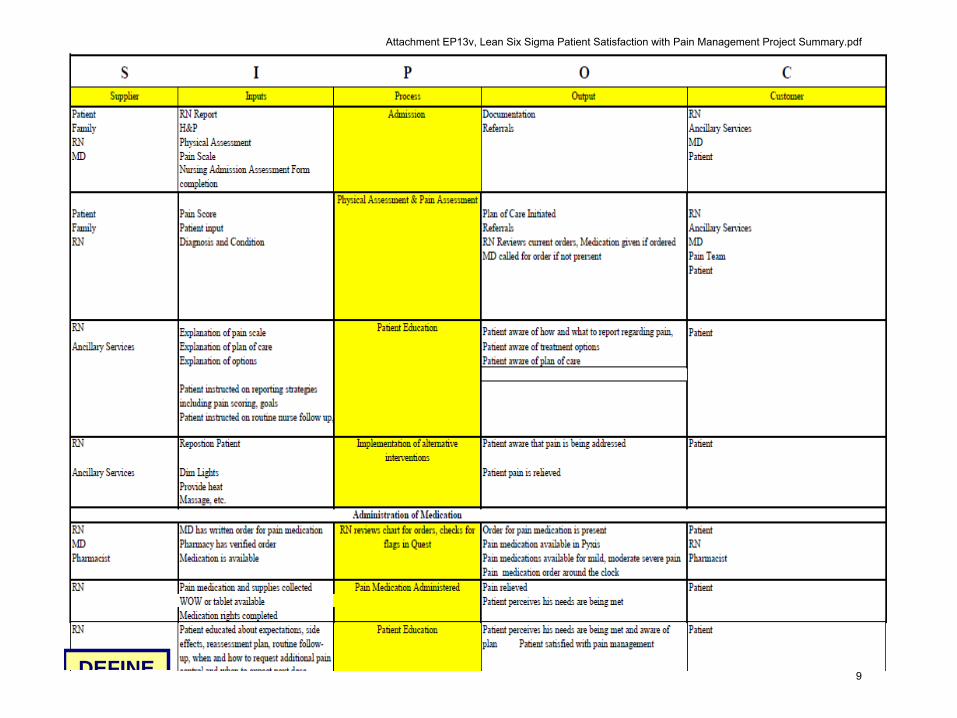
SIPOC
DEFINE
Attachment EP13v, Lean Six Sigma Patient Satisfaction with Pain Management Project Summary.pdf
9

Early Waste Identification DOMOWIT • Defects:
– Lack of communication between MD & RN regarding pain plan of care – Lack of communication between RN & aide regarding pain plan of care – Lack of communication between RN & patient regarding pain plan of care – Lack of communication between aide & patient regarding pain plan of care – Lack of communication between MD & patient regarding pain plan of care – All routine scheduled medications were due at 0900 and were required to be administered within 30
minutes of the scheduled dose. The med/surg RN’s had up to 5 patients with multiple medications. This created a barrier for them in getting to know their patients.
• Over-processing – RN often has to page and/or call MD multiple times for pain medication orders – Patient often unaware of when pain medication is available and has to repeatedly ask nurse
• Motion – RN or aide has to answer patient’s call light to answer question about when next pain medication is due
• Over-production: • Waiting
– Adequate/correct pain medication not given timely, patient has to request pain medication – HCAHPS Scores: Delayed time period for receiving results: Improved with switch from Avatar (Quarterly
results only available when final) to Press Ganey (Preliminary results immediately available)
• Inventory • Transportation
DEFINE
Attachment EP13v, Lean Six Sigma Patient Satisfaction with Pain Management Project Summary.pdf
10

Measure
Attachment EP13v, Lean Six Sigma Patient Satisfaction with Pain Management Project Summary.pdf
11

Baseline Data for Y
•Baseline data on patient satisfaction with pain management is based upon a sample size of 123 patient surveys collected from October 2011 through January 2012.
• The data is obtained from the Hospital Consumer Assessment of Healthcare Providers and Systems (HCAHPS) survey which is provided by a 3rd party vendor to 20% of discharged inpatients.
•Data is available aggregated at the organizational level and the unit level.
•The data for this project was includes the results of the following:
–HCAHPS Composite Score: “Overall Satisfaction with Pain Management”
–Individual questions that are combined for composite score:
•“How often staff did everything they could to help with pain?”
•“How often was pain well controlled?”
MEASURE
Describe how baseline data was obtained…
Attachment EP13v, Lean Six Sigma Patient Satisfaction with Pain Management Project Summary.pdf
12

Baseline Data for Y MEASURE
Measure Systems Analysis Performance Measure
Operational Definition Data Source and Location
Sample Size Who Will Collect the Data
When Will Data be Collected
How Will Data be Collected
Other Data that should be
Collected at the Same Time
Patient perception of pain management.
Discharged patients are sent a survey with questions about their pain management during recent hospital stay. The instrument asks patients to rate the frequency of events during their care (never, sometimes, usually, always): 1. How often staff did
everything they could to help with pain.
2. How often pain was well controlled.
HCAHPS survey of discharged patients
Survey sent to 20% of discharged inpatients. Sample size dependent on returned surveys
Third party vendor: Avatar and Press Ganey
Ongoing Survey Data collected via pre-set survey.
MSA validation consists of evaluation of incumbent from Press Ganey. Data is reproducable and repeatable,.
MSA validation not feasible. Data is attribute data and a Kappa calculation is recommended. Rater repeatability is not applicable for this data because data is collected via anonymous patient survey sent via third party vendor and it is impossible to have rater evaluate measure twice to conduct calculation. Survey is a validated tool and measures patient perception. Patient’s perception would be expected to be the same on repeat samples.
Attachment EP13v, Lean Six Sigma Patient Satisfaction with Pain Management Project Summary.pdf
13

Baseline Data for Y MEASURE
Measure Systems Analysis Performance Measure
Operational Definition Data Source and Location
Sample Size Who Will Collect the Data
When Will Data be Collected
How Will Data be Collected
Other Data that should be
Collected at the Same Time
Patient perception of pain management.
Discharged patients are sent a survey with questions about their pain management during recent hospital stay. The instrument asks patients to rate the frequency of events during their care (never, sometimes, usually, always): 1. How often staff did
everything they could to help with pain.
2. How often pain was well controlled.
HCAHPS survey of discharged patients
Survey sent to 20% of discharged inpatients. Sample size dependent on returned surveys
Third party vendor: Avatar and Press Ganey
Ongoing Survey Data collected via pre-set survey.
MSA validation not feasible. Data is attribute data and a Kappa calculation is recommended. Rater repeatability is not applicable for this data because data is collected via anonymous patient survey sent via third party vendor and it is impossible to have rater evaluate measure twice to conduct calculation. Survey is a validated tool and measures patient perception. Patient’s perception would be expected to be the same on repeat samples.
Attachment EP13v, Lean Six Sigma Patient Satisfaction with Pain Management Project Summary.pdf
14
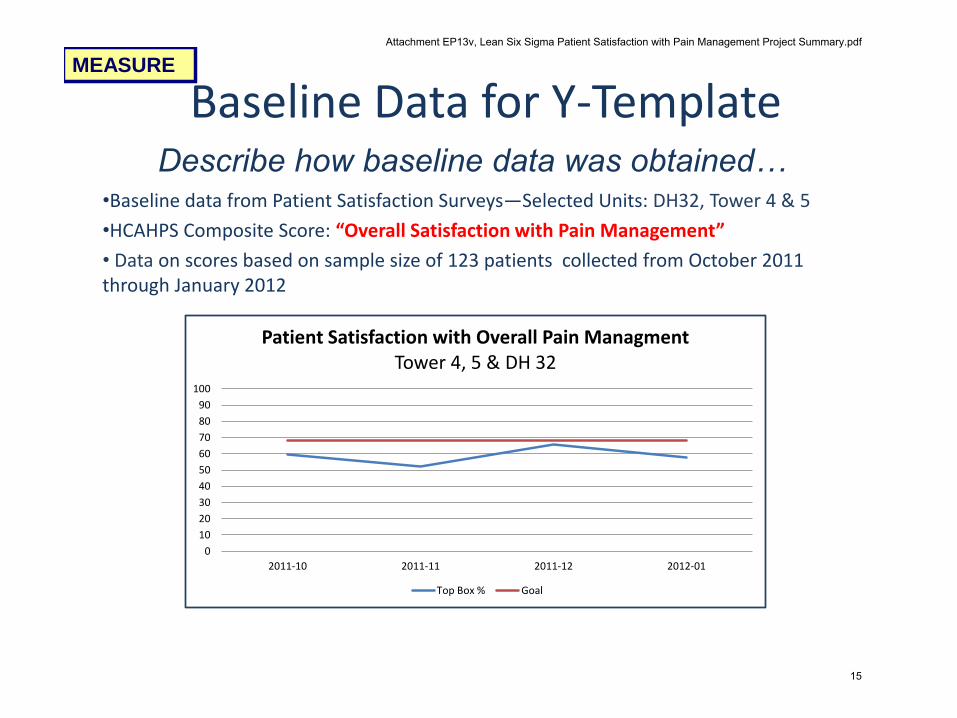
Baseline Data for Y-Template
•Baseline data from Patient Satisfaction Surveys—Selected Units: DH32, Tower 4 & 5
•HCAHPS Composite Score: “Overall Satisfaction with Pain Management”
• Data on scores based on sample size of 123 patients collected from October 2011 through January 2012
MEASURE
Describe how baseline data was obtained…
0
10
20
30
40
50
60
70
80
90
100
2011-10 2011-11 2011-12 2012-01
Patient Satisfaction with Overall Pain Managment Tower 4, 5 & DH 32
Top Box % Goal
Attachment EP13v, Lean Six Sigma Patient Satisfaction with Pain Management Project Summary.pdf
15

Baseline Data for Y-Template
•Baseline data from HCAHPS Patient Satisfaction Survey: DH32, Tower 4 & 5
–Question “How often staff did everything they could to help with pain?”
• Data on scores based on sample size of patients 109 collected from October 2011 through January 2012
MEASURE
Describe how baseline data was obtained…
0
10
20
30
40
50
60
70
80
90
2011-10 2011-11 2011-12 2012-01
How Often Hospital Staff Did Everything They Could to Help with Pain
Top Box % Goal
Attachment EP13v, Lean Six Sigma Patient Satisfaction with Pain Management Project Summary.pdf
16
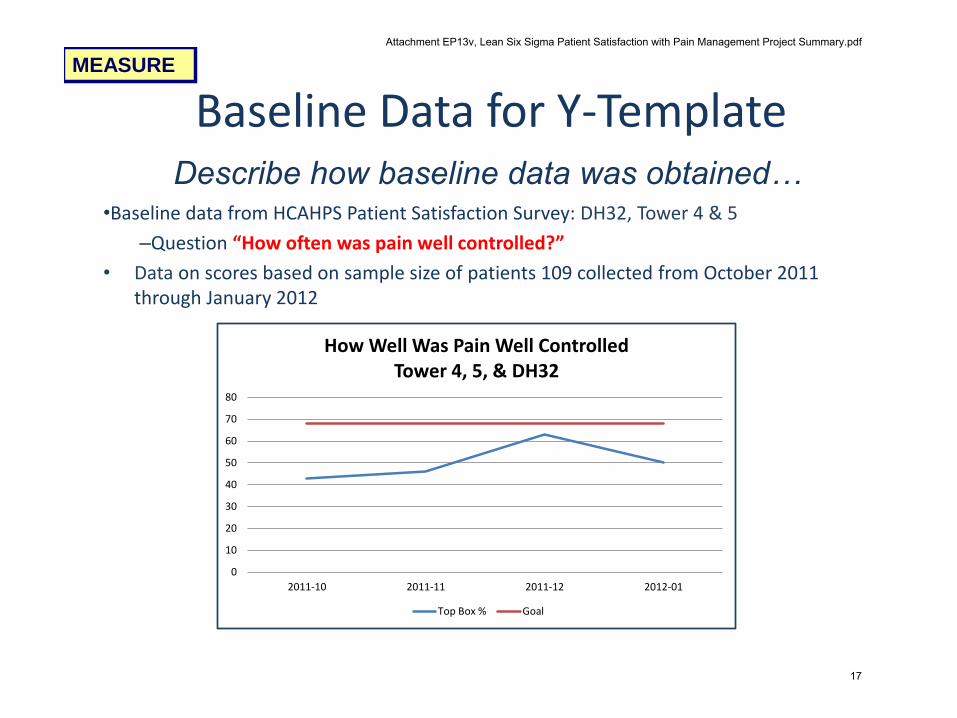
Baseline Data for Y-Template
•Baseline data from HCAHPS Patient Satisfaction Survey: DH32, Tower 4 & 5
–Question “How often was pain well controlled?”
• Data on scores based on sample size of patients 109 collected from October 2011 through January 2012
MEASURE
Describe how baseline data was obtained…
0
10
20
30
40
50
60
70
80
2011-10 2011-11 2011-12 2012-01
How Well Was Pain Well Controlled Tower 4, 5, & DH32
Top Box % Goal
Attachment EP13v, Lean Six Sigma Patient Satisfaction with Pain Management Project Summary.pdf
17

Baseline Data for Path Y MEASURE
•Baseline data collected during participation in a multi-center research study “Patient Satisfaction with Pain Management Survey” sponsored by the National Database of Nursing Quality Indicators (NDNQI)
•All eligible medical-surgical patients were surveyed on 1 day in April 2011 and November 2011
•Data on scores based on sample size of 53 patients on medical/surgical units
•Additional data on scores based on sample size of 23 patients on targeted medical/surgical units
Attachment EP13v, Lean Six Sigma Patient Satisfaction with Pain Management Project Summary.pdf
18

Baseline Data for Path Y
All Medical-Surgical Units
MEASURE
Interventions Implemented February 21,2012
Attachment EP13v, Lean Six Sigma Patient Satisfaction with Pain Management Project Summary.pdf
19
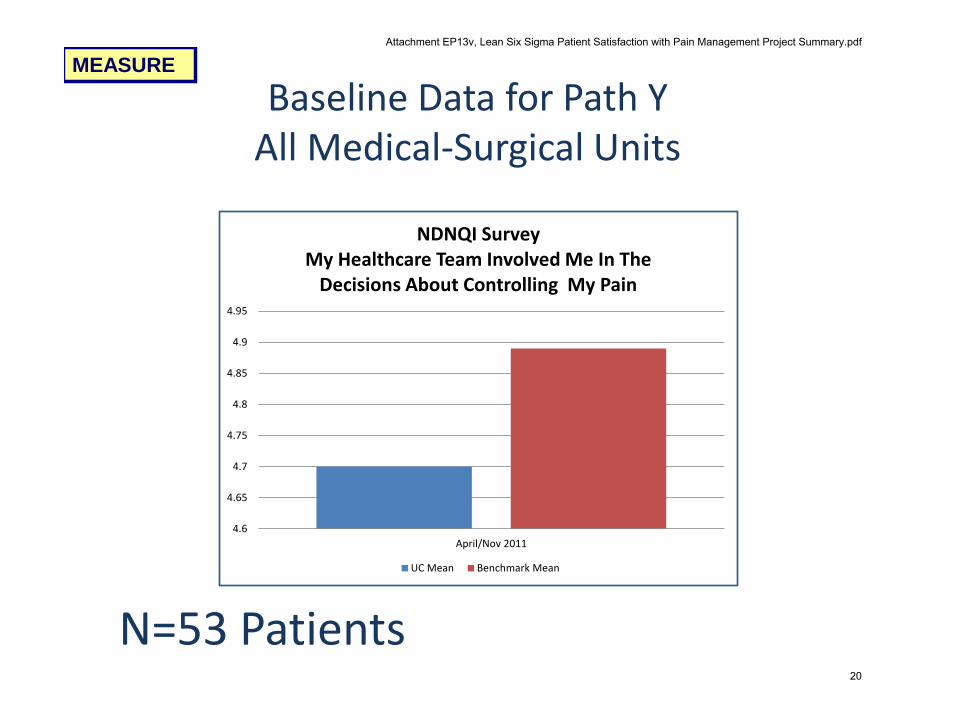
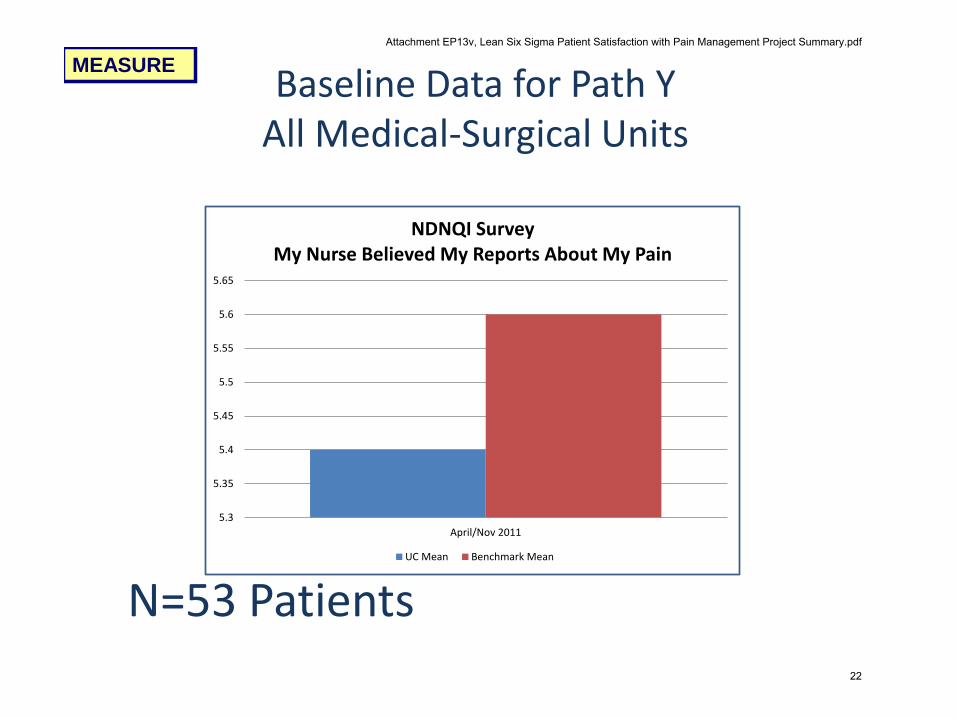
N=53 Patients
4.6
4.65
4.7
4.75
4.8
4.85
4.9
4.95
April/Nov 2011
NDNQI Survey My Healthcare Team Involved Me In The
Decisions About Controlling My Pain
UC Mean Benchmark Mean
MEASURE
Baseline Data for Path Y All Medical-Surgical Units
Attachment EP13v, Lean Six Sigma Patient Satisfaction with Pain Management Project Summary.pdf
20

N=53 Patients
MEASURE
0
0.5
1
1.5
2
2.5
3
3.5
4
4.5
April/Nov 2011
NDNQI Survey My Nurse Suggested Approaches to Help
Manage My Pain
UC Mean Benchmark Mean
Baseline Data for Path Y
All Medical-Surgical Units
Attachment EP13v, Lean Six Sigma Patient Satisfaction with Pain Management Project Summary.pdf
21
N=53 Patients
MEASURE
5.3
5.35
5.4
5.45
5.5
5.55
5.6
5.65
April/Nov 2011
NDNQI Survey My Nurse Believed My Reports About My Pain
UC Mean Benchmark Mean
Baseline Data for Path Y
All Medical-Surgical Units
Attachment EP13v, Lean Six Sigma Patient Satisfaction with Pain Management Project Summary.pdf
22
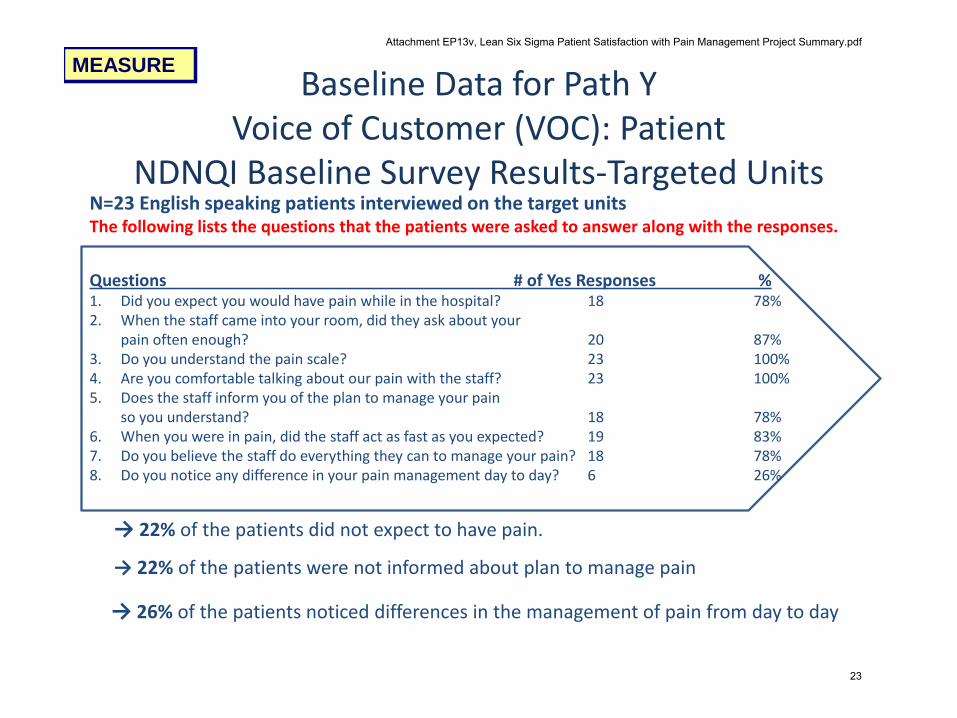
Baseline Data for Path Y
Voice of Customer (VOC): Patient NDNQI Baseline Survey Results-Targeted Units
paste
Questions # of Yes Responses % 1. Did you expect you would have pain while in the hospital? 18 78% 2. When the staff came into your room, did they ask about your pain often enough? 20 87% 3. Do you understand the pain scale? 23 100% 4. Are you comfortable talking about our pain with the staff? 23 100% 5. Does the staff inform you of the plan to manage your pain so you understand? 18 78% 6. When you were in pain, did the staff act as fast as you expected? 19 83% 7. Do you believe the staff do everything they can to manage your pain? 18 78% 8. Do you notice any difference in your pain management day to day? 6 26%
→ 22% of the patients did not expect to have pain.
→ 22% of the patients were not informed about plan to manage pain
N=23 English speaking patients interviewed on the target units The following lists the questions that the patients were asked to answer along with the responses.
→ 26% of the patients noticed differences in the management of pain from day to day
MEASURE
Attachment EP13v, Lean Six Sigma Patient Satisfaction with Pain Management Project Summary.pdf
23

paste
Questions UC Mean Benchmark 50th Percentile 1. My nurse believed my report of pain 5.24 5.68 2. I had pain medication available when I needed it. 5.04 5.56 3. My nurse suggested approaches to manage my pain. 3.36 3.67 4. My nurse discussed side effects of pain meds with me 3.85 3.63 5. The pain medications worked well to control my pain 4.48 5 6. My healthcare team involved me in decisions about pain control 4.46 4.94
→ Our scores were < 50th percentile in almost all categories
N=23 English speaking patients interviewed on the target units
The following lists the questions that the patients were asked to answer along with the responses.
MEASURE
Baseline Data for Path Y Voice of Customer (VOC): Patient
NDNQI Baseline Survey Results-Targeted Units
Attachment EP13v, Lean Six Sigma Patient Satisfaction with Pain Management Project Summary.pdf
24

Normality
MEASURE
Overall Satisfaction with Pain Management-October 2011-January 2012….
The P-value is 0.795.
Because the P-value is .05 or more, the distribution is considered normal
Attachment EP13v, Lean Six Sigma Patient Satisfaction with Pain Management Project Summary.pdf
25

Stability
MEASURE
Is the process stable (Predictable)? Insert control chart to demonstrate stability…
Overall Satisfaction with Pain Management-October 2011-January 2012
The process is stable.
Attachment EP13v, Lean Six Sigma Patient Satisfaction with Pain Management Project Summary.pdf
26

Capability MEASURE
What is our baseline performance? How well are we meeting expectations (How good is our process)?
Percent Defective: 39.45
Attachment EP13v, Lean Six Sigma Patient Satisfaction with Pain Management Project Summary.pdf
27

Baseline Process Map
MEASURE
Attachment EP13v, Lean Six Sigma Patient Satisfaction with Pain Management Project Summary.pdf
28

Filter X’s FMEA Filtering of X’s to vital few…
MEASURE
Attachment EP13v, Lean Six Sigma Patient Satisfaction with Pain Management Project Summary.pdf
29

Pilot Data Collection for X’s
Performance Measure
Operational Definition
Data Source and Location
Sample Size Who Will Collect the Data
When Will Data be Collected
How Will Data be Collected
Other Data that should be
Collected at the same time
Specialist Seen Time, # of
Specialists, PFT, Pts wait
time.
Shadow pts. And measure how many minutes each specialist
takes. Doc. How many specialists
are seen including PFT
CF Clinic 50 Chad Smith
During the first week of the
month, 8/29/2007 to 10/5/2007
Data will be collected using digital watch,
data collection sheet
Day of Wk, any pertinent
comments or issues noted
during observation.
MEASURE
Revise and pilot data collection to include data
on the vital X’s identified in C&E
Attachment EP13v, Lean Six Sigma Patient Satisfaction with Pain Management Project Summary.pdf
30

Voice of Customer (VOC): RN Focus Group Results
paste
Themes 1. Communication 2. Knowledge/Education 3. Process 3. Patient Condition 4. Influence of Supervisors 5. Equipment 6. Complementary Therapy
Focus groups were held in August 2011 with staff from DH32, 4T, 5T & MICU. The focus group consisted of a written survey and verbal roundtable discussion
The following themes affecting pain management were identified from the focus groups:
MEASURE
Attachment EP13v, Lean Six Sigma Patient Satisfaction with Pain Management Project Summary.pdf
31

Voice of Customer (VOC): RN Pareto Chart August 2011
paste
Focus groups were held August 2011 with staff from DH32, 4T, 5T & MICU. The focus group consisted of a written survey and verbal roundtable discussion
The following themes affecting pain management were identified from the focus groups:
C3 47 29 28 8 4 3 2
Percent 38.8 24.0 23.1 6.6 3.3 2.5 1.7
Cum % 38.8 62.8 86.0 92.6 95.9 98.3 100.0
C2
Complim
entary The
rapy
Equipm
ent
Influ
ence
of S
uper
iors
Patie
nt Con
ditio
n
Proc
ess
Know
ledg
e/ Edu
catio
n
Commun
icatio
n
120
100
80
60
40
20
0
100
80
60
40
20
0
C3
Pe
rce
nt
Pareto Chart of C2
MEASURE
Attachment EP13v, Lean Six Sigma Patient Satisfaction with Pain Management Project Summary.pdf
32

Analyze
Which X’s are key?
5 Whys
Cause & Effect Analysis
ANALYZE
Attachment EP13v, Lean Six Sigma Patient Satisfaction with Pain Management Project Summary.pdf
33

Analyze
Attachment EP13v, Lean Six Sigma Patient Satisfaction with Pain Management Project Summary.pdf
34

Fishbone Results from Brainstorming on ALL potential X’s …
ANALYZE
Attachment EP13v, Lean Six Sigma Patient Satisfaction with Pain Management Project Summary.pdf
35

Cause & Effect Summary
• Multiple Inputs were originally identified in the SIPOC
• Common themes were identified via surveys and focus groups
• These were then rated within categories – Patient Satisfaction with Pain Management
– RN Role in Pain Management
– MD Role in Pain Management
• The C & E methodology identified the top Inputs/themes with scores as seen in the next slide
• The top ranked Inputs/themes guided the work for the Improve phase
paste
ANALYZE
Attachment EP13v, Lean Six Sigma Patient Satisfaction with Pain Management Project Summary.pdf
36

Cause & Effect
paste
ANALYZE
Attachment EP13v, Lean Six Sigma Patient Satisfaction with Pain Management Project Summary.pdf
37
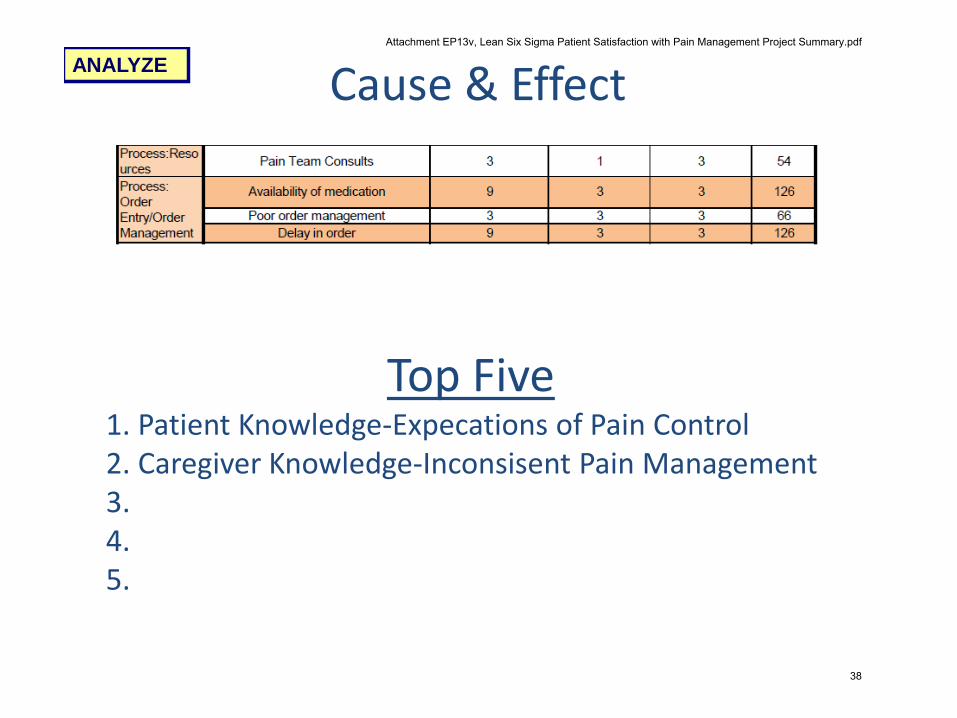
Cause & Effect
paste
ANALYZE
Top Five 1. Patient Knowledge-Expecations of Pain Control 2. Caregiver Knowledge-Inconsisent Pain Management 3. 4. 5.
Attachment EP13v, Lean Six Sigma Patient Satisfaction with Pain Management Project Summary.pdf
38

Analyze: 5 Whys of Pain ANALYZE
Attachment EP13v, Lean Six Sigma Patient Satisfaction with Pain Management Project Summary.pdf
39

Analyze: 5 Whys ANALYZE
Attachment EP13v, Lean Six Sigma Patient Satisfaction with Pain Management Project Summary.pdf
40

Analyze: 5 Whys ANALYZE
Attachment EP13v, Lean Six Sigma Patient Satisfaction with Pain Management Project Summary.pdf
41

Analyze: VOC-Nursing
ANALYZE
C3 47 29 28 8 4 3 2
Percent 38.8 24.0 23.1 6.6 3.3 2.5 1.7
Cum % 38.8 62.8 86.0 92.6 95.9 98.3 100.0
C2
Complim
entary The
rapy
Equipm
ent
Influ
ence
of S
uper
iors
Patie
nt Con
ditio
n
Proc
ess
Know
ledg
e/ Edu
catio
n
Commun
icatio
n
120
100
80
60
40
20
0
100
80
60
40
20
0
C3
Pe
rce
nt
Pareto Chart of C2
Attachment EP13v, Lean Six Sigma Patient Satisfaction with Pain Management Project Summary.pdf
42

Improve
Attachment EP13v, Lean Six Sigma Patient Satisfaction with Pain Management Project Summary.pdf
43

0123456789
10
0 1 2 3 4 5 6 7 8 9 10
Imp
act o
f C
han
ge o
n P
ati
en
t P
erc
ep
tio
n o
f P
ain
Man
ag
men
t
Ease of Implementation
Pain Scale Poster
Pain Goal & Medication Poster
Huddle Education
Quick Education Sheet Campaign
Pain Score Dashboards
Pain Score Reports to MD
MD Pain Management Education
Communication Reminders to MD
Require Pain Consult for Chronic Pain Patients
Pain Free Campaign-Lounges, Workroom & Intranet
Improve Pain Resource Website Visibility
IMPROVE
Ease v. Impact Based on key X’s identified, what improvements were identified?
Attachment EP13v, Lean Six Sigma Patient Satisfaction with Pain Management Project Summary.pdf
44

Interventions What X’s were selected for modification? Communication Education What are the Interventions and the key X’s they address? Improved Communication: Pain Scale Poster Pain Goal & Medication Poster Poster Campaign-Lounges & Workroom (Potentially) Improve Pain Resource Website Visibility (Potentially) Nursing Education Huddle Education Quick Education Sheet Developed Pain Score Dashboards MD Education Pain Score Reports to MD Communication Reminders to MD Pilot interventions and collect data…
IMPROVE
Attachment EP13v, Lean Six Sigma Patient Satisfaction with Pain Management Project Summary.pdf
45

Visual Pain Tools in Every Patient Room
IMPROVE
Attachment EP13v, Lean Six Sigma Patient Satisfaction with Pain Management Project Summary.pdf
46
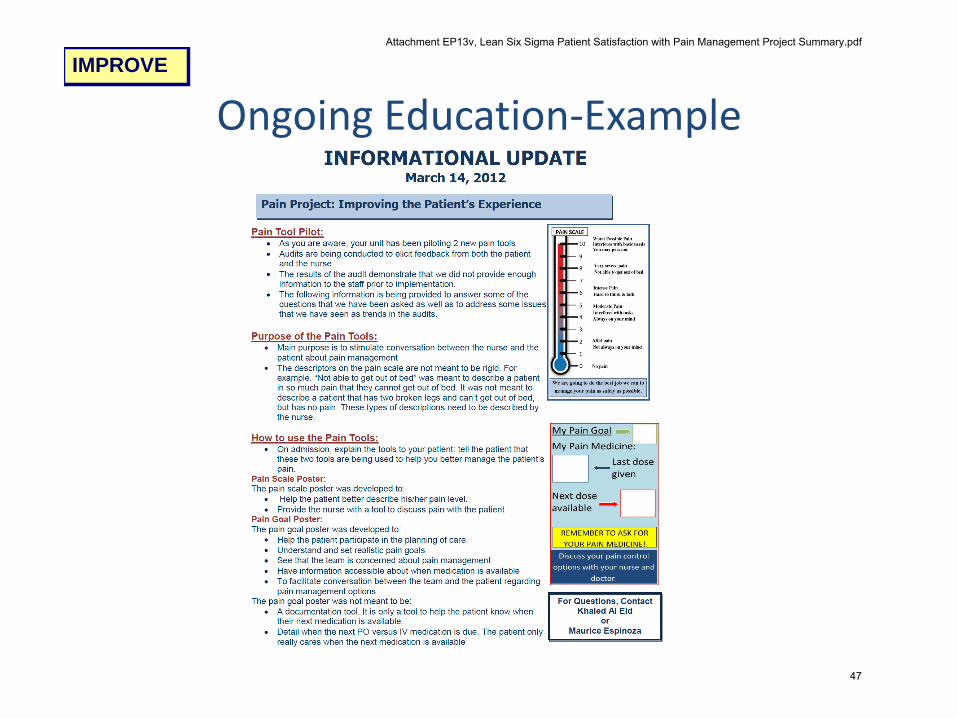
Ongoing Education-Example
IMPROVE
Attachment EP13v, Lean Six Sigma Patient Satisfaction with Pain Management Project Summary.pdf
47

Control
Attachment EP13v, Lean Six Sigma Patient Satisfaction with Pain Management Project Summary.pdf
48

Control Plan CONTROL
→ Control Plan to keep Improvements in place
→ Reaction plan/feedback mechanism
Attachment EP13v, Lean Six Sigma Patient Satisfaction with Pain Management Project Summary.pdf
49

Control Plan CONTROL
→ Control Plan to keep Improvements in place
→ Reaction plan/feedback mechanism
Attachment EP13v, Lean Six Sigma Patient Satisfaction with Pain Management Project Summary.pdf
50

5.4
4.12
4.7
5.76
3.06
4.98
5.6
4.12
4.89
My Nurse Believed My Reports About My Pain My Nurse Suggested Approaches to Help Manage MyPain
My Healthcare Team Involved Me in the Decisions AboutControlling My Pain
NDNQI Pain Management Study
Pre-November 2011 & April 2012 Post-April 2012 NDNQI Benchmark
NDNQI Pain Management Study Pre & Post Results
Interventions Implemented February 21,2012
CONTROL
Evaluation: 1. The questions, “My Nurse Believed My Repots About My Pain” and “My Healthcare Team involved Me in the Decisions About Controlling My Pain” improved and out-performed the mean post intervention. The focus of the project was centered on the patient perception of the teams involvement/interest in pain management. These questions reflect that focus. 2. The question, “My Nurse Suggested Approaches to Help Manage My Pain” scored lower in the post measurement. The focus of the project did not work on this topic, therefore the results are not surprising.
Attachment EP13v, Lean Six Sigma Patient Satisfaction with Pain Management Project Summary.pdf
51
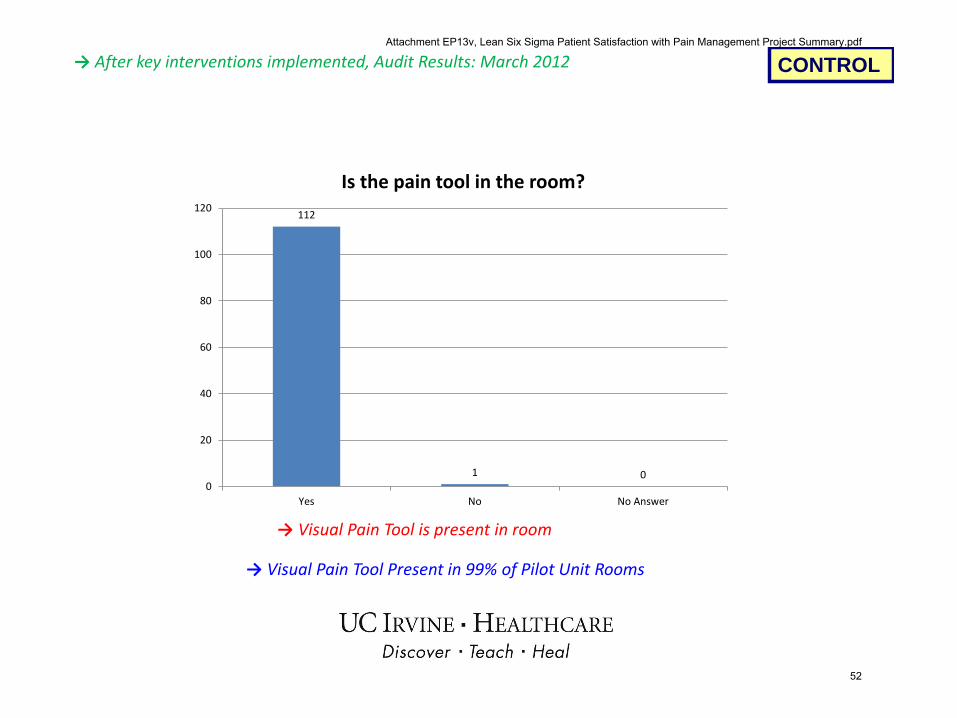
CONTROL → After key interventions implemented, Audit Results: March 2012
→ Visual Pain Tool is present in room
→ Visual Pain Tool Present in 99% of Pilot Unit Rooms
112
1 0 0
20
40
60
80
100
120
Yes No No Answer
Is the pain tool in the room?
Attachment EP13v, Lean Six Sigma Patient Satisfaction with Pain Management Project Summary.pdf
52

CONTROL
→ Visual Pain Tool is being used by 68% of RNs
→ Education regarding tool was provided
77
30
6
0
10
20
30
40
50
60
70
80
90
Yes No No Answer
Is the staff RN utilizing the tool?
→ After key interventions implemented, Audit Results: March 2012
Attachment EP13v, Lean Six Sigma Patient Satisfaction with Pain Management Project Summary.pdf
53

CONTROL → Right after key interventions implemented, Audit Results
→ Visual Pain Tool is visible to 96% of patients
109
4 0
0
20
40
60
80
100
120
Yes No No Answer
Can the patient see the tool?
Attachment EP13v, Lean Six Sigma Patient Satisfaction with Pain Management Project Summary.pdf
54

CONTROL → Right after key interventions implemented, Audit Results
→ 82% of patients understand the tool
→ Education regarding tool was provided
93
18
2
0
10
20
30
40
50
60
70
80
90
100
Yes No No Answer
Does the patient understand the tool?
Attachment EP13v, Lean Six Sigma Patient Satisfaction with Pain Management Project Summary.pdf
55

CONTROL → Right after key interventions implemented, Audit Results
→ 78% of patients like the tool
88
9
16
0
10
20
30
40
50
60
70
80
90
100
Yes No No Answer
Does the patient like the tool?
Attachment EP13v, Lean Six Sigma Patient Satisfaction with Pain Management Project Summary.pdf
56

Opportunity for Spread
• Could other areas of the organization benefit from a similar improvement effort?
Plan is to disseminate interventions to entire organization once pilot is completed and any needed changes are finalized.
Attachment EP13v, Lean Six Sigma Patient Satisfaction with Pain Management Project Summary.pdf
57

CONTROL → Right after key interventions implemented, Audit Results
→ 64% of patients think pain tool is helping team to effectively manage pain
→ Education regarding tool was provided
72
15
26
0
10
20
30
40
50
60
70
80
Yes No No Answer
Is the pain tool helping you and your nurse manage your pain effectively?
Attachment EP13v, Lean Six Sigma Patient Satisfaction with Pain Management Project Summary.pdf
58

0
10
20
30
40
50
60
70
80
90
100
2011-09 2011-10 2011-11 2011-12 2012-01 2012-02 2012-03 2012-04 2012-05 2012-06 2012-07 2012-08 2012-09 2012-10 2012-11 2012-12
Overall Pain Management Patient Satisfaction
Pilot Units
Top Box % Goal
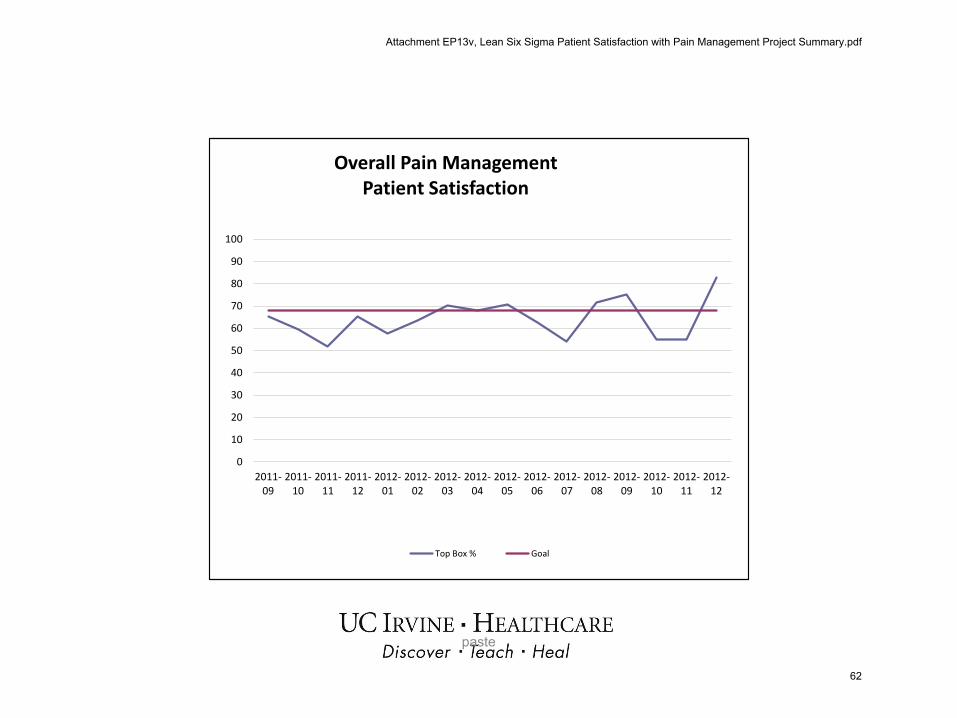
Final Data for Y-Template •HCAHPS Composite.
•Overall Satisfaction with Pain Management on DH32, Tower 4 & 5 (Pilot Units)
•Data on scores based on sample size of 619 patients discharged from September 2011 through December 2012
CONTROL
?
Essence of Nursing-Oct-Dec classes-Focus on patient-centered care/pain management
Improve Phase Begun January 2012: 1. Education 2. Pilot Pain Poster and Pain Thermometer 3. Flexibility added to medication administration policy 4. Patient Education: Pain Management Video
Baseline: Sept 2011-January 2012
Installation of revised White Boards & New Pain Tools in medical/surgical units
Attachment EP13v, Lean Six Sigma Patient Satisfaction with Pain Management Project Summary.pdf
59

0
10
20
30
40
50
60
70
80
90
100
2011-09 2011-10 2011-11 2011-12 2012-01 2012-02 2012-03 2012-04 2012-05 2012-06 2012-07 2012-08 2012-09 2012-10 2012-11 2012-12
How Often Hospital Staff did Everything They could to Help with Pain
Top Box % Goal
Baseline: Sept 2011-January 2012
Improve Phase Begun January 2012: 1. Education 2. Pilot Pain Poster and Pain Thermometer 3. Flexibility added to medication administration policy 4. Patient Education: Pain Management Video
Final Data for Y-Template •Baseline data from HCAHPS Patient Satisfaction Survey: DH32, Tower 4 & 5
–Question “How often staff did everything they could to help with pain?”
•Data on scores based on sample size of 619 patients discharged from September 2011 through December 2012
MEASURE
Essence of Nursing-Oct-Dec classes-Focus on patient-centered care/pain management
Installation of revised White Boards & New Pain Tools in medical/surgical units
Data collection/focus groups: August 2011-January 2012
Attachment EP13v, Lean Six Sigma Patient Satisfaction with Pain Management Project Summary.pdf
60
0
10
20
30
40
50
60
70
80
90
100
2011-09 2011-10 2011-11 2011-12 2012-01 2012-02 2012-03 2012-04 2012-05 2012-06 2012-07 2012-08 2012-09 2012-10 2012-11 2012-12
How Often Pain Was Well Controlled Patient Satisfaction
Top Box % Goal
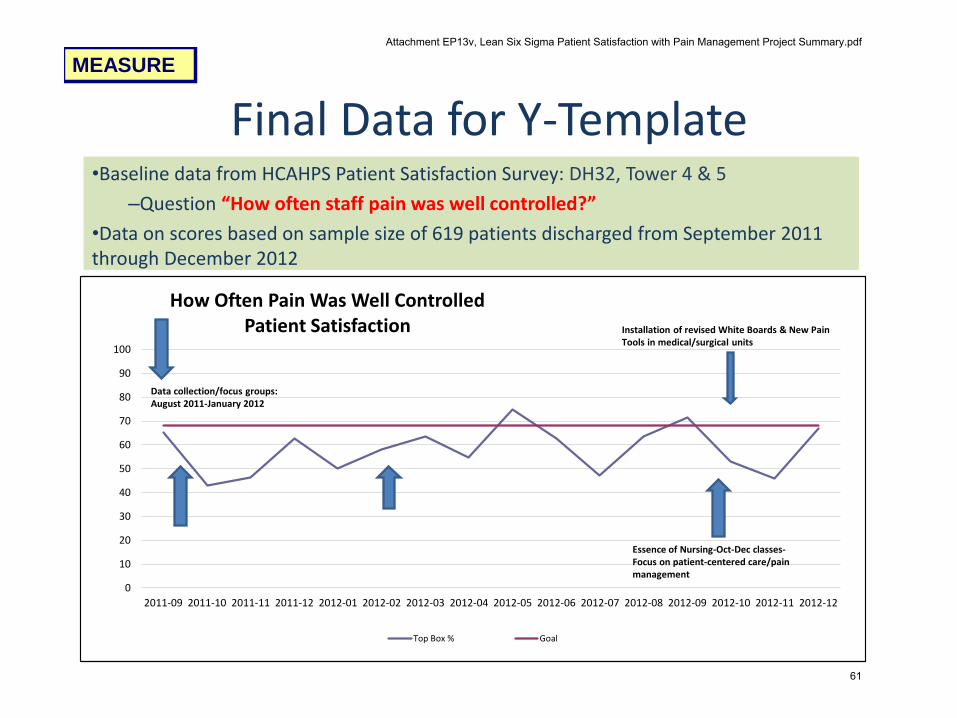
Final Data for Y-Template •Baseline data from HCAHPS Patient Satisfaction Survey: DH32, Tower 4 & 5
–Question “How often staff pain was well controlled?”
•Data on scores based on sample size of 619 patients discharged from September 2011 through December 2012
MEASURE
Essence of Nursing-Oct-Dec classes-Focus on patient-centered care/pain management
Installation of revised White Boards & New Pain Tools in medical/surgical units
Data collection/focus groups: August 2011-January 2012
Attachment EP13v, Lean Six Sigma Patient Satisfaction with Pain Management Project Summary.pdf
61
paste
0
10
20
30
40
50
60
70
80
90
100
2011-09
2011-10
2011-11
2011-12
2012-01
2012-02
2012-03
2012-04
2012-05
2012-06
2012-07
2012-08
2012-09
2012-10
2012-11
2012-12
Overall Pain Management Patient Satisfaction
Top Box % Goal
Attachment EP13v, Lean Six Sigma Patient Satisfaction with Pain Management Project Summary.pdf
62

Normality
MEASURE
Overall Satisfaction with Pain Management-October 2011-January 2012….
The P-value is <0.005.
Because the P-value is not .05 or more, the distribution is considered normal
6050403020100-10-20
99
95
90
80
70
60
50
40
30
20
10
5
1
Always1
Pe
rce
nt
Mean 21.27
StDev 16.11
N 11
AD 1.074
P-Value <0.005
Probability Plot of Always1Normal
Attachment EP13v, Lean Six Sigma Patient Satisfaction with Pain Management Project Summary.pdf
63

Stability
MEASURE
Is the process stable (Predictable)? Insert control chart to demonstrate stability…
Overall Satisfaction with Pain Management-October 2011-January 2012
The process is stable.
1110987654321
1.0
0.8
0.6
0.4
0.2
0.0
Sample
Pro
po
rtio
n
_P=0.659
UCL=1
LCL=0.249
P Chart of Always1
Tests performed with unequal sample sizes
Attachment EP13v, Lean Six Sigma Patient Satisfaction with Pain Management Project Summary.pdf
64

Capability MEASURE
What is our baseline performance? How well are we meeting expectations (How good is our process)?
Percent Defective: 39.45
4321
0.6
0.4
0.2
Sample
Pro
po
rti
on
_P=0.3945
UC L=0.5778
LC L=0.2112
4.03.53.02.52.01.51.0
48
44
40
36
32
Sample
%D
efe
cti
ve
Upper C I: 0.4422
%Defectiv e: 39.45
Lower C I: 32.92
Upper C I: 46.27
Target: 0.00
PPM Def: 394495
Lower C I: 329159
Upper C I: 462742
Process Z: 0.2676
Lower C I: 0.0935
(95.0% confidence)
Summary Stats
806040
60
40
20
Sample Size
%D
efe
cti
ve
45.0
37.5
30.0
22.5
15.07.
50.
0
1.00
0.75
0.50
0.25
0.00
%Defective
Fre
qu
en
cy
Tar
Binomial Process Capability Analysis Pain Post Intervention
P Chart
Tests performed w ith unequal sample sizes
Cumulative %Defective
Rate of Defectives
Histogram
Attachment EP13v, Lean Six Sigma Patient Satisfaction with Pain Management Project Summary.pdf
65


![Perceptually Consistent Example-based Human Motion Retrievaldavid/Classes/Papers/I3D09_motionretrieval.pdfifolds [Safonova et al. 2004; Grochow et al. 2004], and simulating biped behaviors](https://static.fdocuments.us/doc/165x107/5fd416b19af7154fbc45ca85/perceptually-consistent-example-based-human-motion-retrieval-davidclassespapersi3d09motionretrievalpdf.jpg)


![Joshua A. Grochojgrochow/Grochow_MIT_Masters_06_PPI... · 2014. 8. 22. · Joshua A. Grochow Submitted to the Department of Electrical Engineering and Computer ... KIMA04a, MZW05]).](https://static.fdocuments.us/doc/165x107/6021235864dced78a14ea730/joshua-a-jgrochowgrochowmitmasters06ppi-2014-8-22-joshua-a-grochow.jpg)