1 Project Number: DZT-1002 An Interactive Qualifying Project

1
Project Number: DTZ 1102
An Interactive Qualifying Project Report: submitted to the Faculty of
WORCESTER POLYTECHNIC INSTITUTE
in partial fulfillment of the requirements for the
Degree of Bachelor of Science
By
Emma Begbie _____________________________
Zephyr Cady _____________________________
Jackson DeWeese _____________________________
Luke Sorensen _____________________________
Submitted:
December 5, 2011
Approved by Professor Dalin Tang, Project Advisor
___________________________________________
2
Abstract
Using Interactive Brokers as a simulation trading platform and Yahoo! Finance, among other
current financial news sources, the project team conducted four individual seven-week stock
market simulations using four different trading strategies: buy-and-hold, shorting the market,
leveraged ETFs and options straddle prior to earnings announcement. The simulations were
analyzed weekly and at the final conclusions. The four simulations were compared to learn the
effectiveness and applicability of the strategies.
3
Table of contents
TABLE OF CONTENTS ............................................................................................................................................................ -3-
LIST OF FIGURES ..................................................................................................................................................................... -5-
LIST OF TABLES ....................................................................................................................................................................... -7-
1. INTRODUCTION .................................................................................................................................................................. -9-
1.1. OBJECTIVES OF THE PROJECT .................................................................................................... -9-
1.2 .WHAT IS THE STOCK MARKET .................................................................................................... -9-
1.3 .OUTLINE OF THE PROJECT ...................................................................................................... -11-
2. SIMULATION A: BUY-AND-HOLD (EMMA) .............................................................................................................. -13-
2.1 INTRODUCTION AND BACKGROUND ........................................................................................... -13-
2.2 PORTFOLIO STRATEGY AND RESEARCH...................................................................................... -14-
2.2.1 Trading Strategy ............................................................................................................ -14-
2.2.2 Portfolio Selection Criteria ........................................................................................... -14-
2.2.3 Companies Selected ....................................................................................................... -15-
2.3 TRANSACTIONS ......................................................................................................................... -26-
2.4 ANALYSIS ................................................................................................................................. -51-
3. SIMULATION B: MARKET SHORTING (ZEPHYR) .................................................................................................. -58-
3.1 INTRODUCTION AND BACKGROUND ........................................................................................... -58-
3.2 PORTFOLIO STRATEGY AND RESEARCH...................................................................................... -59-
3.2.1 Trading Strategy ............................................................................................................ -59-
3.2.2 Portfolio Selection Criteria ........................................................................................... -60-
3.2.3 Companies Selected ....................................................................................................... -61-
3.3 TRANSACTIONS ......................................................................................................................... -64-
3.4 ANALYSIS ................................................................................................................................. -98-
4. SIMULATION C: LEVERAGED ETFS (LUKE) ...........................................................................................................-105-
4.1 INTRODUCTION AND BACKGROUND ......................................................................................... -105-
4.2 PORTFOLIO STRATEGY AND RESEARCH.................................................................................... -106-
4.2.1 Trading Strategy .......................................................................................................... -106-
4.2.2 Portfolio Selection Criteria ......................................................................................... -106-
4.2.3 Companies Selected ..................................................................................................... -107-
4.3 TRANSACTIONS ....................................................................................................................... -109-
4.4 ANALYSIS ............................................................................................................................... -124-
5. SIMULATION D: LONG OPTION STRADDLES PRIOR TO EARNINGS ANNOUNCEMENTS (JACK) ........-126-
5.1 INTRODUCTION AND BACKGROUND ......................................................................................... -126-
5.2 PORTFOLIO STRATEGY AND RESEARCH.................................................................................... -128-
5.2.1 Trading Strategy .......................................................................................................... -128-

4
5.2.2 Portfolio Selection Criteria ......................................................................................... -131-
5.3 TRANSACTIONS ....................................................................................................................... -132-
5.4 ANALYSIS ............................................................................................................................... -165-
6. COMPARISON OF PORTFOLIO PERFORMANCE ..................................................................................................-169-
7. CONCLUSION ...................................................................................................................................................................-171-
REFERENCES ........................................................................................................................................................................-172-
APPENDIX: TERMINOLOGY ............................................................................................................................................-181-

5
List of Figures
FIGURE 2.1: THE HOME DEPOT STOCK OVER THE PAST MONTH ............................................................................... -17-
FIGURE 2.2: CATERPILLAR STOCK OVER THE PAST MONTH ...................................................................................... -18-
FIGURE 2.3: EXXONMOBIL STOCK OVER THE PAST MONTH ..................................................................................... -20-
FIGURE 2.4: BP STOCK OVER THE PAST MONTH ....................................................................................................... -21-
FIGURE 2.5: ATP OIL & GAS STOCK OVER THE PAST MONTH .................................................................................. -22-
FIGURE 2.6: GOOGLE STOCK OVER THE PAST MONTH .............................................................................................. -23-
FIGURE 2.7: YAHOO STOCK OVER THE PAST MONTH ................................................................................................ -24-
FIGURE 2.8: MICROSOFT STOCK OVER THE PAST MONTH ........................................................................................ -25-
FIGURE 2.9: GOOGLE STOCK VS THE NASDAQ ........................................................................................................... -52-
FIGURE 2.10: YAHOO STOCK VS. THE NASDAQ ......................................................................................................... -54-
FIGURE 2.11: MICROSOFT STOCK VS. THE NASDAQ .................................................................................................. -54-
FIGURE 2.12: THE HOME DEPOT STOCK VS. THE DOW JONES ................................................................................... -55-
FIGURE 2.13: CATERPILLAR STOCK VS. THE DOW JONES ........................................................................................... -56-
FIGURE 2.14: EXXONMOBIL STOCK VS. THE DOW JONES .......................................................................................... -56-
FIGURE 2.15: ATP OIL & GAS VS. THE NASDAQ ....................................................................................................... -57-
FIGURE 3.1: AMD STOCK OVER THE FIRST WEEK OF TRADING .................................................................................. -70-
FIGURE 3.2: JAG PRICE OVER WEEK TWO .................................................................................................................. -73-
FIGURE 3.3: ASSETS OVER THE SIMULATION TIME TO DATE ....................................................................................... -78-
FIGURE 3.4: BP STOCK PRICE OVER WEEK THREE ...................................................................................................... -80-
FIGURE 3.5: FSYS PRICE OVER WEEK THREE ............................................................................................................. -81-
FIGURE 3.6: JAG PRICE OVER WEEK THREE ............................................................................................................... -84-
FIGURE 3.7: MA PERFORMANCE OVER THE LAST YEAR ............................................................................................. -86-
FIGURE 3.8: MA PERFORMANCE OVER THREE MONTHS ............................................................................................. -87-
FIGURE 3.9: NFLX PRICE OVER WEEK FIVE ............................................................................................................... -90-
FIGURE 3.10: JAG PRICE OVER WEEK SEVEN ............................................................................................................. -95-
FIGURE 3.11: AMD PRICE OVER WEEK SEVEN ........................................................................................................... -96-
FIGURE 3.12: TOTAL LIQUID ASSETS OVER THE SIMULATION TIME ............................................................................ -99-
FIGURE 3.13: JAG VS S&P 500 ............................................................................................................................... -100-
FIGURE 3.14: AMD VS. S&P 500 ............................................................................................................................ -101-
FIGURE 3.15: FSYS VS. S&P 500 ............................................................................................................................. 102-
FIGURE 3.16: BP VS. S&P 500 ................................................................................................................................. -103-
FIGURE 5.1: OPTION LONG STRADLE, CALL OPTION AND PUT OPTION RESULTS VS UNDERLYING STOCK PRICE ... -130-
FIGURE 5.2: GBX VS. DOW JONES INDUSTRIALS AND S&P 500 INDICES ................................................................ -137-
FIGURE 5.3: NRG VS. DOW JONES INDUSTRIALS AND S&P 500 INDICES ................................................................ -138-
FIGURE 5.4: YUM PERFORMANCE AROUND YUM EARNINGS ANNOUNCEMENT COMPARED TO S&P500
PERFORMANCE ............................................................................................................................................... -142-
FIGURE 5.5: MAR PERFORMANCE AROUND MAR EARNINGS ANNOUNCEMENT COMPARED TO S&P500
PERFORMANCE ............................................................................................................................................... -143-
FIGURE 5.6: WELLS FARGO & COMPANY, INTERNATIONAL BUSINESS MACHINES CORP., CITIGROUP, INC., AND
HASBRO INC. STOCK PRICES BETWEEN OCTOBER 11TH AND OCTOBER 19TH ................................................. -146-

6
FIGURE 5.7: CAPITAL ONE FINANCIAL STOCK PRICE FROM OCTOBER 18TH TO OCTOBER 25TH ............................. -149-
FIGURE 5.8: AT&T STOCK PRICE BETWEEN OCTOBER 17TH AND OCTOBER 24TH .................................................. -150-
FIGURE 5.9: QUEST DIAGNOSTICS STOCK PRICE FROM OCTOBER 18TH TO OCTOBER 28TH .................................... -151-
FIGURE 5.10: DOW JONES INDUSTRIAL VS. WEYERHAEUSER COMPANY AND CHEVRON CORPORATION FROM OCTOBER
26TH TO OCTOBER 28TH ................................................................................................................................. -154-
FIGURE 5.11: WHIRLPOOL INCORPORATED STOCK PRICE DURING THE WEEK OF OCTOBER 24TH ........................... -155-
FIGURE 5.12: VENTAS, INCORPORATED VS. S&P500 PERFORMANCE FOR WEEK OF OCTOBER 31ST
........................ -159-
FIGURE 5.13: WARNER CHILCOTT VS. ULTRA PETROLEUM CORPORATION PERFORMANCE FOR WEEK OF OCTOBER 31ST
....................................................................................................................................................................... -160-
FIGURE 5.14: PERFORMANCE OF WALT DISNEY COMPANY VS. NVIDIA CORPORATION VS. S&P500 FOR PREVIOUS
WEEK ............................................................................................................................................................. -163-
FIGURE 5.15: PERFORMANCE OF NVIDIA CORPORATION VS. MOLYCORP, INC. VS. S&P500 FROM NOVEMBER 8TH
TO
NOVEMBER 10TH
............................................................................................................................................. -164-

7
List of Tables
TABLE 2.1: HOW I DIVIDED UP MY STOCKS ............................................................................................................. -27-
TABLE 2.2: TABLE OF RESULTS FOR WEEK 1 ............................................................................................................ -31-
TABLE 2.3: TABLE OF RESULTS FOR WEEK 2 ............................................................................................................ -35-
TABLE 2.4: TABLE OF RESULTS FOR WEEK 3 ............................................................................................................ -38-
TABLE 2.5: TABLE OF RESULTS FOR WEEK 4 ............................................................................................................ -41-
TABLE 2.6: TABLE OF RESULTS FOR WEEK 5 ............................................................................................................ -44-
TABLE 2.7: TABLE OF RESULTS FOR WEEK 6 ............................................................................................................ -47-
TABLE 2.8: TABLE OF RESULTS FOR WEEK 7 ........................................................................................................... -51-
TABLE 3.1: TRANSACTIONS FOR 9/26 ........................................................................................................................ -67-
TABLE 3.2: TRANSACTIONS FOR 9/27 ........................................................................................................................ -68-
TABLE 3.3: TRANSACTIONS FOR 9/28 ........................................................................................................................ -69-
TABLE 3.4: TRANSACTIONS FOR 9/29 ........................................................................................................................ -71-
TABLE 3.5: TRANSACTIONS FOR 9/30 ........................................................................................................................ -72-
TABLE 3.6: TRANSACTIONS FOR 10/3 ........................................................................................................................ -74-
TABLE 3.7: TRANSACTIONS FOR 10/4 ........................................................................................................................ -75-
TABLE 3.8: TRANSACTIONS FOR 10/5 ........................................................................................................................ -76-
TABLE 3.9: TRANSACTIONS FOR 10/6 ........................................................................................................................ -77-
TABLE 3.10: TRANSACTIONS FOR 10/7 ...................................................................................................................... -79-
TABLE 3.11: TRANSACTIONS FOR 10/10 .................................................................................................................... -81-
TABLE 3.12: TRANSACTIONS FOR 10/11 .................................................................................................................... -82-
TABLE 3.13: TRANSACTIONS FOR 10/12 .................................................................................................................... -82-
TABLE 3.14: TRANSACTIONS FOR 10/13 .................................................................................................................... -83-
TABLE 3.15: TRANSACTIONS FOR 10/14 .................................................................................................................... -84-
TABLE 3.16: TRANSACTIONS FOR 10/17 .................................................................................................................... -88-
TABLE 3.17: TRANSACTIONS FOR 10/18 .................................................................................................................... -88-
TABLE 3.18: TRANSACTIONS FOR 10/19 .................................................................................................................... -89-
TABLE 3.19: TRANSACTIONS FOR 10/25 .................................................................................................................... -91-
TABLE 3.20: TRANSACTIONS FOR 10/27 .................................................................................................................... -92-
TABLE 3.21: TRANSACTIONS FOR 10/28 .................................................................................................................... -92-
TABLE 3.22: TRANSACTIONS FOR 11/1 ...................................................................................................................... -93-
TABLE 3.23: TRANSACTIONS FOR 11/2 ...................................................................................................................... -93-
TABLE 3.24: TRANSACTIONS FOR 11/3 ...................................................................................................................... -94-
TABLE 3.25: TRANSACTIONS FOR 11/8 ..................................................................................................................... -96-
TABLE 3.26: TRANSACTIONS FOR 11/9 ...................................................................................................................... -97-
TABLE 3.27: TRANSACTIONS FOR 11/10 .................................................................................................................... -97-
TABLE 3.28: TRANSACTIONS FOR 11/11 .................................................................................................................... -98-
TABLE 4.1: TRANSACTION RECORD FOR WEEK 1. ................................................................................................... -110-
TABLE 4.2: TRANSACTION RECORD FOR WEEK 2. ................................................................................................... -114-
TABLE 4.3: TRANSACTION RECORD FOR WEEK 3. ................................................................................................... -116-
TABLE 4.4: TRANSACTION RECORD FOR WEEK 4. ................................................................................................... -118-

8
TABLE 4.5: TRANSACTION RECORD FOR WEEK 5. ................................................................................................... -120-
TABLE 4.6: TRANSACTION RECORD FOR WEEK 6. ................................................................................................... -122-
TABLE 4.7: TRANSACTION RECORD FOR WEEK 7. ................................................................................................... -124-
TABLE 5.1: RESULTS FROM WEEK 1 OF TRADING .................................................................................................... -135-
TABLE 5.2: RESULTS FROM WEEK 2 OF TRADING .................................................................................................... -144-
TABLE 5.3: RESULTS FROM WEEKS 3 AND 4 OF TRADING ....................................................................................... -156-
TABLE 5.4: RESULTS FROM WEEK 5 OF TRADING .................................................................................................... -157-
TABLE 5.5: RESULTS FROM WEEK 6 OF TRADING .................................................................................................... -161-
TABLE 5.6: RESULTS FROM WEEK 7 OF TRADING .................................................................................................... -165-

9
1. Introduction
The purpose of our Interactive Qualifying Project (IQP) is to research and analyze
various trading strategies and their effectiveness. We will specifically focus on analyzing a long-
term buy-and-hold portfolio, a portfolio designed to play against the market, a highly leveraged
day-traded portfolio, and an options portfolio designed to take advantage of hypothesized
increased volatility before earnings announcement days.
1.1 Objectives of the Project
Our main goals are to learn market trading strategies, evaluate causes of market
fluctuations, analyze past performance of portfolios, practice predicting market/individual stock
behavior, and determine which strategies tend to be more profitable. The point of this project
isn’t to just make money, earn a profit, be in the green or however you choose to say it – this is a
learning experience for us to experiment in stock trading in the safety of a simulation, rather than
risking real capital. At the end we will be able to come to the table with a conclusion not saying,
“this is how to make money,” but rather, this is what we did, this is what happened and most
importantly, why.
1.2 What is the Stock Market?
While most people have a basic concept of the stock market, not all people truly know
what the market actually is or how it works. The stock market is in fact an actual market, much
like popular internet marketplaces, such as EBay. In the stock market, instead of trading physical
items, people buy and sell partial ownership of companies. Instead of walking through the aisles

10
of this market to make transactions, most trading in the stock market is done over the internet or
over a phone through a broker.
Unlike other types of markets, where goods are simply for sale in large supply, stock
always has ownership, and only a finite amount of stock exists for each company, though a
company can change this amount by buying back or selling more of its stock. There does not
exist a large amount of surplus stocks in case an investor would like to purchase more than exists
to be traded. In other words, it is important to emphasize that to trade stocks an investor cannot
buy any amount of stock unless another party is looking to sell an equal amount, though for large
cap stocks, because of the high liquidity from high volume trading, this is rarely a problem for
investors. In the case of privately owned companies, the stock does not trade very often at all,
and trades are often only with the company itself, thus changing the overall amount of stock the
company has on the market.
Another way the stock market differs from a traditional market is in the ability of an
individual to be physically present to trade on the market floor. For reference, although it is free
to any individual to walk into a supermarket and purchase goods, the cost of a seat on the New
York Stock Exchange (NYSE) reached $4 million in December of 2005. A seat on the NYSE
enables the seat-holder to trade securities on the floor, through either physical hand signals
(nowadays less commonplace) or terminals. These seats may be owned by individuals, but are
typically owned by companies, which are known as member firms. Since 1953 the number of
seats available has remained at 1,366 [44].
The broker is the stock market equivalent of the bookie at the race track. A broker
facilitates the transaction between two parties, one buying and one selling, without ever

11
purchasing stocks personally. A broker or brokerage firm makes a profit by taking a fee for each
transaction facilitated.
Just as a food market has a physical location, each stock market has a physical trading
floor, e.g. The NYSE is located at 11 Wall St. in New York City.
While an individual technically owns a portion of the company, in which he or she owns
stock, the actual control of the company is limited to a near negligible vote in the board of
directors’ election. The exception to this is major shareholders in the company, who have a
significant say.
1.3 Outline of the Project
Our plan is for each of us to research our individual strategies for trading, and use our
research to try and learn more about trading on the stock market through simulation. Over the
course of a seven-week period, we will be using these strategies in four different simulations to
study different trading strategies and their relative effectiveness. The trading methods used will
be: a long term buy-and-hold, market shorting, leveraged ETFS, and long option straddles prior
to earnings announcements. This diversity of trading strategies will allow us to accomplish a
solid trading method comparison for our relatively short-term simulation.
For the actual simulations, we will be using a virtual trading program called Interactive
Brokers, which will allow us to keep track of our stock trades and our overall trading
performance. During the course of this simulation we will be writing weekly updates of the
stock performance and our interpretation of the results. For instance, the buy-and-hold simulation
trader will explain the week-to-week movements of each stock in the portfolio and predictions

12
for future movement. After our seven-week trading period, we will analyze the performance of
each portfolio and the method used, and their effectiveness of the method in relation to the
others. Interactive Brokers is a trading platform generally used by brokers and high net-value or
very experienced individuals and thus has a slightly lower trading commission than most online
brokerage firms, so for the purposes of our project we will be using the $1 commission per what
Interactive Brokers charges.
While we obviously would prefer to show a profit at the end of the seven-week trading
period, a more important inter-market comparison will be our performance versus a market-
representative index such as the S&P 500. This strategy of “beating the market” is often a
sufficient goal of traders, despite possible losses in a bear market. The other important goal in
our project is, in the case of a successful portfolio, determine what the strengths of the portfolio
were that made it successful and if there were any flaws that hindered additional positive
performance; and in the case of an unsuccessful portfolio, determine what the weaknesses of the
portfolio were that lead to its poor performance, and whether any part of the strategy still has
merit despite its performance.

13
2. Simulation A: Buy-and-Hold
For this simulation I will be observing what happens with stocks over a longer period of
time compared to other simulations. Throughout the weeks of simulation, I will hold the same
stocks and for a period of time and watch the trend in price for those stocks. I will divide up my
money between seven different stocks in three different categories and observe what happens
with the market.
2.1 Introduction and Background
For the method of buy-and-hold there needs to be more background research than with
other strategies, in order to see trends not just in the short-term, but over months in order to see
the general direction the stock is moving. Even though this simulation is only seven weeks, it
will give a general idea of long term trading trends with this type of portfolio. While many
traders believe that long term holding is not the way trading should be done, our group is
interested in comparing this method to ones that are more complicated and involve more rapid
trading to see if profits are still made.
Long term holding is a common method used by many people. A great deal of people buy
into the stock market but, as they do not know much about investing, simply hold their stocks
until they’re ready to retire. One of the reasons is because some companies give their employees
a reduced rate on stock so the employees buy it but then almost forget about it. In some cases
when companies are new and beginning to do well it is good to hold the stock for a longer time
but for stocks in companies with uncertain futures it is not a good idea. The goal of a long term
hold portfolio is to find a stock that will retain its value or increase over time, which can be hard
to predict.

14
2.2 Portfolio Strategy and Research
For this section of the simulation I will be buying shares of stock at the beginning of the
simulation and holding them until the end of the simulation which is when I will sell them. In
order to try to pick the best stocks much background research is needed to ensure success.
2.2.1 Trading Strategy
When looking for long term stocks, one thing that is good to look at is the idea of
dividends. Dividends are usually a quarterly payout that is given to stockholders who have the
stock roughly a month in advance. This payout is a way to let the investors receive part of the
companies’ profits as well. Even if a stock is going down or fluctuating a lot the buyer could still
make money off of dividends. For many stocks, the date that a stock must be purchased in order
to receive a dividend for that quarter has passed. Due to that, when deciding what stocks to
purchase for this simulation, I will decide if any dividend stock left look promising and worth the
dividend or whether I should purchase others instead.
Another thing to look into with long term holding is whether the stock is a growth stock.
A growth stock is stock in a company that is usually newer to the business but is already doing
very well. If a stock is doing well right from the beginning it is predicted that the stock will
continue to do even better as the company grows. When looking at companies I will also look for
growth stocks.
2.2.2 Portfolio Selection Criteria
When looking into long term stocks another thing that needs to be considered is world
events. If there is a war over oil, buying stocks in oil companies would not be a good decision.
This time of year is one that is very prone to hurricanes and after hurricane Irene just hit New

15
York and Vermont very badly, looking into stocks for stores such as Home Depot or construction
companies may be a good choice. This is will be very important in deciding the stock and will be
discussed more in depth when looking at a finalized list of what stocks I will be purchasing for
this simulation.
When looking at stocks to be held over a longer period of time, it is important to not just
buy and see what happens but also to have a plan and reasons behind the stocks chosen. For this
project looking at overall trends for the stock will be important but looking into events in the
news also is. The idea of dividends will play a role in my decision making but may not work for
the types of stocks I feel will do best for this simulation.
2.2.3 Companies Selected
For actually picking the stocks for my simulation I did research into many trends of
stocks right now. I tried to look for ones which seemed to be going upward steadily instead of
just having a recent peak. I tried to pick stocks within the same category so I could have
competitors with hope that at least one will do well enough for me to profit. I also looked into
recent news stories in order to pick those categories better for the time in which we will be doing
the simulation. I ended up picking seven different stocks from three different categories. Those
categories are internet search companies, oil companies, and construction related companies. I
gravitated towards those stock categories through recent events in the news and the time of year
and further narrowed down my search within the categories by recent trends in the market.
Although the idea of dividends was considered with my stock options, I found it was better in
this case to just pick without looking at whether or not it had a dividend because of the limited
amount of dividend stocks available at this time.
16
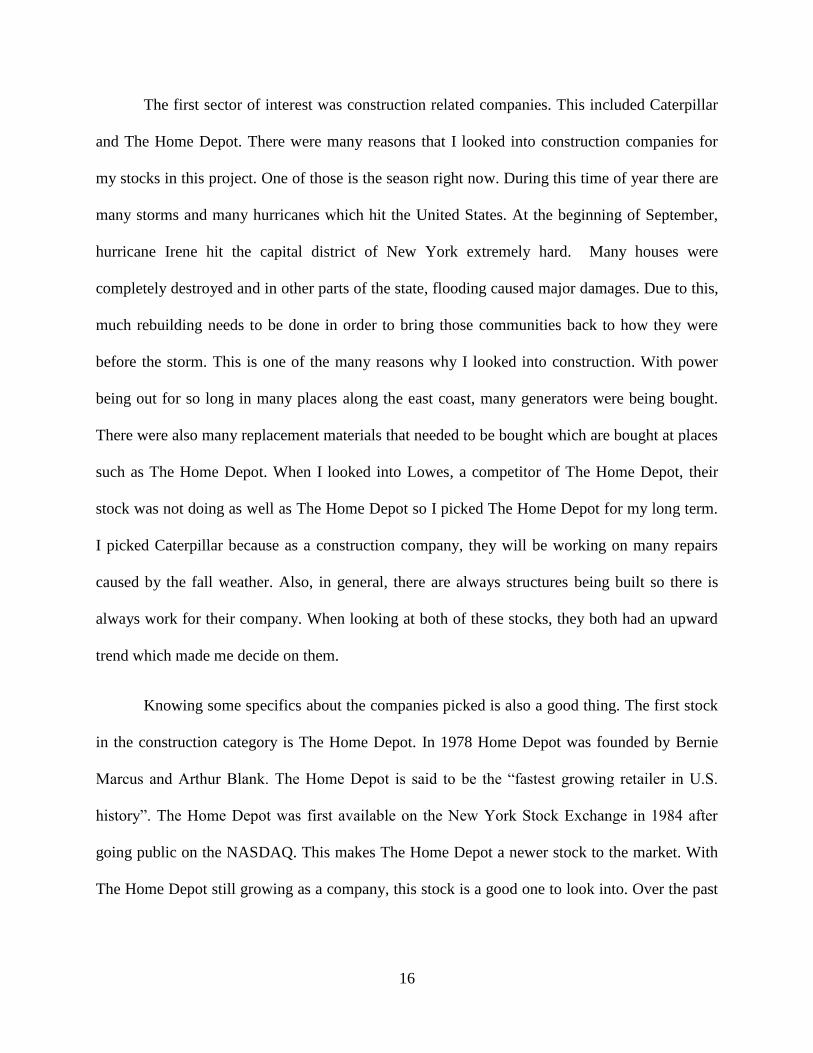
The first sector of interest was construction related companies. This included Caterpillar
and The Home Depot. There were many reasons that I looked into construction companies for
my stocks in this project. One of those is the season right now. During this time of year there are
many storms and many hurricanes which hit the United States. At the beginning of September,
hurricane Irene hit the capital district of New York extremely hard. Many houses were
completely destroyed and in other parts of the state, flooding caused major damages. Due to this,
much rebuilding needs to be done in order to bring those communities back to how they were
before the storm. This is one of the many reasons why I looked into construction. With power
being out for so long in many places along the east coast, many generators were being bought.
There were also many replacement materials that needed to be bought which are bought at places
such as The Home Depot. When I looked into Lowes, a competitor of The Home Depot, their
stock was not doing as well as The Home Depot so I picked The Home Depot for my long term.
I picked Caterpillar because as a construction company, they will be working on many repairs
caused by the fall weather. Also, in general, there are always structures being built so there is
always work for their company. When looking at both of these stocks, they both had an upward
trend which made me decide on them.
Knowing some specifics about the companies picked is also a good thing. The first stock
in the construction category is The Home Depot. In 1978 Home Depot was founded by Bernie
Marcus and Arthur Blank. The Home Depot is said to be the “fastest growing retailer in U.S.
history”. The Home Depot was first available on the New York Stock Exchange in 1984 after
going public on the NASDAQ. This makes The Home Depot a newer stock to the market. With
The Home Depot still growing as a company, this stock is a good one to look into. Over the past

17
couple years they have open location in Mexico and China buy buying other companies making
them now an international company [43].
The CEO of The Home Depot right now is Frank Blake. He was appointed in 2007 after
holding positions of vice chairman of the board of directions, and executive vice president of the
company. He also had prior leadership experience by the time he became CEO due to being an
executive vice president starting in 2002. In this job, Frank Blake had a great deal of
responsibilities including corporate operations. With all of this experience Frank Blake has made
a good CEO and with his leadership and the recent increase of sales I feel that The Home Depot
will be a good choice for my stock [43].
Figure 2.1. The Home Depot stock over the past month
My other choice for a construction related company was Caterpillar Inc. Caterpillar is
known for their construction equipment along with mining equipment. They also make diesel

18
and natural gas engines, industrial gas turbines, and diesel-electric locomotives. Not only are
they involved with the actual equipment, they also are involved with services such as finance,
remanufacturing, logistics, and progress rail services. With all of the construction going on in
the United States and also across the world, Caterpillar is doing very well. Right now the
company is installing a rail line through Saudi Arabia’s Nafud Desert [4].
Caterpillar is older than The Home Depot and has been around for over 85 years,
demonstrating that it can last on the market. Their sales last year (2010) were $45.588 billion.
The CEO of the company and also the chairman of the company is Douglas R. Oberhelman. He
has held many positions in the company since joining in 1975. He was a senior finance
representative in South America, which makes having him in charge a positive thing from a
financial standpoint. He was also the chief financial officer from 1995 to 1998 while also holding
the vice president position. Having Douglas R. Oberhelman as the CEO of Caterpillar Inc is
good for the company, and makes me believe that buying stock in them is a good choice [4].
Figure 2.2. Caterpillar stock over the past month

19
One of the other categories that I chose for my stocks was oil. The two companies that I
was going to pick were BP and ExxonMobil. The reason that I looked into oil was the time of
year. The weather in the United States is becoming colder which usually causes sales of heating
oil to go up. It is predicted at the moment that oil prices will remain about the same for the rest of
the calendar year, which will hopefully make the market for oil prices stable. When looking in
general at the oil market right now, it appears to be climbing. I am hoping that it will remain this
way in order to increase my profits. I also am interested in watching the trends of oil market
prices, due to these reasons I chose to buy two stocks in the oil industry. I ended up deciding
near the end of the week that BP would not be as good of a choice as I first thought due to recent
news events so I am now going with ATP Oil & Gas.
The first oil stock I chose is ExxonMobil. As one of the leaders in the oil business I felt it
would be interesting to look into them. When looking at their stock they appeared to be steadily
going up so appeared to be a good choice for this simulation. ExxonMobil has been around for
over 125 years showing that it has survived many hard economic times. With ExxonMobil being
now made up of ten separate companies, I feel that they are a safe investment choice. The CEO
of ExxonMobil is Rex W. Tillerson. He joined ExxonMobil in 1975 as a production engineer for
the company. He moved up through the ranks of the company becoming a general manager,
production advisor, and president of many divisions. In 1999 Rex Tillerson became the Senior
Vice President of the development company and in 2001, the president of the corporation. In
2006 he became the CEO of the company. With his many years of experience within the
company, he seems to be a stable leader. Since he has been CEO for many years, his leadership
should not affect the stock negatively. I feel ExxonMobil will be a good choice for the
simulation [36].
20
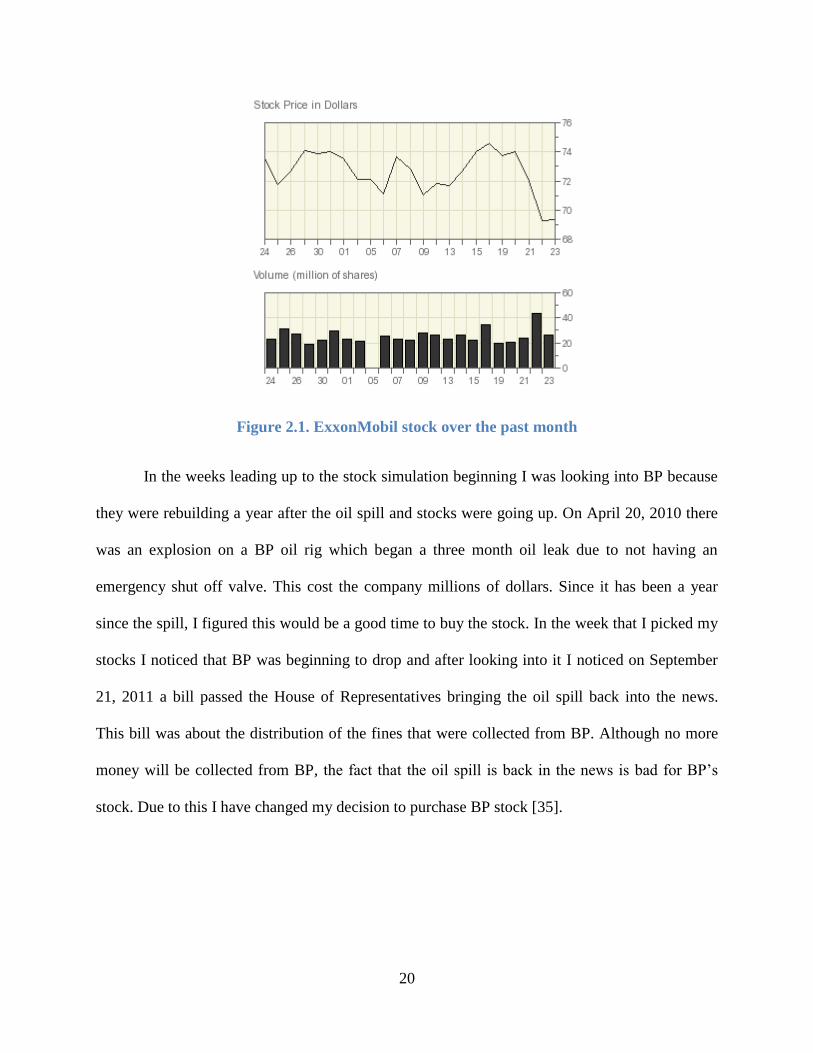
Figure 2.1. ExxonMobil stock over the past month
In the weeks leading up to the stock simulation beginning I was looking into BP because
they were rebuilding a year after the oil spill and stocks were going up. On April 20, 2010 there
was an explosion on a BP oil rig which began a three month oil leak due to not having an
emergency shut off valve. This cost the company millions of dollars. Since it has been a year
since the spill, I figured this would be a good time to buy the stock. In the week that I picked my
stocks I noticed that BP was beginning to drop and after looking into it I noticed on September
21, 2011 a bill passed the House of Representatives bringing the oil spill back into the news.
This bill was about the distribution of the fines that were collected from BP. Although no more
money will be collected from BP, the fact that the oil spill is back in the news is bad for BP’s
stock. Due to this I have changed my decision to purchase BP stock [35].

21
Figure 2.2. BP stock over the past month
My second oil company after deciding not to use BP was ATP Oil & Gas. I looked at
them because their stock dipped recently but it is now going back up again. ATP works with
natural gas and oil in the Mediterranean Sea, the Gulf of Mexico, and the North Sea. It was
founded in 1991. Since then, the company has a 98% success rate with their projects which is a
good outlook for the company. The CEO of ATP is T. Paul Bulmahn and the company is located
in Houston, Texas [3].

22
Figure 2.3. ATP Oil & Gas stock over the past month
My last category of stocks were different internet search engines. The three I looked into
were Google, Yahoo, and Bing, which is owned by Microsoft. The reason I looked into this
category is because I noticed how many business moves Google has been making and looked
into their stocks. Although they dropped a bit in recent history, since the end of August they had
been doing well. I decided it would be good to look into other search engine companies so I
decided on Yahoo and Microsoft. Microsoft interested me anyway due to their new products and
I picked Yahoo because their stock was going up and because it was a good third party to look at.
Looking to technology companies for stocks to purchase can greatly pay off when they come out
with new improved products. When looking into Microsoft I considered Apple but due to the
declining health of Apple CEO Steve Jobs I chose not to use them.
The first of my companies for technology and search engines is Google. One of the first
things that I noticed about Google stock was that it was extremely expensive. While all of the
other stocks I’m looking into are less than $100 per share, Google as of September 22, 2011 is
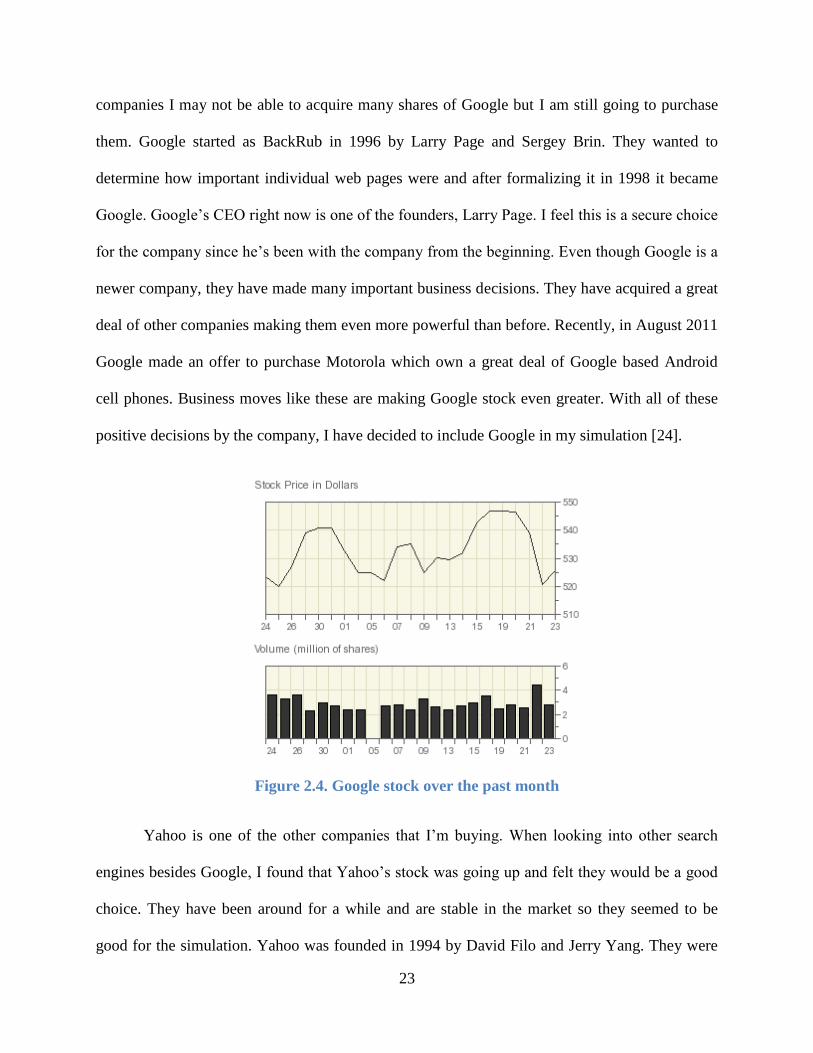
$520.66 per share. Since I am thinking of splitting my stock money evenly between all of the
23
companies I may not be able to acquire many shares of Google but I am still going to purchase
them. Google started as BackRub in 1996 by Larry Page and Sergey Brin. They wanted to
determine how important individual web pages were and after formalizing it in 1998 it became
Google. Google’s CEO right now is one of the founders, Larry Page. I feel this is a secure choice
for the company since he’s been with the company from the beginning. Even though Google is a
newer company, they have made many important business decisions. They have acquired a great
deal of other companies making them even more powerful than before. Recently, in August 2011
Google made an offer to purchase Motorola which own a great deal of Google based Android
cell phones. Business moves like these are making Google stock even greater. With all of these
positive decisions by the company, I have decided to include Google in my simulation [24].
Figure 2.4. Google stock over the past month
Yahoo is one of the other companies that I’m buying. When looking into other search
engines besides Google, I found that Yahoo’s stock was going up and felt they would be a good
choice. They have been around for a while and are stable in the market so they seemed to be
good for the simulation. Yahoo was founded in 1994 by David Filo and Jerry Yang. They were

24
PhD candidates at Stanford and wanted a way to keep track of their internet interests. Since then,
the company has made a search engine which makes it easier for people to find things that they
were looking for on the internet. Yahoo wants people to be able to connect with other people
over the internet and be able to learn more about topics of interest and connect over them. The
company has expanded to having employees in 25 different countries with the headquarters in
Sunnyvale, California. On September 6, 2011, there was a CEO change in the company
(Overview). Former CEO, Carol Bartz was fired after months of talk of such a move. The intern
CEO right now is Tim Morse. This could be a risky time to buy the stock but it seems like the
public approves of this change in power in Yahoo. Hopefully this decision pays off for the stock
prices [31].
Figure 2.5. Yahoo stock over the past month
The last company I looked into was Microsoft. I was thinking of different search engines
and I picked Bing as one to look into. Bing is owned by Microsoft and with all of the
developments that Microsoft has, I felt they would be a good choice. Microsoft was founded by

25
Bill Gates and Paul Allen in 1975. Since then, the company has grown exponentially with their
introduction and refinement of the Windows operating system. Microsoft’s leading competitor is
Apple but with the leadership of Apple, Steve Jobs, having health issues, the future is much more
stable for Microsoft. The CEO for Microsoft is Steve Ballmer. Steve Ballmer joined Microsoft in
1980 so his history with the company makes him a good CEO choice [27].
Figure 2.6. Microsoft stock over the past month
As I progress with this simulation, I will be tracking what happens with both the prices of
the stocks and the companies themselves. With the long term holding method I feel that it is
important to know the history of the company and know the trends of the stocks. As the
simulation progresses, I will watch the news and the stocks to analyze why the stocks are
changing.

26
2.3 Transactions
Week 1
September 26, 2011
Today we began the simulation part of our project. Since I am doing the long term
holding portion of the simulation, I put in the orders for my stocks before the market opened
through Interactive Brokers so I would get them purchased soon after opening. When calculating
my allowable money to spend on stocks, I used the closing prices from Friday September 23,
2011 in order to divide up my $25,000 between my 7 stocks. I divided it so I could spend
$3571.43 on each stock. When I figured this out I added up the leftover money and was able to
purchase another share of Google. Although I calculated the costs with the closing prices, it takes
some time for the transactions to go through so I ended up going over my budget by a bit and
spent $25,173.85 on my stocks. Although I did go a little over, it was about the budget we each
had individually. I ended up purchasing seven shares of Google for $527.84 each, 142 shares of
Microsoft for $25.25 each, 242 shares of Yahoo for $14.60 each, 51 shares of ExxonMobil for
$70 each, 105 shares of The Home Depot for $33.75 each, 48 shares of Caterpillar for $74.82
each, and 384 shares of ATP Oil & Gas for $9.45 each. Each order had a transaction fee of $1 so
I spent $7 in fees on the orders as well. After placing these orders, now I just have to monitor the
market and see what my profits are at the end of each day. Although I cannot sell my stocks until
the last day of the simulation, keeping track of what happens each day will help me to better
understand the trends in the market.
27
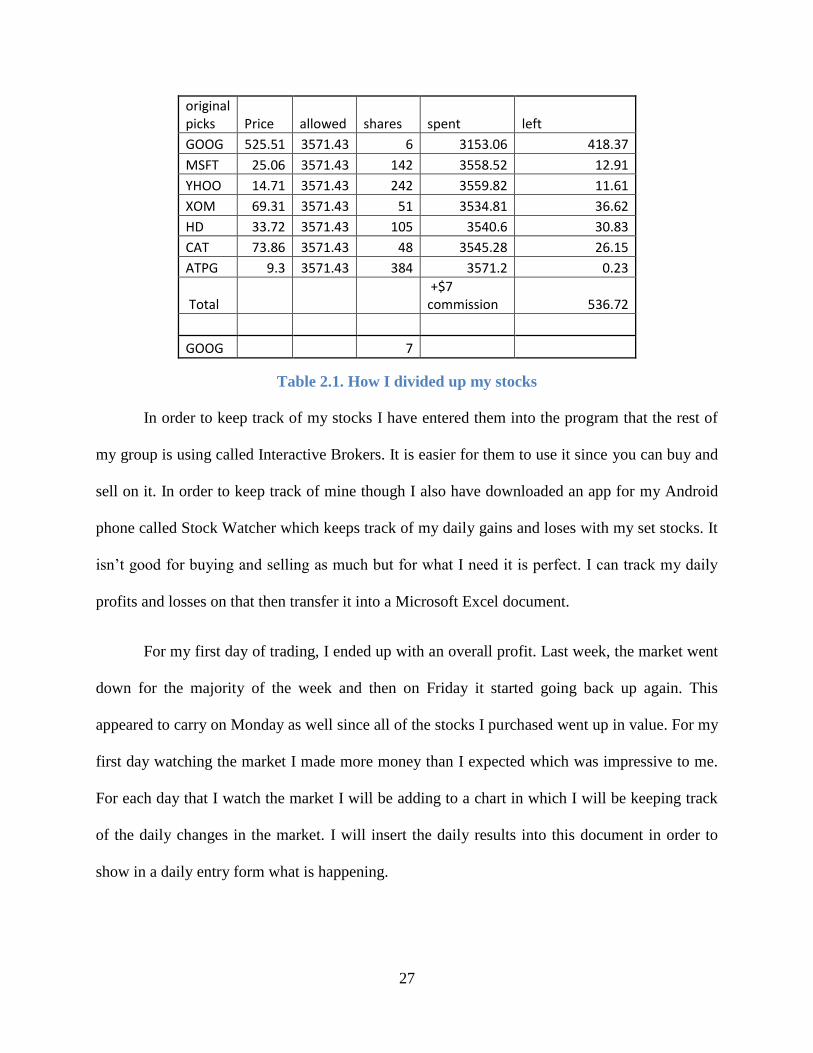
original picks Price allowed shares spent left
GOOG 525.51 3571.43 6 3153.06 418.37
MSFT 25.06 3571.43 142 3558.52 12.91
YHOO 14.71 3571.43 242 3559.82 11.61
XOM 69.31 3571.43 51 3534.81 36.62
HD 33.72 3571.43 105 3540.6 30.83
CAT 73.86 3571.43 48 3545.28 26.15
ATPG 9.3 3571.43 384 3571.2 0.23
Total +$7 commission 536.72
GOOG 7
Table 2.1. How I divided up my stocks
In order to keep track of my stocks I have entered them into the program that the rest of
my group is using called Interactive Brokers. It is easier for them to use it since you can buy and
sell on it. In order to keep track of mine though I also have downloaded an app for my Android
phone called Stock Watcher which keeps track of my daily gains and loses with my set stocks. It
isn’t good for buying and selling as much but for what I need it is perfect. I can track my daily
profits and losses on that then transfer it into a Microsoft Excel document.
For my first day of trading, I ended up with an overall profit. Last week, the market went
down for the majority of the week and then on Friday it started going back up again. This
appeared to carry on Monday as well since all of the stocks I purchased went up in value. For my
first day watching the market I made more money than I expected which was impressive to me.
For each day that I watch the market I will be adding to a chart in which I will be keeping track
of the daily changes in the market. I will insert the daily results into this document in order to
show in a daily entry form what is happening.

28
In summary for my first day I ended up making $345.80 on the market. The difference
between my simulation and of the others in this project is that I don’t sell every day, so those
profits are only theoretical. I still have many weeks of leaving my money in the market so in the
end I will see what my final profits turned out to be.
Tuesday September 27, 2011
Today was my second day trading on the market. Like the first day, stocks were
continuing to climb. Although I am just holding for the entire simulation I do monitor the stocks
throughout the day. At one point I had almost $1000 in asset profits and although I ended the day
with and overall asset profit of $613.16, it was very interesting to watch how much the market
moves throughout the day. Although my method doesn’t involve doing much with the market it
makes it easy to watch trends and learn how to understand the market better.
After the market went down for four days last week I expected that it would go up again
today and I was correct in assuming that. Although some stocks did fluctuate during the day
making my asset profits larger, at the closing I had five out of my seven stocks go up while two
went down. The two that went down were Yahoo and The Home Depot. When looking into
events in the news there was no clear reason why those two went down, so I assumed that the
market was going to even out again after the big drop, and subsequent big rise in prices. Based
on this assumption I feel that tomorrow the market might drop a little more but I will have to see
what that looks like.
Wednesday September 28, 2011
Today was a bad day overall for the market. Although some of my group members enjoy
days in which the market goes down, for example the shorting portfolio, I do not. I know that

29
there will be days in which the market goes down but it still is frustrating to watch knowing that
I cannot sell until the last simulation day. The past couple days I have been watching my group
members making their profits for the day but then are able to keep those profits unless they want
to risk them in the market again. With my daily profits, they mean nothing because I could lose
them all the next day. This is what happened today for my long term holdings. When I checked
the market during the day most of my stocks were going down and a few remained going up but
by closing they had all gone down below the value at which I bought them so I now have less
money than I began with.
I was curious as to why the market was going down so much that day so I looked up
some information about world news in order to better understand why the market did what it did
today. When researching I found that the reason it went down was due to the European debt
crisis. Overall the Dow Jones Industrial Average fell 1.61% today because investors were getting
worried about the handling of the debt. Today Finland voted to approve changes to the bailout
fund for the euro-zone. Tomorrow I expect this to affect the market again when Germany votes
on the changes. By tracking world events around the stock market I can better understand the
trends [8].
Thursday September 29, 2011
Today was another bad day for the market with more talks of the debt crisis in Europe.
Although the market wasn’t affected as badly as yesterday, it was still a bad day for my stocks. I
had four of my stocks continue to go down while three of them climbed up slowly. Sadly the
amount they went down was still more than the increase from the rising stocks was, so I was still
losing money overall. Just today alone I lost $320.57 so my overall loss is $405.90. Hopefully
with more voting in the European nations going on today, this will put investors at ease and the

30
market will climb up again tomorrow for next week. It’s very interesting to learn how events
worldwide affect the whole stock market. With each day on the market I’m learning more about
how the stock market works.
Friday September 30, 2011
Today finished out my first week on the market. It was a very interesting week for me to
get into the market for the first time. While the week started out very well, by the end of the
week I was losing money. Today the market continued to go down due to the debt crisis. I also
learned that this was the worst quarter for the stock market since the first quarter of 2009 with
the Dow Jones Industrial Average dropping 2.16% on Friday and 12% for the quarter. Most of
this was due to the debt crisis in Europe and with the recessions in the U.S. and China. More
investors were worried about the stock market and invested more into the U.S. Treasury than the
market. They are now hoping that the fourth quarter will be better [30].
Due to all of this information, I am hoping to see an increase in the market next week.
With this optimistic view of events in the fourth quarter hopefully my stocks will go up with a
profit at the end of the simulation. In my first week of watching the market I have already
learned so much about how the market changes and how events in the world affect the prices on
the market.

31
shares bought cost closing 9/26 Asset Gain/Loss closing 9/27 Asset gain/loss
GOOG 7 527.84 3694.88 531.89 3723.23 539.34 3775.38
MSFT 142 25.25 3585.5 25.44 3612.48 25.67 3645.14
YHOO 242 14.68 3552.56 14.75 3569.5 14.54 3518.68
XOM 51 70 3570 71.72 3657.72 72.91 3718.41
HD 105 33.75 3543.75 34 3570 33.88 3557.4
CAT 48 74.82 3591.36 76.85 3688.8 77.67 3728.16
ATPG 384 9.45 3628.8 9.63 3697.92 10.01 3843.84
Total 7 (fee) 25519.65 25787.01
25173.85
daily profit 345.8 267.36
total profit 345.8 613.16
closing 9/28 Asset gain/loss closing 9/29 Asset gain/loss closing 9/30 Asset gain/loss
528.84 3701.88 527.5 3692.5 515.04 3605.28
25.575 3631.65 25.45 3613.9 24.89 3534.38
14.19 3433.98 13.42 3247.64 13.17 3187.14
72.07 3675.57 73.88 3767.88 72.63 3704.13
33.6 3528 33.79 3547.95 32.87 3451.35
75.08 3603.84 75.39 3618.72 73.84 3544.32
9.15 3513.6 8.54 3279.36 7.71 2960.64
25088.52 24767.95 23987.24
-698.49 -320.57 -780.71
-85.33 -405.9 -1186.61
Table 2.2. Table of results for week 1
Week 2
Monday October 3, 2011
Today was another down day for the market. As the first day of the fourth quarter I
expected stocks to begin going up again but I was wrong in my guess. It turned out that even
though the manufacturing activity in the U.S. went up today, this was overshadowed by the debt
in Greece. Over the weekend Greece said that its target for deficit would be missed. Investors

32
last week thought that the scare would be over this week leading to the market increasing again
but this was not the case. At one point today the Dow Jones Industrial Average was trading
below the lowest closing level of the year but then raised up a bit so it was still down 191 points
but not as extreme as earlier today.
When looking at my stocks I noticed that Yahoo was the only one of mine that went up
today and that was because Jack Ma who is the chief executive of the Chinese Internet company
named Alibaba Group said he was interested in buying the stock. I found it was interesting that
even the idea of this company being bought brought the stock up. Jack Ma never said that he
would buy for sure only that he was interested. This is a good trend to look out for in the market
[40].
Tuesday October 4, 2011
Today was an interesting day for the market. For the majority of the day when I checked
my stocks I noticed that most of them were going down. Then at the closing, I noticed that most
of them except ATP Oil & Gas were up. This was very good news for my portfolio since it has
been down for a while now. It turned out that in the last hour of trading, there was a report that
the European Union ministers are figuring out how to recapitalize the Continent’s banks. They
feel that Europe’s banks can withstand the debt crisis. Even with this good news, investors are
still worried about the situation in Greece. Luckily the good news for today caused the Dow
Jones Industrial Average to rise 153.41 points [41].
Wednesday October 5, 2011
Today the market got back on track for one of the first days since the simulation began.
With all of the talk of the debt crisis in Europe, investors have not been holding much hope in the

33
stock market but with that situation getting sorted out more, investors are buying again. Today
the Dow Jones Industrial Average gained 131.24 points. This was also helped by more jobs
being added this month than expected. This will be officially announced Friday [6].
Yahoo continued to go up today but for other reasons as well. It was reported that
Microsoft is considering a bid for the company. At the moment they are at their highest point in
three months. It seems that different people are making bids each day so that news of a potential
buyout is helping the company. The company is preparing to send financial information to their
potential buyers. Microsoft tried unsuccessfully to buy the company in 2008 [23].
Thursday October 6, 2011
Today was another good day for the market. Due to Europe’s attempts to control the debt,
the market has been steadily increasing over the past couple days. Even stocks that were doing
poorly lately due to the debt crisis ended up rising today. The European Central Bank decided to
keep the interest rate steady at 1.5% which helped both the market in Europe and here. For my
portfolio Yahoo and ExxonMobil still fell but only by cents instead of dollars [39].
Friday October 7, 2011
This is the end of my second week of trading. Today looked like it was going to be a
good day for the market but near closing almost all of my stocks fell. News came out today that
the United States has added more jobs to the economy but they aren’t keeping up with the pace
that the government was hoping for, in order to get the unemployment rate down further. This
news though didn’t seem to affect the market too heavily. The main reason for the drop today
was the situation with Spain and Italy. Both of these countries had debt downgrades today which

34
once again put investors in panic mode. This news made the euro go down in value which caused
the market to go down during closing. The government is trying to restore confidence in the
banks in those countries but it wasn’t enough for the market today.
For the second week of trading I am not doing too bad considering the situation going on
in Europe at the moment. I am hoping that while the simulation continues, the debt crisis in
Europe gets sorted out so I will end up with a profit. I find it very interesting to be monitoring
the market at a time such as this and I am being provided with a good experience, with the
market’s reaction to world events.

35
shares bought Cost closing 10/3
Asset gain/loss
closing 10/4
Asset gain/loss
GOOG 7 527.84 3694.88 495.52 3468.64 501.9 3513.3
MSFT 142 25.25 3585.5 24.53 3483.26 25.34 3598.28
YHOO 242 14.68 3552.56 13.35 3230.7 14.46 3499.32
XOM 51 70 3570 71.15 3628.65 72.83 3714.33
HD 105 33.75 3543.75 31.59 3316.95 32.47 3409.35
CAT 48 74.82 3591.36 70.55 3386.4 72.54 3481.92
ATPG 384 9.45 3628.8 6.65 2553.6 6.58 2526.72
Total 7 (fee) 23068.2 23743.22
25173.8
5
daily profit -919.04 675.02
total profit -2105.65 -1430.63
closing 10/5 Asset gain/loss closing 10/6 Asset gain/loss closing 10/7 Asset gain/loss
504.7 3532.9 514.71 3602.97 515.12 3605.84
25.89 3676.38 26.34 3740.28 26.25 3727.5
15.92 3852.64 15.65 3787.3 15.47 3743.74
73.95 3771.45 73.89 3768.39 73.56 3751.56
32.83 3447.15 33.38 3504.9 33.92 3561.6
74.26 3564.48 77.09 3700.32 75.52 3624.96
7.49 2876.16 8 3072 7.78 2987.52
24721.16 25176.16 25002.72
977.94 455 -173.44
-452.69 2.31 -171.13
Table 2.3. Table of results for week 2
Week 3
Monday October 10, 2011
Today is the beginning of the third week of the simulation. For the first day of trading
this week the market did extremely well. All of my stocks ended up going up today making me
end up with a profit if I sold today. The Dow Jones Industrial Average gained 329 points. This

36
increase was due to European leaders unveiling a plan which, it is claimed, will solve the debt
crisis in Europe by the end of the month. The plan developed by Angela Merkel and Nicolas
Sarkozy involves recapitalizing the European banks. The plan will be officially presented at the
G20 meeting on November 3 and 4. This helped to restore the investors’ confidence in the
market. The euro value went up along with oil and silver [47].
One of the stocks that has been constantly going up every day is Yahoo. This is due to
even more potential buyers of the company coming forward. It was reported that the founder of
Yahoo, Jerry Yang may organize a buyout of the company with different firms [46].
Tuesday October 11, 2011
Today was a mixed day for the market but for my stocks it was pretty good. All of my
stocks went up except for ExxonMobil which only went down one cent. Through most of the day
stocks went down but then changed at the end of the day when it was said by European leaders
that there will be a debt plan unveiled by the end of October. Tomorrow looks like it will be a
losing day for the market when after-hours news was released about Slovakia voting down the
bailout [37].
Wednesday October 12, 2011
Today was the third day of trading for the week and for the most part the market went up.
This was surprising news after hearing the in Slovakia, the lawmakers were holding up the euro
zone bailout expansion which stopped the efforts for the moment. This means that there will
have to be another vote but it is unknown at the time when that will happen. It is said that
Slovakia will vote yes in the next vote but just wants to work out their own problems first [38].

37
Thursday October 13, 2011 Today was a positive day for the market overall. The Dow Jones Industrial Average
ended up 102.55 points. Although three of my stocks went down today, it was only by a small
percentage each. This increase in the market was due to investors being more optimistic about
the banks in Europe being recapitalized. Even though stocks ended high, the last hour of trading
brought the profits down a little. Today was good overall for industrial stocks including one of
mine, Caterpillar which rose 1.3%. Today Blackberry stocks went down due to their service
problems which is probably why Google who has Android phones went up a great deal today [5].
Friday October 14, 2011
Today was a great day for the market. With the gains that the market made today, the
Dow Jones Industrial Average and the Nasdaq Composite are both in the green for this year. This
is also three weeks in a row of the Dow going up. Investors became optimistic that this weekend
there will be meetings about the crisis in Europe [11].
One of the leading stocks today was Google which I had picked as one of my stocks.
Google jumped $32.69 today to finish at $591.68 with a gain of 15%. Google reported strong
earnings after closing on Thursday which made the stock start off today on a high note. Soon
after opening when I checked I noticed that it had already jumped about $20 and only continued
to climb [30].

38
shares bought cost closing 10/10
Asset gain/loss
closing 10/11
Asset gain/loss
GOOG 7 527.84 3694.88 537.17 3760.19 543.18 3802.26
MSFT 142 25.25 3585.5 26.94 3825.48 27 3834
YHOO 242 14.68 3552.56 15.84 3833.28 15.86 3838.12
XOM 51 70 3570 76.28 3890.28 76.27 3889.77
HD 105 33.75 3543.75 34.66 3639.3 34.71 3644.55
CAT 48 74.82 3591.36 79.13 3798.24 80.66 3871.68
ATPG 384 9.45 3628.8 8.53 3275.52 8.59 3298.56
Total 7 (fee) 26022.29 26178.94
25173.8
5
daily profit 1019.57 156.65
total profit 848.44 1005.09
closing 10/12 Asset gain/loss closing 10/13 Asset gain/loss closing 10/14 Asset gain/loss
548.5 3839.5 558.99 3912.93 591.68 4141.76
26.96 3828.32 27.18 3859.56 27.27 3872.34
15.77 3816.34 15.93 3855.06 15.91 3850.22
77.16 3935.16 76.37 3894.87 78.11 3983.61
34.72 3645.6 34.41 3613.05 35.05 3680.25
81.7 3921.6 81.44 3909.12 84.09 4036.32
9.04 3471.36 9.17 3521.28 10.65 4089.6
26457.88 26565.87 27654.1
278.94 107.99 1088.23
1284.03 1392.02 2480.25
Table 2.4. Table of result for week 3
Week 4
Monday October 17, 2011
Today was a down day for the market. For the past two weeks stocks in general have had
an upward trend but today ended that trend. The Dow Jones Industrial Average fell 2.1% today.
39
This was due again to the European debt crisis. Europe said that they are far from a solution to
the debt crisis still and Germany gave a similar notice [7].
Although my stocks went down today I still have an overall profit at the moment which I
hope will hold out until the end of the simulation.
Tuesday October 18, 2011
Today was a good day for the stock market after there were reports that there will be an
increase in bailout money for Europe. This increase is said to be coming from Germany and
France. This caused the market to increase today. This helped after the large decrease in the
market yesterday. One of my stocks, Yahoo, went up because their earnings were higher than
expected even though they were down this quarter [48].
Wednesday October 19, 2011
Today for the most part, my stocks went down. The only one that went up was Yahoo
and that has been going up recently due to the talks of the company being bought out. It
continued to go up today when their earnings announcement came out which was low, but higher
than expected. Today’s drop in the market was due to the report given by the Federal Reserve
today which was more pessimistic about the economy than was hoped for. For most of the day
the market remained pretty even but then changed once it was announced that the economy
wasn’t doing very well. Investors are said to not be trading as much due to being nervous about
the U.S. economy and that of Europe [15].
Thursday October 20, 2011
Today was an interesting day to be watching the market. Stocks were moving up and
down constantly with the end result having my stocks move only a few cents each. This trend

40
was attributed to the debt crisis again due to different stories coming out of Europe. In the
afternoon it was said that European leaders were going to have a plan for the bailout plan by next
Wednesday. That morning it was said that there were disagreements over how to give out the
bailout money [12].
One of my stocks, Microsoft was in the news today after falling during the day. After the
market closed Microsoft reported their earnings for the quarter which caused the stock to
continue to drop after hours [9].
Friday October 21, 2011
Although today wasn’t an especially good day for Microsoft in the market, their earnings
announcement might make the stock go up for Monday’s opening. Microsoft had a profit
increase of 6.1% in the third quarter. This was mostly due to the sales of Microsoft Office
continuing to increase [25].
Today stocks rose and one of the reasons was the death of Moammar Gadhafi, making
investors in the United States and overseas pleased. Gadhafi was the dictator of Libya for 42
years. He was killed by rebel forces in Libya today.

41
shares
Bough
t cost
closing
10/17
Asset
gain/loss closing 10/18
Asset
gain/loss
GOOG 7 527.84 3694.88 582.41 4076.87 590.51 4133.57
MSFT 142 25.25 3585.5 26.98 3831.16 27.31 3878.02
YHOO 242 14.68 3552.56 15.7 3799.4 15.47 3743.74
XOM 51 70 3570 77.47 3950.97 78.89 4023.39
HD 105 33.75 3543.75 34.65 3638.25 35.95 3774.75
CAT 48 74.82 3591.36 81.52 3912.96 84.72 4066.56
ATPG 384 9.45 3628.8 10.29 3951.36 10.32 3962.88
Total 7 (fee) 27160.97 27582.91
25173.9
daily profit -493.13 421.94
total profit 1987.12 2409.06
closing
10/19
Asset
gain/loss
closing
10/20
Asset
gain/loss
closing
10/21
Asset
gain/loss
580.7 4064.9 583.67 4085.69 590.49 4133.43
27.13 3852.46 27.04 3839.68 27.16 3856.72
15.94 3857.48 16.18 3915.56 16.12 3901.04
78.43 3999.93 78.71 4014.21 80.13 4086.63
35.4 3717 35.73 3751.65 36.86 3870.3
83.56 4010.88 84.26 4044.48 87.39 4194.72
10.14 3893.76 10.04 3855.36 10.08 3870.72
27396.41 27506.63 27913.56
-186.5 110.22 406.93
2222.56 2332.78 2739.71
Table 2.5. Table of results for week 4
Week 5
Monday October 24, 2011
Today was a good day for my stocks. I ended up gaining almost $600. The only that
dropped was The Home Depot so it was an overall good day. One of the reasons that stock could
have gone down was due to Caterpillar having such a good earnings announcement. Since they

42
are in the same category of products this could have affected The Home Depot. Caterpillar had
record revenue for the third quarter this year and is still looking strong. Investors were also more
optimistic about the crisis in Europe. Hopefully the plan that is said to be revealed on
Wednesday will make investors more willing to trade [53].
Tuesday October 25, 2011
Today was an extremely bad day for the market. All of my stocks ended up going down
making me lose about $600. Investors were nervous about what is going to be said tomorrow in
Europe. Tomorrow is when the plan from Germany and France will be revealed about the debt
crisis. There were rumors today that the meeting for tomorrow was cancelled but nothing has
been confirmed yet [59].
Wednesday October 26, 2011
Today was the meeting of the European leaders and due to that, the stock market went up.
Since investors were not as worried anymore about the debt they began investing more today.
The only news that came out of the meeting was that they were closer to a compromise. This
helped make all of my stocks go up today with the exception of Microsoft. Many shares were
being sold of Microsoft making their value decrease. Hopefully good news continues to come
out of Europe and make the market continue its upward trend [17].
Thursday October 27, 2011
Today was a great day for the market. It was agreed upon today in Europe that the bailout
fund would be increased and they would be taking losses on Greek bonds. Once this news came
out, the market immediately went up. I’m hoping that this will continue to impact the market in a
positive way for the remainder of the simulation. One of my stocks, ExxonMobil, rose when
43
their quarterly numbers came out, which showed a profit of $10.3 billion. This was due to an
increase in the price of oil and gas [57].
Friday October 28, 2011
Today my stocks basically remained the same. I ended up losing money overall but it
evened out mostly with the amount some went up and some went down. Investors were once
again having doubts about the handling of the debt situation. This made the market have little
change overall with not much trading going on. I am hoping that next week there will be more
information coming out of Europe to make investors less worried [51].

44
shares bought cost
closing
10/24
Asset
gain/loss
closing
10/25
Asset
gain/loss
GOOG 7 527.84 3694.88 596.42 4174.94 583.16 4082.12
MSFT 142 25.25 3585.5 27.19 3860.98 26.81 3807.02
YHOO 242 14.68 3552.56 16.71 4043.82 16.24 3930.08
XOM 51 70 3570 80.17 4088.67 79.44 4051.44
HD 105 33.75 3543.75 36.7 3853.5 36.04 3784.2
CAT 48 74.82 3591.36 91.77 4404.96 89.89 4314.72
ATPG 384 9.45 3628.8 10.64 4085.76 10.23 3928.32
Total 7 (fee) 28512.63 27897.9
25173.9
daily profit 599.07 -614.73
total profit 3338.78 2724.05
closing
10/26
Asset
gain/loss
closing
10/27
Asset
gain/loss
closing
10/28
Asset
gain/loss
586.31 4104.17 598.67 4190.69 600.14 4200.98
26.59 3775.78 27.25 3869.5 26.98 3831.16
16.3 3944.6 16.63 4024.46 16.56 4007.52
81.07 4134.57 81.88 4175.88 81.48 4155.48
36.55 3837.75 37.22 3908.1 36.12 3792.6
91.57 4395.36 96.33 4623.84 96.85 4648.8
10.46 4016.64 11.32 4346.88 11.46 4400.64
28208.87 29139.35 29037.18
310.97 930.48 -102.17
3035.02 3965.5 3863.33
Table 2.6. Table of results for week 5
Week 6
Monday October 31, 2011
Today was a down day overall for the market. This was due to the problems about
Europe’s solution to the debt crisis. Although this was a down day, the overall month ended in
positive territory. Although good news came out of the meeting last week, investors were
becoming nervous once again about whether this plan would work. It became known that Greece

45
still needs to approve this plan and because of that, investors sold more for the remainder of the
day, causing the decrease in stock prices [49].
Tuesday November 1, 2011
Today was another down day for the market. It seems that the fears that were present at
the end of yesterday carried over into today as well. This was due to the debt plan still needing to
be voted on by Greece. Since the plan results in Greece taking losses, it is a possibility this idea
will be voted down which is bothering investors. They reason that it is safer to sell at this point
and buy stocks back if the plan goes through [50].
Wednesday November 2, 2011
Today stocks began to rise again. After losing about $2000 over the past two days, I am
starting to make some of that back again. This increase was due to Ben Bernanke holding a press
conference. He stated that he will work to help restore the economy in America. Investors were
rallied by this and began investing again. They are still worried about Greece but the talk today
overshadowed that for the most part. Hopefully the talks in Greece will go well and that will
continue to raise the stock market once the talk by Ben Bernanke wares off investors [55].
Thursday November 3, 2011
Once again, my stocks all went up today. This was good considering how much I lost on
my stocks earlier in the week. The situation with Greece was ignored for the day and instead the
rate cut for Europe’s Central Bank was focused on which made investors happier. They were
hoping the bank would do more to help in the future. Going into tomorrow, I hope the issue of
Greece will continue to not affect the market as much [19].

46
Friday November 4, 2011
For the final trading day of the week, the market went down with all of my stocks losing
money. As I feared yesterday, the concerns about Greece affected the market making the overall
week negative. Tonight there is supposed to be a vote for the prime minister which will affect the
debt crisis making investors worried. The good news for the day was that the unemployment rate
has decreased causing the market to not drop as harshly. With next week being my last week of
trading, I am hoping that the market will go up again [16].

47
shares
Bough
t cost
closing
10/31
Asset
gain/loss
closing
11/1
Asset
gain/loss
GOOG 7 527.84 3694.88 592.64 4148.48 578.65 4050.55
MSFT 142 25.25 3585.5 26.63 3781.46 25.99 3690.58
YHOO 242 14.68 3552.56 15.64 3784.88 14.93 3613.06
XOM 51 70 3570 78.09 3982.59 75.94 3872.94
HD 105 33.75 3543.75 35.8 3759 35.54 3731.7
CAT 48 74.82 3591.36 94.46 4534.08 91.63 4398.24
ATPG 384 9.45 3628.8 10.55 4051.2 9.77 3751.68
Total 7 (fee) 28041.69 27108.75
25173.9
daily profit -995.49 -932.94
total profit 2867.84 1934.9
closing 11/2 Asset gain/loss closing 11/3 Asset gain/loss closing 11/4 Asset gain/loss
584.82 4093.74 597.5 4182.5 596.14 4172.98
26.01 3693.42 26.53 3767.26 26.25 3727.5
15.1 3654.2 15.48 3746.16 15.24 3688.08
77.37 3945.87 78.86 4021.86 78.52 4004.52
35.99 3778.95 36.45 3827.25 36.39 3820.95
93.94 4509.12 96 4608 95.74 4595.52
10.29 3951.36 10.58 4062.72 10.46 4016.64
27626.66 28215.75 28026.19
517.91 589.09 -189.56
2452.81 3041.9 2852.34
Table 2.7. Table of results for week 6

48
Week 7
Monday November, 7, 2011
Today begins the last week of trading for this simulation. I am hoping that at the end of
the week I will have a profit to show. I am still in the green for money at this point so unless the
market is too volatile I should keep that money. The market was all over the place today but
most of my stocks ended up going up. This was due to investors now being worried about Italy
instead of Greece. Over the weekend there were protests over the reforms made by the prime
minister. Tomorrow there will be a vote on whether or not he will remain in office. The Prime
Minister of Greece will also be resigning since the bailout plan is approved. This made investors
seem secure about Greece but have now begun to focus on Italy [18].
Tuesday November 8, 2011
Today was another positive day for the market which kept me hopefully about making
money when I sell my stocks Friday. The reason for the increase in the market today was due to
the resignation of Italy’s Prime Minister Silvio Berlusconi. He said that once the new budget is
approved, he will leave office. This made investors more confident that Italy will make it
through the money crisis although they are still worried for the future. With these problems being
handled temporarily, I feel that my stocks will remain high for the remainder of this week [54].
Wednesday November 9, 2011
Today was the worst day for the market that I have seen since I started my simulation. I
lost $1422.12 asset profits off of my total in just one day. This seemed to have been caused by
Italy fears starting again. Investors started off the day by selling since it was announced that the
10-year bond yield for Italy was above 7%. This made investors fear that Italy would also require

49
a bailout in the future. When word got out about this, the European Union then announced that
they would not bailout Italy. This made investors even more worried and caused them to sell
more. Their lack of confidence made this announcement even more detrimental to the market
[52].
Thursday November 10, 2011
Today stocks started to go back up again after the large decrease yesterday. Today one of
the reasons that stocks went back up was due to a bond auction for Italy. It was also mentioned
that the European Central Bank was having an emergency meeting. Although this made investors
feel more relieved today, it is likely things will turn around again like they did yesterday. Since
things change so often from day to day, investors are extremely uneasy overall [56].
While most of my stocks went up today, one of the ones that went down was ATP Oil &
Gas. When looking as to why, I found that they are $2 billion in debt and fear of that caused the
stock to drop. At the end of last month they had lost $260 million alone. This has a lot to do with
the fact that they do a lot of drilling in the Gulf of Mexico where there was an oil spill last
summer. This not only made it slower to drill there, it also made it more expensive. It is also
being rumored that the company is going bankrupt. They are hoping that once more deep sea
drilling begins, they will begin making more profits [13].
Friday November 11, 2011
Today all of my stocks went up again with the exception of ATP Oil & Gas which I
investigated yesterday. Since this is the last day of the simulation I waited until 3:50pm EST to
sell my stocks in order to make as much money as possible in my last day of trading. The reason
for the increase today was due to investors being less worried about Italy and Greece. Lucas

50
Papademos was sworn in today as the new prime minister of Greece which made people happier
in general [58].
After selling my stocks I ended this simulation with a profit of $2100.12. I feel that with
the market being so volatile throughout the simulation, I made good choices with my stocks and
was happy to have made such a profit. The only stock that I ended up losing money on was ATP
Oil & Gas.

51
shares Bought cost
closing
11/7
Asset
profit/loss
closing
11/8
Asset
profit/loss
GOOG 7 527.84 3694.88 608.33 4258.31 612.34 4286.38
MSFT 142 25.25 3585.5 26.8 3805.6 27.16 3856.72
YHOO 242 14.68 3552.56 15.69 3796.98 15.97 3864.74
XOM 51 70 3570 79.35 4046.85 79.76 4067.76
HD 105 33.75 3543.75 37.34 3920.7 37.94 3983.7
CAT 48 74.82 3591.36 95 4560 95.89 4602.72
ATPG 384 9.45 3628.8 10.37 3982.08 10.5 4032
Total 7 (fee) 28370.52 28694.02
25173.9
daily profit 344.33 323.5
total profit 3196.67 3520.17
closing
11/9
Asset
profit/loss
closing
11/10
Asset
profit/loss
closing
11/11
Asset
profit/loss
600.95 4206.65 595.08 4165.56 608.7 4260.9
26.2 3720.4 26.28 3731.76 26.92 3822.64
15.92 3852.64 15.95 3859.9 16.25 3932.5
77.39 3946.89 78.7 4013.7 79.67 4063.17
37.16 3901.8 37.2 3906 38.06 3996.3
91.64 4398.72 92.2 4425.6 96.13 4614.24
8.45 3244.8 7.25 2784 6.73 2584.32
27271.9 26886.52 27274.07
-1422.12 -385.38 387.55
2098.05 1712.67 2100.22
Table 2.8. Table of results for week 7
2.4 Analysis
Now that the simulation portion of the report is complete I am going to be looking back
at my stock portfolio and seeing how I did overall. During the time of the simulation the market
was extremely volatile which made it hard to tell if the stocks I purchased were good choices or
not. Overall I ended up with a profit of $2093.22. In order to see how my stocks did in

52
comparison to the market, I made some graphs to demonstrate this using Google Finance. I
plotted each of my stocks against the index they are associated with.
The first stock that I analyzed was Google. Google is in the Nasdaq index so in order to
see how much I made on Google I compared it to the Nasdaq. I was pleased with the overall
result since Google ended up above the Nasdaq. Although it followed the same trends as the
market for the most part, it was usually gaining a higher percent following October 14, 2011.
Over the course of the simulation the Nasdaq gained a total of 7.87% while Google gained
15.57%. Since this stock performed better than average I consider this to have been a good
choice for the simulation.
Figure 2.9. Google stock vs. the Nasdaq
One of the other technology stocks that I picked was Yahoo. When making a graph of
Yahoo compared to the Nasdaq I noticed that the percent increase by Yahoo was also greater
than that of the Nasdaq. Yahoo went up a total of 10.6% over the course of the simulation
compared to the Nasdaq’s 7.87% increase. One of the things that I noticed was that Yahoo was
more volatile than Google was. Instead of riding consistently about the index, it was instead
changing every few days. It also had an extremely large drop during the first week of the

53
simulation which made it harder to come back from. During the simulation there was a CEO
change which made the stock unstable for some time. Although it was hovering below the
Nasdaq levels near the end of the simulation, in the finals days it rose again pushing it above the
average. Even though Yahoo had some rough times during the course of this simulation, it turned
out to be a good choice for my portfolio.
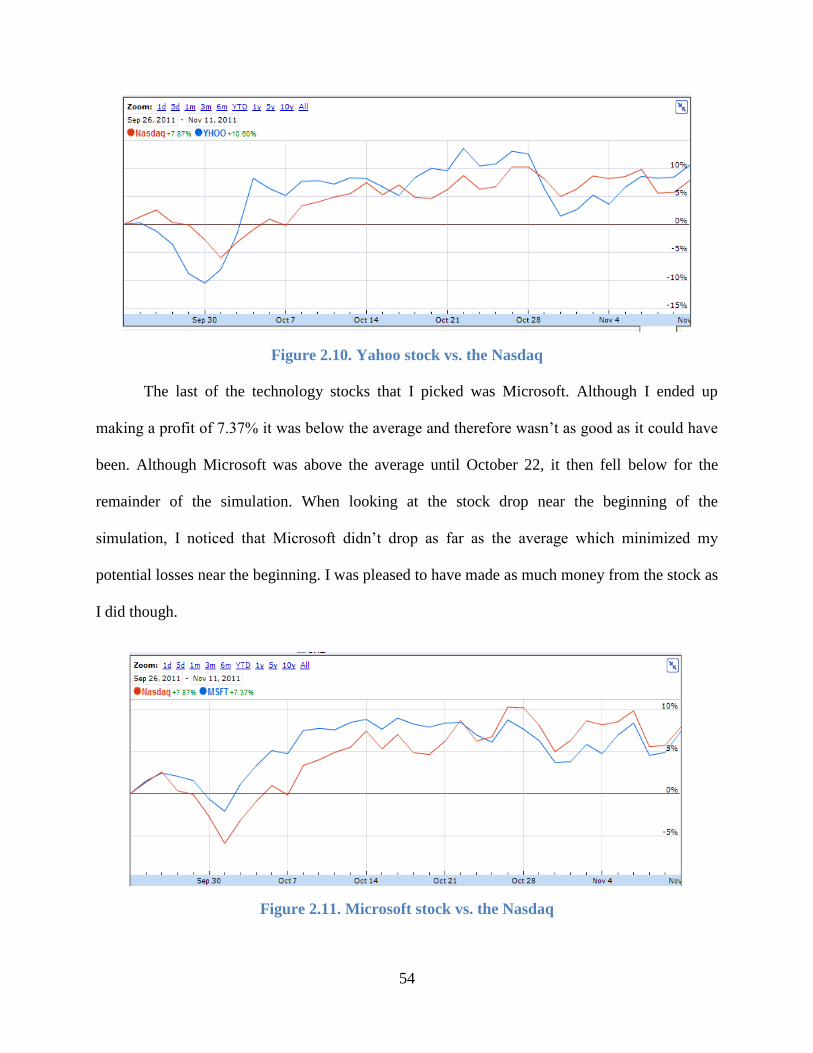
54
Figure 2.10. Yahoo stock vs. the Nasdaq
The last of the technology stocks that I picked was Microsoft. Although I ended up
making a profit of 7.37% it was below the average and therefore wasn’t as good as it could have
been. Although Microsoft was above the average until October 22, it then fell below for the
remainder of the simulation. When looking at the stock drop near the beginning of the
simulation, I noticed that Microsoft didn’t drop as far as the average which minimized my
potential losses near the beginning. I was pleased to have made as much money from the stock as
I did though.
Figure 2.11. Microsoft stock vs. the Nasdaq

55
In the construction category of my portfolio I purchased shares of Home Depot stock.
The Home Depot is part of the Dow Jones index so I made a graph comparing the stock to the
average. Until the last few days The Home Depot was below the average but in the end it was up
12.86% compared to the Dow Jones which was up 12.83% overall. I felt this stock was good
choice for my portfolio since it both made a profit and was above the Dow Jones average.
Figure 2.12. The Home Depot stock vs. the Dow Jones
The other construction company that I had for my portfolio was Caterpillar. This stock
was one that I had chosen based off the assumption that storm damage caused around the time
that the simulation began would cause for an increase in construction. Although this stock went
down like the others did at the beginning of the simulation, it then rose significantly. From
October 8th
on the stock was way above the Dow Jones average finishing with a 30.14% increase
compared to the Dow Jones 12.83% increase. I consider this to have been one of my best stock
purchases. The high increase showed how paying attention to world events while deciding what
stocks to look into can really help to make good choices.

56
Figure 2.13. Caterpillar stock vs. the Dow Jones
The last category that I chose for stocks was oil companies. The first one that I bought
was ExxonMobil. ExxonMobil proved to be a good choice when I noticed it started above the
Dow Jones and remained there throughout the whole simulation. While the Dow Jones went up
12.83% ExxonMobil went up 15.01% resulting in high profits.
Figure 2.14. ExxonMobil stock vs. The Dow Jones
ATP Oil & Gas was the only stock that I ended up losing money on. While the Nasdaq
went up 7.87% throughout the simulation, ATP Oil & Gas dropped 27.42%. Near the middle of
the simulation the stock was up around 25% but then began to fall as news came out of their

57
debts and how they were losing money. This caused the stock to begin rapidly falling around
November 9. From looking at ATP Oil & Gas over the course of the simulation I noticed how it
rarely followed the Nasdaq trends and instead strayed extremely far away. Within the first few
weeks of the simulation the stock dropped so far that I knew it was a bad decision to invest in
that stock but I rode it out anyway for the purpose of the simulation.
Figure 2.15. ATP Oil & Gas vs. the Nasdaq
Over the course of this simulation I have learned a lot about the ways the market is
affected by different world trends and by the trends of the indexes. In order to be successful in
long term holding, research needs to be done first and rash decisions cannot be made. If a lot of
time cannot be put towards working the market, long term holding is a good strategy for making
money off the market.

58
3. Simulation B: Market Shorting
My simulation will be based around the strategy known as short-selling. I will conduct
background research into short-selling, learning what I can about the strategy before the
simulation starts as well as during the remainder of the project. I will analyze market trends for
determining profitability of companies before making a decision to add any company to my
trading portfolio. As the simulation progresses, I will continue learning from my trades, both
successes and failures, and continue to analyze market data. All stock price data in this
simulation is taken from Yahoo finance [45].
3.1 Introduction and Background
The most common perception of stock trading strategy is the age-old saying: “buy low,
sell high”. This is certainly a valid way of thinking, but it is not the only method of turning a
profit on the stock market. A technique known as short-selling, or simply “shorting”, can be
employed to profit from market declines. In essence, shorting involves an investor borrowing
shares of stock from a broker or brokerage firm to sell them when the price is high. The investor
is then said to be short the stock borrowed, hence the name short selling. The investor at this
point is hoping to profit from a decline in stock price, at which point the stock is bought back for
a lower price and returned to the broker. The difference between original selling price and the
buy-back price is how the investor hopes to make a profit [14].
There are dangers inherent in this type of trading. One obvious danger is that the price of
the stock purchased may increase during the time the investor is hoping it will decrease. This
will result in a net loss to the investor of the difference in stock price. A frightening truth in
shorting is that although your potential profits are limited since the stock price cannot fall below

59
zero, the potential losses are limitless due to the ability of the stock price to rise indefinitely.
One way to combat this potential disaster is by using a stop-loss buy order placed on the stocks
being shorted. This would automatically buy the stock set ahead of time if the price reached a
predetermined unacceptable level.
3.2 Portfolio Strategy and Research
My strategy in general will be to sell stocks “borrowed” from my simulated broker during
a period of time when the stocks are high in value. This will involve multiple aspects of trading
strategy and tactics. I will need to decide what is a high enough starting value to short sell.
Merely having a high value at the point of sale is not an acceptable criteria; the trend of the stock
price will need to be considered as well. If I simply sell a quantity of stock once I see the price
has reached, for instance, $20.00 per share, I run the risk of accruing large losses If the stock
continues rising. For this reason my starting strategy will be to attempt to start my trades at a
point in time just past a peak of stock price, when the stock is on a downward trend.
3.2.1 Trading Strategy
If possible I will attempt to begin trading immediately in the week of the simulation start,
with all of my selected companies. If for any reason a particular company is not doing well
financially that day I will wait until I deem their stock price sufficiently high to begin shorting
that company. As my simulation progresses I will monitor the market in general, and look for
new companies that seem to be good shorting candidates.
Once I have sold stock of a company I will then need to wait until the stock prices fall
sufficiently that I judge it is a good time to buy them back and return them to my broker. Beyond
pure judgment, there are necessities to this waiting game. As a bare minimum, I must make a
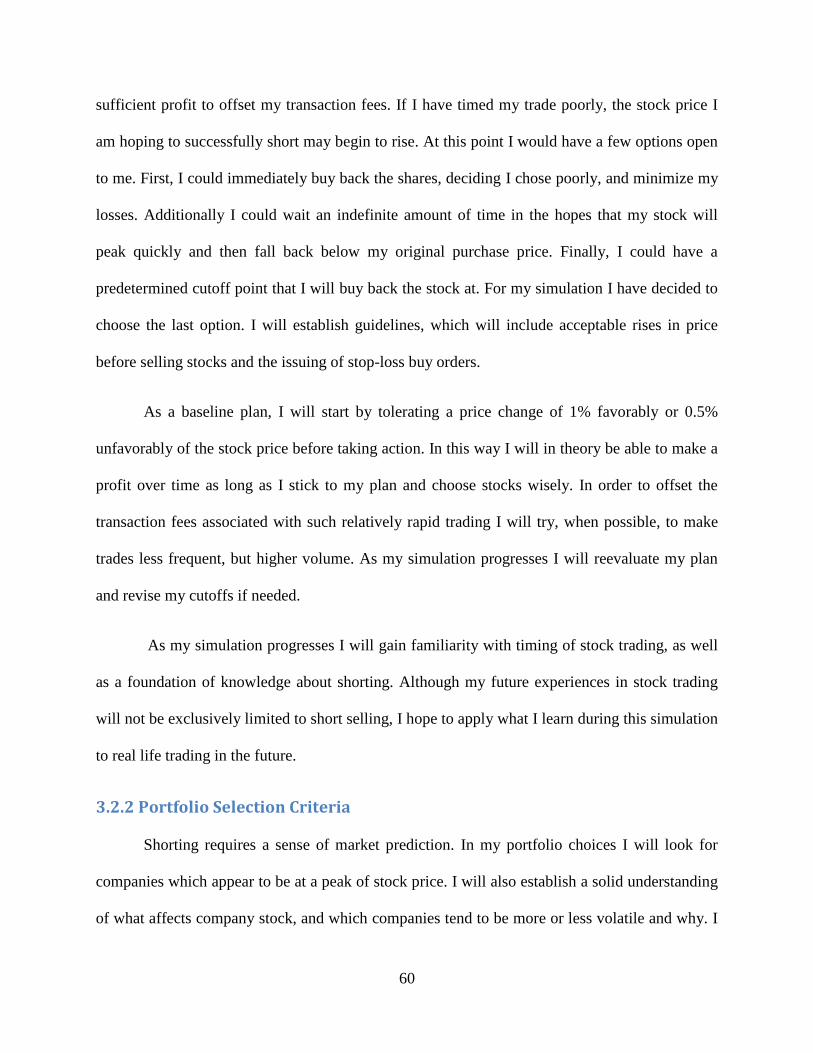
60
sufficient profit to offset my transaction fees. If I have timed my trade poorly, the stock price I
am hoping to successfully short may begin to rise. At this point I would have a few options open
to me. First, I could immediately buy back the shares, deciding I chose poorly, and minimize my
losses. Additionally I could wait an indefinite amount of time in the hopes that my stock will
peak quickly and then fall back below my original purchase price. Finally, I could have a
predetermined cutoff point that I will buy back the stock at. For my simulation I have decided to
choose the last option. I will establish guidelines, which will include acceptable rises in price
before selling stocks and the issuing of stop-loss buy orders.
As a baseline plan, I will start by tolerating a price change of 1% favorably or 0.5%
unfavorably of the stock price before taking action. In this way I will in theory be able to make a
profit over time as long as I stick to my plan and choose stocks wisely. In order to offset the
transaction fees associated with such relatively rapid trading I will try, when possible, to make
trades less frequent, but higher volume. As my simulation progresses I will reevaluate my plan
and revise my cutoffs if needed.
As my simulation progresses I will gain familiarity with timing of stock trading, as well
as a foundation of knowledge about shorting. Although my future experiences in stock trading
will not be exclusively limited to short selling, I hope to apply what I learn during this simulation
to real life trading in the future.
3.2.2 Portfolio Selection Criteria
Shorting requires a sense of market prediction. In my portfolio choices I will look for
companies which appear to be at a peak of stock price. I will also establish a solid understanding
of what affects company stock, and which companies tend to be more or less volatile and why. I

61
will analyze companies’ past stock price performance and trends. This will enable me to better
predict downward trends in stock price, which will produce the greatest profit through shorting.
A potential strategy for portfolio selection is to find two companies directly competing
with each other. This seems like a valid direction to move in for shorting purposes. If one
company profits the other hopefully declines, allowing for oscillating stock prices conducive to
shorting. The potential hazard involved with this method is in the lack of sector diversification.
What this means is that if the industry involved moves one direction as a whole, both companies
will tend in the same direction. This can lead to a lack of damage control.
In addition to trying to find competing companies to invest in, I will try to determine
which companies are the most volatile. This means I will look at which companies have the
greatest percentage change in stock price over time. I have researched assembled lists of the most
volatile stocks currently on the market. My hypothesis is that the more a stock tends to oscillate
in value, the better that stock will be for shorting. For this reason I will try to locate the stocks
that most investors would deem high-risk. Companies that seem on the verge of collapse would
be an example of good shorting material.
3.2.3 Companies Selected
To begin building my portfolio required background research. I analyzed past stock
performance for several companies, and eventually selected five of my possibilities to trade. My
company choices are listed below, along with their ticker.
NVIDIA (NVDA)
NVIDIA is a computer parts company with headquarters in California. Specializing in
graphics processers and motherboards, NVIDIA is a company who has been active in industry

62
since the release of their first commercial product in 1995. As an avid computer technology
enthusiast I chose NVIDIA partially because I have a better understanding of the industry they
operate in. An increased knowledge base will facilitate better understanding of the causes of
stock price fluctuations [10].
Although NVIDIA is a very successful company, I feel it will be possible to profitably
short this company in conjunction with a competitor, AMD. I analyzed NVIDIA’s past
performance and decided their stock prices tend to fluctuate enough for my purposes.
AMD (AMD)
Advanced Micro Devices (AMD) is my second chosen company. They, like NVIDIA,
produce computer components, specifically processors and motherboards. AMD owns the
graphics processor production company ATI, which directly competes with NVIDIA. For this
reason I have chosen both of these companies, hoping that if NVIDIA’s stock increases in price
ATI’s stock price will decrease, and vice versa. ATI was incorporated into AMD in 1985, the
same year they produced their first graphics card product [2].
Fuel Systems Solutions (FSYS)
Fuel Systems Solutions is an alternative-fuel components and systems manufacturer,
specializing in propane and natural gas. Fuel Systems solutions has subsidiary companies in the
automotive, transportation and infrastructure industries: IMPCO, and BRC. Fuel Systems
Solutions’ stock prices tend to fluctuate significantly, and although it is a grim thought that this
should be a good thing, recent trends have shown a consistent decline in stock price. This caught
my eye and led to my decision to short this company [21].

63
Sequenom (SQNM)
Sequenom is a biomedical company who specializes in technology and research relating
to genetic disease diagnosis including DNA sequencing. Sequenom caught my eye due to their
poor stock performance, fluctuating enough to make shorting profitable. Although Sequenom
appears to consistently fluctuate in price, I believe this company represents the greatest threat to
my portfolio. Sequenom’s stock is so low at the present time that I fear the possibility of a
dramatic rise in stock price. I am unsure of how real a possibility this is, and Sequenom will
certainly be a company I will monitor very closely as my simulation progresses.
Of extreme interest is a particular event in Sequenom’s past. In June of 2008 Sequenom
began making announcements regarding an early test for Down syndrome, claiming the test
would be close to 100% accurate and released by June 2009. In response to these announcements
Sequenom’s stock rose to a peak of just under $28 per share in September 2008, compared to
$7.66 per share before the announcements regarding the test. In April 2009 it was discovered that
Sequenom’s claims regarding test accuracy had been forged, with multiple pieces of test data
being fabricated. In response to this, Sequenom’s stock fell to just $3.62 per share. This type of
history in this company leads me to believe the possibility exists for continued dramatic
fluctuation of stock price, and I will include this company in my portfolio [42].
Jaguar Mining (JAG)
Jaguar Mining Inc. is a Brazilian based mining corporation, specializing in gold
production. I chose them for my starting portfolio due to the rapid rate of change of their stock
price. Prices fluctuate a large percent daily for this company, making them an excellent candidate
for shorting.
64
Netflix (NFLX)
Netflix is an extremely popular DVD rental and internet streaming company. Recently,
Netflix has decided to split the portion of their company dedicated to DVD delivery and rentals
into a new company, called Qwikster. I believe there will be a drop in Netflix stock price related
to this decision, and so have decided to add Netflix to my starting lineup of companies.
All of these companies represent my starting choices to trade. As my simulation
progresses I may notice opportunities for large profits with companies not listed above. In that
situation I will describe the company I intend to short, as well as my motives for deciding to
make that move.
3.3 Transactions
For this simulation I will be using a virtual online trading platform hosted by
www.interactivebrokers.com. This website runs virtual trading services including stock
watching, buy and sell orders, stop-loss orders, and more all for a subscription fee. Since a
member of this IQP group already possessed an account at this website we have all agreed to
make use of this platform for our trades. In addition to this site I will be keeping track of all of
my transactions and trading activity in an Excel Spreadsheet. This will facilitate easier
organization and graphical presentation of my final data. Finally, I will provide tables of daily
transactions within this section for review. All total costs displayed in tables are taking into
account a $1.00 commission fee on each transaction.
In general I will organize this section by date, adding new sections for each day of
activity and separating my data by week. My opening series of trades was made as soon as the
market opened on Monday, the 26th
of September. I set up virtual sell orders for each of the

65
companies I planned to trade in advance the night before, so they would be processed as soon as
possible after opening time. I observed the trends of my listed companies and decided almost all
of them looked like they were at good times to sell. AMD was the only company I wasn’t sure
about in terms of trending price. I opted to wait and track AMD further before taking action, and
instead traded my other five companies.
I took the $25,000 dollars allotted to my portion of this project, and divided it by
the number of companies I planned to start with (six) to get a total of $4,166.67 available for
each stock. Although I wasn’t yet trading all six companies, I decided to leave the money
dedicated for AMD alone at this point. The process of shorting begins with a sale of stocks,
rather than a purchase. Despite this, I set aside this particular amount of money for each stock
with the thinking that just in case I chose my trade timing poorly, I would at least have enough
capital to back out of failing trades without going bankrupt. For at least the beginning of this
simulation I will limit the volume of stock traded at one time to however much could be bought
at that time for $4,166.67 regardless of whether or not I am trading six companies at once.
I decided my first set of trades should be high volume, to minimize the percentage cost of
the commission for each transaction (we assumed all commission charges for this simulation
were $1.00). I therefore purchased the maximum amount of shares in NVDA, NFLX, FSYS,
SQNM, and JAG possible given the amount of $4,166.67.
Monday 9/26/2011
Once the market opened for trading on Monday, September 26th, my orders were
processed and stocks were sold. I was able to check the progress of my portfolio about two and a
half hours after opening time, and observed the price of JAG stock had fallen 4.37%. This was
66
well above my previous set cutoff of 1% favorable change, so I promptly bought all of the shares
of JAG I was short. This resulted in a net profit of $175.60 after transaction fees. I was tracking
all of my stocks at this point and a few minutes later made the decision to buy all of my shares of
NVDA after a fall of 3.79%, making a profit of $158.06 after commission. I took similar action
with NFLX and FSYS, making a profit of $215.60, and $80.51 respectively. When watching
both of these companies’ performances I was unsure whether or not I had reached an opportune
time to buy the shares I was short, believing I could wait longer for a greater profit. I realized
this was the type of thinking which could lead to a large loss of capital, and since I had planned
to buy after a loss of 1% of stock price, I stuck to my system and bought the shares.
I watched SQNM for a few hours during the day but their stock price slowly rose
throughout the day. I was tempted to hold out in the hopes that the stock would turn around and
drop enough for a profit, but after a rise of 1.32%, well over my previously accepted limit of
0.5% rise, I realized my error and bought back my shares in an attempt to stop my losses from
rising further. This resulted in a loss of $57.30, bringing my total profits for the day to $572.47. I
consider this to be a huge success for the first day of trading in this simulation. In the future I
will try to act quicker at minimizing my losses.

67
Date Symbol buy/sell price shares Net Cost profit/loss Total Cash Total Profit
26-Sep FSYS sell 18.7 -223 -4169.1
29169.10 26-Sep NFLX sell 137.49 -32 -4398.68
33567.78
26-Sep JAG sell 5.48 -740 -4054.2
37621.98 26-Sep SQNM sell 5.3 -790 -4186
41807.98
26-Sep NVDA sell 13.96 -302 -4214.92
46022.90 26-Sep JAG buy 5.24 740 3878.6 175.6 42144.30 175.60
26-Sep NVDA buy 13.43 302 4056.86 158.06 38087.44 333.66
26-Sep NFLX buy 130.69 32 4183.08 215.6 33904.36 549.26
26-Sep FSYS buy 18.33 223 4088.59 80.51 29815.77 629.77 26-Sep SQNM buy 5.37 790 4243.3 -57.3 25572.47 572.47
Table 3.1. Transactions for 9/26
Tuesday 9/27/2011
This day opened with my sell orders being processed as soon as the market opened. I had
high hopes for all of my companies based on starting prices and rapid downward trends after the
market opened, but quickly realized the day was not as fortuitous as Monday. Between opening
and around 12:30 PM AMD stock rose 2.1%. Since I had shorted 651 shares of AMD I lost
$91.14 after transaction fees. NFLX at first netted me a large profit, but then rose past my
acceptable levels today and therefore, due to my past experience with SQNM, I closed my
position as soon as I noticed the losses accruing. Due to this action I was still able to net a profit
of $131.95 with NFLX.
Allowing my trading frequency to slow throughout the day, I was able to net a profit of
$39.13 with NVDA by waiting until later in the day to buy back the stock I was short. At many
points throughout the day NVDA was down a few cents, but I made a decision to trade with less
frequency and commanded a larger profit near to closing time. JAG and SQNM were similarly
well traded for me, with profits totaling $140.98, and $22.89 respectively. Overall Tuesday was a
success for trading, with my final profits totaling $229.81.

68
Date Symbol buy/sell price shares Net Cost profit/loss Total Cash Total Profit
27-Sep NVDA sell 14.18 -301 -4267.18
29839.65 572.47
27-Sep JAG sell 5.71 -742 -4235.82
34075.47 572.47
27-Sep SQNM sell 5.53 -763 -4218.39
38293.86 572.47
27-Sep AMD sell 6.57 -651 -4276.07
42569.93 572.47
27-Sep NFLX sell 134.53 -31 -4169.43
46739.36 572.47
27-Sep NFLX buy 129.52 31 4016.12 153.31 42723.24 725.78
27-Sep AMD buy 6.71 651 4369.21 -93.14 38354.03 632.64
27-Sep JAG buy 5.52 742 4096.84 138.98 34257.19 771.62
27-Sep NFLX sell 127.94 -32 -4093.08
38350.27 771.62
27-Sep NFLX buy 128.03 32 4097.96 -4.88 34252.31 766.74
27-Sep NFLX sell 127.87 -32 -4090.84
38343.15 766.74
27-Sep SQNM buy 5.5 763 4197.5 20.89 34145.65 787.63
27-Sep NVDA buy 14.05 301 4230.05 37.13 29915.6 824.76 27-Sep NFLX buy 128.51 32 4113.32 -22.48 25802.28 802.28
Table 3.2. Transactions for 9/27
Wednesday 9/28/2011
Wednesday provided an interesting learning experience. I began the trading day by
selling almost all of my selected companies short as usual, specifically FSYS, NVDA, and
NFLX. After this I tracked the market as best I could, given my busy Wednesday schedule. My
only buy of the day was to purchase NVDA stock back after a sufficiently large fall in stock
price to net me $49.17 in profits for the day. I sold AMD towards the end of the day as well as a
newcomer to my portfolio: British Petroleum (BP).
I made the decision to add BP to my short-list for a few reasons. Chiefly I noticed the
fines BP was obligated to pay for damages relating to the gulf oil spill the company had caused a
few years ago were being distributed. This in itself didn’t necessitate a drop in BP stock but this
news did bring the public eye back to the gulf spill, and for this reason I believed BP stock would
suffer. In addition to this I noticed downward trends in stock price over a few days and decided
to attempt shorting BP.

69
Wednesday brought to light for me an interesting point I had not considered before.
When a single investor is attempting day trading, a difficulty arises in simply being available to
watch the stock price rise and fall. I am only at my computer for a few hours on certain days of
the week; an investor with a full time job would likely have even less time to devote to trading.
Clearly trading must either be a full time occupation, or the frequency of trades must suffer. Less
frequent trading is not necessarily a bad thing due to transaction fees, but leads to the possibility
of missing mid-day spikes or drops in stock price. As the scale a given stock is viewed at
increases, the stock fluctuations shrink. This means for trading styles such as short-selling, a
shorter term hold between selling and buying is more profitable, whereas for extended growth-
based portfolios, long term holds may be more profitable. This will be examined in more depth at
the conclusion of our simulation period.
Date Symbol buy/sell price shares Net Cost profit/loss Total Cash Total Profit
28-Sep FSYS sell 19.14 -220 -4209.8
30012.08 802.28
28-Sep NVDA sell 13.95 -301 -4197.95
34210.03 802.28
28-Sep NFLX sell 128.87 -32 -4122.84
38332.87 802.28
28-Sep NVDA buy 13.78 301 4148.78 49.17 34184.09 851.45
28-Sep AMD sell 6.21 -660 -4097.6
38281.69 851.45 28-Sep BP sell 37.65 -110 -4140.5
42422.19 851.45
Table 3.3. Transactions for 9/28
Thursday 9/29/2011
The major news of Thursday was a very dramatic fall of AMD stock, bottoming out well
over 12% lower than at opening. Through some research I attribute this fall to some difficulties
in AMD’s chip supply company, Globalfoundries. AMD is unveiling a new line of processor for
laptop computers, which is drawing a high demand. Supply for this chip was jeopardized through
difficulties at Globalfoundries’ manufacturing plant in Germany. Through the exploitation of this
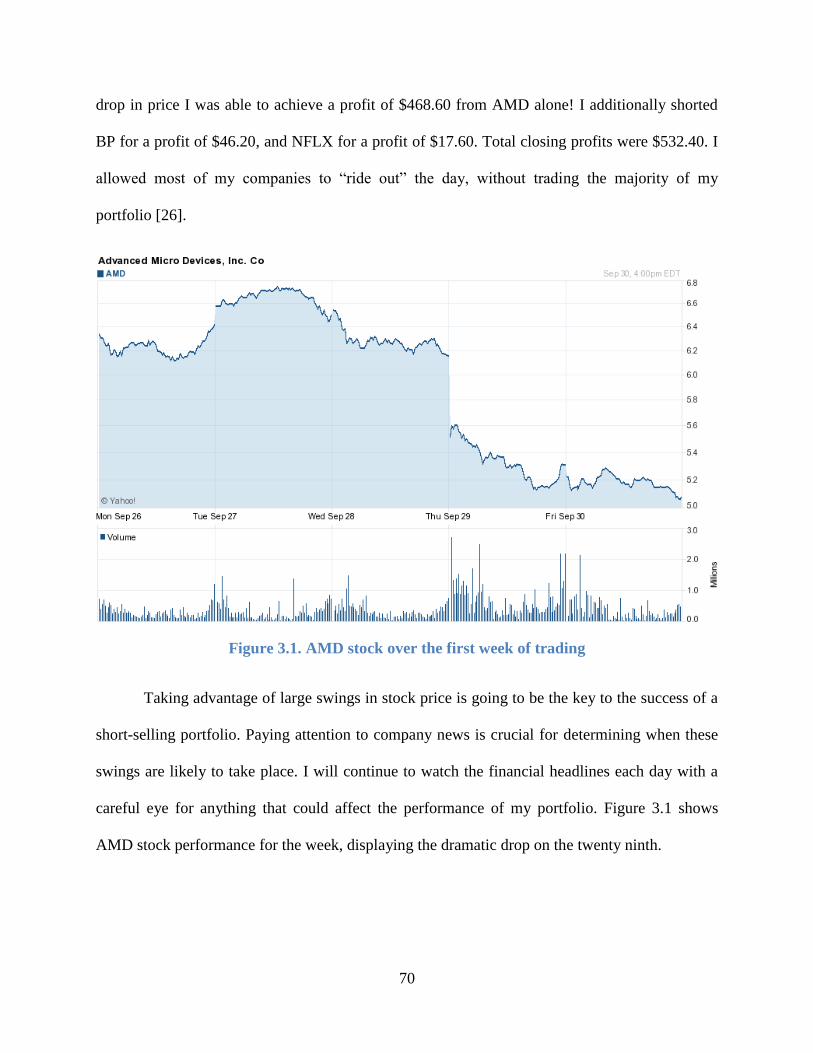
70
drop in price I was able to achieve a profit of $468.60 from AMD alone! I additionally shorted
BP for a profit of $46.20, and NFLX for a profit of $17.60. Total closing profits were $532.40. I
allowed most of my companies to “ride out” the day, without trading the majority of my
portfolio [26].
Figure 3.1. AMD stock over the first week of trading
Taking advantage of large swings in stock price is going to be the key to the success of a
short-selling portfolio. Paying attention to company news is crucial for determining when these
swings are likely to take place. I will continue to watch the financial headlines each day with a
careful eye for anything that could affect the performance of my portfolio. Figure 3.1 shows
AMD stock performance for the week, displaying the dramatic drop on the twenty ninth.

71
Date Symbol buy/sell price shares Net Cost profit/loss Total Cash Total Profit
29-Sep NFLX buy 128.32 32 4107.24 15.6 38314.95 867.05
29-Sep AMD buy 5.5 660 3631 466.6 34683.95 1333.65
29-Sep BP buy 37.23 110 4096.3 44.2 30587.65 1377.85
29-Sep NFLX sell 118.02 -35 -4129.7
34717.35 1377.85
29-Sep NFLX buy 116.6 35 4082 47.7 30635.35 1425.55
29-Sep BP sell 36.73 -112 -4112.76
34748.11 1425.55 29-Sep NVDA sell 13.51 -306 -4133.06
38881.17 1425.55
Table 3.4. Transactions for 9/29
Friday 9/30/2011
Friday brought bad news for my portfolio. Although the market as a whole went down,
my portfolio in general rose. NVDA provided the majority of my profits on Friday, netting me
$267.75. AMD provided an additional $38.75, and I gained $43.19 from BP. NFLX, FSYS, and
SQNM all dented my profits, with losses of $100.05, $43.10, and $91.76 respectively.
Closing brought my total profits for the day to $114.19, and brought my weekly profits to
$1,508.04! This number is far better than I was expecting for my first week of trading, and I
consider this week to be a complete success. I learned a lot about how the market performs, how
timing affects profits, how my own schedule affects my trading ability, and how the news can
assist market prediction. My losses this week were valuable experiences; I learned something
from each one. In general I realized how important it is to have a predetermined trading system
or strategy, and how important it is to stick to that strategy. I look forward to the next week of
trading, and hope to continue to improve as a trader.
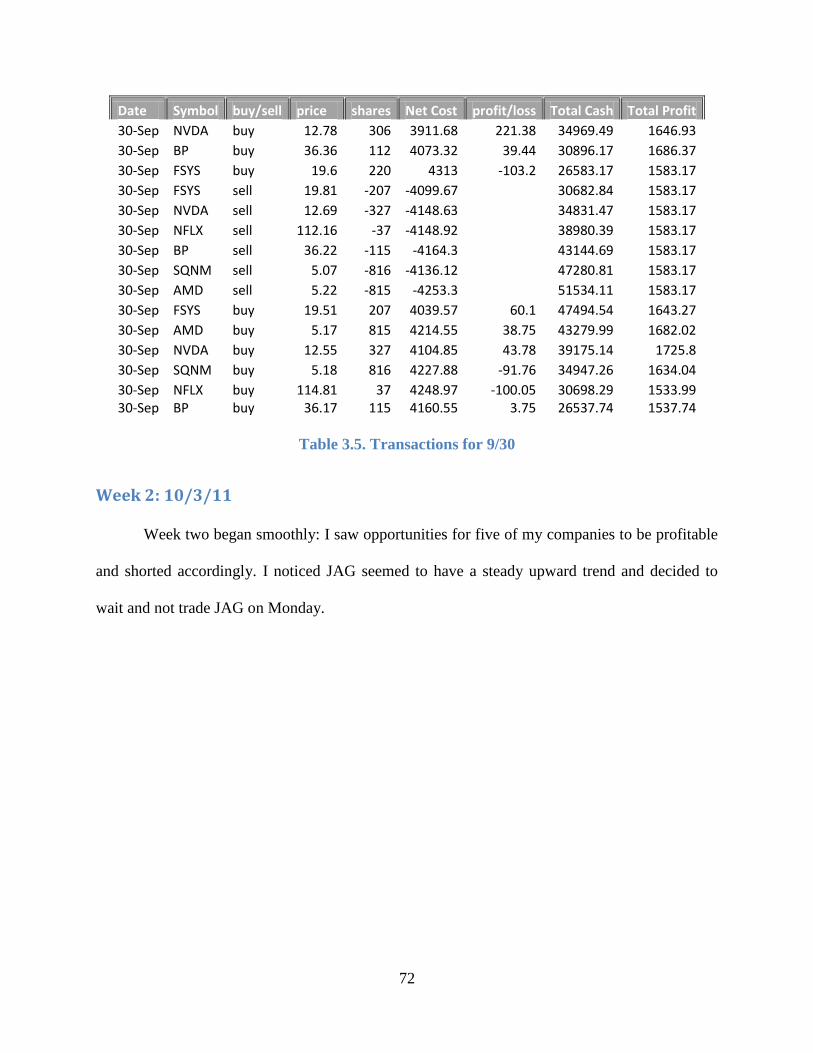
72
Date Symbol buy/sell price shares Net Cost profit/loss Total Cash Total Profit
30-Sep NVDA buy 12.78 306 3911.68 221.38 34969.49 1646.93
30-Sep BP buy 36.36 112 4073.32 39.44 30896.17 1686.37
30-Sep FSYS buy 19.6 220 4313 -103.2 26583.17 1583.17
30-Sep FSYS sell 19.81 -207 -4099.67
30682.84 1583.17
30-Sep NVDA sell 12.69 -327 -4148.63
34831.47 1583.17
30-Sep NFLX sell 112.16 -37 -4148.92
38980.39 1583.17
30-Sep BP sell 36.22 -115 -4164.3
43144.69 1583.17
30-Sep SQNM sell 5.07 -816 -4136.12
47280.81 1583.17
30-Sep AMD sell 5.22 -815 -4253.3
51534.11 1583.17
30-Sep FSYS buy 19.51 207 4039.57 60.1 47494.54 1643.27
30-Sep AMD buy 5.17 815 4214.55 38.75 43279.99 1682.02
30-Sep NVDA buy 12.55 327 4104.85 43.78 39175.14 1725.8
30-Sep SQNM buy 5.18 816 4227.88 -91.76 34947.26 1634.04
30-Sep NFLX buy 114.81 37 4248.97 -100.05 30698.29 1533.99 30-Sep BP buy 36.17 115 4160.55 3.75 26537.74 1537.74
Table 3.5. Transactions for 9/30
Week 2: 10/3/11
Week two began smoothly: I saw opportunities for five of my companies to be profitable
and shorted accordingly. I noticed JAG seemed to have a steady upward trend and decided to
wait and not trade JAG on Monday.
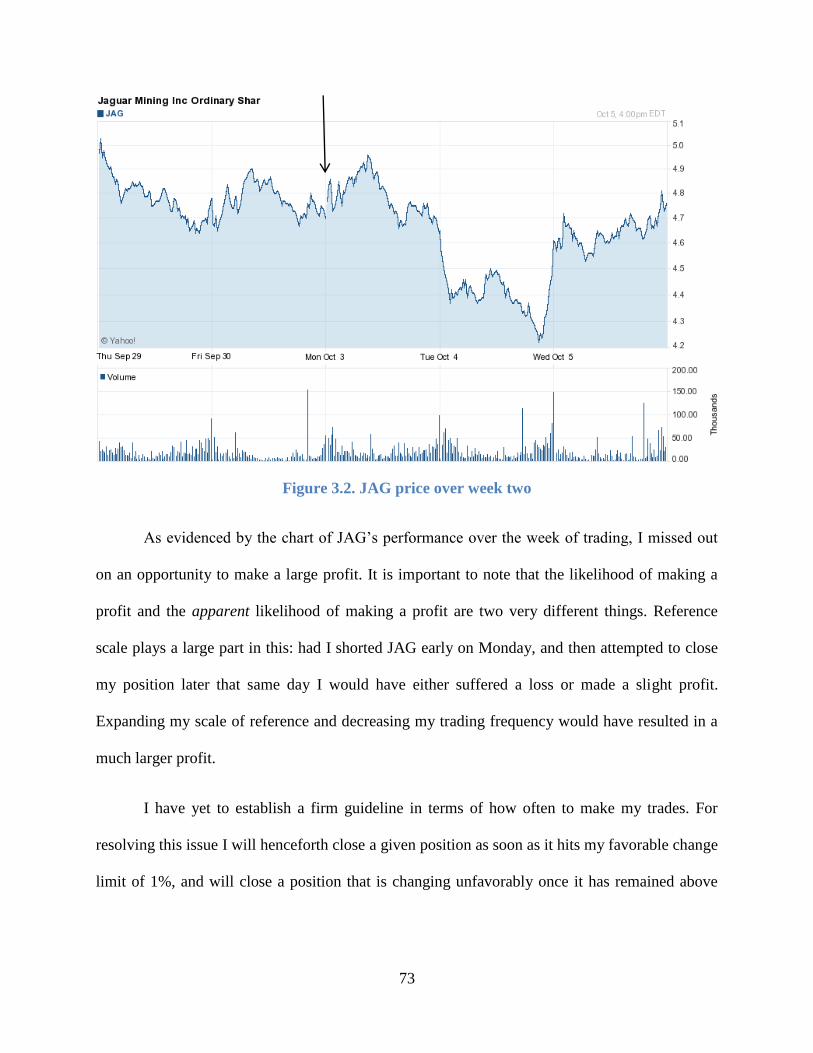
73
Figure 3.2. JAG price over week two
As evidenced by the chart of JAG’s performance over the week of trading, I missed out
on an opportunity to make a large profit. It is important to note that the likelihood of making a
profit and the apparent likelihood of making a profit are two very different things. Reference
scale plays a large part in this: had I shorted JAG early on Monday, and then attempted to close
my position later that same day I would have either suffered a loss or made a slight profit.
Expanding my scale of reference and decreasing my trading frequency would have resulted in a
much larger profit.
I have yet to establish a firm guideline in terms of how often to make my trades. For
resolving this issue I will henceforth close a given position as soon as it hits my favorable change
limit of 1%, and will close a position that is changing unfavorably once it has remained above

74
the limit of 0.5% for over one trading day. This further definition in strategy will remain in effect
until I evaluate and make additional changes to my strategy in general.
I chose not to short NFLX on Monday for similar reasons as my decision to not short
JAG. I noticed an upward swing in stock price and didn’t want to risk losing capital. Of the
companies I did trade, AMD provided the greatest capital gains: AMD fell nearly 3% for a profit
of $121.00. The remainder of my companies I chose to trade were all profitable, with total profits
for the day reaching $338.51.
Date Symbol buy/sell price shares Net Cost profit/loss Total Cash Total Profit
3-Oct BP sell 35.89 -115 -4126.35
30664.09 1537.74
3-Oct AMD sell 5.02 -820 -4115.4
34779.49 1537.74
3-Oct FSYS sell 18.9 -216 -4081.4
38860.89 1537.74
3-Oct NVDA sell 12.31 -330 -4061.3
42922.19 1537.74
3-Oct SQNM sell 5.02 -816 -4095.32
47017.51 1537.74
3-Oct AMD buy 4.87 820 3994.4 121 43023.11 1658.74
3-Oct FSYS buy 18.72 216 4044.52 36.88 38978.59 1695.62
3-Oct NVDA buy 12.12 330 4000.6 60.7 34977.99 1756.32
3-Oct BP buy 35.38 115 4069.7 56.65 30908.29 1812.97
3-Oct SQNM buy 4.94 816 4032.04 63.28 26876.25 1876.25 3-Oct FSYS sell 17.37 -250 -4341.5
31217.75 1876.25
Table 3.6. Transactions for 10/3
Tuesday 10/4/11
Tuesday was even more profitable than Monday. I believe this is due in part to my
decision to decrease my trading margin. Up until this point I have been unwilling to sell more
shares than I could buy back with an even distribution of my starting funds, or margin. At this
point in the simulation I decided to be more aggressive in the amount of volume per trade, and
increase my potential profits. Increasing the number of shares will also decrease the percentage
of my profit per trade that is spent on transaction fees. The danger in this strategy is that if the
worst-case scenario occurs and all my stocks rose a large enough amount I would not possess

75
enough capital to cover the cost of buying the stocks back. In order for this disaster to occur my
portfolio would have to rise a very large amount, but it is still a possibility that must be
considered.
One of the notable points of Tuesday’s trading was my rapid sell-and-buy of NVDA
stock. I shorted NVDA and a mere ten minutes later the stock fell 1% so I quickly closed my
position to earn a profit of $46.00 after commission. This illustrates the point I made last week
about the importance of trade timing and being physically present in order to take advantage of
market changes. I noticed the stock reached my goal of a 1% favorable change and acted quickly
as per my trading strategy. This adherence to strategy is of the utmost importance when using a
trading strategy not based on mathematical formulas. As soon as an investor allows emotion or
intuition to override strategy, failure is imminent. My total profits for the day reached $271.20,
with SQNM making up the largest portion ($98.00).
Date Symbol buy/sell price shares Net Cost profit/loss Total Cash Total Profit
4-Oct FSYS buy 17.11 250 4278.5 63 26939.25 1939.25
4-Oct SQNM sell 5.09 -1000 -5089
32028.25 1939.25
4-Oct NVDA sell 12.53 -400 -5011
37039.25 1939.25
4-Oct NFLX sell 114.24 -40 -4568.6
41607.85 1939.25
4-Oct BP sell 34.63 -150 -5193.5
46801.35 1939.25
4-Oct AMD sell 4.49 -500 -2244
49045.35 1939.25
4-Oct NVDA buy 12.41 400 4965 46 44080.35 1985.25
4-Oct AMD buy 4.44 500 2221 23 41859.35 2008.25
4-Oct NFLX buy 113.16 40 4527.4 41.2 37331.95 2049.45 4-Oct SQNM buy 4.99 1000 4991 98 32340.95 2147.45
Table 3.7. Transactions for 10/4
Wednesday 10/5/11
Wednesday was a good day for the market, and therefore was a terrible day for my
portfolio. Through a series of market fluctuations and aggressive trading at the beginning of the
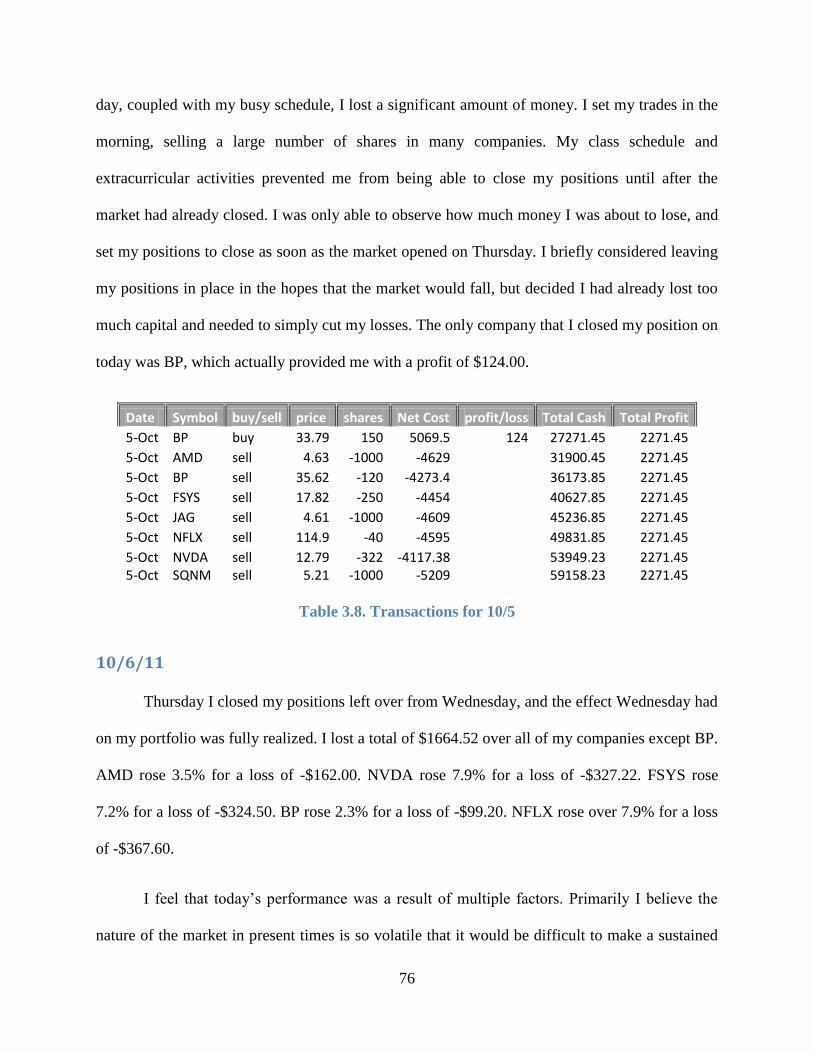
76
day, coupled with my busy schedule, I lost a significant amount of money. I set my trades in the
morning, selling a large number of shares in many companies. My class schedule and
extracurricular activities prevented me from being able to close my positions until after the
market had already closed. I was only able to observe how much money I was about to lose, and
set my positions to close as soon as the market opened on Thursday. I briefly considered leaving
my positions in place in the hopes that the market would fall, but decided I had already lost too
much capital and needed to simply cut my losses. The only company that I closed my position on
today was BP, which actually provided me with a profit of $124.00.
Date Symbol buy/sell price shares Net Cost profit/loss Total Cash Total Profit
5-Oct BP buy 33.79 150 5069.5 124 27271.45 2271.45
5-Oct AMD sell 4.63 -1000 -4629
31900.45 2271.45
5-Oct BP sell 35.62 -120 -4273.4
36173.85 2271.45
5-Oct FSYS sell 17.82 -250 -4454
40627.85 2271.45
5-Oct JAG sell 4.61 -1000 -4609
45236.85 2271.45
5-Oct NFLX sell 114.9 -40 -4595
49831.85 2271.45
5-Oct NVDA sell 12.79 -322 -4117.38
53949.23 2271.45 5-Oct SQNM sell 5.21 -1000 -5209
59158.23 2271.45
Table 3.8. Transactions for 10/5
10/6/11
Thursday I closed my positions left over from Wednesday, and the effect Wednesday had
on my portfolio was fully realized. I lost a total of $1664.52 over all of my companies except BP.
AMD rose 3.5% for a loss of -$162.00. NVDA rose 7.9% for a loss of -$327.22. FSYS rose
7.2% for a loss of -$324.50. BP rose 2.3% for a loss of -$99.20. NFLX rose over 7.9% for a loss
of -$367.60.
I feel that today’s performance was a result of multiple factors. Primarily I believe the
nature of the market in present times is so volatile that it would be difficult to make a sustained

77
profit over the time period in which I was trading. Additionally my inability to take swift action
on Wednesday once my stocks began rising compounded the situation. Had the market rose on a
day where I was present at my computer more often I would have registered less of a drop in
assets. My solution to this will be to ensure that my trading on Wednesdays is very conservative,
saving my aggressive trading for days when I can cut my losses quickly if the market
performance is poor.
Date Symbol buy/sell price shares Net Cost profit/loss Total Cash Total Profit
6-Oct AMD buy 4.79 1000 4791 -162 54367.23 2109.45
6-Oct JAG buy 4.86 1000 4861 -252 49506.23 1857.45
6-Oct SQNM buy 5.34 1000 5341 -132 44165.23 1725.45
6-Oct NVDA buy 13.8 322 4444.6 -327.22 39720.63 1398.23
6-Oct FSYS buy 19.11 250 4778.5 -324.5 34942.13 1073.73
6-Oct BP buy 36.43 120 4372.6 -99.2 30569.53 974.53 6-Oct NFLX buy 124.04 40 4962.6 -367.6 25606.93 606.93
Table 3.9. Transactions for 10/6
10/7/11
Friday at first looked like trading would be more profitable than Wednesday or Thursday,
but quickly losses began accumulating. Although I was much less aggressive with my trading I
still lost a significant amount of money Friday. Total Friday losses were -$195.60 split over five
of my companies.
Friday brought my total losses for the week to -$1126.41, and my total profits were
reduced to $373.93. The fact that I have still profited overall is encouraging, although my losses
for the second week of trading diminish my confidence. Figure 3.4 shows the amount of liquid
assets I possess as a function of the number of transactions I have made. This graph clearly
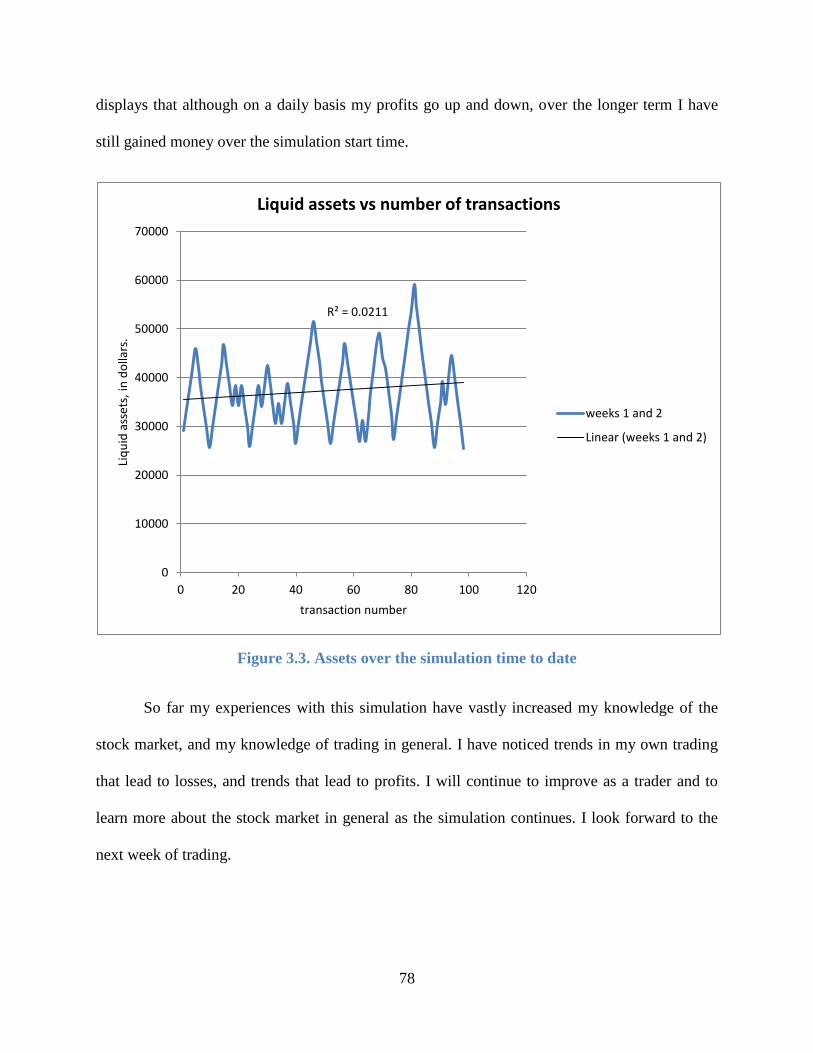
78
displays that although on a daily basis my profits go up and down, over the longer term I have
still gained money over the simulation start time.
Figure 3.3. Assets over the simulation time to date
So far my experiences with this simulation have vastly increased my knowledge of the
stock market, and my knowledge of trading in general. I have noticed trends in my own trading
that lead to losses, and trends that lead to profits. I will continue to improve as a trader and to
learn more about the stock market in general as the simulation continues. I look forward to the
next week of trading.
R² = 0.0211
0
10000
20000
30000
40000
50000
60000
70000
0 20 40 60 80 100 120
Liq
uid
ass
ets,
in d
olla
rs.
transaction number
Liquid assets vs number of transactions
weeks 1 and 2
Linear (weeks 1 and 2)
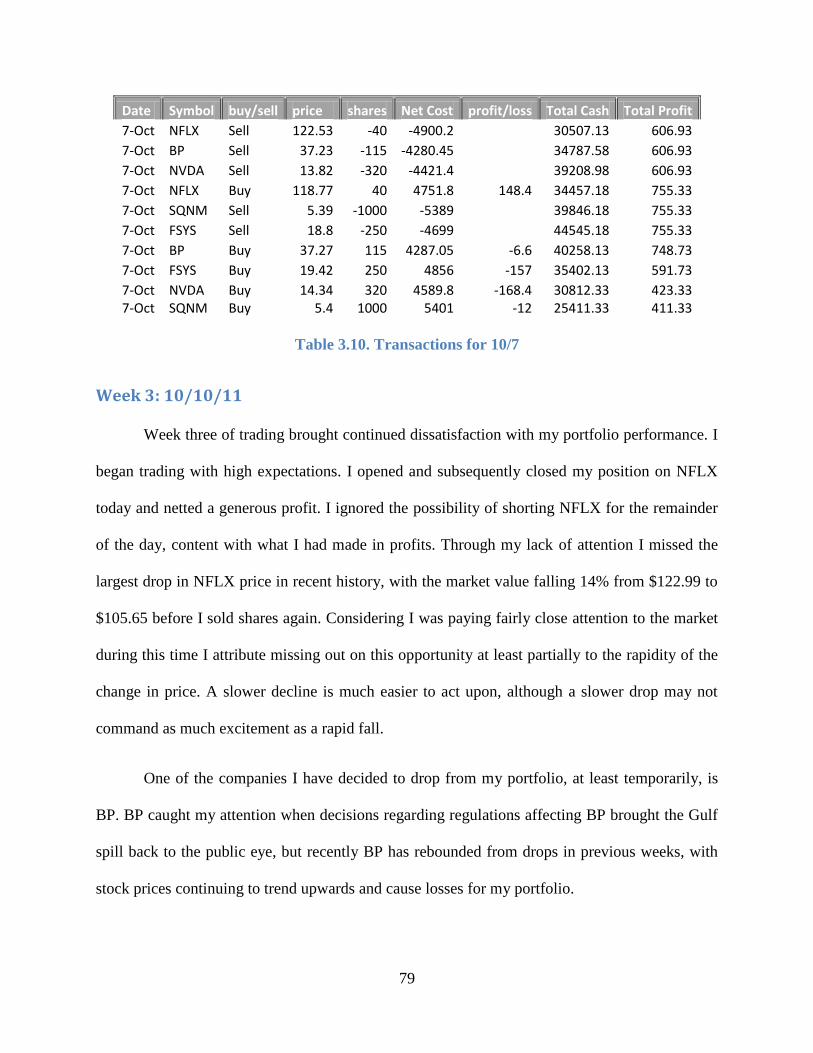
79
Date Symbol buy/sell price shares Net Cost profit/loss Total Cash Total Profit
7-Oct NFLX Sell 122.53 -40 -4900.2
30507.13 606.93
7-Oct BP Sell 37.23 -115 -4280.45
34787.58 606.93
7-Oct NVDA Sell 13.82 -320 -4421.4
39208.98 606.93
7-Oct NFLX Buy 118.77 40 4751.8 148.4 34457.18 755.33
7-Oct SQNM Sell 5.39 -1000 -5389
39846.18 755.33
7-Oct FSYS Sell 18.8 -250 -4699
44545.18 755.33
7-Oct BP Buy 37.27 115 4287.05 -6.6 40258.13 748.73
7-Oct FSYS Buy 19.42 250 4856 -157 35402.13 591.73
7-Oct NVDA Buy 14.34 320 4589.8 -168.4 30812.33 423.33 7-Oct SQNM Buy 5.4 1000 5401 -12 25411.33 411.33
Table 3.10. Transactions for 10/7
Week 3: 10/10/11
Week three of trading brought continued dissatisfaction with my portfolio performance. I
began trading with high expectations. I opened and subsequently closed my position on NFLX
today and netted a generous profit. I ignored the possibility of shorting NFLX for the remainder
of the day, content with what I had made in profits. Through my lack of attention I missed the
largest drop in NFLX price in recent history, with the market value falling 14% from $122.99 to
$105.65 before I sold shares again. Considering I was paying fairly close attention to the market
during this time I attribute missing out on this opportunity at least partially to the rapidity of the
change in price. A slower decline is much easier to act upon, although a slower drop may not
command as much excitement as a rapid fall.
One of the companies I have decided to drop from my portfolio, at least temporarily, is
BP. BP caught my attention when decisions regarding regulations affecting BP brought the Gulf
spill back to the public eye, but recently BP has rebounded from drops in previous weeks, with
stock prices continuing to trend upwards and cause losses for my portfolio.
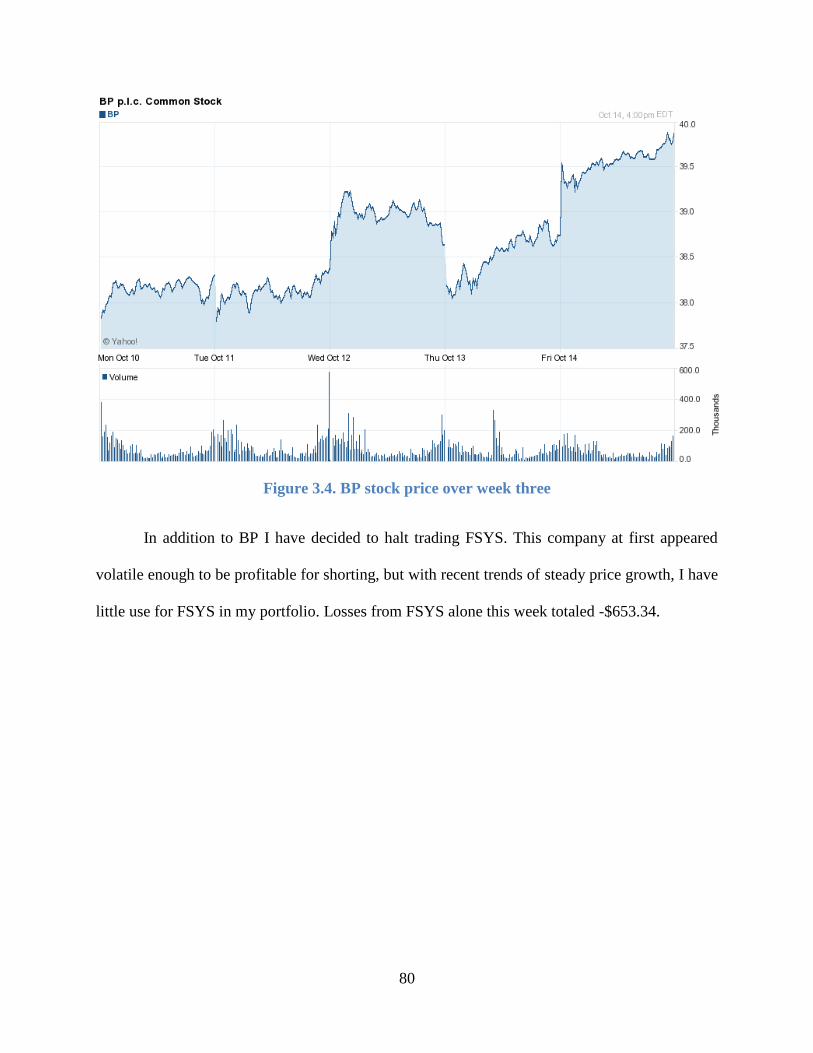
80
Figure 3.4. BP stock price over week three
In addition to BP I have decided to halt trading FSYS. This company at first appeared
volatile enough to be profitable for shorting, but with recent trends of steady price growth, I have
little use for FSYS in my portfolio. Losses from FSYS alone this week totaled -$653.34.

81
Figure 3.5. FSYS price over week three
Date Symbol buy/sell price shares Net Cost profit/loss Total Cash Total Profit
10-Oct NFLX sell 126.67 -40 -5065.8
30477.13 373.93
10-Oct BP sell 37.94 -135 -5120.9
35598.03 373.93
10-Oct FSYS sell 19.89 -250 -4971.5
40569.53 373.93
10-Oct NVDA sell 14.63 -340 -4973.2
45542.73 373.93 10-Oct NFLX buy 122.99 40 4920.6 145.2 40622.13 519.13
Table 3.11. Transactions for 10/10
10/11/11
Tuesday I was unable to achieve much in the way of active trading, due to finals week at
WPI causing me to not have the free time to devote to trading. This once again illustrates the
importance of dedication to trading. If an investor hopes to be profitable, he or she cannot afford
to miss out on opportunities for profit, or miss out on cutting short potential losses. I did have a
small amount of time to scan my portfolio for opportunities and I noticed that NFLX market

82
value continued to drop rapidly, and so initiated another short on NFLX, letting my other
positions continue in the hopes of making a profit on Wednesday.
Date Symbol buy/sell price shares Net Cost profit/loss Total Cash Total Profit
11-Oct NFLX Sell 105.65 -50 -5281.5
45903.63 519.13
Table 3.12. Transactions for 10/11
10/12/11
Wednesday was the day my total net proceeds from trading so far changed from a profit
to a loss. My usual lack of availability on Wednesday led me to close my positions early in the
day, before I became too occupied to trade effectively. Wednesday’s losses totaled -$1,049.70,
making Wednesday by far the worst trading day so far. I am not able to say for sure that this loss
could have been avoided with an exclusively short-selling based portfolio. A portfolio so
confined to a single strategy as this one is by nature lacking in versatility and ability to handle
undesired market changes (in this case a rise of price). Wednesday was when I realized I needed
to make a change of companies in my portfolio if I hoped to continue to be profitable for the
duration of the simulation.
Date Symbol buy/sell price shares Net Cost profit/loss Total Cash Total Profit
12-Oct BP Buy 38.88 135 5249.8 -128.9 40653.83 390.23
12-Oct FSYS Buy 21.84 250 5461 -489.5 35192.83 -99.27
12-Oct NVDA Buy 14.75 340 5016 -42.8 30176.83 -142.07 12-Oct NFLX Buy 113.38 50 5670 -388.5 24506.83 -530.57
Table 3.13. Transactions for 10/12
10/13/11
Thursday, with some trepidation I shorted an assortment of my companies, before
witnessing an almost universal rise in stock price. I was particularly aggressive in my shorting of
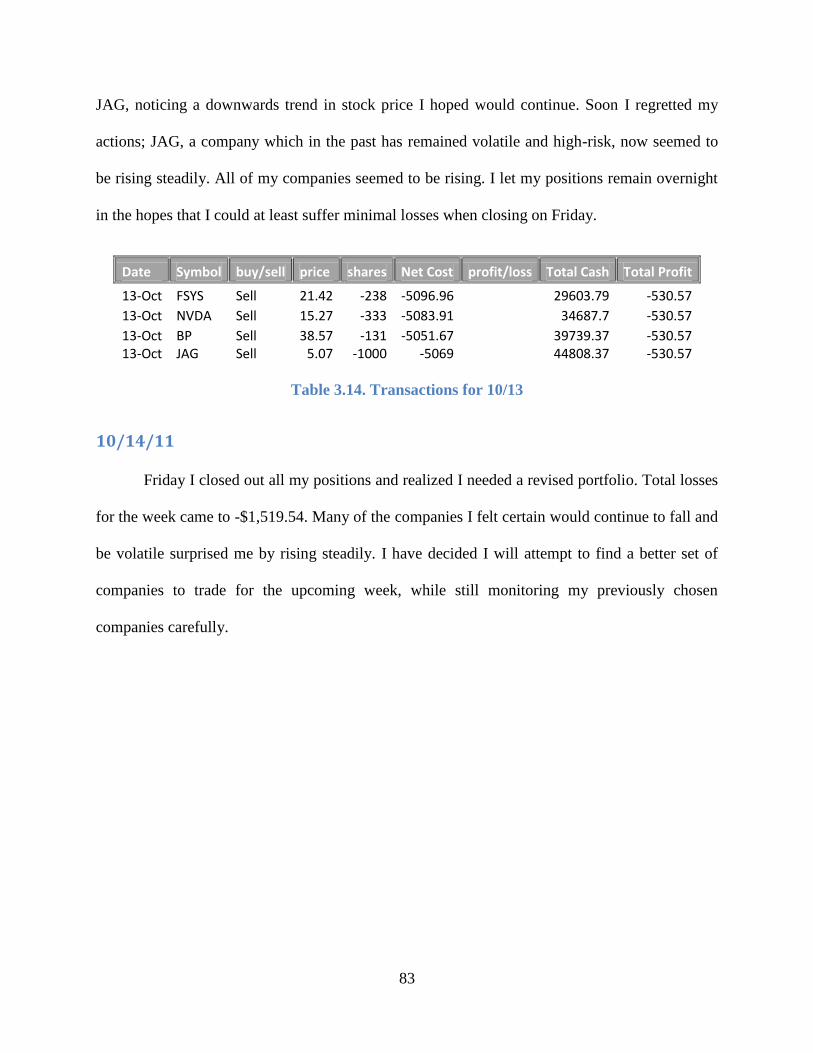
83
JAG, noticing a downwards trend in stock price I hoped would continue. Soon I regretted my
actions; JAG, a company which in the past has remained volatile and high-risk, now seemed to
be rising steadily. All of my companies seemed to be rising. I let my positions remain overnight
in the hopes that I could at least suffer minimal losses when closing on Friday.
Date Symbol buy/sell price shares Net Cost profit/loss Total Cash Total Profit
13-Oct FSYS Sell 21.42 -238 -5096.96
29603.79 -530.57
13-Oct NVDA Sell 15.27 -333 -5083.91
34687.7 -530.57
13-Oct BP Sell 38.57 -131 -5051.67
39739.37 -530.57 13-Oct JAG Sell 5.07 -1000 -5069
44808.37 -530.57
Table 3.14. Transactions for 10/13
10/14/11
Friday I closed out all my positions and realized I needed a revised portfolio. Total losses
for the week came to -$1,519.54. Many of the companies I felt certain would continue to fall and
be volatile surprised me by rising steadily. I have decided I will attempt to find a better set of
companies to trade for the upcoming week, while still monitoring my previously chosen
companies carefully.

84
Figure 3.6. JAG price over week three
In general this week my stocks rose, as evidenced by the charts and data provided. Total
losses were large, but will not impact my ability to continue trading. I have begun research into
other potentially profitable companies to short, and look forward to the next week of trading.
Date Symbol buy/sell price shares Net Cost profit/loss Total Cash
14-Oct BP buy 39.45 131 5168.95 -117.28 39639.42
14-Oct FSYS buy 22.1 238 5260.8 -163.84 34378.62
14-Oct JAG buy 5.32 1000 5321 -252 29057.62 14-Oct NVDA buy 15.51 333 5165.83 -81.92 23891.79
Table 3.15. Transactions for 10/14
Week 4: 10/17/2011
Week four of trading began with my decision to change my portfolio for the week, as
well as my overall trading strategy. I added two new companies to my portfolio, which I will
85
discuss in detail. In addition to this, a major change in strategy this week involved my decision to
only trade these two new companies. In past weeks I typically would short around five
companies at one time, having many open positions at once. This many positions I felt stretched
myself too thin in terms of trying to manage the hour by hour fluctuations of stock price when
searching for the best time to “get out” of the market. For this week I will only trade the two new
additions to my portfolio: Mastercard, and Chile’s Mexican Grill.
Mastercard (MA) is a major credit card company. Mastercard was originally founded in
1966 under the name Interbank Card Association. They have offices worldwide and billions of
people use their services. At first glance Mastercard may not seem like a good candidate to short,
given their large business volume and relatively stable platform of capital. My plan for
attempting to short MA was to take advantage of two factors: my small number of companies to
keep track of this week, and small fluctuations in stock price during the day. Over a long period
of time MA stock appears to be increasing in value steadily as shown below [29].

86
Figure 3.7. MA performance over the last year
Viewing MA performance on a smaller scale, for instance over three months, displays
many more opportunities to profit from shorting.

87
Figure 3.8. MA performance over three months
I hope to be able to take advantage of dips and fluctuations in price on an even smaller,
perhaps hourly scale.
Chile’s Mexican Grill (CMG) is a large chain of restaurants specializing in Mexican
food. I researched this company and found that much like MA, CMG has high enough short term
volatility to be profitable for the scope of this simulation. I have begun to understand that almost
any company can be profitable for shorting, depending on the scale of reference. This reference
scale, or timeframe the investor is working in, makes all of the difference in whether or not a
consistent profit can be realized.

88
Monday 10/17/11
Monday I sold CMG and MA early in the day. Throughout the remainder of the day I
merely observed the market whenever I was able. I wasn’t sure of any good opportunities for
buy-back so I allowed my positions to remain as they were for the day.
Date Symbol buy/sell price shares Net Cost profit/loss Total Cash Total Profit
17-Oct CMG sell 318.47 -20 -6368.4
30260.19 -1145.61 17-Oct MA sell 334.77 -20 -6694.4
36954.59 -1145.61
Table 3.16. Transactions for 10/17
Tuesday 10/18/11
Tuesday I observed the market, without opening any new trades or closing existing
positions. Eventually I observed a decline in CMG price equal to my set cutoff of 1.00% and so
bought, netting a profit of $68.40 after fees. I didn’t see any good opportunities to buy back MA
today and so decided to wait, hoping to see a drop large enough to warrant closing the position.
Date Symbol buy/sell price shares Net Cost profit/loss Total Cash Total Profit
18-Oct CMG buy 314.95 20 6300 68.4 30654.59 -1077.21
Table 3.17. Transactions for 10/18
Wednesday 10/19/11
Wednesday I was unable to trade whatsoever due to my schedule. I hoped the market
would be favorable the next day, and intended to close my MA position on Thursday.
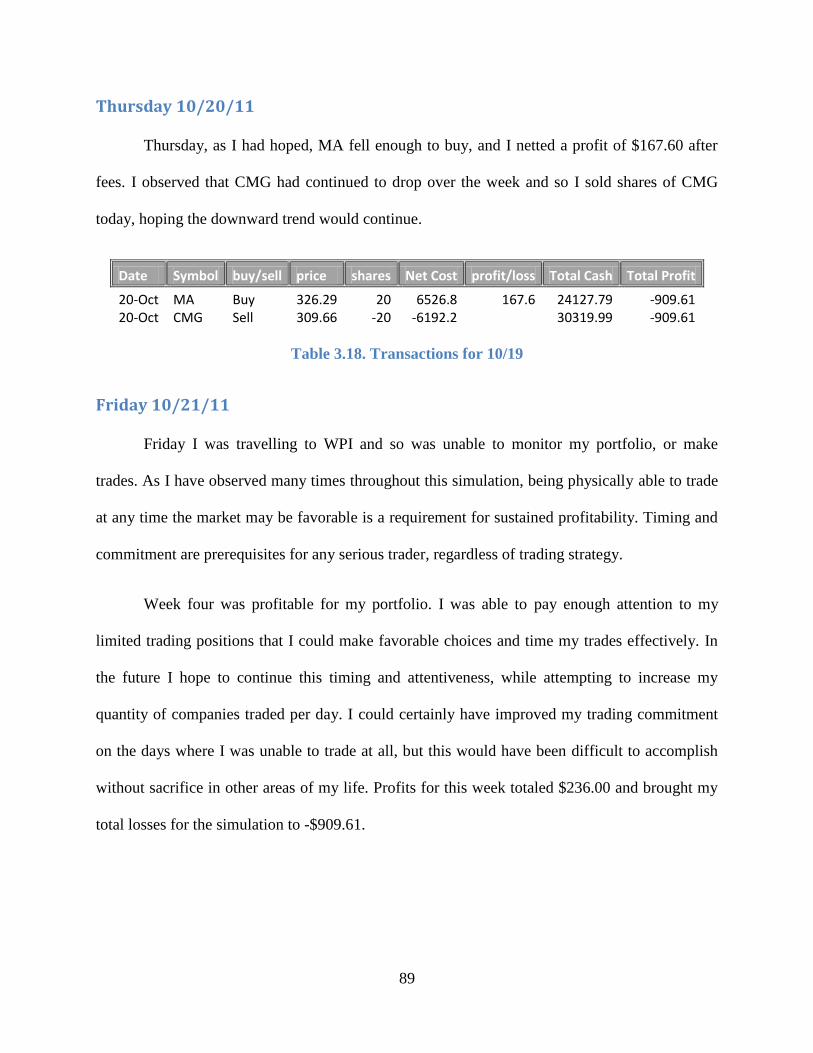
89
Thursday 10/20/11
Thursday, as I had hoped, MA fell enough to buy, and I netted a profit of $167.60 after
fees. I observed that CMG had continued to drop over the week and so I sold shares of CMG
today, hoping the downward trend would continue.
Date Symbol buy/sell price shares Net Cost profit/loss Total Cash Total Profit
20-Oct MA Buy 326.29 20 6526.8 167.6 24127.79 -909.61 20-Oct CMG Sell 309.66 -20 -6192.2
30319.99 -909.61
Table 3.18. Transactions for 10/19
Friday 10/21/11
Friday I was travelling to WPI and so was unable to monitor my portfolio, or make
trades. As I have observed many times throughout this simulation, being physically able to trade
at any time the market may be favorable is a requirement for sustained profitability. Timing and
commitment are prerequisites for any serious trader, regardless of trading strategy.
Week four was profitable for my portfolio. I was able to pay enough attention to my
limited trading positions that I could make favorable choices and time my trades effectively. In
the future I hope to continue this timing and attentiveness, while attempting to increase my
quantity of companies traded per day. I could certainly have improved my trading commitment
on the days where I was unable to trade at all, but this would have been difficult to accomplish
without sacrifice in other areas of my life. Profits for this week totaled $236.00 and brought my
total losses for the simulation to -$909.61.

90
Week 5: 10/24/11
The major news for week five of trading was the massive collapse of NFLX stock at the
beginning of the week. Due mainly to the cumulative loss of over 800,000 subscribers this
quarter, coupled with recent earnings announcements that predicted losses in 2012, NFLX stock
fell massively from over $100 per share down to around $75 a share Tuesday before the market
opened. Unfortunately for my portfolio I did not possess a short position in NFLX at the time,
and so was unable to capitalize on this dramatic loss [32].
Figure 3.9. NFLX price over week five
Tuesday 10/25/11
Tuesday I hoped NFLX would continue to plummet and so shorted 200 shares even
though I had missed the large pre-opening drop. In addition to NFLX, I sold BP and AMD, two
companies I had ceased trading for some time. I believed I would be able to revisit my portfolio
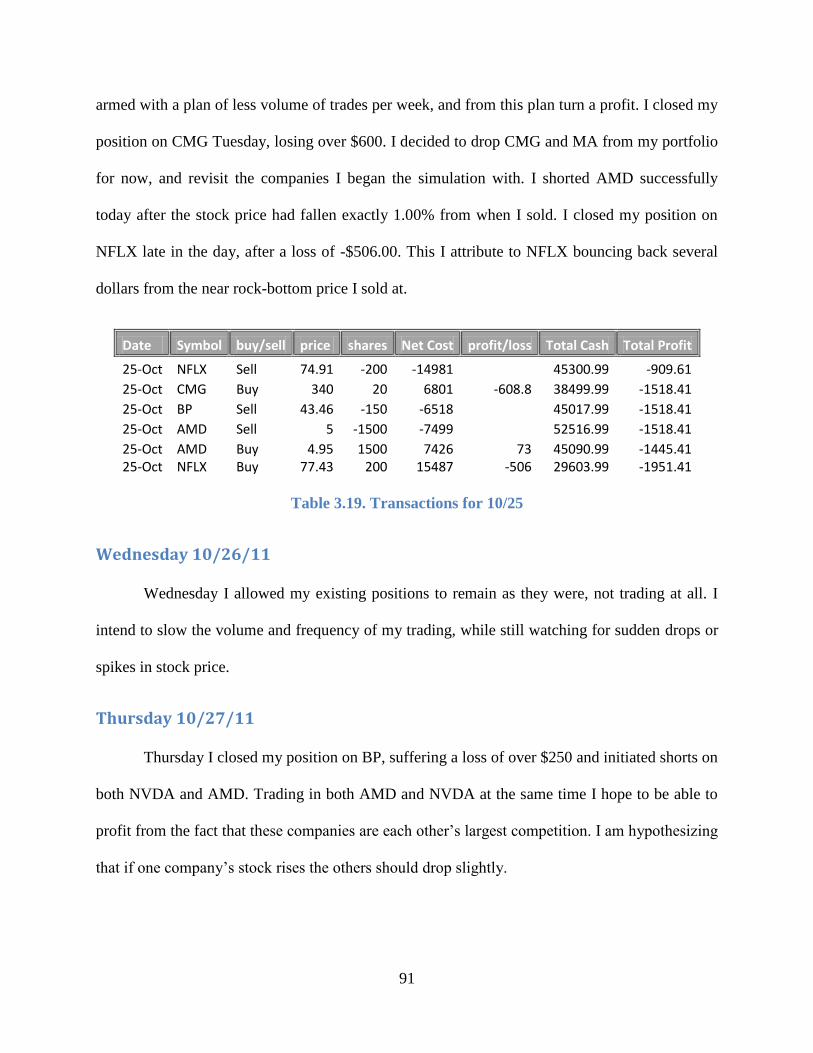
91
armed with a plan of less volume of trades per week, and from this plan turn a profit. I closed my
position on CMG Tuesday, losing over $600. I decided to drop CMG and MA from my portfolio
for now, and revisit the companies I began the simulation with. I shorted AMD successfully
today after the stock price had fallen exactly 1.00% from when I sold. I closed my position on
NFLX late in the day, after a loss of -$506.00. This I attribute to NFLX bouncing back several
dollars from the near rock-bottom price I sold at.
Date Symbol buy/sell price shares Net Cost profit/loss Total Cash Total Profit
25-Oct NFLX Sell 74.91 -200 -14981
45300.99 -909.61
25-Oct CMG Buy 340 20 6801 -608.8 38499.99 -1518.41
25-Oct BP Sell 43.46 -150 -6518
45017.99 -1518.41
25-Oct AMD Sell 5 -1500 -7499
52516.99 -1518.41
25-Oct AMD Buy 4.95 1500 7426 73 45090.99 -1445.41 25-Oct NFLX Buy 77.43 200 15487 -506 29603.99 -1951.41
Table 3.19. Transactions for 10/25
Wednesday 10/26/11
Wednesday I allowed my existing positions to remain as they were, not trading at all. I
intend to slow the volume and frequency of my trading, while still watching for sudden drops or
spikes in stock price.
Thursday 10/27/11
Thursday I closed my position on BP, suffering a loss of over $250 and initiated shorts on
both NVDA and AMD. Trading in both AMD and NVDA at the same time I hope to be able to
profit from the fact that these companies are each other’s largest competition. I am hypothesizing
that if one company’s stock rises the others should drop slightly.

92
Date Symbol buy/sell price shares Net Cost profit/loss Total Cash Total Profit
27-Oct BP buy 45.14 150 6772 -254 22831.99 -2205.41
27-Oct NVDA sell 15.1 -400 -6039
28870.99 -2205.41 27-Oct AMD sell 5.27 -1500 -7904
36774.99 -2205.41
Table 3.20. Transactions for 10/27
Friday 10/28/11
Friday I continued to watch the positions I opened on Thursday, as well as shorting JAG,
SQNM, and FSYS. These companies all rose large percentages before the market opened and I
am confident in my ability to profit from shorting the portfolio I have.
Date Symbol buy/sell price shares Net Cost profit/loss Total Cash Total Profit
28-Oct JAG sell 5.22 -1500 -7829
44603.99 -2205.41
28-Oct SQNM sell 4.7 -1500 -7049
51652.99 -2205.41 28-Oct FSYS sell 23.42 -400 -9367
61019.99 -2205.41
Table 3.21. Transactions for 10/28
I lost a lot of money this week but I am hopeful about prospects for the next week of
trading. Relying entirely on shorting as a means of trading has limited my successes and has
turned me into something of a pessimist. I find that when the market is performing poorly I am
more confident and happier than when the market performs well.
Week 6: 11/1/11
Week six began well for my portfolio. I closed the positions I had allowed to remain open
over the weekend at well-timed points in the day and made a large profit on all fronts. After I
bought NVDA I decided to refrain from shorting them for the near future. I saw a steady rise in
NVDA price with brief, minor drops, leading me to believe that a short position on NVDA
would not be favorable at this stage of my simulation.

93
SQNM dropped steadily this week, although I only profited from this company on
Monday. SQNM released third-quarter earnings announcements later in the week, but this did
little to quell the decline in stock price.
My largest source of profits on Monday was from FSYS. This company fell enough over
the weekend to provide over $400.00 in profits. I decided to ignore FSYS for the remainder of
the week as prices steadily rose. This rise in FSYS price is most likely due to FSYS being
recently selected by General Motors (GM) to be the official supplier of fuel for a new natural-gas
powered vehicle GM will be designing. This close affiliation with such a prominent company
will most likely lead to rising stock price, and a lack of shorting-profitability [20].
Date Symbol buy/sell price shares Net Cost profit/loss Total Cash Total Profit
1-Nov NVDA buy 14.2 400 5681 358 55338.99 -1847.41
1-Nov FSYS buy 22.22 400 8889 478 46449.99 -1369.41 1-Nov SQNM buy 4.6 1500 6901 148 39548.99 -1221.41
Table 3.22. Transactions for 11/1
Tuesday 11/2/11
Tuesday I closed my positions on both AMD and JAG, accumulating large losses from
both. JAG continued to rise past when I closed my position, affirming I got out of the market at
an opportune time.
Date Symbol buy/sell price shares Net Cost profit/loss Total Cash Total Profit
2-Nov AMD buy 5.43 1500 8146 -242 31402.99 -1463.41 2-Nov JAG buy 5.85 1500 8776 -947 22626.99 -2410.41
Table 3.23. Transactions for 11/2

94
Wednesday 11/3/11
Wednesday I saw an opportunity in both AMD and JAG to make a profit. I hypothesized
that both of these companies were at a localized peak of stock price, based off observation of
recent performance. For this reason I sold both JAG and AMD. I ignored other companies in my
portfolio for now, unsure of how performance would be.
Date Symbol buy/sell price shares Net Cost profit/loss Total Cash Total Profit
3-Nov JAG sell 5.94 -1500 -8909
31535.99 -2410.41 3-Nov AMD sell 5.43 -1500 -8144
39679.99 -2410.41
Table 3.24. Transactions for 11/3
For the remainder of this week I did not trade, watching my stocks and waiting for their
price to decline enough to profit. At first both companies rose but then began to fluctuate. I am
confident I will profit from closing my positions during this coming week of trading. At this
point I have realized my own limitations as a trader; mainly lack of time to devote to very short-
term trades. I intend to keep my trading breadth low for the final week of this simulation, and
look forward to analyzing my overall performance.
Week 7: 11/7/11
Monday I began my last week of simulated trading by watching the market. I felt that at
this stage of the simulation I had no need to rush my trades. I monitored my position on both
AMD and JAG, but did not buy either company today. JAG held fairly steady in price for the
duration of the day, a fact which I found uncharacteristic of the company based off of my
observations during this simulation.

95
Figure 3.10. JAG price over week seven
As the graph shows, JAG remained at a level price for Monday, before dropping off later
in the week. AMD dropped slightly during the day Monday, but rose before closing, causing me
to wait to purchase AMD.

96
Figure 3.11. AMD price over week seven
Tuesday 11/8/11
Tuesday I purchased AMD and JAG as soon as I was able in the day, netting a substantial
profit from JAG and an even more substantial loss from AMD. Based on later observation of
AMD price over the following days, if I had held my position until Wednesday or Thursday
before selling, I could have profited.
Date Symbol buy/sell price shares Net Cost profit/loss Total Cash Total Profit
8-Nov AMD buy 5.73 1500 8596 -452 31083.99 -2862.41 8-Nov JAG buy 5.75 1500 8626 283 22457.99 -2579.41
Table 3.25. Transactions for 11/8

97
Wednesday 11/9/11
Wednesday I initiated short positions on several companies, NVDA, BP, and FSYS. My
reasoning was that since I was available to monitor their prices throughout the day I could handle
the slightly increased trading load. I found an opportune time to close FSYS Wednesday before
closing, and netted a profit. BP and NVDA I decided to hold for at least another day before
taking any action.
Date Symbol buy/sell price shares Net Cost profit/loss Total Cash Total Profit
9-Nov NVDA sell 14.76 -400 -5903
28360.99 -2579.41
9-Nov BP sell 42.51 -100 -4250
32610.99 -2579.41
9-Nov FSYS sell 19.72 -300 -5915
38525.99 -2579.41 9-Nov FSYS buy 19.16 300 5749 166 32776.99 -2413.41
Table 3.26. Transactions for 11/9
Thursday 11/10/11
Thursday I closed positions on both NVDA and BP. The profits from NVDA exactly
cancelled the losses incurred from BP so for Thursday I broke even. This close to the end of the
simulation I had a total loss for the entire simulation of -$2413.41, which lead me to believe that
no amount of trading completed in two more days would be sufficient to cancel out this loss.
With this in mind I did not initiate short positions on any other company on Thursday.
Date Symbol buy/sell price shares Net Cost profit/loss Total Cash Total Profit
10-Nov NVDA buy 14.57 400 5829 74 26947.99 -2339.41 10-Nov BP buy 43.23 100 4324 -74 22623.99 -2413.41
Table 3.27. Transactions for 11/10
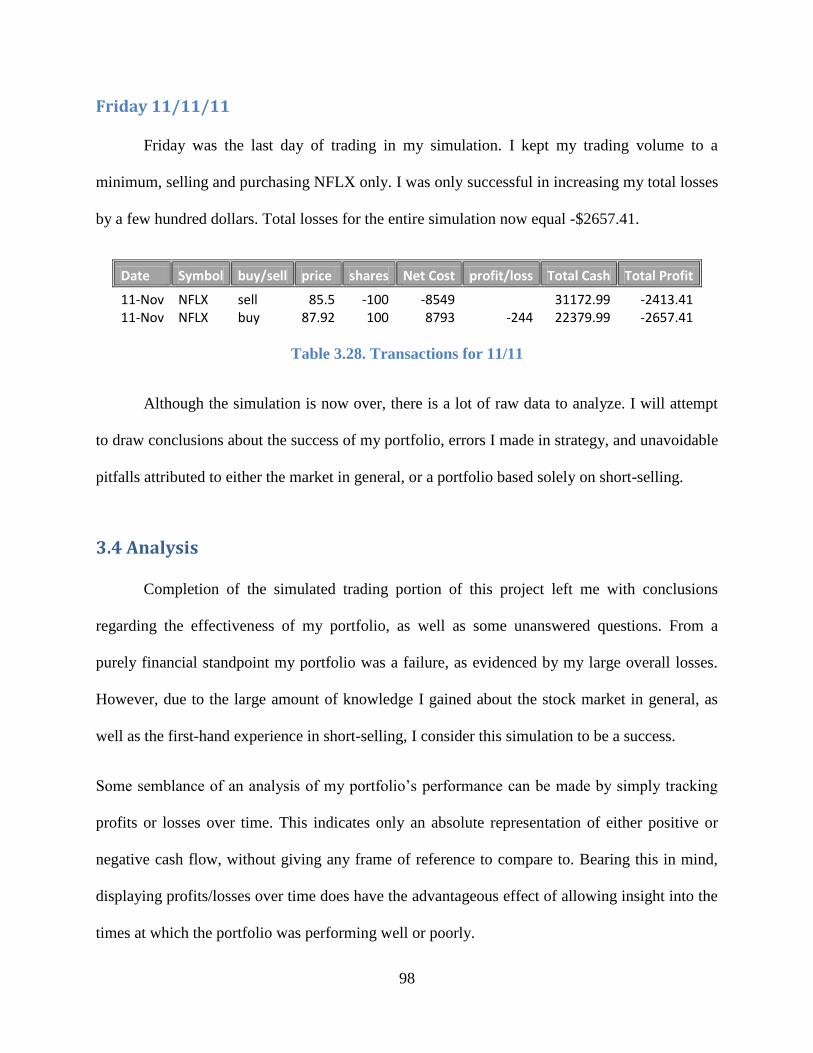
98
Friday 11/11/11
Friday was the last day of trading in my simulation. I kept my trading volume to a
minimum, selling and purchasing NFLX only. I was only successful in increasing my total losses
by a few hundred dollars. Total losses for the entire simulation now equal -$2657.41.
Date Symbol buy/sell price shares Net Cost profit/loss Total Cash Total Profit
11-Nov NFLX sell 85.5 -100 -8549
31172.99 -2413.41 11-Nov NFLX buy 87.92 100 8793 -244 22379.99 -2657.41
Table 3.28. Transactions for 11/11
Although the simulation is now over, there is a lot of raw data to analyze. I will attempt
to draw conclusions about the success of my portfolio, errors I made in strategy, and unavoidable
pitfalls attributed to either the market in general, or a portfolio based solely on short-selling.
3.4 Analysis
Completion of the simulated trading portion of this project left me with conclusions
regarding the effectiveness of my portfolio, as well as some unanswered questions. From a
purely financial standpoint my portfolio was a failure, as evidenced by my large overall losses.
However, due to the large amount of knowledge I gained about the stock market in general, as
well as the first-hand experience in short-selling, I consider this simulation to be a success.
Some semblance of an analysis of my portfolio’s performance can be made by simply tracking
profits or losses over time. This indicates only an absolute representation of either positive or
negative cash flow, without giving any frame of reference to compare to. Bearing this in mind,
displaying profits/losses over time does have the advantageous effect of allowing insight into the
times at which the portfolio was performing well or poorly.

99
Figure 3.12. Total liquid assets over the simulation time
As shown in Fig. 3.12, my portfolio saw the most stability early in the simulation, with
weeks one and two showing the steadiest linear approximations. Late in the simulation, possibly
due to market fluctuations or overly aggressive trading, my portfolio oscillated more rapidly,
ultimately losing $2657.41, or 10.63% over seven weeks of trading.
Plotting the performance of companies in my portfolio against a representation of a larger
portion of the market’s performance is a valuable analytical method. This will show how
successful I was in choosing companies based off of their short-selling profitability. Profitability
from short selling, as previously discussed, arises from volatile stocks, particularly stocks that
drop rapidly in price. I have chosen the S&P 500 as my reference stock to gauge my performance
0
10000
20000
30000
40000
50000
60000
70000
0 20 40 60 80 100 120 140 160
Liq
uid
ass
ets
, in
USD
Transaction number
Week 1
week 2
week 3
week 4
week 5
week 6
week 7
Linear (Week 1)
Linear (week 2)
Linear (week 3)
Linear (week 4)
Linear (week 5)
Linear (week 6)
Linear (week 7)
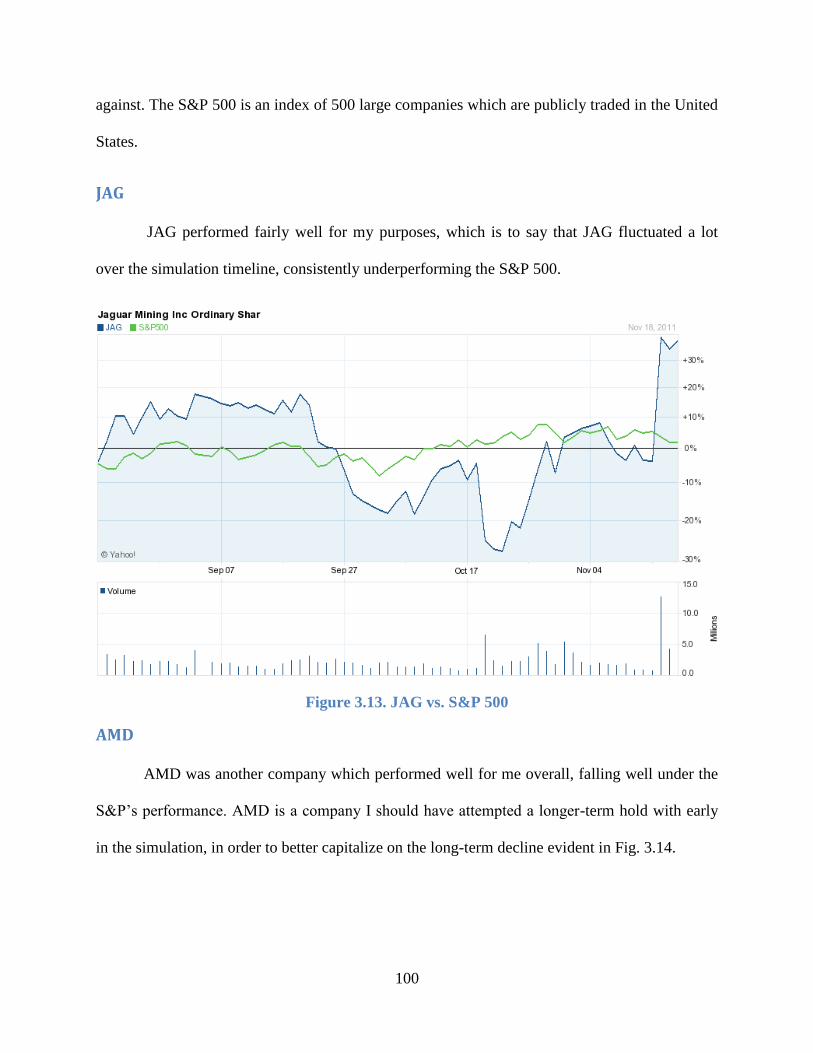
100
against. The S&P 500 is an index of 500 large companies which are publicly traded in the United
States.
JAG
JAG performed fairly well for my purposes, which is to say that JAG fluctuated a lot
over the simulation timeline, consistently underperforming the S&P 500.
Figure 3.13. JAG vs. S&P 500
AMD
AMD was another company which performed well for me overall, falling well under the
S&P’s performance. AMD is a company I should have attempted a longer-term hold with early
in the simulation, in order to better capitalize on the long-term decline evident in Fig. 3.14.

101
Figure 3.14. AMD vs. S&P 500
FSYS
I realize now that FSYS was not as valuable an addition to my portfolio as I thought it
was going to be. This company, while profitable from time to time, did not exhibit the large
drops in price displayed by both AMD and JAG.

102
Figure 3.15. FSYS vs. S&P 500
BP
BP is an example of a company which performed very well over the simulation
timeframe, and was therefore a terrible choice on my part. BP rose consistently over the
simulation time, despite short-term swings.

103
Figure 3.16. BP vs. S&P 500
NFLX
NFLX performed well for my portfolio, falling consistently and by a large amount during
the simulation timeframe. The only way my position on NFLX could have been improved would
be if I had been able to initiate a short position earlier in the year and hold the position until after
the large crash late in the simulation timeline.
NVDA
NVDA was not a good choice for a company to short-sell. NVDA consistently performed
better than the S&P index, with several small drops in price but large overall price increases. I do
not believe my early hypothesis regarding AMD and NVDA price directly affecting each other.
If one of these two companies stock does affect the others, it is only by a minute amount.

104
SQNM
SQNM performed badly overall, and therefore performed well for my portfolio, during
the simulation period. I expected this company to crash rapidly and permanently given their
history involving a fraudulent product.
MA and CMG
Both MA and CMG I believe I should not have bothered trading. These companies were
only added to my portfolio during a time when I was observing unsatisfactory performance by
the other companies in my portfolio. In hindsight, a more correct move would have been to
reduce the volume of trades I made temporarily in order to gain a better grasp of the current
market situation.
In general, I feel that a portfolio based exclusively on short-selling is impractical, and
very difficult to profit from. Profiting from such a singular strategy requires a level of dedication
and time commitment on par with a typical job, making this portfolio all but impossible for the
casual investor. Shorting requires fast action for the short term, and good decision-making for the
long term investments. An interesting experiment would be to repeat my simulation, shorting the
same companies, but doing a long term short. For this experiment I would sell stocks at the
beginning and wait a longer period of time before buying them back. This would be similar but
opposite to the long term buy-and-hold simulation part of this project.
This simulation has taught me a large amount of information about the stock market,
shorting, market tracking, financial decision-making, and damage control. With the lessons
learned through the virtual trading I accomplished, I hope to become a better investor in the
future.

105
4. Simulation C: Leveraged ETFs
My simulation will not differ very much from the traditional trading strategy, with the
only difference being that I am trading in a different type of “stock” that of an Exchange traded
fund. My basic plan will be to Buy at a low price, and sell when the value increases.
4.1 Introduction and Background
Exchange traded funds (ETF) are index funds or trusts that allow for collective trading
based on the overall performance of an entire stock portfolio. This allows for easier trading due
to the treatment of an ETF as a single security. For example, one of my ETFs is based on the
value of gold, and varies based on consumption and availability of gold. Another is based on
technology, and the various companies that make up that sector. Leveraged ETF trading is not a
long term trading plan; instead it looks at a day by day market fluctuation to attempt to make
money.
The goal of a leveraged ETF is to create a larger variance than that of the index of the
leveraged ETF. A leveraged ETF basically takes the gain or loss of an existing ETF and
multiplies it by a value, for example all of my ETF's are multiplied by 2, to get the leveraged
gain or loss. There are also two types of leveraged ETF's: long and short. Long ETF trading
profits when the stocks rise in value. Short ETF trading is where the investor wants the stocks to
fall in value, as money is made off of the depreciation in value of the stocks. My goal is to track
three of these leveraged ETFs on a daily basis, while learning to identify trends in the market and
performance of these ETFs.

106
4.2 Portfolio Strategy and Research
This section will overview the strategy I will be using to trade my ETFs, it will also cover
which ETFs I have selected to trade and the reason for choosing them. In addition it will cover
some of the qualities that these ETFs have and some background information on them.
4.2.1 Trading Strategy
My trading strategy will consist of buying and selling three separate ETFs and watching
them for trends in their performance. My basic strategy is to buy ETFs and wait for an increase
in value of about 5% to sell, and wait for the value to fall and start to rise to buy again. If I buy
an ETF and it continues to fall, I will try and wait for a bottom out point at which I will buy more
of the ETF and wait for it to rise again. If an ETF continues to fall, I will reevaluate and cut my
losses if it seems the value will continue to fall. If one of my tracked ETFs isn't performing in a
very volatile manner, I will monitor the ETF in question while avoiding trading with the ETF
until it becomes more active. I will avoid selling ETFs at a loss unless it seems like there is no
other option, and I will only lose more money by waiting. I will analyze the trends as they occur,
try to become better at predicting how the market will perform to maximize my profits and
minimize my losses. Using our trading program, I will look into using limit orders to
automatically sell at a set value. About halfway through the trading period, I plan on looking at
the performance of my portfolio, and I may look into another strategy of trading ETFs.
4.2.2 Portfolio Selection Criteria
I chose varying ETFs with different bases and both long and short ETFs to try some
varying strategies for trading these ETFs. I wanted to try something that would be more stable
and something that would more volatile too. I hope that trading in multiple sectors and with
107
different types of ETFs will allow me to gauge the market better and learn to anticipate
fluctuations and changes.
4.2.3 Companies Selected
The first ETF that I selected for my trading is Powershares DB Agriculture Double Short
(AGA), a leveraged ETF based on the agriculture sector. AGA is an ETF that is based on the
performance of the agriculture sector as a whole, and is tied into the production and sale of crops
such as corn, soybeans, wheat, and sugar. This ETF is based on the Deutsch Bank Liquid
Commodity Index (DB), which tracks the futures of these commodities.
My second ETF, Powershares DB Gold Double Short (DZZ). DZZ is also related to the
DB and is tied directly into the current value of gold, and it's performance in today’s market.
Both of these DB ETFs are double short, which mean that they are twice as volatile as the
regular ETF, and they rise when the ETF falls. So if the basis ETF drops by 1%, the value of
these two ETFs rises by 2% in value.
The DB was launched in February of 2003, and tracks the performance of crude oil,
heating oil, aluminum, gold, corn and wheat. The DB is unique in that it only trades in these 6
commodities, unlike other commodity groups, and the large portion of energy commodities it
tracks. DB also does constant weighting to evaluate the world production and inventory
providing balanced commodity exposure. The fact that these first two ETFs are traded through
DB makes them a subset of ETF called an Exchange Traded Note (ETN). An ETN performs the
same role as an ETF, except that instead of trading on the performance of the commodity itself
on the market, you are trading a senior debt note that is issued by the bank itself. Because it is

108
issued by a bank there is a chance that an investment would be lost if the bank goes under, but
this is offset by how an ETF comes with taxes and potential tracking errors.
My final ETF is Proshares Ultra Technology (ROM), which is based off of the Dow
Jones US Technology Index (DJTI), is a double long ETF, which means it doubles the
performance of the DJTI, and the ROM rises when the parent index does. An example of this is
if the underlying ETF rises 1% in value, this double long ETF will rise 2% in value. The DJTI is
a section of the Dow Jones Index, which is an index of stocks related to the technology sector of
the stock market. This index is made up of a little over 800 stocks, consisting of software
companies, computer companies, medical research companies, and cell phone companies. A few
examples of these companies are Motorola, Apple Inc. and Google Inc. An index is a way of
evaluating a section of the stock market, and its performance as a whole, and weights each stock
in order to come up with a value for the sector performance.
Dow Jones is a business and financial news company that holds control over many
indices and averaged values that are used to define the performance of the market as a whole by
many. The most prominent index is the Dow Jones Industrial Average, which is an index of
several major companies, including Microsoft, General Electric and Exxon. They also control
many other indices that are used to evaluate sectors of the market, such as the technology index
used in the ROM.
My trading plan for the AGA ETF is to watch for gradual price reductions and try to
anticipate a floor, and buy up shares when the floor is reached, in an attempt to buy in before the
value starts to rise again. This is going to be my slower traded ETF, and will probably be the
most inactive of my traded ETFs. The DZZ ETF will be slightly more volatile than the AGA

109
ETF and will be traded more actively than the other. I will also try to anticipate sudden price
drops in both of these due to sudden downward market fluctuations and trade accordingly, as
these small crashes will cause the value of these ETFs to jump up, and then slowly fall again as
the market climbs back up.
As for the ROM ETF, I expect a much more volatile performance, due to the large
amount of stocks that compose the DJTI, and the overall volatility of the many stocks being
compiled. I plan to watch this ETF on a daily basis, and plan to be much more active in the
trading of this ETF than the other two, due to the large amount of movement I expect. I also plan
to keep an eye on the news, to keep track of anything that might affect the performance of any of
my ETFs, and to act accordingly if I notice anything.
4.3 Transactions
For the actual trading I will be using Interactivebrokers.com to take care of my portfolio
trading and tracking of stocks and ETFs. In addition I have set up a Yahoo Finance account to
track my ETFs, and have an application on my phone set up to keep track of my ETFs. As a
backup I am also tracking all of my trading in a spreadsheet that tracks when I made the trade,
and how much I traded and for what value. This spreadsheet will allow me to present and
analyze my data more easily, and to track my profits.
This section will be organized by date, with weekly performance reviews every Friday. I
will talk about my trades, and profits, and things I could have done differently or things that went
well.

110
Week 1
For the week overall, I made a minor profit on AGA and ROM, and am still waiting for a
value to appear where I can make a profit off of the DZZ shares I hold. I will start trading larger
amounts of shares next week, as I have gained some experience with how the market trends, and
good ways to buy and sell in order to make a profit. I also gained some experience with limit
orders, and know how to use them to trade without actually having to watch the market
constantly. Table 4.1 below shows the record of the transactions I made for my first week of
trading.
Date Symbol Buy/
Sell
Price Shares Net Cost
/Proceeds
Profit/
Loss
Total
Cash
Total
Profit
9/26/11 25000
9/26/11 DZZ Buy 5.39 100 540.00 24460
9/26/11 AGA Buy 17.94 10 180.40 24279.60
9/26/11 ROM Buy 53.37 10 534.70 23744.90
9/26/11 ROM Sell 55.00 10 549.00 14.30 24293.90 14.30
9/27/11 AGA Buy 17.37 50 869.50 23424.40
9/27/11 DZZ Buy 5.11 100 512.00 22912.40
9/28/11 AGA Sell 18.10 60 1085.00 35.10 23997.40 49.4
Table 4.1. Week 1 Transaction Record
9/26/11
For the first week of trading I wanted to start off slowly, so I only spent a small portion of
the overall amount of money I had to work with, so in case my ETFs went down in value I
wouldn't lose too much money. By doing this I hope to ease myself into trading on the market.
Today I bought several shares of each of my ETFs. I bought 100 shares of DZZ at $5.39 a share,
10 shares of AGA at $17.34 a share, and 10 shares of ROM at $53.37 a share. After I bought
these shares, I decided to set up a limit order on interactivebroker.com to sell my shares of ROM
when the value hit $55. The value of the ROM hit $55 at 3:00 that day, and I sold the shares to
111
make a small profit on this. As the day went on the value of DZZ started to go down, so I set up
another limit order to sell when the value hit $5.45. The value of AGA also started to drop so I
set up another order to sell this ETF when the value hit $18.10.
Today I made a small profit on my ROM ETF, bought my other two ETFs at a high point,
and the value of these two started to drop off. I set up my limit order so that even if I wasn't
actively watching the market, the trade would still go through and I would make a profit. I will
also try to stick with this original value In order to keep a steady profit going, though this
number may have to be changed depending on the performance in the days to come. I realized
today that I should wait for a low point in the value of the stock to buy shares; otherwise there is
a possibility for loss.
9/27/11
Tuesday the market for ROM went up to $58 a share, and I realized from this that I
needed to set higher values for the limit orders, just in case there was a potential for me to make
a larger profit. This little mistake taught me the value of limit orders, and how there is a large
potential for easy trading with limit orders, due to the ability to set and forget a selling point.
Besides the fact that I sold my ROM shares too early, I still made a profit, which is always a
good thing.
Today the value of AGA and DZZ dropped even further, so at about noon I bought
several more shares of both of these stocks. I bought 50 shares of AGA at $17.37 a share, and
100 more shares of DZZ at $5.11 a share. When I did this, I added both of these amounts to the
existing limit orders, so that I would sell all of my stocks at the value I chose. The rest of the day
was uneventful, as all three ETFs stayed at a stable value.

112
9/28/11
On Wednesday, at about 2:00 PM, one of my limit orders went through, and I sold 60
shares of AGA at $18.10 a share, making a nice profit on these shares. However, just that day
the value went all the way up to $18.35 a share at one point, and I realized again that I should
start putting higher values on these limit orders. Also on Wednesday the market for DZZ started
to rise again, and the ROM started to decline in value. However the value of DZZ didn't get up
to the selling point I had set, and I decided at that point that I should lower the threshold of the
limit order to $5.40 a share, in hopes that the market would reach that point sooner.
Wednesday was altogether a stable day, as the values didn’t change much as the day went
on, and there were no real opportunities for trading, as I had no real idea where the market would
go the next day. I hope that as the weeks go by, I will be better able to anticipate where the
market will trend in days after steady days like today.
9/29/11
Thursday I didn't get a chance to make any real trades, as the market remained fairly
stable, with no real changes occurring in the overall value of my ETFs. ROM did continue to
slowly drop off as the day went on, but it hadn’t yet reached a point I thought would be a good
point to buy. This is due to the hope for a better profit margin to appear, and due to transaction
costs, it might not be cost effective to buy at this point in time. DZZ still didn't reach a point at
which my limit order would go through, so I continued to hold onto those shares. And AGA
dropped off slightly as the day went on. Altogether it was a stable day, with no real reason
appearing to trade at all.
113
9/30/11
Friday was a bad day for my portfolio, as I didn’t get a chance to check up on the market
until after the trading day was over. DZZ continued to hover around $5.35 a share, not quite
reaching my selling point, and stayed stable throughout the day. However I lost a huge
opportunity to buy ROM shares, as the price dropped significantly to about $51.50 a share,
which could have led to a huge potential to make a large profit when the value climbed again, as
I am sure this was a low point in the value of this ETF. AGA spiked up overnight to a value of
almost $18.90 a share, which again emphasized the fact that I had sold my shares of this much
too early, showing me I need to set up my limit orders with a larger profit margin in mind and
sell manually if I think I'm going to lose money if I wait any longer.
Today taught me I should set up several limit orders that will be long standing in order to
take advantage of sudden changes in the market. I also learned that I should definitely keep track
of my stocks every day, and try and make time to make some trades. After I had time to check
up on the market, I set up a limit order to buy shares of ROM, just in case the market drops over
the weekend, in hopes I can salvage this lost opportunity.
Week 2
As a weekly review, I made a nice profit off two of my ETFs, and made a little over
$1000 in profit, while learning of a flaw in our trading program, and making a profit regardless.
I also learned a little bit about when to cut my losses and just sell regardless of the price if I
notice a trend I don’t like. I also saw an example of my first news related value change, and I
have theorized as to why it affected the value. Table 4.2 below shows a record of the
transactions I made for week 2.

114
Date Symbol Buy/
Sell
Price Shares Net Cost
/Proceeds
Profit/
Loss
Total
Cash
Total
Profit
10/03/11 ROM Buy 51.00 200 10201.00 13796.40
10/03/11 DZZ Buy 5.10 800 4081.00 9715.4
10/04/11 DZZ Sell 5.35 1000 5349.0 216.00 15064.40 265.40
10/06/11 ROM Sell 54.79 200 10957.00 756.00 26021.40 1021.4
10/06/11 DZZ Buy 5.15 2000 10301.00 15720.40
Table 4.2. Week 2 Transaction Record
10/3/11
Monday of this week was an interesting learning experience for me. This is because of
the trade I set up Friday after the market closed, which I had set to buy shares of ROM at $51 a
share. What happened is that the stock dipped down to almost $49 a share, and the program
waited till the stock came back up to $51 to buy, which means I lost a large potential profit due
to a program error. So the trade I had set up went through and I bought 200 shares of ROM at
$51 a share. I also saw that the value of DZZ dropped slightly and I decided that I should buy
some more of that ETF, and I bought 800 shares at $5.10 a share.
So on Monday I bought several large quantities of ETFs, and decided that I needed to
change my standing trades in order to make a small profit, and I set the trade up to sell all 1000
shares of DZZ at $5.35 a share, which would be a small loss on my original 100 shares, but
overall it would turn a profit, and with the consideration that the value has not climbed very high
in recent days, I decided it was a safer bet than watching the market fall again later.
10/4/11
Tuesday was a profitable day for me, and my ETFs started to rise in value. DZZ finally
hit my selling point, and I sold all 1000 shares for a $216 profit. I continued to watch my shares
of ROM, but they didn’t reach a point at which I considered it a good time to sell. AGA

115
continued to stay at a stable level, not reaching a point where I thought it would be safe to buy,
so I continued to monitor the value of the ETF, but took no action with it.
The trading of DZZ taught me a lesson in cutting my losses on some shares, in order to
still make a profit, as I sold at a lower value than I bought some, but I also still made a profit
when I bought even more shares at a much lower value. Tuesday was a profitable day, but I
couldn’t do much trading due to the relative stability of the market.
10/5/11
Wednesday was a slow day for me, as not much at all happened. None of my shares
appeared worth selling, and nothing dropped significantly enough to be worth buying. So
altogether it was a boring trading day and I wasn’t able to do much trading wise. There was
some motion in ETF values, just not significant enough for my trading strategy.
10/6/11
Thursday was another good day for me. I kept an eye on the value of my ROM ETF, and
I decided it had reached a good selling point at a little under $55, and decided to sell at market
price immediately. So I ended up selling 200 shares at $54.79 a share, which led to a profit of
$756 on this trade. This is the largest single profit I have made so far in this simulation.
However, as that day came to a close, I realized I had sold a little too early, and the value of
ROM reached $55.50 a share, and I lost about $100 in profit due to this sell, but as I see it a
profit is still a profit, which is always good. In addition on Thursday, the value of DZZ dropped
to about $5.15, and I decided that it was a good point to buy, so I bought 2000 shares of DZZ at
this price, and set up an automatic sell when this price reached 5.40$ a share.

116
10/7/11
Friday was another relatively slow day for me, I only owned shares in DZZ and that
value stayed at about the same price that I had bought at, though I did notice a sudden spike in
the value, which appears to coincide directly with an article that appeared talking about the
appearance of a local bottom in the underlying gold price. I cannot discern how this cause my
ETF value to suddenly jump, thought I theorize it is due to the sudden selling of stocks, or
something similar, that would cause a sudden drop in the underlying value of gold that would
cause my ETF to jump up in value rapidly.
Week 3
Overall for the week I didn’t get an opportunity to make many trades, as the market
seems to be staying fairly consistent in its trends, either upwards or downwards, and my ability
to trade seems to be slowing down. The trades I did make for this week are shown in Table 4.3
below.
Date Symbol Buy/Sell Price Shares Net Cost
/Proceeds
Profit/Loss Total
Cash
Total
Profit
10/11/11 AGA Buy 16.79 400 6717.00 9003.40
Table 4.3. Week 3 Transaction Record
10/10/11
Monday started off slowly, with the values not being very volatile, and the values staying
fairly stable, and not allowing for very much trading. I only currently own shares in DZZ, and
that value didn’t change by a large enough margin to cause my trade to go through.
The ROM and AGA also stayed at a consistent value, and didn’t appear to be at a good
buying point, so I decided to hold off on buying anything today.

117
10/11/11
Tuesday saw a sharp decline in the value of AGA, which prompted me to buy 400 shares
at $16.79. I set up a automatic sell immediately to sell these shares at $17.15.
This sudden drop in the value of AGA is because of the sudden large increase in the
value of corn and wheat futures, as a large majority of these crops grown in the US were
harvested around this time, and the sudden spike is due to the large sale and movement of these
crops. It’s probable that this price will stay low for a long period of time, but I decided to buy at
this point just in case it rose again for another reason. The price of these crops will drop again as
the winter comes, due to the fact that more of these crops will be moved from overseas into the
United States.
The values of DZZ and ROM continued to stay consistent, with ROM slowly continuing
to rise in value, reaching a maximum today of ~$59.50. DZZ stayed at a fairly constant value
from Monday, with a small rise in value.
10/12/11
Wednesday brought changes in all three ETFs, but nothing drastic enough to warrant a
change. ROM continued to rise, making me regret selling what I held late last week, as the price
has rising almost 5 dollars from my sell point. DZZ dropped off back to a similar price to
Monday’s, and AGA rose slightly, but not enough to cause me to sell.
10/13/11
Thursday was another fairly boring trading day for me, as nothing much happened.
DZZ rose a small amount, ROM continued its rising trend, and AGA stayed fairly consistent,
with a large spike then drop in the middle of the trading day.

118
10/14/11
Friday brought another sudden drop in the value of AGA, probably due to the increase in
movement of more US grown crops, as they are continuing to be harvested around the country.
However I decided not to buy additional shares of AGA due to the unknown of where this ETF
was going to start heading in value.
DZZ dropped slightly during the day, and ROM continued its rise in value. My theory
for why ROM continued to rise is due to the fact that many gaming companies are part of ROM,
and early November and late October are periods during which many game releases occur, which
would cause values to rise as a sudden buying of their product occurs.
Week 4
Overall the week was a slow one, I did manage to make a profit when the value of DZZ
reached a high enough point to sell, but overall the market wasn’t volatile enough were trading
was feasible this week. Table 4.4 will show the transaction I made for this week.
Date Symbol Buy/Sell Price Shares Net Cost
/Proceeds
Profit/Loss Total
Cash
Total
Profit
10/20/11 DZZ Sell 5.40 2000 10799.00 498.00 19802.00 1519.40
Table 4.4. Week 4 Transaction Record
10/17/11
Monday brought little to no change in the values of the various ETFs, with DZZ and
AGA remaining constant over the weekend, and ROM finally dropping off slightly. ROM
continued to drop off for the duration of the day, which I believe implied a downward trend for
the week.

119
10/18/11
Tuesday brought about sudden upward spikes in DZZ and AGA, which within the first
few hours of the trading day dropped back down to values similar to Monday’s values. ROM
dropped slightly then rose as the day went on, but staying at fairly consistent levels overall.
Tuesday was overall a useless trading day, and there was no opportunity for any smart trading.
10/19/11
Wednesday brought minor increases in the value of AGA and DZZ, and a slight drop in
the value of ROM, but overall nothing drastic enough to cause a trade to be a smart choice.
10/20/11
Thursday brought more increases in the value of AGA and DZZ, and was enough that my
standing trade for the sale of DZZ at 5.40 a share went through towards the middle of the day.
This means I sold my 2000 stocks of DZZ for a total of a $598 profit. AGA didn’t reach a point
today where I considered it a good point to sell however, and I continued to hold onto those
shares.
10/21/11
Friday brought about a drop in DZZ and AGA, and a small rise in ROM. This led to
Friday becoming another slow day for the trade of these ETFs. One weird thing that happened
over the course of Friday however was the rapid rise in the value of AGA towards the end of the
trading day.
Week 5
For the week overall, I got a great opportunity to buy DZZ at the lowest I’ve seen it yet. I
hope to get a chance to sell this for a great profit potential, I continue to hold onto 400 shares of

120
AGA, waiting for a good time to sell, and I now added 3000 shares of DZZ to that. I hope that
over the weekend the price will spike on these ETFs, and I have a chance to sell them for a good
profit. Table 4.5 below contains the transaction record for this week.
Date Symbol Buy/Sell Price Shares Net Cost
/Proceeds
Profit/Loss Total
Cash
Total
Profit
10/26/11 DZZ Buy 4.62 4000 13861.00 5934.40
Table 4.5. Week 5 Transaction Record
10/24/11
Monday of this week started off with a drop in the value of AGA and DZZ and a small
rise in the value of ROM. The trading continues to be slow and the very gradual slow changes
doesn’t allow for very active trading.
10/25/11
Tuesday brought about an interesting development, AGA and ROM continued on there
gradual changes, with not a whole lot happening in the value of these ETFs. However the value
of DZZ dropped very suddenly a few hours into the trading day, where the value dropped almost
5% over the course of an hour or so. I have found several articles relating to this rise in the price
of gold, which leads to a drop in DZZ, is due to the financial crisis in Greece, and the relation to
the bailout plan for Greece. This is because there are plans to use a large quantity of gold in
order to bailout Greece, and because of this the value of gold seems to be on the rise. This
sudden dropped seemed to signal a good time to buy, with the hopes that the price would start to
climb back up as things started to settle.
121
10/26/11
Wednesday brought about a great opportunity to buy up shares of DZZ, as the price
continued to drop, reaching a point of about $4.62 a share, which prompted me to buy 3000
shares. I set up an order that would sell these shares at $5.10 a share, hopefully netting me quite
a nice profit.
AGA was holding steady early in the day, but spiked suddenly, which I believe is due to
the release of some information relating to the increase in cost it takes to grow crops, as
compared to past years. This would cause a drop in the base value of crops, due to the lower
profit margin that growers are showing this year.
ROM held fairly steady today, and continued to show no opportunity for and trading in
this ETF.
10/27/11
Thursday brought about even more value drop in DZZ, and it made me regret not waiting
for an even lower point to buy up these shares. AGA dropped down overnight, and continued to
drop in value as the day went on. ROM however did well, and the value went up from
Wednesday, and stayed steady throughout the trading day.
10/28/11
Friday was the most boring day of the week for me trading wise, and everything stayed at
a consistent level from the previous day, with no real value change at all.
Week 6
Overall week five went fairly well, my shares in AGA reached a point I was comfortable
to sell at and I made a profit of $194.00 when I sold 400 shares. DZZ continued to stay at a low

122
point, which meant I was unable to sell the shares I am holding, and ROM stayed at a high value,
which meant I couldn’t trade at all in ROM this week. My transaction for week 6 is contained in
table 4.5 below.
Date Symbol Buy/Sell Price Shares Net Cost
/Proceeds
Profit/Loss Total
Cash
Total
Profit
11/01/11 AGA Sell 17.28 400 6911.00 194.00 12846.40 1713.40
Table 4.6. Week 6 Transaction Record
10/31/11
Monday was a fairly steady day, and the market didn’t change very much over the
weekend. ROM stayed high, AGA stayed low, and DZZ stayed at its average from last week.
11/01/11
Tuesday was a good day for me, as my AGA stocks reached a high point, and I was able
to make a profit off of the shares I bought last week. I sold 400 shares of AGA at $17.28 for a
nice profit. ROM dropped a few percent and in hindsight would have been a great time to buy
some shares of ROM. DZZ increased somewhat overnight and dropped off over the day, but
never reached a point where selling my shares would have led to any sort of decent profit, so I
decided to wait it out.
11/02/11
Wednesday was another average day, ROM increased in value somewhat from Tuesday,
AGA dropped off again, and DZZ dropped off even more. Overall a slow day and it wasn’t a
good day for trading.

123
11/02/11
Thursday was another slow trading day, with DZZ dropping off even more, AGA stayed
about the same, and ROM increased again.
11/03/11
Friday was another bad day for me, with all three ETFs staying about the exact same as
Thursday.
Week 7
Week 7 was another slow week for me, and I ended up having to close out my shares of
DZZ at a loss, which wouldn’t have happened in the long run if I had a choice here. I would
have kept hold of those shares until I could sell for a profit, and only due to the fact we had to
close all our active shares did I take a loss, theoretically. I of course have no idea where the
market would go, but I would hope the market would fall again later, so I could make a profit off
those DZZ shares. During this last week, I also realized that my trading slowed down in the last
few weeks, due to the fact that I was used to the volatility of the market in the first few weeks
and I didn’t feel comfortable trading with the market so stable. I also realized this stability
would mean long term trading would be more effective, and I was used to a faster trading
strategy, and I wasn’t able to enact a long term plan with the end of our simulation occurring
soon. Due to the stability of the market for this last week, and the only trades that occurred
being the sale of my DZZ, I am not going to do a day by day discussion, as there is not much to
talk about for each day. My trade for the week is detailed in Table 7 below.

124
Date Symbol Buy/Sell Price Shares Net Cost
/Proceeds
Profit/Loss Total
Cash
Total
Profit
11/11/11 DZZ Sell 4.34 3000 13019.00 -842.00 25871.4 871.4
Table 4.7. Week 7 Transaction Record
4.4 Analysis
Trading with leveraged ETF’s was an interesting way to get into the trading market, as
the volatility of the market varied greatly with each day, and it made trading in these ETFs
difficult. This was made especially hard due to my lack of experience overall in trading, and I
didn’t have very good judgment in trading. The very basic strategy I took to heart when trading
these ETFs was essentially an easy strategy, and one that is used by many traders on the market
today, the “buy low sell high” policy, and it did fairly well for me. Not considering the losses I
took at the end of the simulation, which were due to and ending of the trading period, I made
close to 7% in profit in a few short weeks. I considered this a very good profit rate, and I feel I
would have continued this trend if the trading period went on for a longer period of time.
Throughout the trading time I learned many things about the market, and about predicting
market trends, and noticing strong market fluctuation. I also got better at the recognition of
floors and ceilings, and managed to trade profitably, almost from the get go. However my
trading slowed down in the last few weeks, as the sudden market stability made me hesitant to
trade, because I was unsure of the correct time to buy and/or sell shares of my ETFs. I realize
after the fact that I was too used to the strong market fluctuation, and that I should have started
looking for smaller profit margins as the market started to slow down, and that my desire for big
profits all at once prevented me from making any good profit later in the trading simulation
period.
125
One thing I noticed throughout the trading period is that my strategy was not one of the
most efficient strategies for trading these leveraged ETFs, mainly due to the fact that there was
no real difference from trading in regular stocks. A strategy I read about during my research, but
didn’t feel I had the experience to really enact, was the idea of trading in both the short and long
versions of a specific parent ETF. For this idea, one would sell one of them, maybe the short
ETF, and buy stocks in the long ETF using the money from selling in the short. One would then
wait for the short to fall and the long to rise, and potentially double the profits off of the
performance of one stock, however a downside to this approach is the potential for large losses
instead of profits. Because of this I felt this strategy was much too risky for me, a first time
trader, to attempt, but thought it would make sense for an experienced trader.
Another problem that appeared as the simulation period went on was my inability to take
action on some of the opportunities that appeared when I was unable to actively trade, such as
when I was in class. This hindrance cost me opportunities that a full time trader would not have
missed, and it makes trading like this almost a full time job, and a hard strategy to enact when
one is not a full time trader.
Overall I feel that this strategy has great potential for profit, but from the perspective of a
college student with little experience in the market, I would much rather work a strategy that
requires much less time and effort. There are also other strategies for trading in leveraged ETFs
that I didn’t have time to look into, but likely require a much more experienced person working
full time as a trader to fully take advantage of.

126
5. Simulation D: Long Option Straddles Prior to Earnings
Announcements
This simulation is based around the idea that volatility of a stock is increased during an
earnings announcement for a company and that this can be used to profit through the use of a
long option straddle, as explained in detail below.
5.1 Introduction and Background
Since ancient times the concept of using what we refer to today as an option (in the sense
of the financial contract) has been used to do business. London saw the use of calls (referred to
as “refusals”) and puts starting just before the turn of the 18th
century. America saw the use of
options referred to as “privileges” in the 19th
century. In today’s world markets, there is an
incredible variety in the types of options – those other than the basic calls and puts (vanilla
options) are called exotic options. For the purposes of this project, we will only be using vanilla
options, albeit in certain combinations called straddles.
Options provide a unique set of contract terms that allow the buyer the right, but not
obligation to buy (or sell) a certain asset (called the underlying) at a predetermined price (called
the strike price). For instance if party A sells party B a $5 call option contract for XYZ stock
with a strike price of $25 and an expiry of July 1st, party B is given the choice on July 1
st to buy
100 XYZ stock for $25 per stock from party A, regardless of the current price. If the current
price of XYZ is greater than $25, party B will exercise the option, purchasing the stock and
immediately has an unrealized profit of the difference between the current price and $25 (and a
realized loss of the $5 for the purchase of the contract). If the current price is below $25, then it
does not make sense for party B to exercise the option and the option contract is allowed to

127
expire, leaving with party with a realized loss of $5. A put option works in the same way, except
it is the right to sell to party A, and it only makes sense to exercise if the current price is below
the strike price. In most cases a trader will sell the underlying immediately after purchasing in
the case of exercise of a call option (or buying to cover in the case of a put option), turning the
unrealized profit into an immediate realized profit. The overall profit then becomes the
difference of the cost of the option and the profit, if any, of the exercise of the option. This type
of option is a European option – American options work the same way with the exception that
they allow for early exercise; that is the buyer is allowed to exercise the option prior to expiry.
For the purposes of this project, we will use American options, simply for sake of convenience
while simulating trading on an American stock exchange.
There are a variety of ways options can be used in combination in order to either limit
potential profit-loss range or modify the way a trader profits relative to the movement in the
price of the underlying. In this simulation, only one such combination will be used; this
combination is a long straddle, formed by buying a call option and put option on the same
underlying with the same strike price and expiry. This creates an interesting payoff diagram – the
payoff is independent of the direction of the underlying’s price, but depends solely on the
absolute value of the difference between the strike price of the two options (remembering that
they were purchased to have the same strike) and the current price of the underlying. Because
both options are bought, there is a realized loss from the get-go, but the farther the underlying
moves from the strike price, the less the loss (assuming the resulting underlying position is
covered immediately, keeping in mind that it only makes sense to exercise one of the options
since the underlying asset’s price is either above or below the strike, or at the strike price, in
which case exercise has no effect), until it moves far enough away from the strike price that a
128
positive profit is achieved. This strategy is used based on a prediction that the price of the
underlying will make a significant movement in one direction or another before or at the expiry
of the options. If the underlying’s price reaches a point in which the profit with early exercise
would prove satisfactory to the trader, selling the options rather than exercising them would
increase profit. This difference in profit comes from the time value, i.e. because of the time value
of money due to the interest rate and the possibility that the option could become a more
favorable position, it has an intrinsically higher value than just the value inherited from the
difference between underlying and strike prices.
Companies typically have an earnings announcement on a quarterly basis in order to keep
investors up-to-date on the performance of the company in regards to its overall cash flow. There
is often a “market prediction” approximating what the earnings for the quarter (or other time
period since the last earnings announcement) will be, and this can lead to what is referred to as
an “earnings surprise,” if the actual announced earnings are significantly different from the
prediction, whether they are positive or disappointing. In the case of an earnings announcement
leading to an earnings surprise, the stock price of the respective company can be expected to
react accordingly, rising on positive news, falling if negative, proportionally, to an extent, to the
degree of the surprise. This sharp movement in price with an unknown direction makes for a
prime opportunity to use a long straddle, which is what this project seeks to test.
5.2 Portfolio Strategy and Research
5.2.1 Trading Strategy
The strategy of this simulation is to purchase a call and put option at-the-money (i.e. with
a strike price equal to the current stock price) prior to a scheduled earnings announcement of the
underlying company in the hopes that there will be significant enough earnings surprises to

129
generate enough movement in the underlying stock’s price to push the profit of the long straddle
into the positive, enough to offset any losses from straddles due to a lack of earnings surprise or
other unforeseen events that keep the stock price stable. Variables that are subject to trial-and-
error are the size of the company (e.g. small-cap versus large-cap companies), the liquidity of the
underlying (most likely directly correlated with the size of the company), the length of time
between the purchase date and the announcement date, the length of time between the purchase
date and expiry (and consequently the length of time between the announcement date and
expiry), and possibly the historical accuracy of earnings predictions for a certain company.
Take Greenbrier Companies (Ticker: GBX) for example. At closing on September 23rd
,
the stock price was at 12.48, a call option with a strike roughly at-the-money (K = 12.5) and an
expiry of October 11th
was priced at $0.98, and a put option with the same strike and expiry was
priced at $1.30. To purchase a long straddle would thus cost $2.28. Below is a diagram showing
the profit function of the two options separately and the long straddle if the options were
exercised [45].

130
Figure 5.1. Option Long Straddle, Call Option and Put Option vs. Underlying Stock Price
The x-axis is the stock price at exercise, while the y-axis is of course the profit. For a profit, the
stock must move either above $14.78 or below $10.22. Greenbrier has an earnings
announcement planned for September 30th
as this is being written. If the options were to be
exercised on this day, even with the predicted volatility due to the announcement, the chance of
the stock moving 18.4% or -18.2% is highly unlikely. This leads to the conclusion that the
options cannot be exercised if a profit is desired. Instead as mentioned above, the options must
be sold. There is no exact formula to determine how the market price of an option will react to a
change (although Black-Scholes formula can be used to price theoretical prices of European-
style options), so it isn’t possible to construct a similar graph with the independent variable as
stock price. The hypothesis of this simulation is that the movement in the stock price will be
sufficiently great that the sum of the changes in the prices of the call and put options will be
strictly positive. One immediate concern is that an option with an expiry in less than a month will
-3
-2
-1
0
1
2
3
4
8 9 10 11 12 13 14 15 16 17
Call
Put
Long Straddle

131
lose value simply based on the passage of time more quickly than say an option with an expiry of
three months (keeping in mind that time value grows exponentially with time, so theoretically an
option’s time value will degrade in a logarithmic manner). To test this hypothesis, the first
week’s purchases will include long straddles such that for each company, there are varying
lengths till expiry in order to compare the results the following week and act accordingly.
5.2.2 Portfolio Selection Criteria
The strike price will be chosen throughout the project so that the moneyness (the
relationship between strike and current stock price) is at-the-money, because the focus is solely
on the absolute volatility of stocks, not on predicting the direction of their performance as that
would be an entirely different type of simulation. Depending on the week, I will test different
variations for variables such as time between announcement and expiry, time between
announcement and option purchase, or average trading volume of the underlying. Because there
are obviously a limited number of companies giving an earnings announcement on any given
day, the ability to change the independent variable to different levels and keep the other variables
either constant or otherwise controlled is limited, but it will be done as best as circumstances
allow.
For the first week, I will be buying the options for the long straddle on Monday,
September 26th
for companies that have earnings announcements on Friday, September 30th
(some are before trading hours, some are during trading hours and some are after trading hours –
in the case of the third, the options obviously can’t be sold until the following week at the open
of trading on Monday). For this week, I will not be using stop or limit orders to let the brokerage
automatically place the trades, but rather watch the market real-time to try to determine when the
appropriate time to close the position is. Theoretically the change in price due to the content of

132
the announcement will occur very quickly – within minutes or even seconds, because the market
is extremely efficient is generally able to react to news rapidly due to the liquidity produced by
market makers (i.e. companies or individuals who attempt to profit from the range of the bid-ask
spread).
5.3 Transactions
9/24/11
On Monday, September 26th
, the planned trades are of an equal number of call and put
options on BioDelivery Sciences International Inc. (Ticker: BDSI) with a strike of $2.50 and
expiries of October 21st, November 18
th, December 16
th, and March 16
th (2012); on NRG Energy
Inc. (Ticker: NRG) with a strike of $22 and same expiries; and on Greenbrier Companies
(Ticker: GBX) with a strike of $12.50 and same expiries. This will naturally create the desired
long straddles as the strikes are all chosen to be as close to the current trading price as possible
and the number of calls and puts on each stock is of course equal. These companies all have
earnings announcements Friday of the same week (September 30th
) and the positions on their
options will be closed as soon as the market reacts to the news and it is feasible to do so (i.e. the
market orders go through and obviously that the market is open for trading). As mentioned, these
will be market orders placed manually at such a time at which it appears that the market has fully
reacted to the content of the earnings announcements. The three month average trading volume
for each company is, respectively, about 121K, 3,127K, and 654K. Because it is not possible to
keep the volumes constant, the data produced after the simulated trading next week will be
analyzed to compare how the expiry date affects the profit margin within the companies’ options
so as to not be influenced by the varying volumes [45].

133
9/24/11
I entered in the trades today as specified above. I decided to use limit orders on all of the
trades, using good-till-canceled (or GTC) and used Interactive Brokers’ “SMART” option for
choosing which exchange to trade on (this increases my chances of the trade going through at the
limit-specified trade by not limiting the order to only one exchange). Because of the low-
liquidity of the underlying stocks, especially for BDSI and GBX, and thus even lower liquidity
of their options as is the general case, there is a large bid-ask spread, which is simply the
difference between the bid and the ask of a financial product. The ask is the price a seller is
willing to trade at, and the bid is the price a buyer is willing to trade at. Obviously the ask price
is always higher than the bid price. For some of BDSI’s options, the bid-ask spread was as large
as $0.50, which doesn’t seem like much until you consider that the options are only trading
around a dollar or two – an incredible spread of almost 50%. Because of this immense spread
size, using a limit order helps to get a price closer to the “mark” value of the option. Using a buy
market order on a low-liquidity financial product will often lead to a trader receiving a price
closer to the ask price (much higher than the quote value, i.e. last value traded at). The limit
order set at the quote value has the risk of not going through right away – or even at all, but does
help curb the risk of getting an overpriced trade. In the case of selling with a market order, the
effect is same, but because the price traded will often be much closer to the bid price, and thus be
sold underpriced. Using GTC on my orders is so if the order doesn’t go through on the same
trading day, I won’t have to reenter the trade the next morning, etc.
9/30/11
While a trader would see the results of this week as a devastating loss, as a student
learning, I found them to be incredibly enlightening and useful for future trading. Overall I lost
134
$2,025 in realized profits plus transactions costs, and still have about $2,780 in unrealized losses
from the options that did not sell on Friday because of low liquidity. Overall I ended up losing
close to $5,000 from my original $25,000 share of the initial $100,000 portfolio value for a grand
total loss of just under 20% in a week’s worth of trading (and 5% for the group overall), which
again, from the viewpoint of a trader would catastrophically bad and a good sign to find another
job, but as a student it was an incredible learning experience for just a week’s time.
Below is a table (Figure 5.2) showing all of my transactions and their consequential
profits and losses, respectively.

135
Table 5.1. Results from Week 1 of Trading
As one can see from the table, BDSI lead to the majority of my intense losses, accounting
for $1,200 of the realized losses (almost 60%, which translates into a portfolio loss of my portion
of about 5%) and over $2,500 in unrealized losses (the only unrealized losses as all other
positions were successfully closed before trading hours ended on Friday, translating into over
11% loss for my portion of the portfolio). As mentioned in the 9/29 Transactions entry, BDSI
had the lowest trading volume (at a meager 121,000 trades per day of the underlying stock) and
by definition the lowest liquidity. This lead to two especially negative consequences: first, the

136
limit orders for the put options never went through, and second, the call option positions were
never closed. The first result was disastrous for the straddle trading strategy because the straddle
was never formed! Had the put orders gone through successfully, the profits would have been
outstanding due to the tremendous loss in the underlying – over 60% in overnight trading
Wednesday night. Naturally because the call options were the only trades to go through, the
options with expiry around the corner lost nearly all their value, while the longer-term options
retained some value due merely to time-value. The second result – the call option positions not
closing – has led to there being the potential for even greater losses. Overnight trading this
weekend put BDSI up about 10% as of writing this section, which will decrease unrealized losses
slightly, but nowhere near the scale of the losses to begin with. GBX also has lower liquidity
(trading volume was just over half a million at 654,000 trades per day) leading to some of the
trades not going in until Friday, the day when I was selling on. NRG having greater liquidity
(over 3 million trades per day) traded much better and all of the option orders went through
smoothly. Another advantage was that the bid-ask spread was not nearly as large and this may
have been the reason that NRG was the only company with which I made a positive profit. I
suspect the bid-ask spread severely cut my profits with the other two companies, especially since
I was forced to put in market orders on Friday to sell as I was not able to actively monitor the
trades because of unforeseen conflicts. In addition, because I was in a rush to put these orders in,
I carelessly “closed” one of my positions twice, forcing me to have to buy-to-cover on the extra
sell order. This was an immediate $200 loss due to the $0.40 difference in the buy and sell prices
I traded at. This spread reinforces my belief that I lost a significant portion due to the high bid-
ask spreads on my options with lower liquidity. Next week I will be sure to only use limit orders
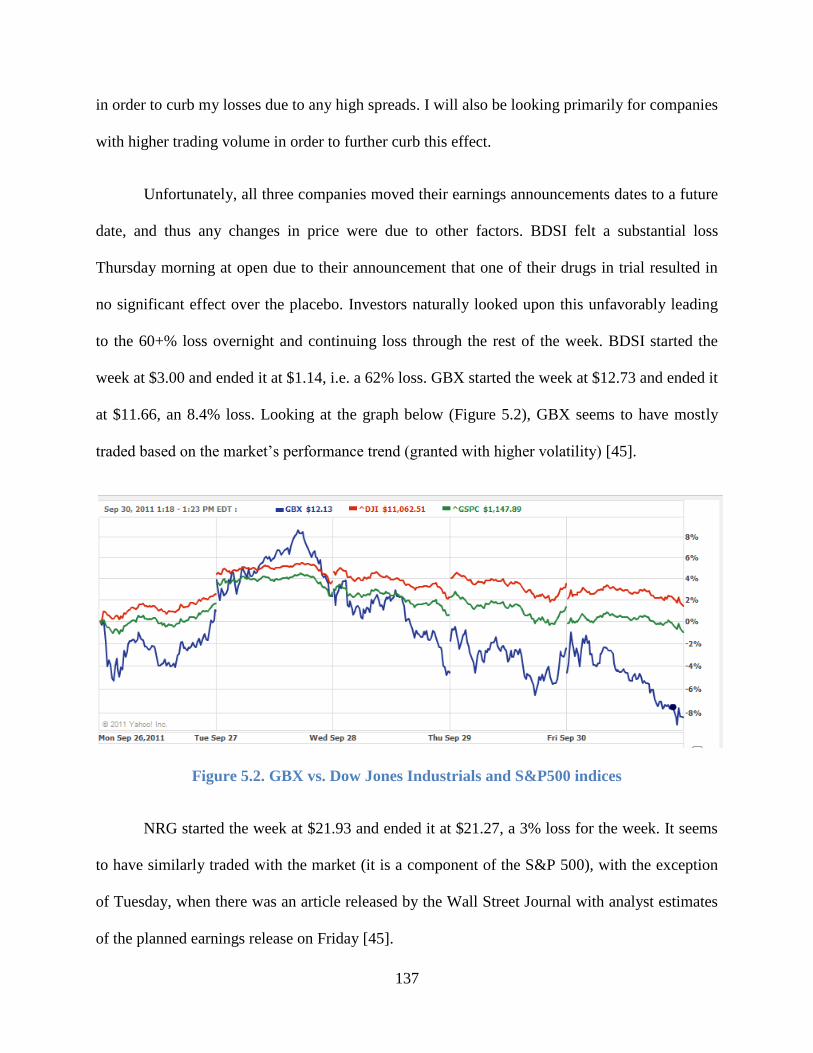
137
in order to curb my losses due to any high spreads. I will also be looking primarily for companies
with higher trading volume in order to further curb this effect.
Unfortunately, all three companies moved their earnings announcements dates to a future
date, and thus any changes in price were due to other factors. BDSI felt a substantial loss
Thursday morning at open due to their announcement that one of their drugs in trial resulted in
no significant effect over the placebo. Investors naturally looked upon this unfavorably leading
to the 60+% loss overnight and continuing loss through the rest of the week. BDSI started the
week at $3.00 and ended it at $1.14, i.e. a 62% loss. GBX started the week at $12.73 and ended it
at $11.66, an 8.4% loss. Looking at the graph below (Figure 5.2), GBX seems to have mostly
traded based on the market’s performance trend (granted with higher volatility) [45].
Figure 5.2. GBX vs. Dow Jones Industrials and S&P500 indices
NRG started the week at $21.93 and ended it at $21.27, a 3% loss for the week. It seems
to have similarly traded with the market (it is a component of the S&P 500), with the exception
of Tuesday, when there was an article released by the Wall Street Journal with analyst estimates
of the planned earnings release on Friday [45].

138
Figure 5.3. NRG vs. Dow Jones Industrials and S&P500 indices
In terms of the effect from the length of time between trading and expiry, the data
produced did not prove sufficient to make a conclusion yet because the effect from the wide bid-
ask spread overshadowed its effect. I will again trade varying expiries next week to continue to
try to see what the effect is.
In conclusion for the week, I’ve found that trading options on underlying stocks with low
liquidity does not prove profitable primarily because of the detrimental effect of the bid-ask
spread as well as the difficulty in trying to get limit orders to go through efficiently or at all. I
also need to see if there is any way to ensure that a limit order will only go through if the whole
straddle will go through – otherwise the whole point of the strategy is a moot point. This may
require me to make market orders when buying, but this may not be too ill-effected if the bid-ask
spread is small enough. I will continue to try varying expiries as there was no discernible pattern
this week. I do not know how to avoid buying a long straddle on a company that reschedules its
earnings announcement, but I hope to make progress on this in the following weeks.
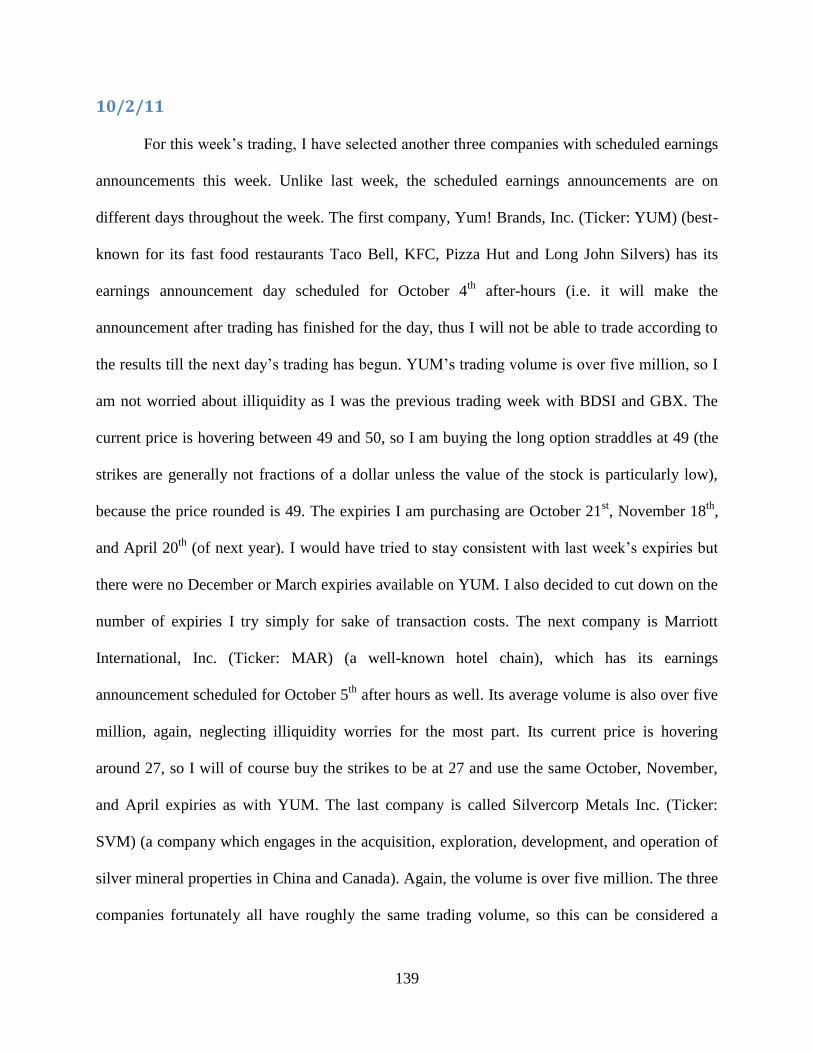
139
10/2/11
For this week’s trading, I have selected another three companies with scheduled earnings
announcements this week. Unlike last week, the scheduled earnings announcements are on
different days throughout the week. The first company, Yum! Brands, Inc. (Ticker: YUM) (best-
known for its fast food restaurants Taco Bell, KFC, Pizza Hut and Long John Silvers) has its
earnings announcement day scheduled for October 4th
after-hours (i.e. it will make the
announcement after trading has finished for the day, thus I will not be able to trade according to
the results till the next day’s trading has begun. YUM’s trading volume is over five million, so I
am not worried about illiquidity as I was the previous trading week with BDSI and GBX. The
current price is hovering between 49 and 50, so I am buying the long option straddles at 49 (the
strikes are generally not fractions of a dollar unless the value of the stock is particularly low),
because the price rounded is 49. The expiries I am purchasing are October 21st, November 18
th,
and April 20th
(of next year). I would have tried to stay consistent with last week’s expiries but
there were no December or March expiries available on YUM. I also decided to cut down on the
number of expiries I try simply for sake of transaction costs. The next company is Marriott
International, Inc. (Ticker: MAR) (a well-known hotel chain), which has its earnings
announcement scheduled for October 5th
after hours as well. Its average volume is also over five
million, again, neglecting illiquidity worries for the most part. Its current price is hovering
around 27, so I will of course buy the strikes to be at 27 and use the same October, November,
and April expiries as with YUM. The last company is called Silvercorp Metals Inc. (Ticker:
SVM) (a company which engages in the acquisition, exploration, development, and operation of
silver mineral properties in China and Canada). Again, the volume is over five million. The three
companies fortunately all have roughly the same trading volume, so this can be considered a

140
constant in this week’s trading results, and theoretically, I can avoid treating liquidity as a
negative factor, though if this turns out to not be the case, I will reconsider this for next week’s
trading. The current price is hovering around 8 at the moment, so naturally the strike for the
straddles will be at 8 and the expiries will be the same, with the exception of April’s, which will
be moved to March 16th
, 2012, because there is no April expiry available on SVM. SVM’s
earnings announcement is scheduled for Friday, but a time is not specified [45].
All buy orders will be put in Sunday night, so they are acknowledged by the exchange as
soon as trading opens for the week Monday morning. This week, I will use a feature of
Interactive Brokers, which allows me to put in an order for the entire straddle, instead of having
to put in separate orders for the calls and puts. This allows a limit order to be put in, while still
ensuring that both sides of the straddle go in – avoiding the disastrous results of such an
occurrence as happened last week with BDSI. The limit order works slightly differently from a
normal limit order because neither the calls nor puts have a specific price for which they must be
bought at, rather the total of the two prices is what the limit price is set to. For example, if I
wanted to buy a straddle for 1.3 per option pair of call and put, the broker would wait until the
total of the prices of the call and put were 1.3 – say 0.6 for the put and 0.7 for the call, and then
put in the buy order. This will even allow some of the order to go through and if either or both of
the option prices go high enough to set the total above the price I wanted to pay while orders are
going through, the broker will stop trading and wait for the price to come back down before
putting through anymore orders. I will let all of my orders run till Friday as I did last week, but
this week I will try using limit orders so I do not lose as much on the bid-ask spread.
On a side note, my BDSI call option positions have still not been closed, despite being
market orders, and they have continued to create heavier unrealized losses. Fortunately, my

141
losses are at some point limited because it was a long, not short, position – in the case of the
latter, I could be left with the potential for ever-growing losses.
10/3/11
Only one of my limit straddle orders has gone through in today’s trading, which worries
me slightly, but there’s not much I can do but wait and see if the rest go through before their
respective earnings announcements.
10/4/11
Only more one straddle order was executed today, which means the other two YUM
option straddles are defunct because the earnings announcement for YUM is scheduled for
tonight after trading. SVM and MAR still have a chance to go through though.
10/5/11
Unfortunately I did not cancel the orders for YUM as would have been logical to do, and
they went through today – after the earnings announcement. I will let them ride till Friday on the
off-chance that the stock makes an abrupt enough move that will still enable the straddle to make
a profit. Fortunately for YUM investors, YUM reported better than expected earnings for the
quarter – up 8% for the year. YUM’s stock went up slightly overnight, but as soon as the market
opened, YUM crashed from 49.70 to 47.95 (a drop of 3.5%) in less than an hour of trading and
then flat-lined for the rest of the day. This doesn’t make a lot of sense at first glance, but looking
at the chart more closely for the previous day, the price spiked up an almost identical amount in
about an hour, seemingly in anticipation of the earnings announcement, so it makes sense that
the price would fall right back to where it was before the announcement. This is a prime example
of traders’ quick profit-taking in the market based on market events. There is also noticeably
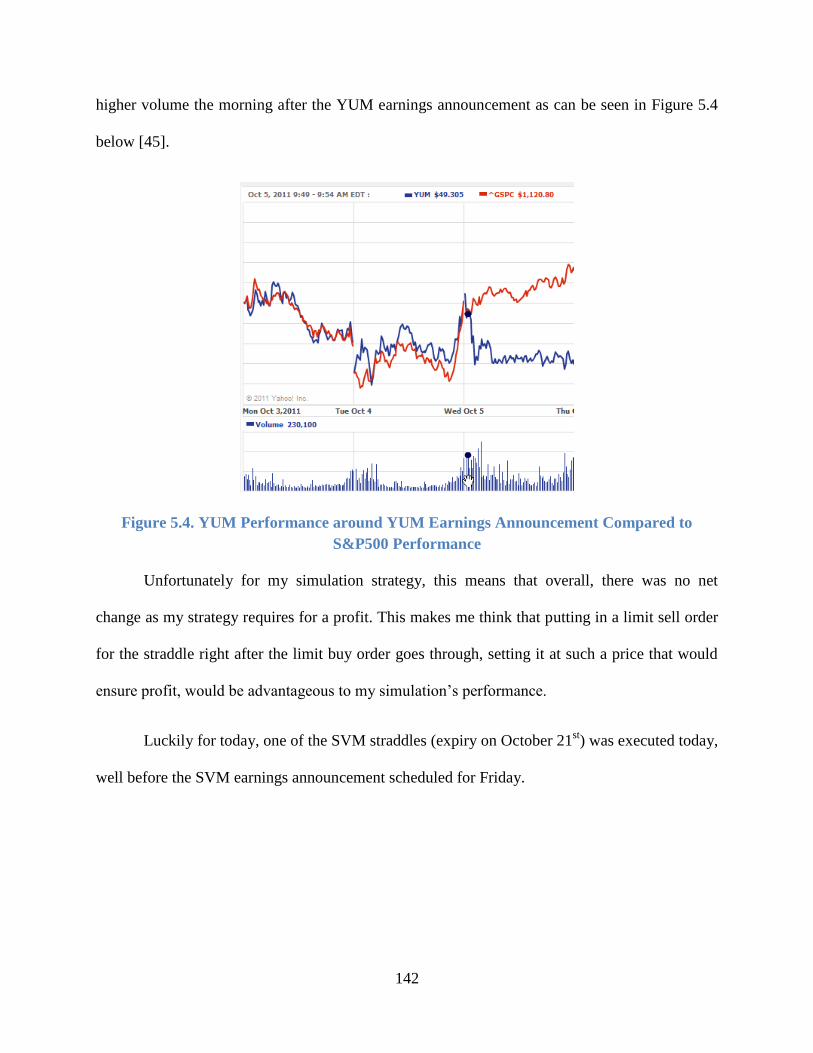
142
higher volume the morning after the YUM earnings announcement as can be seen in Figure 5.4
below [45].
Figure 5.4. YUM Performance around YUM Earnings Announcement Compared to
S&P500 Performance
Unfortunately for my simulation strategy, this means that overall, there was no net
change as my strategy requires for a profit. This makes me think that putting in a limit sell order
for the straddle right after the limit buy order goes through, setting it at such a price that would
ensure profit, would be advantageous to my simulation’s performance.
Luckily for today, one of the SVM straddles (expiry on October 21st) was executed today,
well before the SVM earnings announcement scheduled for Friday.
143
10/6/11
MAR had their earnings announcement last night as scheduled and reported earnings for
the quarter that beat analyst estimates. Their stock behaved as could be expected, rising above
the market’s performance and showing sustained positive return (as shown below in figure 5.5).
Figure 5.5. MAR Performance around MAR Earnings Announcement Compared to
S&P500 Performance
Again, one can see there is an increased volume of trading around the earnings
announcement.
10/7/11
Today I put in orders to close all of my open positions and cancel all outstanding trade
orders for straddles. Overall only five long option straddle orders were executed, two of which
(YUM) went in after the earnings announcement, and one (SVM) never saw an earnings
announcement because it was rescheduled. Overall, I saw, again, sever negative performance for
the week, but this week’s losses were $1,628 realized and about $515 unrealized for a total of

144
$2,143 in losses, which is just over 10% for the week. While this isn’t stellar performance by any
means, it certainly shows improvement over last week. Two changes that I believe are
responsible for this are the limit orders on both the buy and sell orders and much higher volume
of the underlying stocks. Next week, I will try to pair together the sell orders in the same way as
the buy orders are paired together in long straddles, and I will put these orders in immediately
after the buy order goes through. Lastly, I will make sure to cancel any open orders after the
earnings announcement has been made for the respective companies. Below, Table 5.2 is a table
of the week’s performance in detail.
Table 5.2. Results from Week 2 of Trading
10/12/11
This week’s trades will be Citigroup, Inc. (Ticker: C), Hasbro, Inc. (Ticker: HAS),
International Business Machines Corporation (Ticker: IBM), and Wells Fargo & Company

145
(Ticker: WFC). All four companies have their earnings announcements on October 17th
; C and
HAS before trading opens, IBM at 4:30pm (EDT) and WFC at 8:00am (EDT). C’s strike will be
at 29, HAS’s strike will be at 35, IBM’s strike will be at 185, and WFC’s strike will be at 27.
They will all have expiries of October 21st, November 18
th, and April 20
th (2012). Their trading
volumes are, respectively, 51 million, 2 million (a little on the low side, but sufficient), 5 million,
and 36 million [45].
10/13/11
Unfortunately when I went to enter the trades for this week, there appeared to be an error
on Interactive Brokers trading platform (WebTrader) for the options trading. When I entered in
that I wanted to purchase a certain straddle, when I previewed the order, it displayed the order as
a credit instead of a debit, implying that it was about to short sell the straddle instead of going
long on it. Not only would this be the complete opposite of what I’m trying to do in this
simulation, but because the limit price is closer to the bid side of the bid-ask spread, I would be
selling at an extremely unfavorable price, from which I would later have to buy to cover. Given
this error I will report tomorrow on my progress and not trade today.
10/14/11
Unfortunately the error in WebTrader persists. I also tried the WebTrader Beta, but to no
avail. Because, in terms of trading days, it is the day before the earnings announcements, it is no
longer feasible to make most of the trades because three of the four companies make their
earnings announcements before trading even opens. I will have to select new companies to trade
next week and hope that the error resolves itself. Also, simply writing down the trades as if I
were making them is not feasible because option trading is not as simple as stock trading with
the bid-ask spreads not being negligible for the personal investor. It is impossible to observe the

146
option trades closely enough to determine which of my trades would go through and when,
especially considering the number of different options I would be trading.
Below is a graph (Figure 5.6) with all four companies, which would have been the
underlying for the option straddles had I been able to trade. As you can HAS, WFC and IBM
may not have been very favorable trades, but C appears to have been an ideal candidate for this
trading strategy as it increased over 20% in anticipation and release of the earnings
announcement on the 18th
[45].
Figure 5.6. Wells Fargo & Company, International Business Machines Corp., Citigroup,
Inc., and Hasbro Inc. Stock Prices between October 11th
and October 19th
10/17/11
Fortunately the error in Interactive Brokers system is no longer present and I am able to
resume trading; only losing a couple days in the process. The next four underlying stocks which I

147
will make option trades for are Quest Diagnostics Incorporated (Ticker: DGX), AT&T, Inc.
(Ticker: T), BB&T Corporation (Ticker: BBT), and Capital One Financial Corporation (Ticker:
COF). These companies all have earnings announcements dates on October 20th
, DGX before
trading hours, T before, BBT before, and COF after trading hours. DGX’s strike closest to its
current trading price is 50 and its option expiries will be October 21st, November 18
th, and
February 17th
(2012). Its trading volume is around 2 million, which, given previous trades in this
project, seems just high enough to provide sufficient liquidity for desired trading. T’s strike
closest to its current trading price is 29, and it will have the same option expiries except the third
will be March 16th
instead of February 17th
. Its trading volume is around 24 million, more than
sufficient. BBT’s strike is 22 and has the same expiries as T. Its trading volume is around 5
million. COF’s strike is 40, with the same option expiries as T and BBT. COF’s trading volume
is about 3.5 million. The option trades will be put into Interactive Brokers in the same way as last
time since that proved highly effective in ensuring that the entire straddle would go through at
the same time. My phone is set to be alerted as soon as a trade goes through so I can immediately
put in another limit order which will be to sell both halves of the straddle at a limit price which is
a total of the call and put option prices. This way it does not matter which direction the
underlying’s price moves for putting in limit orders for the calls and puts separately (otherwise
market orders or constantly watching the stocks would be the only alternatives, the former being
a large cut to profits and the latter being unfeasible as a full-time student). The limit prices will
be set a bit higher than price at which the straddle was purchased, so even if the underlying only
moves enough to make the option transactions profitable momentarily, the orders will
theoretically go through [45].

148
10/18/11
Today was fortunate in that six of my twelve straddle limit orders went through by the
end of the trading day (DGX October and February, T October and November, BBT November,
and COF October). I of course immediately put through limit orders to sell these at a slight profit
margin. The difficult part here is to determine how much of a profit margin to reach for. Too low
and the inevitable losses from some of the options will outweigh any gains and too high and the
order may never go through as the underlying never moves enough to make the straddle that
profitable before the simple passage of time degrades the value of the options as they approach
expiry. The limit sell orders are roughly 5-10% higher than the buy price was. In the remaining
weeks I will try to observe how my trades react to this level and adjust accordingly. For the
October options that I now own, the expiry date is in three days (21st), so if the limit orders don’t
go through, the options will simply expire leaving me in either a long or short position depending
on which direction the underlying’s price moves (by its nature, a straddle guarantees that either
the puts or the calls will be in the money because the strike price is the same for both). In the
case that this does happen, I will simply put a limit order on the stock and try to obtain some
profit from the stock transactions (i.e. buying to cover at a lower price than the put options sold
at or selling at a higher price than the call options bought at).
10/21/11
One of the straddle limit sell orders went through (COF October) just before it expired,
giving me a healthy 12% profit on that straddle. The graph below (Figure 5.7) shows the positive
result of the earnings announcement in the stock price of COF.

149
Figure 5.7. Capital One Financial Stock Price from October 18th
to October 25th
Unfortunately, the rest of the October options expired with heavy losses. The DGX October
straddle lost about 79%, despite the profit from buying back the stock at a lower price than the
strike price. The T October straddle also lost about 80% despite selling the stock at a slightly
higher price than the strike price. This result makes sense if one looks at Figure 5.1, the
underlying’s price in both cases of DGX and T was very close to the strike price, meaning that
the losses were very close to 100% (if the underlying’s price were exactly the strike price, there
would be only the loss of the price paid for the options, i.e. 100% loss). Below is a graph (Figure
5.8) of T’s movement between October 18th
(straddle purchase) and October 21st (expiry), and
one can see that the earnings announcement had very little effect on the price – in fact the
underlying price barely moved more than half a percent away from the strike price I chose all
week, which of course leads to heavy losses in my simulation strategy.

150
Figure 5.8. AT&T Stock Price between October 17th
and October 24th
Below is a graph (Figure 5.9) of DGX’s stock price, showing a similar pattern to T,
although it did move a little more – almost 2% - it wasn’t enough to create a profitable
straddle/trigger the limit sell order before expiry. This is primarily because the earnings
announcement date was moved to the 25th
of October, after expiry. As you can see below, had
the earnings announcement date not been moved, this straddle would have proven to be highly
profitable with the jump in price on the morning of the 25th
.

151
Figure 5.9. Quest Diagnostics Stock Price from October 18th
to October 28th
10/25/11
As Figure 5.9 shows, DGX’s earnings announcement was good news and the price spiked
some 14% in overnight trading. Naturally the limit sell order for the other DGX straddle with
February expiry went through immediately. The straddle had a profit of almost 20% alone
(unfortunately this was completely overshadowed by the 80% loss from the October expiry due
to the last minute change in earnings announcement date). The BBT November and T November
straddles are still sitting in my portfolio with limit sell orders waiting to trigger, but their current
market prices put them in the red. Eventually I will cut my losses if they continue to decline in
price.
10/26/11
The next round of trading will be from the following companies: Whirlpool Corporation
(Ticker: WHR), Weyerhaeuser Company (Ticker: WY), and Chevron Corporation (Ticker:

152
CVX). WHR has its earnings announcement scheduled for October 28th
at 6:00am, and is
currently trading around 58.5, making 57.5 the closest strike price. Expiries will be November
18th
, December 16th
, and February 17th
. WY has its earnings announcement scheduled for
October 28th
before US markets open, and is trading a little over 17, so a strike price of 17 will
be used. Expiries will be November 18th
, December 16th
, and April 20th
. CVX has its earnings
announcement scheduled for October 28th
at 8:30am, and is currently trading just under 107,
making 105 the closest strike price. Expiries will be November 18th
, December 16th
, and March
16th
. As with the last two rounds of options, limit orders will be placed on the straddle as a whole
for each expiry, and if/when the limit is triggered, another limit order to sell at a reasonable
profit will be placed. This time I will use “DAY,” or end of day for the “Time in Force,” that is,
how long the order remains active for if it is not triggered. This means that if the orders placed
do not trigger before end of trading on the day placed (or the next trading day if the order is
placed after-hours, as is the case for my simulation), they will simply cancel themselves and be
removed from the list of orders. The limit orders to sell will remain as “GTC” or good ‘til
canceled in case the underlying moves in anticipation to the earnings announcement or if the
earnings announcement is moved back a few days (as has happened on numerous occasions)
[45].
10/27/11
Three of the nine straddles I put in limit orders for bought today (and since they were
only end of day orders, the remaining six have been canceled automatically). Unfortunately none
of the straddles for WHR went through, so the performance of that company’s stock is no
irrelevant for my portfolio’s performance this week. The March straddle for CVX and the
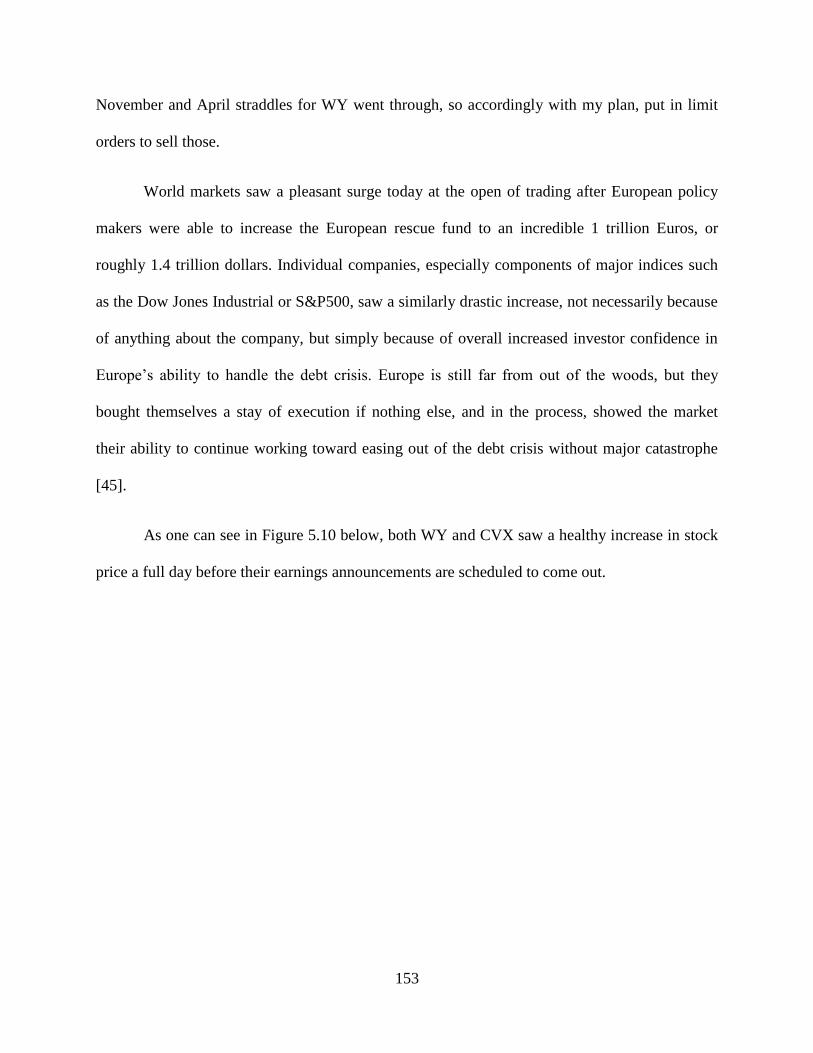
153
November and April straddles for WY went through, so accordingly with my plan, put in limit
orders to sell those.
World markets saw a pleasant surge today at the open of trading after European policy
makers were able to increase the European rescue fund to an incredible 1 trillion Euros, or
roughly 1.4 trillion dollars. Individual companies, especially components of major indices such
as the Dow Jones Industrial or S&P500, saw a similarly drastic increase, not necessarily because
of anything about the company, but simply because of overall increased investor confidence in
Europe’s ability to handle the debt crisis. Europe is still far from out of the woods, but they
bought themselves a stay of execution if nothing else, and in the process, showed the market
their ability to continue working toward easing out of the debt crisis without major catastrophe
[45].
As one can see in Figure 5.10 below, both WY and CVX saw a healthy increase in stock
price a full day before their earnings announcements are scheduled to come out.

154
Figure 5.10. Dow Jones Industrial vs. Weyerhaeuser Company and Chevron Corporation
from October 26th
to October 28th
10/28/11
One of the WY straddles sold at a profit (about 6%), due primarily to the increase from
the European deal and marginally to an increase in the stock price presumably from a positive
earnings announcement. The other two stocks have obviously seen an increase in the call
options’ prices and decrease for the puts, but the remaining straddles as a whole are each still in
the red.
Continuing to look at Figure 5.12 above, one can see that the earnings announcements
had very little noticeable effect on either WY or CVX, and was only enough to trigger one of the
three limit sell orders.
Unfortunately today when I went to put in the limit sell order for one of the WY
straddles, I accidentally put in buy instead of sell, and since I was looking at getting a high price
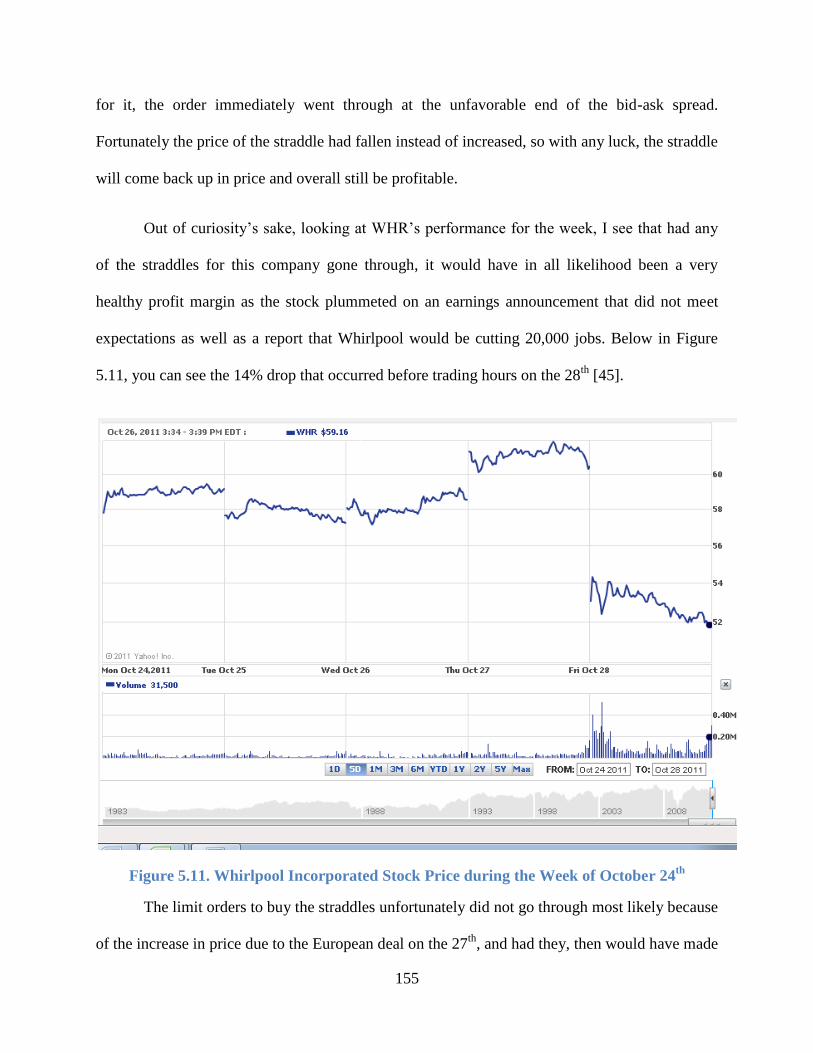
155
for it, the order immediately went through at the unfavorable end of the bid-ask spread.
Fortunately the price of the straddle had fallen instead of increased, so with any luck, the straddle
will come back up in price and overall still be profitable.
Out of curiosity’s sake, looking at WHR’s performance for the week, I see that had any
of the straddles for this company gone through, it would have in all likelihood been a very
healthy profit margin as the stock plummeted on an earnings announcement that did not meet
expectations as well as a report that Whirlpool would be cutting 20,000 jobs. Below in Figure
5.11, you can see the 14% drop that occurred before trading hours on the 28th
[45].
Figure 5.11. Whirlpool Incorporated Stock Price during the Week of October 24th
The limit orders to buy the straddles unfortunately did not go through most likely because
of the increase in price due to the European deal on the 27th
, and had they, then would have made

156
a significant profit on the 28th
as soon as the market opened for trading. It is possible that the
limit orders were just for too low a price to trigger at any point.
Below, Tables 5.3 and 5.4 shows the results of the last two weeks of trading, with the
first week updated to reflect the most recent changes in unrealized profits.
Table 5.3. Results from Weeks 3 and 4 of Trading

157
Table 5.4. Results of Week 5 of Trading
11/2/11
The companies I will be trading options for are Ventas, Incorporated (Ticker: VTR),
Warner Chilcott (Ticker: WCRX), and Ultra Petroleum Corporation (Ticker: UPL). The
companies’ stocks have trading volumes of about 1.8 million, about 5 million, and about 6.5
million, respectively. I will buy option straddles on VTR with a strike of 55 and November,
December and February expiries. Option straddles on WCRX will have a strike of 32 and
November, December and March expiries. Option straddles on UPL will have a strike of 18 and
November, December and April expiries. I will be using an identical trading strategy as last
week, placing limit orders to buy, waiting for the text alert before putting in a slightly increase
price sell limit order [45].

158
11/3/11
Unfortunately the only limit orders that went through today were the straddles on VTR
with November and February expiries. I’m not sure why no other orders went through, as I put
the limit order prices roughly halfway in the bid-ask spreads for each straddle. At this point
there’s nothing that can be done since all of the earnings announcements are before trading opens
tomorrow morning. I have been purchasing the options about a day ahead of time to minimize
the loss of possible profits due to a decrease in price from loss of time value, but at the same
time, the number of option purchases that have gone through is limited by the short time frame.
Next week I will go back to buying a couple days ahead of time in the hopes that more of the
limit orders will have the chance to go through.
11/4/11
Today was a highly disappointing day both in terms of the orders that did go through and
the ones that did not go through. VTR’s earnings announcement was of little consequence and
the market treated it accordingly with next to no real movement in the stock price after the
announcement that did not seem to be simple correlation to the general market trend at the time.
Below is a graph (Figure 5.12) of VTR’s performance this week and an overlay of the S&P500
to account for most of VTR’s movement.

159
Figure 5.12. Ventas, Incorporated vs. S&P500 Performance for Week of October 31st
Looking at the earnings announcements of the other two companies, UPL and WCRX, it
is highly regrettable that their options were not ordered. UPL was up almost 10% by the end of
trading today on positive surprise for revenue earnings (although income was down for the
quarter).
WCRX had similar results in that they would have proven profitable for my strategy.
Unfortunately for any WCRX shareholders, the stock plummeted almost 11% within a couple hours after
trading began following the news that morning that the third quarter profits were down 42%. Below is a
graph (Figure 5.13) of both UPL and WCRX’s performances for the week.

160
Figure 5.13. Warner Chilcott vs. Ultra Petroleum Corporation Performance for Week of October
31st
On Monday morning, I will close any open positions from previous weeks to cut my losses, and
will put in new limit orders early in the week for three companies (TBD) with earnings announcements on
Friday. One positive event for the week is that one of the previous CVX straddles sold at a very marginal
profit of approximately 0.32%. Below is a table (Table 5.5) of this week’s trading results.

161
Table 5.5. Results of Week 6 of Trading
11/7/11
For my last week of trading I have selected three prime candidates for companies with
earnings announcements on Thursday night or Friday morning: Walt Disney Company (Ticker:
DIS), Molycorp, Inc. (Ticker: MCP), and NVIDIA Corporation (Ticker: NVDA). All three
companies have very high trading volumes (22 million, 15 million, and 44 million, respectively)
and thus excellent liquidity. DIS trading at 35.15 at today’s close will have option straddles with
a strike of 35, and expiries of November 18th
, December 16th
, and April 20th
. NVDA trading at
14.74 at today’s close will have option straddles with a strike of 15, and expiries of November
11th
(the same day as the earnings announcement), November 18th
, and March 16th
. MCP trading
at 41.62 at today’s close will have option straddles with a strike of 42.5 and expiries of
November 11th
(the same day as the earnings announcement), November 18th
, and March 16th
.
This is the first time I am trying option straddles with expiry dates coinciding with the earnings
162
announcement dates (obviously the earnings announcements being chosen so they are released
pre-trading hours). Last time I had option expiries so close to the earnings announcements (1 day
after), I met disastrous losses, but this was half due to the last-minute change in the earnings
announcement date. I am hoping that was simply a fluke and that this time I will have better
luck. In the unfortunate case that I do not, it will still be a useful result in confirming that the two
dates should not be in such proximity [45].
11/8/11
All of the limit orders for all nine straddles went through by the first half of the trading
day, which is a first, most likely due to the up and down swing the market made immediately
upon opening. I of course put in the limit orders to sell as soon as I had access to a computer later
in the day. This time I decided to be more formulaic in how I chose the sell point, demanding
that each limit be as close to a five percent increase as possible in terms of cents. This is a more
conservative limit than I have been using in the past (ranging from 10-20%), which I believe will
allow more of the options to be profitable for the strategy, as the slight majority have tended to
not meet the high limit sell orders in previous weeks.
11/9/11
Two of the option straddles have already gone through today (NVDA’s November 11th
and DIS’s November 18th
straddles) at the required 5% profit. Below is a chart (Figure 5.14) of
the two companies’ performances as well as the S&P500’s performance for comparison to the
general market trend that day, for further explanation of why they might have gone through
early.
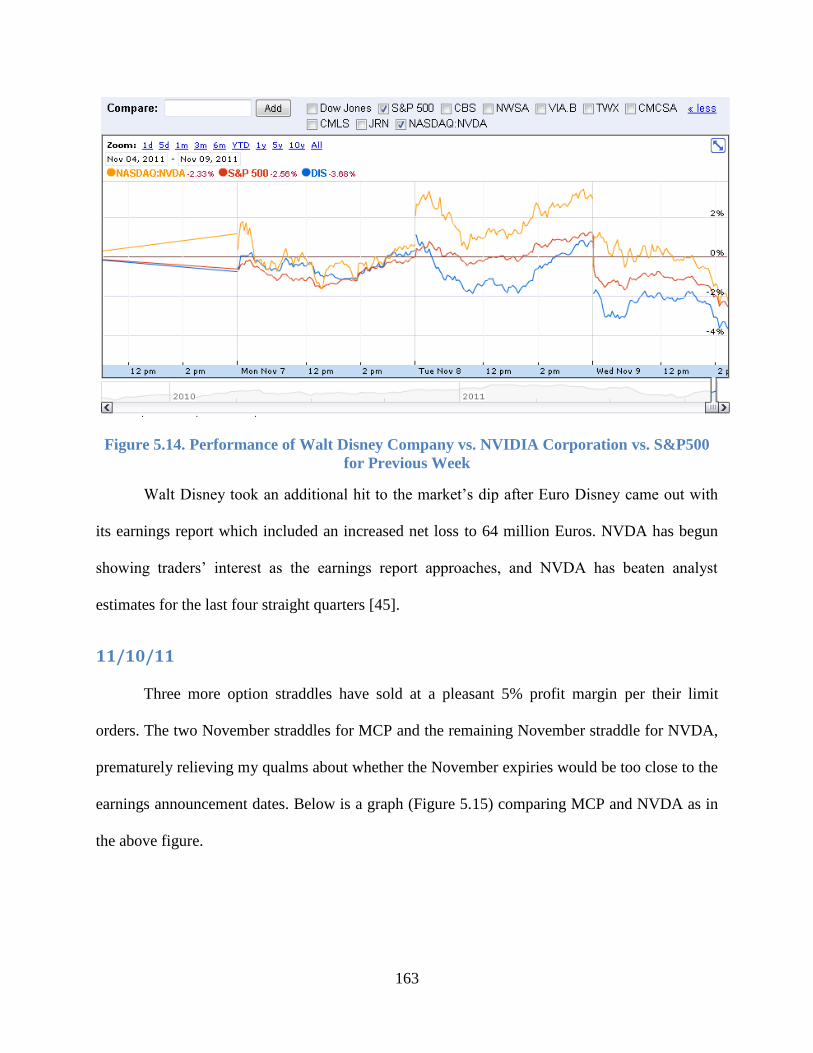
163
Figure 5.14. Performance of Walt Disney Company vs. NVIDIA Corporation vs. S&P500
for Previous Week
Walt Disney took an additional hit to the market’s dip after Euro Disney came out with
its earnings report which included an increased net loss to 64 million Euros. NVDA has begun
showing traders’ interest as the earnings report approaches, and NVDA has beaten analyst
estimates for the last four straight quarters [45].
11/10/11
Three more option straddles have sold at a pleasant 5% profit margin per their limit
orders. The two November straddles for MCP and the remaining November straddle for NVDA,
prematurely relieving my qualms about whether the November expiries would be too close to the
earnings announcement dates. Below is a graph (Figure 5.15) comparing MCP and NVDA as in
the above figure.
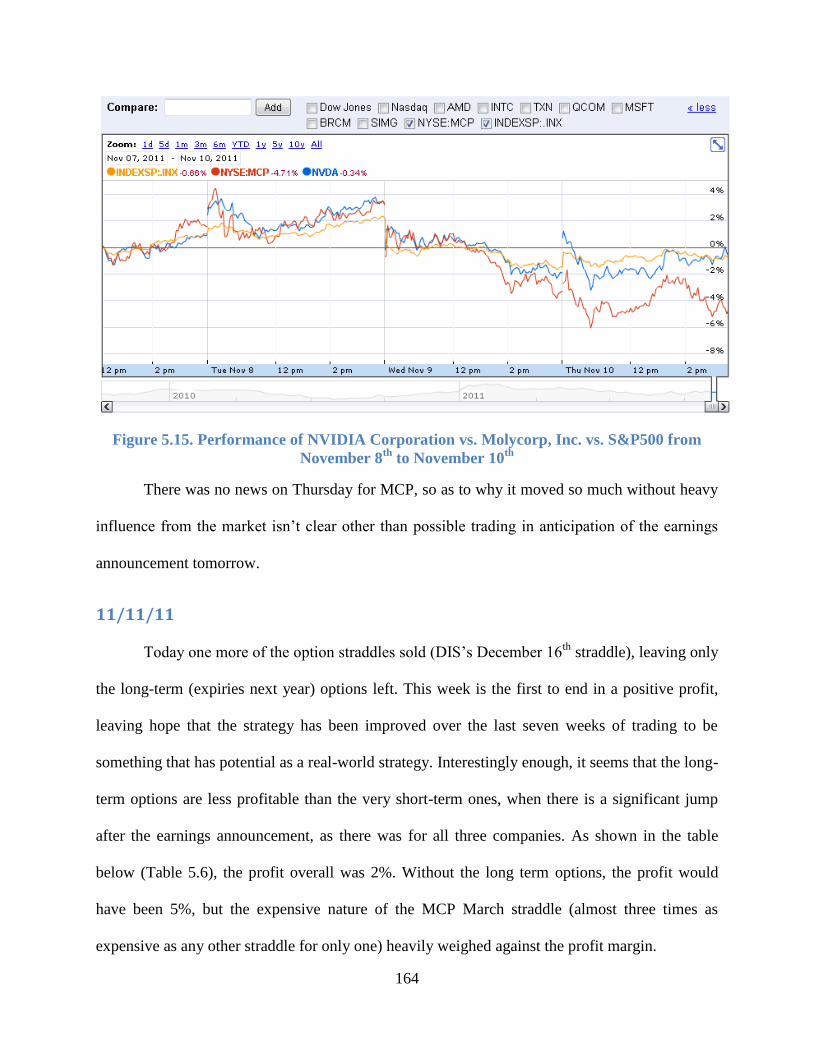
164
Figure 5.15. Performance of NVIDIA Corporation vs. Molycorp, Inc. vs. S&P500 from
November 8th
to November 10th
There was no news on Thursday for MCP, so as to why it moved so much without heavy
influence from the market isn’t clear other than possible trading in anticipation of the earnings
announcement tomorrow.
11/11/11
Today one more of the option straddles sold (DIS’s December 16th
straddle), leaving only
the long-term (expiries next year) options left. This week is the first to end in a positive profit,
leaving hope that the strategy has been improved over the last seven weeks of trading to be
something that has potential as a real-world strategy. Interestingly enough, it seems that the long-
term options are less profitable than the very short-term ones, when there is a significant jump
after the earnings announcement, as there was for all three companies. As shown in the table
below (Table 5.6), the profit overall was 2%. Without the long term options, the profit would
have been 5%, but the expensive nature of the MCP March straddle (almost three times as
expensive as any other straddle for only one) heavily weighed against the profit margin.

165
Table 5.6. Results of Trading Week 7
5.4 Analysis
The portfolio strategy to buy an option straddle with an underlying having an earnings
announcement in proximity presented with mixed results during the simulation. The first few
weeks were as much learning to trade options in more advanced ways as much as running the
simulation for itself. Experimentation with the type of order (i.e. market, limit, etc.), longevity
(i.e. day or good-till-canceled) and expiry date was vital to both the trading of the options in and
of themselves as well as for the purposes of the simulation. The simulation showed that altering
any of these variables can drastically change the behavior of the strategy. Further
experimentation within the parameters of the simulation included how close the purchase of the
option straddle was to the earnings announcement for the underlying company and how close the
earnings announcement was to the options’ expiry. After beginning to use limit orders, the price

166
to set the sell order relative to the buy price was also varied. Each week one or more of these
variables would be altered to improve upon the previous week’s performance.
One of the first things that helped to improve the simulation results immediately was
using limit orders for the option purchases so as to not get killed on the bid-ask spread with
market orders. This naturally led to the problem that both sides of the straddle would not go
through, which would be self-defeating in purpose for the simulation. Fortunately, the trading
platform allowed for limit orders on the entire straddle, thus avoiding the problem of only buying
or selling a portion of the spread and in all likelihood, missing out on the profitable side.
Using good-till-canceled orders became very important as using day orders would often
lead to missed opportunities and the risk that I would not be able to reenter the orders in if
necessary (due to lack of access to a computer, etc.), although the counter-risk was that the GTC
orders had to be cancelled the night before the earnings announcement, as there would be no
point in buying the orders afterwards (at least insofar as this simulation goes).
I quickly learned that low-liquidity stocks were not well-suited for this trading strategy in
any way. Even if the underlying stock performed exactly as I wanted, there was not always a
guarantee that there would be enough liquidity in the options to make the trades required to take
advantage of the stock’s favorable movement. I found this the hard way when trading BDSI and
the orders for the puts never went through before the stock fell through the floor. About halfway
through the simulation, I settled on an average trading volume of one to two million trades at
minimum, more than five if possible, for the underlying in order to have sufficient liquidity in
the respective options market.

167
Expiry dates tended to have a significant impact on the profit margin of the strategy.
Options with far off expiries are naturally much more expensive and unfortunately as I found,
much less prone to even drastic movements in the stock price, because so much of their price
consists of time-value. In addition, options with expiries that were quite close to the earnings
announcement date would react quite favorably if there were significant movements in the
underlying. If I had had the opportunity to continue trading for this simulation, I would have
begun to trade solely options with expiries within a month or two of the earnings announcement
date and purchase date, as the long-term options repeatedly proved less profitable for the
portfolio. One issue that came up when the earnings announcement and expiry were within days
is that a rescheduling of the earnings announcement would just about devastate the strategy,
especially if the options were expensive relative to movement in the stock, as they would simply
expire and the only thing to offset the loss would be if there was any change in the stock price
due to factors other than the rescheduled earnings announcement.
Another major timing issue was not just how close the earnings announcement and expiry
dates were, but how close to the earnings announcement the limit orders were placed.
Throughout the simulation I varied the timing between placing the limit orders and when the
earnings announcement was scheduled for between several days and just the day before. The
advantage of placing the day before was that it would minimize any loss due to time passing, but
at the same time, it was outweighed by the advantage of a longer opportunity for the buy limit
orders to go through by placing the limits several days in advance.
Stocks that were naturally more volatile did substantially better simply because they
sometimes reached a price above or below the strike price that was enough to trigger the
profitable limit sell order even before the earnings announcement had been reached. This was
168
also in part due to trading in anticipation to the earnings announcement (especially if analysts
had reason to believe that the earnings report would be especially good or bad) as well as any
increased volatility in the market as a whole on a particular day that might have influenced the
underlying’s price.
One of my biggest conclusions not mentioned in my transaction entries was that time-
constraints of the portfolio’s trader, a student in this case, could greatly affect the performance of
the portfolio simply because of how able one is able to follow the strategy strictly due to outside
conflicts. A computer program to make these trades or at the very least a full-time trader, would
be much more well-equipped to utilize this strategy as there would be no delay in the limit buy
order going through and the limit sell order being placed, nor would mistakes go unseen for more
than a moment (and in the case of a program, the only mistakes would be those created by the
programmer, which once resolved, would theoretically cease to manifest).
Overall, I found this strategy to have a lot of potential, but the specific logistics of it still
need to be worked out. A detailed algorithm with more rigid conditions and a significantly
greater amount of experimental data to study would be needed before I would recommend such a
strategy being utilized. Once such rigor was applied though, it would simply be a matter of
giving the instructions to a computer as a trading program or a living and breathing full-time
trader and the simulation I conducted suggested heavily that it could be quite profitable given
enough time.

169
6. Comparison of Portfolio Performances
Our four portfolios made up a diverse spread of stock trading strategies, and had
similarly diverse results. Having these four types of portfolios running at the same time provided
for a more accurate comparison than having portfolios simulated at different times, since the
market was fluctuating equally for each simulation, but given more time, it would have been
better to be able to run the simulations in a variety of behaviors for the market in terms of
volatility and overall performance (e.g. in a poorly performing market the short-selling portfolio
would have highly out-performed long term holding, in a very volatile market, the leveraged
ETF and option straddle portfolios tend to perform more effectively).
The most profitable method in this simulation was the long term holding. This method is
best for those who don’t have the time to be trading very often but are looking to get into the
market and make a profit over a long time period (e.g. a Roth IRA). Of all the trading strategies
used, this one required the most research and background work up front, but once the shares
were purchased, no further trading was required. In a volatile time such as the one in which this
simulation took place, long term holding was a good strategy in order to ride out the ups and
downs of the market over the seven weeks.
The short-selling portfolio suffered very large losses overall and performed poorly
especially when compared to the long-term buy-and-hold portfolio. Shorting was one of the most
time intensive portfolios with respect to the time required during the trading day to monitor stock
performance.
The leveraged ETF trading strategy requires large time considerations. Leveraged ETF
trading can be quite complicated, although it can also potentially be incredibly profitable if one

170
learns how to trade effectively. However, there are much easier trading strategies for someone
who cannot be a full time trader.
The fourth portfolio, attempting to take advantage of earnings announcements with
option straddles, showed mixed results, but as the simulation went on and variables were
adjusted it steadily improved in performance finally reaching a positive 2% profit for the final
week. With more work this could prove to be a very effective strategy but it was also a time-
intensive trading strategy (though not nearly as much as the previous two) better suited for a
machine to carry out the trades automatically with a more rigidly designed algorithm.

171
7. Conclusion
Overall our simulation data suggest that for individuals with money to put in the stock
market, at our age it is more effective to be long-term investors rather than traders given the time
requirements of trading and most people our age do not have enough initial capital to remain
profitable given commissions on a higher frequency of trading. With further development and
work on our simulation, it would likely be possible to improve the performance of all of the
portfolios, but the second, third and fourth portfolios would of course still carry a significantly
higher risk than long term investing, which by the time a person had the necessary initial capital
to effectively use the latter three, the risk involved would likely be too high, leaving these
strategies to be tried by institutional investors and persons of high net-worth.
172
References
1) "About Us News & Events News Releases Press Release 12-30-2005." NYSE, New York
Stock Exchange. Web. 18 Sept. 2011. <http://www.nyse.com/press/11358564
20824.html>.
2) "AMD History." AMD History. Web. 2 Dec. 2011.
<http://www.amd.com/us/aboutamd/corporate-information/Pages/timeline.aspx>.
3) ATP Oil and Gas. Web. 23 Sept. 2011. <http://www.atpog.com/about.html>.
4) "Caterpillar - Learn About Our Company." Caterpillar Inc. Web. 24 Sept. 2011.
<http://www.caterpillar.com/company>.
5) Cheng, Jonathan. "Dow Finishes Up 102 Points." Business News & Financial News – The
Wall Street Journal - Wsj.com. Web. 17 Oct. 2011.
<http://online.wsj.com/article/SB10001424052970204002304576626543687
404616.html?mod=WSJ_hp_LEFTWhatsNewsCollection>.
6) Cheng, Jonathan. "Dow Tacks On 131 Points - WSJ.com." Business News & Financial
News - The Wall Street Journal - Wsj.com. Web. 05 Oct. 2011. <http://online.wsj.
com/article/SB10001424052970203388804576612500319523710.
html?mod=WSJ_hp_LEFTTopStories>.
7) Cheng, Jonathan. "Stocks Slide Back Into Red - WSJ.com." Business News & Financial
News - The Wall Street Journal - Wsj.com. Web. 24 Oct. 2011.
<http://online.wsj.com/article/SB100014240529702044795045
76636551499332380.html?mod=WSJ_hp_LEFTTopStories>.
8) Cheng, Jonathan. "U.S. Stocks End Winning Streak - WSJ.com." Business News &
Financial News - The Wall Street Journal - Wsj.com. Web. 28 Sept. 2011.
173
<http://online.wsj.com/article/SB100014240529702041382045765983
52663734780.html? mod=WSJ_hp_LEFTWhatsNewsCollection>.
9) Coker, Margaret. "Gadhafi's Death Ushers In New Era." Business News & Financial
News - The Wall Street Journal - Wsj.com. 21 Oct. 2011. Web. 26 Oct. 2011.
<http://online.wsj.com/article/SB100014240529702046187045766426619
15994024.html?mod=WSJ_hp_LEFTTopStories>.
10) "Company Info." Welcome to NVIDIA - World Leader in Visual Computing
Technologies. Web. 02 Dec. 2011. <http://www.nvidia.com/page/companyinfo.html>.
11) Conway, Brendan. "Dow Gets Back Into the Black." Business News & Financial News -
The Wall Street Journal - Wsj.com. Web. 17 Oct. 2011.
<http://online.wsj.com/article/SB100014240529702040023045766306740
67063488.html?mod=WSJ_hp_MIDDLETopStories>.
12) Conway, Brendan. "Stocks Swing But End on High - WSJ.com." Business News &
Financial News - The Wall Street Journal - Wsj.com. 20 Oct. 2011. Web. 26 Oct.
2011. <http://online.wsj.com/article/SB1000142405297020461
8704576642632867031592.html?mod=WSJ_hp_LEFTWhatsNewsCollection>.
13) Dezember, Ryan, and Matt Wirz. "ATP CFO Says Oil & Gas Co. in Control of Destiny -
Deal Journal - WSJ." WSJ Blogs - WSJ. 10 Nov. 2011. Web. 12 Nov. 2011.
<http://blogs.wsj.com/deals/2011/11/10/atp-cfo-says-oil-gas-co-in-control-of
destiny/?mod=yahoo_hs>.
14) Elder, Alexander. Sell and Sell Short. N.p.: Wiley, 07/2008. ebrary. Web. 13 Sept. 2011.

174
15) Farrell, Maureen. "Slowing Economy Stifles Stocks." CNNMoney - Business, Financial
and Personal Finance News. 19 Oct. 2011. Web. 28 Oct. 2011.
<http://money.cnn.com/2011/10/19/markets/markets_newyork/index.htm>.
16) Farrell, Maureen. "Stocks Close Dismal Week down Roughly 2%." CNNMoney
Business, Financial and Personal Finance News. 04 Nov. 2011. Web. 01 Dec. 2011.
<http://money.cnn.com/2011/11/04/markets/markets_newyork/index.htm>.
17) Farrell, Maureen. "Stocks End Higher on Europe Hopes." CNNMoney - Business,
Financial and Personal Finance News. 26 Oct. 2011. Web. 30 Oct. 2011.
<http://money.cnn.com/2011/10/26/markets/markets_newyork/index.htm>.
18) Farrell, Maureen. "Stocks Fight Italian Jitters to Close Higher." CNNMoney - Business,
Financial and Personal Finance News. 07 Nov. 2011. Web. 12 Nov. 2011.
<http://money.cnn.com/2011/11/07/markets/markets_newyork/index.htm>.
19) Farrell, Maureen. "Stocks Post a Second Day of Gains." CNNMoney - Business,
Financial and Personal Finance News. 03 Nov. 2011. Web. 01 Dec. 2011.
<http://money.cnn.com/2011/11/03/markets/markets_newyork/index.htm>.
20) "Fuel Systems' IMPCO Automotive to Supply General Motors' Commercial CNG Bi
Fuel Pickup." GlobeNewswire - Press Release Distribution - EDGAR Filings – Video
News Releases. Web. 05 Nov. 2011.
<http://www.globenewswire.com/newsroom/news.html?ref=rss>.
21) Fuel Systems Solutions. Web. 02 Dec. 2011.
<http://www.fuelsystemssolutions.com/default.asp>.
22) Fundamentals of the Stock Market (0-07-136096-4, 978-0-07-136096-8), Wyss, B.
O'Neill. McGraw-Hill Companies, The, 2000.

175
23) Gongloff, Mark. "Yahoo Shares Soar on Report of Microsoft Interest - MarketBeat -
WSJ." WSJ Blogs - WSJ. Web. 05 Oct. 2011. <http://blogs.wsj.com/marketbeat
/2011/10/05/yahoo-shares-soar-on-report-of-microsoft-interest/>.
24) "Google History." Google. Web. 24 Sept. 2011. <http://www.google.com/intl
/en/about/corporate/company/history.html>.
25) Jones, Steven D. "Mircrosoft's Office Still Sells." Business News & Financial News – The
Wall Street Journal - Wsj.com. 21 Oct. 2011. Web. 26 Oct. 2011.
<http://online.wsj.com/article/SB10001424052970204618704576643463475
830924.html?mod=WSJ_hp_LEFTWhatsNewsCollection>.
26) King, Ian. "AMD Falls After Supplier Disruption Crimps Sales Forecast - Bloomberg."
Bloomberg - Business & Financial News, Breaking News Headlines. Web. 01 Oct.
2011. <http://www.bloomberg.com/news/2011-09-29/amd-falls-on-reduced-sales
forecast-after-manufacturing-glitch.html?cmpid=yhoo>.
27) Kramer, Dave. "A Brief History of Microsoft on the Web: Reflections on Microsoft.com
from Birth to Middle Age'" A Brief History of Microsoft on the Web. Web. 24 Sept.
2011.<http://www.microsoft.com/misc/features/features_flshbk.htm>.
28) "Listings Directory." NYSE, New York Stock Exchange. Web. 25 Sept. 2011.
<http://www.nyse.com/about/listed/lcddata.html>.
29) "MasterCard Worldwide® | The Heart Of Commerce ;." Welcome to MasterCard
Worldwide - Country/Region Selector. Web. 02 Dec. 2011.
<http://www.mastercard.com/us/company/en/index.html>.
30) Mikolajczak, Chuck. "US STOCKS-Google, Euro Zone Hopes Lift Futures| Reuters."
Business & Financial News, Breaking US & International News | Reuters.com. 14

176
Oct. 2011. Web. 17 Oct. 2011. <http://www.reuters.com/article/2011/10/14/markets
stocks-idUSN1E79D04M20111014>.
31) "Overview / Yahoo." Yahoo! Pressroom Home / Yahoo. Web. 24 Sept. 2011.
<http://pressroom.yahoo.net/pr/ycorp/overview.aspx>.
32) Pepitone, Julianne. "Netflix Earnings: 800,000 U.S. Subscribers Lost in Q3 - Oct. 24,
2011."CNNMoney - Business, Financial and Personal Finance News. 24 Oct. 2011.
Web. 02 Dec. 2011.
<http://money.cnn.com/2011/10/24/technology/netflix_earnings/index.htm>.
33) Pepitone, Julianne. "Yahoo's Carol Bartz out as CEO - Sep. 6, 2011." CNNMoney -
Business, Financial and Personal Finance News. 06 Sept. 2011. Web. 24 Sept. 2011.
<http://money.cnn.com/2011/09/06/technology/yahoo_carol_bartz/index.htm>.
34) Phillips, Matt. "U.S. Stocks Log Worst Quarter Since 2009 - WSJ.com." Business News,
Finance News, World, Political & Sports News from The Wall Street Journal
Wsj.com. Web. 01 Oct.2011. <http://online.wsj.com/article/SB10001424052
970204226204576603202392429600.html?mod=WSJ_hp_LEFTWhatsNews
Collection>.
35) Recio, Maria. "Bill to Steer BP Oil Spill Fines to Gulf States Passes Committee -
KansasCity.com." Kansas City's Best Source for News, Weather, Sports & More |
KansasCity.com. Web. 24 Sept. 2011. <http://www.kansascity.com/2011/09/21/
3158351/bill-to-steer-bp-oil-spill-fines.html>.
36) "Rex W. Tillerson." About Us. ExxonMobil. Web. 23 Sept. 2011.
<http://www.exxonmobil.com/Corporate/about_who_mgmt_rwt.aspx>.

177
37) Rooney, Ben. "Market Report - Oct. 11, 2011 - CNNMoney." CNNMoney - Business,
Financial and Personal Finance News. 11 Oct. 2011. Web. 17 Oct. 2011.
<http://money.cnn.com/2011/10/11/markets/markets_newyork/index.htm>.
38) Rousek, Leos. "EU Bailout Fault Lines Exposed in Slovakia." Business News &
Financial News - The Wall Street Journal - Wsj.com. Web. 17 Oct. 2011.
<http://online.wsj.com/article/SB10001424052970203499704576624340417317
546.html?mod=WSJ_hp_LEFTTopStories>.
39) Russolillo, Steven. "Blue Chips Notch Third Straight Gain - WSJ.com." Business News &
Financial News - The Wall Street Journal - Wsj.com. Web. 06 Oct. 2011.
<http://online.wsj.com/article/SB100014240529702034768045766145010
83866730.html?mod=WSJ_hp_LEFTTopStories>.
40) Russolillo, Steven. "Dow Takes It on the Chin - WSJ.com." Business News & Financial
News - The Wall Street Journal - Wsj.com. Web. 03 Oct. 2011. <http://online.wsj.com
/article /SB10001424052970204612504576608494194543536.html?mod=WSJ_
hp_LEFTTopStories>.
41) Russolillo, Steven. "Stocks Rally to End Higher - WSJ.com." Business News & Financia
News - The Wall Street Journal - Wsj.com. Web. 05 Oct. 2011. <http://online.
wsj.com/article/SB10001424052970204524604576610400545194990.html?mod=
WSJ_hp_LEFTWhatsNewsCollection>.
42) United States. Securities and Exchange Comission. Www.sec.gov. Web.
<http://www.sec.gov/litigation/admin/2011/34-65247.pdf>.
43) Welcome to The Home Depot, Inc. Corporate Web Site. Web. 24 Sept. 2011.
<https://corporate.homedepot.com/wps/portal/>.

178
44) Wyss, B. O'Neill. Fundamentals of the Stock Market. Blacklick, OH: McGraw-Hill
Professional Book Group , 12/2000. ebrary. Web. 11 Sept. 2011.
45) Yahoo Finance. Web. <http://finance.yahoo.com/ >.
46) "Yahoo Shares Rise on More Takeover Speculation - Yahoo! Finance." Yahoo! Finance -
Business Finance, Stock Market, Quotes, News. Web. 10 Oct. 2011.
<http://finance.yahoo.com/news/Yahoo-shares-rise-on-more-apf
1748511932.html?x=0>.
47) Yousuf, Hibah. "Market Report - Oct. 10, 2011 - CNNMoney." CNNMoney - Business,
Financial and Personal Finance News. 10 Oct. 2011. Web. 10 Oct. 2011.
<http://money.cnn.com/2011/10/10/markets/markets_newyork/index.htm
?source=yahoo_quote>.
48) Yousuf, Hibah. "Market Report - Oct. 18, 2011 - CNNMoney." CNNMoney - Business,
Financial and Personal Finance News. 18 Oct. 2011. Web. 26 Oct. 2011.
<http://money.cnn.com/2011/10/18/markets/markets_newyork/index.htm>.
49) Yousuf, Hibah. "Stocks End Stellar Month with a Fall." CNNMoney - Business, Financial
and Personal Finance News. 31 Oct. 2011. Web. 04 Nov. 2011.
<http://money.cnn.com/2011/10/31/markets/markets_newyork/index.htm>.
50) Yousuf, Hibah. "Stocks Fall Hard On Greece Fears" CNNMoney - Business,
Financial and Personal Finance News. 01 Nov. 2011. Web. 01 Dec. 2011.
<http://money.cnn.com/2011/11/01/markets/markets_newyork/index.htm>.
51) Yousuf, Hibah. "Stocks Flatline after Huge Rally." CNNMoney - Business, Financial and
Personal Finance News. 28 Oct. 2011. Web. 30 Oct. 2011.
<http://money.cnn.com/2011/10/28/markets/markets_newyork/index.htm>.
179
52) Yousuf, Hibah. "Stocks Get Hammered by Italy Fears." CNNMoney - Business, Financial
and Personal Finance News. 09 Nov. 2011. Web. 12 Nov. 2011.
<http://money.cnn.com/2011/11/09/markets/markets_newyork/index.htm>.
53) Yousuf, Hibah. "Stocks Get Merger, Earnings Boost." CNNMoney - Business, Financial
and Personal Finance News. 24 Oct. 2011. Web. 29 Oct. 2011.
<http://money.cnn.com/2011/10/24/markets/markets_newyork/index.htm>.
54) Yousuf, Hibah. "Stocks Pop on Berlusconi's Pending Resignation." CNNMoney -
Business, Financial and Personal Finance News. 08 Nov. 2011. Web. 12 Nov. 2011.
<http://money.cnn.com/2011/11/08/markets/markets_newyork/index.htm>.
55) Yousuf, Hibah. "Stocks Rebound after 2-day Rout." CNNMoney - Business, Financial
and Personal Finance News. 02 Nov. 2011. Web. 01 Dec. 2011.
<http://money.cnn.com/2011/11/02/markets/markets_newyork/index.htm>.
56) Yousuf, Hibah. "Stocks Rebound after Ugly Sell-off." CNNMoney - Business, Financial
and Personal Finance News. 10 Nov. 2011. Web. 12 Nov. 2011.
<http://money.cnn.com/2011/11/10/markets/markets_newyork/index.htm>.
57) Yousuf, Hibah. "Stocks Soar 3% on Europe Deal." CNNMoney - Business, Financial and
Personal Finance News. 27 Oct. 2011. Web. 30 Oct. 2011.
<http://money.cnn.com/2011/10/27/markets/markets_newyork/>.
58) Yousuf, Hibah. "Stocks: Strong Finish to a Choppy Week." CNNMoney - Business,
Financial and Personal Finance News. 11 Nov. 2011. Web. 13 Nov. 2011.
<http://money.cnn.com/2011/11/11/markets/markets_newyork/index.htm>.

180
59) Yousuf, Hibah. "Stocks Stumble as Europe Clouds the Markets." CNNMoney - Business,
Financial and Personal Finance News. 25 Oct. 2011. Web. 29 Oct. 2011.
<http://money.cnn.com/2011/10/25/markets/markets_newyork/index.htm>.

181
Appendix: Terminology
Option - a contract conveying a right to buy or sell designated securities, commodities, or
property interest (i.e. the underlying) at a specified price (i.e. the strike) during a stipulated
period
Straddle - the purchase or sale of particular option derivatives that allows the holder to profit
based on how much the price of the underlying security moves, regardless of the direction of
price movement
Earnings announcement - an official public statement of a company's profitability for a specific
time period
Liquidity - an asset’s ability to be sold with minimal loss of value and minimal effect on the
price of the asset; characterized by the volume of trading
Position - A financial stance on a certain company, option, stock, etc. Having a position on a
company indicates stock, options, etc, are either owned or have been shorted and are owed.
Opening a position refers to creating a position, by beginning a trade through either purchasing
or selling short. Closing a position refers to an investor removing themselves from the market on
that particular stock, option, or similar, by selling stock or buying stock to end a short-sale.
Volatility - Volatility refers to the tendency of an asset to fluctuate in worth rapidly with respect
to the market in general, or similar assets.