Project number: 265138 MATRIX Final AMRAmatrix.gpi.kit.edu/downloads/MATRIX-D3.03.pdf3 Abstract The...
57
1 Project number: 265138 Project name: New methodologies for multi-hazard and multi-risk assessment methods for Europe Project acronym: MATRIX Theme: ENV.2010.6.1.3.4 Multi-risk evaluation and mitigation strategies Start date: 01.10.2010 End date: 30.09.2013 (36 months) Deliverable: D3.3: Scenarios of cascade events Version: Final Responsible partner: AMRA Month due: M24 Month delivered: M28 Primary authors (a) : Alexander Garcia-Aristizabal Warner Marzocchi March 2013 _______________________________ _________________ Signature Date (a) see the Acknowledgements section for a full list of people contributing to this document Reviewer: Farrokh Nadim March 2013 _______________________________ _________________ Signature Date Authorised: Kevin Fleming March 2013 _______________________________ _________________ Signature Date Dissemination Level PU Public PP Restricted to other programme participants (including the Commission Services) X RE Restricted to a group specified by the consortium (including the Commission Services) CO Confidential, only for members of the consortium (including the Commission Services)
Transcript of Project number: 265138 MATRIX Final AMRAmatrix.gpi.kit.edu/downloads/MATRIX-D3.03.pdf3 Abstract The...
1
Project number: 265138 Project name: New methodologies for multi-hazard and multi-risk
assessment methods for Europe Project acronym: MATRIX Theme: ENV.2010.6.1.3.4
Multi-risk evaluation and mitigation strategies Start date: 01.10.2010 End date: 30.09.2013 (36 months) Deliverable: D3.3: Scenarios of cascade events Version: Final Responsible partner: AMRA Month due: M24 Month delivered: M28 Primary authors(a):
Alexander Garcia-Aristizabal Warner Marzocchi March 2013
_______________________________ _________________ Signature Date (a)
see the Acknowledgements section for a full list of people contributing to this document
Reviewer:
Farrokh Nadim March 2013 _______________________________ _________________ Signature Date Authorised: Kevin Fleming March 2013 _______________________________ _________________ Signature Date
Dissemination Level
PU Public
PP Restricted to other programme participants (including the Commission Services)
X
RE Restricted to a group specified by the consortium (including the Commission Services)
CO Confidential, only for members of the consortium (including the Commission Services)

2
3
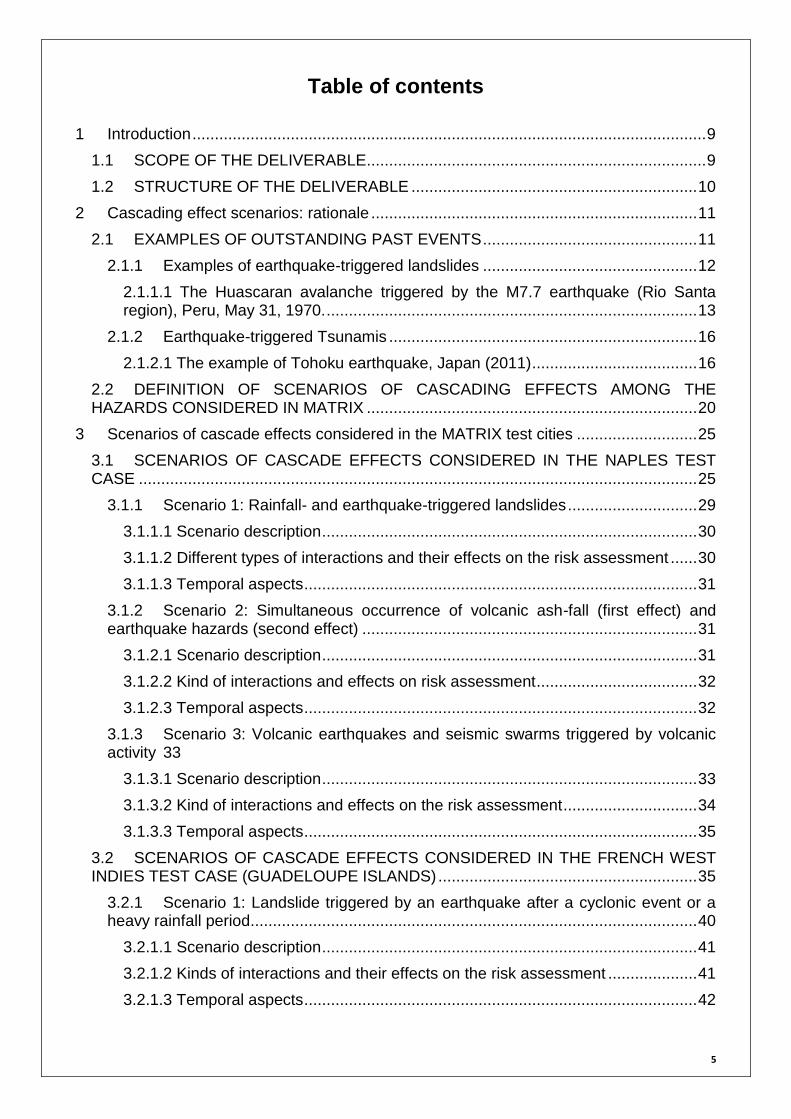
Abstract
The process of scenario identification is a fundamental step towards a quantitative multi-risk assessment that considers cascading effects. To achieve the definition of a complete set of scenarios, different strategies can be adopted, ranging from event-tree-like to fault-tree-like strategies. In many applications, an “adaptive” method combining both kinds of approaches is applied in order to ensure and exhaustive exploration of the scenarios domain. Here we discuss about the importance of considering cascading events within a multi-risk analysis, indentifying those scenarios that imply a significant amplification of the total risk in a particular area of interest. In this optic we first describe outstanding past events in which cascading effects have played an important role when the final consequences of the event are considered. Then, we describe the possible interactions that can be produced among the different (natural) hazards that are considered in the MATRIX project. Finally, we introduce the scenarios for the three test sites considered in the MATRIX project (Naples, French West Indies and Cologne), with detailed descriptions of the specific cases that are to be quantified. In particular, for Naples, three different scenarios were proposed for quantitative analysis: (1) Rainfall- and earthquake-triggered landslides, (2) Simultaneous occurrence of ash-fall (first effect) and earthquake hazards (second effect), and (3) Volcanic earthquakes and seismic swarms triggered by volcanic activity. For the French West Indies test case (Guadeloupe islands), a single scenario was selected, involving the assessment of landslides triggered by an earthquake after cyclonic events or heavy rainfall periods. Finally, for Cologne, a single scenario has been considered related to earthquake-triggered embankment failures and the subsequent inundation of the city of Cologne.
This document constitutes a reference for the description of the scenarios considered. Furthermore, these different scenarios selected for quantification constitute a wide range of cases for the analysis of the effects of cascading effects, and once implemented into an assessment scheme will provide important insights to analyse the problems, advantages, technical issues, etc. of considering interaction among different hazards.
Keywords: multi-hazard; scenarios of cascade effects

4
Acknowledgement
The research leading to these results has received funding from the European Community’s Seventh Framework Programme [FP7/2007-2013] under grant agreement n° 265138.
Different partners from the MATRIX project have collaborated in the preparation of this
report. Here we include the entire list of people who participated (alphabetical order of
institutions):
- AMRA:
Alexander Garcia-Aristizabal, Angela Di Ruocco, Warner Marzocchi.
- GFZ:
Sergey Tyagunov, Sergiy Vorogushyn, Heidi Kreibich, Kevin Fleming.
- BRGM:
Nicolas Desramaut.
5
Table of contents
1 Introduction ................................................................................................................... 9
1.1 SCOPE OF THE DELIVERABLE ............................................................................ 9
1.2 STRUCTURE OF THE DELIVERABLE ................................................................ 10
2 Cascading effect scenarios: rationale ......................................................................... 11
2.1 EXAMPLES OF OUTSTANDING PAST EVENTS ................................................ 11
2.1.1 Examples of earthquake-triggered landslides ................................................ 12
2.1.1.1 The Huascaran avalanche triggered by the M7.7 earthquake (Rio Santa region), Peru, May 31, 1970. ................................................................................... 13
2.1.2 Earthquake-triggered Tsunamis ..................................................................... 16
2.1.2.1 The example of Tohoku earthquake, Japan (2011) ..................................... 16
2.2 DEFINITION OF SCENARIOS OF CASCADING EFFECTS AMONG THE HAZARDS CONSIDERED IN MATRIX .......................................................................... 20
3 Scenarios of cascade effects considered in the MATRIX test cities ........................... 25
3.1 SCENARIOS OF CASCADE EFFECTS CONSIDERED IN THE NAPLES TEST CASE ............................................................................................................................. 25
3.1.1 Scenario 1: Rainfall- and earthquake-triggered landslides ............................. 29
3.1.1.1 Scenario description .................................................................................... 30
3.1.1.2 Different types of interactions and their effects on the risk assessment ...... 30
3.1.1.3 Temporal aspects ........................................................................................ 31
3.1.2 Scenario 2: Simultaneous occurrence of volcanic ash-fall (first effect) and earthquake hazards (second effect) ........................................................................... 31
3.1.2.1 Scenario description .................................................................................... 31
3.1.2.2 Kind of interactions and effects on risk assessment .................................... 32
3.1.2.3 Temporal aspects ........................................................................................ 32
3.1.3 Scenario 3: Volcanic earthquakes and seismic swarms triggered by volcanic activity 33
3.1.3.1 Scenario description .................................................................................... 33
3.1.3.2 Kind of interactions and effects on the risk assessment .............................. 34
3.1.3.3 Temporal aspects ........................................................................................ 35
3.2 SCENARIOS OF CASCADE EFFECTS CONSIDERED IN THE FRENCH WEST INDIES TEST CASE (GUADELOUPE ISLANDS) .......................................................... 35
3.2.1 Scenario 1: Landslide triggered by an earthquake after a cyclonic event or a heavy rainfall period .................................................................................................... 40
3.2.1.1 Scenario description .................................................................................... 41
3.2.1.2 Kinds of interactions and their effects on the risk assessment .................... 41
3.2.1.3 Temporal aspects ........................................................................................ 42

6
3.3 POSSIBLE SCENARIOS OF CASCADE EFFECTS CONSIDERED IN THE COLOGNE TEST CASE ................................................................................................ 42
3.3.1 Scenario 1: Earthquake-triggered embankment failures and subsequent inundation of the City of Cologne ................................................................................ 44
3.3.1.1 Scenario description .................................................................................... 45
3.3.1.2 Kinds of interactions .................................................................................... 49
4 Final remarks .............................................................................................................. 50
5 References ................................................................................................................. 51

7
List of Figures
Figure 1 Map of the region affected by the May 31, 1970 earthquake in Peru (from Cluff, 1971).................................................................................................................................. 14
Figure 2 Distribution of deaths resulting from the 2011 Tohoku earthquake (from Vervaeck and Daniell, 2012b). ........................................................................................................... 17
Figure 3 Relative impact of the earthquake: fractions of damage caused by earthquake and tsunami (Dark red: 100% damage caused by earthquake; dark blue: 100% damage caused by tsunami; yellow: 50% damage via earthquake, 50% damage via tsunami). Source: Vervaeck and Daniell, 2012b; Daniell et al., 2011). .............................................. 18
Figure 4 Causal map and direct/indirect impact chains of the Tohoku earthquake (from Khazai et al., 2011). ........................................................................................................... 20
Figure 5 Diagram showing the possible scenarios of cascade of events among hazards considered in the MATRIX project. .................................................................................... 24
Figure 6 DEM of the city of Naples. ................................................................................... 25
Figure 7 Map of the target areas: Camaldoli, Arenella, and Furigrotta. ............................. 27
Figure 8 Landslide triggering events often observed in Italy (source: CNR-GNDCI: database of areas affected by landslides and floods in Italy). ............................................ 29
Figure 9 Guadeloupe, French West Indies (source: French overseas Ministry website: http://www.outre-mer.gouv.fr/?presentation-guadeloupe.html) .......................................... 36
Figure 10 Spatial repartition of Storm surge hazards in Guadeloupe (Source Dossier Départementaux des Risques Majeurs, DDRM 2004) ....................................................... 38
Figure 11 Spatial repartition of Flood hazards in Guadeloupe (source, DDRM, 2004) ...... 38
Figure 12 Spatial repartition of landslide hazards in Guadeloupe (source, DDRM, 2004) . 38
Figure 13 Spatial repartition of seismic hazards in Guadeloupe (source, DDRM, 2004) ... 38
Figure 14 Spatial repartition of volcanic hazards in Guadeloupe (source, DDRM, 2004) .. 38
Figure 15 Relationships between different hazards (the arrows are orientated in the sense of triggering) (Figure from MATRIX Deliverable 6.3). ......................................................... 39
Figure 16 Spatial distribution of the built-up area (orange) of Cologne and the surrounding suburbs. As can be seen, the Rhine River divides the city effectively into two (black boundary). .......................................................................................................................... 43
Figure 17: Study area between Andernach and Düsseldorf including the Cologne metropolitan area. Location and height of river dikes. ....................................................... 45
Figure 18 Seismic source zones (Grünthal et al., 2010) and hazard distribution (Tyagunov et al., 2006) around Cologne. The stars represent the locations of notable past earthquakes. ...................................................................................................................... 46
Figure 19 (Left) Extreme value statistics and (right) typical normalised flood hydrographs with associated probabilities of occurrence for the river gauge Andernach (upstream of Cologne, Figure 17). .......................................................................................................... 47
Figure 20. The three breach mechanisms considered for the flood-protection dikes along the Rhine in the vicinity of Cologne .................................................................................... 48
8
List of Tables
Table 1 Casualties and damage at communities that were strongly affected by the May 31, 1970, earthquake (statistics as defined July 2, 1970, Comité Nacional de Emergencia del Peru). ................................................................................................................................. 15
Table 2 Distribution of level of damage to buildings considering the earthquake and the tsunami. ............................................................................................................................. 18
Table 3 Estimated economic losses (in billion USD) due to direct damages caused by the earthquake, tsunami and powerplant after the Mw 9.0 Tohoku earthquake, Japan. Source: Khazai et al. (2011), Vervaeck and Daniell (2012b). ......................................................... 19
Table 4 Matrix presenting the possible direct interactions among the hazards considered in the MATRIX project (interactions at hazard level). The number ‘1’ in a cell represents possible interactions at hazard level, whereas the symbol ‘V’ represents possible interactions at vulnerability level. ....................................................................................... 22
Table 5 Cascades of more than 2 events (considering only interactions at the hazard level). ................................................................................................................................. 23
Table 6 Summary of some relevant parameters and data from the three selected areas of interest in Naples for multi-type hazard and risk analysis: Canaldoli, Arenella, and Fuorigrotta. ........................................................................................................................ 27
Table 7 Possible cascade scenarios for the Naples test case. .......................................... 28
Table 8 Kind of interactions considered for the rainfall- and earthquake-triggered landslides ........................................................................................................................... 31
Table 9 Time scales of interest for the rainfall- and earthquake-triggered landslides ........ 31
Table 10 Kind of interactions considered for the Simultaneous occurrence of ash-fall (first effect) and earthquake hazards (second effect) scenario .................................................. 32
Table 11 Time scales of interest for the cascading effect considering the simultaneous occurrence of volcanic ash-fall (first effect) and earthquake hazards (second effect) ........ 33
Table 12 Kind of interactions considered for the earthquake swarms triggered by volcanic activity ................................................................................................................................ 35
Table 13 Time scales of interest for the volcanic earthquake hazard produced by triggered seismicity during volcanic unrests ...................................................................................... 35
Table 14 Description of the three selected areas of interest in Guadeloupe selected for multi-type hazard and risk analysis. ................................................................................... 39
Table 15 Possible event cascade scenarios for the French West Indies test case. ........... 40
Table 16 Kind of interactions considered for the rainfall- and earthquake-triggered landslides ........................................................................................................................... 42
Table 17 Time scales of interest for the cyclone- and earthquake-triggered landslides ..... 42
Table 18 Possible event cascade scenarios identified for the Cologne test case. ............. 44
9
1 Introduction
Multi-hazard is a wide concept that, in its most general interpretation can be defined as “the process to determine the probability of occurrence of different hazards, either occurring at the same time or shortly following each other, because they are dependent upon one another or because they are caused by the same triggering event or hazard, or merely threaten the same elements at risk without chronological coincidence” (European Commission, 2010; Garcia-Aristizabal et al., 2012a). Following this definition, we can divide the multi-hazard concept into two possible lines of applications: (1) multi-hazard assessment seen as the process of assessing different (independent) hazards threatening a given (common) area, and (2) as representing the process of assessing possible interactions and/or cascade effects among the different types of hazardous events. In theory, a holistic multi-hazard assessment should include both parts of the concept. However, according to the typology and specific objectives of the project of interest, it may be possible that only one of them is sufficient.
Looking at the current state-of-the-art of multi-hazard practices (e.g., Garcia-Aristizabal et al., 2012b), and in particular considering natural hazards, it has been found that most of the multi-hazard applications currently available have been oriented toward the assessment of independent hazards threatening common exposed elements, and few efforts have been dedicated towards the definition and quantification of cases where there are possible interactions and cascade effects that may occur among/between different hazardous events. This last perspective is one of the most ambitious objectives of the MATRIX project (and the main objective of WP3 and WP5). This report, which is one of the activities of Task 3.2 (Identification of possible cascade events for different space-time scales), aims to describe the most important scenarios of cascade effects that can be foreseen among the hazards considered in the MATRIX project, and in particular for the test cases considered in WP7.
1.1 SCOPE OF THE DELIVERABLE
The results of Task 3.1 (Review of existing multi-hazard assessment procedures) were presented in deliverables D3.1 “Review of existing procedures” and D3.2 “Dictionary of terminology”. In particular, D3.1 contains a review of the state-of-the-art in multi-hazard assessment, with special attention paid to the work undertaken in previous European projects. On the other hand, the main objectives of Task 3.2 in this report are:
- Among the hazards considered in the MATRIX project, identify possible scenarios of cascade events for different space- and time scales;
- Identification of the conditions that have to be met to see a significant increase in the total risk due to interactions between events;
- The most significant interactions that may lead to an amplification of single risks and/or to triggering different threatening events;
- To consider the temporal aspect, because cascade conditions strongly depend upon the time scale that is being considered.

10
Considering the overall objective of WP3, the main scope of this report is then to identify, describe, and characterize the most relevant scenarios of cascade and triggered events that can occur among the different hazards considered in MATRIX project.
1.2 STRUCTURE OF THE DELIVERABLE
The deliverable is structured into four sections. After the introduction, the second section describes the importance of considering cascading events within a multi-risk analysis. We are interested in indentifying those scenarios that imply a significant amplification of the total risk in a particular area of interest. In this section in particular, we first describe outstanding past events in which cascading effects have played an important role if we consider the final consequences of the event (i.e., considering the observed losses, it is possible to infer the proportion of which the secondary triggered event(s) contributed to the total loss), and then we describe, in general terms, the possible interactions that can be produced among the different (natural) hazards that are considered in the MATRIX project.
The third section introduces the scenarios for the three test sites considered in the MATRIX project (Naples, French West Indies [Guadeloupe], and Cologne), with detailed descriptions of the specific cases that are to be quantified. Finally, the fourth section provides some concluding remarks.

11
2 Cascading effect scenarios: rationale
The term “scenario” is used in a wide range of fields and so different definitions can be found in practical applications. In general, a scenario may be considered as a synoptical, plausible and consistent representation of an event or series of actions and events. In particular, it must be plausible because it must fall within the limits of what might conceivably happen, and must be consistent in the sense that the combined logic used to construct a scenario must not have any built-in inconsistencies. More specifically, this report is intends to describe the possible scenarios of cascade events considering the different natural hazards of interest for the MATRIX project. Following the definition outlined in the MATRIX Deliverable D3.2, a “cascade of events”, or in general “cascading effects”, is defined as a series of, or a parallel sequence of, adverse events generated by single or different sources.
From the risk assessment point of view, the cascading effects scenarios of main interest are those that produce an amplification of the effects when compared to the effects produced by the single (triggering) event. Furthermore, the set of scenarios should be “complete”, meaning that it should include all the possible scenarios (e.g., Kaplan 1991; Haimes 2009). Nevertheless, in practical applications, there might be a continuum of possible scenarios, making the scenario structuring an overwhelming problem. For this reason, the scenario selection process is generally centred on the identification of the most important ones.
The literature available dealing with risk analysis and more specifically on scenario description and structuring is quite extensive. The first issue is generally the definition of a strategy for the identification of possible scenarios. To achieve this objective, it is necessary to define an objective process of finding, organizing and categorizing the set of risk scenarios. As such, it can (and should) include well-known standard methods of scenario identification, such as event trees, fault trees, etc. For example, event tree structures use a ‘forward logic’ strategy that implies to identifying the possible initiating (triggering) events. In this event-tree-like structure, the nodes are uncertain or chance events; the model shows the sequence of chance events that can lead to desirable or undesirable outcomes. On the other hand, fault trees use a ‘backward logic’ strategy that begins with an endpoint, outcome or result, and works backwards to find the most likely causes of the result. As with the forward logic analysis, in this case the nodes are uncertain or chance events and the structure commonly focuses on identifying the most likely path from an endpoint back to its originating events (e.g., Haimes 2009; Yoe 2012).
2.1 EXAMPLES OF OUTSTANDING PAST EVENTS
Different catastrophic events in the past provide the evidence for the need to consider and assess possible cascading effects in risk quantification procedures. Many examples can be cited, as for example, the well-known cases of tsunamis triggered by earthquakes, or landslides triggered by intense rain events or earthquakes. In this section, we describe two outstanding cases that highlight the amplified effects and losses due to the synergic actions when two or more events interact, resulting in a cascade of effects.

12
2.1.1 Examples of earthquake-triggered landslides
This phenomenon has been widely observed around the world, and much has been learned about earthquake-induced landslides since the first formal, scientific post-earthquake investigation was undertaken following the earthquake swarm in Calabria, Italy in 1783, when the Neapolitan Academy of Sciences and Fine Letters appointed a commission to conduct field studies in the epicentral area (Sarconi, 1784, cited by Cotecchia et al., 1986; Davison, 1936; Keefer, 2002). In this non-exhaustive brief introduction, we will list some of the most well-known cases, and at the end a specific case – important from a multi-hazard and multi-risk perspective due to its implications for the final loss assessment — is discussed in more detail. Detailed syntheses of data and historical reviews of past cases of landslides triggered by earthquakes can be found in, for example, Keefer (1984, 2002), Jibson (1985), Jibson and Keefer (1988, 1989, 1993), Rodriguez et al., 1999, Papadopoulos and Plessa, 2000 (for Greece), and Prestininzi and Romeo, 2000 (for Italy).
Examples of early reports of earthquake-triggered landslides include those dealing with the M7.3 Charleston, South Carolina, earthquake of 1886 (Dutton, 1889), the M8.3 Assam, India, earthquake of 1897 (Oldham, 1899), the M7.8 San Francisco, California, earthquake of 1906 (Lawson, 1908), and the M8.1 Bihar, India-Nepal, earthquake of 1934 (Geological Survey of India, 1939). All of these reports contain descriptions of landslides occurring throughout the relatively large areas that were surveyed on the ground, although not all localities that probably produced landslides were described (Keefer, 2002).
More recently, the large 1964 Alaska earthquake (M9.2) provided much data on landslides, even though the area affected was very large (269,000 km2; Plafker et al., 1969); thousands of landslides were documented by many investigations, and the results (along with other earthquake effects) were published in an eight-volume report by the National Academy of Sciences (National Research Council Committee on the Alaska Earthquake, 1968-1973) and many other reports and articles (for a list, see Keefer and Tannaci, 1981). Detailed descriptions and analyses were carried out on a wide variety of landslides, including large rock avalanches, subaqueous landslides, and several landslides that caused considerable damage in Anchorage, the largest city in Alaska (Keefer, 2002).
An extreme example involving a massive loss of human life is the M7.7 earthquake in the Rio Santa region of Peru on May 31, 1970, which is generally cited as one of the most destructive, single earthquake-induced landslide in historic times. This earthquake triggered a rock avalanche from Nevado Huascarán in the Andean Cordillera Blanca, which killed more than 18,000 people. The earthquake also generated thousands, or possibly tens of thousands, of other landslides throughout an onshore area of about 30,000 km2 (Plafker et al., 1971).
Another outstanding example is the M6.7 San Fernando, California, earthquake of February 9, 1971, which triggered landslides that occurred over an area of about 250 km2 (considering the most heavily affected region); studies such as those presented in Morton (1971, 1975) provided detailed data on the earthquake-induced landslides, including the types of movement and material involved, and also presented evidence suggesting that the types of landslides produced by the earthquake were different from the “large rotational or complex landslides” previously found to be characteristic of that area (Morton, 1971, 1975). Other interesting cases of earthquakes that triggered important landslide events found in literature include the M7.5 Guatemala earthquake of February 4, 1976 (>10,000 triggered landslides, e.g., Harp et al., 1981); the Friuli earthquake sequence, Italy, in 1976 (M6.3-6.5 for the largest shock, with documented landslides in an area of about 500 Km2, e.g., Ambraseys, 1976; Govi, 1977a, 1977b; Govi and Sorzana, 1977); the M6.9 Loma

13
Prieta, California, earthquake of October 17, 1989 (>1300 landslides in an area of about 2,000 Km2, e.g., Weber and Nolan, 1989; Plant and Griggs, 1990; Spittler and Harp, 1990; Manson et al., 1992; Keefer, 1998, 2000); the M6.7 Northridge, California, earthquake of January 17, 1994 (>11,000 landslides throughout an area of 10,000 km2, most of which were in a central area of about 1,000 km2 of steep slopes, e.g., Harp and Jibson (1995, 1996); the M6.9 Hyogoken-Nanbu, Japan, earthquake of January 17, 1995 (the Kobe earthquake, with >700 landslides triggered throughout an area of about 700 km2, e.g., Sassa et al., 1995; Fukuoka et al., 1997); the 1997 Umbria-Marche earthquake sequence in central Italy (maximum event with M6.0), which produced about 100 landslides throughout an area of 1400 km2 (e.g., Bozzano et al., 1998; Esposito et al., 2000); and Mw 8.0 Wenchuan earthquake of May 12, 2008, in which produced more than 15000 instances of landslides, rock falls, debris flows, and mudslides; in this case, the events killed at least 69227 people, injured 374643 and 17923 are missing (presumed dead, as of May 2009, e.g., Bjerrum et al., 2010). The effects of the triggered mass movements count for about 20000 fatalities (Yin et al., 2009), and the economic losses due to the earthquake are estimated to be 124 billion USD (Bjerrum et al., 2010).
2.1.1.1 The Huascaran avalanche triggered by the M7.7 earthquake (Rio Santa region), Peru, May 31, 1970.
A well-known catastrophic earthquake-triggered landslide is the Huascaran rock-debris avalanche, triggered by the M7.7 Peru earthquake in 1970, causing the deaths of more than 18000 people, burying two villages (Plafker et al., 1971).
The M7.7 Peru earthquake occurred beneath the Pacific Ocean on May 31 1970, about 25 km from the coast of Peru (e.g., see Figure 1). The ground shaking produced by the earthquake triggered an unstable mass of glacial ice about 800 meters across at the top of Nevado Huascarán to fall, resulting in more than 50 million cubic meters of debris sliding approximately 15 kilometres downhill, achieving speeds between 200 to 400 km/h (Plummer et al., 2007).

14
Figure 1 Map of the region affected by the May 31, 1970 earthquake in Peru (from Cluff, 1971).
The main landslide was triggered about 130 km away from the earthquake. It swept along the valley at the foot of the mountain, filling it with rock, mud and ice, and partially destroying the towns of Ranrahirca, 12 km from the mountain. Part of the landslide branched off to one side, swept over a ridge and flowed through the village of Yungay. The village was obliterated; only a few of its inhabitants managed to escape by running to higher ground as the landslide approached. The earthquake also triggered many other smaller landslides in the region, destroying thousands of buildings and causing even more deaths.
The impact of the mass movement triggered by the 1970 fall from Huascarán was considerable and reportedly involved a massive loss of life (e.g., Plafker et al., 1971). The event is frequently listed as one of the deadliest mass movements in history (e.g., Evans, 2006; Schuster and Highland, 2007). The most detailed summary of casualties is by Plafker et al. (1971) who tabulate data from the “Comite Nacional de Emergencia del Peru" as of July 2, 1970 (Evans et al., 2009). Estimates of the final death toll vary from one reference to the other. Following Plafker et al. (1971), the event is believed to have caused at least 40,000 deaths (mostly at the cities of Yungay, Huaras, Ranrahirca and Mancos) and resulted in extensive to total destruction of buildings at dozens of

15
communities. According to preliminary statistics of the Comité Nacional de Emergencia del Peru (July 2, 1970), the earthquake also caused some 50,000 injuries, and destroyed or rendered uninhabitable 186,000 buildings, representing 80 per cent of all structures in the area. Of the casualties, at least 18,000 persons were buried beneath the great debris avalanche that covered Yungay and most of Ranrahirca. The remainder were killed mainly by collapsed structures, or landslides. A summary of the effects in terms of casualties and damage to structures, as presented by Plafker et al. (1971), is outlined in Table 1. Considering the assessed numbers of casualties, it is important to highlight the secondary, triggered event (i.e., main avalanche), that from the statistics listed in Table 1 and considering the confirmed casualties and the missing people, alone accounts for about the 83% of the total.
Table 1 Casualties and damage at communities that were strongly affected by the May 31, 1970, earthquake (statistics as defined July 2, 1970, Comité Nacional de Emergencia del Peru).
Community Dead Missing Percentage of
buildings destroyed (%)
DAMAGE MAINLY BY STRUCTURAL FAILURE
Mancos 1100 2000 70
Quillos 108 ? 70
Huaras 798 16000 80
Aija 291 ? 100
Carhuapampa 458 ? ?
Carhuas 160 17 50
Caras 332 8 55
Huata 200 1 80
Huailas 300 17 85
Recuay 150 ? 20
Huyllapampa 100 ? ?
Chimbote 444 244 65
Cajacay 100 ? 90
Caceras del Per
140 ? ?
Macate 100 60 100
Santa 260 200 75
Cajatambo 96 ? 30
DAMAGE MAINLY BY HUASCARAN DEBRIS AVALANCHE
Yungay 320 15,000 100
Matacoto ? ? 70
Ranrahirca 800 1000 100
16
2.1.2 Earthquake-triggered Tsunamis
A tsunami is a well-known phenomenon that is triggered by other natural events. The principal generation mechanism of a tsunami is the displacement of a substantial volume of water or perturbation of the sea (e.g., Haugen et al., 2005). This displacement of water is usually attributed to different phenomena as earthquakes, landslides, volcanic eruptions, etc., and the waves formed in this way are then sustained by gravity (e.g., Voit 1987; Margoritondo, 2005).
Earthquake-triggered tsunami events, in particular, can be generated when the sea floor abruptly deforms and vertically displaces the overlying water. Many recent events with catastrophic consequences have contributed to increasing interest and awareness in this kind of events. Considering their impacts, some recent examples of powerful megathrust earthquakes that have generated tsunamis are: the 1960 Valdivia earthquake (Mw 9.5); the 1964 Alaska earthquake (Mw 9.2); the 2004 Indian Ocean earthquake (Mw 9.2), and the 2011 Tohoku earthquake (Mw9.0). In this section we will discuss the effects of the 2011 Tohoku earthquake and tsunami, since it provides important evidence in terms of the effects of cascading effects considering natural and technological events.
2.1.2.1 The example of Tohoku earthquake, Japan (2011)
On March 11, 2011, the 2011 Tohoku‐Oki earthquake occurred off the Pacific coast of
northeastern Honshu, Japan. The event was a dip‐slip rupture of the plate boundary between the Pacific and North America plates. The moment magnitude (MW) of this event was 9.0, which is believed to be the largest value ever recorded in Japan (e.g., Saito et al, 2011; Suzuki et al., 2011). The rupture area, determined to be approximately 450 km x 200 km, generated a tsunami 130 km off the coast of Miyagi Prefecture, northeast Japan (e.g., Mori et al., 2011). This tsunami was the third mega-earthquake generated tsunami in this decade; the other two being the Sumatra tsunami of 2004 (e.g., Liu et al., 2005) and the Southern Chile tsunami (Michelini et al., 2010). The tsunami first reached the Japanese mainland 20 min after the earthquake and ultimately affected a 2000 km stretch of Japan’s Pacific coast (Mori et al., 2011).
Saito et al. (2011) analyzed the tsunami waveforms, and estimated the initial tsunami water height distribution using an inversion analysis based on dispersive tsunami simulations. In their results, they outline that the distribution is characterized by a peak
height of 8 m located near the trench and the high‐water (>2m) region extending landward with a width of ∼100 km.
Before this event, there was thought to be a high risk of earthquake and tsunami off the Tohoku coast. The 1896 Meiji Sanriku earthquake (Mw 8.2–8.5) and tsunami caused about 22000 deaths, and smaller tsunamis have occurred roughly every 10 to 50 years. Thus, earthquake and tsunami disaster countermeasures, such as offshore and onshore tsunami barriers, planted tree barriers, vertical evacuation buildings, and periodic evacuation training had been introduced to these areas (Mori et al., 2011). Therefore, Mori et al. (2011) emphasize that Tohoku was one of the areas best prepared for a tsunami. Nevertheless, the tsunami disaster countermeasures were insufficient against the 2011 event. Tsunami barriers were severely damaged, some reinforced concrete buildings were totally destroyed, and inundation maps underestimated the effects in several areas (Mori et al., 2011).

17
The M9.0 Tohoku earthquake and tsunami of 11th March, 2011 proved to be the most expensive earthquake of all time, causing between $400-700 billion USD (e.g., Vervaeck and Daniell, 2012a) in total losses and approximately 19000 deaths (16100 dead, 3000 missing: a total of 19100 as of March 2012, Vervaeck and Daniell, 2012b). Of this number, around 600 are assumed to have died from earthquake-related stress and chronic disease and around 265 due to collasped structures. Another around 230 could be related to other causes, such as fire, landslides etc. Hence, around 94.2% of the deaths were tsunami related (see Figure 2, Vervaeck and Daniell, 2012b).
Figure 2 Distribution of deaths resulting from the 2011 Tohoku earthquake (from Vervaeck and Daniell, 2012b).
Around 35% of buildings in the area were built pre-1980, around 55% from 1981-2000 and 10% post-2001. In terms of seismic code, this means that around 65% had been built following major Japanese seismic codes (1981, 1987 etc.) and that the other 35% were influenced by previous pre-war seismic codes and earthquakes (1926, 1938, Vervaeck and Daniell, 2011). Most of the buildings are wooden in the affected area, with some concrete and steel buildings making up the mix (Vervaeck and Daniell, 2011). Over 1.2 million buildings had been damaged by the tsunami and earthquake (as of March 2012, Vervaeck and Daniell, 2012b). Furthermore, 3918 roads have been reported to be damaged, as well as 78 bridges, 45 dikes and 29 railway locations. In addition, around 200 landslides were reported (however, the data seems to be incomplete from many locations, Vervaeck and Daniell, 2012b).
Considering the damages to buildings during this event, Daniell et al. (2011) obtained the distribution of damages considering both tsunami- and earthquake-caused losses shown in Table 2. The best estimate of damage to buildings from Daniell et al. (2011) coming from each of the three events is the earthquake (42%), tsunami (39%) and nuclear incident (19%). Nevertheless, the relative impact of the earthquake vs. the tsunami changes from one place to the other, as outlined in Figure 3.

18
Table 2 Distribution of level of damage to buildings considering the earthquake and the tsunami.
Buildings Destroyed Partially destroyed Partially damaged
Tsunami 104020 111317 67329
Earthquake 25510 142784 634536
Figure 3 Relative impact of the earthquake: fractions of damage caused by earthquake and tsunami (Dark red: 100% damage caused by earthquake; dark blue: 100% damage caused by tsunami; yellow: 50% damage via earthquake, 50% damage via tsunami). Source: Vervaeck and Daniell, 2012b; Daniell et al., 2011).

19
In total, one year after the event, reasonable estimates for the earthquake and tsunami direct economic losses are between $237 billion and $303 billion, with around $275 billion USD as the median estimate (e.g., Vervaeck and Daniell, 2012b). In addition, around $65 billion USD direct damage occurred as a result of the power plant incident in Fukushima. Indirect losses could be of the order of $185 to 345 billion across the earthquake, tsunami and powerplant (Vervaeck and Daniell, 2012b). It is worth remembering that even without the tsunami, the earthquake would still have caused 40-45% of the total damage seen (Daniell et al., 2011; Khazai et al., 2011).
Table 3 shows that around 112–145 billion USD of damage was caused by the tsunami, while 48–81 billion USD can be attributed to the earthquake in coastal regions. This gives approximately equal components of earthquake (52 %) and tsunami loss (48 %) for the sum of both inland and coastal areas. About two-thirds of the total losses calculated by the cabinet office and prefectural reports are housing- or infrastructure-related (Khazai et al., 2011). Note that the monetary losses associated with the displacement of 70,000 residents within the evacuation zones, as well as the decommissioning of the Fukushima plant have not been calculated, other than by estimates via TEPCO and other sources (Khazai et al., 2011). The estimated values of the tsunami, earthquake and power plant losses are shown in Table 3; these values result from the direct loss estimates of the Japanese Government and Prefectures, as well as additional CATDAT information (Khazai et al., 2011).
Table 3 Estimated economic losses (in billion USD) due to direct damages caused by the earthquake, tsunami and powerplant after the Mw 9.0 Tohoku earthquake, Japan. Source: Khazai et al. (2011), Vervaeck and Daniell (2012b).
In Billion USD Earthquake Tsunami Power plant
Direct Loss Inland 77 0 30-41
Direct Loss Coastal
48-81 112-145 28-30
Total Direct Loss 125-158 (42%) 112-145 (39%) 58-71 (19%)
Indirect Economic Loss
69-132 64-113 51-91
Total Economic Loss
194-290 (41%) 176-258 (36%) 109-162 (23%)
The Tohoku earthquake was typical of disasters in which there occured ‘cascading expansion’. Khazai et al. (2011) performed an analysis of ‘causal’ interactions for this event. In accounting for all of the factors relevant during the Tohoku disaster, Khazai et al. (2011) considered the ‘cascade’ effects produced by the main initial earthquake and both the tsunami and the nuclear power plant incidents, as depicted in Figure 4. The causal map depicts the direct and indirect interactions between the various triggering events and their causes found in the literature, as well as the concept of cascading phenomena and exacerbating factors in society and the economy triggered by the earthquake.

20
Figure 4 Causal map and direct/indirect impact chains of the Tohoku earthquake (from Khazai et al., 2011).
Beyond the non-negligible ‘amplification’ of the losses due to the triggering effects, another important factor to consider in this case is the short term hazard and risk assessment. In particular, the occurrence of a seismic sequence may increase the short-term probability of a large shock by orders of magnitude (although the absolute probability may remain low, e.g., Woo and Marzocchi, 2011). In this case, on 9 March, 2011, a Mw 7.4 thrust
earthquake (the so‐called Sanriku‐Oki earthquake) shook the middle portion of the Japan trench (e.g., DeMets et al., 2010). According to the Japan Meteorological Agency (JMA), this earthquake nucleated at a depth of 8 km, 25 km north and 36 km west of the epicenter of the March 11th event, which occurred 51 hours later (Shao et al., 2011). The small temporal separation and spatial proximity between these two events have drawn significant attention to their potential interaction (e.g., Ando and Imanishi, 2011). Woo and Marzocchi (2011) analysed the sequence and found that the weekly probability (of a M>8.5) after the Mw7.4 event increased, relative to the background probability, by a factor of 100 in a circular area around the the epicenter with radius of 100 km. In this case, it is straightforward to understand that an increase in the probability of a large earthquake implies an increase in the short-term probability of a tsunami. Likewise, this increase in the hazard component also implies an increase on the risk.
2.2 DEFINITION OF SCENARIOS OF CASCADING EFFECTS AMONG THE HAZARDS CONSIDERED IN MATRIX
To define the most important scenarios of cascade effects among natural hazards, in the MATRIX milestone MS3 document it was proposed to identify the ‘primary’ interactions between hazards. This can be understood as considering the pairs of hazards where it is theoretically possible to define an event that has the capacity to directly trigger another one, defining in this way the possible interactions at the hazard level.

21
In the matrix-like table shown in Table 4, the different hazards considered in the MATRIX project are classified as triggering (running in the x-axis) against the ‘triggered’ (running in the y-axis) events. In this case, all the possible ‘direct’ triggering effects are considered and define the interactions at the hazard level. Furthermore, the most significant cases in which the simultaneous or near-similtaneous occurrence of two events may lead to interactions at the vulnerability level are also represented. In this case, the hazards running in the x-axis are considered as the ‘first effect’ events (i.e., the event occurring first in time, and whose effects on the exposed elements remain during the occurrence of the subsequent event or events), whereas those in the y-axis are considered as ‘second effect events’. The cases in which interactions at vulnerability level may be of importance for the risk assessment are represented with the symbol ‘V’.

22
Table 4 Matrix presenting the possible direct interactions among the hazards considered in the MATRIX project (interactions at hazard level). The number ‘1’ in a cell represents possible interactions at hazard level, whereas the symbol ‘V’ represents possible interactions at vulnerability level.
a, c In specific cases, such as, for example, when a landslide (a) or a lava flow (c) reaches and blocks a river.
b For example, a volcanic edifice collapses.
It is also possible to highlight more complex cascade effects, in which more than two events in a possible cascade sequence can be identified. This is shown in Table 5, where this case, the number refers to the ‘level’ (i.e., the position in the sequence of events) at which the given phenomena may be triggered, starting from the triggering event as level 0.
Triggering ->
(cause)
Considered hazards
Triggered
(result)
Triggering events / first-effect events
Ea
rthqu
ake
s
La
nd
slid
es
Volcanic
flo
od
s
Tsun
am
i
Wild
fire
s
Meteorological events
Vo
lca
nic
eru
pti
on
(in
ge
nera
l)
Tep
hra
fa
ll
Pyro
cla
stic flo
ws
La
va
flo
ws
La
ha
rs
Vo
lcan
ic e
art
hq
ua
ke
s
Extr
em
e w
ind
Hea
vy p
recip
ita
tio
n
Extr
em
e t
em
pe
ratu
re
Tri
gg
ere
d e
ve
nts
/ s
ec
on
d-e
ffe
ct
ev
en
ts
Earthquakes V 1b V V V
Landslides 1, V 1 V 1? 1
Vo
lcan
ic
Volcanic eruption
1
Tephra fall
Pyroclastic flows
Lava flows
Lahars V V 1
Volcanic earthquakes
1, V V V
Floods V 1a 1c
V 1
Tsunami 1, V 1 1 V
Wildfires 1 1 1

23
Table 5 Cascades of more than 2 events (considering only interactions at the hazard level).
Ea
rthqu
ake
s
La
nd
slid
es
Vo
lca
nic
eru
pti
on
(in
ge
nera
l)
flo
od
s
Tsun
am
i
Wild
fire
s
Meteorological events
Extr
em
e w
ind
Hea
vy p
recip
ita
tio
n
Extr
em
e t
em
pe
ratu
re
Tri
gg
ere
d e
ve
nts
Earthquakes 1
Landslides 1 1,4
1? 1
Vo
lcan
ic
Volcanic eruption
1d
Tephra fall 2 1
Pyroclastic flows
2 1
Lava flows 2 1
Lahars 2,3 2 1
Volcanic earthquakes
2 1
Floods 2 1 3 1
Tsunami 1 1 1
Wildfires 3 3 1
d In this case, it may be more properly defined as the triggering of volcanic unrest that eventually leads to an eruption.
The numbers in this table are an attempt to represent the different possible sequences of events that can produce different chains of cascade events. Figure 5 allows us to understand better the existing relationships between the different kinds of events and their relative level in the chain. In this way, the occurrence of different phenomena may be considered from the possible triggering factors.

24
Figure 5 Diagram showing the possible scenarios of cascade of events among hazards considered in the MATRIX project.

25
3 Scenarios of cascade effects considered in the MATRIX test cities
3.1 SCENARIOS OF CASCADE EFFECTS CONSIDERED IN THE NAPLES TEST CASE
Naples is located in south west Italy on a bay along the Tyrrhenian coast in the inner-most part of the Gulf of Naples. It is in the midst of two volcanic areas, the Phlegrean Fields and Mount Vesuvius. From the eastern hills of the Phlegrean Fields, the city slopes down northward to the Campanian Plain and slopes down southeastward to the slopes of Mt. Vesuvius.
The eastern area of Naples consists of a wide floodplain (the Sebeto river hollow) while the western urban area of Naples consists of the Bagnoli Plain and the remains of 4 ancient volcanic hollows generated by the Phlegrean Fields volcanism (Chiaia, Neapolis, Fuorigrotta and Soccavo, see Figure 6). The urban area of Naples is mainly composed of hills, most of them with heights ranging from 150 to 452 meters.
Figure 6 DEM of the city of Naples.
The geological history of the whole territory is complex: the latest substrate is mainly composed of volcanic debris. The Campania region is fragile and exposed to several environmental risks, both natural and anthropogenic, that have in recent centuries produced disastrous events resulting in thousands of victims and huge damage to the cultural heritage. Considering only the latter half of the 20th century, in Campania there were about 3300 victims of natural disasters (e.g., 2734 in the 1980 Irpinia earthquake, 40 in the 1944 eruption of Vesuvius and the rest due mainly to landslides and floods). In fact, Campania is the Italian region that has suffered the highest number of fatalities from natural catastrophes: more than 40% of the total for Italy. In particular, considering only
26
the natural sources of environmental hazards for the Naples city area, the main hazards are:
Volcanic hazard, which encompasses the active volcanoes of Somma-Vesuvius, Phlegrean Fields and the island of Ischia;
Seismic hazard, due both to active faulting in the Campanian Apennines and to earthquakes arising from the three active volcanoes in the Naples area;
Hydrogeological hazard, mainly due to flash floods, pyroclastic flows and rock falls due to slope instability;
Tsunami hazard, whose origin may be identified in earthquakes with their epicenters in the sea or in coastal areas, coastal or submarine landslides, and volcanic eruptions (in this case, possible sources are volcanic activity on Ischia and Vesuvius, and submarine volcanoes in the low Tyrrhenian Sea.
While the volcanic and seismic hazards can affect the whole city (with an intensity varying from place to place), the areas prone to the tsunami and hydrogeological hazards are respectively located on the coast and close to instable slopes. In particular, in the Phlegrean Fields, the sectors mainly susceptible to landslides or rock falls are located along steep tuff slopes, in pyroclastic deposits and, in some places, in lavas. The recurrent morphologies are associated with the caldera rims, slopes of coastal fault and to escarpments bordering river valleys.
Considering the area of the city of Naples, the parts susceptible to landslides and rock fall are mainly located near the outcrops of Campanian Ignimbrite and Neapolitan Yellow Tuff on the Camaldoli hill (Soccavo and Pianura side). Similar events of lower intensity have been observed on the Posillipo hill, mainly composed of Neapolitan Yellow Tuff, along the slopes on the side of the Fuorigrotta district and along the tuff cliffs of Coroglio.
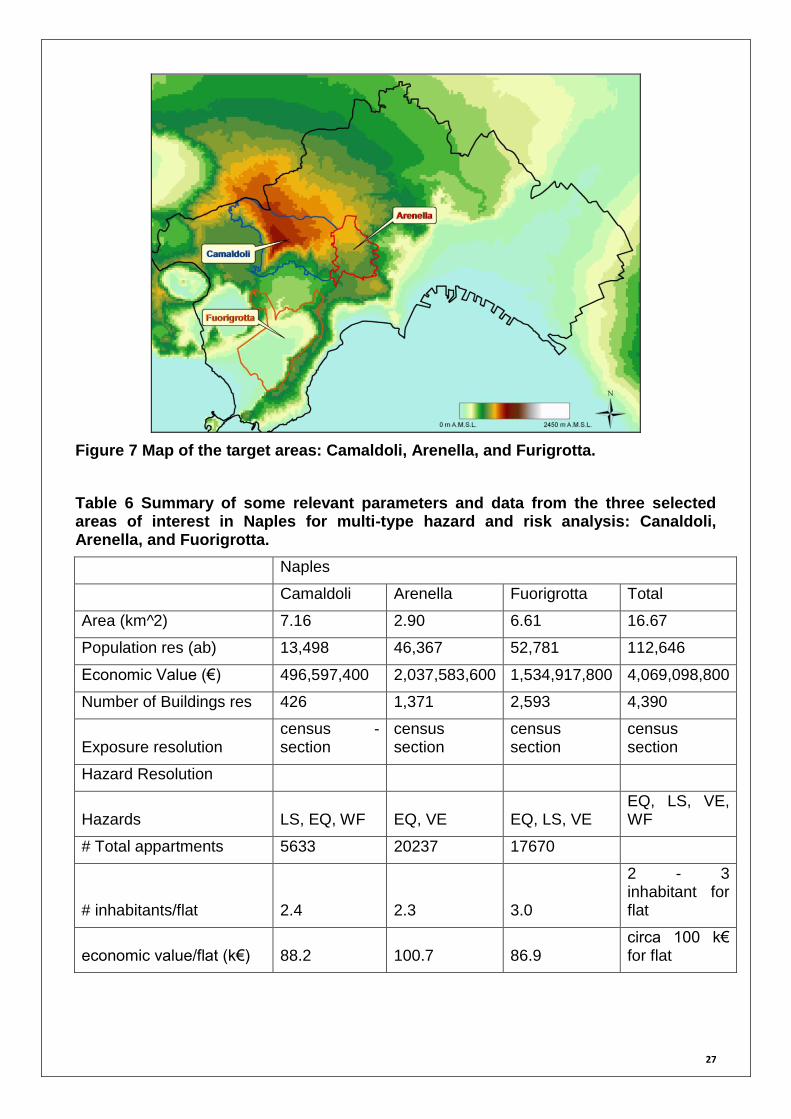
In the MATRIX project, three target areas within the Naples city area have been selected for multi-type hazard and risk analysis. These areas have been selected according to the spatial distribution of natural hazards and the available information about the elements at risk. The selected target areas are: Camaldoli, Fuorigrotta and Arenella (Figure 7). Some characteristics of the three areas, namely area, number of inhabitants, number of residential and commercial buildings, etc., are summarized in Table 6.
27
Figure 7 Map of the target areas: Camaldoli, Arenella, and Furigrotta.
Table 6 Summary of some relevant parameters and data from the three selected areas of interest in Naples for multi-type hazard and risk analysis: Canaldoli, Arenella, and Fuorigrotta.
Naples
Camaldoli Arenella Fuorigrotta Total
Area (km^2) 7.16 2.90 6.61 16.67
Population res (ab) 13,498 46,367 52,781 112,646
Economic Value (€) 496,597,400 2,037,583,600 1,534,917,800 4,069,098,800
Number of Buildings res 426 1,371 2,593 4,390
Exposure resolution census -section
census section
census section
census section
Hazard Resolution
Hazards LS, EQ, WF EQ, VE EQ, LS, VE EQ, LS, VE, WF
# Total appartments 5633 20237 17670
# inhabitants/flat 2.4 2.3 3.0
2 - 3 inhabitant for flat
economic value/flat (k€) 88.2 100.7 86.9 circa 100 k€ for flat
28
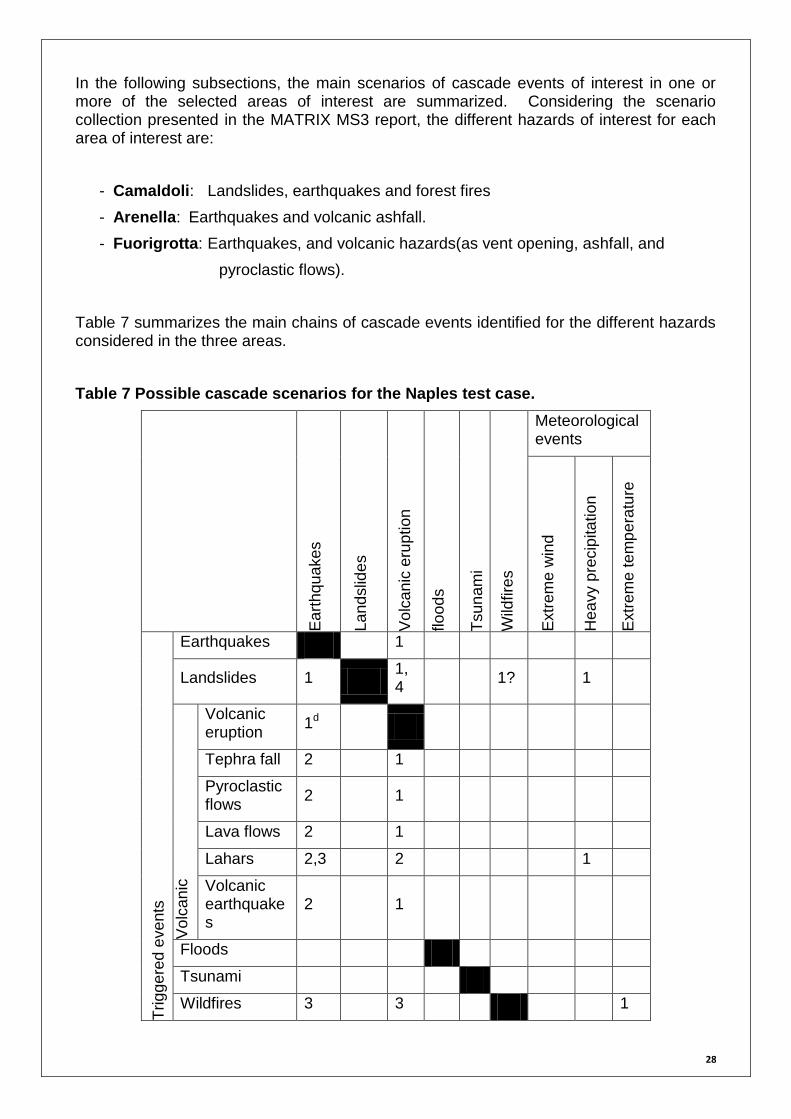
In the following subsections, the main scenarios of cascade events of interest in one or more of the selected areas of interest are summarized. Considering the scenario collection presented in the MATRIX MS3 report, the different hazards of interest for each area of interest are:
- Camaldoli: Landslides, earthquakes and forest fires
- Arenella: Earthquakes and volcanic ashfall.
- Fuorigrotta: Earthquakes, and volcanic hazards(as vent opening, ashfall, and
pyroclastic flows).
Table 7 summarizes the main chains of cascade events identified for the different hazards considered in the three areas.
Table 7 Possible cascade scenarios for the Naples test case.
Ea
rthqu
ake
s
La
nd
slid
es
Vo
lcan
ic e
rup
tion
(in
ge
ne
ral)
flo
od
s
Tsun
am
i
Wild
fire
s
Meteorological events
Extr
em
e w
ind
Hea
vy p
recip
ita
tio
n
Extr
em
e t
em
pe
ratu
re
Trigg
ere
d e
ve
nts
Earthquakes 1
Landslides 1 1,4
1? 1
Vo
lcan
ic
Volcanic eruption
1d
Tephra fall 2 1
Pyroclastic flows
2 1
Lava flows 2 1
Lahars 2,3 2 1
Volcanic earthquakes
2 1
Floods
Tsunami
Wildfires 3 3 1

29
Three different scenarios have been selected in the Naples test case for more quantitative analysis:
Scenario 1: Rainfall- and earthquake-triggered landslide (interaction at the hazard level).
Scenario 2: Simultaneous occurrence of ash-fall and earthquake hazards (interaction at the vulnerability level).
Scenario 3: Volcanic earthquakes and seismic swarms triggered by volcanic activity (interaction at hazard level).
3.1.1 Scenario 1: Rainfall- and earthquake-triggered landslides
For the Naples test case, landslide hazard is of interest for the Camaldoli area. Landslides are the movement of a mass of rock, debris, or earth down a slope under the influence of gravity (Cruden and Varnes, 1996, Kalsnes and Vangelsten, 2012). The occurrence of landslides can be associated with different triggering mechanisms, where a triggering factor usually refers to an event that may cause a response in terms of landslide activity. As example, let us consider the CNR-GNDCI database of areas affected by landslides in Italy. As can be observed in Figure 8, the most frequent kind of events triggering landslides in Italy are: precipitation (69.4%), erosion (13.9%), human activity (7.3%), earthquakes (3%), and ground water variation (1.7%).
Figure 8 Landslide triggering events often observed in Italy (source: CNR-GNDCI: database of areas affected by landslides and floods in Italy).
From a quantitative point of view, rainfall and earthquakes are the landslide triggering mechanisms of particular interest, since they can play an important role in short-term hazard and risk assessments, i.e., quantifying short-term probabilities of landslide occurrence given the occurrence of one or both of these two triggering events.
30
3.1.1.1 Scenario description
Given their particular interest for short-term landslide hazard assessment, both rainfall and earthquakes are the triggering events to be considered for the scenarios of cascade effects in the Naples test case. Considering the rainfall triggering mechanism, landslides can be triggered either by intense and short duration rainfall events, or by lower intensity and long duration rainfall events, or a combination of both. The reduction of effective material strength by percolating water is generally considered to be the primary cause of rainfall-induced landslides. As can be seen in Figure 8, water triggering plays a major role for triggering landslides in Italy. Heavy rainfall is in fact the main trigger for mudflows, the deadliest and most destructive of all landslides (e.g., Kalsnes and Vangelsten, 2012). Of particular interest is also the analysis of the effects of possible changes in landslide patterns due to increased or reduced fainfall as a consequence of possible climate change. Under this assumption, non-stationary hazard analysis would be required.
On the other hand, the occurrence of earthquakes in steep landslide-prone areas may increase greatly the likelihood of landslide occurrence due to either the inertial forces during the ground shaking itself, or the rapid increase in pore water pressure induced by the cyclic stresses and subsequent reduction of the soil shear strength. Strong earthquakes may cause widespread landslides (as described in previous sections) and other types of ground failure, for example liquefaction. Furthermore, earthquakes may reduce the soil strength for longer periods, causing the affected area to be more susceptible to post-earthquake rainfall triggered landslides until the soil has regained its original strength (Cepeda, 2009).
Note that for simplicity other known triggering mechanisms characterized by long-duration phenomena (such as erosion, anthropic effects, etc.) are not considered here.
3.1.1.2 Different types of interactions and their effects on the risk assessment
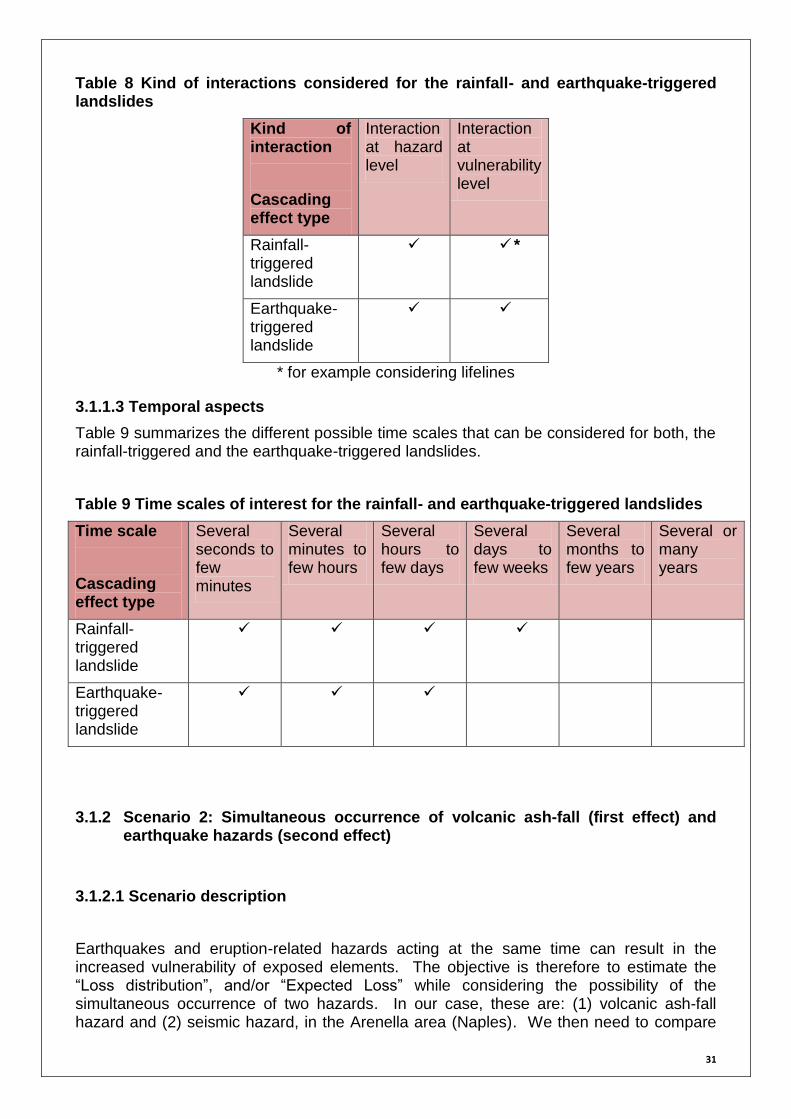
The type of interactions that may occur refer to the way in which the occurrence of two (or more) adverse events may influence (i.e., increase) the risk. As described in MATRIX deliverable D3.1 (Garcia-Aristizabal and Marzocchi 2012b), two possible kinds of interactions can be considered in the multi-hazard problem: first, the multi-hazard problem understood as the assessment of possible ‘chains’ of adverse events in which the occurrence of given initial ‘triggering’ event entails a modification of the probability of occurrence of a secondary event (interaction at hazard level), and second, where the action of different hazards is considered and combined at the vulnerability level, i.e., how the vulnerability of the exposed elements (to a given hazard) can be modified if another hazardous event takes place simultaneously or within a short time window (in general, short enough such that the system cannot be repaired). Table 8 summarizes the kind of interactions considered for the rainfall- and earthquake-triggered landslides. For example, In terms of the temporal dependence of these interactions, for rainfall-triggered landslides, the relavent time peridos is of the order of seconds to weeks, while for earthquake triggered landslides, it is from seconds to weeks.
31
Table 8 Kind of interactions considered for the rainfall- and earthquake-triggered landslides
Kind of interaction
Cascading effect type
Interaction at hazard level
Interaction at vulnerability level
Rainfall-triggered landslide
*
Earthquake-triggered landslide
* for example considering lifelines
3.1.1.3 Temporal aspects
Table 9 summarizes the different possible time scales that can be considered for both, the rainfall-triggered and the earthquake-triggered landslides.
Table 9 Time scales of interest for the rainfall- and earthquake-triggered landslides
Time scale
Cascading effect type
Several seconds to few minutes
Several minutes to few hours
Several hours to few days
Several days to few weeks
Several months to few years
Several or many years
Rainfall-triggered landslide
Earthquake-triggered landslide
3.1.2 Scenario 2: Simultaneous occurrence of volcanic ash-fall (first effect) and earthquake hazards (second effect)
3.1.2.1 Scenario description
Earthquakes and eruption-related hazards acting at the same time can result in the increased vulnerability of exposed elements. The objective is therefore to estimate the “Loss distribution”, and/or “Expected Loss” while considering the possibility of the simultaneous occurrence of two hazards. In our case, these are: (1) volcanic ash-fall hazard and (2) seismic hazard, in the Arenella area (Naples). We then need to compare

32
the results of the seismic risk analysis in terms of expected losses with and without the consideriation of the effects of the ash load.
According to some historical documents on Vesuvius eruptions, the combination of ash fall and seismic action is one of the main reasons of the collapse of masonry structures that manage to survive (or which did not experience) pyroclastic flows (Zuccaro et al., 2008). This kind of scenario has been already discussed by a number of authors (Zuccaro et al., 2008; NARAS report, Marzocchi et al., 2009; Marzocchi et al., 2012). Similar fragility analysis for wood-frame buildings considering combined snow and earthquake loading has been performed by Lee and Rosowsky (2006), outlining similar effects as those expected in the case of volcanic ash.
3.1.2.2 Kind of interactions and effects on risk assessment
As described in the previous scenario, the kind of interactions refers to the way in which the occurrence of two (or more) adverse events may influence (usually increase) the risk. Table 10 summarizes the kind of interactions considered for the simultaneous occurrence of volcanic ash-fall and earthquake hazards.
Table 10 Kind of interactions considered for the Simultaneous occurrence of ash-fall (first effect) and earthquake hazards (second effect) scenario
Kind of interaction
Cascading effect type
Interaction at hazard level
Interaction at vulnerability level
Simultaneous occurrence of ash-fall and earthquake hazards
3.1.2.3 Temporal aspects
Table 11 summarizes the different possible time scales that can be considered for the case of simultaneous (or short in time) occurrence of ash-fall (first effect) and earthquakes (second effect).

33
Table 11 Time scales of interest for the cascading effect considering the simultaneous occurrence of volcanic ash-fall (first effect) and earthquake hazards (second effect)
Time scale
Cascading effect type
Several seconds to few minutes
Several minutes to few hours
Several hours to few days
Several days to few weeks
Several months to few years
Several or many years
Simultaneous occurrence of ash-fall and earthquake hazards
3.1.3 Scenario 3: Volcanic earthquakes and seismic swarms triggered by volcanic activity
3.1.3.1 Scenario description
Eruption forecasting refers, in general, to the assessment of the occurrence probability of a given type of eruptive event, whereas volcanic hazards are normally associated with the generation of superficial and evident phenomena that usually accompany eruptions (e.g., lava, pyroclastic flows, tephra fall, lahars, etc.). Nevertheless, during the evolution of a volcanic system from its quiescent state to eruptive state, a large number of small- to moderate-sized earthquakes occur.
In fact, volcanic unrests are normally accompanied by (volcanic) seismic activity located directly below the volcano (for some few examples, see Endo et al., 1981; Sawada and Aramaki, 1989; Matsumura et al., 1991; Oshima et al., 1991; Power et al., 1994; Garcia-Aristizabal et al., 2007), and/or also by triggered seismic swarms (sometimes categorized as ‘distant volcano-tectonic events’, e.g., White and Power, 2002) associated with fault systems nearby the volcano (e.g., Minakami, 1974; Shimizu et al., 1992; Wolfe, 1992; Legrand et al., 2002).
Several of the world’s active volcanoes are located near densely populated areas (for example, in Italy, Japan, Mexico, Colombia, Ecuador, etc.), and therefore the seismic hazard associated with pre-eruptive earthquake activity can be considered in a cascading effect perspective within a multi-risk framework.
The problem to be analysed is to assess the possible effect that local seismicity (normally characterized by many shallow micro-earthquakes) triggered during volcanic unrests may have in the area where the volcano is located, and compare it with the general seismic hazard analysis. In fact, seismic swarms triggered by volcanic unrest activity are composed of a high number of shallow events (i.e., rates are higher than for the normal

34
seismicity of the area), with generally low magnitudes. Nevertheless, from a seismic hazard point of view, they may be of interest when exposed elements (such as, e.g., populated areas or facilities of interest) are located very close to the volcano, since they are generally very shallow events (on a few kilometers depth) and thus still exhibit a potential to inflict damage.
In the Neapolitan area, this case may be of particular interest given the highly urbanized area in the surroundings of Campi Flegrei. For example, two unrest episodes (called bradisisma, from the Greek word for “slow earthquake”) occurred from 1969 to 1972 and from mid-1982 to December 1984 (Barberi et al., 1984). The first event produced a net uplift of about 1.7 m (Troise et al., 2008), and only weak seismic activity was recorded during this phase. The second event presented a similar uplift pattern, but compared to the previous period this episode was accompanied by greater seismicity, both in terms of the number of earthquakes and their magnitude (Dvorak and Gasparini, 1991; De Natale et al., 1995; Troise et al., 1997). Shallow earthquake hypocenters (depth from 1 to 4 km) occurred between mid-1983 to December 1984 and inflicted damage in buildings in the Pozzuoli area (e.g., Troise et al., 2008).
A magnitude 4.2 earthquake with its epicenter in Pozzuoli occurred on October 4, 1983. In 1984, the town was almost completely evacuated and about 40,000 people were relocated. The total uplift recorded between January 1982 and December 1984 amounted to 1.8 m. Since the end of 1984, the ground has started to subside with a peak subsidence rate of about 7–8 cm/year in 1985 and at a progressively smaller rate until 2001–2002, when the subsidence ended and about 0.9 m of the total uplift was recovered (De Natale et al., 2006). Superimposed on the subsidence phase were some small and rapid uplift episodes that occurred in 1989, 1994, and 2000, i.e., with an apparent period of about 5–6 years (Gaeta et al., 2003; Lanari et al., 2004). These smaller uplift episodes reached a maximum uplift of about 1–8 cm, lasted 4–10 months, and were accompanied by seismic swarms of small earthquakes (ML<2) lasting from a few days to 1–2 months (Troise et al., 2008).
3.1.3.2 Kind of interactions and effects on the risk assessment
As described in the previous scenarios, the kind of interactions refers to the way in which the occurrence of two (or more) adverse events may influence (fundamentally increase) the risk. Table 12 summarizes the kind of interactions considered for the earthquake swarms triggered by volcanic activity.

35
Table 12 Kind of interactions considered for the earthquake swarms triggered by volcanic activity
Kind of interaction
Cascading effect type
Interaction at hazard level
Interaction at vulnerability level
Earthquake swarms triggered by volcanic activity
3.1.3.3 Temporal aspects
Table 13 summarizes the different possible time scales that can be considered for the volcanic earthquake hazard produced by triggered seismicity during volcanic unrests.
Table 13 Time scales of interest for the volcanic earthquake hazard produced by triggered seismicity during volcanic unrests
Time scale
Cascading effect type
Several seconds to few minutes
Several minutes to few hours
Several hours to few days
Several days to few months
Several months to few years
Several or many years
Earthquake swarms triggered by volcanic activity
?
3.2 SCENARIOS OF CASCADE EFFECTS CONSIDERED IN THE FRENCH WEST INDIES TEST CASE (GUADELOUPE ISLANDS)
Guadeloupe is an archipelago located in the French West Indies in the North Atlantic Ocean. Composed of 5 groups of Islands (Grande-Terre, Basse-Terrre, Marie-Galante, Les Saintes and La Désirade (Figure 9), Guadeloupe is one of the 5 French overseas territories (DROM – Département-Région d’Outre Mer). Around 402000 inhabitants live on this territory, covering 1,632 km² and administred by 32 communes.
36
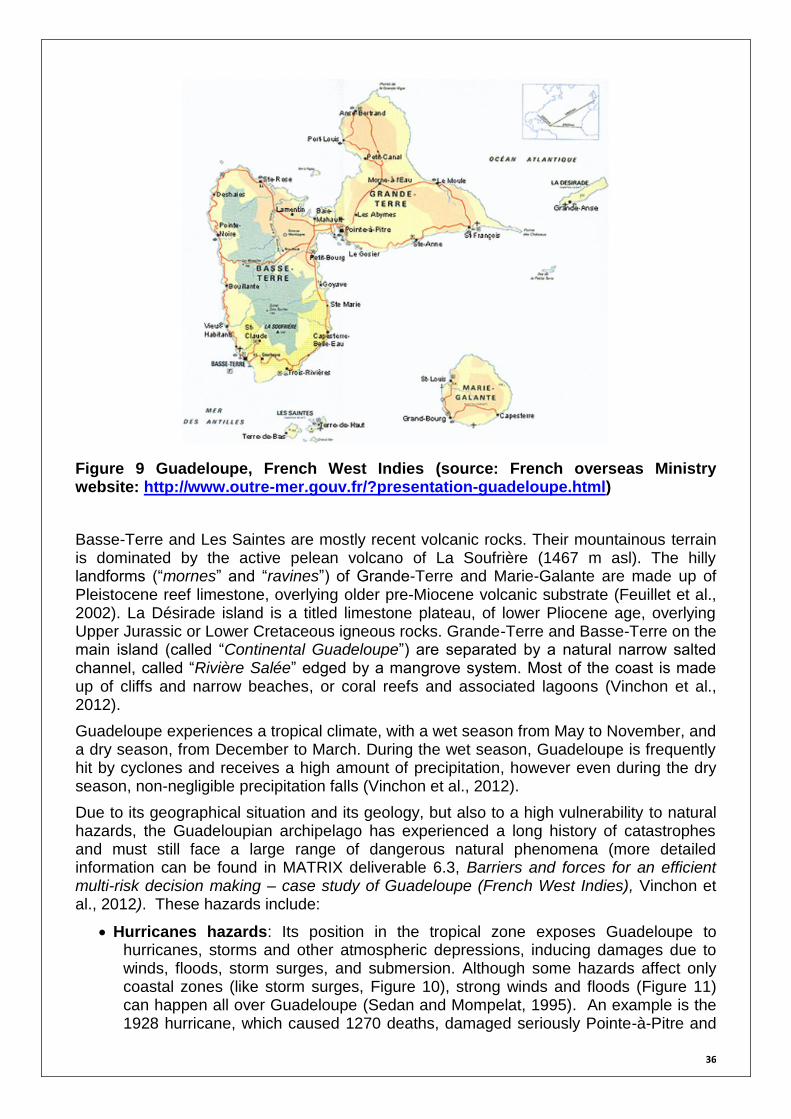
Figure 9 Guadeloupe, French West Indies (source: French overseas Ministry website: http://www.outre-mer.gouv.fr/?presentation-guadeloupe.html)
Basse-Terre and Les Saintes are mostly recent volcanic rocks. Their mountainous terrain is dominated by the active pelean volcano of La Soufrière (1467 m asl). The hilly landforms (“mornes” and “ravines”) of Grande-Terre and Marie-Galante are made up of Pleistocene reef limestone, overlying older pre-Miocene volcanic substrate (Feuillet et al., 2002). La Désirade island is a titled limestone plateau, of lower Pliocene age, overlying Upper Jurassic or Lower Cretaceous igneous rocks. Grande-Terre and Basse-Terre on the main island (called “Continental Guadeloupe”) are separated by a natural narrow salted channel, called “Rivière Salée” edged by a mangrove system. Most of the coast is made up of cliffs and narrow beaches, or coral reefs and associated lagoons (Vinchon et al., 2012).
Guadeloupe experiences a tropical climate, with a wet season from May to November, and a dry season, from December to March. During the wet season, Guadeloupe is frequently hit by cyclones and receives a high amount of precipitation, however even during the dry season, non-negligible precipitation falls (Vinchon et al., 2012).
Due to its geographical situation and its geology, but also to a high vulnerability to natural hazards, the Guadeloupian archipelago has experienced a long history of catastrophes and must still face a large range of dangerous natural phenomena (more detailed information can be found in MATRIX deliverable 6.3, Barriers and forces for an efficient multi-risk decision making – case study of Guadeloupe (French West Indies), Vinchon et al., 2012). These hazards include:
Hurricanes hazards: Its position in the tropical zone exposes Guadeloupe to hurricanes, storms and other atmospheric depressions, inducing damages due to winds, floods, storm surges, and submersion. Although some hazards affect only coastal zones (like storm surges, Figure 10), strong winds and floods (Figure 11) can happen all over Guadeloupe (Sedan and Mompelat, 1995). An example is the 1928 hurricane, which caused 1270 deaths, damaged seriously Pointe-à-Pitre and

37
destroyed some small cities. More recently, the 1989 Hugo hurricane caused 11 deaths and affected 35000 people with an economic cost of 4 billion of euros.
Earthquake hazards: The Guadeloupian archipelago is part of the Caribbean Arc, which results from the subduction of the Atlantic lithosphere beneath the Caribbean plate. This tectonic context is responsible for the seismic activity and makes Guadeloupe a zone V seismic zone (the highest level in the French seismic scale), where different types of earthquakes can occur, ranging from shallow crustal to subduction zone. This hazard is aggravated due to site lithological and topographical site effects (Figure 13, Lebrun et al., 2004). For example, an earthquake in 1843 caused around 1200 of deaths and triggered a large number of landslides (Bernard and Lambert, 1988). The last damaging earthquake that resulted in fatalities (Les Saintes earthquake) occurred in 2004, less than a decade ago (Bertil, 2005; Douglas, 2007).
Volcanic hazards: The Basse-Terre Island is a volcanic island composed of 7 eruptive fields. Among the several volcanoes making up these fields, only La Soufrière remains active. Three types of eruptions are possible: phreatic, magmatic or paroxysmal magmatic. Hence, this dome exposes the surroundings areas to a variety of threats e.g., sectorial collapse, blocks projections, lava flows, blast, glowing clouds, pyroclastics flows, lahars, ashes deposits. (Figure 14, Feuillet et al., 2002). During the last eruption of la Soufrière in 1976-1977 (a phreatic eruption), the evacuation of 76000 people for 3 and a half months was undertaken, causing significant impacts upon the economic activities and overall organization of all of Guadeloupe.
Landslide hazards: The volcanic soils of Guadeloupe, combined with the aforementioned geological and meteorological drivers (earthquakes, volcanic eruptions, heavy rainfalls) make some areas particularly prone to landslides (Mompelat 1994, Figure 12).
Tsunami hazards: These are caused by either earthquakes, landslides or volcanic eruptions, and have the potential to reach the coastal zones of Guadeloupe (Zahibo and Pelinovsky, 2001). In 2003, for example, the collapse of a volcano cone on Montserrat’s island induced a tsunami which reached the west coast of Basse-Terre.
For the interest of MATRIX multi-risks case-studies, 3 different zones with 3 different scales have been selected and risk assessments performed.

38
Figure 10 Spatial repartition of Storm surge hazards in Guadeloupe (Source Dossier Départementaux des Risques Majeurs, DDRM 2004)
Figure 11 Spatial repartition of Flood hazards in Guadeloupe (source, DDRM, 2004)
Figure 12 Spatial repartition of landslide hazards in Guadeloupe (source, DDRM, 2004)
Figure 13 Spatial repartition of seismic hazards in Guadeloupe (source, DDRM, 2004)
Figure 14 Spatial repartition of volcanic hazards in Guadeloupe (source, DDRM, 2004)

39
No area in Guadeloupe is spared from natural hazards, with every commune having to face at least two or three types of hazards. Some are even confronted by all five of aforementioned hazards, e.g., Commune Belle Eau, in the south of Basse-Terre. This multi-hazards problem is even exacerbated when dealing with risks. Human assets (population, zones of economic activities, transportation infrastructure, etc.) are mostly located along the coast, and thus are exposed to the different coastal hazards. For example, the main agglomeration of Pointe-à-Pitre-Les Abymes-Le Gossier is in a high-risk zone regarding storm surges. Three areas have been selected to illustrate the different risks Guadeloupe has to deal with. Some details of these 3 zones: a commune (Pointe-à-Pitre), an island (Basse-Terre), and the whole department (Guadeloupe), are outlined in Table 14.
Table 14 Description of the three selected areas of interest in Guadeloupe selected for multi-type hazard and risk analysis.
Pointe-à-Pitre (commune) Basse-Terre (Island)
Guadeloupe (department)
Area (km^2) 2.66 847.82 1628.43
Population (inhabitants) 17017 186661 401730
Hazards studied in MATRIX
Earthquake, Storm surge Earthquake, Landslide
Earthquake, hurricanes (wind)
Different potential cascading scenarios which can occur in Guadeloupe are presented in Table 15 and the resulting chains are illustrated in Figure 15. Most of the aforementioned hazards are indeed interrelated. Some of these events (earthquake, volcanic eruption and hurricane) are called “principal” because they are independent of other phenomena, whereas other events (like landslides, tsunamis or floods) are usually triggered by these initiating phenomena.
Figure 15 Relationships between different hazards (the arrows are orientated in the sense of triggering) (Figure from MATRIX Deliverable 6.3).

40
Table 15 Possible event cascade scenarios for the French West Indies test case.
3.2.1 Scenario 1: Landslide triggered by an earthquake after a cyclonic event or a heavy rainfall period
The past experiences of the previous earthquakes which have struck Guadeloupe have exhibited the prominance of landslide events during seismic crisis. These cascading events might have a non-negligible impact on risk management, notably due to their effects on the road network. During the Les Saintes Earthquake on November 21st, 2004, a large number of roads were blocked for long periods due to landslides on “Les Saintes” Island and in the South of Basse-Terre (Bertil, 2005). The earthquake was the triggering event, but the conditions at the time of the earthquake were such that the slopes were more prone to landslides. The soils were soaked because the previous months have been particularly rainy, in some places exceeding the previous monthly precipitation records. For example, in Capesterre, 1862 mm of rainfall was recorded during November, with 300 mm falling in only 3 hours on November 18th. These antecedent rainfall events increased the susceptibility to earthquake-induced landslides. By contrast, the earthquake on February 14th, 2005, triggered no damaging mass movements. The dryness of the first two months of 2005, combined with the purge of the existing unstable materials following the first earthquake made the slopes more resistant to the seismic ground motion (Bertil, 2005).
Cyclones and earthquakes are examples of independent phenomena, since they are uncorrelated (the first one being meteorological and the second one geological). However,
Ea
rth
qua
kes
La
ndslid
es
Vo
lcan
ic e
rup
tion
(in
gen
era
l)
flo
ods
Tsu
na
mi
Ma
rine
su
rge
Meteorological events
Extr
em
e w
ind
He
avy p
recip
ita
tio
n
Extr
em
e t
em
pe
ratu
re
Tri
gg
ere
d e
ven
ts
Earthquakes
Landslides 1 1,4 1 1
Vo
lcan
ic
Volcanic eruption
1d
Tephra fall 2 1
Pyroclastic flows
2 1
Lava flows 2 1
Lahars 2,3 2 1
Volcanic earthquakes
2 1
Floods 2 1 3 1 1
Tsunami 1,2 1 1
Marine surge 1
41
their combined effects exacerbate hazardous conditions. Regarding cascading scenarios, both events will increase the landslide hazard as they both trigger landslides. Even if they don’t initiate the movement, they could still make the slope conditions more favourable for future landslides, which could happen when another triggering event occurs.
The combined effects of earthquakes and cyclones are also present when addressing the vulnerability aspect of risk. A building damaged by high-speed winds might be more vulnerable to ground shaking, and likewise an earthquake damaged building will be more vulnerable to wind damage.
3.2.1.1 Scenario description
Landslides can be triggered by a large number of different factors. Some factors decrease the resisting forces of the slopes to movement, whereas some others increase the destabilizing forces. Cyclones and earthquakes affect the stability of slopes via both aspects and are therefore the relevant candidates for triggering landslides in a cascading scenario in Guadeloupe.
Cyclones are usually accompanied by heavy rainfall. These intense and short duration precipitation events usually initiate shallow landslides. As already mentioned, the increase in the soil water content due to infiltration increases the pore pressure along the profile and is the primary reason for landslides. Effective resisting strengths are therefore reduced and the destabilizing forces can overcome them. Rainfall can also increase the moving forces: the additional infiltrated water increases the weight of the soil, increasing the gravitational actions on the profile, and the transient regime increases the flow pressure along the hydraulic gradient. These two effects, even if less important than the reduction in effective strengths, can thus also negatively affect slope stability.
Furthermore, cyclones are characterized by high-speed winds. Regarding landslides, these winds interact with the soil through the vegetation cover. The wind blowing into the trees exert pressure on the soil, acting as a moving mechanism. But the most prevailing impact of the wind on slope stability is the accompanying deforestation and its subsequent consequences. Trees have mechanical and hydrological stabilizing effects. Thanks to their roots, they increase the cohesion of the soil. Vegetation could also reduce the potential for water infiltration, by rainfall interception and root’s absorption. Hence, trees decrease pore pressure and improve slope stability conditions. Therefore, the disappearance of such vegetation cover due to cyclones could increase the probability of the occurrence of earthquake-induced landslides (Kamp et al., 2008).
As already discussed in section 3.1.1, earthquakes can initiate landslides due to the inertial effect of the ground shaking (increase of the mobilizing forces) or due to the increase of the pore pressure, and the corresponding reduction of the effective resisting forces.
3.2.1.2 Kinds of interactions and their effects on the risk assessment
The descriptions of the different kinds of interaction can be found in paragraph 3.1.1.1 and their types interactions are summarized in Table 16.

42
Table 16 Kind of interactions considered for the rainfall- and earthquake-triggered landslides
Kind of
interaction
Cascading effect
type
Interaction at
hazard level
Interaction at
vulnerability
level
Earthquake-
triggered
landslide
3.2.1.3 Temporal aspects
Table 17 summarizes the different possible time scales that can be considered for both the rainfall-triggered and the earthquake-triggered landslides.
Table 17 Time scales of interest for the cyclone- and earthquake-triggered landslides
Time scale
Cascading effect type
Several seconds to few minutes
Several minutes to few hours
Several hours to few days
Several days to few weeks
Several months to few years
Several or many years
Earthquake-triggered landslide
3.3 POSSIBLE SCENARIOS OF CASCADE EFFECTS CONSIDERED IN THE COLOGNE TEST CASE
The city of Cologne is located in the western part of Germany, in the federal state of North Rhine-Westphalia. It is one of the largest cities of the country with more than one million inhabitants. The area of the city is 405.15 square kilometres, divided into two parts by the Rhine River (Figure 16).

43
Figure 16 Spatial distribution of the built-up area (orange) of Cologne and the surrounding suburbs. As can be seen, the Rhine River divides the city effectively into two (black boundary).
Cologne is regularly affected by flooding from the Rhine and is considered to be one of the most flood-prone European cities. Besides the flood hazard, the area of the city is exposed to other types of natural hazards, in particular, windstorms, which also frequently cause damage in the area, and earthquakes, which, while much rarer than floods and windstorms, still have the potential to inflict considerable damage. In fact, the area around Cologne is one of the most active tectonic regions of Germany. According to the current estimates of seismic hazard for the region (Grünthal and Wahlström, 2006) the level of ground shaking (in terms of EMS seismic intensity) is about VII for a 10% probability of exceedance within 50 years (mean return period of 475 years) and about VIII for the 2% probability in 50 years (return period of 2475 years). Therefore, although rare, earthquakes have a high damaging potential and would be able to cause considerable direct and indirect losses in the affected area.
As mentioned previously, the level of losses from single hazardous events can dramatically increase when considering the interaction of different hazards and the occurrence of probable cascading effects. Possible cascade scenarios for Cologne are presented in Table 18. Although the area has already been considered in comparative risk assessments (Grünthal et al., 2006), possible interactions and cascading effects have been neglected. In the present study, which aims to contribute to the development of a holistic multi-risk assessment methodology, we consider the possibility of the temporal-coincidence and interaction of flood and earthquake hazards in the area. The details of the considered scenarios are given the following sections.
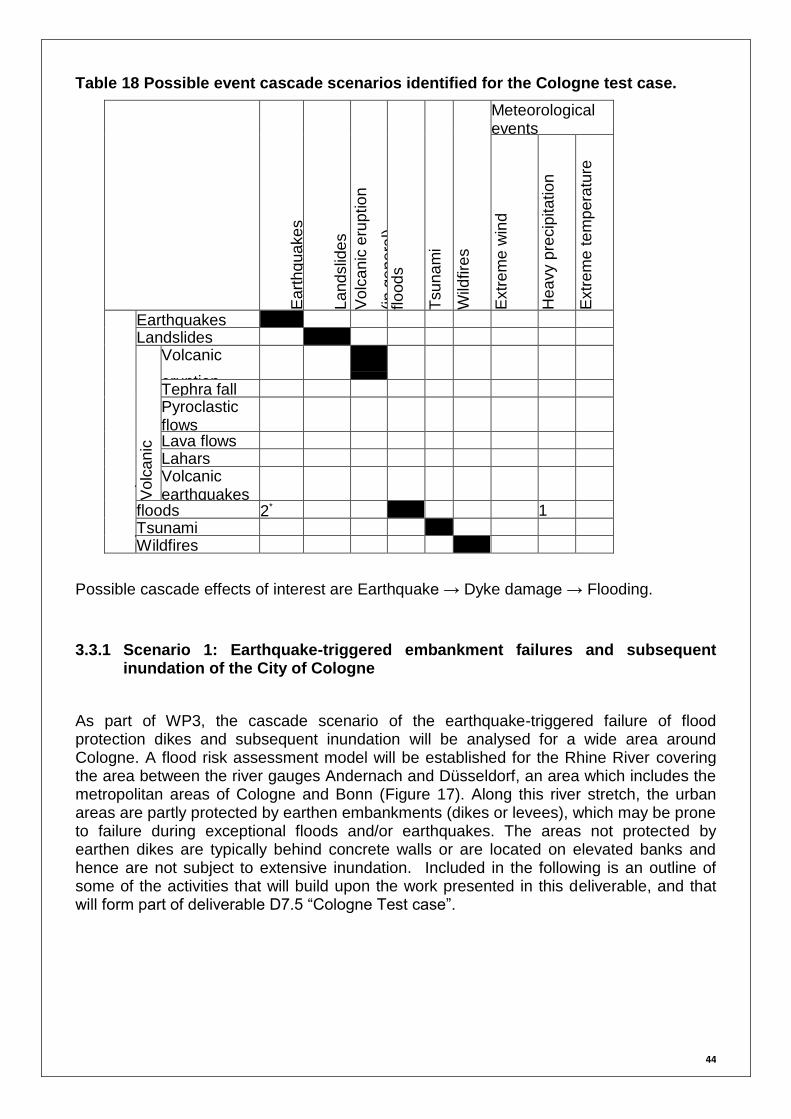
44
Table 18 Possible event cascade scenarios identified for the Cologne test case.
Ea
rth
qua
ke
s
La
nd
slid
es
Vo
lca
nic
eru
ptio
n
(in
ge
ne
ral)
flo
od
s
Tsun
am
i
Wild
fire
s
Meteorological events
Extr
em
e w
ind
He
avy p
recip
itatio
n
Extr
em
e t
em
pera
ture
Trig
ge
red
eve
nts
Earthquakes Landslides
Vo
lca
nic
Volcanic
eruption
Tephra fall Pyroclastic flows
Lava flows Lahars Volcanic earthquakes
floods 2* 1 Tsunami Wildfires
Possible cascade effects of interest are Earthquake → Dyke damage → Flooding.
3.3.1 Scenario 1: Earthquake-triggered embankment failures and subsequent inundation of the City of Cologne
As part of WP3, the cascade scenario of the earthquake-triggered failure of flood protection dikes and subsequent inundation will be analysed for a wide area around Cologne. A flood risk assessment model will be established for the Rhine River covering the area between the river gauges Andernach and Düsseldorf, an area which includes the metropolitan areas of Cologne and Bonn (Figure 17). Along this river stretch, the urban areas are partly protected by earthen embankments (dikes or levees), which may be prone to failure during exceptional floods and/or earthquakes. The areas not protected by earthen dikes are typically behind concrete walls or are located on elevated banks and hence are not subject to extensive inundation. Included in the following is an outline of some of the activities that will build upon the work presented in this deliverable, and that will form part of deliverable D7.5 “Cologne Test case”.

45
Figure 17: Study area between Andernach and Düsseldorf including the Cologne metropolitan area. Location and height of river dikes.
3.3.1.1 Scenario description
Scenarios involving the simultaneous (within 30 days during a flood event) occurrence of a damaging earthquake, causing the liquefaction of earthen embankments along the Rhine and a flood event, will be assessed in terms of flood and earthquake damage.
Spatial distribution of seismic hazard in the area around Cologne is shown in Fig. 18, which presents the location of seismic source zones (where the maximum expected magnitude is indicated) and the distribution of seismic hazard (in the German part of the

46
map only) in terms of EMS intensities for 10% of exceedance probability in 50 years. The stars show the epicentres of past notable earthquakes in the region. The input information necessary for the hazard calculations (including the seismic source zones and seismicity parameters) is from Grünthal et al. (2010).
For the seismic hazard calculations, we use the GEM OpenQuake software (Crowley et al, 2011, www.globalquakemodel.org). Taking into consideration the spatial configuration of the existing flood protection system within the area of interest (the boundaries of the area are shown in Figure 18 in the form of the light-green rectangle) seismic hazard curves are calculated in terms of PGA (Peak Ground Acceleration). The curves are calculated for sites along the Rhine corridor between the gauges Andernach and Düsseldorf (Figure 17 and Figure 18) at intervals of 1 km and are used for assessing the probability of damage to the earthen dikes.
Figure 18 Seismic source zones (Grünthal et al., 2010) and hazard distribution (Tyagunov et al., 2006) around Cologne. The stars represent the locations of notable past earthquakes.
The probability of a dikes’ failure is considered in terms of liquefaction potential, estimated using the method of Seed and Idriss (1971). According to this approach, the liquefaction potential of an area or a site can be assessed with a factor of safety (FS) against liquefaction, which is determined as the ratio of the capacity of the soil to resist liquefaction (CRR: Cyclic Resistance Ratio) and the seismic demand placed on the soil layer (CSR: Cyclic Stress Ratio).
The CSR value can be estimated using the following expression:
,

47
where amax is the horizontal peak ground acceleration (PGA) at the ground surface in g’s, σ and σ’ are the total and effective overburden stress of the soil, respectively, and rd is a stress reduction coefficient that accounts for the flexibility of the soil column and depends on the depth. For the calculation of the vertical stresses as a function of depth, we also consider the variations in the water level of the river.
As for the CRR, there are different methods for estimating the soil’s resistance to liquefaction. Probably the most common is the method based on standard penetration testing (SPT). In our study, due to the lack of SPT data in the area under consideration, we use an approach based on the correlation between penetration resistance and relative density of soils. In addition to the relative density, for modeling the bearing capacity of dikes, we also consider other geotechnical parameters such as specific weight, porosity and fines content. Statistical information about the distribution of these parameters is taken from Vorogushyn (2010) and other sources. Calculations of CSR (reflecting the level of seismic influence) and CRR (depending on the dike’s material properties) are done through Monte-Carlo simulations, considering the variability of the listed geotechnical parameters, ground water level, as well as the level of PGA. The estimates of FS are presented as a set of two-dimensional surfaces, showing dependence of the liquefaction potential on PGA and water level and reflecting the existing uncertainties.
The calculations are implemented for every point of interest at the locations of earthen dikes between Andernach and Düsseldorf. At those sites where the factor of safety is less than 1, one can expect the initiation of liquefaction. It is assumed that an initiation of liquefaction at any point throughout the earthen dike’s body corresponds to the failure of the entire dike and, therefore, this should be taken into account in the flood risk calculations.
For the Rhine River reach between Andernach (Rhine-km 613.8) and Düsseldorf (Rhine-km 744.2), flood scenarios with return periods of 80, 100, 200, 500 and 1000 years are defined at the river gauge Andernach. Based on the maximum annual flow series, an extreme value statistical analysis was carried out using several distribution functions to determine the return periods for different flow levels (Figure 19, left).
Figure 19 (Left) Extreme value statistics and (right) typical normalised flood hydrographs with associated probabilities of occurrence for the river gauge Andernach (upstream of Cologne, Figure 17).

48
At the same time, a cluster analysis of the hydrographs corresponding to the maximum flow events was carried out for gauge Andernach, which resulted in three typical hydrograph forms, for which the probability of occurrence can be computed (Figure 19, right). By up-scaling the normalised flow hydrographs with the peak flow corresponding to a certain return period, one obtains typical flood hydrographs. These can be used as boundary conditions for the hydraulic flood hazard assessment model IHAM (Vorogushyn et al., 2010), which will be used in combination with the FLEMOps flood damage model (Thieken et al., 2008) for flood risk assessments.
In addition to the analysis of earthquake-triggered dike failures, the dike stability under a hydraulic load of flood waves will be analysed for different flood scenarios. We consider three breach mechanisms for flood-protection dikes: overtopping, piping and slope instability due to seepage flow (Apel et al., 2004, Vorogushyn et al., 2009), as outlined in Figure 20.
Overtopping: Overtopping failure occurs when the overtopping flow causes the erosion of the landward dike slope if the shear stress of the flow exceeds the critical shear stress of the dike material. The subsequent slope failure is assumed to lead to a total dike collapse.
Piping: Piping failure is assumed when the seepage flow through the dike foundation reaches the landward dike foot and causes the retrogressive erosion of dike foundation. The development of pipes proceeds to the riverside dike slope and causes the subsidence of the dike core and final collapse.
Slope instability due to seepage: Failure due to slope instability is initiated by the seepage flow through the dike core which causes the erosion of the landward slope. In case the slope failure point conditioned by the height of the phreatic surface reaches the dike crest, a total dike collapse is assumed.
Figure 20. The three breach mechanisms considered for the flood-protection dikes along the Rhine in the vicinity of Cologne
49
3.3.1.2 Kinds of interactions
The interaction of the earthquake and flood hazards will be considered only in terms of probable earthquake influence on the flood protection system, which would increase the flood hazard level for the city area. The probable earthquake influence on the vulnerability of the affected built-up area is not considered, because the latter aspect is difficult to analyse with the currently available data and process knowledge. This means that the impact of an earthquake on the stability of flood protection dikes will be considered as an adverse effect in flood hazard and risk assessment. An assessment of the possible increase in flood damage due to earthquake impact, e.g., due to damages to buildings and lifelines, the blocking of evacuation routes, the release of dangerous substances transportable by flood water, along with an assessment of seismic risk in the urban area affected by flood, is beyond the scope of this work package. However, it would be of interest for future studies and is an essential element of the emergency management decision making process.
3.3.1.3 Temporal aspects
As part of deliverable D7.5, the scenarios of flood events for different return periods summarised in Section 3.3.1.1 will be assessed for the flood event durations of 30 days – a typical duration of a critical flood. The estimation of the earthquake impact on flood risk by damaging the flood protection dikes will be carried out for several assumptions of earthquake occurrence:
Earthquake and dike failure at various locations during a flood event duration of 30 days
Earthquake and dike failure at various locations within 2 years prior to a critical flood
A sensitivity analysis will be carried out in order to determine the effect of the assumption about the length of the time window for the occurrence of an earthquake on damage probability. The time window of up to 2 years reflects the societal capacity to recover the dike functionality after a devastating earthquake.
On the one hand, the length of the time window influences the probability of an earthquake occurrence capable of damaging the flood protection dikes. In addition, the failure of dikes prior to a flood event and during a flood event may differently distribute the flood waters along the river reach, causing different inundation patterns and subsequent damages. In other words, in the case of upstream dike damages, the flood storage capacities upstream of Cologne may be filled and result in smaller damages for the downstream communities. Due to inhomogeneous spatial distribution of asset values, the impact of different inundation patterns may become visible in the risk values, although it is expected to be rather small (this is because (1) the probability of failures is very small, and (2) the Rhine floods leading to failures have very large volumes compared to the available floodplain storage capacity. Therefore the inundation patterns might not be very different from scenario to scenario).

50
4 Final remarks
Multi-hazard is a wide concept that, in general terms, can be split into two possible lines of applications: (1) multi-hazard assessment may be seen as the process of assessing different (independent) hazards threatening a given (common) area, and (2) it represents the process of assessing possible interactions and/or cascade effects among the different hazardous events.
The process of scenario identification is the first and fundamental step towards a quantitative multi-risk assessment that considers cascading effects. To achieve the required complete set of scenarios, different strategies can be adopted, ranging from event-tree-like to fault-tree-like strategies. In many applications, an adaptive method combining both kinds of approaches is applied in order to ensure and exhaustive exploration of scenarios.
In this document we analyse different cases of cascading scenarios among the hazards of interest in the MATRIX project, considering some interactions at the hazard level (i.e., cases in which the occurrence of one event/hazard modifies the occurrence probability of another), and interactions at the vulnerability level, in which the effects on exposed elements caused by one hazard will affect the element’s vulnerability to other kinds of hazard.
Considering specific cases for each of the three test sites of the MATRIX project, one or more scenarios were selected in order to perform practical applications and quantitative analysis. For Naples, three different scenarios were proposed for quantitative analysis: (1) Rainfall- and earthquake-triggered landslides, (2) Simultaneous occurrence of ash-fall (first effect) and earthquake hazards (second effect), and (3) Volcanic earthquakes and seismic swarms triggered by volcanic activity. Note that the last two scenarios can be merged into a single case of interactions. For the French West Indies test case (Guadeloupe islands), a single scenario was selected, involving the assessment of landslides triggered by an earthquake after cyclonic events or heavy rainfall periods. Finally, for Cologne, a single scenario has been considered related to earthquake-triggered embankment failures and the subsequent inundation of the city of Cologne.
This document constitutes a reference for the description of the scenarios considered. Furthermore, these different scenarios selected for quantification constitute a wide range of cases for the analysis of the effects of cascading effects, and once implemented into an assessment scheme will provide important insights to analyse the problems, advantages, technical issues, etc. of considering interaction among different hazards.

51
5 References
Aki, K (1967). Scahng law of seismic spectrum, J Geophys. Res., 72, 1217-1231
Ambraseys, N.N., The Gemona di Friuli Earthquake of 6 May 1976, UNESCO Restricted Technical Report RP/1975-76/2.222.3, Part II, 1976.
Ando, R., and K. Imanishi (2011), Possibility of Mw 9.0 mainshock triggered by diffusional
propagation of after‐slip from Mw 7.3 foreshock, Earth Planets Space, 63(7), 767–771, doi:10.5047/eps.2011.05.016.
Apel, H., Thieken, A.H., Merz, B., Blöschl, G., 2004. Flood risk assessment and associated uncertainty. Natural Hazards and Earth System Sciences 4, 295–308.
Bernard, P. and Lambert J., 1988. Subduction and seismic hazard in the northern lesser Antilles: Revision of the historical Seismicity, Bulletin of the Seismological Society of America, 78:6, 1965-1983.
Bertil D. 2005. with the collaboration from Bès de Berc S. and Douglas J. Synthèse de la crise sismique des Saintes (Guadeloupe) entre le 21 novembre 2004 et le 30 mars 2005, Report BRGM/RP-54401-FR. 238 p. in French.
Bjerrum, L. W., K. Atakan and M. B. Sørensen (2010) Reconnaissance report and preliminary ground motion simulation of the 12 May 2008 Wenchuan earthquake. Bull Earthquake Eng (2010) 8:1569–1601, DOI 10.1007/s10518-010-9198-2.
Boore, D. M., 1983. Stochastic simulation of high-frequency ground motions based on seismological models of the radiated spectra, Bulletin of the Seismological Society of America, Vol 73, No 6, pp. 1865-1894
Bozzano, F., Gambino, P., Prestininzi, A., Scarascia Mugnozza, G., and Valentini, G., Ground Effects Induced by the Umbria-Marche Earthquakes of September–October 1997, Central Italy, Proceedings of the 8th International Congress of the International Association for Engineering Geology and the Environment, Vancouver, Canada, 21–25 September, 1998, A.A. Balkema, Rotterdam, pp. 825–830, 1998.
Cepeda, José. Characterisation and risk management of rainfall-induced landslides, Ph.D. thesis, Department of Geosciences, Faculty of Mathematics and Natural Sciences, University of Oslo, 2009.
Cluff, L. S. (1971) Peru earthquake of May 31, 1970; Engineering geology observations. Bull. Seismol. Soc. Am., 61 (3), p. 511-533
Commission staff working paper: “Risk assessment and mapping guidelines for disaster management”, European Commission, Brussels, December 2010.
Cotecchia, V., Guerricchio, A., and Melidoro, G. The Geomorphogenetic Crisis Triggered by the 1783 Earthquake in Calabria (Southern Italy), Proceedings of the International Symposium on Engineering Geology Problems in Seismic Areas, Bari, Italy, vol. 6, pp. 245–304, 1986.
Crowley H., Monelli D., Pagani M., Silva V., Weatherill G. (2011): OpenQuake User’s Manual, www.globalquakemodel.org.
Cruden D.M., Varnes D.J. (1996). Landslides Types and Processes. In: Turner A.K. and Schuster R.L. (Eds.) Landslides: Investigation and Mitigation. Transportation Research Board Special Report 247. National Academy Press, Washington, DC, pp. 36 72.
Daniell, J.E., Khazai, B., Wenzel, F., Vervaeck, A. [2011] “The CATDAT damaging earthquakes database”, Nat. Hazards Earth Syst. Sci., 11, 2235-2251, doi:10.5194/nhess-11-2235-2011, 2011.
52
Davison, C. Great Earthquakes, Thomas Murby & Co., London, 1936.
DDRM, Dossier Départemental des Risques Majeurs, Préfecture de Guadeloupe, Report (in French) http://www.guadeloupe.pref.gouv.fr/content/download/1957/11421/file/ DDRM_2004.pdf, 2004
De Natale, G., E. Faccioli, and A . Zollo, 1988. Scaling of Peak Ground Motions from Digital Recordings of Small Earthquakes at Campi Flegrei, Southern Italy. PAGEOPH, 126(1).
De Natale, G., G. Iannaccone, M . Martini, and A . Zollo, 1987. Seismic Sources and Attenuation Properties at the Campi Flegrei Volcanic Area, PAGEOPH, 125(6).
DeMets, C., R. G. Gordon, and D. F. Argus (2010), Geologically current plate motions, Geophys. J. Int., 181(1), 1–80, doi:10.1111/j.1365-246X.2009.04491.x.
Dutton, C.E. The Charleston Earthquake of August 31, 1886, U.S. Geological Survey Ninth Annual Report 1887–1888, pp. 203–528, 1889.
Esposito, E., Porfido, S., Simonelli, A.L., Mastrolorenzo, G., and Iaccarino, G.: 2000, Landslides and Other Surface Effects Induced by the 1997 Umbria-Marche Seismic Sequence, Engineering Geology 58, 353–376, 2000.
Evans, S. G., N. F. Bishop, L.F. Smoll, P. Valderrama Murillo, K.B. Delaney, A. Oliver-Smith, 2009. A re-examination of the mechanism and human impact of catastrophic mass flows originating on Nevado Huascarán, Cordillera Blanca, Peru in 1962 and 1970. Engineering Geology 108, 96–118.
Evans, S.G., 2006. Single event landslides resulting from massive rock slope failure: characterizing their frequency and impact on society. In: Evans, S.G., Scaráscia Mugnozza, G., Strom, A.L., Hermanns, R.L. (Eds.), Landslides from Massive Rock Slope Failure. NATO Science Series. Springer, Dordrecht, pp. 53–73.
Feuillet N., Manighetti, Tapponier, P and Jacques P., 2002. Arc parallel extension and localization of volcanic complexes in Guadeloupe, Lesser Antilles, Journal of Geophysical Research, 107, ETG 3.1-29, doi:10.1029/2001JB000308.
Garcia-Aristizabal, A. and W. Marzocchi (with: Woo G., Reveillere A., Douglas J., Le Cozannet G., Rego F., Colaco C., Fleming K., M. Pittore, S. Tyagunov, S. Vorogushyn, F. Nadim, B. V. Vangelsten, and W. ter Horst), (2012a). Dictionary of the terminology adopted, Deliverable 3.2, New methodologies for multi-hazard and multi-risk assessment methods for Europe (MATRIX project), contract No. 265138.
Garcia-Aristizabal, A. and W. Marzocchi (main authors, with: Woo G., Reveillere A., Douglas J., Le Cozannet G., Rego F., Colaco C., Fleming K., M. Pittore, S. Tyagunov, S. Vorogushyn, F. Nadim, B. V. Vangelsten, and W. ter Horst), (2012b). Review of existing procedures for multi-Hazard assessment, Deliverable 3.1, New methodologies for multi-hazard and multi-risk assessment methods for Europe (MATRIX project), contract No. 265138.
Geological Survey of India, The Bihar-Nepal Earthquake of 1934, Memoirs of the Geological Survey of India 73, 1939.
Fukuoka, H., Sassa, K., and Scarascia-Mugnozza, G., Distribution of Landslides Triggered by the 1995 Hyogo-ken Nanbu Earthquake and Long Runout Mechanism of the Takarazuka Golf Course Landslide, Journal of Physics of the Earth 45, 83–90, 1997.
Govi, M. Carta delle Frane Prodotte dal Terremoto (Map Showing the Landslides Triggered by the Earthquake), Rivista Italiana di Paleontologia e Stratigrafia 83, Plate 1., 1977a.

53
Govi, M. Photo-interpretation and Mapping of the Landslides Triggered by the Friuli Earthquake (1976), International Association of Engineering Geology Bulletin 15, 67–72, 1977b.
Govi, M. and Sorzana, P.F. Effetti Geologici del Terremoto, Frane, Rivista Italiana di Paleontologia e Stratigrafia 83, 329–368, 1977.
Grünthal, G. (editor) (1998). “Cahiers du Centre Européen de Géodynamique et de Séismologie: Volume 15 – European Macroseismic Scale 1998”, European Center for Geodynamics and Seismology, Luxembourg.
Grünthal G., Thieken A. H., Schwarz J., Radtke K. S., Smolka A. and Merz B. (2006): Comparative Risk Assessments for the City of Cologne – Storms, Floods, Earthquakes, Natural Hazards, 38, 1-2, 21-44.
Grünthal G. and Wahlström R. (2006): New Generation of Probabilistic Seismic Hazard Assessment for the Area Cologne/Aachen Considering the Uncertainties of the Input Data, Natural Hazards, 38, 159-176.
Grünthal G., Arvidsson R., Bosse Ch. (2010): Earthquake Model for the European-Mediterranean Region for the Purpose of GEM1, Scientific Technical Report SRT10/04, GFZ, 36.
Haimes, Y. Y., 2009. Risk modeling, assessment and management, 3rd Ed., John Wiley & Sons, New Jersey.
Hancox, G.T., Perrin, N.D., and Dellow, G.D., Earthquake-induced Landsliding in New Zealand and Implications for MM Intensity and Seismic Hazard Assessment, Institute of Geological and Nuclear Sciences, Ltd., GNS Client Report 43601B., 1997.
Hancox, G.T., Perrin, N.D., and Dellow, G.D., Recent Studies of Historical Earthquake-Induced Landsliding, Ground Damage, and MM Intensity in New Zealand, Bulletin of the New Zealand Society for Earthquake Engineering, vol. 35, no. 2, pp. 59–94, 2002.
Harp, E.L., Wilson, R.C., and Wieczorek, G.F., Landslides from the February 4, 1976, Guatemala Earthquake, U.S. Geological Survey Professional Paper 1204-A, 1981.
Haugen, K.B., F.Løvholt, C. B. Harbitz (2005). Fundamental mechanisms for tsunami generation by submarine mass flows in idealised geometries. Marine and Petroleum Geology, 22,(1–2). Pag.209–217. http://dx.doi.org/10.1016/j.marpetgeo.2004.10.016
Jibson, R.W. Landslides Caused by the 1811-12 NewMadrid Earthquakes, Ph.D. Dissertation, Stanford University, 1985.
Jibson, R.W. and Keefer, D.K. Landslides Triggered by Earthquakes in the Central Mississippi Valley, Tennessee and Kentucky, U.S. Geological Survey Professional Paper 1336-C., 1988.
Jibson, R.W. and Keefer, D.K. Statistical Analysis of Factors Affecting Landslide Distribution in the New Madrid Seismic Zone, Tennessee and Kentucky, Engineering Geology 27, 509–542, 1989.
Jibson, R.W. and Keefer, D.K. Analysis of the Seismic Origin of Landslides: Examples from the New Madid Seismic Zone, Geological Society of America Bulletin 105, 521–536, 1993.
Kalsnes, B, and B. V. Vangelsten, 2012. Landslide Risk (Chapter 6 in: MATRIX Deliverable D2.1: Report on the single-type risk analysis procedures n the framework of synoptical risk comparisons, prepared by S. Uhlemann)

54
Kamp U., Growley B.J., Khattak G. and Owen L.A., 2008. GIS-based landslide susceptibility mapping for the 2005 Kashmir earthquake. Geomorphology 101, 631-642.
Kaplan, S., 1991. The general theory of quantitative risk assessment, Risk Based Decision Making in Water Resources V, Y. Haimes, D. Moser, and E. Stakhiv (Eds.), American Soc. of Civil Engineers, New York, pp. 11-39.
Keefer, D.K. and Tannaci, N.E. Bibliography on Landslides, Soil Liquefaction, and Related Ground Failures in Selected Historic Earthquakes, U.S. Geological Survey Open-File Report 81-572, 1981.
Keefer, D.K. Landslides Caused by Earthquakes, Geological Society of America Bulletin 95, 406–421, 1984.
Keefer, D. K. (ed.), The Loma Prieta, California, Earthquake of October 17, 1989 – Landslides: U.S. Geological Survey Professional Paper 1551-C., 1998.
Keefer, D.K., Statistical Analysis of an Earthquake-induced Landslide Distribution – the 1989 Loma Prieta, California Event, Engineering Geology 58, 213–249, 2000.
Keefer, D. K.. Investigating landslides caused by earthquakes – A historical review, Surveys in Geophysics 23: 473–510, 2002.
Khazai, B., J.E. Daniell and F. Wenzel. The March 2011 Japan Earthquake: Analysis of Losses, Impacts, and Implications for the Understanding of Risks Posed by Extreme Events. TECHNIKFOLGENABSCHÄTZUNG, Theorie und Praxis. N3, 20, Dec. 2011. S. 22-33 URL: http://www.itas.fzk.de/tatup/113/khua11a.htm
Lawson, A.C. (ed.). The California Earthquake of April 18, 1906: Report of the California State Earthquake Investigation Commission, Carnegie Institution,Washington, D.C., Publication 87, reprint edition, 1908.
Le Brun B., Duval A.M., Bard P.Y., Monge O., Bour M., Vidal S. and Fabriol H., 2004. Seismic Microzonation: A comparison between geotechnical and Seismological approaches in Pointe-à-Pitre (French West Indies) Bulletin of Earthquake Engineering, 2, 27-50.
Lee, KH; and D.V. Rosowsky, 2006. Fragility analysis of woodframe buildings considering combined snow and earthquake loading. Structural Safety, 28(3), 289-303.
Liu, P. L. F., P. Lynett, H. Fernando, B. E. Jaffe, H. Fritz, B. Higman, R. Morton, J. Goff, and C. Synolakis (2005), Observations by the international tsunami survey team in Sri Lanka, Science, 308, 1595, doi:10.1126/science.1110730.
Malagnini, L. and V. Montaldo, 2004. Relazioni di attenuazione del moto del suolo: App.3 al Rapporto Conclusivo. Gruppo di Lavoro per la redazione della mappa di pericolosità sismica (Ordinanza PCM 20.03.03, n.3274) Istituto Nazionale di Geofisica e Vulcanologia, Italy.
Manson, M.W., Keefer, D.K., and McKittrick, M.A., (eds.), Landslides and Other Geologic Features in the Santa Cruz Mountains, California, Resulting from the Loma Prieta Earthquake of October 17, 1989, State of California Division of Mines and Geology Open-File Report 91-05, 1992.
Margaritondo, G (2005). "Explaining the physics of tsunamis to undergraduate and non-physics students". European Journal of Physics 26 (3)
Marzocchi, W., M.L. Mastellone, S. Di Ruocco, P. Novelli, E. Romeo, and P. Gasparini, 2009. Principles of multi-risk assessment: interactions amongst natural and man-induced risks, Project Report (FP6 NARAS project), European Commission, Directorate-General Research – Environment, contract No. 511264.

55
Marzocchi, W., A. Garcia-Aristizabal, P. Gasparini, M. L. Mastellone, and A. Di Ruocco (2012). Basic principles of multi-risk assessment: a case study in Italy, Nat. Hazards, 62(2), 551-573. DOI: 10.1007/s11069-012-0092-x
Michelini, A., et al. (2010), The 2010 Chile earthquake: Rapid assessments of tsunami, Eos Trans. AGU, 91(35), doi:10.1029/2010EO350002.
Mori, N., T. Takahashi, T. Yasuda, and H. Yanagisawa (2011), Survey of 2011 Tohoku
earthquake tsunami inundation and run‐up, Geophys. Res. Lett., 38, L00G14, doi:10.1029/2011GL049210.
Morton, D.M.: 1971, Seismically Triggered Landslides in the Area Above the San Fernando Valley, U.S. Geological Survey Professional Paper 733, pp. 99–104.
Morton, D.M.: 1975, Seismically Triggered Landslides in the Area Above the San Fernando Valley, State of California Division of Mines and Geology Bulletin 196, pp. 145–154.
National Research Council Committee on the Alaska Earthquake. The Great Alaska Earthquake of 1964, National Academy of Sciences, Washington, D.C., National Research Council Publication 1603, : 1968-1973.
Oldham, R.D. Report on the Great Earthquake of 12th June 1897, Memoirs of the Geological Survey of India, vol. 29, 1899.
Orsi, G., L. Civetta, C. Del Gaudio, S. de Vita, M.A. Di Vito, R. Isaia, S.M. Petrazzuoli, G.P. Ricciardi, C. Ricco, 1999. Short-term ground deformations and seismicity in the resurgent Campi Flegrei caldera, Italy: an example of active block-resurgence in a densely populated area. Journal of Volcanology and Geothermal Research 91, 415–451
Papadopoulos, G.A. and Plessa, A., Magnitude-Distance Relations for Earthquake-induced Landslides in Greece, Engineering Geology 58, 377–386, 2000.
Plafker, G., Kachadoorian, R., Eckel, E.B., and Mayo, L.R. Effects of the Earthquake of March 27, 1964 on Various Communities, U.S. Geological Survey Professional Paper 542-G, 1969.
Plafker, G., Ericksen, G. E., and Concha, J. F.: Geological aspects of the 31 May 1970, Peru earthquake, Bull. Seis. Soc. Am., 61, 543–578, 1971.
Plant, N. and Griggs, G.B., Coastal Landslides Caused by the October 17, 1989 Earthquake Santa Cruz County, California, California Geology 43, 75–84, 1990.
Plummer, C. C., D. McGeary, and D. H. Carlson. Physical Geology, 11th ed. The McGraw Hill Company, Inc., 2007.
Prestininzi, A. and Romeo, R., Earthquake-induced Ground Failures in Italy, Engineering Geology 58, 387–397, 2000.
Rodríguez, C.E., Bommer, J.J., and Chandler, R.J. Earthquake-induced Landslides: 1980–1997, Soil Dynamics and Earthquake Engineering 18, 325–346, 1999.
Saito, T., Y. Ito, D. Inazu, and R. Hino (2011), Tsunami source of the 2011 Tohoku‐Oki earthquake, Japan: Inversion analysis based on dispersive tsunami simulations, Geophys. Res. Lett., 38, L00G19, doi:10.1029/2011GL049089.
Sarconi, M. Osservazioni Fatte Nelle Calabrie e Nella Frontiera di Valdemone sui Fenomeni del Tramoto del 1783 e Sulla Geografia Fisica di Quelle Regioni, Reali Accademia delle Scienze e Belle Lettere. Naples, 1784.
Sassa, K., Fukuoka, H., Scarascia-Mugnozza, G., Irikura, K., and Okimura, T., Landslides Triggered by the Hyogoken-Nanbu Earthquake, Landslide News 9, 2–5, 1995.
56
Schuster, R.L., Highland, L.M., 2007. The Third Hans Cloos Lecture. Urban landslides: socioeconomic impacts and overview of mitigative strategies. Bulletin Engineering Geology and the Environment 66, 1–27.
Sedan O. and Mompelat J.M., 1995. Conséquences du passage des cyclones Iris, Luis et Marylin aux Antilles françaises (Guadeloupe et Martinique), rapport de mission. Reprt BRGM/RP-38790-FR, 14 p, in French.
Seed, H. B., and Idriss, I. M. (1971): Simplified procedure for evaluating soil liquefaction potential. J. Soil Mech. Found. Div., ASCE, 97, SM8, pp. 1249-1274.
Shao, G., C. Ji, and D. Zhao (2011), Rupture process of the 9 March, 2011 Mw 7.4
Sanriku‐Oki, Japan earthquake constrained by jointly inverting teleseismic waveforms, strong motion data and GPS observations, Geophys. Res. Lett., 38, L00G20, doi:10.1029/2011GL049164.
Spittler, T. E. and Harp, E.L., Preliminary Map of Landslide Features and Coseismic Fissures, in the Summit Road Area of the Santa CruzMountains, Triggered by the Loma Prieta Earthquake of October 17, 1989, U.S. Geological Survey Open-File Report 90-688, 1990.
Suzuki, W., S. Aoi, H. Sekiguchi, and T. Kunugi (2011), Rupture process of the 2011
Tohoku‐Oki mega‐thrust earthquake (M9.0) inverted from strong‐motion data, Geophys. Res. Lett., 38, L00G16, doi:10.1029/2011GL049136.
Thieken, A.H., Olschewski, A., Kreibich, H., Kobsch, S., Merz, B., 2008. Development and evaluation of FLEMOps – a new Flood Loss Estimation MOdel for the private sector. In: Proverbs, D., Brebbia, C.A., Penning-Rowsell, E. (Eds.), Flood Recovery Innovation and Response. WIT Press, Southhampton, UK, pp. 315–324.
Troise, C., G. De Natale, and F. Pingue, 1997. A model for earthquake generation during unrest episodes at Campi Flegrei and Rabaul calderas, Geophys. Res. Letters, Vol. 24, No.13, 1575-1578
Tyagunov, S., Grünthal, G., Wahlström, R., Stempniewski, L. and Zschau, J. (2006) Seismic risk mapping for Germany, Natural Hazards and Earth System Science, Vol. 6, 573-586.
Vervaeck, Armand and James Daniell (2011). Japan Tohoku earthquake and tsunami: CATDAT 41 report (October 2, 2011) Update of the Earthquake report and CATDAT database data. URL: http://earthquake-report.com/2011/10/02/japan-tohoku-earthquake-and-tsunami-catdat-41-report-october-2-2011/ (Last access: March 2012)
Vervaeck, Armand and James Daniell (2012b). Japan – 366 days after the Quake… 19000 lives lost, 1.2 million buildings damaged, $574 billion. Update of the Earthquake report and CATDAT database data. URL: http://earthquake-report.com/2012/03/10/japan-366-days-after-the-quake-19000-lives-lost-1-2-million-buildings-damaged-574-billion/ (Last access: August 2012)
Vervaeck, Armand and James Daniell (2012) Damaging Earthquakes Database 2011: The Year in Review . Update of the Earthquake report and CATDAT database data. URL: http://earthquake-report.com/2012/01/09/catdat-damaging-earthquakes-database-2011-annual-review/ (Last access: August 2012)
Vinchon C., Bengoubou-Valerius, Baills A. and Reveillere A, 2012. Social and institutional barriers to effective multi-hazard decision-making. MATRIX deliverable 6.3, New methodologies for multi-hazard and multi-risk assessment methods for Europe (MATRIX project), contract No. 265138.
57
Vilardo, G., G. Alessio, and G. Luongo, 1991. Analysis of the magnitude-frequency distribution for the 1983-1984 earthquake activity of Campi Flegrei, Italy, ournal of Volcanology and Geothermal Research, 48 ( 1991 ) 115-125
Vorogushyn S. (2009): Analysis of flood hazard under consideration of dike breaches. Dissertation, Potsdam, 165.
Vorogushyn, S., Merz, B., Apel, H., 2009. Development of dike fragility curves for piping and micro-instability breach mechanisms. Natural Hazards and Earth System Sciences 9, 1383–1401.
Vorogushyn, S., Merz, B., Lindenschmidt, K.-E., Apel, H., 2010. A new methodology for flood hazard assessment considering dike breaches. Water Resources Research 46, W08541. http://dx.doi.org/10.1029/2009WR008475.
Voit, S.S (1987). "Tsunamis". Annual Review of Fluid Mechanics 19 (1): 217–236.
Weber, G.E. and Nolan, J.M., Landslides and Associated Ground Failure in the Epicentral Region of the October 17, 1989 Loma Prieta Earthquake, Final Technical Report to U.S. Geological Survey under Contract 14-08-0001-G1861, 1989.
Woo, G., and W. Marzocchi (2011) Operational Earthquake Forecasting and Decision-Making. In: Early Warning for Geological Disasters Scientific Concepts and Current Practice, Friedemann Wenzel and Jochen Zschau (Editors), Springer, in press.
Yin, Y. F. Wang, and P. Sun (2009). Landslide hazards triggered by the 2008 Wenchuan earthquake, Sichuan, China. Landslides (2009) 6:139–151. DOI 10.1007/s10346-009-0148-5.
Yoe, C., 2012. Principles of risk analysis. Decision making under uncertainty, Taylor & Francis group, CRC press., Boca Raton, FL.
Zahibo N. and Pleniovsky E.N., 2001. Evaluation of tsunami risk in the Lesser Antilles, Natural Hazards and Earth System Sciences, 1, 221-231.
Zuccaro, G. 2004. Inventory and vulnerability for residential buildings at National territorial level, risk maps and socio-economic losses – Naples, 2004 (in italian); CD publishing the results of the Task 1 for SAVE, INGV/GNDT Project, PQ 2000-2002
Zuccaro, G., F. Cacace, R.J.S. Spence, and P.J. Baxter, 2008. Impact of explosive eruption scenarios at Vesuvius, Journal of Volcanology and Geothermal Research 178 (2008) 416 – 453.