Project Monitoring and Control E. Susy...
43
1 Project Monitoring and Control E. Susy Suhendra
Transcript of Project Monitoring and Control E. Susy...
1
Project Monitoring and ControlE. Susy Suhendra

2
Project Monitoring and Control
Monitoring – collecting, recording, and reporting information concerning project performance that project manger and others wish to know
Controlling – uses data from monitor activity to bring actual performance to planned performance

3
Project Monitoring and Control
Why do we monitor?
What do we monitor?
When to we monitor?
How do we monitor?
4
Why do we monitor?
Simply because we know that things don‟t always go according to plan (no matter how much we prepare)
To detect and react appropriately to deviations and changes to plans

5
What do we monitor?
Men (human resources)
Machines
Materials
Money
Space
Time
Tasks
Quality/Technical Performance

6
What do we monitor?
Inputs
Time
Money
Resources
Material Usage
Tasks
Quality/Technical Performance
Outputs
Progress
Costs
Job starts
Job completion
Engineering / Design
changes
Variation order (VO)

7
When do we monitor?
End of the project
Continuously
Regularly
Logically
While there is still time to react
As soon as possible
At task completion
At pre-planned decision points (milestones)

8
Where do we monitor?
At head office?
At the site office?
On the spot?
Depends on situation and the „whats‟
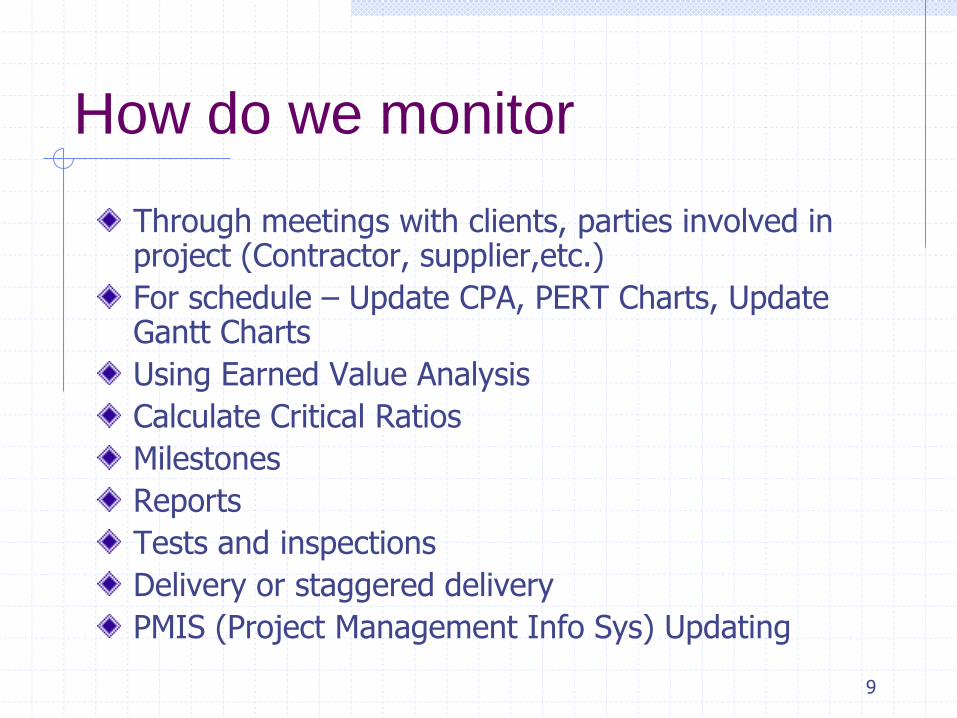
How do we monitor
9
Through meetings with clients, parties involved in project (Contractor, supplier,etc.)
For schedule – Update CPA, PERT Charts, Update Gantt Charts
Using Earned Value Analysis
Calculate Critical Ratios
Milestones
Reports
Tests and inspections
Delivery or staggered delivery
PMIS (Project Management Info Sys) Updating

10
Meetings – Some monitoring issues
What problems do you have and what is being done to correct them?
What problems do you anticipate in the future?
Do you need any resources you do not yet have?
Do you need information you do not have yet?
Do you know anything that will give you schedule difficulties?
Any possibility your task will finish early/late?
Will your task be completed under/over/on budget?

11
Project Control Cycle
PLAN
Specifications
Project Schedule
Project budget
Resource plan
Vendor contracts MONITOR
Record status
Report progress
Report cost
COMPARE
Actual status against plan
-Schedule
-Cost
ACTION
Correct
deviations
from plan
RE-PLAN as
necessary

12
Project Control
Control – process and activities needed to correct deviations from plan
Control the triple constraints
time (schedule)
cost (budget, expenses, etc)
performance (specifications, testing results, etc.)

13
Techniques for monitoring and
control
Earned Value Analysis

14
What Is It ?
Why Do I Need It ?
How Do I Do It?
Earned Value Analysis

15
There‟s Room For Improvement
70% of projects are:•Over budget•Behind schedule
52% of all projects finish at 189% of their initial budget
And some, after huge investments of time and money, are simply never comple
Source:The Standish Group
16
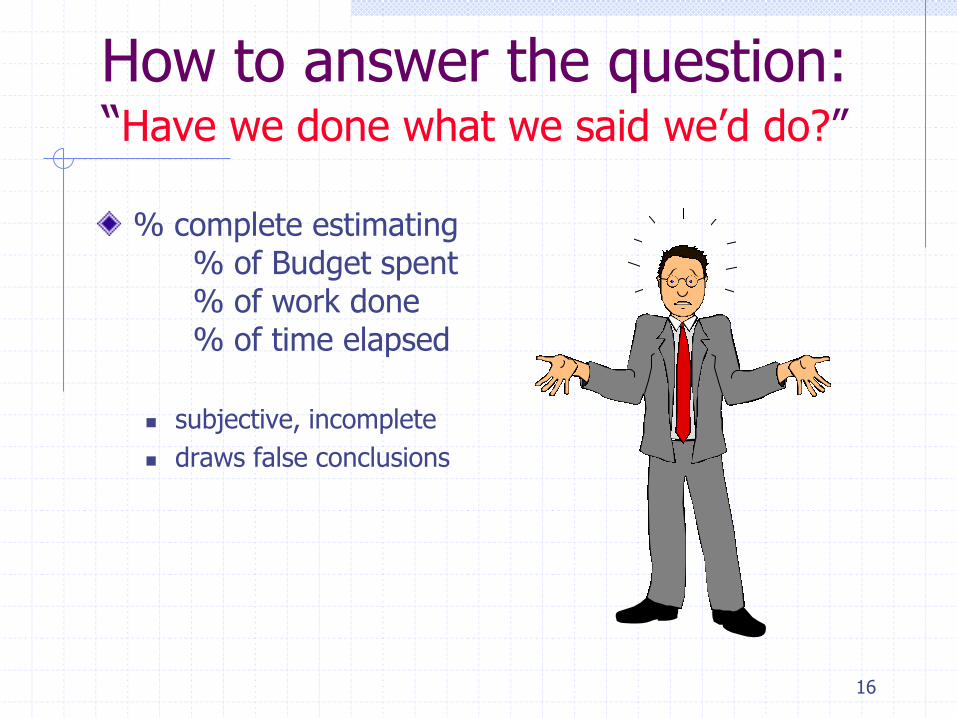
How to answer the question: “Have we done what we said we‟d do?”
% complete estimating % of Budget spent% of work done% of time elapsed
subjective, incomplete
draws false conclusions
17
Enter Earned Value Analysis
“Earned Value Analysis” is:• an industry standard way to:
• measure a project‟s progress,• forecast its completion date and final cost, and• provide schedule and budget variances along the
way.
By integrating three measurements, it provides consistent, numerical indicators with which you can evaluate and compare projects.

18
What‟s more Important?
Knowing where you are on schedule?
Knowing where you are on budget?
Knowing where you are on work accomplished?
19
EVA Integrates All Three
It compares the PLANNED amount of work with what has actually been COMPLETED, to determine if COST , SCHEDULE, and WORK ACCOMPLISHED are progressing as planned.
Work is “Earned” or credited as it is
completed.

20
Earned Value needed because...
Different measures of progress for different types of tasks
Need to “roll up” progress of many tasks into an overall project status
Need for a uniform unit of measure (dollars or work-hours).

21
Earned Value needed because...
Provides an “Early Warning” signal for prompt corrective action.
Bad news does not age well.
Still time to recover
Timely request for additional funds

22
How‟s this project doing?
0
20000
40000
60000
80000
100000
120000
Jan-03 Feb-03 Mar-03 Apr-03 May-03 Jun-03 Jul-03 Aug-03 Sep-03 Oct-03 Nov-03 Dec-03
Projected
Actual

23
Some New Terms
BCWS - Budgeted Cost of Work Scheduled
ACWP - Actual Cost of Work Performed
BCWP - Budgeted Cost of Work Performed

24
Earned Value Definitions
BCWS: “Budgeted Cost of Work Scheduled”
Planned cost of the total amount of work scheduledto be performed by the milestone date.

25
BCWS - Budgeted Cost of Work Scheduled
0
20000
40000
60000
80000
100000
120000Jan-0
3
Feb-0
3
Mar-
03
Apr-
03
May-0
3
Jun-0
3
Jul-03
Aug-0
3
Sep-0
3
Oct-
03
Nov-0
3
Dec-0
3
BCWS

26
Earned Value Definitions (cont.)
ACWP: “Actual Cost of Work Performed”
Cost incurred to accomplish the work that has been done to date.

27
ACWP - Actual Cost of Work Performed
49000
56000
0
20000
40000
60000
80000
100000
120000Jan-0
3
Feb-0
3
Mar-
03
Apr-
03
May-0
3
Jun-0
3
Jul-03
Aug-0
3
Sep-0
3
Oct-
03
Nov-0
3
Dec-0
3
BCWP
ACWP

28
Earned Value Definitions (cont.)
BCWP: Budgeted Cost of Work Performed
The planned (not actual) cost to complete the work that has been done.

29
BCWP - Budgeted Cost of Work Performed
49000
55000
0
20000
40000
60000
80000
100000
120000Jan-0
3
Feb-0
3
Mar-
03
Apr-
03
May-0
3
Jun-0
3
Jul-03
Aug-0
3
Sep-0
3
Oct-
03
Nov-0
3
Dec-0
3
BCWP
BCWS

30
55000
49000
56000
0
20000
40000
60000
80000
100000
120000Jan-0
3
Feb-0
3
Mar-
03
Apr-
03
May-0
3
Jun-0
3
Jul-03
Aug-0
3
Sep-0
3
Oct-
03
Nov-0
3
Dec-0
3
BCWS
BCWP
ACWP
The Whole Story

31
Some Derived Metrics
SV: Schedule Variance (BCWP-BCWS)A comparison of amount of work performed during a given period of time to what was scheduled to be performed.
A negative variance means the project is behind schedule
CV: Cost Variance (BCWP-ACWP)A comparison of the budgeted cost of work performed with actual cost.
A negative variance means the project is over budget.

32
Schedule Variance & Cost Variance
Schedule Variance = BCWP-BCWS
$49,000- 55,000
SV = - $ 6,000
Cost Variance = BCWP-ACWP
$49,00056,000
CV = - $7,000

33
SPI: Schedule Performance Index
SPI=BCWP/BCWS
SPI<1 means project is behind schedule
CPI: Cost Performance Index
CPI= BCWP/ACWP
CPI<1 means project is over budget
CSI: Cost Schedule Index (CSI=CPI x SPI)The further CSI is from 1.0, the less likely project recovery becomes.
Some More Derived Metrics
34
Performance Metrics
SPI: BCWP/BCWS
49,000/55,000 = 0.891
CPI: BCWP/ACWP
49,000/56,000 = 0.875
CSI: SPI x CPI
.891 x .875 = 0.780

35
Assume that operations on a Work Package cost $ 1,500 to complete. They were originally scheduled to finish today. At this point, we actually spent $1,350. And we estimate that we have completed two thirds (2/3) of the work. What are the cost and schedule variances?
CV = BCWP – ACWP = 1500 (2/3) – 1350 = - 350 SV = BCWP – BCWS = 1500 (2/3) – 1500 = - 500CPI = BCWP/ACWP = 1500(2/3)/1350 = 0.74SPI = BCWP/BCWS = 1500(2/3)/1500 = 0.67Spending higher than budget, and given what we
have spent, we are not as far along as we should be (have not completed as much work as we should have)

36
102000
90882
103865
0
20000
40000
60000
80000
100000
120000Jan-0
3
Feb-0
3
Mar-
03
Apr-
03
May-0
3
Jun-0
3
Jul-03
Aug-0
3
Sep-0
3
Oct-
03
Nov-0
3
Dec-0
3
BCWS
BCWP
ACWP
Making Projections
Today

37
102000
116,571
0
20000
40000
60000
80000
100000
120000
140000
Jan-
03
Mar
-03
May
-03
Jul-0
3
Sep
-03
Nov-
03
Jan-
04
Mar
-04
BCWS
BCWP
ACWP
Estimate to Complete
Today

38
EXERCISE
A project to develop a country park has an actual cost in month
17 of $350,000, a planned cost of $475,000, and a value completed of $300,000. Find the cost and schedule variances and the three indexes.
Month 17
$ Planned (Baseline) – 475,000
Actual cost – 350,000
Value completed – 300,000 BCWP
ACWP
BCWS
Time t

39
Solution
BCWS = 475,000
BCWP = 300,000
ACWP = 350,000
CV = 300,000 – 350,000 = -50,000 (negative value - cost overrun)
SV = 300,000 – 475,000 = -175,000 (negative value - behind schedule)
Cost Performance Index (CPI) = BCWP/ACWP = 300/350 = 0.86
Schedule Performance Index (SPI) = BCWP/BCWS = 300/475 = 0.63
Time t = Schedule Variance/Slope of Planned costs =
-175,000/ (475,000/17) = - 6.26 months
Time Difference= 17- 6.26 = 10.74
TV = 10.74/17 = 0.63
CV = BCWP – ACWP
SV = BCWP – BCWS

40
Critical ratio
Sometimes, especially large projects, it may be worthwhile calculating a set of critical ratios for all project activities
The critical ratio is
actual progress x budgeted cost
scheduled progress actual cost
If ratio is 1 everything is probably on target
The further away form 1 the ratio is, the more we may need to investigate

41
Critical ratio exampleCalculate the critical ratios for the following activities and indicate which are probably on target and need to be investigated.
Activity Actual progress
Scheduled Progress
Budgeted Cost
Actual cost
Critical ratio (CR)
A 4 days 4 days 60 40
B 3 days 2 days 50 50
C 2 days 3 days 30 20
D 1 day 1 day 20 30
E 2 days 4 days 25 25

42
Critical ratio example
Can be on schedule and below budget (Act A) Why so good?
Can be behind schedule but below budget (Act C)
Can be on budget but physical progress lagging (Act E)
Can be on schedule but cost running higher than budget (Act D)
On budget ahead of schedule (Act B)

43
Summary
Need proper project monitoring and control mechanisms
Tools available to help in monitoring and controlling activities
There are human control and management aspects not covered here