Project Management - Utrecht University Management Part 2 of the planning phase ... and the COCOMO...
42
Project Management Part 2 of the planning phase Planning and controlling a system’s development Modelling and Systems Development Lecture 4
Transcript of Project Management - Utrecht University Management Part 2 of the planning phase ... and the COCOMO...

Project Management Part 2 of the planning phase
Planning and controllinga system’s development
Modelling and Systems Development
Lecture 4

2
Context of project management
• Recall the Systems Development Life Cycle (SDLC):– Planning– Analysis– Design– Implementation
• Planning: – Project initiation:
• Why build the system?• Can we build the system?
– Project management:• How to build the system
with its desired functionality on time and within budget?
Presenter
Presentation Notes
How to build the system? A question like this could be answered in different ways. However, in the current context, answers should include what tasks are to be carried out, how long these tasks will take, who will carry them out, what standards will be used etc.

3
Project management
1. Identify project size 2. Create & manage the work plan3. Staff the project4. Coordinate project activities

4
Identify project size
1. Use industry standards– and your own experience from prior
projects
2. Use function points, project complexity and the COCOMO model
• Both methods are highly empirical!
Presenter
Presentation Notes
COCOMO = COnstructive COst Model; see further.

5
Estimation trade-offs
• Size (functionality)– Function points– Lines of code
• Time– Months
• Cost and effort– Person-months
Presenter
Presentation Notes
More often than not there is time pressure. Of course the project manager can negotiate with the project sponsor to postpone the deadline, but this is not always an option. An alternative may be to increase the number of people working on the project or to decrease the functionality. Take special care when choosing the first option (increase number of employees) because this generates often extra overhead in communication. Suppose for instance that based on solid assumptions the size is estimated to be 20,000 locs and based on the complexity of the code (consisting mainly of Java, but also some HTML) the effort is estimated to be 20 person-months. However, work should be completed within 2 months. Then a naïve calculation would lead to assigning 10 persons to the project. But this will most likely lead to major problems.

6
Estimating a project based on industry information
Planning Analysis Design Implementation
Industrystandard
for businessapplications
15% 20% 35% 30%
Estimatesin PersonMonths
4(actual)
5.33(estimated)
9.33(estimated)
8(estimated)
Presenter
Presentation Notes
When using industry standard information, it’s a good idea to keep track of actual times spent on the tasks, in order to collect more specific data. These data can be compared to the predictions based on industry standards and can lead to more reliable figures for future use. Also note that this approach not only gives the estimated time for the complete project, but also for the different main phases (contrary to the approach using FP’s).
7
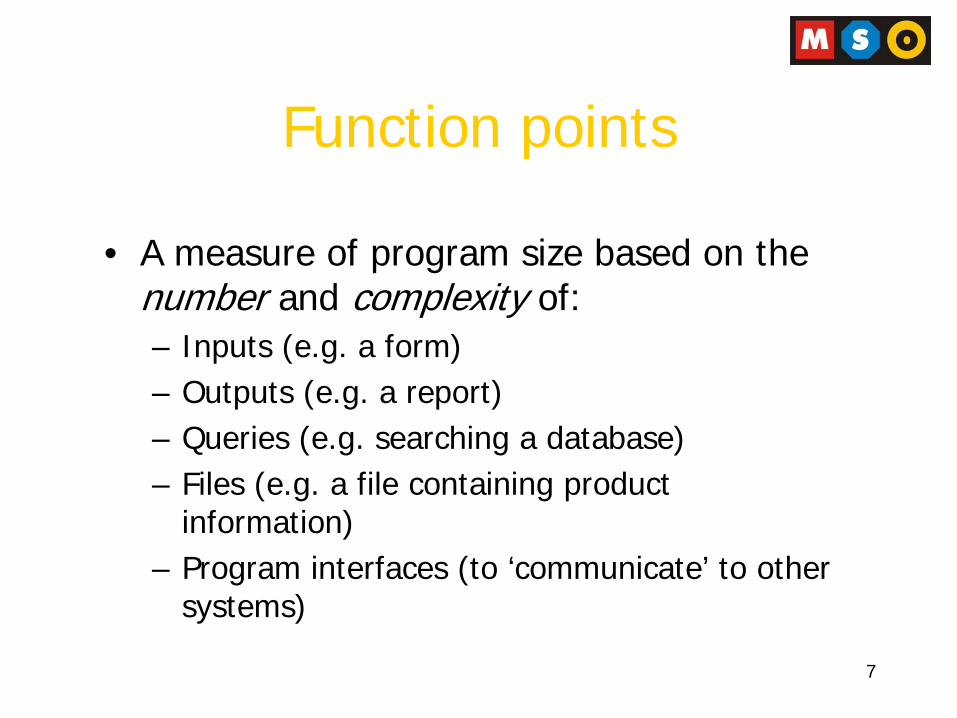
Function points
• A measure of program size based on the number and complexity of:– Inputs (e.g. a form)– Outputs (e.g. a report)– Queries (e.g. searching a database)– Files (e.g. a file containing product
information)– Program interfaces (to ‘communicate’ to other
systems)
8
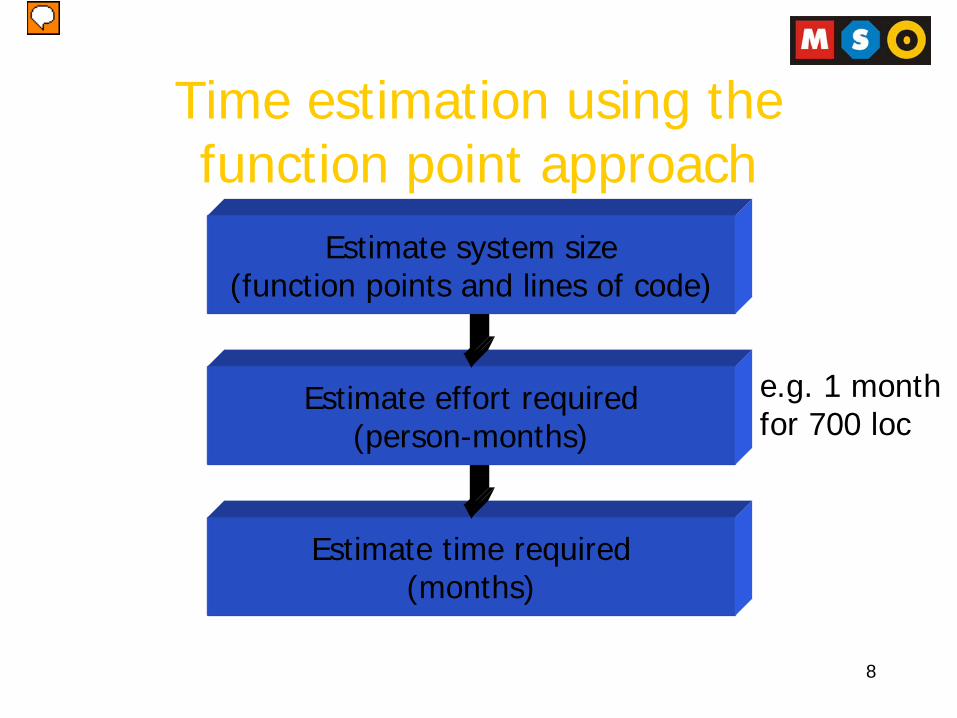
Estimate time required(months)
Estimate effort required(person-months)
Time estimation using the function point approach
Estimate system size(function points and lines of code)
e.g. 1 monthfor 700 loc
Presenter
Presentation Notes
Beware that the effort has a different dimension than time, e.g. the effort could be 12 person-year, which would mean that with an average of 6 persons involved in the project, the estimate time (i.e. the time to complete the whole project) is 2 years.

9
Adjusted function points
• System size:– TUFP, Total Unadjusted FP’s– APC, Adjusted Project Complexity– TAFP, Total Adjusted FP’s; depends on
TUFP and APC

10
Project complexity
• Data Communications• Heavy Use Configuration• Transaction Rate• End-User efficiency• Complex Processing• Installation Ease• Multiple sites
• Performance• Distributed functions• On-line data entry• On-line update• Reusability• Operational Ease• Extensibility
PC = sum of all 14 values assigned to the factors; range: 0 - 70
Presenter
Presentation Notes
Note that the factors refer to technical complexity (see also http://yunus.hun.edu.tr/~sencer/size.html)
11
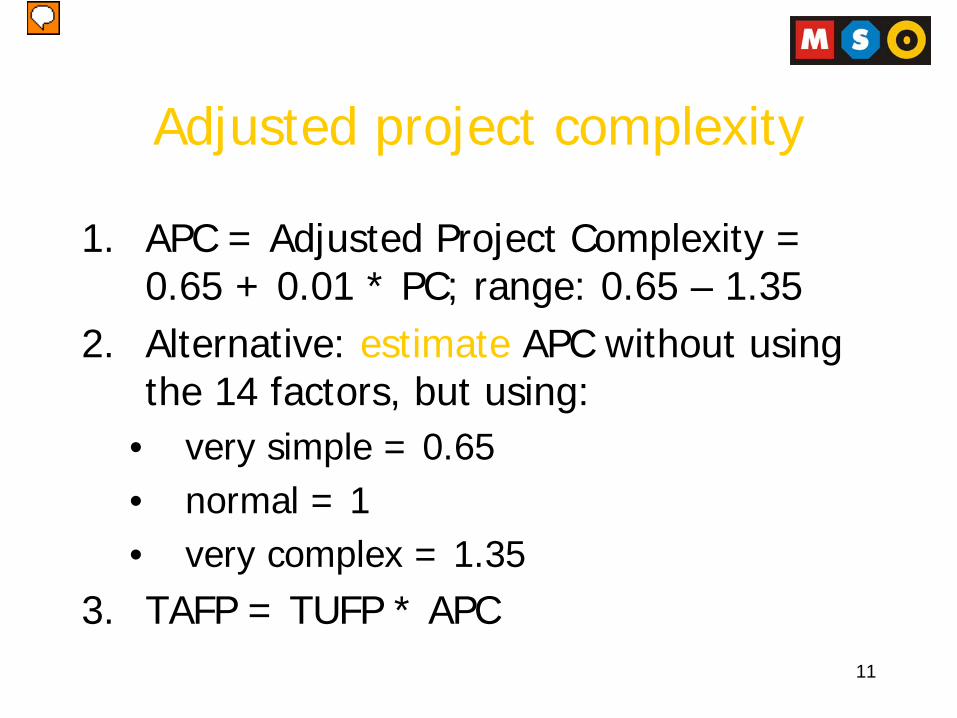
Adjusted project complexity
1. APC = Adjusted Project Complexity = 0.65 + 0.01 * PC; range: 0.65 – 1.35
2. Alternative: estimate APC without using the 14 factors, but using:
• very simple = 0.65• normal = 1• very complex = 1.35
3. TAFP = TUFP * APC
Presenter
Presentation Notes
The Project Complexity is scaled to a factor ranging from .65 – 1.35

12
Lines of code• Convert FP’s to
LOC’s (Lines Of Code)
• These numbers should not be taken too literally
Language LOC/FP C 130
COBOL 110
JAVA 55C++ 50
Turbo Pascal 50
Visual Basic 30
PowerBuilder 15
HTML 15
Packages (Access, Excel) 10 - 40
Presenter
Presentation Notes
Note the very strong warnings given in http://www.spr.com/products/programming.shtm that strict use of the table makes no sense!!! The technique of converting FPs to Locs is called backfiring. In applying the conversion, first ask yourself what a LOC actually is (e.g. does it include comment; and how about standards for indenting or the use of key words like begin and end giving rise to new lines). In the Web site just mentioned they even point out that you should talk about logical source statements and not about physical lines of code. Instead of LOC, COCOMO also uses DSI (Delivered Source Instructions).
13
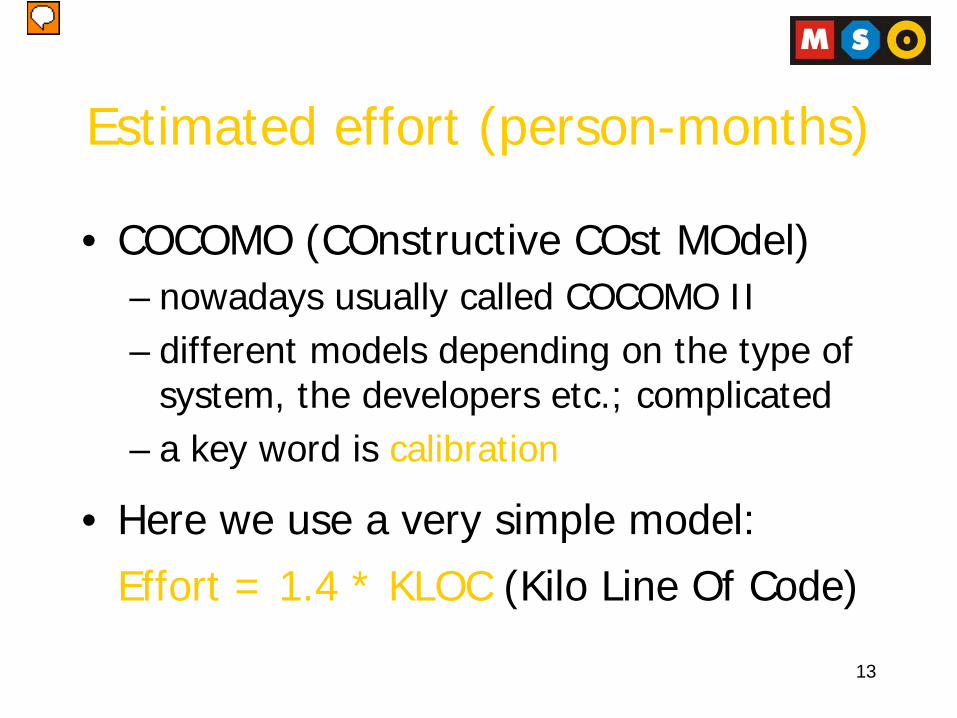
Estimated effort (person-months)
• COCOMO (COnstructive COst MOdel)– nowadays usually called COCOMO II– different models depending on the type of
system, the developers etc.; complicated– a key word is calibration
• Here we use a very simple model:
Effort = 1.4 * KLOC (Kilo Line Of Code)
Presenter
Presentation Notes
Sites for COCOMO: The Definition Manual on http://www.dicyt.gub.uy/pdt/files/6.2.1_-_cocomo_model.pdf http://sunset.usc.edu/csse/research/COCOMOII/cocomo_main.html http://yunus.hun.edu.tr/~sencer/cocomo.html for cost estimation models in general and COCOMO in particular.
14
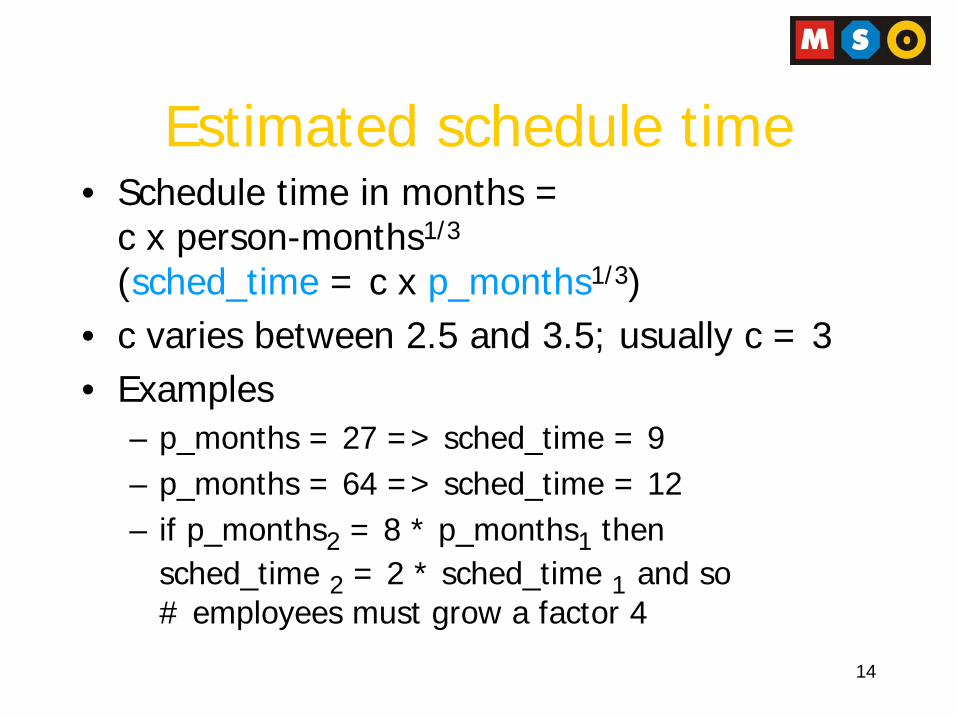
Estimated schedule time• Schedule time in months =
c x person-months1/3
(sched_time = c x p_months1/3) • c varies between 2.5 and 3.5; usually c = 3• Examples
– p_months = 27 => sched_time = 9– p_months = 64 => sched_time = 12– if p_months2 = 8 * p_months1 then
sched_time 2 = 2 * sched_time 1 and so # employees must grow a factor 4

15
• A work plan is a list of tasks with – dates– deliverables– responsible person(s)– status– …
Creating the work plan
16
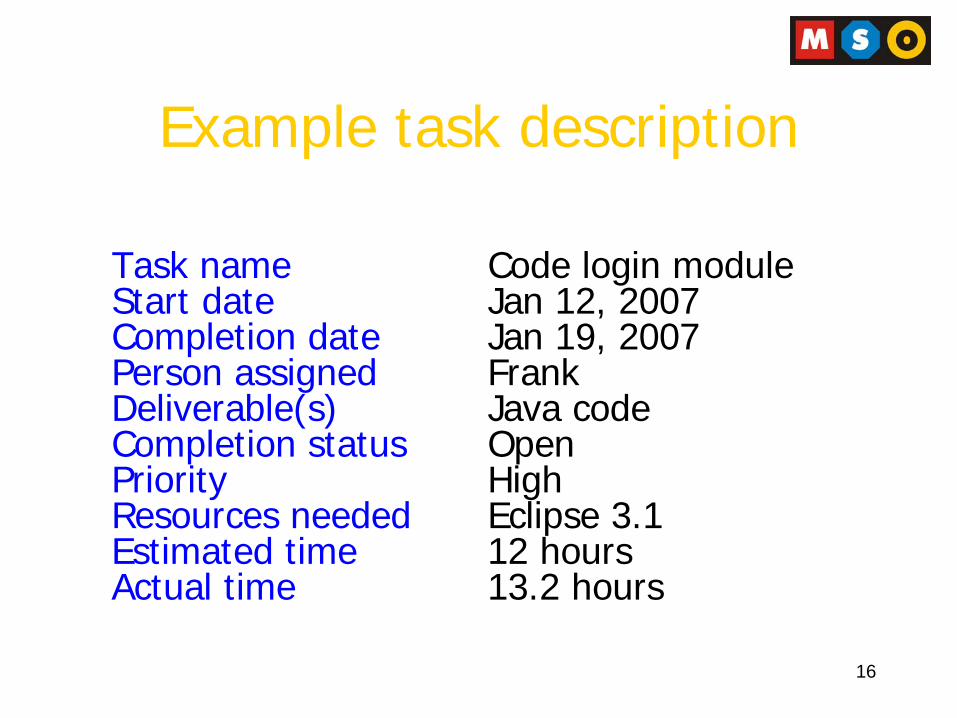
Example task description
Task name Code login moduleStart date Jan 12, 2007Completion date Jan 19, 2007Person assigned Frank Deliverable(s) Java codeCompletion status OpenPriority HighResources needed Eclipse 3.1Estimated time 12 hoursActual time 13.2 hours
17
Identifying tasks
• Top-down approach– Identify highest level tasks – Break them into increasingly smaller units
• Methodology– Based on SDLC phases (planning,
analysis...)– Based on products (Web pages, applets,
database server,...)
Presenter
Presentation Notes
When using a methodology for the identification of the tasks, there are already lots of tasks and deliverables described within the framework of the methodology and you can choose which ones are applicable within the current context and which are not.

18
Task identification based on SDLC
Phases:Planning, AnalysisDesign, Implement.
Planning: project initiation
system request, feasibilityproject management:
identify project sizecreate & manage workplanstaff the projectcoordinate project activities
Work Plan Task name Duration Dependency Status
****
19
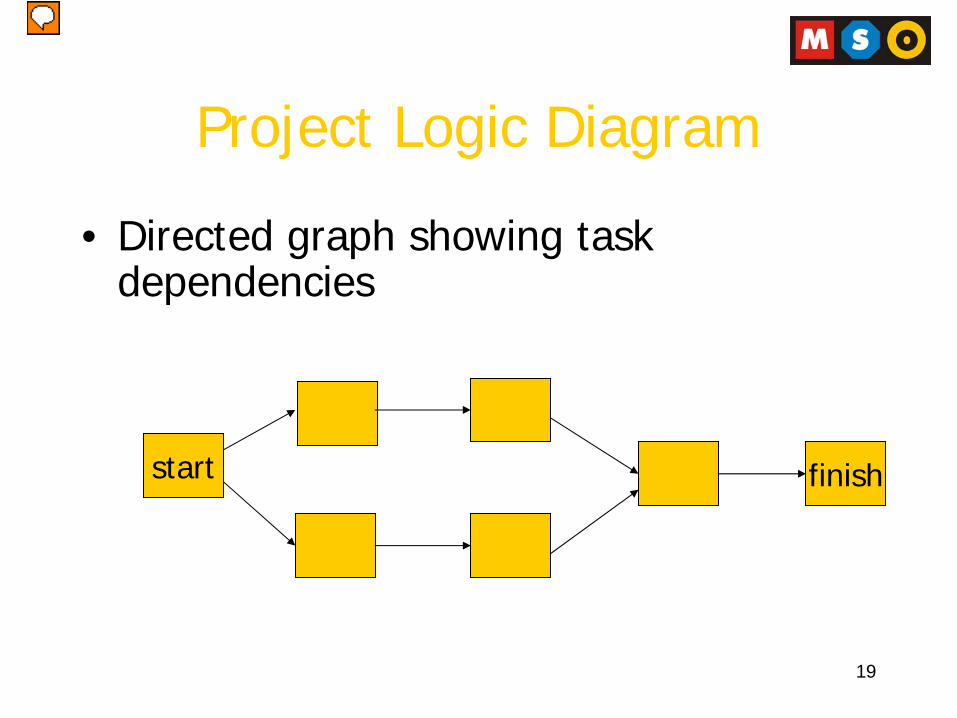
Project Logic Diagram
• Directed graph showing task dependencies
start finish
Presenter
Presentation Notes
Gemakkelijk te maken met whiteboard en PostIt-briefjes
20
PERT diagrams
• PERT = Programme Evaluation and Review Technique
• Decorates nodes in Project Logic Diagram with timing information

21
Nodes in PERT diagrams
12 10 22
16 264
Task name
Earlieststart time
Lateststart time
Earliestfinish time
Latestfinish time
Total float

22
Forward pass
start
0 10 40 10 10 14
+

23
Merging paths
10 1220 325 5
2012 8 Copy the highest value
24
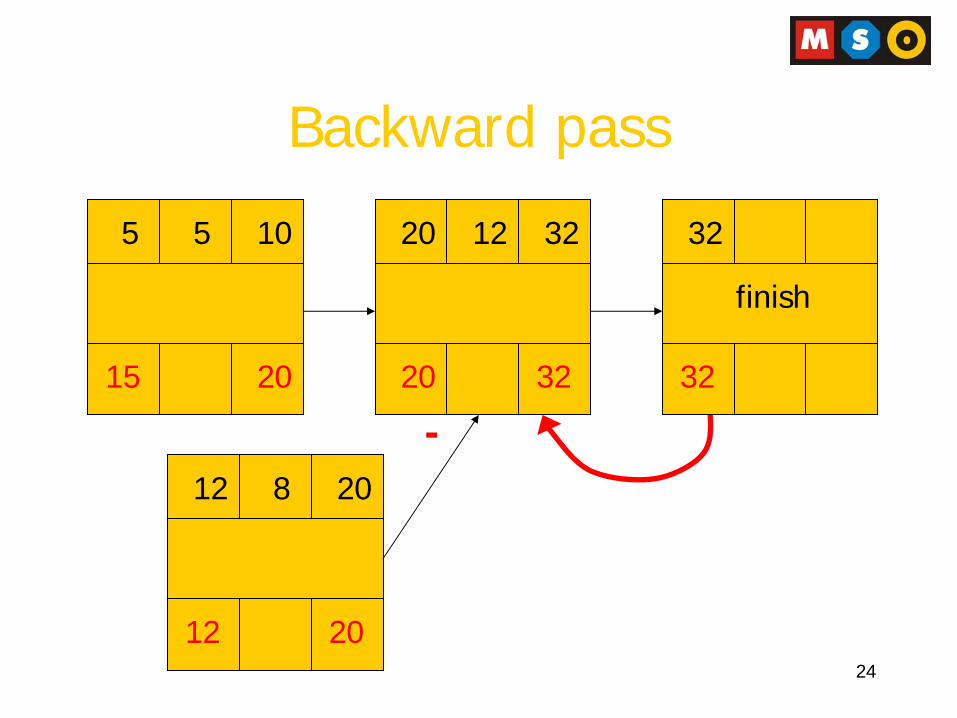
Backward pass
10 1220 32 325 5
finish
323220
2012 8
20
20
15
12
-

25
Splitting paths10 1210 22
18
4 6
8
28
10
16
2214
148
Copy lowest value
26
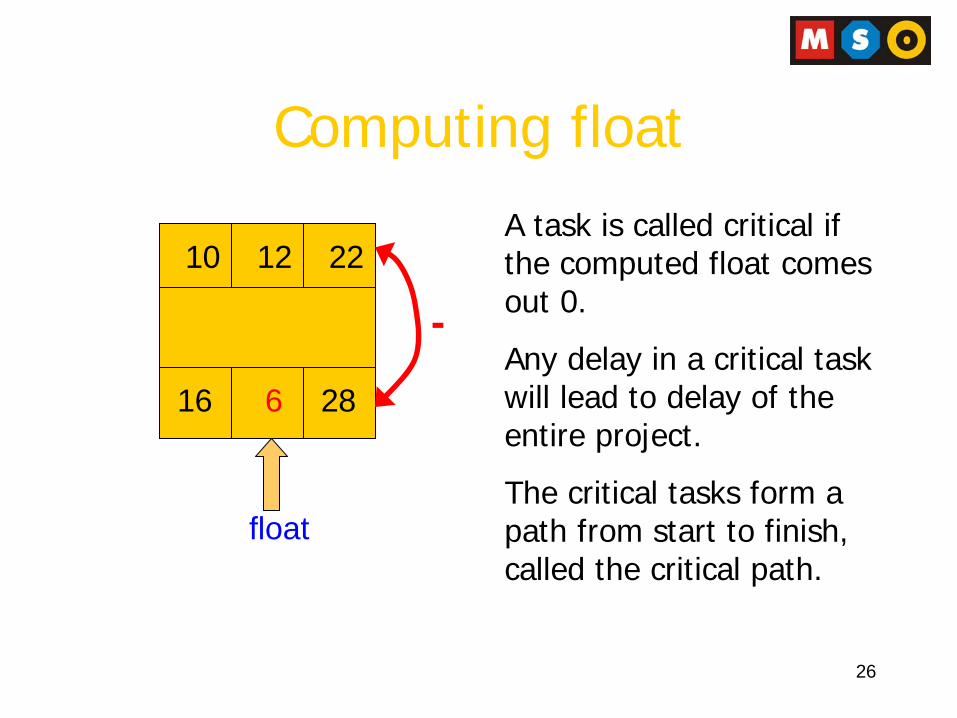
Computing float
1210 22
2816
float
A task is called critical if the computed float comes out 0.
Any delay in a critical task will lead to delay of the entire project.
The critical tasks form a path from start to finish, called the critical path.
6
-

27
Gantt chart
1210 22
2816 6
10 20 30
float
milestone
28
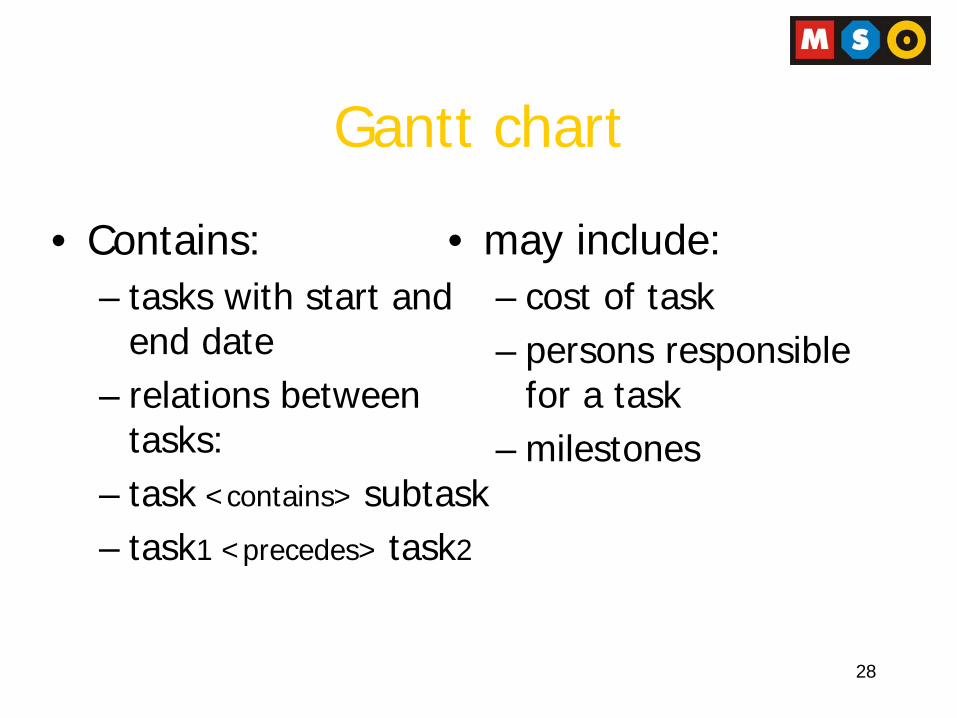
Gantt chart
• Contains:– tasks with start and
end date– relations between
tasks:– task <contains> subtask– task1 <precedes> task2
• may include:– cost of task– persons responsible
for a task– milestones

29
Gantt chart example
Presenter
Presentation Notes
FCS = Final Candidate System

30
Planning software
• Automates computing and drawing Gantt charts– e.g. MS
Project

31
Refining estimatesBased on hurricane model: gradual refinement
Typical margins of error for well-done estimates
Phase Deliverable Cost (%) Sched. time (%)
Planning System Request 400 60Project Plan 100 25
Analysis System Proposal 50 15Design System Specification 25 10
Source: Boehm et al. (1995)
Presenter
Presentation Notes
Hurricane model: predictions becomes more accurate as the hurricane approaches you.
32
When you are late ...
• due to an apparent underestimation; e.g. 2 months turned out to become 3 months:– move all deadlines by 1 month– increase all estimations for the next phases
by a factor 1.5 (or reduce the scope)– don’t change your estimations (but add
people to the project)
Presenter
Presentation Notes
See p. 98-99 of the book. Obviously the last choice mentioned above is the most risky and the second one has the lowest risk. However, this second choice will often be very difficult to explain to the project sponsor. So what you can try to do as a PM is to persuade the project sponsor to reduce the scope of the project. The first choice may seem obvious, but presupposes that the other estimations are not only better than the current underestimation, but should be perfect. It’s also wise to pad some time in your original estimations.
33
Timeboxing/RADNo focus on tasks but on time
– Argument: how many features do you use from your word processor?
1. Fix deadline for this cycle2. Prioritize functionality (MoSCoW model:
Must/Should/Could/Won’t have)3. Build and deliver the most
important functionality
Presenter
Presentation Notes
The example of the word processor is meant to illustrate that the SW company that has built the word processor has spent a great deal of time and money on features, most of which you (and a lot of other people) will never use. Only with the arrival of dedicated tools, it was possible to achieve the short lifecycles commonly used with RAD. In this context the notion of SWAT-teams was defined beyond the common meaning: SWAT = Skilled Workers with Advanced Tools (instead of Special Weapons And Tactics). MoSCoW: see http://www.coleyconsulting.co.uk/moscow.htm or http://en.wikipedia.org/wiki/MoSCoW_Method

34
Managing scope
• Scope creep: tendency to add requirements after the project scope was set (first law of S.E.)
• Reasons: – new technical possibilities– users seeing new useful functionality – upper management wants to include new
strategies
Presenter
Presentation Notes
Upper management: suppose for instance that a large bank finds out that financial directors of subsidiaries sometimes grant loans to companies without a proper risk analysis of the company’s creditability. If upper management finds this happens when building a new software system for risk analysis, but no proper precautions were taken on the level of authorization, then undoubtedly they want to include this as soon as possible, even though the project is halfway.

35
Staffing the project
• Deliverable = the staffing plan; contains:– the different roles needed:
• project manager• functional lead + analysts (business, systems)• technical lead + technical staff
– the reporting structure– the project’s objectives and rules
36
Staffing the project
• Assigning people to roles:– a person often has several roles– distinguish technical skills (e.g. being a
network specialist or a programmer) from interpersonal skills (e.g. how sociable you are or how well you communicate);
– look for balance within the team

37
Staffing the project
• Adding staff may add more overhead than additional labor: N
persons
theoretically have N * (N – 1)/2 lines of communication
• Using teams of 8-10, reporting in a hierarchical structure, can reduce complexity

38
Motivation: the key success factor
• Deadlines: must be realistic• ‘Pat on the back’: very motivating!• Bonus/salary: be careful!• Decision making: involve team members• Working conditions: must be excellent• New skills: challenging, but learn them in
time
Presenter
Presentation Notes
working conditions: sounds trivial, but resources, temperature, desk/chair are very important. See also: http://www.stevemcconnell.com/articles/art05.htm (Microsoft: A Highly Motivated Environment)

39
Coordinating project activities
• CASE• Standards• Documentation• Managing risk
Presenter
Presentation Notes
This is about creating an efficient way of system development. The book distinguishes four different aspects.
40
CASE: Computer Aided Software Engineering
• Software for automating (part of) the development process
• Upper CASE: used primarily for analysis• Lower CASE: used for design and e.g. for
generating database tables• I-CASE (I: Integrated) = upper + lower
– Rational Rose, Oracle Designer/2000, ...– But often used as diagramming tool!
Presenter
Presentation Notes
The use of CASE-tools can improve consistency and – with the help of the repository – the tool can warn/prevent you from making mistakes, such as putting a field on a screen design which does not exist in the model.

41
Standards• Documentation:
– often templates, headers and footers, ...• Coding:
– last update and who made that, brief description, ...• UI:
– fonts, colors, ...• Procedures:
– changes in e.g. specs must be approved by the PM; with a conflict, try to settle it, or escalate to one level up, …

42
Documentation / Risk Management
• Complete history of the project
• Both in project binders and on-line
• deliverables, internal communication (e.g. minutes from meetings, standards for docu, letters …)
• Risk assessment: list of risks with – probabilities– consequences – ways to deal with