PROJECT JUSTIFICATION t e chm a t - Department of Water...
148
Attachment PROJECT JUSTIFICATION 2 Bay Area Regional Climate Change Preparedness Proposition 84 Integrated Regional Water Management 2015 Implementation Grant Application Association of Bay Area Governments
Transcript of PROJECT JUSTIFICATION t e chm a t - Department of Water...

Attac
hmen
t PROJECT JUSTIFICATION2Bay Area Regional Climate Change Preparedness
Proposition 84Integrated Regional Water Management
2015 Implementation Grant Application
Association of Bay Area Governments

Bay Area Regional Climate Change Preparedness Att. 2-i
2015 IRWM Implementation Grant Application
Introduction .......................................................................................................................................................................... 1
Regional Map ........................................................................................................................................................................ 4
Project Summary Table (PSP Table 4) ................................................................................................................................... 5
Project Justification: Water Supply – Drought Preparedness Projects ................................................................................. 7
Project 1: Bay Area AQPI System ................................................................................................................................... 8
Project 2: Anderson Dam Seismic Retrofit Project ...................................................................................................... 25
Project 3: Marin 2020 Turf Replacement Project ........................................................................................................ 37
Project Justification: Human Right to Water Projects ........................................................................................................ 54
Project 4: East Palo Alto Groundwater Supply Project ................................................................................................ 55
Project 5: Coastal San Mateo County Drought Relief Phase II .................................................................................... 72
Project Justification: Shoreline Resilience – Sea Level Rise Preparedness Projects ........................................................... 85
Project 6: San Francisquito Creek Flood Protection and Ecosystem Restoration Project ........................................... 86
Project 7: Mountain View Shoreline Portion of SBSPR Project ................................................................................... 98
Project 8: Eden Landing Portion of SBSPR Project ..................................................................................................... 113
Project 9: Novato Creek Flood Protection and Habitat Enhancement Project ......................................................... 128
Project Justification: Grant Administration ...................................................................................................................... 143
Project 10: Grant Administration .............................................................................................................................. 144
List of Acronyms and Abbreviations
AB Assembly Bill
ABAG Association of Bay Area Governments
ADSRP Anderson Dam Seismic Retrofit Project
AF acre-feet
AFD acre-feet per day
AFY acre-feet per year
AMP adaptive management plan
AQPI Advanced Quantitative Precipitation Information
AR atmospheric river
ARO atmospheric river observatory
BAWSCA Bay Area Water Supply and Conservation Agency
BMKV HWR Bel Marin Keys Unit V project component
BMO basin management objective
BMP best management practice
CAP corrective action plan
CDFW California Department of Fish and Wildlife
CEQA California Environmental Quality Act
CIMIS California Irrigation Management Information System
cfs cubic feet per second
CII commercial, industrial, and institutional

Attachment 2 – Project Justification
Bay Area Regional Climate Change Preparedness Program Att. 2-ii
2015 IRWM Implementation Grant Application
CIP Capital Improvement Program
CNRFC California–Nevada River Forecast Center
COG council of governments
CoSMos USGS Coastal Storm Modeling System
CRLF California red-legged frog
CSA 7 San Mateo County Service Area 7
CSO combined sewer overflow
CUWCC California Urban Water Conservation Council
CVP Central Valley Project
CWA Federal Clean Water Act
CW3E Center for Western Weather and Water Extremes, Scripps Institution of Oceanography
cy cubic yards
Delta Sacramento–San Joaquin River Delta
DAC Disadvantaged Community
dBA A-weighted decibels
DO dissolved oxygen
DSOD California Division of Safety of Dams
DWR California Department of Water Resources
EIR environmental impact report
EIS environmental impact statement
ETo the reference, or potential, amount of evaporation and plant transpiration from the Earth's land surface to the atmosphere
FAHCE SCVWD Fisheries and Aquatic Habitat Collaborative Effort Program and Fish Habitat Restoration Plan
FEMA Federal Emergency Management Agency
FERC Federal Energy Regulatory Commission
FIRM FEMA flood insurance rate map
FIRO forecast-informed reservoir operations
FBO forecast-based operations
ft. feet
FY fiscal year
gpcd gallons per capita per day
gpm gallons per minute
GRR general reevaluation report
GWMP groundwater management plan
HEC-RAS USACE Hydrologic Engineering Center River Analysis System
HEP USFWS Habitat Evaluation Procedure
hr. hour
HWR Hamilton Wetland Restoration
I- Interstate
in. inches
IRWM Integrated Regional Water Management
IRWMP Integrated Regional Water Management Plan
kg kilograms
LF linear feet
MCE maximum credible earthquake
MCL maximum contaminant level
mcy million cubic yards
MG million gallons
MGD million gallons per day
MGY million gallons per year
Attachment 2 – Project Justification
Bay Area Regional Climate Change Preparedness Program Att. 2-iii
2015 IRWM Implementation Grant Application
mg/L milligrams per liter
MHI median household income
min. minute
MMWD Marin Municipal Water District
MND Mitigated Negative Declaration
NHI National Heritage Institute
NMFS National Marine Fisheries Service
NOAA National Oceanic and Atmospheric Administration
NPDES National Pollutant Discharge Elimination System
NRCS Natural Resources Conservation Service
NWS National Weather Service
NWS-MTR NWS San Francisco–Monterey Weather Forecast Office
OCOF Our Coast, Our Future Collaborative Project
PCSWMM USEPA stormwater, wastewater, and watershed modeling program
PG&E Pacific Gas and Electric Company
PMF probable maximum flood
Prop 84 Proposition 84
Proposal the proposal being submitted in response to the 2015 IRWM Proposal Solicitation Package
psi pounds per square inch
PSP Proposal Solicitation Package
QPI quantitative precipitation information
RCD San Mateo County Resource Conservation District
R-GCPD residential gallons per capita per day
RWQCB Regional Water Quality Control Board
RWS regional water system
SBSPR South Bay Salt Pond Restoration
SCC California State Coastal Conservancy
SCVWD Santa Clara Valley Water District
SCWA Sonoma County Water Agency
SFBRWQCB San Francisco Bay Regional Water Quality Control Board
SFCJPA San Francisquito Creek Joint Powers Authority
SFEP San Francisco Estuary Partnership
SFHA special flood hazard area
SFPUC San Francisco Public Utilities Commission
SMART Sonoma–Marin Area Rail Transit
sq. ft. square feet
SWP California State Water Project
SWRCB California State Water Resources Control Board
TDS total dissolved solids
USACE U.S. Army Corps of Engineers
USD U.S. dollars
USEPA U.S. Environmental Protection Agency
USFWS U.S. Fish and Wildlife Service
USGS U.S. Geological Survey
UWMP Urban Water Management Plan
WEAP Water Evaluation And Planning system modeling tool
WUCOLS Water Use Classification of Landscape Species
WTP water treatment plant
WWTP wastewater treatment plant
Attachment 2 – Project Justification
Bay Area Regional Climate Change Preparedness Program Att. 2-1
2015 IRWM Implementation Grant Application
Introduction
The Bay Area Regional Climate Change Preparedness Program and its nine high-priority projects comprise a
geographically diverse and well-integrated implementation program with multiple water supply, recycled water, and
drought preparedness benefits to the Bay Area’s diverse population.
The Bay Area Integrated Regional Water Management (IRWM) Plan was established to integrate all water resources
functional areas, from water supply and flood protection to habitat and watershed management. In considering
projects to propose for this last round of Proposition 84 funding, the Bay Area Coordinating Committee reviewed Bay
Area projects funded to date and considered many very strong projects representing all water resources areas. Since
grant funding for the Bay Area IRWM Region under Proposition 84 (Prop 84) Rounds 1, 2, and the Drought Round has
been allocated primarily for water supply, water quality, and recycled water projects, the Coordinating Committee has
focused this last round of Prop 84 funding on climate change adaptation projects including watershed and habitat
improvement and flood protection. The proposed suite of projects supports and advances foundational Bay Area IRWM
Plan principles.
Climate change vulnerability and adaptation to sea level rise in the Bay Area is a central focus for the 2013 Update to
the Bay Area IRWM Plan. The Vulnerability Prioritization completed under that effort identified sea-level rise, flooding,
and water supply as the top three Bay Area vulnerabilities. The Bay Area Regional Climate Change Preparedness
Program and its nine high-priority projects address these vulnerabilities.
As is shown in this attachment, the Bay Area Regional Climate Change Preparedness Program contains significant,
dedicated, and well-defined projects that meet multiple Program Preferences of the California Department of Water
Resources (DWR) Prop 84 2015 IRWM Guidelines. This attachment describes how the Bay Area Regional Climate
Change Preparedness Program meets the needs created by the drought, details the physical benefits associated with
each project, justifies how each project is technically feasible, describes how each project can achieve the claimed level
of benefits, describes how each project benefits disadvantaged communities (DACs), and explains whether the benefits
will be attained through the least cost alternative. A brief description of grant administration tasks are provided as
Project 10.
The Bay Area Regional Climate Change Preparedness Program geographically spans the entire Bay Area region and
addresses three primary integrated water management benefits:
Water Supply – Drought Preparedness
Human Right to Water
Shoreline Resilience – Sea Level Rise Preparedness
Strengthening the Bay Area’s ability to respond and adapt to climate change impacts is crucial and urgent. The Bay Area
Regional Climate Change Preparedness Program addresses this urgent need through improvements to foundational
infrastructure, including the natural and built environment, and focusing on the nexus between natural events and
human response. Completion of the Program and suite of projects proposed will render the Bay Area population less
vulnerable and able to more effectively respond to and channel natural events associated with climate change.
To facilitate review, the projects are grouped by primary benefit type, as listed in Table 2-1, below. Table 2-2 provides
an abstract for each project. A Regional Map showing the locations of these projects in relation to the San Francisco
Bay IRWM Region is included as Figure 2-1. It is important to note that while the project groupings shown in Table 2-1
are intended to facilitate review, many of the nine high-priority projects provide multiple benefits (such as Water
Supply – Drought Preparedness and Human Right to Water). Details and justifications for each of the nine high-priority
projects are provided in this attachment following the summary tables.

Attachment 2 – Project Justification
Bay Area Regional Climate Change Preparedness Program Att. 2-2
2015 IRWM Implementation Grant Application
Table 2-1. Bay Area Regional Climate Change Preparedness Program Project List
Primary Project
Benefit
Project
ID# Project Proponent Project Title
Water Supply – Drought
Preparedness
1 San Francisco Estuary
Partnership (SFEP) Bay Area Advanced Quantitative Precipitation Information (AQPI) System
2 Santa Clara Valley Water
District (SCVWD) Anderson Dam Seismic Retrofit Project
3 Marin Municipal Water
District (MMWD) Marin 2020 Turf Replacement Project
Human Right to Water
4 City of East Palo Alto East Palo Alto Groundwater Supply Project
5
San Mateo County Resource Conservation
District (San Mateo County RCD)
Coastal San Mateo County Drought Relief Phase II
Shoreline Resilience –
Sea Level Rise Preparedness
6 State Coastal Conservancy San Francisquito Creek Flood Protection and Ecosystem Restoration Project
7 State Coastal Conservancy Mountain View Shoreline Portion of SBSPR Project
8 State Coastal Conservancy Eden Landing Portion of SBSPR Project
9 State Coastal Conservancy Novato Creek Flood Protection and Habitat Enhancement Project
Administration 10 Association of Bay Area
Governments/SFEP (ABAG/SFEP)
Grant Administration

Attachment 2 – Project Justification
Bay Area Regional Climate Change Preparedness Program Att. 2-3
2015 IRWM Implementation Grant Application
Table 2-2. Bay Area Regional Climate Change Preparedness Program Project Abstracts
Project
ID # Project Name
Project
Proponent Project Abstract (<25 words)
1 Bay Area Advanced Quantitative Precipitation
Information (AQPI) System
SFEP The AQPI system uses radars and improved modeling to
provide increased lead times for government decision-
makers to prepare for flooding and water supply
management decisions.
2 Anderson Dam Seismic Retrofit Project
SCVWD This project will make improvements required for Anderson Dam and its appurtenances to withstand a maximum credible earthquake and probable maximum flood event.
3 Marin 2020 Turf Replacement Project
MMWD This project will remove up to 443,000 square feet of non-functional turfgrass from commercial, institutional, and industrial properties and replace it with environmentally beneficial landscapes.
4 East Palo Alto Groundwater Supply
Project
City of East Palo Alto
This project includes development and use of groundwater as a new source of water supply for the City of East Palo Alto and its DACs.
5 Coastal San Mateo County Drought Relief
Phase II
San Mateo County RCD
This project continues ongoing efforts with local communities and agricultural stakeholders to balance beneficial uses of water resources in San Mateo County.
6 San Francisquito Creek Flood Protection and
Ecosystem Restoration Project
State Coastal Conservancy
The project goals are to protect against concurrent 100-year riverine floods, 100-year high-tides, and sea-level rise while restoring 18 acres of tidal marsh.
7 Mountain View Shoreline Portion of
SBSPR Project
State Coastal Conservancy
This project in Mountain View includes 710 acres of tidal marsh and upland habitat restoration and critical flood risk management infrastructure for residences and businesses.
8 Eden Landing Portion of SBSPR Project
State Coastal Conservancy
The Eden Landing project involves restoration of over 1,300 acres of tidal marsh, levee improvements to decrease flood risk, and new public access trails.
9 Novato Creek Flood Protection and Habitat Enhancement Project
State Coastal Conservancy
The Novato Creek Flood Protection and Habitat Enhancement Project will provide flood protection for 870 acres of land and restore 30 acres of wetland habitat.
10 Grant Administration ABAG/SFEP This task ensures that IRWM grant funds for the nine projects are properly managed, that projects are completed, and that schedules are met within budget.

Attachment 2 – Project Justification
Bay Area Regional Climate Change Preparedness Program Att. 2-4
2015 IRWM Implementation Grant Application
Regional Map
Attachment 2 – Project Justification
Bay Area Regional Climate Change Preparedness Program Att. 2-5
2015 IRWM Implementation Grant Application
Project Summary Table
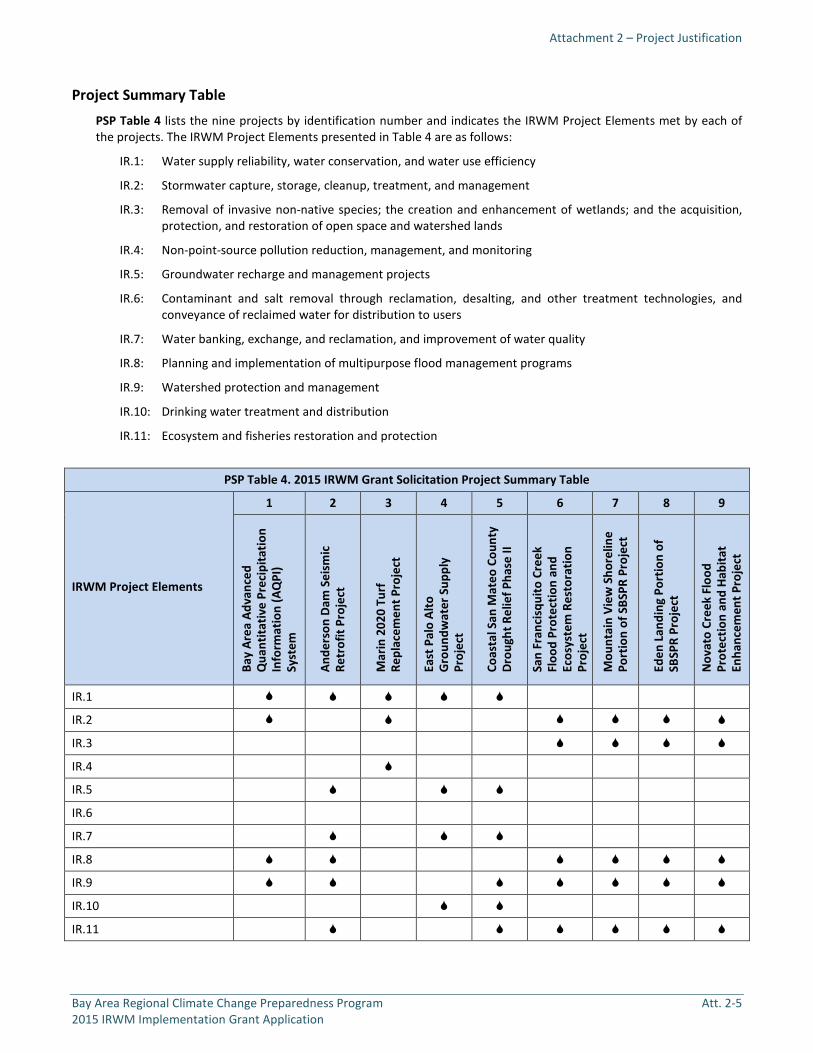
PSP Table 4 lists the nine projects by identification number and indicates the IRWM Project Elements met by each of
the projects. The IRWM Project Elements presented in Table 4 are as follows:
IR.1: Water supply reliability, water conservation, and water use efficiency
IR.2: Stormwater capture, storage, cleanup, treatment, and management
IR.3: Removal of invasive non-native species; the creation and enhancement of wetlands; and the acquisition,
protection, and restoration of open space and watershed lands
IR.4: Non-point-source pollution reduction, management, and monitoring
IR.5: Groundwater recharge and management projects
IR.6: Contaminant and salt removal through reclamation, desalting, and other treatment technologies, and
conveyance of reclaimed water for distribution to users
IR.7: Water banking, exchange, and reclamation, and improvement of water quality
IR.8: Planning and implementation of multipurpose flood management programs
IR.9: Watershed protection and management
IR.10: Drinking water treatment and distribution
IR.11: Ecosystem and fisheries restoration and protection
PSP Table 4. 2015 IRWM Grant Solicitation Project Summary Table
IRWM Project Elements
1 2 3 4 5 6 7 8 9
Ba
y A
rea
Ad
va
nce
d
Qu
an
tita
tiv
e P
reci
pit
ati
on
Info
rma
tio
n (
AQ
PI)
Sy
ste
m
An
de
rso
n D
am
Se
ism
ic
Re
tro
fit
Pro
ject
Ma
rin
20
20
Tu
rf
Re
pla
cem
en
t P
roje
ct
Ea
st P
alo
Alt
o
Gro
un
dw
ate
r S
up
ply
Pro
ject
Co
ast
al
Sa
n M
ate
o C
ou
nty
Dro
ug
ht
Re
lie
f P
ha
se I
I
Sa
n F
ran
cisq
uit
o C
ree
k
Flo
od
Pro
tect
ion
an
d
Eco
syst
em
Re
sto
rati
on
Pro
ject
Mo
un
tain
Vie
w S
ho
reli
ne
Po
rtio
n o
f S
BS
PR
Pro
ject
Ed
en
La
nd
ing
Po
rtio
n o
f
SB
SP
R P
roje
ct
No
va
to C
ree
k F
loo
d
Pro
tect
ion
an
d H
ab
ita
t
En
ha
nce
me
nt
Pro
ject
IR.1
IR.2
IR.3
IR.4
IR.5
IR.6
IR.7
IR.8
IR.9
IR.10
IR.11

Attachment 2 – Project Justification
Bay Area Regional Climate Change Preparedness Program Att. 2-6
2015 IRWM Implementation Grant Application
The subsequent sections of Attachment 2 are organized by project benefit type and include the following information
for each project:
A. Project description;
B. Project map;
C. Project physical benefits (primary and secondary) (PSP Table 5), followed by the
Technical Analysis of Physical Benefits Claimed (following PSP Table 5 for the primary and secondary benefits);
D. Direct water-related benefits to a DAC;
E. Project Performance Monitoring Plan; and
F. Cost-effectiveness analysis (PSP Table 6).
References supporting the project physical benefits described for each project are identified in each project discussion.

Attachment 2 – Project Justification
Bay Area Regional Climate Change Preparedness Program Att. 2-7 2015 IRWM Implementation Grant Application
Project Justification: Water Supply – Drought Preparedness Projects
Project ID# Project Proponent Project Title
1 San Francisco Estuary Partnership (SFEP)
Bay Area Advanced Quantitative Precipitation Information (AQPI) System
2 Santa Clara Valley Water District
(SCVWD)
Anderson Dam Seismic Retrofit Project
3 Marin Municipal Water District
(MMWD)
Marin 2020 Turf Replacement Project
The three projects that comprise the Bay Area Regional Climate Change Preparedness Program’s Water Supply – Drought Preparedness projects will increase the water supply of the region and decrease Delta reliance in measurable ways. Further, each project also has at least one or more additional benefit for the region.
Project 1, the Bay Area Advanced Quantitative Precipitation Information (AQPI) system, installs new radars and monitoring equipment, and develops state-of-the-art forecast models, to improve forecast accuracy and spatial resolution for the Bay Area region. The system provides customized radar observation and prediction capabilities tailored to the type of storms that occur in the Bay Area, to better prepare for extreme events, such as atmospheric rivers. Water, emergency response, and public safety managers will have the advanced and detailed information needed to properly prepare for and reduce impacts of extreme storm events. The project adds up to 12,000 acre-feet per year (AFY) of additional water supply by 2019.
The seismic retrofit of Anderson Dam in Santa Clara County (Project 2) contributes to water supply resiliency in the region by allowing the Anderson Reservoir to store its full design capacity of 248,108 AFY. Additional benefits include flood protection, through reservoir operating rules that reduce the likelihood of flooding; recreational benefits, through activities such as boating and fishing; and environmental benefits, through providing suitable water flows and temperatures for aquatic habitats and protected species.
Marin 2020 Turf Replacement Project (Project 3) works to establish a new norm for landscapes, one consistent with statewide efforts of the California Urban Water Conservation Council to minimize water use and chemical contaminants in stormwater runoff. Benefits include a project life benefit of 362 acre-feet of potable water saved as well as a measurable reduction in pollutants (nitrogen, phosphorous, and herbicides) impacting fragile ecosystems.

Attachment 2 – Project Justification
Bay Area Regional Climate Change Preparedness Program Att. 2-8 2015 IRWM Implementation Grant Application
PROJECT 1 – BAY AREA AQPI SYSTEM A. Project Description Project Need and Goals: The current precipitation monitoring and forecasting systems in San Francisco Bay Area are inadequate due radar gaps in geographic coverage and data availability, and inability to accurately portray heavy rainfall events such as atmospheric rivers (see Figure 2, below). The current national operational radar system was designed in the 1990’s to identify severe thunderstorms that occur in the mid-west, not atmospheric rivers that occur along the West Coast of the U.S. Regional water, emergency response, and public safety managers do not currently have enough information on extreme storm events to make informed decisions to effectively minimize flood risk and manage water supplies. The Bay Area Advanced Quantitative Precipitation Information (AQPI) system will install new radars and monitoring equipment, and develop state-of-the-art forecast models, to improve forecast accuracy and resolution for the Bay Area region (see Figure 1). To accurately track and forecast the most impactful and challenging precipitation events, the AQPI system will provide customized radar observation and prediction capabilities tailored to the type of storms that occur in the Bay Area, and to better prepare for extreme events, such as atmospheric rivers. The AQPI system will also provide coastal storm surge and streamflow forecasts to assist water resource and emergency response managers along the Bay margin. With the AQPI system, water, emergency response, and public safety managers will have the advanced and detailed information needed to properly prepare for and reduce impacts of extreme storm events. The AQPI system will assist the region today, and well into the future, as climate and weather patterns alter toward more extreme events and more significant impacts to the Pacific Coast, as well as the creeks and shoreline of the San Francisco Bay region. Project Background and Phasing: The AQPI system involves four phases. Phase I is complete, and included installing radar prototypes, atmospheric river observatories, and a precipitation observation network in Sonoma County and other parts of California. Phases II and III are the subject of this grant application and are described further below. Phase IV is a future effort to further improve and extend the forecasting coverage. The program leverages ongoing efforts by the National Oceanic and Atmospheric Administration (NOAA), the USGS Coastal Storm Modeling System (CoSMoS), and expertise from the Center for Western Weather and Water Extremes (CW3E) at the Scripps Institution of Oceanography. Project Description: The AQPI system Phases II and III is comprised of three elements: (1) installation of new radar and surface monitoring hardware; (2) development and calibration of a high-performance rainfall and runoff information system; and (3) development of a state-of-the-art user interface to communicate and exchange data (see Figure 3 in Section C, below). The primary elements of the project are summarized below:
1. AQPI Hardware: One C-band radar along the Sonoma County coast (long-range outer network). Four X-band radars that will ring San Francisco Bay (high resolution inner network). Four surface meteorological rainfall stations and three stream gauges.
2. Data Systems: Integration of new and existing meteorological and stream data. High-resolution mapping of actual and predicted rainfall, and numerical weather prediction models, using a
combination of radars and gauges. Improved precipitation forecasts at very high resolution [< 3 km] from 0-12 hours, and at high resolution [10-15
km] out to 10 days, that incorporate terrain features and atmospheric patterns specific to the Bay Area. Development of a 48-hour streamflow prediction system using hydrologic and storm surge models.
3. User Interface: Real-time, publically accessible data interface, such as a mobile device application. Data displays and graphics for notifications of rainfall and runoff conditions, and flood-risk or likely flooding. Virtual connectivity to distribute data to Bay Area emergency response and water management agencies. Data grids for local stakeholders to input into their own flood and water management models and tools.
Anticipated Physical Benefits/Intended Outcomes: The project will benefit two temporal clusters: short-term and long-term. The former will assist local agencies to better predict flooding. Long-term forecasting will provide improved rainfall accuracy that will improve water supply management decisions in response to storm events (forecast-based operations). Regional Applicability: The AQPI system will benefit the entire Bay Area region by providing public access to a state-of-the-art early warning flood protection system, with enhanced storm tracking and rainfall and runoff predictions. The AQPI system will aid water, emergency response, and public safety managers in securing water supplies while mitigating flood risk and minimizing water quality impacts to the Bay Area region.

Attachment 2 – Project Justification Project 1 – Bay Area AQPI System
Bay Area Regional Climate Change Preparedness Program Att. 2-9 2015 IRWM Implementation Grant Application
B. Project Map

Attachment 2 – Project Justification Project 1 – Bay Area AQPI System
Bay Area Regional Climate Change Preparedness Program Att. 2-10 2015 IRWM Implementation Grant Application
C. Project Physical Benefits
Primary and secondary project physical benefits are summarized in PSP Tables 5a and 5b, respectively, as follows.
PSP Table 5a - Primary Annual Project Physical Benefits
Project Name: Project 1 - Bay Area AQPI System Type of Benefit Claimed: Flood Damage Reduction Units of the Benefit Claimed: Inundated acres reduced (acres per 100-year flood event) Additional Information About This Benefit: These benefits will be realized by advanced flood warnings generated by data collected and distributed by the AQPI system. Anticipated Useful Life of Project (years): 23 years
Year
Physical Benefits
Without Project With Project Change Resulting from Project
2016 0 acres (slower flood warning)
130,360 acres 20% of Bay Area 100-year floodplain protected by improved flood warnings (partial installation of radars and limited geographic coverage). 1% reduction in flood damages due to a 100-year event, evacuation of people, fortifying of properties, avoided hazardous spill responses.
2017 0 acres (slower flood warning)
260,720 acres 40% of Bay Area 100-year floodplain protected by improved flood warnings (additional installation of radars and expanded geographic coverage). 1% reduction in flood damages due to a 100-year event, evacuation of people, fortifying of properties, avoided hazardous spill responses.
2018 0 acres (slower flood warning)
651,800 acres 100% of Bay Area 100-year floodplain protected by improved flood warnings (all radars installed and operational – total geographic coverage of 100-year floodplain). 1% reduction in flood damages due to a 100-year event, evacuation of people, fortifying of properties, avoided hazardous spill responses.
Last Year of Project Life (approximately
2039)
0 acres (slower flood warning)
651,800 acres 100% of 100-year floodplain Bay Area protected by improved flood warnings. 1% reduction in flood damages due to a 100-year event, evacuation of people, fortifying of properties, avoided hazardous spill responses.
Comments: Johnson LE, Cifelli R, White A. 2015. Benefits of an Advanced Quantitative Precipitation Information System: San
Francisco Bay Area Case Study. NOAA Technical Memorandum PSD-315, NOAA Printing Office, Silver Spring, MD, 59 p. http://dx.doi.org/10.7289/V5WS8R6X. http://docs.lib.noaa.gov/noaa_documents/OAR/PSD/TM_OAR_PSD_315.pdf.
DWR (California Department of Water Resources). 2013. Flood Future Report I. California’s Flood Future: Recommendations for Managing the State’s Flood Risk. 152 p. November. http://www.water.ca.gov/sfmp/resources/California_Flood_Future.pdf.
DWR (California Department of Water Resources). 2013. Flood Future Report I. California’s Flood Future: Recommendations for Managing the State’s Flood Risk. Technical Attachment D: Summary of Exposure and Infrastructure Inventory by County (Mapbook). November. http://www.water.ca.gov/sfmp/resources.cfm#highlights/.
DWR (California Department of Water Resources). 2010. Economic Analysis Guidelines - Flood Risk Management. 89 p. May. http://www.water.ca.gov/economics/guidance.cfm.

Attachment 2 – Project Justification Project 1 – Bay Area AQPI System
Bay Area Regional Climate Change Preparedness Program Att. 2-11 2015 IRWM Implementation Grant Application
Figure 1: Difficulties Observing Rainfall in the Bay Area with Existing Radar Network
Technical Analysis of Primary Physical Benefits Claimed
1. Explanation of the need for the project, including recent and historical conditions that provide background for benefits to be claimed.
The San Francisco Bay Area is in an extremely vulnerable position with respect to future impacts of climate change. Sea level rise, combined with periodic strong El Niño events, will lead to increased storm surges and coastal and bayshore flooding. A warmer climate will lead to storms that carry more moisture, which in turn will lead to more extreme rainfall events and urban flash flooding. The combination of decreased snowpack and increased rainfall will lead to extreme runoff from the Sierra Nevada Mountains that will flow into the bay. These conditions, combined with sea-level rise and higher storm surges, can cause catastrophic lowland flooding. A warmer climate also means earlier runoff, making water supply management even more challenging. In addition to the potential flood threat, there is also a trend toward more extreme droughts as climate change impacts increase. Thus, when it does rain, it will be critical to capture and store as much runoff as possible without compromising flood protection, especially within a drought.
Although reliable, the current severe-weather forecasting capabilities of the National Weather Service (NWS) are limited in time and spatial resolution due to limitations in the observation networks and computer processing capabilities. The California–Nevada River Forecast Center (CNRFC) issues flood forecasts, at 6-hour time intervals out to 5 days for selected main stem river sites. The NWS San Francisco–Monterey Weather Forecast Office issues warnings for flash floods that can occur in less than 6 hours. Although the Weather Forecast Office uses radar for storm tracking, the current radar products have limited accuracy and spatial resolution due to problems of terrain beam-blocking and overshooting storm-tops, particularly in the variable terrain in the Bay Area (see Figure 2).
The AQPI system is expected to provide a 12-hour lead-time improvement in severe-weather forecasts and spatial resolution as low as 1 km for flash-flood forecasts for urban areas. For municipalities in the Bay Area region, stormwater management and combined sewer systems require timeliness that vary from a few minutes to several hours, on spatial scales down to ~150 m (i.e., the “block” level). Specifically, rainfall rates exceeding ~0.3”/hr. or 1.2″ during a 6-hour period are especially problematic, and the 15-minute-to-2-hour lead time is critical for making decisions and taking actions to protect public safety and manage water resources. These are the critical time and space scales for which the AQPI system is designed. For the longer time frames, the AQPI system will provide advanced detection and prediction of atmospheric rivers over the Pacific Ocean. Lead-time and atmospheric river landfall location predictions will provide opportunities for precipitation capture in San Francisco Bay and Sierra Nevada water supply reservoirs. The table below summarizes current and proposed conditions with implementation of the AQPI system.
Current Radar and Forecasting for Bay Area
AQPI System Enhancements
Geographic Areas Covered by Radar < 50 % of Bay Area* > 80% of Bay Area** Radar Update Time 6 minutes 1 minute Radar Spatial Resolution 1 kilometer ~150 meter Radar Large Event Tracking (atmospheric rivers) No Yes Resolution of 12-Hour Precipitation Forecast 3 km 1 km Probability Information for 12-hour Forecast No Yes Lead Time Coastal Storm Surge and Small Stream Flooding
0 days 2 days
Number of Data Sources to Acquire Radar and Forecasting Imagery and Data
Multiple One
* Radar beam < 2 km above mean sea level ** Actual number depends on final location of radar equipment
Attachment 2 – Project Justification Project 1 – Bay Area AQPI System
Bay Area Regional Climate Change Preparedness Program Att. 2-12 2015 IRWM Implementation Grant Application
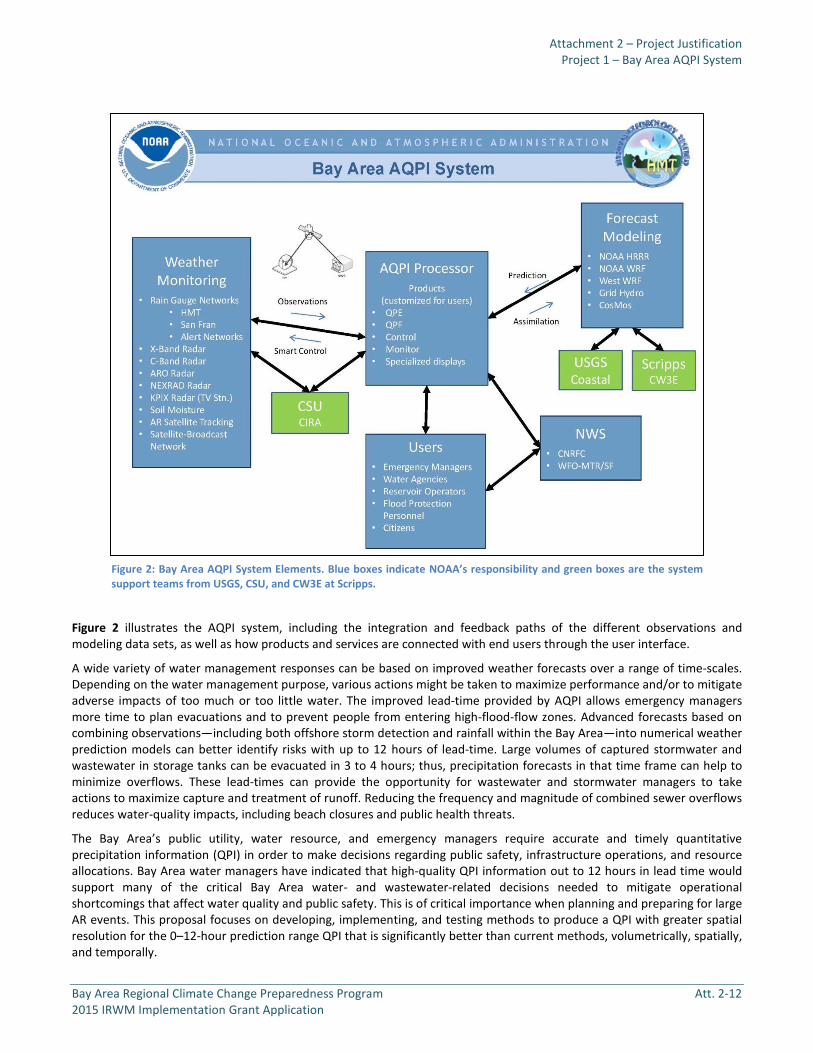
Figure 2 illustrates the AQPI system, including the integration and feedback paths of the different observations and modeling data sets, as well as how products and services are connected with end users through the user interface.
A wide variety of water management responses can be based on improved weather forecasts over a range of time-scales. Depending on the water management purpose, various actions might be taken to maximize performance and/or to mitigate adverse impacts of too much or too little water. The improved lead-time provided by AQPI allows emergency managers more time to plan evacuations and to prevent people from entering high-flood-flow zones. Advanced forecasts based on combining observations—including both offshore storm detection and rainfall within the Bay Area—into numerical weather prediction models can better identify risks with up to 12 hours of lead-time. Large volumes of captured stormwater and wastewater in storage tanks can be evacuated in 3 to 4 hours; thus, precipitation forecasts in that time frame can help to minimize overflows. These lead-times can provide the opportunity for wastewater and stormwater managers to take actions to maximize capture and treatment of runoff. Reducing the frequency and magnitude of combined sewer overflows reduces water-quality impacts, including beach closures and public health threats.
The Bay Area’s public utility, water resource, and emergency managers require accurate and timely quantitative precipitation information (QPI) in order to make decisions regarding public safety, infrastructure operations, and resource allocations. Bay Area water managers have indicated that high-quality QPI information out to 12 hours in lead time would support many of the critical Bay Area water- and wastewater-related decisions needed to mitigate operational shortcomings that affect water quality and public safety. This is of critical importance when planning and preparing for large AR events. This proposal focuses on developing, implementing, and testing methods to produce a QPI with greater spatial resolution for the 0–12-hour prediction range QPI that is significantly better than current methods, volumetrically, spatially, and temporally.
Figure 2: Bay Area AQPI System Elements. Blue boxes indicate NOAA’s responsibility and green boxes are the system support teams from USGS, CSU, and CW3E at Scripps.
Attachment 2 – Project Justification Project 1 – Bay Area AQPI System
Bay Area Regional Climate Change Preparedness Program Att. 2-13 2015 IRWM Implementation Grant Application
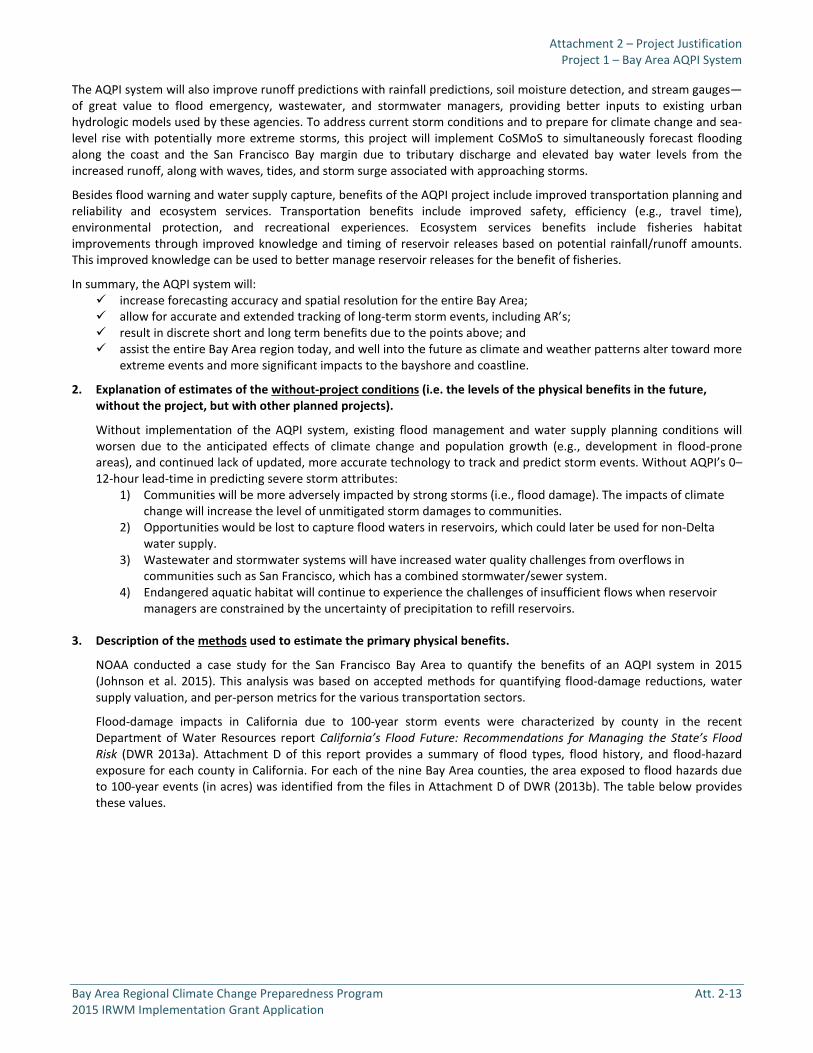
The AQPI system will also improve runoff predictions with rainfall predictions, soil moisture detection, and stream gauges—of great value to flood emergency, wastewater, and stormwater managers, providing better inputs to existing urban hydrologic models used by these agencies. To address current storm conditions and to prepare for climate change and sea-level rise with potentially more extreme storms, this project will implement CoSMoS to simultaneously forecast flooding along the coast and the San Francisco Bay margin due to tributary discharge and elevated bay water levels from the increased runoff, along with waves, tides, and storm surge associated with approaching storms.
Besides flood warning and water supply capture, benefits of the AQPI project include improved transportation planning and reliability and ecosystem services. Transportation benefits include improved safety, efficiency (e.g., travel time), environmental protection, and recreational experiences. Ecosystem services benefits include fisheries habitat improvements through improved knowledge and timing of reservoir releases based on potential rainfall/runoff amounts. This improved knowledge can be used to better manage reservoir releases for the benefit of fisheries.
In summary, the AQPI system will: increase forecasting accuracy and spatial resolution for the entire Bay Area; allow for accurate and extended tracking of long-term storm events, including AR’s; result in discrete short and long term benefits due to the points above; and assist the entire Bay Area region today, and well into the future as climate and weather patterns alter toward more
extreme events and more significant impacts to the bayshore and coastline.
2. Explanation of estimates of the without-project conditions (i.e. the levels of the physical benefits in the future, without the project, but with other planned projects).
Without implementation of the AQPI system, existing flood management and water supply planning conditions will worsen due to the anticipated effects of climate change and population growth (e.g., development in flood-prone areas), and continued lack of updated, more accurate technology to track and predict storm events. Without AQPI’s 0–12-hour lead-time in predicting severe storm attributes:
1) Communities will be more adversely impacted by strong storms (i.e., flood damage). The impacts of climate change will increase the level of unmitigated storm damages to communities.
2) Opportunities would be lost to capture flood waters in reservoirs, which could later be used for non-Delta water supply.
3) Wastewater and stormwater systems will have increased water quality challenges from overflows in communities such as San Francisco, which has a combined stormwater/sewer system.
4) Endangered aquatic habitat will continue to experience the challenges of insufficient flows when reservoir managers are constrained by the uncertainty of precipitation to refill reservoirs.
3. Description of the methods used to estimate the primary physical benefits.
NOAA conducted a case study for the San Francisco Bay Area to quantify the benefits of an AQPI system in 2015 (Johnson et al. 2015). This analysis was based on accepted methods for quantifying flood-damage reductions, water supply valuation, and per-person metrics for the various transportation sectors.
Flood-damage impacts in California due to 100-year storm events were characterized by county in the recent Department of Water Resources report California’s Flood Future: Recommendations for Managing the State’s Flood Risk (DWR 2013a). Attachment D of this report provides a summary of flood types, flood history, and flood-hazard exposure for each county in California. For each of the nine Bay Area counties, the area exposed to flood hazards due to 100-year events (in acres) was identified from the files in Attachment D of DWR (2013b). The table below provides these values.

Attachment 2 – Project Justification Project 1 – Bay Area AQPI System
Bay Area Regional Climate Change Preparedness Program Att. 2-14 2015 IRWM Implementation Grant Application
Representative X-Band Radars Representative C-Band Radar
Bay Area County
Area Exposed to 100-Year Event (acres)
(from DWR 2013 Attachment D)
Flood-damage Reduction Benefit from AQPI System (Present value (6%, 10 yrs.) 1% of damages to
floodplain structure contents avoided) Alameda 45,800 (9% of county area) $33.3 Million (M) Contra Costa 113,000 (22% of county area) $18.0 M Marin 34,600 (9% of county area) $16.6 M Napa 51,400 (10% of county area) $10.2 M San Francisco 400 (1% of county area) $0.0 San Mateo 88,000 (25% of county area) $28.5 M Santa Clara 60,900 (7% of county area) $24.8 M Solano 199,200 (34% of county area) $12.1 M Sonoma 58,500 (6% of county area) $8.5 M
Total 651,800 (14% of Bay Area) $270.6 M Source: DWR 2013a; 2013b.
The Johnson et al. (2015) study estimated that the AQPI System flood forecasting would result in an incremental 1% to 2% reduction in damages to structure contents in the 100-year floodplain. Assuming that a 100-year flood occurs in any given year once all the radars are installed, the system is operational, and the user interface is complete, it is assumed that there will be a total monetary savings of 1% of structures’ content value in the floodplain of 651,800 acres. This is the equivalent savings of $37,000,000 dollars per year. The present value equivalent (at 6% for 10 years) is $270,600,000 (see the third column in benefits table above).
4. Identification/description of all new facilities, policies, and actions required to obtain the physical benefits, i.e., any City (or regional) policies or procedures that need to be established in order for the benefits to be realized.
A key factor in achieving flood-damage reduction benefits is the efficient response of emergency preparedness agencies and residents living in the floodplains. For a community with a high level of preparedness, this factor may be 90%. A poorly prepared community may have a response efficiency factor of only 30%. Given the importance of this factor, the AQPI system will involve substantial training and support for flood preparedness though workshops and table-top exercises in collaboration with the Federal Emergency Management Agency (FEMA) and emergency-response agencies in the San Francisco Bay Area, including the California Office of Emergency Services (CalOES). Furthermore, AQPI flood and flash-flood warning products will be designed and disseminated according to the needs and desires of the emergency preparedness agencies.
5. Description of potential adverse physical effects and what is being done to mitigate those impacts.
Potential adverse physical effects of developing the AQPI system primarily involve the construction of the AQPI system radars and monitoring equipment. Operation of the system, once built, is not anticipated to have significant lasting physical effects. Potential adverse physical effects are summarized in the table below, with representative photos of these facilities.

Attachment 2 – Project Justification
Bay Area Regional Climate Change Preparedness Program Att.2-15 2015 IRWM Implementation Grant Application
Facility Typical Size/Footprint Description Physical Effects of Installation Impact Avoidance and Minimization C-Band Radar 625 sq.ft. radar mounting
footprint on 1,225 sq.ft. concrete enclosure
Perimeter fencing Approximately 35-foot tall (10 ft.
tall enclosure w/25 ft. radome) 3-4 small buildings to house
electrical and communications equipment
Reinforced concrete foundation with steel-lattice tower or concrete enclosure to support the radar and an access stairway. The entire facility will be surrounded by perimeter fencing or a wall for security. The tower will have appropriate lighting and lightning rods.
Earthwork activity to prepare the foundation
Radome and tower/enclosure will be a visible, non-natural feature on the landscape
Radome and tower/enclosure can be a physical obstruction to birds and other wildlife
Additional impervious surface of concrete pad may increase stormwater runoff
Radar facility will be located in developed areas with existing radar towers, i.e., radars will be located in an “infill” setting and not a pristine greenfield setting. Any radar tower construction will first be screened for the potential of and proximity to bird activity, as well as visual/aesthetic impacts consistent with CEQA guidelines. Radar frequencies will be set so as to not interfere with ambient communications.
X-Band Radar 64 sq.ft. foundation Approximately 20 ft. tall (10 ft.
tall enclosure w/10 ft. tall radar) If 10 ft. riser is used, 25 sq.ft.
foundation. Additional electrical enclosures
Concrete foundation surrounded by perimeter fencing.
Earthwork activity to prepare the foundation
Small platform on the pad (10 feet tall)
Additional impervious surface of concrete pad may increase stormwater runoff
Radar facility will be located in developed areas with radar towers, i.e., radars will be located in an “infill” setting and not a pristine greenfield setting. Any radar tower construction will first be screened for the potential of and proximity to bird activity, as well as visual/aesthetic impacts consistent with CEQA guidelines.
Weather Gauge
25-square-foot footprint 10 feet tall
On tripod; anchored with guy-wires; surrounded by perimeter fence
Earthwork activity to prepare the tripod
Minimal impact will be addressed in CEQA guidelines.
Stream Flow Gauge
2-square-foot footprint 1 foot tall
Mounted on underside of bridge to monitor stream height; small antenna will also be mounted to telemeter data
N/A Minimal impact will be addressed in CEQA guidelines.

Attachment 2 – Project Justification
Bay Area Regional Climate Change Preparedness Program Att. 2-16 2015 IRWM Implementation Grant Application
6. Description of whether the proposed project effectively addresses long-term drought preparedness goals.
a. Promote water conservation, conjunctive use, reuse, and recycling: This project will not directly affect these issues.
b. Improve landscape and agricultural irrigation efficiencies: This project will not directly affect these issues.
c. Achieve long-term reduction of water use: This project will not directly affect these issues.
d. Efficient groundwater basin management: The California State Water Plan Reoperation Studies identify reoperation of existing reservoirs, flood facilities, and other water facilities in conjunction with groundwater storage to improve water supply reliability, flood-hazard reduction, and ecosystem protection and to reduce groundwater overdraft (DWR 2013a, 7-7). Reservoirs in the program area are important source areas for downstream streamflow and recharge. With the improved understanding of storm precipitation and runoff provided by the AQPI system, reservoir managers can make better-informed decisions regarding retaining or releasing existing water supplies based on the forecast volume of runoff from tracked storms. For sizeable storms, the ability for reservoir managers to increase releases will improve groundwater recharge opportunities. For example, at Lake Del Valle in Alameda County, better forecasting of precipitation and runoff amounts prior to storms will allow improved and potentially increased reservoir releases to the Arroyo Del Valle and a complex of groundwater recharge facilities downstream. Zone 7 Water Agency plans on using the AQPI system to better manage recharge of its overall groundwater basin in the upper Alameda Creek watershed.
e. Establish system interties: Not applicable to this project.
f. Solutions that yield a new water supply, such as seawater desalination: As described above, improved foreknowledge of approaching storm systems and their likely precipitation content and runoff volume will enable reservoir managers to more efficiently manage their reservoirs towards a full capacity. In the event of a rainfall event that would trigger reservoir releases, increased downstream releases for groundwater recharge will be made based on improved understanding of the reservoir capacity. In this way, reservoir storage and release will be improved to provide additional water supply.
References Cited for Primary Project Benefit DWR (California Department of Water Resources). 2013a. Flood Future Report I. California’s Flood Future:
Recommendations for Managing the State’s Flood Risk. 152 p. November. http://www.water.ca.gov/sfmp/resources/California_Flood_Future.pdf.
DWR (California Department of Water Resources). 2013b. Flood Future Report I. California’s Flood Future: Recommendations for Managing the State’s Flood Risk. Technical Attachment D: Summary of Exposure and Infrastructure Inventory by County (Mapbook). November. http://www.water.ca.gov/sfmp/resources.cfm#highlights/.
Attachment 2 – Project Justification Project 1 – Bay Area AQPI System
Bay Area Regional Climate Change Preparedness Program Att. 2-17 2015 IRWM Implementation Grant Application
Technical Analysis of Secondary Physical Benefits Claimed
1. Explanation of the need for the project, including recent and historical conditions that provide background for benefits to be claimed, e.g., recent water shortages, loss of habitat or ecosystem function, and water quality problems. The AQPI system will allow water-resource managers to better determine the amount, location, timing, and frequency of rainfall. These advantages will enable water managers to better manage their supplies, with improved storage and release operations. This aspect of the project will become increasingly important as climate change intensifies droughts and precipitation events. When it does rain, it will be critical to capture and store as much runoff as possible without affecting flood reduction capacity, even within a drought.
An important factor for the water supply benefits involves acceptance of reservoir forecast-based operations (FBO) policies by the Army Corps of Engineers (USACE) and other Federal, State, and local water supply agencies. The FBO concept is currently a focus of interest in California, with DWR having examined FBO for several Sierra reservoirs (http://www.water.ca.gov/system_reop/) and in a feasibility study for the Russian River/Lake Mendocino (Johnson 2015). Moreover, legislation to require the Army Corps of Engineers to incorporate forecast information into their reservoir release strategy has recently been introduced into the U.S. Congress.
A detailed study of forecast-informed reservoir operations (FIRO) for the Russian River basin is currently being developed by the USACE, Sonoma County Water Agency (SCWA), and other stakeholders (SCWA 2015). There are indications that the FBO approach is acceptable, as indicated by the Final California Water Plan Update 2013, which noted measures to improve reservoir operations using forecasting (DWR 2013a, 7-12; DWR 2014). A
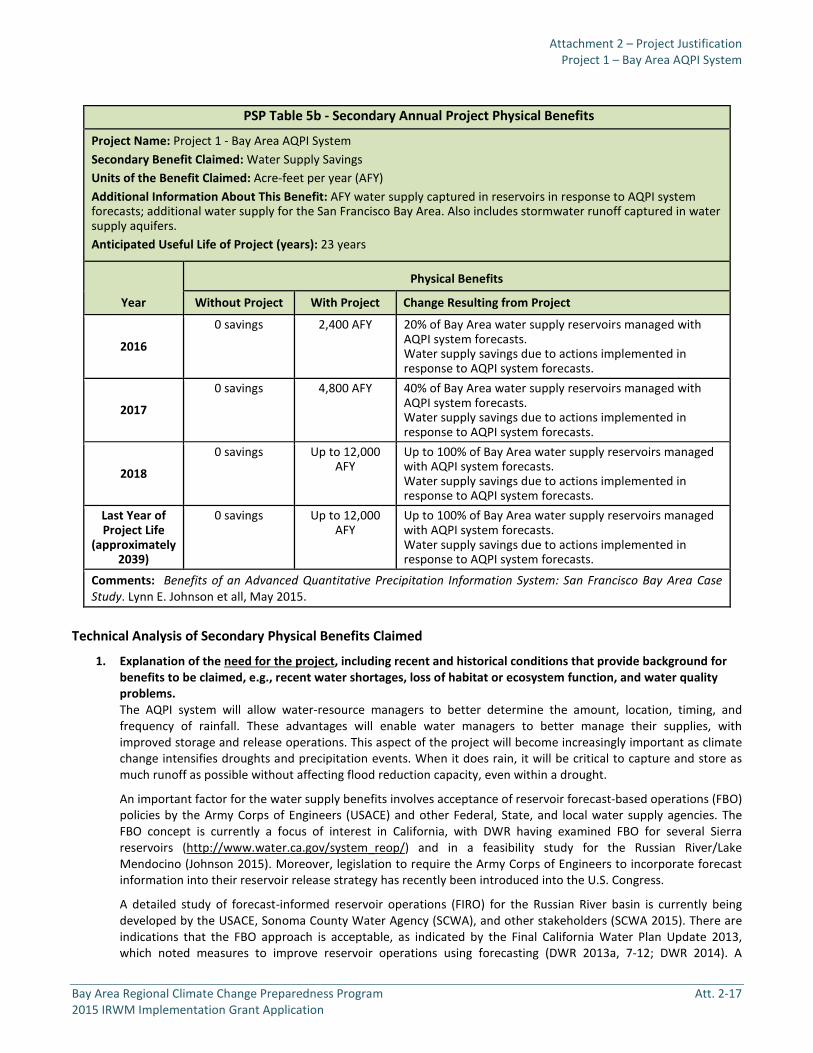
PSP Table 5b - Secondary Annual Project Physical Benefits
Project Name: Project 1 - Bay Area AQPI System Secondary Benefit Claimed: Water Supply Savings Units of the Benefit Claimed: Acre-feet per year (AFY) Additional Information About This Benefit: AFY water supply captured in reservoirs in response to AQPI system forecasts; additional water supply for the San Francisco Bay Area. Also includes stormwater runoff captured in water supply aquifers. Anticipated Useful Life of Project (years): 23 years
Year
Physical Benefits
Without Project With Project Change Resulting from Project
2016
0 savings 2,400 AFY 20% of Bay Area water supply reservoirs managed with AQPI system forecasts. Water supply savings due to actions implemented in response to AQPI system forecasts.
2017
0 savings 4,800 AFY 40% of Bay Area water supply reservoirs managed with AQPI system forecasts. Water supply savings due to actions implemented in response to AQPI system forecasts.
2018
0 savings Up to 12,000 AFY
Up to 100% of Bay Area water supply reservoirs managed with AQPI system forecasts. Water supply savings due to actions implemented in response to AQPI system forecasts.
Last Year of Project Life
(approximately 2039)
0 savings Up to 12,000 AFY
Up to 100% of Bay Area water supply reservoirs managed with AQPI system forecasts. Water supply savings due to actions implemented in response to AQPI system forecasts.
Comments: Benefits of an Advanced Quantitative Precipitation Information System: San Francisco Bay Area Case Study. Lynn E. Johnson et all, May 2015.
Attachment 2 – Project Justification Project 1 – Bay Area AQPI System
Bay Area Regional Climate Change Preparedness Program Att. 2-18 2015 IRWM Implementation Grant Application
reconnaissance-level analysis by the DWR (2014; MBK Engineers 2014) was performed to demonstrate the refilling potential of Shasta, Oroville, Folsom, and New Bullards Bar reservoirs from FBO reoperation. That study noted the following results for years when reoperation increased the maximum storage with FBO reoperation conditions: Shasta (24 of 54 years), Oroville (10 of 42 years), Folsom (22 of 55 years), and New Bullards Bar (5 of 39 years). The DWR reoperation study also conducted a CalLite model run to demonstrate the potential effects of FBO reoperation systemwide on the carryover storage and water supply of the California State Water Project (SWP) and Central Valley Project (CVP). The changes in average annual carryover storage were: Shasta (60,000 AF), Trinity (20,000 AF), and Folsom (28,000 AF).
Opportunities for reservoir FBO in the San Francisco Bay Area include reservoirs operated by the Santa Clara Valley Water District (SCVWD), Zone 7 Water Agency, Contra Costa Water District, San Francisco Public Utilities Commission, Sonoma County Water Agency, and others. As an example of AQPI’s applicability for improved reservoir management, a feasibility analysis of reoperation of Lake Sonoma was conducted (Johnson 2015) to identify a potential average water supply storage increase of 10,000 AF/year. A conservative estimate is that 7,500 AF/year could be obtained by allowing FBO policies in the 40,000 AF flood zone. Comparable analysis of Lake Sonoma, which has a 50,000 AF flood zone, was not conducted, but a comparable increase in water supply may be expected.
Detailed analysis for the SCVWD reservoirs was not conducted. However, discussions with SCVWD staff indicate that using an FBO approach could increase water supply yields and conjunctive management operations. The DWR reoperation study (2013) noted that, according to East Bay Municipal Utility District, the Camanche and Pardee reservoirs are already operating efficiently and do not have potential operational flexibility for reoperation.
Discussions with the SCWA and SCVWD indicate that both agencies acknowledge that groundwater conjunctive-use strategies could be aided by FBO reservoir operations strategies.
In some areas, such as the coast side of San Mateo County, where there is a DWR-recognized DAC, this project will improve the use of small, local reservoirs for storage and groundwater recharge management for populations that have no other sources of water, thus contributing to the "human right to water."
2. Explanation of estimates of the without-project conditions (i.e. the levels of the physical benefits in the future, without the project, but with other planned projects). Without implementation of the AQPI project, existing flood control and water supply conditions would worsen due to future challenges and risks of climate change. Without AQPI’s improved lead-time in predicting severe storm attributes:
1) Water supply agencies will not be able to maximize their water management/drought mitigation opportunities. In periods of drought, maximizing water for reservoirs is critical.
2) Wastewater and stormwater systems will have increased water-quality challenges from culvert overflows
3) Endangered aquatic habitat will continue to experience the challenges of insufficient flows when reservoir managers are reluctant to release water because of the uncertainty of precipitation to refill reservoirs.
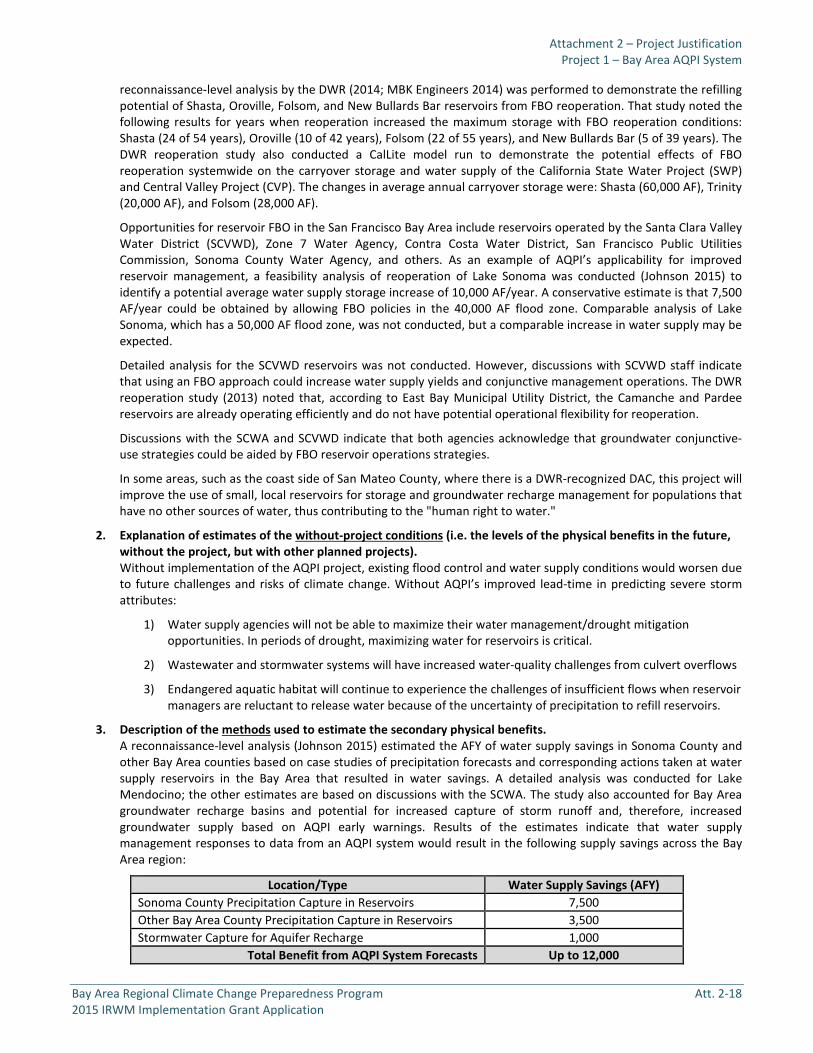
3. Description of the methods used to estimate the secondary physical benefits. A reconnaissance-level analysis (Johnson 2015) estimated the AFY of water supply savings in Sonoma County and other Bay Area counties based on case studies of precipitation forecasts and corresponding actions taken at water supply reservoirs in the Bay Area that resulted in water savings. A detailed analysis was conducted for Lake Mendocino; the other estimates are based on discussions with the SCWA. The study also accounted for Bay Area groundwater recharge basins and potential for increased capture of storm runoff and, therefore, increased groundwater supply based on AQPI early warnings. Results of the estimates indicate that water supply management responses to data from an AQPI system would result in the following supply savings across the Bay Area region:
Location/Type Water Supply Savings (AFY) Sonoma County Precipitation Capture in Reservoirs 7,500 Other Bay Area County Precipitation Capture in Reservoirs 3,500 Stormwater Capture for Aquifer Recharge 1,000
Total Benefit from AQPI System Forecasts Up to 12,000

Attachment 2 – Project Justification Project 1 – Bay Area AQPI System
Bay Area Regional Climate Change Preparedness Program Att. 2-19 2015 IRWM Implementation Grant Application
The savings estimates outlined in the preceding table are the base-case, most probable estimates. The case study analysis predicted that water savings may reach up to 25,000 AFY or as low as 5,000 AFY. Also, the estimates only considered selected facilities, and are treated as minimal levels of achievement given the limited scope of analysis.
The SCWA reports (DWR 2009) that its wholesale price for water is roughly $1,000/AF. Thus, the value of capturing an additional 12,000 AFY equals roughly $12,000,000 per year. Bay Area water agencies would not have to pay for this amount of water from sources outside the region (i.e., the Delta) through improved reservoir management based on high-resolution AQPI forecasting. Additional energy cost savings can be achieved by reducing the regional imported water need, as well. Most local reservoir systems rely on gravity to provide the energy for supply and distribution, so increased local reservoir storage opportunities results in energy cost savings for the region. Additionally, the improved storage/release management at reservoirs afforded by AQPI data will also result in more groundwater recharge from increased reservoir releases. Increased groundwater recharge, in turn, provides another water supply benefit.
4. Identification/description of all new facilities, policies, and actions required to obtain the physical benefits, i.e., any City policies or procedures that need to be established in order for the benefits to be realized. To realize the benefits of the AQPI system, some reservoirs will need to reconsider their existing operational guidelines and transition to an FBO approach that will make use of data provided by AQPI to make improved decisions regarding storage and release.
5. Description of potential adverse physical effects and what is being done to mitigate those impacts. If none, explanation of why. Please see the table in the response to the preceding Primary Benefit question 5, which summarizes physical impacts related to increased water supply benefit from AQPI data.
6. Description of whether the proposed project effectively addresses long-term drought preparedness goals.
a. Promote water conservation, conjunctive use, reuse, and recycling: Not applicable to this project.
b. Improve landscape and agricultural irrigation efficiencies: Not applicable to this project.
c. Achieve long-term reduction of water use: Not applicable to this project.
d. Efficient groundwater basin management: Approximately 1,000 AFY increased water supply from improved capture of storm runoff to groundwater recharge basins in the Bay Area. As noted above, 1,000 AFY translates to approximately $1,000,000 per year in water supply savings.
e. Establish system interties: Not applicable to this project.
f. Solutions that yield a new water supply, such as seawater desalination: The ability to harvest and manage rainfall from atmospheric rivers may represent a new water supply. The AQPI will provide tools to evaluate and improve the management of potential water resources from atmospheric river type storms.
References Cited for Secondary Project Benefit
DWR (California Department of Water Resources). 2013a: Final California Water Plan Update 2013, Volume 3 - Resource Management Strategies, Chapter 7: System Reoperation. 20 p. http://www.waterplan.water.ca.gov/cwpu2013/final/index.cfm. See pages 7-12 for summary of system reoperation measures and concepts.
DWR (California Department of Water Resources). 2013b. Flood Future Report I. California’s Flood Future: Recommendations for Managing the State’s Flood Risk. Technical Attachment D: Summary of Exposure and Infrastructure Inventory by County (Mapbook). November. http://www.water.ca.gov/sfmp/resources.cfm#highlights/.
DWR (California Department of Water Resources). 2014. Draft Phase 2 Report System Reoperation Study — Strategy Formulation and Refinement. Sacramento (CA): 39 p. http://www.water.ca.gov/system_reop/docs/System%20Reop%20Phase%202%20Report%20-%20February%202014%20Draft.pdf.
Johnson LE. 2015. Reservoir Forecast-Based Operations Simulation Model—Lake Mendocino Case Study. Internal Report to Sonoma County Water Agency. NOAA ESRL Physical Sciences Division. May.

Attachment 2 – Project Justification Project 1 – Bay Area AQPI System
Bay Area Regional Climate Change Preparedness Program Att. 2-20 2015 IRWM Implementation Grant Application
D. Direct Water-Related Benefit to a Disadvantaged Community (DAC)
The Bay Area AQPI system will assist regional flood-protection and water supply managers in ensuring that DACs and the entire region are adequately protected against effects of climate change. The AQPI system will provide early warnings and lead time for emergency response agencies to act and protect private property and public safety.
This project would serve all the DACs in the San Francisco Bay region. However, the total area of DACs in the region is less than 25% by population and geography.
The project team is working closely with water-supply and flood-control managers who directly manage resources and public safety protection for all of the DACs in the region. Local governments of all flood management and major water supply agencies in the Bay Area IRWM region are participating in the AQPI system. The data generated by this effort will benefit all DACs identified in DWR’s DAC Mapping Tool.
Many of the Bay Area’s DACs are located along low lying areas around the edge of the bay (East Palo Alto, Richmond, Redwood City, etc.), and these populations will benefit from early warning on flood issues. As is discussed for the San Francisquito Creek Flood Protection and Ecosystem Restoration Project (Project 6 of this grant proposal), DAC populations around the Bay Area are prone to flooding under storm conditions. This project will provide a higher level of precipitation data quality and advanced storm warnings, including coastal flooding and storm surge conditions in low lying DAC areas, to allow individuals and emergency service personnel to respond appropriately to protect the property and public health of DACs in the region.

Attachment 2 – Project Justification Project 1 – Bay Area AQPI System
Bay Area Regional Climate Change Preparedness Program Att. 2-21 2015 IRWM Implementation Grant Application
E. Project Performance Monitoring Plan
PSP Table 6 – Project Performance Monitoring Plan
Project 1 – Bay Area AQPI System
Proposed Physical Benefits Targets or Milestones Measurement Tools and Methods Evaluation
Reduced property damage due to flooding
By year 4, the AQPI system will have the flood warning information, such as through a website and phone application, available to residents and businesses in the 100-year floodplain (user interface), residents will be able to track storms and potential high-risk flood areas.
Number of members of the general public who have accessed the precipitation warning websites and/or downloaded the phone application (user interface).
Post flooding surveys by emergency managers and/or FEMA benchmarked against previous flooding events. Increase in the number of website visits and/or application users over time in response to storm events.
Increased water supply By year 4, 25% of reservoir flood-pool made available for conservation purposes using AQPI information
Reports by water agencies on reservoir water-levels during the dry season
Review of water agency reports and evaluation of results before and after AQPI
More water for fish in streams with reservoirs
Achieve minimum flow requirements for fish habitat during the dry season
California Department of Fish and Wildlife reports
Interviews with California Department of Fish and Wildlife and National Marine Fisheries Service staff.

Attachment 2 – Project Justification Project 1 – Bay Area AQPI System
Bay Area Regional Climate Change Preparedness Program Att. 2-22 2015 IRWM Implementation Grant Application
F. Cost-Effectiveness Analysis
PSP Table 7 evaluates whether the physical benefits provided by the project are provided at the least possible costs.
PSP Table 7 – Cost-Effectiveness Analysis Project name: Project 1 - Bay Area AQPI System
Question 1 What are the types of benefits provided? Explain in as much detail as possible: Actions after flood warning that yield direct tangible benefits include the following (from USACE 1994): Moving property to a safe elevation within the floodplain - Residents and businesses
occupying multi-story buildings may have the opportunity to protect moveable property by relocating it from basements and ground floors to higher levels.
Temporary flood-proofing - Warnings issued with sufficient mitigation time will allow property owners to temporarily flood-proof property, for example, with temporary closures of windows and doors, and using sand bags.
Opportune maintenance - A warning system can provide officials and individuals with more time to undertake opportune maintenance, such as closing a shut-off valve on a gas line or safeguarding water supplies and sewage treatment plants.
Early notification of emergency services - Increased warning time can reduce the cost of emergency shelter and emergency care, as individuals have more time to arrange to stay elsewhere. The cost of public assistance and long-term emergency shelter for evacuees can be reduced if these evacuees have time to secure their property and prepare before evacuation. Communities with limited emergency personnel and other resources will benefit from additional time to ready emergency services.
Orderly disruption of network systems - Warning and response systems offer opportunities for network systems (phone systems, utilities, pipelines, cable TV services, transportation patterns and traffic levels, and local area networks) to prepare for disruption in a more orderly and cost-effective manner. With sufficient warning time, businesses may make alternative plans for their network services.
Suspension of sensitive works - For products with lengthy production processes, sufficient warning time may provide the opportunity to suspend production processes in order to minimize the destruction of the product or minimize the possibility of hazardous materials seeping into the waterways. Similarly, sufficient warning may allow crews to sequence repair work in a way that minimizes disruption to a utility.
Related effects of emergency cost, cleanup cost, and business losses - Warning systems may reduce emergency costs and cleanup costs by allowing emergency responders and residents to take preventive actions. Similarly, warning systems may allow for reduced unemployment and income loss, smaller losses in sales, and smaller reductions in taxes collected by increasing the chances of a quick recovery. Also, the cost for flood insurance may be reduced as warnings result in decreases in the amount of coverage required by residents and businesses.
Traffic control - Advance flood warning may provide the opportunity for authorities to decide which roads to close and which to keep open before flooding begins. Traffic can be re-routed in a more efficient manner, and personnel can be deployed in a timely manner to block access to potentially dangerous areas as well as to direct traffic on detour routes.
Actions after heavy precipitation warning, or forecast of little-to-no rain, allow reservoir operators to adopt a management strategy that uses data from watershed monitoring programs and improved weather and water forecasting to help water managers selectively retain or release water from reservoirs in a flexible manner that more accurately reflects prevailing and anticipated conditions. Forecast-based operations represents an innovative use of emerging science and technology to optimize limited resources and relieve potential impacts of climate change without building expensive new reservoir infrastructure. The goal of FBO is to enable modest adjustments from standard flood-control guidelines when there is minimal risk of adverse impacts of such deviations to improve water supply and environmental outcomes without diminishing flood

Attachment 2 – Project Justification Project 1 – Bay Area AQPI System
Bay Area Regional Climate Change Preparedness Program Att. 2-23 2015 IRWM Implementation Grant Application
protection or dam safety. Examples where FBO can have tangible benefits include: Drought-mitigation scenario - When recent storms have caused moderately high reservoir
levels but no major precipitation is predicted for several days, water is retained at higher levels than currently allowed (unless a new storm appears before spring refill) to provide adequate supplies during the summer.
Flood mitigation scenario - When a storm is predicted to be intense enough to risk flooding, water could be released from the reservoir to lower reservoir levels than currently allowed, with confidence that the storm will refill the reservoir.
Ecosystem benefits - When increased reservoir storage, and the timing and volume of releases can improve water quality conditions and reliable stream flow for ESA-listed salmonids.
Question 2 Have alternative methods been considered to achieve the same types and amounts of physical benefits as the proposed project? If yes, list the methods (including the proposed project) and estimated costs. Yes, alternative methods have been considered, but AQPI represents the most technologically advanced and suitable approach to achieve improved rainfall forecasting for flood protection and water supply planning purposes for the Bay Area region. Existing satellite and radar-tower data systems are not adequate to provide the temporal or spatial resolution necessary for flood management and water supply planning, as compared to the AQPI system. The existing data systems lack the specificity for, and have limited ability to do, any meaningful forecasting, and they have several geographic gaps. The AQPI system will address current geographic and data gaps, will provide higher-resolution temporal and spatial specificity, and will provide enhanced forecasting ability. In terms of cost and relative value, one large winter storm surge in the Bay Area could have damages well in excess of the cost of the AQPI system ($26,450,000). Recently, in December 2014, a much-anticipated storm, hailed as the “storm of the century,” resulted in several preparations, including the closure of several schools throughout the Bay Area region. However, the storm was not as large as forecast, particularly in the central and south Bay Area. Much time and money was wasted on unnecessary advanced planning. The AQPI system will provide better information and spatial resolution for more accurate planning in such situations.
For water supply, the “do-nothing” alternate would involve continuation of reservoir operations policies that require release of flood waters that could be reserved to enhance water supply, even when there are highly reliable forecasts of no rain. Flood control managers are understandably wary of filling a reservoir until they are certain that another major storm will not arrive. As a result, California reservoirs often enter the dry season only partially filled. If water managers had more accurate information about upcoming storms (or lack of storms), they could adjust water levels in reservoirs to maximize both water supply and flood-control functions with greater confidence.
Question 3 Is the proposed project the least-cost alternative? The least-cost alternative is to do nothing and continue operating the existing data systems. Doing nothing and waiting for a future time in which to invest in improved data systems will not address the Bay Area’s current water-resources emergency response and planning needs. The AQPI system represents a great improvement over the least-cost alternative (doing nothing), providing improved data- and decision-making that results in tangible benefits for flood management and water supply. The radar and monitoring network proposed is the minimum necessary to achieve the goals of up to 12 hours of advanced warnings. The AQPI data systems and user interface tasks are the minimum necessary to ensure that data is processed quickly and accurately and is conveyed to the widest range of users.

Attachment 2 – Project Justification Project 1 – Bay Area AQPI System
Bay Area Regional Climate Change Preparedness Program Att. 2-24 2015 IRWM Implementation Grant Application
G. References Cited:
DWR (California Department of Water Resources). 2009. California Water Today. p. 71-134. http://www.ppic.org/content/pubs/report/R_211EHChapter2R.pdf.
DWR (California Department of Water Resources). 2010. Economic Analysis Guidelines - Flood Risk Management. 89 p. May. http://www.water.ca.gov/economics/guidance.cfm.
DWR (California Department of Water Resources). 2013a: Flood Future Report I. California’s Flood Future: Recommendations for Managing the State’s Flood Risk. 152 p. November. http://www.water.ca.gov/sfmp/resources/California_Flood_Future.pdf.
DWR (California Department of Water Resources). 2013b. Final California Water Plan Update 2013, Volume 3 - Resource Management Strategies, Chapter 7- System Reoperation. 20 pgs. http://www.waterplan.water.ca.gov/cwpu2013/final/index.cfm
MBK Engineers. 2014. System Reoperation Study Forecast-Based Operations Analysis. Technical Report. Draft. Prepared for Department of Water Resources.
Johnson LE. 2015. Reservoir Forecast-Based Operations Simulation Model - Lake Mendocino Case Study. Internal Report to Sonoma County Water Agency. February.
Johnson LE, Cifelli R, White A. 2015. Benefits of an Advanced Quantitative Precipitation Information System: San Francisco Bay Area Case Study. NOAA Technical Memorandum PSD-315, NOAA Printing Office, Silver Spring, MD, 59 p. http://dx.doi.org/10.7289/V5WS8R6X. http://docs.lib.noaa.gov/noaa_documents/OAR/PSD/TM_OAR_PSD_315.pdf.
USACE (U.S. Army Corps of Engineers). 1994. Framework for estimating national economic development benefits and other beneficial effects of flood warning and preparedness systems. Institute for Water Resources, Alexandria, Va. Report 94-R-3. http://planning.usace.army.mil/toolbox/library/IWRServer/94-R-3.pdf.
Attachment 2 – Project Justification
Bay Area Regional Climate Change Preparedness Program Att. 2-25 2015 IRWM Implementation Grant Application
PROJECT 2 – ANDERSON DAM SEISMIC RETROFIT PROJECT
A. Project Description
Project Need and Goals: With a total storage capacity of 90,373 acre-feet (AF), Anderson Reservoir is the largest of the ten Santa Clara Valley Water District (SCVWD) reservoirs. The reservoir was designed for water supply purposes, but it also provides 1) flood protection benefits, through reservoir operating rules that reduce the likelihood of flooding, 2) recreational benefits, through activities such as boating and fishing, and 3) environmental benefits, through providing suitable water flows and temperatures for aquatic habitats and protected species.
A seismic stability evaluation performed in 2007 indicated that the downstream and upstream embankments and intake and outlet structures of Anderson Reservoir could become unstable during a very large magnitude earthquake (AMEC June 2011, Anderson Dam Seismic Stability Evaluation Report (SSE-1A), prepared for Santa Clara Valley Water District). In response to these findings, the SCVWD initiated the Anderson Dam Seismic Retrofit Project (ADSRP) to seismically retrofit the dam. SCVWD also implemented a water storage elevation restriction in 2008 to protect the public against uncontrolled release of water in the event of a major earthquake or major flood event until the ADSRP is complete. Currently, the dam is being operated at a restricted capacity of 61,810 AF, or 68% of total capacity, which decreases SCVWD’s flexibility to move water in from the San Felipe Division of the Central Valley Project (CVP) early in the year to manage anticipated late-summer water quality issues, carry water over from one year to the next, and adapt to anticipated increases in extreme events due to climate change. The restriction also reduces SCVWD’s potential to operate the Anderson Hydroelectric Facility located downstream from the dam and reduces boating capacity on the reservoirs. The estimated average annual water supply impact from the restriction is 4,779 AF, based on decreases in water supply to drinking water treatment plants (WTPs) and groundwater recharge facilities. In addition, the reduced storage capacity reduces fishery flows for steelhead trout in Coyote Creek downstream of the reservoir.
The project goal is to restore full operating capacity to Anderson Reservoir by: Seismically retrofitting the dam to safely withstand the maximum credible earthquake (MCE), which the United
States Bureau of Reclamation defines as “the largest hypothetical earthquake that may be reasonably expected to occur along a given fault or [that another] seismic source could produce under the current tectonic setting.”
Raising the dam crest and spillway walls to safely pass the probable maximum flood (PMF) event without risk of dam overtopping or failure. The PMF is the flood that may be expected to occur from the most severe combination of critical meteorological and hydrologic conditions that are reasonably possible in a particular drainage area.
Project Description:
The ADSRP includes construction of the following elements: - Embankment seismic remediation consisting of partial removal and replacement of liquefiable materials on the
upstream and downstream sides of the dam, together with the addition of stabilizing buttresses. - Construction of a new or modified intake structure for the outlet works. - A new low-level intake to accommodate potential fault offsets. - A new high-level intake to provide emergency drawdown capabilities as required for dam safety. - Raising the dam crest and spillway walls to safely accommodate the probable maximum flood event.
The project also includes construction staging areas, spoils disposal areas, and an on-site material mining area to generate the rock needed for the new embankments and buttresses. Construction of the project will require that the reservoir be dewatered and public recreation areas be temporarily closed. Project construction is anticipated to begin in 2017, and take approximately three years to complete. The project is anticipated to be complete in 2020.
Anticipated Physical Benefits/Intended Outcomes: The ADSRP will enable SCVWD to operate Anderson Reservoir at its full capacity of 90,373 AF, resulting in increased water supply yield, additional environmental flows, operational flexibility, and drought preparedness.
Regional Applicability: The reservoir is a key component of the SCVWD’s water supply system, which serves more than 1.8 million people and supports the heart of Silicon Valley.
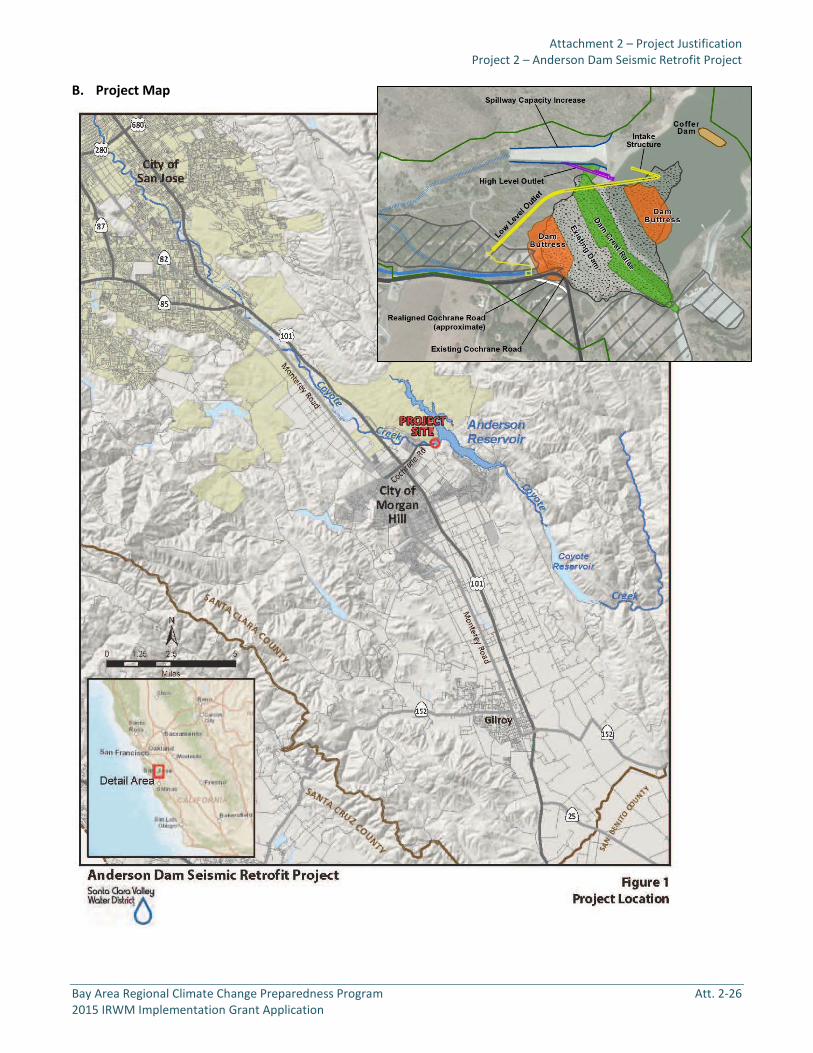
Attachment 2 – Project Justification Project 2 – Anderson Dam Seismic Retrofit Project
Bay Area Regional Climate Change Preparedness Program Att. 2-26 2015 IRWM Implementation Grant Application
B. Project Map

Attachment 2 – Project Justification Project 2 – Anderson Dam Seismic Retrofit Project
Bay Area Regional Climate Change Preparedness Program Att. 2-27 2015 IRWM Implementation Grant Application
C. Project Physical Benefits
Primary and secondary project physical benefits are summarized in PSP Tables 5a and 5b, respectively, below.
PSP Table 5a - Primary Annual Project Physical Benefits Project Name: Project 2 - Anderson Dam Seismic Retrofit Project Type of Benefit Claimed: Water Supply Produced Units of the Benefit Claimed: Acre-feet per year Additional Information About This Benefit: This benefit describes SCVWD’s average annual deliveries to drinking water treatment plants and groundwater recharge facilities without the project and with the project. The lack of without-project benefits in years 2017 through 2020 is the result of reservoir dewatering for construction. Anticipated Useful Life of Project (years): 50 years
Year Physical Benefits
Without Project With Project Change Resulting from Project 2017 0 0 0 2018 0 0 0 2019 0 0 0 2020 0 0 0 2021 243,330 248,108 4,779
Last Year of Project Life (approximately 2070)
243,330 248,108 4,779
Comments: The physical benefits for the project begin in 2021, the first full year after the project is completed, and represent the estimated average annual water supply produced based on modeling SCVWD’s water supply system operations without and with the project. (See Anderson Modeling Results, “Water Supply Benefits Summary” tab.)
PSP Table 5b - Secondary Annual Project Physical Benefits Project Name: Project 2 - Anderson Dam Seismic Retrofit Project Secondary Benefit Claimed: Fishery Benefits Units of the Benefit Claimed: Cubic feet per second (cfs) Additional Information About This Benefit: This benefit describes the stream flows below Anderson Reservoir without and with the project. The lack of without-project benefits in years 2017 through 2020 is the result of reservoir dewatering for construction. Anticipated Useful Life of Project (years): 50 years
Year Physical Benefits
Without Project With Project Change Resulting from Project 2017 0 0 0
2018 0 0 0
2019 0 0 0
2020 0 0 0
2021 21.7 24.2 2.5 cfs annual increase in flows to support fisheries in Coyote Creek
Last Year of Project Life (approximately 2070)
21.7 24.2 2.5 cfs increase in flows to support fisheries in Coyote Creek
Comments: The physical benefits for the project begin in 2021, the first full year after the project is completed, and represent the estimated average stream flow in Coyote Creek approximately 5.5 miles downstream of Anderson Dam at Coyote Creek Golf Drive based on modeling SCVWD’s water supply system operations without and with the project. (See Anderson Modeling Results, “Fish Flow Benefits Summary” tab.)

Attachment 2 – Project Justification Project 2 – Anderson Dam Seismic Retrofit Project
Bay Area Regional Climate Change Preparedness Program Att. 2-28 2015 IRWM Implementation Grant Application
Technical Analysis of Primary and Secondary Physical Benefits Claimed
1. Explanation of the need for the project, including recent and historical conditions that provide background for benefits to be claimed.
Anderson Dam was constructed by the SCVWD in 1950. From 1987 to 1989, the dam underwent updates that included adding a small hydroelectric plant, raising the crest of the dam, and modifying the spillway. The existing dam is approximately 240 feet tall and has the potential to retain approximately 90,373 acre-feet of water. The reservoir is SCVWD’s largest surface water reservoir and has more capacity than the other nine reservoirs combined. Anderson Reservoir can be used to store local runoff as well as water delivered from San Luis Reservoir through the San Felipe Division of the CVP. In addition, the reservoir can deliver water to all three of SCVWD’s drinking water treatment plants and groundwater recharge facilities throughout the county. Finally, the reservoir can be used to carry water over from one year to the next to provide supply for droughts and other water shortages. As such, Anderson Reservoir is a critical water supply facility for Santa Clara County. The reservoir also provides storage for releases into Coyote Creek to support steelhead trout, recreation, and flood protection.
In 2008 and 2009, the SCVWD performed a seismic stability study and conducted extensive field explorations, laboratory testing, and engineering analyses at the dam (AMEC 2011a). The study concluded that the downstream and upstream slopes of dam, and the dam crest, could be unstable in a large-magnitude earthquake and could experience large deformations and slumping due to the presence of poorly compacted, liquefiable soil layers including: a) a 5-to-10-foot-thick layer of weak fill material at the bottom of the downstream dam shell; and b) weak alluvial material under portions of the upstream shell. These weak soil layers are susceptible to a loss in strength when subjected to severe seismic shaking.
These findings were discussed with the California Division of Safety of Dams (DSOD) and the Federal Energy Regulatory Commission (FERC). SCVWD, DSOD, and FERC are coordinating closely on the project to ensure that public safety is protected until the dam can be retrofitted. Since December 2008, Anderson Dam and Reservoir has been operating under a water level restriction; water levels in the reservoir are currently restricted to 37 feet below the spillway, or about 68% of capacity. This loss in water storage capacity reduces the water supply benefits associated with the reservoir because SCVWD is not able to store more water for deliveries to drinking water treatment plants and groundwater recharge facilities. The loss in water storage capacity also reduces SCVWD’s ability to provide fishery flows in Coyote Creek. Seismically retrofitting Anderson Dam so it can be operated at full capacity will have a significant impact on SCVWD’s long-term water supply reliability and ability to strategically respond to drought and climate change challenges to meet water supply demands.
2. Explanation of estimates of the without-project conditions (e.g., the levels of the physical benefits in the future, without the project, but with other planned projects).
SCVWD estimated the without-project benefits using its water supply system model (WEAP). WEAP simulates local water supply system conditions over an 82-year hydrologic period (1922–2003) based on imported water allocations estimated by DWR through their most recent delivery capability/reliability report, local runoff and natural recharge, projected demands, projected recycled water use, existing and planned facilities, and planned operations. For this analysis, in order to capture fishery flow benefits as well as water supply benefits, SCVWD used recently completed model results that evaluated changes in water supply and stream flow conditions resulting from implementation of revised reservoir operations associated with implementing the SCVWD Fisheries and Aquatic Habitat Collaborative Effort (FAHCE) (SCVWD 2015). To estimate the without-project conditions, the ADSRP trigger was turned off and the model was executed. The without project WEAP modelin gresults are shown in the benefits table above.
Primary Benefit. The water supply benefits produced by the ADSRP include deliveries to drinking water treatment plants and supply delivered to groundwater recharge facilities (SCVWD 2015). The WEAP modeling results for the water supply benefits of the ADSRP are summarized in the Table 5c below. The model added the average annual supply deliveries to treatment plants and recharge facilities, for a total of 243,330 acre-feet per year (AFY) average water supply produced without the project (row 71 in Table 5c below).
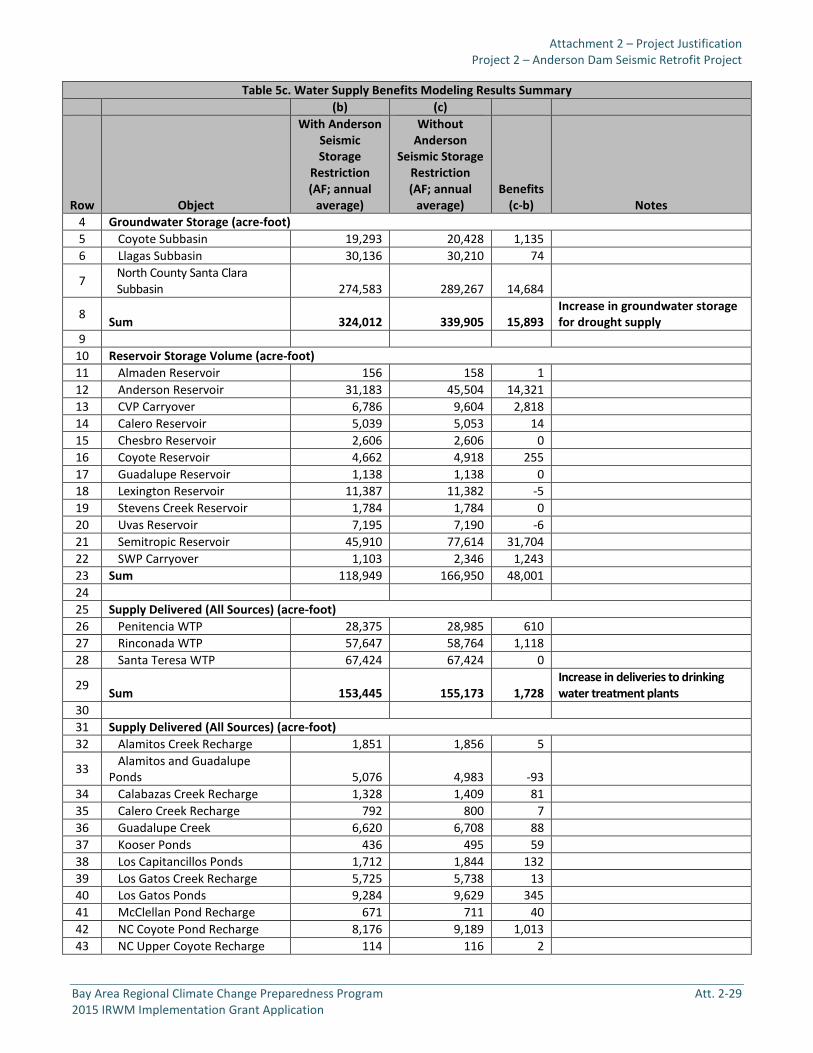
Attachment 2 – Project Justification Project 2 – Anderson Dam Seismic Retrofit Project
Bay Area Regional Climate Change Preparedness Program Att. 2-29 2015 IRWM Implementation Grant Application
Table 5c. Water Supply Benefits Modeling Results Summary (b) (c)
Row Object
With Anderson Seismic Storage
Restriction (AF; annual
average)
Without Anderson
Seismic Storage Restriction (AF; annual
average) Benefits
(c-b) Notes 4 Groundwater Storage (acre-foot) 5 Coyote Subbasin 19,293 20,428 1,135 6 Llagas Subbasin 30,136 30,210 74
7 North County Santa Clara Subbasin 274,583 289,267 14,684
8 Sum 324,012 339,905 15,893 Increase in groundwater storage for drought supply
9 10 Reservoir Storage Volume (acre-foot) 11 Almaden Reservoir 156 158 1 12 Anderson Reservoir 31,183 45,504 14,321 13 CVP Carryover 6,786 9,604 2,818 14 Calero Reservoir 5,039 5,053 14 15 Chesbro Reservoir 2,606 2,606 0 16 Coyote Reservoir 4,662 4,918 255 17 Guadalupe Reservoir 1,138 1,138 0 18 Lexington Reservoir 11,387 11,382 -5 19 Stevens Creek Reservoir 1,784 1,784 0 20 Uvas Reservoir 7,195 7,190 -6 21 Semitropic Reservoir 45,910 77,614 31,704 22 SWP Carryover 1,103 2,346 1,243 23 Sum 118,949 166,950 48,001 24 25 Supply Delivered (All Sources) (acre-foot) 26 Penitencia WTP 28,375 28,985 610 27 Rinconada WTP 57,647 58,764 1,118 28 Santa Teresa WTP 67,424 67,424 0
29 Sum 153,445 155,173 1,728 Increase in deliveries to drinking water treatment plants
30 31 Supply Delivered (All Sources) (acre-foot) 32 Alamitos Creek Recharge 1,851 1,856 5
33 Alamitos and Guadalupe Ponds 5,076 4,983 -93
34 Calabazas Creek Recharge 1,328 1,409 81 35 Calero Creek Recharge 792 800 7 36 Guadalupe Creek 6,620 6,708 88 37 Kooser Ponds 436 495 59 38 Los Capitancillos Ponds 1,712 1,844 132 39 Los Gatos Creek Recharge 5,725 5,738 13 40 Los Gatos Ponds 9,284 9,629 345 41 McClellan Pond Recharge 671 711 40 42 NC Coyote Pond Recharge 8,176 9,189 1,013 43 NC Upper Coyote Recharge 114 116 2

Attachment 2 – Project Justification Project 2 – Anderson Dam Seismic Retrofit Project
Bay Area Regional Climate Change Preparedness Program Att. 2-30 2015 IRWM Implementation Grant Application
Table 5c. Water Supply Benefits Modeling Results Summary (b) (c)
Row Object
With Anderson Seismic Storage
Restriction (AF; annual
average)
Without Anderson
Seismic Storage Restriction (AF; annual
average) Benefits
(c-b) Notes 44 Overfelt Ponds 872 1,021 149 45 Penitencia Creek Recharge 1,284 1,197 -87 46 Penitencia Ponds 1,482 1,735 254 47 Regnart Creek Recharge 384 408 24 48 Rodeo Creek Recharge 396 420 24 49 Ross Creek Recharge 847 927 80 50 San Tomas Creek Recharge 693 732 39 51 Saratoga Creek Recharge 2,942 3,124 181 52 Silver Creek Recharge 569 569 0 53 Stevens Creek Recharge 2,726 2,726 0 54 Thompson Creek Recharge 438 438 0 55 Wildcat Creek Recharge 440 465 25 56 Lower Coyote Recharge 1,026 1,172 146
57 Sum 55,883 58,412 2,529
Increase in supply delivered to Santa Clara Plain ground-water recharge facilities
58 59 Supply Delivered (All Sources) (acre-foot) 60 Coyote Upper Recharge 6,369 6,517 147 61 Coyote Upper Recharge 2 7,515 7,577 61
62 Sum 13,884 14,093 209
Increase in supply delivered to Coyote Valley ground-water recharge facilities
63 64 Supply Delivered (All Sources) (acre-foot) 65 Madrone Ponds 7,164 7,375 212 66 Main Ave Ponds 2,397 2,475 79 67 San Pedro Ponds 2,080 2,092 12 68 Uvas Recharge 8,477 8,488 11
69 Sum 20,117 20,430 314
Increase in supply delivered to Llagas Subbasin ground-water recharge facilities
70
71
Total Supply Delivered to Drinking Water Treatment Plants and Recharge Facilities (Sum of Rows 29+57+62+69) 243,330 248,108 4,779
Average annual water supply benefits from increased deliveries to water treatment plants and recharge facilities
72 73 Key Assumptions 74 Project triggers\ADSRP 0 1
75 Project triggers\FAHCE Scenario 2 2 FAHCE Reservoir Operations Rule Curve, with CVP to Anderson

Attachment 2 – Project Justification Project 2 – Anderson Dam Seismic Retrofit Project
Bay Area Regional Climate Change Preparedness Program Att. 2-31 2015 IRWM Implementation Grant Application
Secondary Benefit. The fishery benefits include flows in Coyote Creek downstream of Anderson Dam, specifically at the downstream end of the coldwater management zone of Coyote Creek, are identified in the FAHCE modeling effort (SCVWD 2015). This is the area where SCVWD will make releases from Anderson Dam to provide coldwater habitat for steelhead trout. The WEAP modeling results are summarized in Table 5d below, in row 14. The flow rate in Coyote Creek at the end of the coldwater management zone is approximately 21.7 cubic feet per second (cfs) without the project.
Table 5d. Fishery Flow Benefits Modeling Results Summary (b) (c)
Row Object
With Anderson
Seismic Storage
Restriction (cfs;
average)
Without Anderson
Seismic Storage
Restriction (cfs;
average)
Average Annual
Benefits (c-b) (cfs) Notes
5 Streamflow (below node or reach listed) (River: Coyote Creek Div) (Acre-foot) 6 0 \ Headflow 29.0 32.6 3.6 7 1 \ local anderson res 29.0 32.6 3.6 8 3 \ Anderson Minimum Flow 29.0 32.6 3.6 9 5 \ cvp diversion to coyote cr Inflow 29.0 32.6 3.6 10 7 \ cvp to coyote ck div Return 30.5 33.2 2.7 11 9 \ FAHCE Anderson Reservoir Operations 30.5 33.2 2.7 12 11 \ local release 2 upper coyote 21.7 24.2 2.5 13 13 \ FAHCE 10 cfs 21.7 24.2 2.5
14 15 \ FAHCE Anderson Coyote Creek Golf Dr 21.7 24.2 2.5
This represents flow in Coyote Creek near the downstream end of the coldwater management zone. These represent a relative difference in controlled flows (no spillway flows included).
15 17 \ lower coyote ds accretion Inflow 26.8 29.4 2.5 16 19 \ Coyote Upper Recharge 2 Withdrawal 16.4 18.9 2.5 17 21 \ local 2 coyote pond recharge 16.4 18.9 2.5 18 23 \ local anderson 2 coyote ponds 5.1 6.2 1.1 19 25 \ local 2 upper coyote 5.0 6.0 1.1 20 27 \ local release 2 ford ponds 5.0 6.0 1.1 21 29 \ local 2 lower coyote recharge 3.6 4.4 0.9 22 31 \ Silver Creek Inflow 4.0 4.8 0.9 23 33 \ Penitencia Creek Inflow 5.1 6.0 0.9 24 35 \ FAHCE Coyote Creek Flow to Bay 5.1 6.0 0.9 25 26 Key Assumptions 27 Project triggers\ADSRP 0 1
28 Project triggers\FAHCE Scenario 2 2 FAHCE Reservoir Operations Rule Curve, with CVP to Anderson
3. Description of the methods used to estimate the primary and secondary physical benefits.
SCVWD estimated the with-project benefits using the same WEAP modeling method that it used to estimate the without-project benefits, except that the ADSRP trigger was turned on (SCVWD 2015).
Attachment 2 – Project Justification Project 2 – Anderson Dam Seismic Retrofit Project
Bay Area Regional Climate Change Preparedness Program Att. 2-32 2015 IRWM Implementation Grant Application
Primary Benefit. The water supply benefits of the project include deliveries to drinking water treatments and supply delivered to groundwater recharge facilities. The results are summarized in Table 5c, row 71 above. The WEAP model added the average annual deliveries to treatment plants and recharge facilities, for a total of 248,108 AFY average water supply produced with the project (SCVWD 2015; Table 5c, row 71).
Secondary Benefit. The fishery benefits include flows in Coyote Creek downstream of Anderson Dam, specifically at the downstream end of the coldwater management zone of Coyote Creek identified in the FAHCE modeling effort (SCVWD 2015). The results are summarized in Table 5d, row 14 above. The flow rate in Coyote Creek at the end of the coldwater management zone is approximately 24.2 cfs with the project.
4. Identification/description of all new facilities, policies, and actions required to obtain the physical benefits, e.g., any City policies or procedures that need to be established in order for the benefits to be realized.
No new policies are needed to achieve the physical benefits. The project would be constructed mainly on SCVWD-owned property. However, the following actions are required to complete the project:
To allow for the construction of a downstream buttress, permanent right-of-way would be required to accommodate realignment of Cochrane Road around the buttress.
DSOD and FERC must approve the final constructed project before operation can commence. The reservoir will need to be dewatered and public recreation temporarily closed.
In addition, as stated above, the project requires construction of the following new/improved facilities:
Embankment seismic remediation consisting of partial removal and replacement of liquefiable materials on the upstream and downstream sides of the dam, together with the addition of stabilizing buttresses.
Construction of a new or modified intake structure for the outlet works. A new low-level intake to accommodate potential fault offsets. A new high-level intake to provide emergency drawdown capabilities as required for dam safety. Raising the dam crest and spillway walls to safely accommodate the probable maximum flood event.
5. Description of potential adverse physical effects and what is being done to mitigate those impacts.
The project is in the design phase, and CEQA compliance is in progress. However, the initial study (SCVWD 2013) for the project identified the following potentially significant impacts (page numbers as indicated):
Aesthetics: Potential short- and long-term aesthetic impacts may occur due to raising of the dam crest and dewatering of the reservoir (p. 21–22)
Conversion of prime farmland or agricultural use due to the downstream embankment (p. 24) Short-term adverse air quality impacts due to project construction (p. 26). Short-term adverse impacts to Coyote Creek, and associated fisheries, habitat, and water quality due to
dewatering and project construction (p. 30, 32, 48–50) Permanent impacts on a short reach of Coyote Creek due to the construction of the downstream buttress.
The area permanently impacted is concrete-lined channel. (p. 30). Temporary loss and disturbance of wetlands and aquatic habitat due to reservoir dewatering and project
construction (p. 31). Impacts to a pallid bat maternity colony, located in a nearby barn, that may be temporarily or permanently
affected by project construction. (p. 32–33) Permanent impacts to trees, including ordinance-sized trees (p. 33) Cultural, historic, and archeological resources may be impacted by project construction; most notably, a
designated historic landmark and its structures may be permanently impacted due to the construction of the new downstream buttress. (p. 34–36).
The Anderson Reservoir rim is subject to landslides under existing conditions; drawdown of the reservoir may exacerbate this existing condition. (p. 39–40)
Greenhouse gas emissions due to construction are expected (p. 42) Naturally occurring asbestos in known to be present in soils within the project area. Exposure to airborne
asbestos could adversely affect human health (p. 45). Adverse noise impacts due to construction are anticipated (p. 54–55). Temporary restriction of recreational activities at the reservoir during project construction (p. 53).

Attachment 2 – Project Justification Project 2 – Anderson Dam Seismic Retrofit Project
Bay Area Regional Climate Change Preparedness Program Att. 2-33 2015 IRWM Implementation Grant Application
6. Description of whether the proposed project effectively addresses long-term drought preparedness goals.
a. Promote water conservation, conjunctive use, reuse, and recycling: Anderson Reservoir is a critical component of SCVWD’s conjunctive management system. It stores local runoff and imported supplies conveyed through San Luis Reservoir for use for groundwater recharge and drinking water treatment plant supply. These supplies can be used in the current year or carried over for use in future years, depending on the availability of other sources of supply. The modeling analysis shows an increase in average Anderson Reservoir storage of about 14,000 AF from the without-project to the with-project condition (SCVWD 2015; Table 5c, row 12). Similar increases are seen in CVP carryover (Table 5c, row 13), Semitropic groundwater bank storage (Table 5c, row 21), and State Water Project carryover (Table 5c, row 22), all of which also provide drought supplies and contribute to SCVWD’s ability to conjunctively use its supplies.
Anderson Reservoir is also connected to the San Felipe Division of the CVP and can be used to store supplies conveyed through San Luis Reservoir via the Santa Clara Conduit to the reservoir’s force main. For example, in 2014 and 2015, SCVWD stored imported water supplies in Anderson Reservoir during the spring for use later in the summer and fall when drought-related water supply and/or water quality conditions in the Delta or San Luis Reservoir may limit use of those sources. Restoration of the full operational capacity of Anderson Reservoir will improve SCVWD’s conjunctive management opportunities.
b. Improve landscape and agricultural irrigation efficiencies: Not applicable.
c. Achieve long-term reduction of water use: Not applicable.
d. Efficient groundwater basin management: SCVWD recharges the Santa Clara (Santa Clara Plain and Coyote Valley management areas) and Llagas groundwater subbasins with local and imported water sources. Releases from Anderson Reservoir are a significant source of recharge in the Santa Clara subbasin. With Anderson Reservoir operating at a reduced capacity, SCVWD is unable to maximize releases for groundwater recharge, resulting in low groundwater levels. The ADSRP WEAP modeling analysis shows that groundwater levels throughout the county (Table 5c, rows 5, 6, and 7) are higher by approximately 16,000 AF when Anderson Reservoir is operated at full capacity.
e. Establish system interties: Anderson Reservoir is an integral part of the SCVWD water supply system, and is tied to their water distribution system and San Luis Reservoir through the San Felipe Division of the CVP. Currently, the district is limited in its ability to simultaneously deliver water from Anderson Reservoir to multiple locations (i.e., groundwater recharge, water treatment facilities, hydroelectric facility, Anderson Force Main, etc.). The project includes replacement of the intake structure at the dam. After project completion, SCVWD will have the ability to deliver water from Anderson Reservoir to simultaneously meet water demands in multiple locations, including groundwater recharge and water treatment facilities. This flexibility will allow the district to maximize beneficial use of water within Anderson Reservoir, including imported water, and reduce water waste due to limited operational scenarios.
f. Solutions that yield a new water supply, such as seawater desalination: Not applicable. The ADSRP would restore full operational capacity of an existing water supply facility.
References Cited for Project Benefits
AMEC Geomatrix. 2011a. “Seismic Stability Evaluation Report (SSE-1A, Seismic Stability Evaluation of Anderson Dam.” June 2011.
Santa Clara Valley Water District. 2013. “Anderson Dam Seismic Retrofit Project, FERC Project 5737, Initial Study.” August 2013.
Santa Clara Valley Water District. 2015. “Anderson Dam WEAP Modeling Results.” July 2015. Excel spreadsheet with WEAP modeling results will be provided upon request.

Attachment 2 – Project Justification Project 2 – Anderson Dam Seismic Retrofit Project
Bay Area Regional Climate Change Preparedness Program Att. 2-34 2015 IRWM Implementation Grant Application
D. Direct Water-Related Benefit to a DAC
Disadvantaged communities (DAC) located within the SCVWD service area, as identified in DWR’s DAC Mapping Tool, include several DAC block groups, tracts, and places located in Santa Clara County and in Monterey County (a different IRWM funding area) that would be affected by flooding resulting from catastrophic failure of Anderson Dam. In comparing DWR’s DAC Mapping Tool against dam failure flood hazard maps, the flood damage area of Anderson Dam includes DACs around the Cities of San Jose, Morgan Hill, Gilroy, and Watsonville. The ADSRP would benefit these identified DAC areas by preventing flood damage caused by dam failure due to a large seismic event.
The project will benefit the DACs in SCVWD’s service area. However, less than 25% of the area served by this project meets the definition of a DAC.

Attachment 2 – Project Justification Project 2 – Anderson Dam Seismic Retrofit Project
Bay Area Regional Climate Change Preparedness Program Att. 2-35 2015 IRWM Implementation Grant Application
E. Project Performance Monitoring Plan
PSP Table 6 – Project Performance Monitoring Plan
Project 2 - Anderson Dam Seismic Retrofit Project Proposed Physical Benefits Targets or Milestones Measurement Tools and Methods Evaluation
Water Supply Produced Deliver at least 248,100 AFY to drinking water treatment plants and groundwater recharge facilities after the project is completed
Measured water deliveries Annual water supply balance reports to document deliveries to drinking water treatment plants and groundwater recharge facilities
Fishery Flows Provide an average flow of 24.2 cfs at Coyote Creek Golf Drive downstream of Anderson Reservoir after the project is completed
Stream flow gauges FAHCE monitoring reports

Attachment 2 – Project Justification Project 2 – Anderson Dam Seismic Retrofit Project
Bay Area Regional Climate Change Preparedness Program Att. 2-36 2015 IRWM Implementation Grant Application
F. Cost-Effectiveness Analysis
PSP Table 7 evaluates whether the physical benefits provided by the project are provided at the least possible costs.
PSP Table 7 – Cost-Effectiveness Analysis Project name: Project 2-Anderson Dam Seismic Retrofit Project
Question 1 What are the types of benefits provided? Explain in as much detail as possible: Anderson Reservoir requires a retrofit and a raised dam crest and spillway to safely withstand the maximum credible earthquake and probable maximum flood events. The ultimate benefit of this project will be increased dam safety and the ability to remove the operating restriction on reservoir storage. Removal of the operating restriction will enable SCVWD to store more water in the reservoir, which will increase the amount of water produced for drinking water treatment supply and groundwater recharge by 4,779 AFY and increase fishery flows downstream of the reservoir by 2.5 cfs (SCVWD 2015).
Question 2 Have alternative methods been considered to achieve the same types and amounts of physical benefits as the proposed project been identified? If yes, list the methods (including the proposed project) and estimated costs. Nineteen (19) conceptual alternatives were considered to address the seismic and PMF deficiencies of Anderson Dam. Seven criteria were used to compare and evaluate the 19 conceptual alternatives: Capital Construction Costs, Construction Risks/Impacts, Project Schedule, Impacts to Reservoir Operations, Quality of the Project/Ease of Construction, Environmental Impacts, and Community & Stakeholder Relations. Following the evaluation, the six highest-scoring alternatives were considered to be the most feasible alternatives and were carried forward for detailed evaluation. These six alternatives were further developed, analyzed, evaluated, and ranked using both deterministic and risk-based approaches. From the quantitative analysis, the alternative that ranked first was the recommended alternative, Alternative 15. For a more detailed description of the alternatives and breakdown of the evaluation, please refer to the HDR’s Feasible Alternative Matrix Report (HDR 2013).
Question 3 Is the proposed project the least cost alternative? Explain why the alternative was selected as the proposed project; why is this the preferred alternative? Explain accomplishments of the project that are different from the alternative project or methods. Yes, the ADSRP is the least-cost alternative. This alternative was selected because it: was the highest ranked alternative in the Feasible Alternatives Matrix Report (HDR 2013) using
deterministic methods and risk-based methods, had the lowest estimated construction cost using conventional deterministic cost estimating
methods, had the lowest risk-based probabilistic cost for both expected (median) and severe overrun
(90th percentile) scenarios, had the least chance of exceeding the targeted project completion date, and was the only
alternative that had a reasonable chance (45%) of meeting SCVWD’s target date for project completion, and
was the only alternative that did not have a significant chance of a delay in project completion beyond 2020.
G. References Cited
HDR Engineering, Inc. 2013. “Feasible Alternatives Matrix, Anderson Dam Seismic Retrofit Project.” Technical Memorandum prepared for Santa Clara Valley Water District. April 4, 2013.
Santa Clara Valley Water District. 2015. “Anderson Modeling Results.” 2 July 2015. Excel spreadsheet provided upon request.

Attachment 2 – Project Justification
Bay Area Regional Climate Change Preparedness Program Att. 2-37 2015 IRWM Implementation Grant Application
PROJECT 3 – MARIN 2020 TURF REPLACEMENT PROJECT
A. Project Description
Project Goals: Marin Municipal Water District (MMWD) has implemented water conservation programs for many decades. The goal of the Marin 2020 Turf Replacement Project is to enhance water supply reliability under immediate and long-term drought conditions by permanently reducing 1) commercial, industrial, and institutional (CII) landscape irrigation demand by 18.1 AF, 2) dry-weather urban water runoff by 1.9 AF, and 3) the discharge of 113 kg of turf-related chemicals each year. Water quality and habitat protection and restoration efforts being implemented elsewhere in Marin County will benefit from the elimination of dry-weather runoff from 10 acres of commercial turf throughout MMWD’s service area. This project is consistent with statewide efforts of the California Urban Water Conservation Council (CUWCC) to develop a new norm for landscapes in California, and seeks to comply with the County of Marin’s Phase II NPDES Stormwater Permit requirements to reduce discharge of chemical contaminants in stormwater runoff.
Project Description: The northern San Francisco Bay region is home to endangered and threatened salmonids, amphibians, and plant species directly impacted by the availability of fresh water flows in Marin and Sonoma County watersheds. From a potable water supply perspective, turfgrass consumes more water than any other landscape plant species and accounts for a significant peak in water demand during months when rainfall is unable to meet plant demand. In addition to the quantity of fresh water, the quality of water in wetland habitat areas is impacted by dry-weather urban runoff containing biological and chemical contaminants detrimental to sensitive species. Much of this dry-weather inflow to habitats occurs as a direct result of landscape irrigation system runoff, especially from turf areas irrigated predominantly by overhead spray- and rotor-type sprinkler technologies. Although well-managed turfgrass in active recreational areas, for example, can be highly functional and have environmental and social benefits, non-functional turfgrass areas do not typically provide the same level of benefit.
The total area of non-functional commercial turf in MMWD’s service area is 80 acres. This project will replace 13% of that area with climate-appropriate landscaping that enhances the urban watershed and significantly reduces potable water consumption and pollution caused by irrigation runoff.
Project implementation will consist of a rebate program that offers CII customers a $2-per-square-foot incentive to replace non-functional turfgrass with beneficial, low-water-demand landscaping. Eligible rebate actions will include installation of native and climate-appropriate plants, drip irrigation system equipment, organic soil amendments, and other materials required for installation of an environmentally sustainable landscape. MMWD staff will administer all elements of the project, including code compliance, technical support, marketing, site inspections, quality control, accounting, and grant administration and reporting.
Anticipated Physical Benefits/Intended Outcomes: Over the 20-year life of the project, this project will result in a savings of 5.9 million gallons (18.1 AF) of potable water annually, contributing to drought resiliency in the region. This benefit will be quantified by amount of water saved (measured as the reduction in use as compared to the average five-year prior period of consumption). The project will provide habitat enhancement benefits by reducing 1.9 million gallons of dry-weather urban runoff and 113 kg of environmentally harmful lawn-care chemicals that now result in negative environmental impacts to wetland areas. This benefit will be quantified by 1) gallons of irrigation water runoff eliminated, and 2) kilograms of chemical nutrients and pesticides eliminated.
Regional Applicability: MMWD receives water primarily from local runoff (75% of supply) and from the Russian River in Sonoma County (25% of supply). By reducing water demand in MMWD’s service area, the project will reduce pressure on local supplies and on Russian River supplies, which support numerous communities in the Sonoma, Napa, and northern Marin counties in the northern portion of the San Francisco Bay IRWM region. The project will improve water supply reliability under immediate and long-term drought conditions by permanently reducing CII landscape irrigation demand by 18.1 AF each year, thereby freeing up 18.1 AF of potable water annually. The project will also contribute to the goal of improving water supply reliability and assist the district in meeting the 20 x 2020 targets required under SBX7-7, and it will assist other regional agencies that are members of the North Bay Watershed Association in meeting the regional area average gallons-per-capita-daily goals under SBX7-7. This project will reduce the non-point-source pollution generated by runoff, overspray, and leaks from overhead irrigation systems, thereby directly diminishing the load of nutrients and other pollutants discharged to regional water bodies, including San Pablo Bay and San Francisco Bay, and thus helping to meet total maximum daily load limit requirements imposed by the State Water Quality Control Board.

Attachment 2 – Project Justification Project 3 – Marin 2020 Turf Replacement Project
Bay Area Regional Climate Change Preparedness Program Att. 2-38 2015 IRWM Implementation Grant Application
B. Project Map

Attachment 2 – Project Justification Project 3 – Marin 2020 Turf Replacement Project
Bay Area Regional Climate Change Preparedness Program Att. 2-39 2015 IRWM Implementation Grant Application
C. Project Physical Benefits
Primary and secondary project physical benefits are summarized in PSP Tables 5a and 5b, respectively, as follows.
Technical Analysis of Primary Physical Benefits Claimed
1. Explanation of the need for the project, including recent and historical conditions that provide background for benefits to be claimed; e.g., recent water shortages, loss of habitat or ecosystem function, and water quality problems.
Of MMWD’s potable water supply, 75% is collected from rainfall on the Mount Tamalpais watershed and 25% is imported from the Russian River watershed in Sonoma County. Both of these hydrologic regions depend entirely on local rainfall for potable water supplies, have very limited water storage capacity, and are required by law to release significant portions of this water to support ecosystems that are home to multiple species of listed endangered and critically endangered species.
PSP Table 5a - Primary Annual Project Physical Benefits
Project Name: Project 3 - Marin 2020 Turf Replacement Project Type of Benefit Claimed: Water Supply Savings Units of the Benefit Claimed: AFY potable water-use savings Additional Information About This Benefit: This project will save 5.9 million gallons (18.1 acre-feet) of potable water annually, contributing to drought resiliency in the region. This benefit will be quantified by amount of water saved (measured as reduction in use compared to average five-year prior consumption). Anticipated Useful Life of Project (years): 20 years
Year
Physical Benefits
Without Project With Project Change Resulting from Project
2015 (Project Launch Late 2015)
29* 29 0 acre-feet of potable water saved
2016 29 24.48** 4.52 acre-feet of potable water saved
2017 29 19.95 9.04 acre-feet of potable water saved
2018 29 15.43 13.56 acre-feet of potable water saved
2019 (Project Completed
September 2019)
29 10.9 18.1 acre-feet of potable water saved each year thereafter
20-Year Cumulative
Water Savings (2019-2039)
580 218 362 acre-feet of potable water saved total
Comments: *Average evapotranspiration (ETo) rate for turfgrass between 2010 and 2015 in Marin County equals 3.62 acre-feet per acre, per year (1.18 million gallons per acre, per year), as measured by CIMIS weather station #157. Cool-season turfgrass requires an average of 80% of ETo, or 2.9 acre-feet per acre (3.62 * 0.80) of irrigation per year (UC Cooperative Extension and DWR 2000, 6). Therefore, the irrigation requirement for the entire 10-acre project area is approximately 29 acre-feet per year (2.9 * 10 acres). **For each of the four project years, 2.5 acres of turfgrass will be converted to low-water-use landscape. The average irrigation water requirement for low-water-using plants is approximately 30% of ETo (UC Cooperative Extension and DWR 2000, 12); therefore, each converted project-acre will require 1.09 acre-feet (3.62 * 0.30) of irrigation per year, or 62.4% [(1.09 / 2.9) – 1 * 100] less water than the turfgrass converted as a result of this project.

Attachment 2 – Project Justification Project 3 – Marin 2020 Turf Replacement Project
Bay Area Regional Climate Change Preparedness Program Att. 2-40 2015 IRWM Implementation Grant Application
Recent, increasingly apparent climatological changes in rainfall and temperature patterns are having significant impacts on water supply security, wildlife habitat, and water quality. For example, 2013 was the hottest and driest year ever recorded in Marin County, significantly increasing demands on limited water supplies, causing stress to native and ornamental plants, interrupting spawning activity for endangered salmonid populations, and requiring the import of higher-than-usual amounts of water at a premium cost to meet customer demand. Given that MMWD has only two years of water storage capacity even during normal rainfall years, the trend of unstable rainfall patterns risks the environmental health and social prosperity of the district. The district is required to make every reasonable effort to conserve as much potable water as is feasible.
Landscape water use, particularly for non-functional ornamental turfgrass, is an area in which significant and permanent conservation savings can be achieved. Landscape design and maintenance practices typical of the period from 1960–1990 embraced the use of large swaths of ornamental turfgrass on streetscapes and commercial properties to provide visual curb appeal. These areas cannot be utilized for recreational purposes and are therefore referred to as “non-functional” turfgrass areas. Ornamental turfgrass, typically cool-season types of grasses, has an annual plant–water factor of 80% of the maximum evapotranspiration rate—twice that of most other landscape plants—and, practically, can only be irrigated using overhead sprinkler systems also rated as having the lowest water application efficiency, often 65% or less for older systems (UC Cooperative Extension and DWR 2000, 6). In addition to the relatively large quantities of water needed to maintain these turf areas, significant amounts of turfgrass irrigation water runoff are loaded with residues from fertilizers, pesticides, and animal waste and sediment. Conversion to habitat-friendly landscape virtually eliminates these pollutants and their downstream environmental impacts and provides new urban habitat areas for insects and birds (USEPA 2015, 1).
MMWD staff has measured the total area of non-functional turfgrass on commercial and municipal properties using a combination of tools and techniques, including aerial photography, in-house geographic information system software, physical landscape plan measurement, and site visits to verify actual landscape conditions. MMWD has determined that the district contains a total of 80 acres of non-functional turf. If all this turf were to be converted to low-water-use native and climate-appropriate landscape, potable water savings would be approximately 143 acre-feet per year, or 10% of the total potable water used by properties with dedicated irrigation water meters. This project proposes to convert 10 acres of non-functional commercial and municipal turfgrass in order to directly and permanently reduce irrigation water requirements by 18.1 acre-feet each year and eliminate 113 kg of chemical fertilizer and pesticides from fragile aquatic ecosystems in the watershed.
2. Explanation of estimates of the without-project conditions (i.e., the levels of the physical benefits in the future, without the project, but with other planned projects).
MMWD is scheduled to install electronic-read water meters at all properties with dedicated irrigation meters by mid-2016. The meters will assist irrigation customers by providing weekly, rather than bi-monthly, online water meter readings so that leaks and overwatering can be detected and corrected more rapidly. In conjunction with the new meter technology, MMWD staff has completed an inventory, including area measurements, of all sites, and has provided each customer with a scientifically calculated water budget to assist them in managing their landscape water use. Additionally, the water meter project will provide rebates for upgrading existing irrigation systems in order to improve irrigation efficiency and reduce runoff. This program is expected to conserve significant amounts of water through the combination of education, information, and hardware upgrades to improve system efficiency. The potable water savings target for this program is 300 acre-feet per year.
Without implementation of the Marin 2020 Turf Replacement Project, the program described above will result in approximately 300 AFY of savings. However, while the installation of electronic-read meters at sites with commercial landscapes will help to improve irrigation scheduling practices and efficiencies and reduce water waste caused by leaks, the same permanent reductions in water demand and improvement in water quality and habitat

Attachment 2 – Project Justification Project 3 – Marin 2020 Turf Replacement Project
Bay Area Regional Climate Change Preparedness Program Att. 2-41 2015 IRWM Implementation Grant Application
value will not be achieved. The replacement of turfgrass and associated spray irrigation systems with landscape of greater habitat value will reduce water demand, decrease the amount of chemicals required to maintain the turfgrass, eliminate contaminated runoff, significantly improve irrigation efficiency, and permanently enhance the overall environmental value of the project’s 10 acres.
3. Description of the methods used to estimate the primary physical benefits.
The primary benefit of potable water savings was estimated using a combination of industry-standard resources for plant and climate water-demands and irrigation system efficiency data published by the California Department of Water Resources in the California Irrigation Management Information System (CIMIS) (DWR 2015), Water Use Classification of Landscape Species (WUCOLS) (UC Cooperative Extension and DWR 2000), and UC Davis Integrated Pest Management Program (UC IPM 2015).
The average five-year ETo for Marin County during the period from January 1, 2010, through December 31, 2014, was calculated using data acquired electronically from CIMIS weather station #157 (Point San Pedro), located in a central climate zone in San Rafael, California. The CIMIS network, operated by the Department of Water Resources, records daily ETo values from weather station #157. The total five-year ETo was divided by 5 to arrive at the average annual ETo as measured in inches per square foot for the time period. The result was a gross average ETo of 43 inches per square foot (equivalent to 26.8 gallons per square foot per year), or the annual water requirement for cool-season turf, which is the predominant ornamental turfgrass species in Marin. The value of 26.8 gallons per square foot was converted to acre-feet-per-acre units for simplicity and consistency of reporting, resulting in a gross annual irrigation requirement of 3.6 acre-feet (26.8 gallons per square foot * 43,560 square feet per acre / 325,851 gallons per acre-foot). The simple net irrigation water requirement was calculated by multiplying the gross average ETo by the standard WUCOLS plant adjustment factor for cool-season turf, resulting in an estimated net irrigation water requirement of 2.9 acre-feet per year for each project-acre of turf (3.6 * 0.8).
This result was applied to all 10 project-acres to arrive at the baseline assumption that for existing turfgrass, 29 acre-feet was the total average irrigation water requirement that would be compared to the post-conversion irrigation water requirement for low-water-use landscape plants. This is the “without-project” water-use condition.
Note: This simple method of estimated net irrigation water requirements using a plant adjustment factor was selected, given that full information on actual water use for project sites not yet selected is not available, and, therefore, more precise methods of estimation, e.g., modifying ETo values using factors for irrigation efficiency and microclimate, would not be meaningful.
Calculation of Net Irrigation Water Requirement for Turfgrass
CIMIS Weather Station #157 ETo Data, 1/1/2010–12/31/2014 A Total Five-Year ETo, in Inches (CIMIS) 217 B Average One-Year ETo, in Inches (A/5) 43.3 C Gross Annual Irrigation Water Requirement, in Gallons/Acre (B * 0.623 * 43,560) 1,175,070
D Gross Annual Irrigation Water Requirement, in Acre-feet/Acre (C/325,851) 3.6
E Multiply by Turf Plant Adjustment Factor (UC Cooperative Extension and DWR 2000, 6) 0.8 F Net Annual Irrigation Water Requirement, in Acre-feet/Acre (D * E) 2.9 H Net Total Pre-Project Irrigation Water Requirement, in Acre-Feet (F * 10 Acres) 29
For the “with-project” estimates of the four project implementation years, 2.5 acres of turfgrass will be converted to low-water-use landscape each year. The average irrigation water requirement for low-water-using plants is approximately 30% of ETo (UC Cooperative Extension and DWR 2000, 12); therefore, each converted project-acre will require 1.09 acre-feet (3.62 * 0.30) of irrigation per year, or 62.4% [(1.09 / 2.9) – 1 * 100] less water than the turfgrass targeted for conversion as part of this project. This amount of water savings was consecutively subtracted from the “without-project” condition of 29 AFY of potable water use. For each of the four project years, 2.5 acres of turfgrass will be converted, thereby reducing irrigation water demand by 1.81 AF/acre/year, or 4.52 AF per project year. Therefore, area converted and water savings in project year 1 = 2.5 acres converted, with 4.52 AF saved; project year 2 = project year 1 + 2.5 acres converted, with 4.52 AF saved; project year 3 = project years 1 + 2

Attachment 2 – Project Justification Project 3 – Marin 2020 Turf Replacement Project
Bay Area Regional Climate Change Preparedness Program Att. 2-42 2015 IRWM Implementation Grant Application
+ 2.5 acres converted, with 4.52 AF saved; and project year 4 = project years 1 + 2 + 3 + 2.5 acres converted, with 4.52 AF saved. A grand total of 10 acres of turfgrass will be converted, with 18.1 AF of water savings each year thereafter.
4. Identification/description of all new facilities, policies, and actions required to obtain the physical benefits, i.e., any City policies or procedures that need to be established in order for the benefits to be realized.
No new facilities or policies will be required in order to obtain the physical benefits of this project. MMWD currently employs trained staff to perform all of the program activities, and the program is fully supported by District management and elected officials. The actions required to realize the project benefits include preparation of customer outreach materials, such as brochures and application forms, completion of pre- and post-inspections for project sites, in-house processing of application materials and payments, tracking of staff time and expenses, and preparation of report documentation as required by the grant agreement.
5. Description of potential adverse physical effects and what is being done to mitigate those impacts.
No potential adverse physical effects have been identified for this project. The project will not require a CEQA review process or CEQA document. The project will replace high-water-use, climate-inappropriate turf with climate-appropriate landscaping, including native plants. Additionally, irrigation systems will be modified from overhead spray irrigation to drip irrigation in order to support the new landscape features, resulting in a reduction of overspray and elimination of irrigation runoff in the project areas. This, in turn, will reduce pollutant levels associated with irrigation runoff entering the natural environment.
Not only are there no known adverse effects anticipated for the project, but the environmental benefits gained from such landscape conversions have been extensively documented. Beginning with the State of California’s Porter-Cologne Act of 1969 and continuing up to the present day with Marin’s current Countywide Plan, the reduction of water waste and runoff better ensures adequate water supplies for wildlife and humans, improves soil health and permeability, reduces erosion and flooding, and filters and remediates nutrients and pathogens that would otherwise damage the environment (Marin County 2007, 60-63).
The many ecosystem services provided by climate-appropriate landscaping are embodied in the Sustainable Sites Initiative developed by the American Society of Landscape Architects (Sustainable Sites Initiative 2014a; Sustainable Sites Initiative 2014b). These beneficial services seek to:
Protect and restore existing hydrologic functions. Manage and clean water on-site. Reduce outdoor water use. Through evaporation, transpiration, and the uptake and storage of carbon by plants, detoxify and cleanse
the air, soil, and water, and provide a breathable atmosphere. Regulate local climate by using trees to provide shade and act as windbreaks. Help to control erosion with vegetation, thereby slowing the deposition of sediment and preventing the
loss of soil foundation. Attract thousands of pollinator species to promote the growth of myriad plants and crops.
6. Description of whether the proposed project effectively addresses long-term drought preparedness goals, and how the project effectively addresses/contributes to sustainable water supply and reliability during water shortages and achieves one or more of the following:
a. Promote water conservation, conjunctive use, reuse, and recycling: Studies of programs similar to the proposed project have shown that significant water savings are achieved through the process of converting high-water-use, turf-based landscapes to low-water-use, climate-appropriate landscapes. A five-year xeriscape conversion study published in 2005 by the Southern Nevada Water Authority reported a 30% reduction in landscape water-demand post-turf conversion (Sovocool 2005, 60).
b. Improve landscape and agricultural irrigation efficiencies: Landscape irrigation efficiencies are improved by 40-50% when existing spray irrigation systems are converted to point-source drip irrigation. Drip irrigation systems avoid water loss by placing water directly at the soil surface, eliminating overspray and losses due to misting and runoff. Additionally, drip systems operate at a lower water pressure than spray systems (15-20 psi vs. 30-50 psi) and lower flows (e.g., 3-5 gallons per minute vs. 20-30 gallons per minute), thereby

Attachment 2 – Project Justification Project 3 – Marin 2020 Turf Replacement Project
Bay Area Regional Climate Change Preparedness Program Att. 2-43 2015 IRWM Implementation Grant Application
reducing water loss in the event of equipment failure or leaks. (Rogers et al. 1997, 2)
c. Achieve long-term reduction of water use: It is anticipated that the acres of turf converted to low-water-use landscape will be retained for more than 20 years, based on facts such as the following: the conversion of landscapes is a costly process ($20-$30 per square foot); the economic value of a landscape increases as trees and woody perennials mature; and irrigation water requirements decrease as climate-adapted plants become established.
d. Efficient groundwater basin management: This project does not address groundwater basin management.
e. Establish system interties: This project does not establish system interties.
f. Solutions that yield a new water supply, such as seawater desalination: This project does not yield a new water supply; however, the project will help extend existing water supplies.
References Cited for Primary Project Benefit
DWR (California Department of Water Resources). 2015. California Irrigation Management Information System (CIMIS) Overview. http://www.cimis.water.ca.gov/# (June 22, 2015).
Marin County. 2007. Marin Countywide Plan. http://www.marincounty.org/~/media/files/departments/cd/he/cwp_cd2.pdf%20%20%20%20page%202-60 (June 22, 2015).
Rogers DH, Lamm FR, Alam M, Trooien TP, Clark GA, Barnes PL, and Mankin K. 1997. Efficiencies and Water Losses of Irrigation Systems. http://longbeach.wsu.edu/cranberries/documents/efficienciesandwaterlossesofirrigationsystems.pdf (June 22, 2015).
Sovocool KA. 2005. Xeriscape Conversion Study, Final Report. http://www.snwa.com/assets/pdf/about_reports_xeriscape.pdf (June 22, 2015).
Sustainable Sites Initiative. 2014a. Water. http://www.sustainablesites.org/benefits/water (June 22, 2015).
Sustainable Sites Initiative. 2014b. Ecosystem Services. http://www.sustainablesites.org/benefits/ecosystemservices (June 22, 2015).
UC Cooperative Extension (University of California Cooperative Extension and California Department of Water Resources). 2000. A Guide to Estimating Irrigation Water Needs of Landscape Plantings in California. http://www.water.ca.gov/wateruseefficiency/docs/wucols00.pdf (June 22, 2015).
UC IPM (University of California Statewide Integrated Pest Management Program). 2015. How to Manage Pests: California Weather Data: Active weather stations in Marin County. http://www.ipm.ucdavis.edu/calludt.cgi/WXPCLISTSTNS?MAP=&PATH=CNTY&COUNTY=MR&ACTIVE=1&NETWORK=&STN (June 22, 2015).
USEPA (U.S. Environmental Protection Agency). 2015. Water: Coastal Zone Act Reauthorization Amendments, A. Pollution Prevention Management Measure. http://water.epa.gov/polwaste/nps/czara/ch4-6.cfm (June 24, 2015).

Attachment 2 – Project Justification Project 3 – Marin 2020 Turf Replacement Project
Bay Area Regional Climate Change Preparedness Program Att. 2-44 2015 IRWM Implementation Grant Application
Technical Analysis of Secondary Physical Benefits Claimed
1. Explanation of the need for the project, including recent and historical conditions that provide background for benefits to be claimed; e.g., recent water shortages, loss of habitat or ecosystem function, and water quality problems.
From the 1960s until the 1990s, landscape architects specified non-functional ornamental turfgrass areas for street medians and commercial developments and along parkways in housing developments in order to provide bright-green vistas pleasing to the eye. This style of turf-dominant landscaping was less popular in Marin than in other areas of California, due in large part to the severe drought during 1976–78; nevertheless, 80 acres of high-water-using ornamental turf remains, requiring large amounts of water and chemical inputs in order to maintain an acceptable visual appearance. In the current period of climatic change, with uncertainty about future rainfall patterns, and with infill development that increases urban runoff and threatens environmental health in aquatic
PSP Table 5b - Secondary Annual Project Physical Benefits
Project Name: Project 3 - Marin 2020 Turf Replacement Project Secondary Benefit Claimed: Water Quality Improvement Units of the Benefit Claimed: mg/L (nitrogen + phosphorus + oxadiazon) reduced in commercial irrigation runoff (kg nitrogen + phosphorus + oxadiazon prevented from entering the environment are shown below in parentheses) Additional Information About This Benefit: This project will reduce the volume of irrigation runoff entering the environment by replacing commercial turfgrass with native and climate-appropriate landscaping. It will consequently reduce the amount of pollutants in irrigation runoff discharged to downstream water bodies. Reducing the load of nutrients and other pollutants discharged to water bodies would decrease concentrations of such pollutants in those water bodies to some degree. However, determining the change in concentration of pollutants in surrounding water bodies is not feasible, because the exact locations of turf replacement activities are not yet known. Because only the volume of runoff is being decreased by this project, the concentration of pollutants in runoff would not change until project completion, when all irrigation runoff in the project area is prevented from entering the environment and the concentration of pollutants in irrigation runoff into the environment is reduced to zero. Anticipated Useful Life of Project (years): 20 years
Year
Physical Benefits
Without Project With Project Change Resulting from Project
2015 (Project Launch Late 2015)
15.8 mg/L (113 kg) 15.8 mg/L (113 kg) 0 mg/L (0 kg) – No change in pollutants discharged in irrigation runoff.
2016 15.8 mg/L (113 kg) 15.8 mg/L (84.75 kg) 0 mg/L (28.25 kg) – Reduced pollutant load from irrigation runoff.
2017 15.8 mg/L (113 kg) 15.8 mg/L (56.5 kg) 0 mg/L (56.5 kg) – Reduced pollutant load from irrigation runoff.
2018 15.8 mg/L (113 kg) 15.8 mg/L (28.25 kg) 0 mg/L (84.75 kg) – Reduced pollutant load from irrigation runoff.
2019 (Project Completed
September 2019)
15.8 mg/L (113 kg) 0 mg/L (0 kg) 15.8 mg/L (113 kg) – There will be no irrigated turf runoff. All pollutant load will be reduced from irrigation runoff.
20-Year Cumulative Water Quality Benefits
15.8 mg/L (2,260 kg) 0 mg/L (0 kg) 15.8 mg/L (2,260 kg) – Total reduced pollutant load from irrigation runoff as a result of the project. There will be no irrigated turf runoff.

Attachment 2 – Project Justification Project 3 – Marin 2020 Turf Replacement Project
Bay Area Regional Climate Change Preparedness Program Att. 2-45 2015 IRWM Implementation Grant Application
habitats, the cost of maintaining non-functional turf areas is no longer sustainable or desirable.
Marin’s urban creeks have been contaminated by pollutants in urban runoff for years; in 2002, Corte Madera Creek, centrally located in MMWD’s urban watershed, was listed on EPA’s Water Quality Assessment Status Report as “threatened” for aquatic life support, fish spawning, cold- and fresh-water habitat, overall use support, and wildlife habitat (USEPA 2002). In 2010, this same EPA assessment tool listed all of the creeks in MMWD’s urban watershed that drain into San Pablo Bay as “impaired” by urban runoff, debris, and pesticides (USEPA 2010). Corte Madera creek, for example, is listed on the most current 2010 assessment report as impaired for pesticides and debris (USEPA 2013), and the San Francisco Estuary Institute has recorded elevated levels of ammonium nitrogen (the primary constituent of chemical fertilizer) in water chemistry tests and oxadiazon (a commonly used turfgrass herbicide) in fish and bivalve tissue samples in Marin County (San Francisco Estuary Institute & The Aquatic Science Center 2015). Finally, the current Phase II permit for the Marin County Stormwater Pollution Prevention Program for municipal landscape design and maintenance pesticide total maximum daily load specifically requires local jurisdictions to “implement practices that reduce the discharge of pesticides, herbicides and fertilizers” (MCSPPP 2015).
The primary background conditions that necessitate conversion of non-functional turfgrass project areas to low-water and low-chemical-dependent, environmentally beneficial landscapes are documented as follows:
“Landscape maintenance practices can have adverse effects on water quality. Because commonly used fertilizers and herbicides are a source of organic compounds, it is important to keep these practices to a minimum, and prevent overwatering. When well-maintained and designed, landscaped concave surfaces, infiltration basins, swales, and bio-retention areas can add aesthetic value while providing the framework for environmentally sound, comprehensive stormwater management systems.” (Bay Area Stormwater Management Agencies Association 2010, 73)
“The care of landscaped areas, including golf courses, can contribute significantly to nonpoint source pollutant loadings. The application of fertilizers and pesticides in coastal areas can be detrimental to surface waters. After a site is developed, a significant area of maintained landscape may be regularly treated with fertilizer and pesticides. In areas where nitrogen is a problem pollutant, measures to control the introduction of nitrogen into runoff and leachate are important. Several studies have been completed that demonstrate the leaching potential of nitrogen from turf. Researchers at Cornell University found that 60 percent of nitrogen applied to turf leached to ground water (Long Island Regional Planning Board 1984). Shultz (1989) suggests that 50 percent of the nitrogen applications are leached out and not used by plants. A study completed by Exner and others (1991) showed that as much as 95 percent of nitrate applied in late August on an urban lawn was leached below the turfgrass root zone. In coastal areas, where soils are highly permeable and ground water and surface waters are hydrologically connected, reduced applications of nutrients may be necessary to control subsurface flow of nutrients into surface waters.” (USEPA 2015)
When managed for sustainability, roadside vegetation can contribute to better water quality and conductivity, increased diversity of insect life, and cost savings, while also benefiting the socioeconomic health of the state. Sustainably managed roadsides reduce the amount of non-native mown turf and include meadows of native warm season grasses and/or flowering perennials, and masses of native shrubs and trees. However, sustainable strategies only provide optimal cost savings and enhance environmental stewardship when implemented consistently.” (Bay Area Stormwater Management Agencies Association 2010, 3)
“Appropriately chosen vegetation, such as native warm season grasses, helps stabilize the soil surface to reduce stormwater erosion and keep sedimentation activity from occurring. These two phenomenon continue to present a serious problem, resulting in water quality problems, which damage not only fish and wildlife, but also threaten public health, welfare and safety. Because of the deep and/or fibrous root systems present in many native grasses and forbs, they act as an efficient soil stabilizer and increase infiltration by providing deeper channels for water penetration more efficiently than shallow-rooted turf grass.” (Lucey and Barton 2010, 7)
This project proposes to convert 10 acres of non-functional commercial and municipal turfgrass to directly and permanently reduce the irrigation water demand by 18.1 AF each year and eliminate 11.3 mg/L of nitrogen, 4.45

Attachment 2 – Project Justification Project 3 – Marin 2020 Turf Replacement Project
Bay Area Regional Climate Change Preparedness Program Att. 2-46 2015 IRWM Implementation Grant Application
mg/L phosphorus, and 0.05 mg/L herbicides from impacting the fragile aquatic ecosystems in the watershed.
2. Explanation of estimates of the without-project conditions (i.e., the levels of the physical benefits in the future, without the project, but with other planned projects).
Without the specific reductions in chemical-laden runoff provided by this project, it is likely that some reductions in runoff may occur as a result of the promotion of less-toxic landscape maintenance techniques included in “Integrated Pest Management” best practices, as well as proper chemical application methods detailed in the Marin County Stormwater Pollution Prevention Program’s Phase II permit compliance requirements. The Phase II permit specifically sets out chemical requirements for chemical applications by municipal contractors and staff as well as all non-agricultural landscape maintenance workers; however, the permit does not directly address the issue of irrigation water management of runoff. Given that commercial turfgrass areas are almost exclusively irrigated using overhead spray systems, some runoff is inevitable due to the design of spray systems; and because permit enforcement historically has been almost non-existent for commercial turf management, the permit alone will not achieve the same level of water quality benefits provided by the proposed project (MCSPPP 2015).
3. Description of the methods used to estimate the secondary physical benefits.
The methods used to estimate the secondary physical benefits to be achieved by this project included a research literature review to identify the quantities of the specific irrigation runoff coefficients and chemical constituents of environmental concern, analysis of quantitative water quality and chemical measurements, and calculation of the percentage of irrigation water runoff and nutrients of concern based on industry-average measurements.
The U.S. EPA is a leader in the documentation of research results linking chemical contaminants in stormwater to environment problems in aquatic environments, and thus the EPA’s 1999 Stormwater Guide was used to support test results in the local watershed. The table below reproduces Table 4-2 from this guide (USEPA 1999, 4-1, 4-6/9).
Sources of Contaminants in Urban Stormwater Runoff
Contaminant Contaminant Sources
Sediment and Floatables Streets, lawns, driveways, roads, construction activities, atmospheric deposition, drainage channel erosion
Pesticides and Herbicides Residential lawns and gardens, roadsides, utility right-of-ways, commercial and industrial landscaped areas, soil wash-off
Organic Materials Residential lawns and gardens, commercial landscaping, animal wastes
Metals Automobiles, bridges, atmospheric deposition, industrial areas, soil erosion, corroding metal surfaces, combustion processes
Oil and Grease/Hydrocarbons Roads, driveways, parking lots, vehicle maintenance areas, gas stations, illicit dumping to storm drains
Bacteria and Viruses Lawns, roads, leaky sanitary sewer lines, sanitary sewer cross-connections, animal waste, septic systems
Nitrogen and Phosphorus Lawn fertilizers, atmospheric deposition, automobile exhaust, soil erosion, animal waste, detergents
Source: U.S. EPA 1999 Stormwater Guide, pp. 4-1 and 4-6/9.
The quantity of irrigation runoff to be reduced by this project was estimated using the industry-standard average of 20% water loss due to inefficiencies of overspray and runoff when water is applied to turfgrass using spray irrigation. This percentage was converted to a gallons/AF factor of 65,170 gallons (325,851 gallons per acre-foot * 0.20) to determine the amount of irrigation water potentially wasted due to irrigation runoff and other system

Attachment 2 – Project Justification Project 3 – Marin 2020 Turf Replacement Project
Bay Area Regional Climate Change Preparedness Program Att. 2-47 2015 IRWM Implementation Grant Application
inefficiencies (UC Cooperative Extension, 30). When applied to the entire 10-acre project area, this runoff factor equals an estimated runoff amount of approximately 1.9 million gallons per year (65,170 * 29 acre-feet of irrigation water used per year for turfgrass), or 5.8 AF per year.
The quantity of chemical nutrients and pesticides to be reduced by this project was estimated by determining the average application rates of nitrogen, phosphorus, and commercially available herbicides and insecticides used for turfgrass maintenance on an annual basis. Available research studies were used to estimate the quantity of chemical runoff in irrigation water runoff in order to determine the amount of runoff based on the five-year average of irrigation water demand in Marin (CIMIS). The amount of actual nitrogen recommended for turfgrass is 5 pounds per 1,000 square feet per year (Colorado State University Extension 2014), or 81 kg/acre/year, and a turfgrass fertilizer with an analysis of 20–20–20 (20% nitrogen–20% phosphorus–20% potassium) would commonly be applied to supply this recommended nutrient concentration. Given that the primary chemicals of concern for this project are nitrogen, phosphorus, and herbicides, the combined quantity of these chemicals is estimated to be 163 kg/acre/year (81 kg N + 81 kg P + 1.1 kg oxadiazon). Studies show that nitrogen and phosphorus losses occur at a rate of 10% and 4%, respectively, due to irrigation runoff from spray irrigation systems (USEPA 2015). Assuming that oxadiazon will also be subject to losses at the lowest reported rate of 4%, the combined chemical load from runoff would be 11.3 kg per acre (8.1 kg N @ 10% loss + 3.2 kg P @ 4% loss + 0.04 kg oxadiazon @ 4% loss), for a 10-acre project-area total chemical load of 113 kg (113 million milligrams) per year without this project.
Verification of the chemical nutrients and herbicides in Marin’s watershed, consistent with the research results found for urban watersheds in general, were documented by accessing EPA Water Quality Assessment Status Reports, Marin County Stormwater Pollution Prevention permit documents, and test results from the San Francisco Estuary Institute (San Francisco Estuary 2015; MSCPPP 2015).
Finally, the area of post-project converted landscape using high-efficiency drip irrigation and low-water-use landscape plants in place of turfgrass was estimated to contribute no significant runoff or chemical pollutants to the environment (UC Cooperative Extension, 30). Irrigation water runoff from project area turfgrass is calculated to be 5.8 AF (7.2 million liters) per year.
An average of 20% of the water applied to turfgrass using spray irrigation is lost due to inefficiency in the form of overspray and runoff; therefore, it is estimated that approximately 0.20 AF per acre-foot applied is wasted due to irrigation runoff and other system inefficiencies (UC Cooperative Extension and DWR 2000, 20). For the completed 10-acre project area, this equals an estimated runoff amount of approximately 5.8 AF per year (0.20 * 29 AF of irrigation water used per year for turfgrass), or 7.2 million liters.
Combined average runoff of nitrogen, phosphorus, and herbicides from project-area turfgrass is calculated to be 15.8 mg/L per year, based on recommended application rates of commonly used turf-care products. Oxadiazon is a common herbicide used to prevent weeds in turfgrass and is listed under the trade name Ronstar. According to the University of California, the average recommended application rate is 3 pounds of active ingredient per acre per year, or 1.1 kg/acre/year (UCIPM 2015).
Given that 5.8 AF (7.2 million liters) of irrigation runoff is estimated to occur each year, the chemical constituent concentration entering the environment will be reduced as a result of this project by 113 million mg / 7.2 million liters = 15.8 mg/L/year (11.3 mg/L N + 4.45 mg/L P + 0.05 mg/L oxadiazon), or 113 kg per year, for a 20-year total chemical load reduction of 2,260 kg.
Water loss due to runoff is reduced to insignificant levels or eliminated completely due to the 90-95% efficiency of point-source drip irrigation systems that will be utilized in converted project areas. (UC Cooperative Extension and DWR 2000, 30).
For each of the four project years, 2.5 acres of turfgrass will be converted, reducing chemical pollution by 28.25 kg per project year. Therefore, area converted in project year 1 = 2.5 acres converted, with 28.25 kg of chemicals reduced; project year 2 = project year 1 reductions + 28.25 kg of chemicals reduced, for a cumulative reduction of 56.5 kg; project year 3 = project years 1 + 2 + 28.25 kg of chemicals reduced, for a cumulative reduction of 84.75 kg; and project year 4 = project years 1 + 2 + 3 + 28.25 kg of chemicals reduced, for a cumulative reduction of 113 kg in year 4 and each year thereafter.
4. Identification/description of all new facilities, policies, and actions required to obtain the physical benefits, i.e., any City policies or procedures that need to be established in order for the benefits to be realized.
Attachment 2 – Project Justification Project 3 – Marin 2020 Turf Replacement Project
Bay Area Regional Climate Change Preparedness Program Att. 2-48 2015 IRWM Implementation Grant Application
No new facilities or policies will be required to obtain the physical benefits. MMWD currently employs trained staff to perform all of the program activities, and the program is fully supported by district management and elected officials. The actions required to realize the project benefits include preparation of customer outreach materials, such as brochures and application forms, completing pre- and post-inspections for project sites, in-house processing of application materials and payments, tracking staff time and expenses, and preparing report documentation as required by the grant agreement
5. Description of potential adverse physical effects and what is being done to mitigate those impacts.
No potential adverse physical effects have been identified for this project. The project will not require a CEQA review process or CEQA document. The project will remove high-water-use, climate-inappropriate turf, and replace it with climate-appropriate landscape including, native plants. Additionally, irrigation systems will be modified from overhead spray irrigation to drip irrigation in order to support the new landscape features, resulting in a reduction of overspray and elimination of irrigation runoff in the project areas. This, in turn, will reduce pollutant levels associated with irrigation runoff entering the natural environment.
Not only are there no known adverse effects anticipated for the project, but the environmental benefits gained from such landscape conversions have been extensively documented. Beginning with the State of California’s Porter-Cologne Act of 1969 and continuing up to the present day with Marin’s current Countywide Plan, the reduction of water waste and runoff better ensures adequate water supplies for wildlife and humans, improves soil health and permeability, reduces erosion and flooding, and filters and remediates nutrients and pathogens that would otherwise damage the environment (Marin County 2007, 60-63).
6. Description of whether the proposed project effectively addresses long-term drought preparedness goals, and how the project effectively addresses/contributes to sustainable water supply and reliability during water shortages and achieves one or more of the following:
a. Promote water conservation, conjunctive use, reuse, and recycling: See the Primary Physical Benefits discussion above.
b. Improve landscape and agricultural irrigation efficiencies: Landscape irrigation efficiencies will be improved by 40-50% when existing spray irrigation systems are converted to point-source drip irrigation. Drip irrigation systems avoid water loss by placing water directly at the soil surface, eliminating overspray and losses due to misting and runoff. Additionally, drip systems operate at a lower water pressure than spray systems (15-20 psi vs. 30-50 psi) and lower flows (e.g., 3-5 gallons per minute vs. 20-30 gallons per minute), thereby reducing water loss in the event equipment failure or leaks. (Rogers et al. 1997, 2)
c. Achieve long-term reduction of water use: See the Primary Physical Benefits discussion above.
d. Efficient groundwater basin management: This project does not address groundwater basin management.
e. Establish system interties: This project does not establish system interties.
f. Solutions that yield a new water supply, such as seawater desalination: This project does not yield a new water supply; however, the project will help extend existing water supplies.
References Cited for Secondary Project Benefit
Bay Area Stormwater Management Agencies Association. 2010. Public Perception and Sustainable Roadside Vegetation Management Strategies, Chapter 6: Site Design Landscape Details. http://www.cccleanwater.org/Publications/StartAtTheSource/ch6_site_design_landscape_details.pdf (June 29, 2015).
Colorado State University Extension. 2014. Calculating Fertilizer Rates. http://www.ext.colostate.edu/mg/gardennotes/233.html ( June 29, 2015).
Exner, M.E., M.E. Burbach, D.G. Watts, R.C. Shearman, and R.F. Spalding. 1991. Deep nitrate movement in the unsaturated zone of a simulated urban lawn. J. Environmental Quality 20 (3): 658-662.
Long Island Regional Planning Board. 1984. Koppelman, L., Tanenbaum, E., and Swick, C., 1984, Nonpoint source management handbook: Hauppauge, N.Y., Long Island Regional Planning Board.
Lucey A, Barton S. 2010. Public Perception and Sustainable Roadside Vegetation Management Strategies. Paper

Attachment 2 – Project Justification Project 3 – Marin 2020 Turf Replacement Project
Bay Area Regional Climate Change Preparedness Program Att. 2-49 2015 IRWM Implementation Grant Application
presented at: 90th Anniversary Meeting of the Transportation Research Board; Washington, D.C. http://docs.trb.org/prp/11-3282.pdf.
Marin County. 2007. Marin Countywide Plan. http://www.marincounty.org/~/media/files/departments/cd/he/cwp_cd2.pdf%20%20%20%20page%202-60 (June 22, 2015).
MCSPPP (Marin County Stormwater Pollution Prevention Program). 2015. Phase II Permit Compliance Tracking. Section E.11.j.
Municipal Landscape Design and Maintenance Pesticide Total Maximum Daily Load (TMDL). Email document provided by Marin County staff, June 16, 2015. General program website: http://www.marincounty.org/depts/pw/divisions/mcstoppp.
Rogers DH, Lamm FR, Alam M, Trooien TP, Clark GA, Barnes PL, and Mankin K. 1997. Efficiencies and Water Losses of Irrigation Systems. http://longbeach.wsu.edu/cranberries/documents/efficienciesandwaterlossesofirrigationsystems.pdf (June 22, 2015).
San Francisco Estuary (San Francisco Estuary Institute & The Aquatic Science Center). 2015. Contaminant Data Download and Display (CD3). http://www.sfei.org/rmp/wqt (June 29, 2015).
Warren Shultz. 1989. The Chemical-Free Lawn, The Newest Varieties and Techniques to Grow Lush, Hardy Grass. Rodale Press
UC Cooperative Extension (University of California Cooperative Extension and California Department of Water Resources). 2000. A Guide to Estimating Irrigation Water Needs of Landscape Plantings in California. http://www.water.ca.gov/wateruseefficiency/docs/wucols00.pdf (June 22, 2015).
UC IPM (University of California Statewide Integrated Pest Management Program). 2015. How to Manage Pests: California Weather Data: Active weather stations in Marin County. http://www.ipm.ucdavis.edu/calludt.cgi/WXPCLISTSTNS?MAP=&PATH=CNTY&COUNTY=MR&ACTIVE=1&NETWORK=&STN (June 22, 2015).
USEPA (U.S. Environmental Protection Agency). 1999. [Stormwater] http://water.epa.gov/scitech/wastetech/guide/stormwater/upload/2006_10_31_guide_stormwater_usw_b.pdf (July 29, 2015)
USEPA (U.S. Environmental Protection Agency). 2002. 2002 Waterbody Report for Corte Madera Creek. http://iaspub.epa.gov/tmdl_waters10/attains_waterbody.control?p_au_id=CAR2032001119990218112526_00&p_cycle=2002 (June 29, 2015).
USEPA (U.S. Environmental Protection Agency). 2010. California Water Quality Assessment Report. http://iaspub.epa.gov/waters10/attains_index.control?p_area=CA (June 29, 2015).
USEPA (U.S. Environmental Protection Agency). 2013. Water: WATERS. http://water.epa.gov/scitech/datait/tools/waters/index.cfm (June 29, 2015).
USEPA (U.S. Environmental Protection Agency). 2015. Water: Coastal Zone Act Reauthorization Amendments, A. Pollution Prevention Management Measure. http://water.epa.gov/polwaste/nps/czara/ch4-6.cfm (June 24, 2015).

Attachment 2 – Project Justification Project 3 – Marin 2020 Turf Replacement Project
Bay Area Regional Climate Change Preparedness Program Att. 2-50 2015 IRWM Implementation Grant Application
D. Direct Water-Related Benefit to a DAC
There are several Disadvantaged Community (DAC) Block Groups within MMWD’s service area; these are located in Marin City and the City of San Rafael, including areas of central San Rafael, the Canal district, and Contempo Marin. Two DAC Places are identified within MMWD’s service area in DWR’s DAC Mapping Tool; one abuts Marin City and includes a portion of Sausalito, and the other is in Mill Valley. According to the census and MHI data presented in DWR’s DAC Mapping Tool, less than 25% of the area served by this project meets the definition of a DAC.
The Marin 2020 Turf Replacement Project implementation will occur throughout the entire service area, including within the identified DAC areas. The project will address water-related needs of the entire service area, including water supply reliability during drought periods. However, less than 25% of these benefits will directly affect DACs in the MMWD service area.

Attachment 2 – Project Justification Project 3 – Marin 2020 Turf Replacement Project
Bay Area Regional Climate Change Preparedness Program Att. 2-51 2015 IRWM Implementation Grant Application
E. Project Performance Monitoring Plan
PSP Table 6 – Project Performance Monitoring Plan Project 3 – Marin 2020 Turf Replacement Project
Proposed Physical Benefits Targets or Milestones Measurement Tools and Methods Evaluation
Water Supply: Reduce potable water used for irrigation purposes by removing high-water-use turf located at project sites and replacing such turf with low-water-use, native and climate-appropriate landscape.
443,000 square feet of turf removed and replaced with native and climate-appropriate landscape when the four-year project is complete. 18.1 acre-feet of potable water saved annually when four-year project is fully implemented. Over 20 years, 362 acre-feet of potable water will be saved cumulatively.
Amount of turf removed will be recorded in incentive program records and verified through site inspections pre- and post- implementation. Quantifiable reduction in water use will be measured by comparing actual water meter consumption data from each project irrigation meter before and after the project is implemented.
Processing each rebate will entail recording number of square feet of turf removed. Water consumption data from water meters will be entered into MMWD’s SAP computer system, allowing staff to monitor, analyze, and report on water use patterns at each site, with a high level of accuracy. Incentive program implementation will include site inspections.
Water Supply: Reduce potable water used for irrigation purposes by removing high-water-volume spray landscape irrigation equipment at project sites and replacing such equipment with low-volume drip irrigation. (Replacement of sprays intended for turf, with drips intended for native, low-water-use landscape plants.)
Removal of high-water-volume spray landscape irrigation equipment, and retrofit with low-volume equipment at project sites equaling 10 acres of converted landscape area. 18.1 acre-feet of potable water saved annually when four-year project is fully implemented. Over 20 years, 362 acre-feet of potable water will be saved cumulatively.
Irrigation equipment upgrade and removal data will be recorded in incentive program records and verified through site inspections pre- and post- implementation. Quantifiable reduction in water use will be measured by comparing actual water meter consumption data from each project irrigation meter before and after the project is implemented.
Upgrading landscape equipment to a high-efficiency standard provides the necessary tools to sustain landscape plants in a healthy condition with the minimum amount of supplemental water. Processing each rebate will entail recording detail regarding irrigation equipment removed or upgraded. Staff will monitor, analyze, and report on water-use patterns at each site. Incentive program implementation will include site inspections.
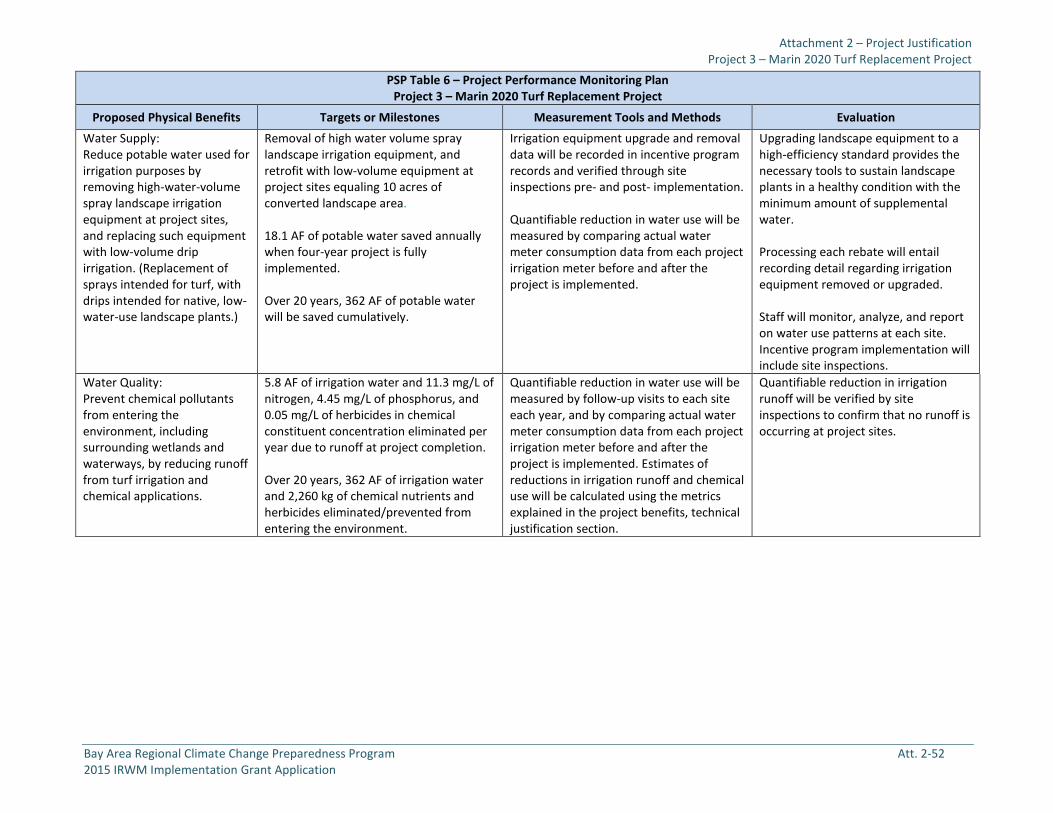
Attachment 2 – Project Justification Project 3 – Marin 2020 Turf Replacement Project
Bay Area Regional Climate Change Preparedness Program Att. 2-52 2015 IRWM Implementation Grant Application
PSP Table 6 – Project Performance Monitoring Plan Project 3 – Marin 2020 Turf Replacement Project
Proposed Physical Benefits Targets or Milestones Measurement Tools and Methods Evaluation Water Supply: Reduce potable water used for irrigation purposes by removing high-water-volume spray landscape irrigation equipment at project sites, and replacing such equipment with low-volume drip irrigation. (Replacement of sprays intended for turf, with drips intended for native, low-water-use landscape plants.)
Removal of high water volume spray landscape irrigation equipment, and retrofit with low-volume equipment at project sites equaling 10 acres of converted landscape area. 18.1 AF of potable water saved annually when four-year project is fully implemented. Over 20 years, 362 AF of potable water will be saved cumulatively.
Irrigation equipment upgrade and removal data will be recorded in incentive program records and verified through site inspections pre- and post- implementation. Quantifiable reduction in water use will be measured by comparing actual water meter consumption data from each project irrigation meter before and after the project is implemented.
Upgrading landscape equipment to a high-efficiency standard provides the necessary tools to sustain landscape plants in a healthy condition with the minimum amount of supplemental water. Processing each rebate will entail recording detail regarding irrigation equipment removed or upgraded. Staff will monitor, analyze, and report on water use patterns at each site. Incentive program implementation will include site inspections.
Water Quality: Prevent chemical pollutants from entering the environment, including surrounding wetlands and waterways, by reducing runoff from turf irrigation and chemical applications.
5.8 AF of irrigation water and 11.3 mg/L of nitrogen, 4.45 mg/L of phosphorus, and 0.05 mg/L of herbicides in chemical constituent concentration eliminated per year due to runoff at project completion. Over 20 years, 362 AF of irrigation water and 2,260 kg of chemical nutrients and herbicides eliminated/prevented from entering the environment.
Quantifiable reduction in water use will be measured by follow-up visits to each site each year, and by comparing actual water meter consumption data from each project irrigation meter before and after the project is implemented. Estimates of reductions in irrigation runoff and chemical use will be calculated using the metrics explained in the project benefits, technical justification section.
Quantifiable reduction in irrigation runoff will be verified by site inspections to confirm that no runoff is occurring at project sites.

Attachment 2 – Project Justification Project 3 – Marin 2020 Turf Replacement Project
Bay Area Regional Climate Change Preparedness Program Att. 2-53 2015 IRWM Implementation Grant Application
F. Cost-Effectiveness Analysis
PSP Table 7 evaluates whether the physical benefits afforded by the project are provided at the least possible costs.
PSP Table 7 – Cost-Effectiveness Analysis
Project Name: Project 3 - Marin 2020 Turf Replacement Project Question 1 What are the types of benefits provided?
Water supply reliability will be enhanced by permanently reducing CII landscape irrigation demand by 18.1 acre-feet, dry-weather urban water runoff by 1.9 AF, and 113 kg of turf-related chemicals each year. Water quality and habitat protection and restoration efforts will benefit by eliminating dry-weather runoff from 10 acres of turf caused by irrigation systems that carry pollutants into downstream wetland habitats.
Question 2 Have alternative methods been considered to achieve the same types and amounts of physical benefits as the proposed project been identified? If no, why? There is no known alternative to converting non-functional turfgrass into areas of environmentally sustainable landscape that would provide the same types and amounts of primary and secondary physical benefits. Methods are available to improve water-use efficiency and reduce chemical runoff by means of less-toxic lawn-care products; however, turfgrass is the highest-water-using plant in the ornamental landscape and requires large inputs of water and nutrients in order for it to maintain an acceptable appearance.
MMWD has taken a leadership role in the promotion of low-water-use landscape and the elimination of chemical fertilizers and pesticides associated with landscape maintenance. In 2008, MMWD became a founding member of the Bay-Friendly Landscaping and Gardening Coalition that is dedicated to promoting environmentally sustainable landscaping practices. MMWD sponsored training sessions for over 200 local landscape professionals, teaching them the 7 Principles of Bay-Friendly Landscaping, and has distributed thousands of copies of the Bay-Friendly Guidelines publication to customers (Bay-Friendly).
The district also performs landscape plan-review services for all local cities and towns, for the County of Marin, and for MMWD customers, at no charge. Whenever a landscape area of 1,000 square feet or greater is added or changed, the district’s codes must be met before a building permit can be issued. The standards of the plan-review process ensure that all irrigation systems will operate at maximum uniformity and that plant selections will be water-conserving and environmentally appropriate (MMWD).
Question 3 Is the proposed project the least cost alternative? Explain why the alternative was selected as the proposed project; why is this the preferred alternative? Explain accomplishments of the project that are different from the alternative project or methods.
Yes, this project alternative is the least-cost, most-effective alternative that will yield multiple benefits over the longest period of time. Removing the project-area non-functional turfgrass in MMWD essentially implements a permanent change that will contribute to meeting drought resiliency, reduce the pollutant loads, decrease urban runoff, improve environmental conditions for both terrestrial and aquatic species, and provide a model of sustainable landscaping that will encourage additional customers to convert non-functional turfgrass areas, thereby multiplying the benefits of this project.
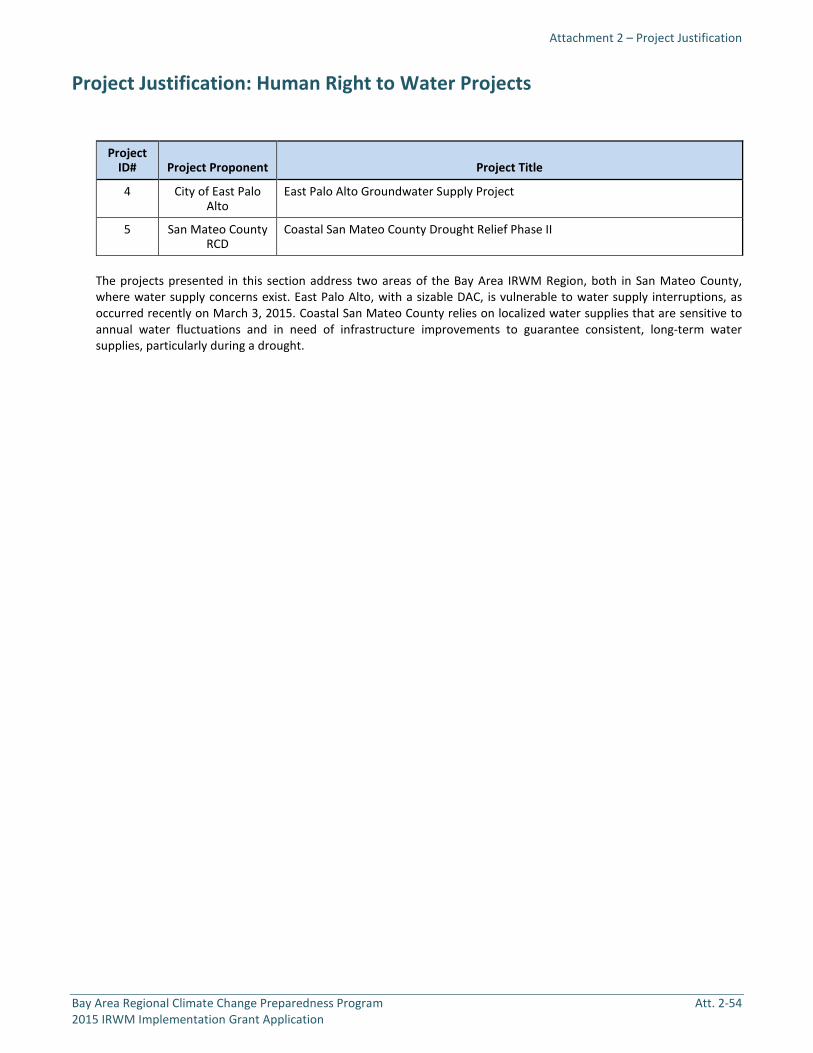
Attachment 2 – Project Justification
Bay Area Regional Climate Change Preparedness Program Att. 2-54 2015 IRWM Implementation Grant Application
Project Justification: Human Right to Water Projects
Project ID# Project Proponent Project Title
4 City of East Palo Alto
East Palo Alto Groundwater Supply Project
5 San Mateo County RCD
Coastal San Mateo County Drought Relief Phase II
The projects presented in this section address two areas of the Bay Area IRWM Region, both in San Mateo County, where water supply concerns exist. East Palo Alto, with a sizable DAC, is vulnerable to water supply interruptions, as occurred recently on March 3, 2015. Coastal San Mateo County relies on localized water supplies that are sensitive to annual water fluctuations and in need of infrastructure improvements to guarantee consistent, long-term water supplies, particularly during a drought.

Attachment 2 – Project Justification
Bay Area Regional Climate Change Preparedness Program Att. 2-55 2015 IRWM Implementation Grant Application
Project 4 – East Palo Alto Groundwater Supply Project
A. Project Description
Project Need and Goals: Disadvantaged Community (DAC) census blocks cover 32.6% of the land area within the City of East Palo Alto (City). The East Palo Alto Groundwater Supply Project includes the development and use of groundwater as a new source of potable water supply that will directly benefit the DACs within the City by increasing supply reliability. The City currently receives 100% of its potable water supply from the San Francisco Public Utilities Commission (SFPUC) regional water system (RWS) and has no system storage or alternative supply sources to meet peak demands or to provide backup during a catastrophic event (e.g., supply interruptions or water-quality breaches from the SFPUC RWS). This project will reduce the City’s demand and dependence on SFPUC’s RWS, boost pressures within the City’s distribution system during peak demands, provide alternate supplies during emergencies, and provide the City with the supply reliability that it needs to support economic development.
The City currently has one of the lowest residential per-capita water uses in the State of California (State), 45 residential gallons per capita per day (R-GCPD) (SWRCB 2015). This is almost half the statewide average of 87.5 R-GPCD (SWRCB 2015), making additional normal- and drought-year cutbacks difficult to achieve. Nonetheless, the City’s water demands exceed its contractual supply allocation from the SFPUC RWS, which means it cannot support additional economic development within the city limits.
The current cost to purchase water from the SFPUC RWS is $1,960 per acre-foot. In contrast, the cost for the City to produce groundwater is approximately $400 per acre-foot. By lowering the cost of the City’s water supply, this project will greatly benefit the City’s customers, especially those in the DAC neighborhoods. The project goals are to:
Provide 900 to 1,200 acre-feet per year (AFY) of new water supply during normal and drought years. Reduce the amount of high-cost water purchased from the SFPUC RWS. Allow the City to develop and produce its own local, cost-effective, and reliable water supply. Avoid the immeasurable cost of public health impacts and loss of property caused by a future SFPUC RWS supply
interruption or water-quality breach, fire, or other emergency, particularly in the high-density DAC areas. Continue to work with other groundwater users to manage the San Mateo Plain Groundwater Subbasin through
the development and implementation of a groundwater management plan.
Project Description: The project includes: (1) the design and construction of a treatment system at the currently-inactive Gloria Way Well; and (2) the design of a new well and treatment system (Pad D Well). The Gloria Way Well is located at the intersection of Bay Road and Gloria Way. The Pad D Well will be located at the corner of Clarke Road and East Bayshore Drive.
The Gloria Way Well was constructed in 1981. Use of the well for potable purposes ceased shortly thereafter due to customer complaints related to elevated concentrations of manganese. The City completed a series of studies (HDR 2004; Todd et al. 2012; ESA 2013) that identified the benefits of bringing the Gloria Way Well back online for potable purposes, with the addition of a treatment system. This project will include permitting of the Gloria Way Well and Treatment System, and design and construction of the well pump, treatment system (including chemical feed and storage), disinfection system, filter backwash recovery system, distribution system injection, and associated controls and piping. The Gloria Way Well is expected to produce approximately 300 gallons per minute (gpm), or 400-450 AFY. Design of the Gloria Way Well Treatment System will be completed by November 2015, with construction completed by September 2016.
For the Pad D Well, the City conducted a feasibility study (Todd et al. 2012) and constructed a pilot well, conducted aquifer pump testing, and collected groundwater samples (EKI 2014). The project will include preparation of the required CEQA documents, permitting of the Pad D Well, and design of the well, pump, treatment/blending system, disinfection system, and associated controls and piping. The Pad D Well is expected to produce 350-500 gpm, or 500-750 AFY. Design of the Pad D Well will be complete by December 2016. The City is committed to constructing the Pad D Well by December 2017; however, the Pad D Well construction work is outside the scope of this project and grant request.
Anticipated Physical Benefits/Intended Outcomes: The primary benefits of this project are (1) an increased potable supply of 900-1,200 AFY, and (2) removal of manganese to below the California Secondary MCL of 0.05 milligrams per liter (mg/L).
Regional Applicability: Because this project creates a new potable water supply, it provides for economic growth, with benefits locally and to the region. This project reduces the City’s reliance on the SFPUC RWS, which benefits the region.

Attachment 2 – Project Justification Project 4 – East Palo Alto Groundwater Supply Project
Bay Area Regional Climate Change Preparedness Program Att. 2-56 2015 IRWM Implementation Grant Application
B. Project Map
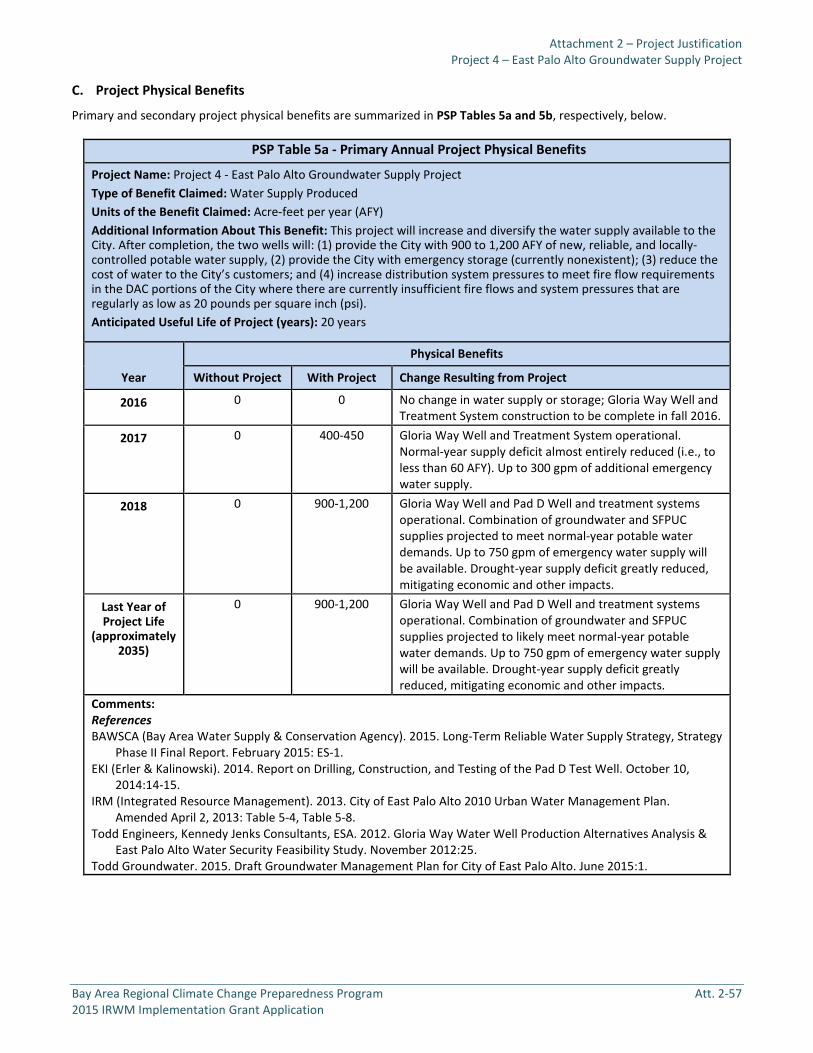
Attachment 2 – Project Justification Project 4 – East Palo Alto Groundwater Supply Project
Bay Area Regional Climate Change Preparedness Program Att. 2-57 2015 IRWM Implementation Grant Application
C. Project Physical Benefits
Primary and secondary project physical benefits are summarized in PSP Tables 5a and 5b, respectively, below.
PSP Table 5a - Primary Annual Project Physical Benefits
Project Name: Project 4 - East Palo Alto Groundwater Supply Project Type of Benefit Claimed: Water Supply Produced Units of the Benefit Claimed: Acre-feet per year (AFY) Additional Information About This Benefit: This project will increase and diversify the water supply available to the City. After completion, the two wells will: (1) provide the City with 900 to 1,200 AFY of new, reliable, and locally-controlled potable water supply, (2) provide the City with emergency storage (currently nonexistent); (3) reduce the cost of water to the City’s customers; and (4) increase distribution system pressures to meet fire flow requirements in the DAC portions of the City where there are currently insufficient fire flows and system pressures that are regularly as low as 20 pounds per square inch (psi). Anticipated Useful Life of Project (years): 20 years
Year
Physical Benefits
Without Project With Project Change Resulting from Project
2016 0 0 No change in water supply or storage; Gloria Way Well and Treatment System construction to be complete in fall 2016.
2017 0 400-450 Gloria Way Well and Treatment System operational. Normal-year supply deficit almost entirely reduced (i.e., to less than 60 AFY). Up to 300 gpm of additional emergency water supply.
2018 0 900-1,200 Gloria Way Well and Pad D Well and treatment systems operational. Combination of groundwater and SFPUC supplies projected to meet normal-year potable water demands. Up to 750 gpm of emergency water supply will be available. Drought-year supply deficit greatly reduced, mitigating economic and other impacts.
Last Year of Project Life
(approximately 2035)
0 900-1,200 Gloria Way Well and Pad D Well and treatment systems operational. Combination of groundwater and SFPUC supplies projected to likely meet normal-year potable water demands. Up to 750 gpm of emergency water supply will be available. Drought-year supply deficit greatly reduced, mitigating economic and other impacts.
Comments: References BAWSCA (Bay Area Water Supply & Conservation Agency). 2015. Long-Term Reliable Water Supply Strategy, Strategy
Phase II Final Report. February 2015: ES-1. EKI (Erler & Kalinowski). 2014. Report on Drilling, Construction, and Testing of the Pad D Test Well. October 10,
2014:14-15. IRM (Integrated Resource Management). 2013. City of East Palo Alto 2010 Urban Water Management Plan.
Amended April 2, 2013: Table 5-4, Table 5-8. Todd Engineers, Kennedy Jenks Consultants, ESA. 2012. Gloria Way Water Well Production Alternatives Analysis &
East Palo Alto Water Security Feasibility Study. November 2012:25. Todd Groundwater. 2015. Draft Groundwater Management Plan for City of East Palo Alto. June 2015:1.

Attachment 2 – Project Justification Project 4 – East Palo Alto Groundwater Supply Project
Bay Area Regional Climate Change Preparedness Program Att. 2-58 2015 IRWM Implementation Grant Application
Technical Analysis of Primary Physical Benefits Claimed
1. Explanation of the need for the project, including recent and historical conditions that provide background for benefits to be claimed; e.g., recent water shortages, loss of habitat or ecosystem function, and water-quality problems.
As described in more detail below, the City has multiple water supply needs that will be addressed by this project:
The City uses more than its contractual allocation from the SFPUC RWS, which means that it cannot support any additional economic development in the city limits;
The City has one of the lowest residential per-capita water uses in the State (45 R-GPCD), which makes drought cutbacks difficult to achieve;
The City has a single source of supply and no emergency storage, which makes it vulnerable to supply interruptions or other emergency conditions (e.g., water-quality breaches in the SFPUC system such as occurred on March 3, 2015); and
The City cannot currently meet fire flow requirements or support adequate distribution system pressures in large portions of DAC neighborhoods within the City, which creates a major public health and safety issue.
Water Supply Need The City has a single source of water—a supply allocation of 1.94 MGD (equivalent to 2,199 AFY) from the SFPUC RWS, upon which 26 other water agencies rely. The City’s current demand meets or exceeds its supply allocation, which means the City cannot approve any additional growth or economic development within the city limits (IRM 2013). Furthermore, the SFPUC RWS supply is constrained, and deliveries can be reduced by as much as 20% during dry years (BAWSCA 2015). Based on projections in the City's current urban water management plan (UWMP), the City's normal-year supply deficit is projected to be 1,200 AFY by 2035; drought shortfalls will be even greater.
The City currently has one of the lowest residential per-capita water uses in the State (45 R-GCPD). This rate is nearly half the statewide average of 87.5 R-GPCD (SWRCB 2015) and makes additional normal- and drought-year cutbacks difficult to achieve. Nonetheless, the City continues to take aggressive action to reduce water demand. As part of its ongoing water conservation program, the City provides rebates to its customers for selected water-efficient fixtures, such as washing machines, and participates in selected regional conservation programs offered by the Bay Area Water Supply and Conservation Agency (BAWSCA).
Currently, the SFPUC and the State Water Resources Control Board (SWRCB) are calling for the City to reduce water use by up to 10% relative to water use in 2013. In response to the drought and the cutback requirements, the City is complying with the water use restrictions mandated by the SWRCB (resolutions were passed by the City Council on November 18, 2014, and July 7, 2015), which includes the following restrictions:
prohibits the application of potable water to outdoor landscapes in a manner that causes
Figure 1: Existing Gloria Way Well
Figure 2: Pad D Test Well
Attachment 2 – Project Justification Project 4 – East Palo Alto Groundwater Supply Project
Bay Area Regional Climate Change Preparedness Program Att. 2-59 2015 IRWM Implementation Grant Application
runoff onto adjacent property, non-irrigated areas, private and public walkways, roadways, parking lots, or structures.
requires that all garden hoses have shutoff nozzles. prohibits hosing down of driveways and sidewalks. prohibits the use of potable water in a fountain or other decorative water feature, except where such
water is part of a recirculating system. prohibits the application of potable water to outdoor landscapes during and within 48 hours after
measurable rainfall. prohibits irrigation with potable water of ornamental turf on public street medians. limits the watering of lawns and outside plantings to two (2) days per week.
Additionally, free faucet aerators, shower heads, and hose shutoff nozzles are being distributed to residents.
This project will increase the City’s water supply by an estimated 900 to 1,200 AFY, and thus will augment the City’s water supply portfolio, in both normal and dry years, as well as in emergency situations.
Emergency Supply Need In large portions of the City, and particularly in the DAC neighborhoods, water distribution system pressures are routinely as low as 20 psi as compared to typical distribution system pressures of 70-80 psi (IRM 2013). City fire regulations require a residual water pressure of 20 psi at all times (including during periods of maximum demand (East Palo Alto Code of Ordinances Section 8.16.460)), a standard that the City is far from meeting. These chronically low system pressures are, at minimum, a nuisance because residents complain that there is not enough water pressure for them to take showers. More seriously, these low system pressures mean that if a fire or other emergency were to occur, the City would not be able to provide sufficient fire flow. This creates a major public health and safety issue for the City, its customers, and the region. This project will add additional water supply sources at specific locations within the distribution system and proximate to the DAC neighborhoods, augmenting supply and helping to maintain system pressure in those areas during peak demand periods or in the event of a fire or other emergency.
Drought Preparedness Need Currently, the City’s customers are already conserving water, using approximately 45 R-GPCD, which is well below the state average of 87.5 R-GPCD. This means that during a significant drought or cutbacks to its SFPUC RWS supply, the City’s water users have limited ability to reduce consumption. Additionally, a common step taken by many municipalities to reduce water demand is to implement mandatory water restrictions on irrigation of extensive lawns at homes, schools, parks, cemeteries, and golf courses. These types of water uses are very limited in the City, and therefore are not options to reduce overall water demand in the city limits. This project will provide the City with a supplemental source of supply that will create a buffer for the City during droughts, such as the one that we are currently experiencing. Further, since the City will have an alternative supply during normal and drought years, so this project will reduce the City’s reliance on the SFPUC RWS, which benefits the region.
Human Right to Water This project will directly provide clean, affordable, and accessible water to the City and maintain an adequate level of public safety. As discussed, this project will increase distribution system pressures and fire flows, and augment the City’s drinking water supplies with water that meets all primary and secondary MCLs and water-quality standards. This project will also buffer the City and its customers against water-quality breaches in the SFPUC regional system and other potential supply disruptions. On March 3, 2015, the SFPUC released untreated water to the RWS, which the City had no choice but to serve to its customers, including those in the DAC neighborhoods, due to lack of storage or alternate sources within the City water system. Following the incident, residents were notified of the water-quality breach, and the SWRCB requested that the City prepare and implement a corrective action plan (CAP) to mitigate impacts of future water-quality breaches. The Gloria Way Well and Pad D Well are part of the CAP that is being prepared by the City.
Economic Need Every census tract within the City contains a DAC, approximately 65% of the residents are low-income (i.e., have an income level that is less than 80% of the San Mateo County median income), and 18.4% of the City’s residents are below the poverty line (as compared to 7.6% in San Mateo County and 15.9% in the State) (U.S. Census 2015). The current cost to purchase water from the SFPUC regional system is $1,960 per acre-foot. In contrast, the cost for the

Attachment 2 – Project Justification Project 4 – East Palo Alto Groundwater Supply Project
Bay Area Regional Climate Change Preparedness Program Att. 2-60 2015 IRWM Implementation Grant Application
City to produce groundwater is approximately $400 per acre-foot. Over a 20-year period, development of groundwater will save the City up to $37,000,000. By lowering the cost of the City’s water supply, this project will greatly benefit the City’s residents and businesses, especially those in the DAC neighborhoods. Further, additional supply will allow the City to approve new economic development projects within the City, which will provide millions of dollars in local and regional benefits.
2. Explanation of estimates of the without-project conditions (i.e. the levels of the physical benefits in the future, without the project, but with other planned projects).
Water Supply Without-Project Without an additional supply source, the City will have to either: (1) purchase additional water from the SFPUC RWS in volumes above its contractual entitlement (if that water is indeed available), or (2) cease economic development in the city limits. Both scenarios create significant uncertainty and vulnerability and create impacts locally and regionally.
The City has a contractual supply allocation of 2,199 AFY from the SFPUC regional system. The City’s 2010 UWMP estimated that the City’s demand in 2015 would be 2,658 AFY, which is 459 AFY more than the City’s supply allocation. The City’s demands are estimated to increase to 3,400 AFY by 2035, which is approximately 1,200 AFY more than the City’s contractual supply allocation from the SFPUC RWS (IRM 2013).
As discussed in the 2010 UWMP, recycled water could potentially be used to offset up to 150 AFY of potable water by 2025 (IRM 2013). Currently, the City’s wastewater is treated at the Palo Alto Regional Water Quality Control Plant, which produces recycled water. However, no infrastructure is in place to transfer the recycled wastewater to the City, nor to distribute the recycled water within the city limits.
The City currently has one of the lowest residential per-capita water uses in the State (45 R-GCPD). This usage is nearly half the statewide average of 87.5 R-GPCD (SWRCB 2015), making additional normal- and drought-year cutbacks difficult to achieve. Nonetheless, the City continues to take aggressive action to reduce water demand. As part of its ongoing water conservation program, the City provides rebates to its customers for selected water-efficient fixtures, such as washing machines, and participates in selected regional conservation programs offered by BAWSCA.
In response to the drought and to cutback requirements, the City is complying with the water-use restrictions mandated by the SWRCB (resolutions were passed by the City council on November 18, 2014, and July 7, 2015), which includes the following restrictions:
prohibits the application of potable water to outdoor landscapes in a manner that causes runoff onto adjacent property, non-irrigated areas, private and public walkways, roadways, parking lots, or structures.
requires that all garden hoses have shutoff nozzles. prohibits hosing down of driveways and sidewalks. prohibits the use of potable water in a fountain or other decorative water feature, except where such
water is part of a recirculating system. prohibits the application of potable water to outdoor landscapes during and within 48 hours after
measurable rainfall. prohibits irrigation with potable water of ornamental turf on public street medians. limits the watering of lawns and outside plantings to two (2) days per week.
Additionally, free faucet aerators, shower heads, and hose shutoff nozzles are being distributed to residents.
The without-project and with-project water supply conditions are displayed in the table below.

Attachment 2 – Project Justification Project 4 – East Palo Alto Groundwater Supply Project
Bay Area Regional Climate Change Preparedness Program Att. 2-61 2015 IRWM Implementation Grant Application
Overall, the without-project condition results in a normal-year water supply shortfall of up to 1,051 AFY in 2035, which would need to be purchased from SFPUC. However, this supply is not guaranteed to be available from the SFPUC RWS, which creates significant vulnerability for the City.
Emergency Supply Without-Project The City’s distribution system lacks any storage and redundancy to provide a secure water supply to major portions of the City during an emergency, and is unreliable during peak demand periods (i.e., system pressures are routinely as low as 20 psi in the DAC neighborhoods of the City). Without this project, the City will remain extremely vulnerable to fire and emergency situations. Further, the City has no emergency storage or functioning interties that feed its system, which means that if a catastrophic event disrupted its supply from the SFPUC RWS, the City residents and businesses would have no water. This project will add additional water supply sources at locations near the DAC neighborhoods to address these issues by augmenting supply and maintaining system pressures during peak demand periods or in the event of an emergency.
Drought Preparedness Without-Project The City is currently 100% dependent upon the SFPUC RWS, which can reduce deliveries by over 20% during dry years, creating a total supply shortfall for the City of up to 1,217 AFY by 2035 (IRM 2013). The City has limited ability to conserve during a drought without significant economic hardship due to its already low residential water use (45 GPCD).
Human Right to Water Without-Project Without this project, the City’s already water-efficient residents (among the lowest per-capita water users in the State) will have to make significant sacrifices to reduce water use further during a drought. Residents currently limit discretionary use of water (i.e., there is very limited outdoor irrigation of water within the City), and asking them to save more water (beyond the water conservation and drought measures already being implemented) would mean restricting use water for health and sanitation purposes. Furthermore, without this project and the supplemental supply benefits, the City’s population will remain extremely vulnerable to water-quality breaches, catastrophic supply interruptions, chronically low water pressures throughout the distribution system, and fire or other emergencies.
Economic Effects Without-Project This project provides a highly reliable and cost-effective source of water to the City and its DAC customers. Without this project, the City will be forced to purchase additional water, if available, from the SFPUC regional system at a cost of at least $1,960 per acre-foot, rather than developing groundwater at a cost of $400 per acre-foot. Over a 20-year period, purchasing SFPUC water will cost the City an extra $37,000,000 compared to use of groundwater. Furthermore, without this project, the City does not have sufficient water supply to support further economic development within the City, greatly impacting the economy, both locally and regionally.
Supply Source in 2035 at End of Project Life (AFY)
Total Supply (AFY)
Total Demand from UWMP
(in 2035) (AFY)
Water Shortfall (in 2035)
(AFY) SFPUC Gloria Way
Well Pad D Well
Recycled Water
(potential) Without Project Normal Year 2,199 0 0 150 2,349 3,400 1,051
Dry Year 2,033 0 0 150 2,183 3,400 1,217 With Project Normal Year 2,199 Up to 400-
450 Up to
500-750 150 3,249-
3,649 3,400 0-151
Dry Year 2,033 Up to 400-450
Up to 500-750
150 3,083-3,383
3,400 17-317

Attachment 2 – Project Justification Project 4 – East Palo Alto Groundwater Supply Project
Bay Area Regional Climate Change Preparedness Program Att. 2-62 2015 IRWM Implementation Grant Application
3. Description of the methods used to estimate the primary physical benefits.
Additional Water Supply The method used to estimate the total amount of additional potable water supply generated by the project included data from well pump tests and groundwater modeling and investigations to determine the potential hydraulic performance and production capacity of the two wells within the safe yield of the aquifer.
In the Draft Groundwater Management Plan for City of East Palo Alto (GWMP) (Todd 2015), the natural recharge to the aquifer was estimated to be between 5,000 and 10,000 AFY. Groundwater outflows include groundwater extraction at a rate of approximately 2,200 AFY, and subsurface outflow to the San Francisco Bay. Given that outflows from groundwater extraction are currently significantly less than the rate of recharge to the basin, it is estimated that additional pumping from the Gloria Way and Pad D wells can be accommodated within the safe yield of the groundwater basin. Extensive monitoring is being proposed as part of the GWMP to confirm the sustainable rates of groundwater use within the basin.
Multiple pump tests have been performed at the Gloria Way Well, the most recent being a short-duration performance test conducted in 2012 (Todd et al. 2012). The well was pumped for approximately 4 hours in order to confirm the historic flow rate and capacity of the well. It was determined that the Gloria Way Well could conservatively be pumped at a rate of 300 gpm, which would generate approximately 400-450 AFY (Todd et al. 2012).
The pump test performed at the Pad D Test Well included a step-drawdown test and a constant-rate 24-hour pump test. It was determined that a production well installed at the Pad D site could conservatively be pumped at a rate of 350 to 500 gpm, which would generate approximately 500 to 750 AFY (EKI 2014).
The test wells and modeling conducted as part of the groundwater investigations by the City indicate that with both wells operational, the City could add up to 1,200 AFY of groundwater as an additional water supply source.
Water Demand The City’s water demand, presented in the 2010 UWMP (IRM 2013), was based on projected population growth and current water usage rates, which are unlikely to change dramatically due to the current built-out status of the City and the already-low per-capita water use (45 R-GPCD residential) (IRM 2013). The UWMP presents estimated potable water demands every five years between 2015 and 2035, and projects an estimated 3,400 AFY of demand by 2035.
Similarly, the 2010 UWMP presents the volume of SFPUC and recycled water supplies projected to be available to the City during normal and dry years. These values were used herein to determine the potable water shortfall during normal and dry years in the City. The 2010 UWMP values are summarized in the table included with the response to Question 2, above.
4. Identification/description of all new facilities, policies, and actions required to obtain the physical benefits, i.e., any City policies or procedures that need to be established in order for the benefits to be realized.
The following permits are required for the project:
San Mateo County: Permit to construct the Pad D Well. SWRCB: Permits to activate the Gloria Way and Pad D Wells, and to operate treatment systems at each
well. Palo Alto Regional Water Quality Control Plant: Permits to discharge treatment system waste.
5. Description of potential adverse physical effects and what is being done to mitigate those impacts.
A CEQA/NEPA document has been completed for the construction and use of the Gloria Way Well and Treatment System (ESA 2013), and a CEQA/NEPA document will be prepared for the Pad D Well (anticipated to be complete in February 2016).
The following potential adverse physical effects associated with the Gloria Way well project were identified in the Gloria Way Well Retrofit Project Joint Initial Study and Environmental Assessment (ESA 2013). Similar impacts would be expected for the Pad D Well. The Pad D Well is located on an empty lot in a commercial area. Significant environmental impacts are not anticipated for the Pad D Well.

Attachment 2 – Project Justification Project 4 – East Palo Alto Groundwater Supply Project
Bay Area Regional Climate Change Preparedness Program Att. 2-63 2015 IRWM Implementation Grant Application
Aesthetics: The planned treatment system at Gloria Way Well will replace an existing hydropneumatic tank and associated piping. Mature trees and bushes may need to be removed in order to construct the treatment system. o Gloria Way Well Mitigation: Preparation of landscaping plans (ESA 2013, p. 3.3-1–3.3-4).
Traffic: Construction could affect traffic and roadway safety/accessibility. o Mitigation: Preparation of traffic control plans prior to the start of construction (ESA 2013, p. 3.4-1–3.4-
11).
Noise: Noise will be caused by construction, as well as during normal well and treatment system operations. o Mitigation: Preparation of construction noise control plans. Installing noise control enclosures on all
equipment to prevent exceedance of City noise ordinances (ESA 2013, p. 3.5-1–3.5-11).
Air Quality: Construction activities may impact air quality. o Mitigation: Implementation of dust control measures according to the Bay Area Air Quality Management
District construction measures (ESA 2013, p. 3.6-1–3.6-17).
Cultural Resources: Excavation and grading could uncover cultural resources or human remains. o Mitigation: Preparation of cultural resources monitoring and mitigation plans by a qualified archeologist
(ESA 2013, p. 3.8-1–3.8-17).
Biological Resources: Disturbance of nesting birds. o Mitigation: Construction will be performed and scheduled to minimize disturbance to nesting birds (ESA
2013, p. 3.9-1–3.9-9).
Water Quality: Construction activities may impact stormwater and surface water quality. o Mitigation: Implementation of construction best management practices (ESA 2013, p. 3.11-1–3.11-20).
Groundwater Hydrology: Operation of the wells could impact groundwater levels in nearby production wells. o Mitigation: The City shall perform private well-monitoring and implement mitigation actions for two years
following the start of pumping operations to ensure impacts are not significant (ESA 2013, p. 3.11-1–3.11-20).
6. Description of whether the proposed project effectively addresses long-term drought preparedness goals.
a. Promote water conservation, conjunctive use, reuse, and recycling: As a result of climate change, droughts are expected to become more frequent and severe. By expanding its water supply portfolio to include the in-lieu recharge of groundwater, the City will be better prepared to withstand future droughts. Specifically, this project:
increases water supply reliability; advances/expands conjunctive management of multiple water supply sources; provides additional water supply; and addresses other anticipated climate change impact (e.g., through water management system
modifications).
In lieu of developing surface water storage, this project uses groundwater as a source of underground storage that is available to the City during emergencies and drought years. Reduced use of groundwater during wet years will allow the basin to recharge, such that groundwater is available to augment the City’s supply during drought years, support summer peaking demands, and provide water in the event of an emergency.
b. Improve landscape and agricultural irrigation efficiencies: This project will not directly affect landscape and agricultural irrigation efficiencies.
c. Achieve long-term reduction of water use: This project will not directly affect long-term reductions in water use.
d. Efficient groundwater basin management: The City overlies the San Mateo Plain Groundwater Subbasin (DWR Basin 2-9.03), which is part of the larger Santa Clara Basin. Within the San Mateo Plain Subbasin is the northern portion of San Francisquito Cone,

Attachment 2 – Project Justification Project 4 – East Palo Alto Groundwater Supply Project
Bay Area Regional Climate Change Preparedness Program Att. 2-64 2015 IRWM Implementation Grant Application
which lies beneath the City.
The City and other basin stakeholders, including BAWSCA, Santa Clara Valley Water District, Alameda County Water District, SFPUC, San Mateo County, Palo Alto, Menlo Park, Foster City, Town of Atherton, Tuolumne River Trust, Palo Alto Park Mutual Water Company, and O'Conner Tract Co-op Water Company, have initiated work to develop a GWMP in support of this project. The GWMP is currently in draft form and is expected to be completed by the end of 2015.
The GWMP (Todd 2015) presents basin management objectives (BMOs) to ensure efficient and sustainable use of the groundwater basin. These BMOs address basin-wide concerns and potential impacts of increased pumping of the aquifer. The BMOs seek to:
maintain acceptable groundwater levels; avoid subsidence; protect groundwater quality; integrate management of groundwater and surface water; improve understanding of the groundwater system; and promote regional groundwater management.
To accomplish these BMOs, the City, along with other stakeholders, will undertake the following actions:
Perform public and stakeholder outreach. Conduct an extensive monitoring program, including monitoring of groundwater levels,
groundwater quality, well pumping, subsidence, saltwater intrusion, water balance items (recharge and outflow), surface water, and climate. Quarterly and annual reports will be prepared as part of the monitoring program.
Expand the monitoring network to include additional monitoring or sentry wells and additional land subsidence monitoring,
Conduct additional studies to better characterize the groundwater basin. Evaluate areas and sources (e.g., stormwater, recycled water, graywater) for managed aquifer
recharge. Collaborate with local agencies and organizations to encourage replacement of imported water
and groundwater with recycled water and graywater for landscaping and other non-potable uses as appropriate.
Prepare drinking water source assessments for all of its production wells as they are brought online.
Coordinate all work with local, state, and federal agencies.
e. Establish system interties: This project will not establish any system interties.
f. Solutions that yield a new water supply, such as seawater desalination: This project includes the development and use of groundwater as a new source of supply for the City and its DAC neighborhoods by supporting design and construction of a treatment system at the City’s currently-inactive Gloria Way Well and facilitating planning and design of a new municipal groundwater supply well and treatment system (Pad D Well). This project will add up to 900 to 1,200 AFY of new potable supply to the City. This groundwater supply will provide emergency and supply reliability to supplement the City’s supply from the SFPUC RWS.
References Cited for Primary Project Benefit
BAWSCA (Bay Area Water Supply & Conservation Agency). 2015. Long-Term Reliable Water Supply Strategy, Strategy Phase II Final Report, February 2015: p. ES-1.
CEDD (California Employment Development Department). 2015. Unemployment Data, June 2014. EKI (Erler & Kalinowski, Inc.). 2014. Report on Drilling, Construction, and Testing of the Pad D Test Well, 10 October
2014: p. 14-15. ESA. 2013. Gloria Way Well Retrofit Project Joint Initial Study and Environmental Assessment, June 2013. IRM (Integrated Resource Management). 2013. City of East Palo Alto 2010 Urban Water Management Plan, Amended 2
April 2013: p. 9.
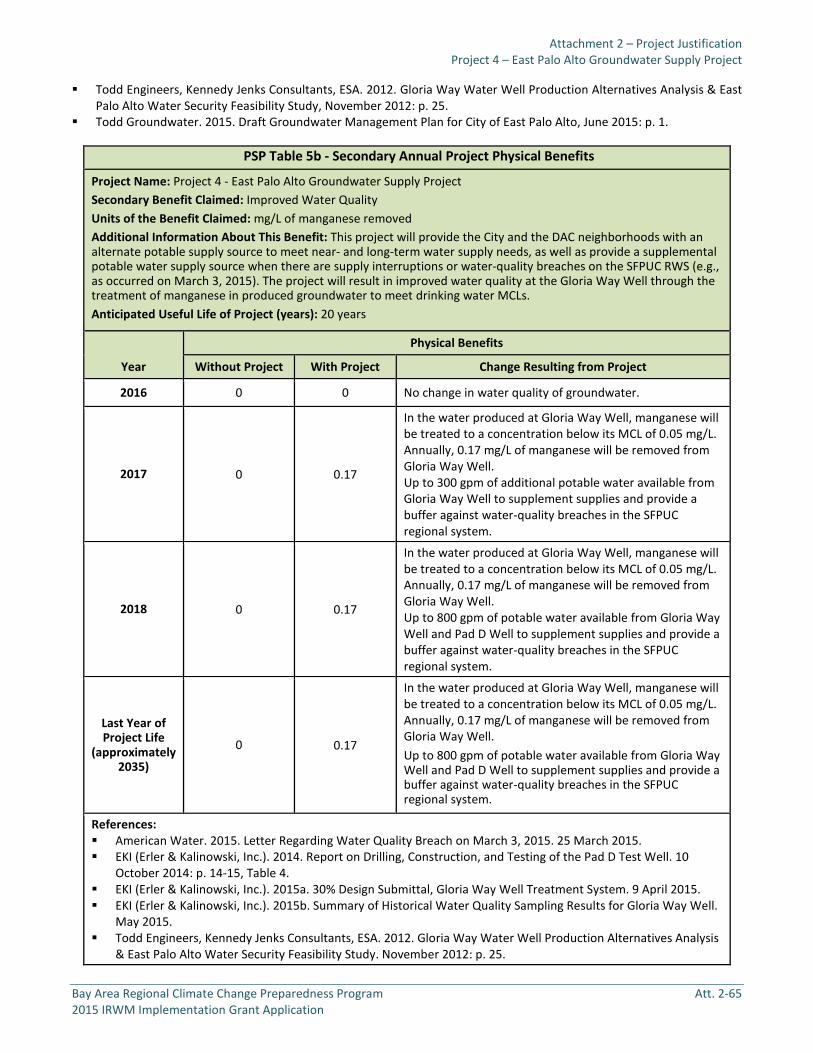
Attachment 2 – Project Justification Project 4 – East Palo Alto Groundwater Supply Project
Bay Area Regional Climate Change Preparedness Program Att. 2-65 2015 IRWM Implementation Grant Application
Todd Engineers, Kennedy Jenks Consultants, ESA. 2012. Gloria Way Water Well Production Alternatives Analysis & East Palo Alto Water Security Feasibility Study, November 2012: p. 25.
Todd Groundwater. 2015. Draft Groundwater Management Plan for City of East Palo Alto, June 2015: p. 1.
PSP Table 5b - Secondary Annual Project Physical Benefits
Project Name: Project 4 - East Palo Alto Groundwater Supply Project Secondary Benefit Claimed: Improved Water Quality Units of the Benefit Claimed: mg/L of manganese removed Additional Information About This Benefit: This project will provide the City and the DAC neighborhoods with an alternate potable supply source to meet near- and long-term water supply needs, as well as provide a supplemental potable water supply source when there are supply interruptions or water-quality breaches on the SFPUC RWS (e.g., as occurred on March 3, 2015). The project will result in improved water quality at the Gloria Way Well through the treatment of manganese in produced groundwater to meet drinking water MCLs. Anticipated Useful Life of Project (years): 20 years
Year
Physical Benefits
Without Project With Project Change Resulting from Project
2016 0 0 No change in water quality of groundwater.
2017 0 0.17
In the water produced at Gloria Way Well, manganese will be treated to a concentration below its MCL of 0.05 mg/L. Annually, 0.17 mg/L of manganese will be removed from Gloria Way Well. Up to 300 gpm of additional potable water available from Gloria Way Well to supplement supplies and provide a buffer against water-quality breaches in the SFPUC regional system.
2018 0 0.17
In the water produced at Gloria Way Well, manganese will be treated to a concentration below its MCL of 0.05 mg/L. Annually, 0.17 mg/L of manganese will be removed from Gloria Way Well. Up to 800 gpm of potable water available from Gloria Way Well and Pad D Well to supplement supplies and provide a buffer against water-quality breaches in the SFPUC regional system.
Last Year of Project Life
(approximately 2035)
0 0.17
In the water produced at Gloria Way Well, manganese will be treated to a concentration below its MCL of 0.05 mg/L. Annually, 0.17 mg/L of manganese will be removed from Gloria Way Well. Up to 800 gpm of potable water available from Gloria Way Well and Pad D Well to supplement supplies and provide a buffer against water-quality breaches in the SFPUC regional system.
References: American Water. 2015. Letter Regarding Water Quality Breach on March 3, 2015. 25 March 2015. EKI (Erler & Kalinowski, Inc.). 2014. Report on Drilling, Construction, and Testing of the Pad D Test Well. 10
October 2014: p. 14-15, Table 4. EKI (Erler & Kalinowski, Inc.). 2015a. 30% Design Submittal, Gloria Way Well Treatment System. 9 April 2015. EKI (Erler & Kalinowski, Inc.). 2015b. Summary of Historical Water Quality Sampling Results for Gloria Way Well.
May 2015. Todd Engineers, Kennedy Jenks Consultants, ESA. 2012. Gloria Way Water Well Production Alternatives Analysis
& East Palo Alto Water Security Feasibility Study. November 2012: p. 25.
Attachment 2 – Project Justification Project 4 – East Palo Alto Groundwater Supply Project
Bay Area Regional Climate Change Preparedness Program Att. 2-66 2015 IRWM Implementation Grant Application
Technical Analysis of Secondary Physical Benefits Claimed
1. Explanation of the need for the project, including recent and historical conditions that provide background for benefits to be claimed; e.g., recent water shortages, loss of habitat or ecosystem function, and water-quality problems.
The City has multiple water-quality needs that will be addressed by this project. The City has a single source of supply, which makes it vulnerable to water-quality breaches that directly affect its customers, including the Human Right to Water for DACs. The proposed secondary supply source (groundwater) must meet federal and state water-quality standards to protect public health and safety, particularly for DACs. These needs will be met by constructing and operating a water treatment facility at the City’s existing Gloria Way Well so that safe, reliable water can be provided to DACs in the City.
Water samples collected from the Pad D test well did not exceed any primary or secondary MCLs, indicating that treatment of the produced groundwater may not be required in order to meet drinking water standards (EKI 2014). However, it should be noted that water quality measured in the test well samples is a snapshot of the groundwater in the vicinity of the test well at the time of sampling. Water quality may change as groundwater is pumped. Thus, either a treatment system and/or blending with a higher quality source (i.e., the City’s existing supply from the SFPUC RWS) will be incorporated into the design of the Pad D Well.
Water-Quality Need The Gloria Way Well currently produces non-potable water due to high levels of manganese and therefore has limited uses and is not operated. Based on recent water-quality data, water produced from the Gloria Way Well contains manganese at concentrations up to 0.19 mg/L, which is greater than the secondary MCL of 0.05 mg/L (EKI 2015b).
As part of the project, the City proposes to design, construct, and operate a groundwater treatment system at the Gloria Way Well. Using chemical oxidation and filtration, the proposed treatment system at the Gloria Way Well will reduce the concentration of manganese to below its MCL prior to delivery to the City’s customers (EKI 2015a).
By treating up to 450 AFY of the produced groundwater, the City will ensure that the supplemental supply source will meet all primary and secondary California MCLs and applicable water-quality standards.
Public Health and Safety Need The City currently does not have any storage tanks or alternative supplies that can provide a source of treated water during emergencies or other supply disruptions, which makes the City and its customers extremely vulnerable.
On March 3, 2015, the SFPUC released untreated water to the RWS, which the City had no choice but to serve to its customers, including those in the DAC neighborhoods, due to lack of storage or alternate sources within the City water system. Following the incident, residents were notified of the water-quality breach, and the SWRCB requested that the City prepare and implement a CAP to mitigate impacts of future water-quality breaches. The Gloria Way Well and Pad D Well are part of the CAP that is being prepared by the City. This project will provide the City and its customers with an alternative source of high-quality, potable water that it can use during emergencies and other supply interruptions.
By adding a groundwater treatment system at the Gloria Way Well, the City will be able to treat and distribute 400-450 AFY of high-quality water to its customers, including DACs, during water-quality breaches on the SFPUC RWS or during other emergency events.
2. Explanation of your estimates of the without-project conditions (i.e., explain the levels of the physical benefits in the future, without the project, but with other planned projects).
Water Quality The Gloria Way Well currently only produces non-potable water due to concentrations of manganese above its MCL. The produced groundwater is only being used for non-potable uses, such as construction dust control, equipment cleaning, and street sweeping. Without this project, the Gloria Way Well will remain a poor-quality water source with limited uses.

Attachment 2 – Project Justification Project 4 – East Palo Alto Groundwater Supply Project
Bay Area Regional Climate Change Preparedness Program Att. 2-67 2015 IRWM Implementation Grant Application
Public Health and Safety The intent of this project is to provide clean, safe, reliable drinking water to the City’s customers and maintain an adequate level of public safety. Specifically, the project will increase system pressures and fire flows in the DAC portions of the City, and augment the City’s drinking water supplies with water that meets all primary and secondary MCLs. Without this project, there would be no buffer against water-quality breaches in the SFPUC RWS, and the City’s customers would continue to be vulnerable to other emergency events.
3. Description of the methods used to estimate the secondary physical benefits. As part of the design of the Gloria Way Well Treatment System, extensive water-quality sampling was done and prior data were reviewed to understand the baseline quality of the groundwater. As described in the 30% Design Submittal for the Gloria Way Well (EKI 2015a), the treatment system will be designed with appropriate chemical treatment, filtration, and blending to achieve treated water quality that meets or exceeds all primary and secondary MCLs prior to entering the City’s distribution system.
4. Identification/description of all new facilities, policies, and actions required to obtain the physical benefits, i.e., any City policies or procedures that need to be established in order for the benefits to be realized. No new policies are needed to achieve the physical benefits.
The following permits are required for the project:
San Mateo County: Permit to construct the Pad D Well. SWRCB: Permits to activate the Gloria Way and Pad D Wells, and to operate treatment systems at each
well. Palo Alto Regional Water Quality Control Plant: Permits to discharge treatment system waste.
5. Description of potential adverse physical effects and what is being done to mitigate those impacts. See list of impacts under the Primary Benefit technical analysis discussion, above.
6. Description of whether the proposed project effectively addresses long-term drought preparedness goals.
a. Promote water conservation, conjunctive use, reuse, and recycling: See the Primary Benefit technical analysis discussion, above.
b. Improve landscape and agricultural irrigation efficiencies: This project does not improve landscape and agricultural irrigation efficiencies.
c. Achieve long-term reduction of water use: This project does not achieve long-term reduction of water use. d. Efficient groundwater basin management: See the Primary Benefit technical analysis discussion, above. e. Establish system interties: This project does not establish system interties. f. Solutions that yield a new water supply, such as seawater desalination: See the Primary Benefit technical
analysis discussion, above.
References Cited for Secondary Project Benefit
American Water. 2015. Letter Regarding Water Quality Breach on March 3, 2015. 25 March 2015. EKI (Erler & Kalinowski, Inc.). 2014. Report on Drilling, Construction, and Testing of the Pad D Test Well. 10 October
2014: p. 14-15, Table 4. EKI (Erler & Kalinowski, Inc.). 2015a. 30% Design Submittal, Gloria Way Well Treatment System. 9 April 2015. EKI (Erler & Kalinowski, Inc.). 2015b. Summary of Historical Water Quality Sampling Results for Gloria Way Well. May
2015. Todd Engineers, Kennedy Jenks Consultants, ESA. 2012. Gloria Way Water Well Production Alternatives Analysis & East
Palo Alto Water Security Feasibility Study. November 2012: p. 25.
Attachment 2 – Project Justification Project 4 – East Palo Alto Groundwater Supply Project
Bay Area Regional Climate Change Preparedness Program Att. 2-68 2015 IRWM Implementation Grant Application
D. Direct Water-Related Benefit to a DAC
This project will provide clean, safe, affordable, and accessible water for human consumption, cooking, and sanitary purposes to the City of East Palo Alto. As shown on the project map, the DAC census blocks cover 0.84 square miles. This is approximately 33% of the area to be served by the project (2.58 square miles). This project directly supports the Human Right to Water.
Citywide, 50% of residents are considered low-income (i.e., have an income level that is less than 80% of the State median income), and 18.4% of the City’s residents are below the poverty line (as compared to 7.6% in San Mateo County and 15.9% in the State) (U.S. Census 2015). Approximately 13,226 City residents live in DAC neighborhoods. These residents represent approximately 45% of City residents. Therefore, the City’s needs, as previously discussed in the benefits section, reflect the needs of the DAC. These needs include (1) increased water supply, (2) drought relief and preparedness, (3) increased system pressure for routine and emergency use, (4) reduced cost for water, and (5) human right to water.
This project will have major benefits to the DAC neighborhoods within the City, as it will help to meet all needs described above. It will improve fire flow and reduce drought hardships by increasing system pressures in those neighborhoods, which system pressures are chronically as low as 20 psi and are a source of significant complaints. Because the cost to produce local groundwater is only approximately $400 per acre-foot (as compared to $1,960 per acre-foot for water purchased from the SFPUC RWS), this project will reduce the cost of water for residents.
This project will provide all of the benefits noted above to approximately 13,226 residents in DAC neighborhoods within the City, including to approximately 1,374 persons in Tract 612000 Block 4, 1,596 persons in Tract 612000 Block 1, 2,254 persons in Tract 612100 Block 2, 1,213 persons in Tract 612100 Block 3, 897 persons in Tract 612100 Block 4, 2,161 persons in Tract 612100 Block 5, 2,608 persons in Tract 611900 Block 5, and 1,123 persons in Tract 611900 Block 4. The residents of these DAC blocks represent approximately 45% of City residents.
All benefits provided by this project will directly affect the DACs (providing increased water supply, drought relief and preparedness, increased system pressure for routine and emergency use, reduced cost for water, and human right to water). Additionally, input from DACs (e.g., complaints of low water pressure and associated human health dangers) is one of the primary reasons the City is pursuing this project. As the project moves forward, the DACs will continue to be engaged in the development and preparation of the project.

Attachment 2 – Project Justification Project 4 – East Palo Alto Groundwater Supply Project
Bay Area Regional Climate Change Preparedness Program Att. 2-69 2015 IRWM Implementation Grant Application
E. Project Performance Monitoring Plan
PSP Table 6–Project Performance Monitoring Plan Project 4–East Palo Alto Groundwater Supply Project
Proposed Physical Benefits Targets or Milestones Measurement Tools and Methods Evaluation Increased Potable Water Supply
1. Completion of the design of the Gloria Way Treatment System in December 2015.
2. Completion of the construction of the Gloria Way Treatment System in September 2016.
3. Completion of the design of the Pad D Well and Treatment System in December 2016.
4. Completion of the construction of the Pad D Well and Treatment System in December 2017.
Water metering before and after the project, at the project sites and throughout the City.
The project will be monitored and evaluated in future UWMPs, in updates to the City’s GWMP, and through reporting to DWR and SWRCB.
Water Quality Treatment of manganese to below its MCL of 0.05 mg/L.
1. Analysis of well treatment effluent according to SWRCB requirements.
2. Daily readings of performance gauges and water-quality meters at the treatment plants to ensure proper operation.
The project will be monitored and evaluated in future UWMPs, in updates to the City’s GWMP, and through reporting to the DWR and SWRCB.
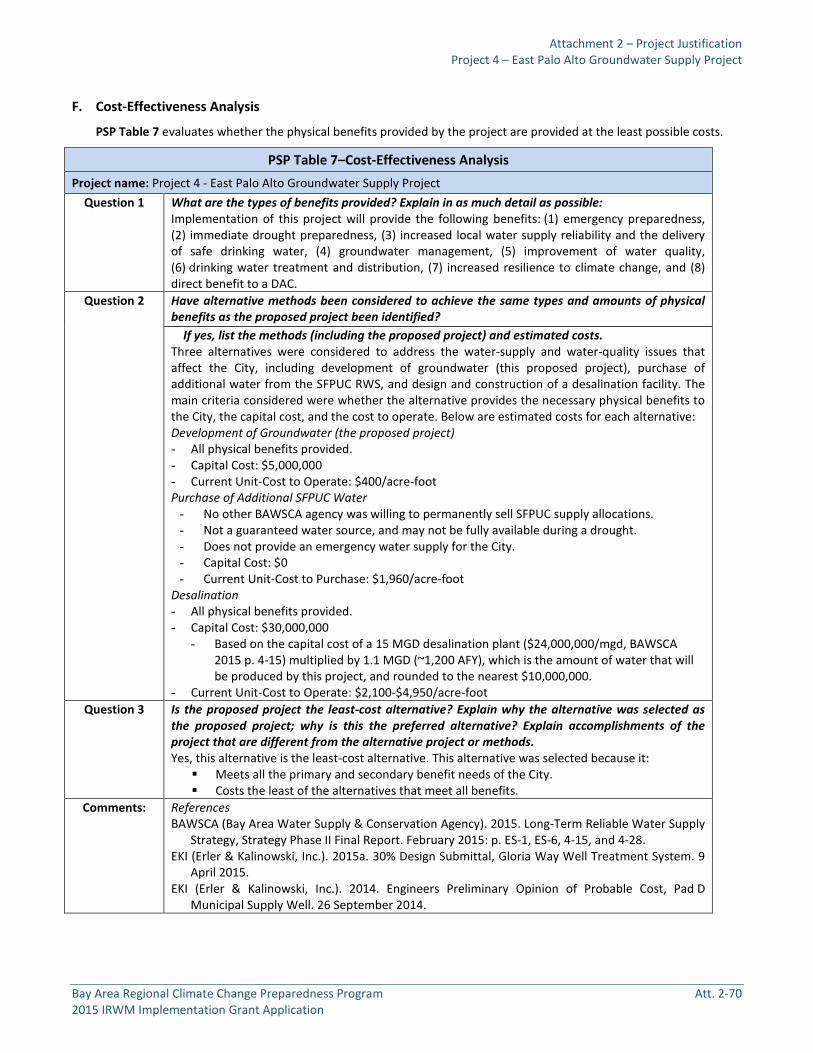
Attachment 2 – Project Justification Project 4 – East Palo Alto Groundwater Supply Project
Bay Area Regional Climate Change Preparedness Program Att. 2-70 2015 IRWM Implementation Grant Application
F. Cost-Effectiveness Analysis
PSP Table 7 evaluates whether the physical benefits provided by the project are provided at the least possible costs.
PSP Table 7–Cost-Effectiveness Analysis Project name: Project 4 - East Palo Alto Groundwater Supply Project
Question 1 What are the types of benefits provided? Explain in as much detail as possible: Implementation of this project will provide the following benefits: (1) emergency preparedness, (2) immediate drought preparedness, (3) increased local water supply reliability and the delivery of safe drinking water, (4) groundwater management, (5) improvement of water quality, (6) drinking water treatment and distribution, (7) increased resilience to climate change, and (8) direct benefit to a DAC.
Question 2 Have alternative methods been considered to achieve the same types and amounts of physical benefits as the proposed project been identified? If yes, list the methods (including the proposed project) and estimated costs. Three alternatives were considered to address the water-supply and water-quality issues that affect the City, including development of groundwater (this proposed project), purchase of additional water from the SFPUC RWS, and design and construction of a desalination facility. The main criteria considered were whether the alternative provides the necessary physical benefits to the City, the capital cost, and the cost to operate. Below are estimated costs for each alternative: Development of Groundwater (the proposed project) - All physical benefits provided. - Capital Cost: $5,000,000 - Current Unit-Cost to Operate: $400/acre-foot Purchase of Additional SFPUC Water
- No other BAWSCA agency was willing to permanently sell SFPUC supply allocations. - Not a guaranteed water source, and may not be fully available during a drought. - Does not provide an emergency water supply for the City. - Capital Cost: $0 - Current Unit-Cost to Purchase: $1,960/acre-foot
Desalination - All physical benefits provided. - Capital Cost: $30,000,000
- Based on the capital cost of a 15 MGD desalination plant ($24,000,000/mgd, BAWSCA 2015 p. 4-15) multiplied by 1.1 MGD (~1,200 AFY), which is the amount of water that will be produced by this project, and rounded to the nearest $10,000,000.
- Current Unit-Cost to Operate: $2,100-$4,950/acre-foot Question 3 Is the proposed project the least-cost alternative? Explain why the alternative was selected as
the proposed project; why is this the preferred alternative? Explain accomplishments of the project that are different from the alternative project or methods. Yes, this alternative is the least-cost alternative. This alternative was selected because it: Meets all the primary and secondary benefit needs of the City. Costs the least of the alternatives that meet all benefits.
Comments: References BAWSCA (Bay Area Water Supply & Conservation Agency). 2015. Long-Term Reliable Water Supply
Strategy, Strategy Phase II Final Report. February 2015: p. ES-1, ES-6, 4-15, and 4-28. EKI (Erler & Kalinowski, Inc.). 2015a. 30% Design Submittal, Gloria Way Well Treatment System. 9
April 2015. EKI (Erler & Kalinowski, Inc.). 2014. Engineers Preliminary Opinion of Probable Cost, Pad D
Municipal Supply Well. 26 September 2014.
Attachment 2 – Project Justification Project 4 – East Palo Alto Groundwater Supply Project
Bay Area Regional Climate Change Preparedness Program Att. 2-71 2015 IRWM Implementation Grant Application
G. References Cited:
American Water. 2015. Letter Regarding Water Quality Breach on March 3, 2015. 25 March 2015.
BAWSCA (Bay Area Water Supply & Conservation Agency). 2015. Long-Term Reliable Water Supply Strategy, Strategy Phase II Final Report, February 2015.
EKI (Erler & Kalinowski, Inc.). 2015a. 30% Design Submittal, Gloria Way Well Treatment System. 9 April 2015.
EKI (Erler & Kalinowski, Inc.). 2015b. Summary of Historical Water Quality Sampling Results for Gloria Way Well. May 2015.
EKI (Erler & Kalinowski, Inc.). 2014. Report on Drilling, Construction, and Testing of the Pad D Test Well. 10 October 2014.
EKI (Erler & Kalinowski, Inc.). 2014. Engineers Preliminary Opinion of Probable Cost, Pad D Municipal Supply Well. 26 September 2014.
ESA. 2013. Gloria Way Well Retrofit Project Joint Initial Study and Environmental Assessment. June 2013.
HDR. 2004. East Palo Alto Area, Gloria Way Well Investigation Summary Report, April 2004.
IRM (Integrated Resource Management). 2013. City of East Palo Alto 2010 Urban Water Management Plan. Amended 2 April 2013.
SWRCB (State Water Resources Control Board). 2015. Fact Sheet, May 2015 Statewide Conservation Progress. June 2015.
Todd Engineers, Kennedy Jenks Consultants, ESA. 2012. Gloria Way Water Well Production Alternatives Analysis & East Palo Alto Water Security Feasibility Study. November 2012.
Todd Groundwater. 2015. Draft Groundwater Management Plan for City of East Palo Alto. June 2015.
U.S. Census Bureau. 2015. East Palo Alto, 2009-2013 American Community Survey 5-Year Estimates. July 2015.
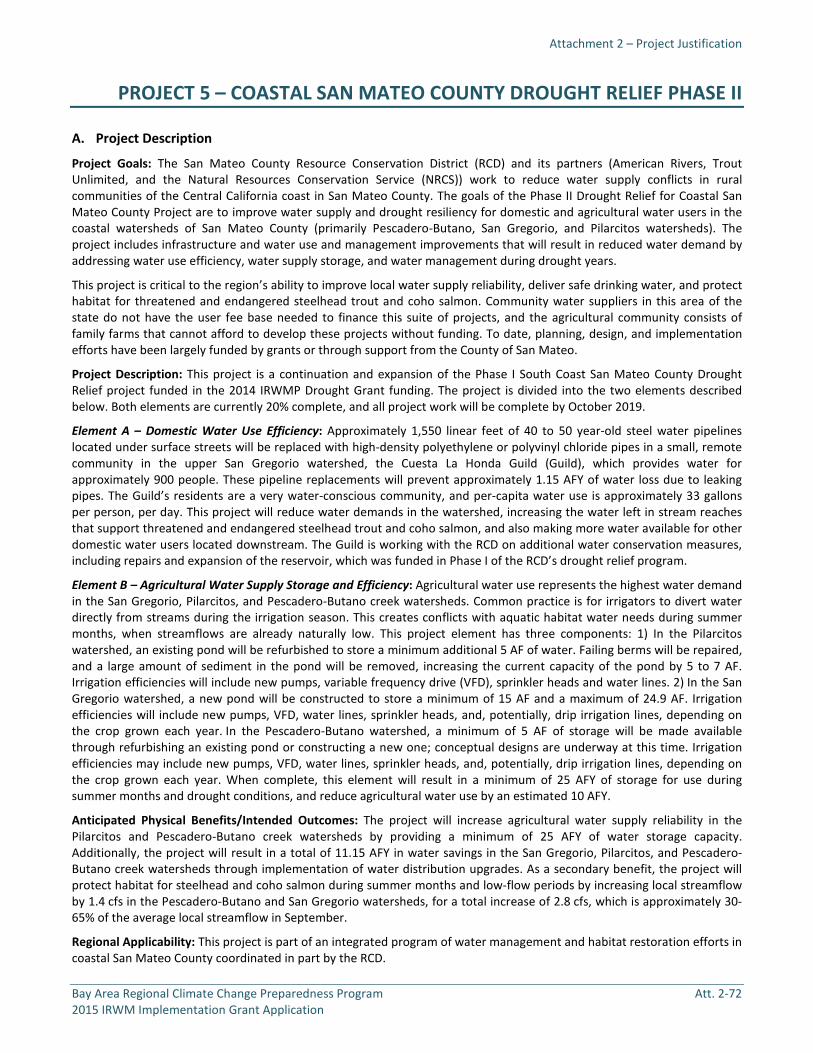
Attachment 2 – Project Justification
Bay Area Regional Climate Change Preparedness Program Att. 2-72 2015 IRWM Implementation Grant Application
PROJECT 5 – COASTAL SAN MATEO COUNTY DROUGHT RELIEF PHASE II
A. Project Description
Project Goals: The San Mateo County Resource Conservation District (RCD) and its partners (American Rivers, Trout Unlimited, and the Natural Resources Conservation Service (NRCS)) work to reduce water supply conflicts in rural communities of the Central California coast in San Mateo County. The goals of the Phase II Drought Relief for Coastal San Mateo County Project are to improve water supply and drought resiliency for domestic and agricultural water users in the coastal watersheds of San Mateo County (primarily Pescadero-Butano, San Gregorio, and Pilarcitos watersheds). The project includes infrastructure and water use and management improvements that will result in reduced water demand by addressing water use efficiency, water supply storage, and water management during drought years.
This project is critical to the region’s ability to improve local water supply reliability, deliver safe drinking water, and protect habitat for threatened and endangered steelhead trout and coho salmon. Community water suppliers in this area of the state do not have the user fee base needed to finance this suite of projects, and the agricultural community consists of family farms that cannot afford to develop these projects without funding. To date, planning, design, and implementation efforts have been largely funded by grants or through support from the County of San Mateo.
Project Description: This project is a continuation and expansion of the Phase I South Coast San Mateo County Drought Relief project funded in the 2014 IRWMP Drought Grant funding. The project is divided into the two elements described below. Both elements are currently 20% complete, and all project work will be complete by October 2019.
Element A – Domestic Water Use Efficiency: Approximately 1,550 linear feet of 40 to 50 year-old steel water pipelines located under surface streets will be replaced with high-density polyethylene or polyvinyl chloride pipes in a small, remote community in the upper San Gregorio watershed, the Cuesta La Honda Guild (Guild), which provides water for approximately 900 people. These pipeline replacements will prevent approximately 1.15 AFY of water loss due to leaking pipes. The Guild’s residents are a very water-conscious community, and per-capita water use is approximately 33 gallons per person, per day. This project will reduce water demands in the watershed, increasing the water left in stream reaches that support threatened and endangered steelhead trout and coho salmon, and also making more water available for other domestic water users located downstream. The Guild is working with the RCD on additional water conservation measures, including repairs and expansion of the reservoir, which was funded in Phase I of the RCD’s drought relief program.
Element B – Agricultural Water Supply Storage and Efficiency: Agricultural water use represents the highest water demand in the San Gregorio, Pilarcitos, and Pescadero-Butano creek watersheds. Common practice is for irrigators to divert water directly from streams during the irrigation season. This creates conflicts with aquatic habitat water needs during summer months, when streamflows are already naturally low. This project element has three components: 1) In the Pilarcitos watershed, an existing pond will be refurbished to store a minimum additional 5 AF of water. Failing berms will be repaired, and a large amount of sediment in the pond will be removed, increasing the current capacity of the pond by 5 to 7 AF. Irrigation efficiencies will include new pumps, variable frequency drive (VFD), sprinkler heads and water lines. 2) In the San Gregorio watershed, a new pond will be constructed to store a minimum of 15 AF and a maximum of 24.9 AF. Irrigation efficiencies will include new pumps, VFD, water lines, sprinkler heads, and, potentially, drip irrigation lines, depending on the crop grown each year. In the Pescadero-Butano watershed, a minimum of 5 AF of storage will be made available through refurbishing an existing pond or constructing a new one; conceptual designs are underway at this time. Irrigation efficiencies may include new pumps, VFD, water lines, sprinkler heads, and, potentially, drip irrigation lines, depending on the crop grown each year. When complete, this element will result in a minimum of 25 AFY of storage for use during summer months and drought conditions, and reduce agricultural water use by an estimated 10 AFY.
Anticipated Physical Benefits/Intended Outcomes: The project will increase agricultural water supply reliability in the Pilarcitos and Pescadero-Butano creek watersheds by providing a minimum of 25 AFY of water storage capacity. Additionally, the project will result in a total of 11.15 AFY in water savings in the San Gregorio, Pilarcitos, and Pescadero-Butano creek watersheds through implementation of water distribution upgrades. As a secondary benefit, the project will protect habitat for steelhead and coho salmon during summer months and low-flow periods by increasing local streamflow by 1.4 cfs in the Pescadero-Butano and San Gregorio watersheds, for a total increase of 2.8 cfs, which is approximately 30-65% of the average local streamflow in September.
Regional Applicability: This project is part of an integrated program of water management and habitat restoration efforts in coastal San Mateo County coordinated in part by the RCD.
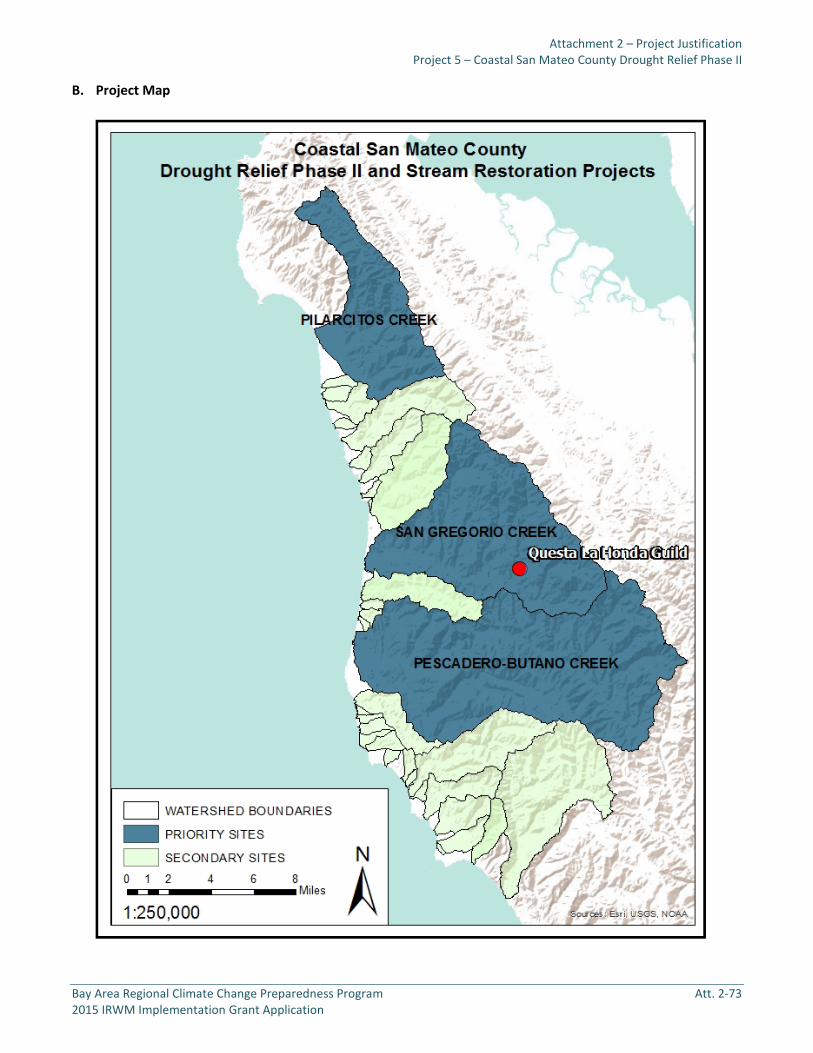
Attachment 2 – Project Justification Project 5 – Coastal San Mateo County Drought Relief Phase II
Bay Area Regional Climate Change Preparedness Program Att. 2-73 2015 IRWM Implementation Grant Application
B. Project Map

Attachment 2 – Project Justification Project 5 – Coastal San Mateo County Drought Relief Phase II
Bay Area Regional Climate Change Preparedness Program Att. 2-74 2015 IRWM Implementation Grant Application
C. Project Physical Benefits
Primary and secondary project physical benefits are summarized in PSP Tables 5a and 5b, respectively, as follows.
Technical Analysis of Primary Physical Benefits Claimed
1. Explanation of the need for the project, including recent and historical conditions that provide background for benefits to be claimed; e.g., recent water shortages, loss of habitat or ecosystem function, and water quality problems.
In an effort to address the lack of water availability during drought conditions, the San Gregorio Creek watermaster has instituted water rationing in the area through no-pump days, and community water suppliers have coordinated conservation efforts the past four water years. Community water supply infrastructure was primarily constructed between 1930 and 1960; some of the main water distribution lines and other infrastructure are approximately 50 years old and at risk of breaks or failures. Typically, farmers in this area use pumps that divert streamflows at rates between 250 and 500 gallons per minute (gpm), but some divert as much as 750 gpm. By installing high-efficiency pumps with lower pumping rates (i.e., 100 gpm or less), the occurrence of localized dewatering and impacts to salmonids and salmonid habitat will be reduced (American Rivers 2013).
The Cuesta La Honda Guild is a community of approximately 800-900 homes located in a rural community within the San Gregorio watershed in San Mateo County (see project map). The Guild currently has 47 AF of water storage capacity, and its annual water need under the rationing program implemented in 2014 was 42 AF. The Guild is already a very water-conscious community that uses approximately 33 gallons per person per day. The Guild relies solely on surface water withdrawals year-round from headwaters in San Gregorio Creek to fill its water storage, and it regularly experiences difficulties in meeting demands for its residents due to low flows in the creek, water quality issues, and mandatory no-pump days. The Guild is actively fixing leaking pipelines and improving water storage facilities to increase its water systems capacity to serve its residents. As a result of project’s Element A, the Guild will save approximately 2.7% of the annual water need each year. The Guild draws water directly
PSP Table 5a - Primary Annual Project Physical Benefits
Project Name: Project 5 - Coastal San Mateo County Drought Relief Phase II Type of Benefit Claimed: Water Supply Saved Units of the Benefit Claimed: AFY Additional Information About This Benefit: The project will increase available water supply by repairing and replacing leaking distribution pipes; installing high-efficiency sprinklers, drip irrigation systems, high-efficiency low-flow pumps, and water meters; and conducting training. Anticipated Useful Life of Project (years): 30 years
Year
Physical Benefits
Without Project With Project Change Resulting from Project
2016 0 0.56 Water savings of 0.56 AFY. Element A would begin repairs to domestic water supply infrastructure, and benefits would be seen immediately.
2017 0 10.84 Water savings of 10.84 AFY. Increased benefit from Element A and Element B would begin to show benefits through agricultural water storage efficiency.
2018 0 11.15 Water savings of 11.15 AFY. Elements A and B complete.
Last Year of Project Life
(approximately 2048)
0 11.15 Water savings of 11.15 AFY. Elements A and B complete.
Comments: Estimates of water storage and water saving outcomes are based on professional judgement by engineers and water system managers for each site.

Attachment 2 – Project Justification Project 5 – Coastal San Mateo County Drought Relief Phase II
Bay Area Regional Climate Change Preparedness Program Att. 2-75 2015 IRWM Implementation Grant Application
upstream from San Mateo County Service Area 7 (CSA 7) creek intakes, a County of San Mateo-operated water supply service area located adjacent to and immediately south of the Guild. In the past, the County experienced difficulties withdrawing sufficient quantities of surface water for CSA 7 and had to lower its intake on San Gregorio Creek to alleviate this issue in the summer of 2014. Project Element A will result in less water withdrawn upstream of CSA 7 during low flow periods, and will thus benefit summer flows in San Gregorio Creek and remove conflicts with CSA 7 withdraws.
Water supply reliability will increase as a result of the project’s additional water storage, which will provide supplies during late summer months and prolonged drought periods, when surface water is unable to meet water demands. Water supply reliability will also be improved by reducing summer water demands and water use conflicts through water efficiency projects and coordinating water diversion and management activities (Stillwater Sciences 2014:7; Alford 2010:67-69; PWA 2008:14, 15, 24, 84-85). Water rights allocated in the region exceed actual surface water supply during late summer months in dry water years (Alford 2010:56).
For Element B, three project sites are located on active agricultural properties, one each in the San Gregorio, Pilarcitos, and Pescadero-Butano creek watersheds. All are described below.
The agricultural site in the San Gregorio watershed currently relies entirely on direct withdraws from San Gregorio Creek that do not provide reliable quantities of water throughout the summer growing season. This agricultural operation currently has no water storage facilities for irrigating crops. Existing small catchments on the property are filled with overland winter flow and are used only for stock water. At this site, a 15-to-24.9-AF pond is proposed for construction to store year-round water supply for both the cattle and row crop operations. Water use efficiency measures will also be implemented, such as new, smaller pumps, VFD, water lines, sprinkler heads, and, potentially, drip irrigation lines, to reduce overall water demand and result in less water withdrawn from San Gregorio Creek.
The agricultural operation in the Pilarcitos watershed has a total of 54 AF of water storage to meet a 120 AF/year demand and depends on water from a well (50 gpm), surface water diversions from Arroyo Leon Creek, a tributary to Pilarcitos Creek, and overland winter flow into the ponds to irrigate 70 acres of farmland. One of these ponds is in disrepair; if brought back online, it would increase total storage by approximately 10 AF. As a result of this project, an additional 10 acres of farmland would become farmable again. This portion of land has had to remain fallow due to the lack of water storage and insufficient availability of surface flows from Arroyo Leon Creek to supply the other functional ponds. Water use efficiency measures will also be implemented, such as new, smaller pumps, VFD, water lines, and sprinkler heads, to reduce overall water demand and result in less water withdrawn from Arroyo Leon Creek.
The agricultural operation in the Pescadero-Butano watershed currently has approximately 10 AF of water storage and a yearly water demand of approximately 20 AF per year. An increase of 10 AF of water storage would represent a 100% increase in water storage and has the potential to eliminate the need for summer diversions from surface water. Furthermore, the proposed system would capture rainwater from the greenhouse roofs. The current water storage capacity of the operation is not sufficient to last through the growing season, and the surface water supply is not dependable for meeting irrigation needs in the late summer and early fall. During the summer of 2014, surface water was insufficient to meet irrigation needs, and the operation was forced to forgo planting additional crops. In addition to expanding water storage, water use efficiency measures will be implemented, such as new, smaller pumps, VFD, water lines, sprinkler heads, and, potentially, drip irrigation lines, to reduce overall water demand and result in less water withdrawn from Pescadero Creek.
Overall, this project will result in an estimated increase of 25 AFY (8.15 MGY) in additional water storage capacity and 11.15 AFY (3.6 MGY) of reduced water need due to efficiency improvements. Increased water savings for the Cuesta La Honda Guild Community are roughly equivalent to 2.7% of domestic water allocations in the area.
2. Explanation of estimates of the without-project conditions (i.e., the levels of the physical benefits in the future, without the project, but with other planned projects).
Without the repair of 1,500 feet of leaking pipelines (Element A), the Cuesta La Honda Guild will lose 2.7% of its annual water need (under rationing conditions) every year.
Without the development of additional water storage and substantial reductions in agricultural water demand (Element B), the ability to meet immediate and long-term human and environmental needs in the region during
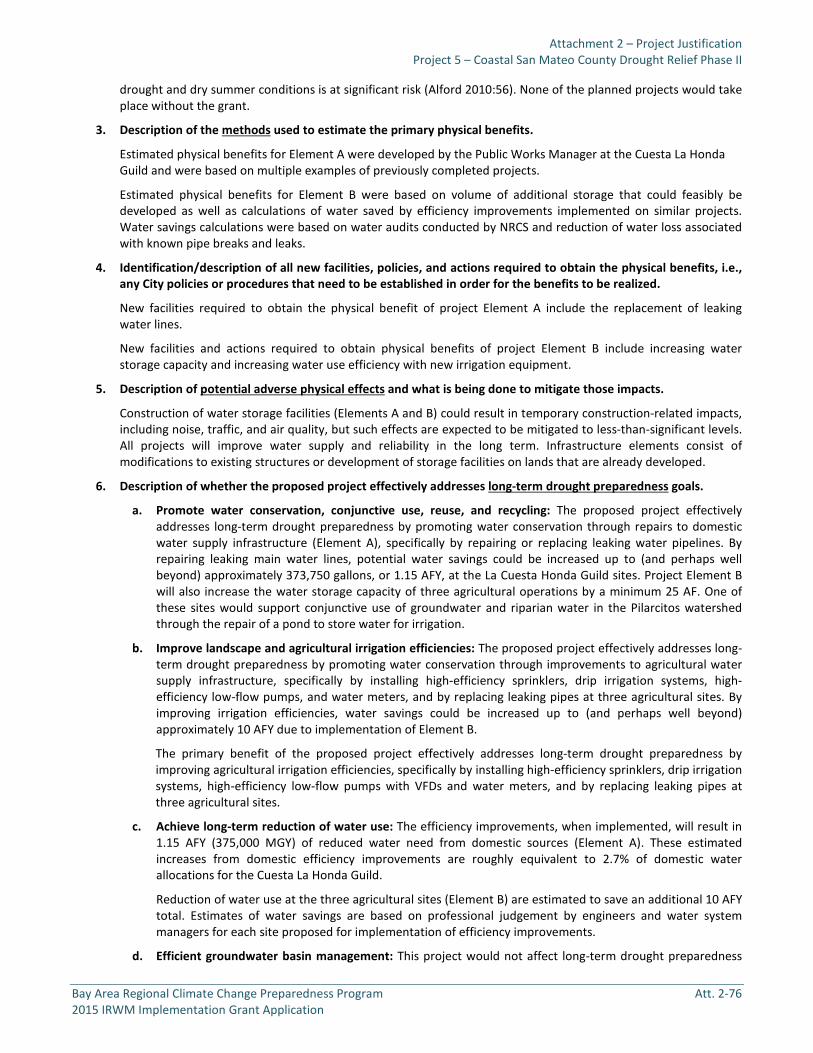
Attachment 2 – Project Justification Project 5 – Coastal San Mateo County Drought Relief Phase II
Bay Area Regional Climate Change Preparedness Program Att. 2-76 2015 IRWM Implementation Grant Application
drought and dry summer conditions is at significant risk (Alford 2010:56). None of the planned projects would take place without the grant.
3. Description of the methods used to estimate the primary physical benefits.
Estimated physical benefits for Element A were developed by the Public Works Manager at the Cuesta La Honda Guild and were based on multiple examples of previously completed projects.
Estimated physical benefits for Element B were based on volume of additional storage that could feasibly be developed as well as calculations of water saved by efficiency improvements implemented on similar projects. Water savings calculations were based on water audits conducted by NRCS and reduction of water loss associated with known pipe breaks and leaks.
4. Identification/description of all new facilities, policies, and actions required to obtain the physical benefits, i.e., any City policies or procedures that need to be established in order for the benefits to be realized.
New facilities required to obtain the physical benefit of project Element A include the replacement of leaking water lines.
New facilities and actions required to obtain physical benefits of project Element B include increasing water storage capacity and increasing water use efficiency with new irrigation equipment.
5. Description of potential adverse physical effects and what is being done to mitigate those impacts.
Construction of water storage facilities (Elements A and B) could result in temporary construction-related impacts, including noise, traffic, and air quality, but such effects are expected to be mitigated to less-than-significant levels. All projects will improve water supply and reliability in the long term. Infrastructure elements consist of modifications to existing structures or development of storage facilities on lands that are already developed.
6. Description of whether the proposed project effectively addresses long-term drought preparedness goals.
a. Promote water conservation, conjunctive use, reuse, and recycling: The proposed project effectively addresses long-term drought preparedness by promoting water conservation through repairs to domestic water supply infrastructure (Element A), specifically by repairing or replacing leaking water pipelines. By repairing leaking main water lines, potential water savings could be increased up to (and perhaps well beyond) approximately 373,750 gallons, or 1.15 AFY, at the La Cuesta Honda Guild sites. Project Element B will also increase the water storage capacity of three agricultural operations by a minimum 25 AF. One of these sites would support conjunctive use of groundwater and riparian water in the Pilarcitos watershed through the repair of a pond to store water for irrigation.
b. Improve landscape and agricultural irrigation efficiencies: The proposed project effectively addresses long-term drought preparedness by promoting water conservation through improvements to agricultural water supply infrastructure, specifically by installing high-efficiency sprinklers, drip irrigation systems, high-efficiency low-flow pumps, and water meters, and by replacing leaking pipes at three agricultural sites. By improving irrigation efficiencies, water savings could be increased up to (and perhaps well beyond) approximately 10 AFY due to implementation of Element B.
The primary benefit of the proposed project effectively addresses long-term drought preparedness by improving agricultural irrigation efficiencies, specifically by installing high-efficiency sprinklers, drip irrigation systems, high-efficiency low-flow pumps with VFDs and water meters, and by replacing leaking pipes at three agricultural sites.
c. Achieve long-term reduction of water use: The efficiency improvements, when implemented, will result in 1.15 AFY (375,000 MGY) of reduced water need from domestic sources (Element A). These estimated increases from domestic efficiency improvements are roughly equivalent to 2.7% of domestic water allocations for the Cuesta La Honda Guild.
Reduction of water use at the three agricultural sites (Element B) are estimated to save an additional 10 AFY total. Estimates of water savings are based on professional judgement by engineers and water system managers for each site proposed for implementation of efficiency improvements.
d. Efficient groundwater basin management: This project would not affect long-term drought preparedness

Attachment 2 – Project Justification Project 5 – Coastal San Mateo County Drought Relief Phase II
Bay Area Regional Climate Change Preparedness Program Att. 2-77 2015 IRWM Implementation Grant Application
goals related to efficient groundwater basin management.
e. Establish system interties: This project would not affect long-term drought preparedness goals related to system interties.
f. Solutions that yield a new water supply, such as seawater desalination: This project would not affect long-term drought preparedness goals related to new water supply sources.
References Cited for Primary Project Benefit
Alford 2010. Dynamic Water Resources Needs in California’s Central Coast Watersheds.
PWA (Philip Williams & Associates). 2008. Pilarcitos Integrated Watershed Management Plan. http://www.sanmateorcd.org/pilarcitos_iwmp.html.
ESA 2004. Pescadero-Butano Watershed Assessment: p. 2-2 and 8-2.
Stillwater Sciences. 2014. Ecological assessment of flows in San Gregorio Creek. Appendix to: San Gregorio Creek watershed management plan. Final report. Prepared by Stillwater Sciences, Morro Bay, California for American Rivers, Nevada City, California.
USGS (U.S. Geological Survey). 2014a. USGS San Gregorio Gage data. http://waterdata.usgs.gov/ca/nwis/uv/?site_no=11162570&PARAmeter_cd=000614015,00060.
USGS 2014b. USGS Pescadero Creek Gage. Available at: http://waterdata.usgs.gov/usa/nwis/uv?site_no=11162500.

Attachment 2 – Project Justification Project 5 – Coastal San Mateo County Drought Relief Phase II
Bay Area Regional Climate Change Preparedness Program Att. 2-78 2015 IRWM Implementation Grant Application
Technical Analysis of Secondary Physical Benefits Claimed
1. Explanation of the need for the project, including recent and historical conditions that provide background for benefits to be claimed; e.g., recent water shortages, loss of habitat or ecosystem function, and water quality problems.
The San Gregorio and Pescadero Creek watersheds, which have historically supported a population of approximately 2,000-2,500 steelhead, have been listed by the California Department of Fish and Wildlife (CDFW) as high-priority streams (Becker et al. 2010:17-25). These streams are also listed by the National Marine Fisheries Service (NMFS) as core recovery areas for Central California Coast Coho (NOAA 2012:261). The San Gregorio Creek Watershed Management Plan (NHI 2010) included a limiting factors analysis that identified reduced summer streamflows due to water diversions as one of the primary factors limiting steelhead and coho salmon recovery.
Low streamflows, in part due to water diversions, are noted in the San Gregorio Creek Watershed Management Plan as a primary limiting factor for steelhead and coho salmon (NHI 2010:100, 114) and for steelhead in the Pilarcitos, San Gregorio, and Pescadero watersheds in the Southern Steelhead Resources Evaluation (Becker et al. 2010:17-25). The U.S. Geological Survey (USGS) stream gages maintained in each watershed show that streamflows, already significantly reduced during summer months, can drop even more dramatically in a short period of time due to larger water diversions.
An assessment evaluating the impacts of changing from a 250-gallon-per-minute (gpm) pumping rate (common for most agricultural water users in the area) down to a 90 gpm pumping rate showed that these modifications can
PSP Table 5b - Secondary Annual Project Physical Benefits
Project Name: Project 5 - Coastal San Mateo County Drought Relief Phase II Secondary Benefit Claimed: Fishery Benefits Units of the Benefit Claimed: Cubic feet per second (cfs) Additional Information About This Benefit: Increased fishery flows in two core steelhead and coho salmon summer rearing habitats in San Gregorio and Pescadero-Butano creek watersheds due to reduced water diversion amounts and pumping rates during summer months and low flow periods. Anticipated Useful Life of Project (years): 20 years
Year
Physical Benefits
Without Project With Project Change Resulting from Project
2017 0 2.8 2.8 cfs increased fishery flows in core steelhead and
coho salmon summer rearing habitats in San Gregorio and Pescadero-Butano creek watersheds
2018 0 2.8 2.8 cfs increased fishery flows in core steelhead and
coho salmon summer rearing habitats in San Gregorio and Pescadero-Butano creek watersheds
Last Year of Project Life
(approximately 2027)
0 2.8 2.8 cfs increased fishery flows in core steelhead and coho salmon summer rearing habitats in San Gregorio and Pescadero-Butano creek watersheds
Comments: San Gregorio Creek and Pescadero-Butano Creek watersheds are noted as core recovery areas for central coast coho salmon in the Central Coast Coho Recovery Plan and San Gregorio Creek Watershed Management Plan (p. 261). Low streamflows are noted in the San Gregorio Creek Watershed Management Plan as a primary limiting factor for steelhead and coho salmon (p. 100 and p. 114) and for steelhead in both the San Gregorio and Pescadero-Butano watersheds in the Southern Steelhead Resources Evaluation (p. 17-25) and steelhead in the Pilarcitos Integrated Watershed Management Plan. In these areas, streamflows regularly drop down to 2 cfs or less during critical summer months, making fisheries habitat areas vulnerable to adverse impacts from water diversions.

Attachment 2 – Project Justification Project 5 – Coastal San Mateo County Drought Relief Phase II
Bay Area Regional Climate Change Preparedness Program Att. 2-79 2015 IRWM Implementation Grant Application
dramatically reduce streamflow fluctuations and impacts to salmonid habitat (American Rivers 2013).
Two of the three proposed projects in Element B will reduce their diversion rate from 1.6 cfs down to 0.2 cfs by switching their pump size from a 750 gpm pump to a 100 gpm pump, thus improving streamflows in San Gregorio Creek by up to 1.4 cfs total, and dramatically reducing hydrograph fluctuations and impacts to habitat. A similar Element B project will improve streamflows in Pescadero-Butano Creek by up to 1.4 cfs. A total of 2.8 cfs in increased streamflows for salmonid fisheries in coastal San Mateo County will result from the project.
The Pilarcitos watershed supports habitat for the California red-legged frog (CRLF), a threatened species, and the San Francisco garter snake, an endangered species. Priority actions for the recovery of these species in the Pilarcitos Integrated Watershed Management Plan (PWA 2008) includes controlling non-native predators of CRLF by managing hydroperiods. The Element B project in Pilarcitos watershed would achieve this goal by refurbishing an existing manmade pond, allowing for the regular use of this pond for summer irrigation and effectively managing the hydroperiod. Non-native predators, such as the bullfrog, will not tolerate a pond that is regularly emptied in the late summer/early fall. This is the same time period during which the agricultural producer would draw down the pond for irrigation uses.
2. Explanation of estimates of the without-project conditions (i.e., explain the levels of the physical benefits in the future, without the project, but with other planned projects).
Water diversions will continue to have dramatic impacts on the hydrograph and may dewater critical instream summer rearing habitat, particularly during drought periods. Salmonid population viability is at risk if the current pumping conditions continue in sensitive watersheds of coastal San Mateo County. CDFW has conducted enforcement sweeps and has imposed regulatory instream flow requirements in these watersheds to protect fish and wildlife resources. If the project is not implemented and CDFW enforcement actions continue to occur, the resulting water supply curtailments would have significant adverse impacts on water users who rely on surface waters for drinking (Element A) and on agricultural users who need water supplies to grow crops that contribute to the local economy (Element B).
3. Description of the methods used to estimate the secondary physical benefits.
The estimated fishery flow benefits apply primarily to the Element B projects and were developed based on the volume of additional water storage that could feasibly be constructed, estimations of water saved by efficiency improvements such as the reduction of pump sizes, and estimations of local water use needs. This information is based on irrigation water audits and past experience with implementations of similar water efficiency improvements in other areas in the county.
An estimated 2.8 cfs of summer flows resulting from improved irrigation pumping will benefit salmonid rearing habitat in the Pescadero-Butano and San Gregorio creek watersheds.
Water savings calculations will be validated based on irrigation water audits conducted by NRCS and reduction of water loss associated with known pipe breaks and leaks.
4. Identification/description of all new facilities, policies, and actions required to obtain the physical benefits, e.g., any City policies or procedures that need to be established in order for the benefits to be realized.
New actions and facilities associated with this project that are required to obtain the primary physical benefits include water management plans generated through a partnership with the NRCS and technical service providers, increased water storage capacity, and more efficient irrigation equipment. The agricultural operation will be required to operate its system within the design parameters of the project. This will be enforced through an agreement with the owner/operator and the RCD or partner agency/organization.
5. Description of potential adverse physical effects and what is being done to mitigate those impacts.
Construction of water storage facilities and replacement of leaking water lines could result in temporary construction-related impacts, including noise, traffic, and air quality, but such effects are expected to be mitigated to less-than-significant levels. All projects will improve water supply and reliability in the long-term. Infrastructure elements consist of modifications to existing structures or development of storage facilities on lands that are already developed.
6. Description of whether the proposed project effectively addresses long-term drought preparedness goals.

Attachment 2 – Project Justification Project 5 – Coastal San Mateo County Drought Relief Phase II
Bay Area Regional Climate Change Preparedness Program Att. 2-80 2015 IRWM Implementation Grant Application
a. Promote water conservation, conjunctive use, reuse, and recycling: The associated secondary benefits of the project effectively address long-term drought preparedness by improving agricultural irrigation efficiencies that impact instream flows in creeks that support steelhead and coho passage and habitat. First, with the 25 AF increase of water storage capacity for agricultural operations, farmers will be able to fill ponds in the wet season, when streamflow is high, and reduce or eliminate diversions from the creek during the late summer and early fall, when streamflow is lowest. Second, installing water use efficiency improvements at three agricultural sites will reduce the total amount of water needed for irrigation and therefore reduce the need to pump water for irrigation during the dry season. Efficiency improvements, when applied to the types of pumps used to divert water, can dramatically reduce local streamflow fluctuations, which can temporarily dewater creeks at the pump site when using pumps with high pumping rates. Typically, farmers in this area use pumps that divert streamflows at rates between 250 and 500 gallons per minute (gpm), but some divert as much as 750 gpm. By installing high-efficiency pumps with lower pumping rates (i.e., 100 gpm or less), the occurrence of localized dewatering and impacts to salmonids and salmonid habitat will be reduced (American Rivers 2013).
b. Improve landscape and agricultural irrigation efficiencies: See discussion above under the Primary project benefit.
c. Achieve long-term reduction of water use: See discussion above under Primary Project Benefit.
d. Efficient groundwater basin management: This project would not affect long-term drought preparedness goals related to new water supply sources.
e. Establish system interties: This project would not affect long-term drought preparedness goals related to new water supply sources.
f. Solutions that yield a new water supply, such as seawater desalination: This project would not affect long-term drought preparedness goals related to new water supply sources.
References Cited for Secondary Project Benefit
American Rivers. 2013. San Gregorio Creek Stream Impact Evaluation for a Diversion Pumping Rate of 90 gpm. Technical analysis submitted to the California Department of Fish and Wildlife, August 8, 2013.
Becker GS, Smetak KM, Asbury DA. 2010. Southern Steelhead Resources Evaluation: Identifying Promising Locations for Steelhead Restoration in Watersheds South of the Golden Gate. Cartography by D.A. Asbury. Center for Ecosystem Management and Restoration. Oakland, CA.
NHI (National Heritage Institute). 2010. San Gregorio Creek Watershed Management Plan.
NOAA (National Oceanic Atmospheric Administration). 2012. Central Coast Coho Recovery Plan. http://www.westcoast.fisheries.noaa.gov/publications/recovery_planning/salmon_steelhead/domains/north_central_california_coast/central_california_coast_coho/ccc_coho_salmon_esu_recovery_plan_vol_i_sept_2012.pdf.
PWA (Philip Williams & Associates). 2008. Pilarcitos Integrated Watershed Management Plan.
USGS (U.S. Geological Survey). 2014a. USGS San Gregorio Gage data. http://waterdata.usgs.gov/ca/nwis/uv/?site_no=11162570&PARAmeter_cd=000614015,00060.
USGS (U.S. Geological Survey). 2014b. USGS Pescadero Creek Gage. http://waterdata.usgs.gov/usa/nwis/uv?site_no=11162500.
Attachment 2 – Project Justification Project 5 – Coastal San Mateo County Drought Relief Phase II
Bay Area Regional Climate Change Preparedness Program Att. 2-81 2015 IRWM Implementation Grant Application
D. Direct Water-Related Benefit to a DAC
There are no Disadvantaged Communities in or near the project sites as presented in DWR’s DAC Mapping Tool.
The Coastal San Mateo Drought Relief Phase II Project will provide direct water supply benefits to rural areas of San Mateo County in need of safe, clean, and affordable water for human consumption, cooking, and sanitary purposes. The project will support the “Human Right to Water.” However, less than 25% of the area served by this project meets the definition of a DAC.
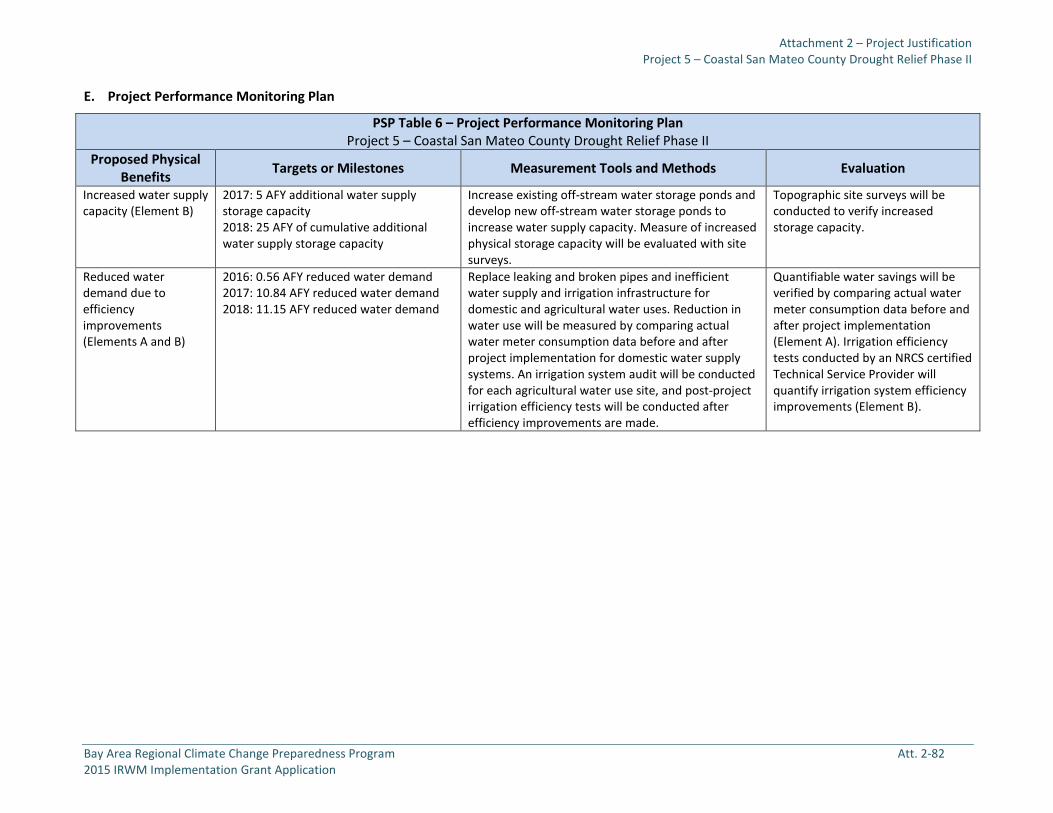
Attachment 2 – Project Justification Project 5 – Coastal San Mateo County Drought Relief Phase II
Bay Area Regional Climate Change Preparedness Program Att. 2-82 2015 IRWM Implementation Grant Application
E. Project Performance Monitoring Plan
PSP Table 6 – Project Performance Monitoring Plan Project 5 – Coastal San Mateo County Drought Relief Phase II
Proposed Physical Benefits Targets or Milestones Measurement Tools and Methods Evaluation
Increased water supply capacity (Element B)
2017: 5 AFY additional water supply storage capacity 2018: 25 AFY of cumulative additional water supply storage capacity
Increase existing off-stream water storage ponds and develop new off-stream water storage ponds to increase water supply capacity. Measure of increased physical storage capacity will be evaluated with site surveys.
Topographic site surveys will be conducted to verify increased storage capacity.
Reduced water demand due to efficiency improvements (Elements A and B)
2016: 0.56 AFY reduced water demand 2017: 10.84 AFY reduced water demand 2018: 11.15 AFY reduced water demand
Replace leaking and broken pipes and inefficient water supply and irrigation infrastructure for domestic and agricultural water uses. Reduction in water use will be measured by comparing actual water meter consumption data before and after project implementation for domestic water supply systems. An irrigation system audit will be conducted for each agricultural water use site, and post-project irrigation efficiency tests will be conducted after efficiency improvements are made.
Quantifiable water savings will be verified by comparing actual water meter consumption data before and after project implementation (Element A). Irrigation efficiency tests conducted by an NRCS certified Technical Service Provider will quantify irrigation system efficiency improvements (Element B).

Attachment 2 – Project Justification Project 5 – Coastal San Mateo County Drought Relief Phase II
Bay Area Regional Climate Change Preparedness Program Att. 2-83 2015 IRWM Implementation Grant Application
PSP Table 6 – Project Performance Monitoring Plan Project 5 – Coastal San Mateo County Drought Relief Phase II
Proposed Physical Benefits Targets or Milestones Measurement Tools and Methods Evaluation
Protection of core critical habitat for steelhead and coho salmon due to reduced total water diversion amounts and reduced pumping rates (San Gregorio and Pescadero-Butano creek watersheds)
2017: fisheries flow benefit at two summer rearing habitat areas, allowing for significant streamflow fluctuations and potential stream channel dewatering during drought and normal late summer low flow periods (late August through early October). Increase in streamflow by up to 1.4 cfs per site.
2018: fisheries flow benefit at two summer rearing habitat areas are protected from dewatering and or significant fluctuations during drought and normal late summer low flow periods (late August through early October). Increase in streamflow by up to 1.4 cfs per site.
Develop off-stream storage that enables diverters to stop diverting water from the stream during extreme low-flow periods, where feasible. Develop regulating reservoirs and install stream pumps with low diversion rates such that diverters that cannot eliminate water diversions during low-flow periods. Reduce diversion rates to no greater than 10% of average summer streamflows during extreme low-flow periods.
Water management will be verified by visual monitoring.
Streamflow conditions will be monitored using stream pressure transducers, staff gages, and flow surveys conducted with a Marsh-McBurney flow meter.
Streamflow data will be used to calculate summer pumping rate thresholds that are protective of instream habitat. This data will be used to appropriately size summer diversion stream pumps. Visual monitoring and watermaster reporting will be used to verify that water management is conducted as planned. Streamflow surveys will be used to quantify changes to streamflow conditions for habitat.

Attachment 2 – Project Justification Project 5 – Coastal San Mateo County Drought Relief Phase II
Bay Area Regional Climate Change Preparedness Program Att. 2-84 2015 IRWM Implementation Grant Application
F. Cost-Effectiveness Analysis
PSP Table 7 evaluates whether the physical benefits provided by the project are provided at the least possible costs.
PSP Table 7 – Cost-Effectiveness Analysis Project name: Project 5 - San Mateo County Drought Relief Phase II
Question 1 What are the types of benefits provided? Explain in as much detail as possible:
Primary Water Supply Benefit: By repairing leaking main water lines (Element A), water savings could be as much as (and perhaps well above) approximately 373,750 gallons, or 1.15 AFY, in the San Gregorio watershed. This would represent a 0.7-gallon-per-minute loss from multiple small leaks that are extremely hard to locate over miles of pipelines. On a daily basis, this loss equates to 2,880 gallons per day of potable water. Estimated per-capita water use at Cuesta La Honda Guild is approximately 33 gallons per day, per person. A loss reduction of 0.7 gpm would equate to the availability of water for 31 additional persons per day—a supply of water that is currently lost into the ground. This estimate potentially could be much higher, as leaking pipes have a high likelihood of deteriorating well beyond these estimates. By improving irrigation efficiencies at three agricultural sites, water savings could be up to (perhaps well beyond) 10 AF per year across the three priority watersheds.
Secondary Habitat Flow Improvement Benefit: By increasing the water storage capacity for agricultural operations by 25 AF, farmers will be able to fill ponds in the wet season, when streamflow is high, and eliminate diversions from the creek during the late summer and early fall, when streamflow is lowest. This improved diversion schedule will benefit fisheries habitat by dramatically reducing local streamflow fluctuations, which can temporarily dewater creeks during summer months when streamflows are already naturally low.
Question 2 Have alternative methods been considered to achieve the same types and amounts of physical benefits as the proposed project been identified? If yes, list the methods (including the proposed project) and estimated costs.
Yes. The only other alternative to the project includes development of an intertie with municipal water supplies on the other side of the coastal range. This alternative is infeasible due to the long distance between water suppliers and the steep and landslide-prone terrain. In addition to high construction costs, ongoing electrical costs associated with pumping would be costly to maintain. Trucking water in from outside the area is not a sustainable solution, as it is cost prohibitive and resource intensive. Based on a report from a community member already trucking water, the cost to truck water into the area is approximately $1,300 per month for a single household. Furthermore, bottled water also must be purchased for drinking and cooking, as it is not possible for residents to verify that trucked-in water is potable.
Question 3 Is the proposed project the least-cost alternative? Explain why the alternative was selected as the proposed project; why is this the preferred alternative? Explain accomplishments of the project that are different from the alternative project or methods.
The project as proposed is the least-cost alternative. Interties with urban water agency infrastructure are cost prohibitive due to distance, so increasing available local drinking water supply by purchasing it from other areas is infeasible and not considered a realistic alternative. The proposed project strategy addresses infrastructure needs, resulting in both immediate and long-term benefits and improved local water reliability that outweigh the alternative option of incurring significant cumulative costs associated with the import of water from other regions during drought periods, periods when aging water supply lines break, and/or when reservoir water quality renders stored water unusable.

Attachment 2 – Project Justification
Bay Area Regional Climate Change Preparedness Program Att. 2-85 2015 IRWM Implementation Grant Application
Project Justification: Shoreline Resilience – Sea Level Rise Preparedness Projects
Project ID# Project Proponent Project Title
6 State Coastal Conservancy
San Francisquito Creek Flood Protection and Ecosystem Restoration Project
7 State Coastal Conservancy
Mountain View Shoreline Portion of SBSPR Project
8 State Coastal Conservancy
Eden Landing Portion of SBSPR Project
9 State Coastal Conservancy
Novato Creek Flood Protection and Habitat Enhancement Project
The four projects described in this section comprise the Bay Area Shoreline Resilience Program. This program establishes wetland and habitat goals for the nine-county San Francisco Bay IRWM Region, while assisting communities with development of pro-active responses to sea level rise. The goal of the program is to provide demonstration implementation projects in four subregions, allowing communities to better address local impacts through multi-benefit projects. The San Francisquito Creek Flood Protection and Ecosystem Restoration Project (Project 6) is an element of a larger flood protection project in East Palo Alto that will provide direct flood protection benefits to a disadvantaged community. The Mountain View Shoreline and Eden Landing Projects (Projects 7 and 8, respectively) are part of the larger South Bay Salt Pond Restoration (SBSPR) Project, which seeks to maintain and improve flood protection and shoreline resiliency, restore a variety of wetland habitats, and provide wildlife-oriented public access on 15,100 acres of former salt-evaporation ponds in southern San Francisco Bay. The Novato Creek Flood Protection and Habitat Enhancement Project (Project 9) is a combination of two project elements, one involving construction of a levee and 25 acres of seasonal wetlands, the second involves construction of a flood control weir and 3 acres of seasonal wetlands.

Attachment 2 – Project Justification
Bay Area Regional Climate Change Preparedness Program Att. 2-86 2015 IRWM Implementation Grant Application
PROJECT 6 – SAN FRANCISQUITO CREEK FLOOD PROTECTION AND ECOSYSTEM RESTORATION PROJECT
A. Project Description
Project Needs and Goals: The San Francisquito Creek Flood Protection and Ecosystem Restoration Project – East Bayshore Road to San Francisco Bay Project is part of the Bay Area Regional Shoreline Resilience Program. Following years of effort to address environmental issues and storm events, including a 45-year flood in 1998 that damaged approximately 1,700 properties, five local agencies from two counties—the cities of Palo Alto, Menlo Park, and East Palo Alto, the County of San Mateo, and the Santa Clara Valley Water District—joined together to create a new regional government agency, the San Francisquito Creek Joint Powers Authority (SFCJPA). This agency’s multijurisdictional approach to solving problems is reflected in this project, which serves to address the interrelated water quality, habitat protection and restoration, and flood protection needs of the region.
The overall project’s local and regional goals are to benefit stakeholders and the environment. This project benefits local residents by eliminating the risk of levee overtopping in storm events that have historically severely impacted the City of East Palo Alto, with many census tracts qualifying as a Disadvantaged Community (DAC). In fact, the majority of residential homes at risk of flooding from East Bayshore Road/Highway 101 to the San Francisco Bay are located in East Palo Alto. The project will prevent the levees from overtopping during a 100-year riverine flood, coincident with a 100-year high-tide event.
The project will increase streamflow capacity in San Francisquito Creek from the downstream face of East Bayshore Road to San Francisco Bay. It will reduce local flood risks during storm events, as well as provide the capacity needed for future upstream flood protection. Increasing the creek’s flow capacity from East Bayshore Road/Highway 101 to San Francisco Bay will be achieved by widening the creek channel within the reach to convey peak flows for 100-year storm events, removing abandoned PG&E pipelines, and configuring flood walls in the upper part of the reach for consistency with the structure of Caltrans’ enlargement of the Highway 101/East Bayshore Road Bridge over San Francisquito Creek (a separate project also underway). The project will also create increased tidal marshland habitat within the new channel at appropriate elevations for intertidal wetland plant and animal species.
Project Description: This project addresses ecosystem restoration, flood management, recreation and public access, wetland enhancement, and watershed planning. The project will increase the flow capacity of San Francisquito Creek from East Bayshore Road/Highway 101 to San Francisco Bay by: (1) widening the creek channel and creating new setback levees, (2) widening the creek channel and installing floodwalls in densely developed areas that cannot accommodate setback levees, and (3) excavating sediment deposits down to marsh-plain elevation and reshaping the channel throughout the project reach to maximize conveyance capacity, sediment transport, and beneficial habitat. To accomplish this, approximately seven acres of the City of Palo Alto’s golf course were acquired to expand the width of the channel. The channel will be widened by approximately 20 feet at the upstream end of the project, and will progressively increase in width throughout the 1.5-mile project reach. At the downstream end of the project reach, the setback levee will be in a location that increases the channel width by 200 feet, with the additional width accommodating the existing low-flow channel as well as vastly expanded in-channel marsh plain. Additionally, the project will enhance public access by improving existing trailheads, creating a boardwalk and landing at the Friendship Bridge pedestrian crossing, and provide education opportunities by installing interpretive signs at locations in partnership with the State of California Coastal Conservancy (SCC).
Anticipated Physical Benefits/Intended Outcomes: The project will protect more than 1,300 properties from creek flooding and, when coupled with future tidal levee improvements, will remove these properties from the FEMA floodplain. The project will protect residences, businesses, and public facilities from a 100-year flood event, and will provide significant benefits during lesser storm events. The project is expected to create approximately 14.4 acres of new or improved mid-marsh habitat, and approximately 4 acres of new or improved low marsh habitat. Additionally, high tide refugial habitat for sensitive wildlife species will be created on the levee slope.
Regional Applicability: This project will benefit regional stakeholders by eliminating the risk of flooding to Highway 101, which is a major transportation route in the Bay Area. This project will provide appreciable statewide benefits by preventing water quality impacts to the San Francisco Bay that result from flooding. In addition, it will provide the downstream capacity needed for future upstream flood protection projects being planned by the SFCJPA.

Attachment 2 – Project Justification
Bay Area Regional Climate Change Preparedness Program Att. 2-87 2015 IRWM Implementation Grant Application
B. Project Map

Attachment 2 – Project Justification
Bay Area Regional Climate Change Preparedness Program Att. 2-88 2015 IRWM Implementation Grant Application
C. Project Physical Benefits
Primary and secondary project physical benefits are summarized in PSP Tables 5a and 5b, respectively, as follows.
Technical Analysis of Primary Physical Benefits Claimed
1. Explanation of the need for the project, including recent and historical conditions that provide background for benefits to be claimed; e.g., recent water shortages, loss of habitat or ecosystem function, and water quality problems.
The goal of the San Francisquito Creek Flood Protection and Ecosystem Restoration Project is to provide protection against a 100-year riverine flood, coincident with a 100-year high-tide event, with accommodation for 26 inches of projected sea-level rise and Federal Emergency Management Agency (FEMA) freeboard requirements along San Francisquito Creek between East Bayshore Road and the San Francisco Bay.
The project will protect more than 1,300 properties from creek flooding, of which approximately 1,100 are primary residences located in East Palo Alto. When coupled with future tidal levee improvements, the project will remove these properties from the FEMA floodplain. The downstream reach of San Francisquito Creek between East Bayshore Road and San Francisco Bay is at the highest risk of severe flooding in the system, due to undersized channel capacity and substandard levees. Flooding risk is exacerbated during high tides. The creek in this area runs through communities that have experienced severe damage during previous flood events. The completion of the East Bayshore Road to San Francisco Bay reach is a necessary first step in providing comprehensive flood protection farther upstream.
The project will remove fluvial flooding risks from San Francisquito Creek for approximately 1,100 properties (primary residences) within the City of East Palo Alto. The median household income (MHI) in East Palo Alto is $50,142 annually (American Fact Finder 2013). Fifty percent of the residents are low-income (i.e., have incomes less than 80% of the State median income) (U.S. Census 2010), qualifying much of the City of East Palo Alto as a DAC as defined by the California Department of Finance Population Research Unit.
PSP Table 5a - Primary Annual Project Physical Benefits
Project Name: Project 6 - San Francisquito Creek Flood Protection and Ecosystem Restoration Project Type of Benefit Claimed: Flood Damage Reduction Units of the Benefit Claimed: Inundated acres reduced (acres) Additional Information About This Benefit: 1,317 parcels exist within the 550 acres currently at risk for flood inundation. Almost all of these parcels are residential and in a DAC. Anticipated Useful Life of Project (years): 50
Year
Physical Benefits
Without Project With Project Change Resulting from Project
2016 0 - Project under construction starting April 2016.
2017 0
550 Project complete in December 2017. 550 acres will have significantly reduced flood risk.
Last Year of Project Life
(approximately 2067
0 550
550 acres protected from flood risk from 100-year flood for the next 50 years.
Comments: USACE. 2011. San Francisquito Creek Preliminary Flood Damage Analysis (Economic Impact Areas SM 5 and SC 3).
Figure 1: Homes in East Palo Alto flooded in 1998

Attachment 2 – Project Justification Project 6 – San Francisquito Creek Flood Protection and Ecosystem Restoration Project
Bay Area Regional Climate Change Preparedness Program Att. 2-89 2015 IRWM Implementation Grant Application
The project will increase streamflow capacity in San Francisquito Creek from the downstream face of East Bayshore Road to San Francisco Bay. It will reduce local flood risks during storm events, as well as provide the capacity needed for future upstream flood protection projects. Increasing the creek’s flow capacity from East Bayshore Road/Highway 101 to San Francisco Bay will be achieved by widening the creek channel within the reach to convey peak flows for 100-year storm events, excavating sediment deposits to marsh-plain elevation, building a setback levee within the Palo Alto Municipal Golf Course, and configuring flood walls in the upper part of the project reach for consistency with structure for Caltrans’ enlargement of the Highway 101/East Bayshore Road Bridge over San Fran-cisquito Creek (a sepa-rate project). Project elements include flood walls, levee setbacks and creek widening in the middle reach be-tween East Palo Alto and the Palo Alto Municipal Golf Course, and in-channel marsh restoration.
Channel widening to increase flow conveyance provides the project an opportunity to vastly improve ecological conditions. The existing channel is narrow and has steep inboard levee faces, resulting in high velocities and channel scour during storm events. The rapid transition from the narrow marsh strip along the low flow channel to upland areas of the levees minimizes the success of local plant species, instead providing favorable conditions for invasive grasses and pepperweed, which provides poor habitat for local fauna and is observed throughout the project reach. The widened channel will be set at marsh-plain elevation, and graded at 1% from the inboard toe of the setback and rebuilt levees to the outer hinge of the low-flow channel, providing a stable elevation for native marsh vegetation as well as progressively concentrating diminishing flows after large events to optimize sediment transport and avoid the severe scour and deposition cycle that is present under existing conditions. The table below summarizes the types of restoration that will be implemented by project sub-reach.
Proposed Marsh-Plain Restoration Features
Downstream of Friendship Bridge
High-marsh and transitional vegetation would be planted in areas from the edge of the creek channel to the toe of the levee, from just upstream of San Francisco Bay to just downstream of Friendship Bridge. The Faber Tract side of the levee will also be restored with high-marsh transitional vegetation where the levee is being raised and widened.
Upstream of Friendship Bridge on right bank
High-marsh and transitional vegetation would be planted from the edge of the creek channel to the toe of the levee, from just upstream of Friendship Bridge to East Bayshore Road.
Left bank High-marsh and transitional vegetation would be planted from the edge of the creek channel to the base of the floodwall or the toe of the levee. In this area, the marsh would be planted adjacent to the toe of the cut-and-fill area. The marsh would extend from the point at which the new levee would diverge inland from the existing levee to East Bayshore Road.
In addition to marsh-plain restoration, the project will result in reduced velocities and improved conditions for fish migration. To maximize this benefit, the SFCJPA has worked with the California Department of Fish and Wildlife and National Marine Fisheries Service to design strategic hydraulic breaks along the project reach to provide additional refuge areas for migrating fish. These velocity breaks will be a combination of boulders or boulder piles that are large enough to provide for velocity disruption zones without affecting the water surface elevation within the channel or the conveyance performance of the project.
Figure 2: Pre-project San Francisquito channel Figure 3: Rendering of Post-project channel

Attachment 2 – Project Justification Project 6 – San Francisquito Creek Flood Protection and Ecosystem Restoration Project
Bay Area Regional Climate Change Preparedness Program Att. 2-90 2015 IRWM Implementation Grant Application
2. Explanation of estimates of the without-project conditions (i.e., the levels of the physical benefits in the future, without the project, but with other planned projects).
Residential Flood Damage Assumptions without Project: It is estimated that approximately 703 homes, 914 homes, and 1,090 homes would be inundated in the 25-year, 50-year, and 100-year flood events, respectively. In 2011, the total residential damages, including damages to structures and content, was estimated to be $18,655,865, $24,255,278, and $28,925,879 for the 25-year, 50-year, and 100-year flood events, respectively. Data related to cleanup and debris removal costs are not available, and have therefore been excluded from this analysis. The majority of residences that will benefit from this project are located in East Palo Alto, 341 of which are within a DAC.
Commercial Flood Damage Assumptions without Project: In 2011, it was estimated that approximately eight office buildings, 14 office buildings and public facilities, and 18 office buildings and public facilities would be affected in the 25-year, 50-year, and 100-year events, respectively. In summary, the total commercial damages, including damages to structures and content, is estimated to be $1,216,000, $2,128,000, and $2,736,000 for the 25-year, 50-year, and 100-year flood events, respectively.
Road Inundation Damage Assumptions without Project: Costs associated with road inundation were estimated using the default values within the Department of Water Resources’ Flood Rapid Assessment Model. These default values assume the cost per mile of highway/arterial, major, minor, and unsealed roads to be $250,000, $100,000, $30,000, and $10,000, respectively. These assumptions are based on estimates developed for the San Francisco Bay Area. The inundation areas identified in the project area are also located within the San Francisco Bay Area. As such, it was determined that these values reasonably reflect the costs associated with road inundation in the project area. In total, these costs amount to $250,000, $330,000, and $475,000 for the 25-year, 50-year, and 100-year floods, respectively.
3. Description of the methods used to estimate the primary physical benefits.
In 2008, the U.S. Army Corps of Engineers (USACE) developed a HEC-RAS model for the creek, and the data outputs from specific flow events were input into a FLO-2D model to establish floodplain maps for the 10-, 25-, 50-, 100- and 250-year events. The Q for each return interval was established by the HEC-1 hydrologic model of the watershed produced by the Santa Clara Valley Water District in 2005 and certified by the USACE in 2008. Flooding projected as a result of overbanking and levee overtopping within the project reach was estimated to be 550 acres by means of creation of a GIS polygon on the 100-year floodplain map.
While the grant program requires that primary benefits related to flood protection be described in acres of area protected, a more useful measure for quantifying flood protection in an urban area is a count of structures damaged by flooding, or by analysis of the economic damages likely to result from flooding. To that end, in 2011 the USACE produced a Preliminary Flood Damage Analysis for San Francisquito Creek. Estimates of area impacted and expected economic damages were calculated by adding up the economic impact areas within the analysis that are specific to the floodplain impacted by the project reach.
4. Identification/description of all new facilities, policies, and actions required to obtain the physical benefits, e.g., any City policies or procedures that need to be established in order for the benefits to be realized.
All policies and inter-agency agreements required to obtain the physical benefits are in place. The project will be shovel-ready at the time of execution of a grant agreement, and construction of the project is the only action required to obtain the physical benefits.
5. Description of potential adverse physical effects and what is being done to mitigate those impacts.
Potential adverse effects of the project were evaluated in the project CEQA compliance document, which was completed in 2012 (ICF 2012). There will be temporal disturbance of existing tidal marsh habitat within the San Francisquito Creek channel and areas of diked marsh (hydraulically disconnected from other habitats) outside of the channel but within the construction footprint. All habitats temporally disrupted will be restored to pre-project conditions. All permanent impacts to tidal marsh or diked marsh will be mitigated at a 2:1 ratio, as required in the Clean Water Act 401 Water Quality Certification for the project. The project will result in a loss of upland refugia for the salt marsh harvest mouse, which loss will be mitigated by the creation of earth mounds in the marsh areas

Attachment 2 – Project Justification Project 6 – San Francisquito Creek Flood Protection and Ecosystem Restoration Project
Bay Area Regional Climate Change Preparedness Program Att. 2-91 2015 IRWM Implementation Grant Application
adjacent to the creek as required in the U.S. Fish and Wildlife Service (USFWS) Biological Opinion for the Project and in partnership with the USFWS Don Edwards National Wildlife Refuge staff.
6. Description of whether the proposed project effectively addresses long-term drought preparedness goals.
The primary project benefit of reduced flood risk does not address long-term drought preparedness goals.
References Cited for Primary Project Benefit
American Fact Finder. 2013. American Community Survey data for the 2009-2013 period. Available: http://factfinder.census.gov/faces/nav/jsf/pages/community_facts.xhtml.
ICF (ICF International). 2012. Final EIR. San Francisquito Creek Flood Reduction, Ecosystem Restoration, and Recreation Project San Francisco Bay to Highway 101. October. Prepared for San Francisquito Creek Joint Powers Authority, Menlo Park, CA.
USACE (U.S. Army Corps of Engineers). 2011. San Francisquito Creek Preliminary Flood Damage Analysis (Economic Impact Areas SM 5 and SC 3).
U.S. Census 2010. 2010 Census Data. Available: http://www.census.gov/2010census/data
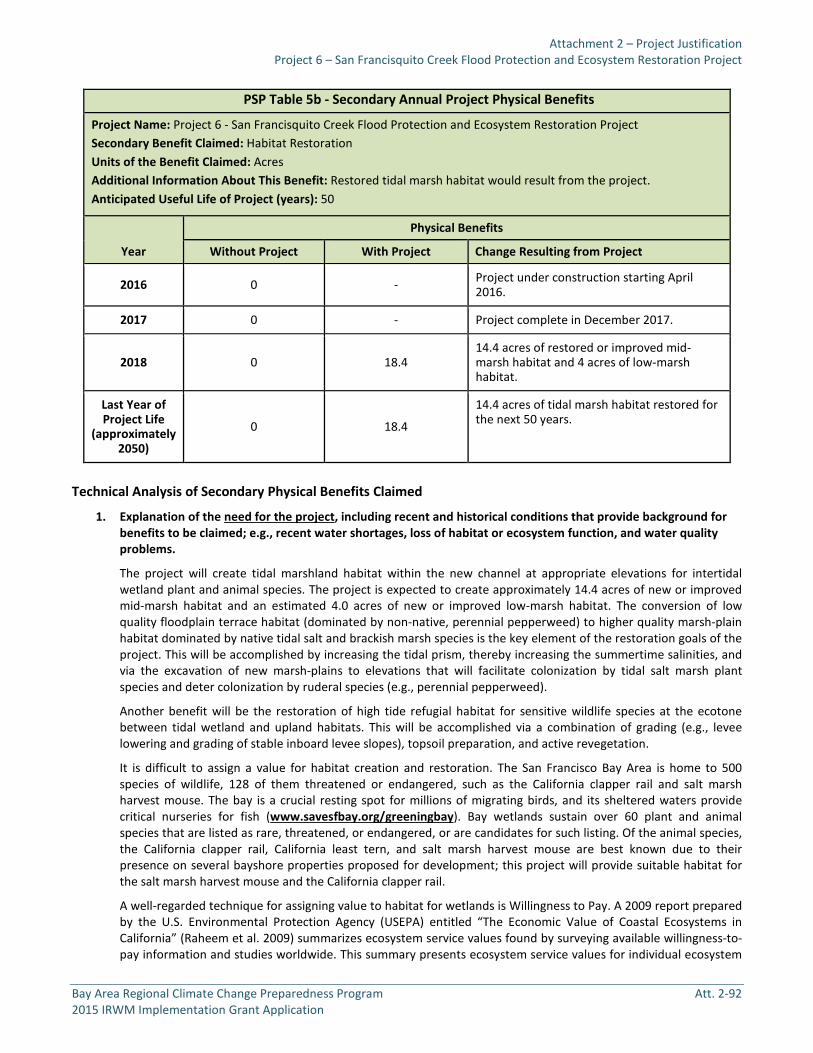
Attachment 2 – Project Justification Project 6 – San Francisquito Creek Flood Protection and Ecosystem Restoration Project
Bay Area Regional Climate Change Preparedness Program Att. 2-92 2015 IRWM Implementation Grant Application
Technical Analysis of Secondary Physical Benefits Claimed
1. Explanation of the need for the project, including recent and historical conditions that provide background for benefits to be claimed; e.g., recent water shortages, loss of habitat or ecosystem function, and water quality problems.
The project will create tidal marshland habitat within the new channel at appropriate elevations for intertidal wetland plant and animal species. The project is expected to create approximately 14.4 acres of new or improved mid-marsh habitat and an estimated 4.0 acres of new or improved low-marsh habitat. The conversion of low quality floodplain terrace habitat (dominated by non-native, perennial pepperweed) to higher quality marsh-plain habitat dominated by native tidal salt and brackish marsh species is the key element of the restoration goals of the project. This will be accomplished by increasing the tidal prism, thereby increasing the summertime salinities, and via the excavation of new marsh-plains to elevations that will facilitate colonization by tidal salt marsh plant species and deter colonization by ruderal species (e.g., perennial pepperweed).
Another benefit will be the restoration of high tide refugial habitat for sensitive wildlife species at the ecotone between tidal wetland and upland habitats. This will be accomplished via a combination of grading (e.g., levee lowering and grading of stable inboard levee slopes), topsoil preparation, and active revegetation.
It is difficult to assign a value for habitat creation and restoration. The San Francisco Bay Area is home to 500 species of wildlife, 128 of them threatened or endangered, such as the California clapper rail and salt marsh harvest mouse. The bay is a crucial resting spot for millions of migrating birds, and its sheltered waters provide critical nurseries for fish (www.savesfbay.org/greeningbay). Bay wetlands sustain over 60 plant and animal species that are listed as rare, threatened, or endangered, or are candidates for such listing. Of the animal species, the California clapper rail, California least tern, and salt marsh harvest mouse are best known due to their presence on several bayshore properties proposed for development; this project will provide suitable habitat for the salt marsh harvest mouse and the California clapper rail.
A well-regarded technique for assigning value to habitat for wetlands is Willingness to Pay. A 2009 report prepared by the U.S. Environmental Protection Agency (USEPA) entitled “The Economic Value of Coastal Ecosystems in California” (Raheem et al. 2009) summarizes ecosystem service values found by surveying available willingness-to-pay information and studies worldwide. This summary presents ecosystem service values for individual ecosystem
PSP Table 5b - Secondary Annual Project Physical Benefits
Project Name: Project 6 - San Francisquito Creek Flood Protection and Ecosystem Restoration Project Secondary Benefit Claimed: Habitat Restoration Units of the Benefit Claimed: Acres Additional Information About This Benefit: Restored tidal marsh habitat would result from the project. Anticipated Useful Life of Project (years): 50
Year
Physical Benefits
Without Project With Project Change Resulting from Project
2016 0 - Project under construction starting April 2016.
2017 0 - Project complete in December 2017.
2018 0 18.4 14.4 acres of restored or improved mid-marsh habitat and 4 acres of low-marsh habitat.
Last Year of Project Life
(approximately 2050)
0 18.4
14.4 acres of tidal marsh habitat restored for the next 50 years.

Attachment 2 – Project Justification Project 6 – San Francisquito Creek Flood Protection and Ecosystem Restoration Project
Bay Area Regional Climate Change Preparedness Program Att. 2-93 2015 IRWM Implementation Grant Application
functions (where available), as well as for bundled services (assumed aggregate value) for estuarine and beach environments. The values for estuarine environments were found to range from $50,000 $80,000 per acre per year, and beaches range from $36,000 $83,000 per acre (2008 USD). Specific values for marsh habitat were not provided.
Based on these data points, the value of the wetlands created and restored by this project is conservatively estimated at $50,000 per acre per year (2009 USD). This translates to an ecosystem services benefit of $1,005,000 per year with project implementation, or approximately $14,227,936 over the 50-year project life.
2. Explanation of estimates of the without-project conditions (e.g., explain the levels of the physical benefits in the future, without the project, but with other planned projects).
Under existing conditions, tidal marshland habitat and pickleweed habitat are present but are limited to small spatial in-channel elevations due to accumulated fluvial sediments within the leveed channel throughout the project reach. The ideal elevation for these habitats is at mean higher high-water, or a range between the average daily high tides. The channel also serves as a migratory corridor for adult and smolt steelhead. The narrow channel and resulting high velocities limit the opportunity for adult steelhead to pass upstream to spawning areas in the upper watershed during high flow events, the very events that provide for passage upstream of the project reach.
3. Description of the methods used to estimate the secondary physical benefits.
In estimating the primary physical benefits, the SFCJPA measured the acreage of high quality habitat being restored using GIS data overlaid on aerial photographs. 14.4 acres of restored or improved mid-marsh habitat and 4 acres of low-marsh habitat will result from the project.
4. Identification/description of all new facilities, policies, and actions required to obtain the physical benefits, e.g., any City policies or procedures that need to be established in order for the benefits to be realized.
All policies and interagency agreements required to obtain the physical benefits are in place. The project will be shovel-ready at the time of execution of a grant agreement, and construction of the project is the only action required to obtain the physical benefits.
5. Description of potential adverse physical effects and what is being done to mitigate those impacts.
There will be temporal disturbance of existing tidal marsh habitat within the San Francisquito Creek channel and areas of diked marsh (hydraulically disconnected from other habitats) outside of the channel but within the construction footprint. All habitats temporally disrupted will be restored to pre-project conditions. All permanent impacts to tidal marsh or diked marsh will be mitigated at a 2:1 ratio as required in the CWA 401 Water Quality Certification for the project. The project will result in a loss of upland refugia for salt marsh harvest mouse, which loss will be mitigated by the creation of earth mounds in the marsh areas adjacent to the creek as required in the USFWS’ Biological Opinion for the project and in partnership with the USFWS Don Edwards National Wildlife Refuge staff.
6. Description of whether the proposed project effectively addresses long-term drought preparedness goals.
The secondary project benefit of habitat restoration does not address long-term drought preparedness goals.
References Cited for Secondary Project Benefit
Raheem et al. 2009. The Economic Value of Coastal Ecosystems in California. Available: http://www.opc.ca.gov/webmaster/ftp/project_pages/Fund_Studies/NCEAS_NonMkt_Value_Report.pdf

Attachment 2 – Project Justification Project 6 – San Francisquito Creek Flood Protection and Ecosystem Restoration Project
Bay Area Regional Climate Change Preparedness Program Att. 2-94 2015 IRWM Implementation Grant Application
D. Direct Water-Related Benefit to a DAC
The City of East Palo Alto is located in San Mateo County. Citywide, the median household income (MHI) for the period from 2009-2013 in East Palo Alto is $50,142 (American Fact Finder 2013). According to 2010 U.S. Census data, 50% of the residents are low-income (i.e., have incomes less than 80% of the State median income), and 18.4% of the City’s residents are below the poverty line (as compared to 7.6% in San Mateo County and 15.9% in the State). Five hundred thirty-eight (32.6%) out of 1,650 acres in the City are a DAC, according to DWR’s DAC Mapping Tool.
Flood protection is a primary need of the East Palo Alto community. Of all the areas within the fluvial floodplain of San Francisquito Creek, the area of East Palo Alto to be protected by the project is at the highest risk of loss of human life resulting from overtopping or levee failure. Most of the properties within this area sit below sea level, with rooftops at or below the height of the existing creek levees. A catastrophic flood in this area would lead to several feet of inundation, and would require water rescue to evacuate those left stranded, similar to what was required in New Orleans following Hurricane Katrina in 2005. While the geographic expanse of flooding would be less than in New Orleans, the threat to those affected would be similar.
The project will remove fluvial flooding risks from San Francisquito Creek for more than 1,300 properties, of which approximately 1,100 are primary residences located in East Palo Alto, 341 of which are within a DAC as designated by the State and are at risk of flooding during moderate events and would be inundated to the greatest depth during a 100-year event. These DAC areas (block groups) experienced flooding as recently as December 2012, when floodwaters from a 22-year event broke out of San Francisquito Creek and flowed into these homes in East Palo Alto. Once this project is completed, the DAC will be protected from fluvial flooding up to the 100-year flood event, which has a 1% chance of occurring in any given year.
The project map presented in Section B was created by overlaying the 100-year floodplain map generated by the USACE with the DAC block groups identified in DWR’s DAC Mapping Tool.
Although the project will provide flood protection and other benefits to areas outside of the DAC block groups, the urgency to complete the project in a timely manner is due to the significant risk of property damage and loss of life in the affected DAC. The community at greatest risk has been the biggest advocate for completion of the project, and all of the public outreach meetings conducted under CEQA were held within East Palo Alto so that the meetings would be accessible to those neighborhoods. The community supports the project and is eager to have their risk reduced.
26.2% of the population to be protected by the project is within the DAC block groups as defined by DWR. When considering other methodologies for determination of a DAC, such as that used by the California Department of Finance Population Research Unit, this percentage would be greater.

Attachment 2 – Project Justification Project 6 – San Francisquito Creek Flood Protection and Ecosystem Restoration Project
Bay Area Regional Climate Change Preparedness Program Att. 2-95 2015 IRWM Implementation Grant Application
E. Project Performance Monitoring Plan
PSP Table 6 – Project Performance Monitoring Plan Project 6 – San Francisco Creek Flood Protection and Ecosystem Restoration Project
Proposed Physical Benefits Targets or Milestones Measurement Tools and Methods Evaluation
Flood protection from 100-year creek flows, coupled with a 100-year tide, with 26 inches of anticipated sea-level rise
Achieve project design flow conveyance
A USGS stream gauge upstream of the project reach provides data on creek flows conveyed to the lower watershed. During high flow events, the SFCJPA will capture flow volumes reported at the USGS gauge, and the hydrologic model developed for the watershed will be used to verify flows entering the project reach.
The SFCJPA will monitor water surface elevation in the project reach during storm events to ensure that the designed freeboard is achieved.
Habitat restoration 70% success rate for restoration plantings and establishment of the desired habitat improvements
Annual survey of Ridgway’s rail nesting and photo-documentation of pickleweed habitat for salt marsh harvest mouse
The SFCJPA will implement adaptive management to maximize habitat restoration benefits of the project.

Attachment 2 – Project Justification Project 6 – San Francisquito Creek Flood Protection and Ecosystem Restoration Project
Bay Area Regional Climate Change Preparedness Program Att. 2-96 2015 IRWM Implementation Grant Application
F. Cost-Effectiveness Analysis
PSP Table 7 evaluates whether the physical benefits provided by the project are provided at the least possible costs.
PSP Table 7 – Cost-Effectiveness Analysis Project name: Project 6 - San Francisquito Creek Flood Protection and Ecosystem Restoration Project
Question 1 What are the types of benefits provided? Explain in as much detail as possible:
Flood protection: Upon completion, the project provides protection against a 100-year riverine flood, coincident with a 100-year high-tide event, with accommodation for 26 inches of projected sea-level rise and FEMA freeboard requirements on San Francisquito Creek between East Bayshore Road/Highway 101 and the San Francisco Bay.
The project will protect approximately 1,100 primary residences from creek flooding, and when coupled with future tidal levee improvements, will remove these properties from the FEMA floodplain. The downstream reach of San Francisquito Creek between East Bayshore Road and San Francisco Bay is at the highest risk of severe flooding in the system, due to undersized channel capacity and substandard levees. Flooding risk is exacerbated during high tides. The creek in this area runs through communities that have experienced severe damage during previous flood events. The completion of the East Bayshore Road to San Francisco Bay reach is a necessary first step in providing comprehensive flood protection farther upstream.
The project will remove fluvial flooding risks from San Francisquito Creek for approximately 1,100 properties (primary residences) within the City of East Palo Alto. The MHI in East Palo Alto is $50,142 annually. According to 2010 U.S. Census data, 50% of the residents are low-income (i.e., have incomes less than 80% of the State median income), and 18.4% of the City’s residents are below the poverty line (as compared to 7.6% in San Mateo County and 15.9% in the State).
Habitat Restoration: The project will create increased tidal marshland habitat (within the new channel) at appropriate elevations for intertidal wetland plant and animal species. The project is expected to create approximately 14.4 acres of new or improved mid-marsh habitat, and an estimated 4.0 acres of new or improved low-marsh habitat. The conversion of low quality floodplain terrace habitat (dominated by non-native, perennial pepperweed) to higher quality marsh-plain habitat dominated by native tidal salt and brackish marsh species is the key element of the restoration goals of the project. This will be accomplished by increasing the tidal prism, thereby increasing the summertime salinities, and via the excavation of new marsh plains to elevations that will facilitate colonization by tidal salt marsh plant species and deter colonization by ruderal species (e.g., perennial pepperweed).
Another benefit will be the restoration of high tide refugial habitat for sensitive wildlife species at the ecotone between tidal wetland and upland habitats. This will be accomplished via a combination of grading (e.g., levee lowering and grading of stable inboard levee slopes), topsoil preparation, and active revegetation.
Question 2 Have alternative methods been considered to achieve the same types and amounts of physical benefits as the proposed project been identified? If yes, list the methods (including the proposed project) and estimated costs.
In addition to alternatives evaluation required under CEQA, the SFCJPA analyzed alternative projects within a 404(b)1 Alternatives Analysis as part of the project application for a CWA Section 404 permit. For the purpose of this analysis, specific and consistent criteria were developed to screen alternatives and determine the least environmentally damaging practicable alternative that would meet the basic project purposes. Twelve project alternatives were evaluated against the following screening criteria:
achievement of the basic project purposes; financial, technical and logistical feasibility; and
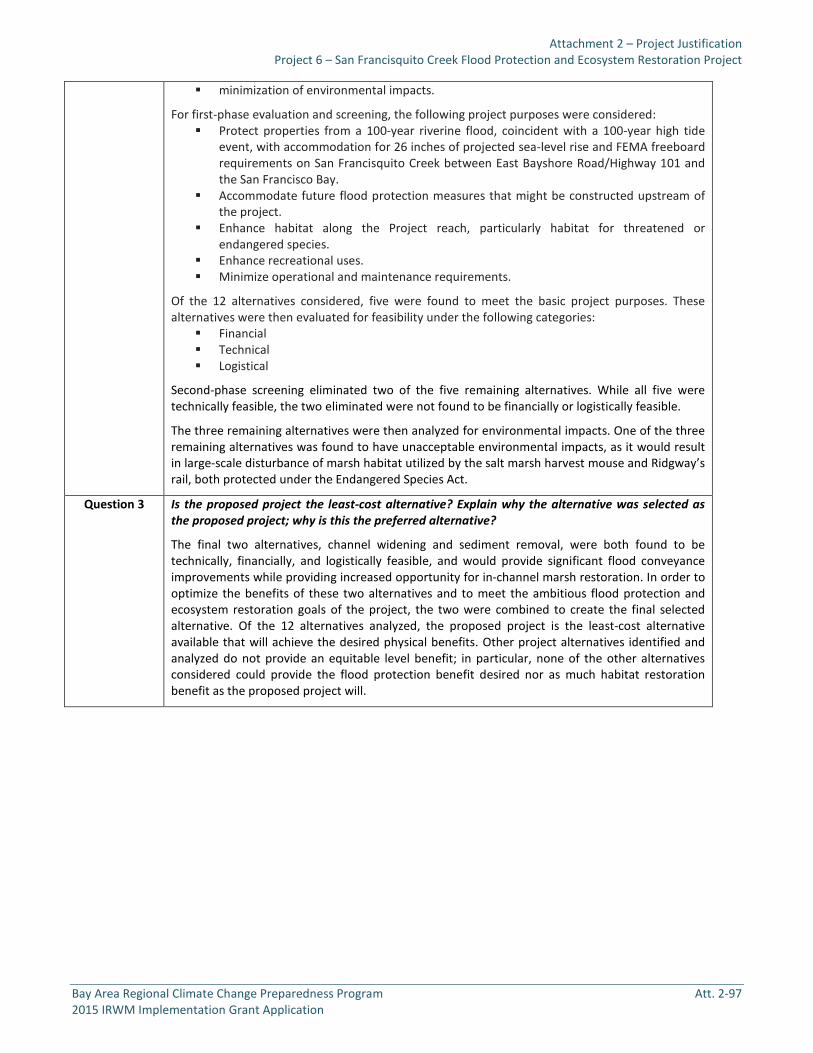
Attachment 2 – Project Justification Project 6 – San Francisquito Creek Flood Protection and Ecosystem Restoration Project
Bay Area Regional Climate Change Preparedness Program Att. 2-97 2015 IRWM Implementation Grant Application
minimization of environmental impacts.
For first-phase evaluation and screening, the following project purposes were considered: Protect properties from a 100-year riverine flood, coincident with a 100-year high tide
event, with accommodation for 26 inches of projected sea-level rise and FEMA freeboard requirements on San Francisquito Creek between East Bayshore Road/Highway 101 and the San Francisco Bay.
Accommodate future flood protection measures that might be constructed upstream of the project.
Enhance habitat along the Project reach, particularly habitat for threatened or endangered species.
Enhance recreational uses. Minimize operational and maintenance requirements.
Of the 12 alternatives considered, five were found to meet the basic project purposes. These alternatives were then evaluated for feasibility under the following categories:
Financial Technical Logistical
Second-phase screening eliminated two of the five remaining alternatives. While all five were technically feasible, the two eliminated were not found to be financially or logistically feasible.
The three remaining alternatives were then analyzed for environmental impacts. One of the three remaining alternatives was found to have unacceptable environmental impacts, as it would result in large-scale disturbance of marsh habitat utilized by the salt marsh harvest mouse and Ridgway’s rail, both protected under the Endangered Species Act.
Question 3 Is the proposed project the least-cost alternative? Explain why the alternative was selected as the proposed project; why is this the preferred alternative?
The final two alternatives, channel widening and sediment removal, were both found to be technically, financially, and logistically feasible, and would provide significant flood conveyance improvements while providing increased opportunity for in-channel marsh restoration. In order to optimize the benefits of these two alternatives and to meet the ambitious flood protection and ecosystem restoration goals of the project, the two were combined to create the final selected alternative. Of the 12 alternatives analyzed, the proposed project is the least-cost alternative available that will achieve the desired physical benefits. Other project alternatives identified and analyzed do not provide an equitable level benefit; in particular, none of the other alternatives considered could provide the flood protection benefit desired nor as much habitat restoration benefit as the proposed project will.

Attachment 2 – Project Justification
Bay Area Regional Climate Change Preparedness Program Att. 2-98 2015 IRWM Implementation Grant Application
PROJECT 7 – MOUNTAIN VIEW SHORELINE PORTION OF SBSPR PROJECT
A. Project Description
Project Need and Goals: The proposed Mountain View Shoreline project is an element of the Bay Area Regional Shoreline Resilience Program and part of the South Bay Salt Pond Restoration Project (SBSPR Project). The SBSPR Project seeks to maintain and improve flood protection and shoreline resiliency, restore a variety of wetland habitats, and provide wildlife-oriented public access on 15,100 acres of former salt-evaporation ponds in southern San Francisco Bay. The SBSPR Project will achieve its goals by constructing a series of habitat, flood protection, and public access projects in phases combined with a robust program of adaptive management.
The project proposed in this application includes restoration of 710 acres including Alviso Ponds A1 and A2W and Charleston Slough (collectively referred to as the “Mountain View Ponds”). This project will fulfill the following goals:
Restore 690 acres of former salt-evaporation ponds to tidal wetlands to provide special status species habitat, increase ecological productivity, and improve water quality.
Maintain or improve existing flood protection for 395 acres and create high tide refugia habitat by improving 1.5 miles of existing levees1 and creating 20 acres of upland transition zones.
Provide wildlife-oriented public access and recreation by constructing 1.5 miles of new trails and two interpretive overlook platforms, as well as interpretive signs.
Project Description: The Mountain View Shoreline portion of the SBSPR Project consists of a cluster of former salt ponds (Pond A1, Pond A2W, and Charleston Slough) as well as the levees surrounding each pond, some of the fringe marsh outside of the ponds and slough levees, Permanente Creek, and Mountain View Slough. The project is highly collaborative and partners with the City of Mountain View, the City of Palo Alto, the U.S. Fish and Wildlife Service, the Santa Clara Valley Water District, and the California State Coastal Conservancy (SCC). The project will restore an estimated 690 acres of tidal marsh habitat, create 20 acres of upland transition zone, and provide an estimated 1.5 miles of shoreline protection. These efforts will prevent flooding in the shoreline communities of Mountain View and Palo Alto, a 395-acre area that comprises several thousand businesses and homes, and enhance resiliency to sea-level rise. Reconnecting the two ponds to tidal waters of the San Francisco Bay will increase natural sediment delivery to the surrounding marshes, improve local water quality, and provide fish rearing habitat.
Shoreline resilience features include increasing the level of flood protection provided by shoreline levees to adjacent infrastructure, business, and parks through raising and improving existing berms. In addition, upland fill material will be used to create upland transition zones that are relatively gently sloping upland habitat with a slope ratio of up to 30:1 (horizontal:vertical). The slopes will serve as a transition zone between the ecosystems of the ponds and the adjacent uplands as well as provide resiliency to sea-level rise by providing wetland migration accommodation space and reducing wave run-up impacts for adjacent levees.
Restoration activities include breaching of the non-engineered berms at locations of historic slough channels, grading portions of the existing berms down to marsh-plain elevations, leaving some berm sections to provide high tide refugia (or adding material to existing berm sections to create islands), installing ditch blocks to control water flows for marsh development, and excavating pilot channels. The ponds will rely on natural sedimentation to bring the pond bottoms up to marsh-plain elevations; wetland vegetation is expected to appear in 5 to 10 years. These actions will provide long-lasting improvements to habitat, water quality, and overall ecological conditions of Pond A1, Pond A2W, and Charleston Slough. Project construction is anticipated to begin in December 2016 and be complete by July 2018.
Anticipated Physical Benefits/Intended Outcomes: The Mountain View Shoreline portion of the SBSPR Project will improve flood protection for 395 acres including several thousand businesses and homes in Mountain View and Palo Alto, and it will restore 690 acres of tidal wetland and 20 acres of upland transition zone habitat for a multitude of fish, bird, and mammal species.
Regional Applicability: The proposed Mountain View Shoreline project is a key element of the Bay Area Regional Shoreline Resilience Program and part of the SBSPR Project. The SBSPR Project seeks to maintain and improve flood protection and shoreline resiliency, restore a variety of wetland habitats, and provide wildlife-oriented public access on 15,100 acres of former salt-evaporation ponds in southern San Francisco Bay.
1 All levees around the salt ponds, unless noted, are unimproved, unengineered berms. The SBSPR Project and this application use the terms levee, dike, and berm interchangeably.

Attachment 2 – Project Justification
Bay Area Regional Climate Change Preparedness Program Att. 2-99 2015 IRWM Implementation Grant Application
B. Project Map

Attachment 2 – Project Justification Project 7 – Mountain View Shoreline Portion of SBSPR Project
Bay Area Regional Climate Change Preparedness Program Att. 2-100 2015 IRWM Implementation Grant Application
C. Project Physical Benefits
Primary and secondary project physical benefits are summarized in PSP Tables 5a and 5b, respectively, as follows.
Technical Analysis of Primary Physical Benefits Claimed
1. Explanation of the need for the project, including recent and historical conditions that provide background for benefits to be claimed; e.g., recent water shortages, loss of habitat or ecosystem function, and water quality problems.
An estimated 90% of the historic tidal marshes in the San Francisco Bay–Delta Estuary have been filled or significantly altered over the past two centuries. During this period, extensive urban and industrial development occurred on coastal and fluvial floodplains. These dramatic changes to the historic bayshore and tidal marshes have led to losses of fish and wildlife, including state and federally listed species, and degraded water quality in the Bay. In addition, these changes reduced the ability of the Bay shoreline to absorb storm run-up and high tides. Sea-level rise will intensify the existing flood risks to the developed shoreline by increasing the frequency of levee failure and the frequency of high energy wave events with the potential to erode the existing levees, landfill slopes, and infrastructure.
In South San Francisco Bay, the primary cause of tidal marsh loss was diking and impounding of Bay waters for salt production. In 2003, Cargill Inc. sold 15,100 acres of these South Bay salt ponds to the California Department of Fish and Wildlife (CDFW) and the U.S. Fish and Wildlife Service (USFWS), creating the South Bay Salt Pond Restoration Project, which seeks to restore some of the South Bay’s historic landscape.
In 2008, the SBSPR Project completed a 50-year plan for restoration and enhancement of the habitats of San Francisco Bay across the landscape, improvement of the existing level of flood protection and creation of wildlife-oriented public access. SBSPR Phase 1 will be complete as of June 2015, creating 1,600 acres of tidal wetlands, 1,440 acres of muted tidal wetlands, enhancement of 710 acres of managed ponds, and 7 miles of trail. Although 25% of the SBSPR Project is complete, much more remains to be done.
PSP Table 5a – Primary Annual Project Physical Benefits
Project Name: Project 7 - Mountain View Shoreline Portion of SBSPR Project Type of Benefit Claimed: Flood Damage Reduction Units of the Benefit Claimed: Acres of inundation reduced Additional Information About This Benefit: The existing flood protection consists of non-engineered berms that regularly erode. Failure of the salt pond berm during storms or high tides could lead to extensive flooding inland that would inundate at least 395 acres in the City of Mountain View as well as Highway 101 (Silicon Valley’s major transportation route). Anticipated Useful Life of Project (years): 50 years
Year
Physical Benefits
Without Project With Project Change Resulting from Project
2016 0 - Project under construction starting December 2016.
2017 0 - Project under construction.
2018 0 395 Project complete in July 2018. 395 acres protected against flood inundation during storms or high tides.
Last Year of Project Life (approximately
2058)
0 395 395 acres protected against flood inundation during storms or high tides for the next 50 years.
Comments: Shoreline Regional Park Community: Sea Level Rise Study Feasibility Report and Capital Improvement Program (ESA-PWA December 2012). ESA-PWA provided the estimate of acres at risk based on an updated geospatial analysis of data in their December 2012 report.

Attachment 2 – Project Justification Project 7 – Mountain View Shoreline Portion of SBSPR Project
Bay Area Regional Climate Change Preparedness Program Att. 2-101 2015 IRWM Implementation Grant Application
South Bay Salt Pond Restoration Project Map
The SBSPR Project will release a draft EIS/EIR in July 2015 describing the next set of flood protection, restoration, and recreation projects (SBSPR Phase 2 projects) in the Alviso and Ravenswood Pond Complexes, which include the Mountain View project proposed for funding in this application. In addition to the habitat enhancement benefits described in the Secondary Benefits section below, SBSPR Phase 2 will help address some of the shoreline vulnerabilities of South Bay communities. This proposal is focused on one of the SBSPR Phase 2 projects: the Alviso Mountain View Ponds (consisting of Ponds A1 and A2W and the adjacent Charleston Slough).
The historic salt pond levees that protect the South Bay shoreline are generally non-engineered berms that are aging, subject to potential failures, and have little to no ability to provide protection against sea-level rise. Given the present day flood risk, the salt pond levees cannot be breached for tidal wetland restoration, as that would increase the existing flood risk even more. While the Pond A1 and A2W levee system does not currently provide adequate flood protection, at the same time, it precludes the restoration of these ponds to tidal wetlands. This project will address both of these problems. The flood risk will be addressed by raising and improving existing inadequate levees, protecting landfills from high tides and erosion by adding fill and vegetation that will also provide habitat (habitat benefits described below in more detail), and protecting existing infrastructure such as PG&E towers and access roads. When completed, the project will protect 395 acres in the Mountain View and Palo Alto area from flooding and sea-level rise.
2. Explanation of estimates of the without-project conditions (e.g., the levels of the physical benefits in the future, without the project, but with other planned projects).
The salt pond levees are currently maintained to provide wildlife values. Originally created to hold bay water for solar evaporation, they are not engineered levees and were never intended to provide flood protection for human

Attachment 2 – Project Justification Project 7 – Mountain View Shoreline Portion of SBSPR Project
Bay Area Regional Climate Change Preparedness Program Att. 2-102 2015 IRWM Implementation Grant Application
life or property. These levees were created by dredging soft bay mud from adjacent “borrow ditch” and piling it on top of existing berms. As a result, these berms erode quickly, require difficult and costly maintenance, and are not adequate to protect the shoreline. Bayfront levee failure in Ponds A1 or A2W from storms or extreme tides could lead to coastal flooding through the ponds and over the inadequate inland levee system. Since the levee network was originally intended to hold and protect concentrated salt water from dilution from the bay, the inland levees, closest to developed areas provide an even lower level of protection than the bayfront levees. Bayfront levee failure means the adjacent Silicon Valley businesses, major freeways, water pollution control plants, and residences could experience costly and extensive flooding. The City of Mountain View’s Shoreline Regional Park Community: Sea Level Rise Study Feasibility Report and Capital Improvement Program (ESA-PWA December 2012) illustrates the impacts of flooding from a failure of the Pond A1 outboard levee to affect 395 acres. ESA-PWA provided the estimate of acres-at-risk based on an updated geospatial analysis of data in their December 2012 report. The amount is conservative (low) because it only considers coastal flooding over the Coast Casey levee (originating from Pond A1 Bayfront levee failure) and excludes coastal and fluvial flood waters from Adobe Creek and Palo Alto Flood Basin overtopping.
Without the Mountain View project, levee failure will continue to be a risk factor during storms and extreme tides, and the City of Mountain View and Palo Alto will continue to be at risk.
3. Description of the methods used to estimate the primary physical benefits.
The flood risk assessment for the larger SBSPR Project is documented in Shoreline Regional Park Community Report (ESA-PWA December 2012). This report drew upon documentation of levee conditions conducted by the SBSPR Project, modeling done by ESA-PWA, the Santa Clara Valley Water District’s planning for the Permanente Creek Flood Protection Project, and other local planning documents. The two scenarios used in the report were: (1) sea-level rise of 8 inches between 2000 and 2067, and (2) sea-level rise of 31 inches between 2000 and 2067.
The acreage estimate for flood damage reduction benefits of the Mountain View project was conducted in June 2015 by ESA-PWA at the applicant’s request. Based on previous modeling conducted by ESA-PWA, ESA-PWA staff re-evaluated data from their 2012 study and estimated the amount of coastal flooding that would likely come just from failure of the inland Pond A1 levee. This estimate is conservative and does not include possible flooding into Palo Alto because it is not based on more accurate model runs. The proposed Mountain View project will result in 395 acres of flood protection for residents and property in the City of Mountain View.
4. Identification/description of all new facilities, policies, and actions required to obtain the physical benefits, e.g., any City policies or procedures that need to be established in order for the benefits to be realized.
The actions and structures required to increase shoreline resiliency include:
1) Levee Improvements: Place additional fill along the slopes and levee top to achieve a minimum crest elevation of 14 feet NAVD88 along 7,000 feet of the Charleston Slough west levee and 1,000 feet of the Coast Casey Forebay north levee. Levee fill would be placed and compacted to 90%-to-95% of maximum dry density as measured using ASTM D1557. The improved levee would have side slopes of 4:1 (h:v) and rock slope protection for erosion control where exposed to wave action. While ponds are owned by the USFWS, the levees are on Cities of Palo Alto and Mountain View properties. Construction access to the levees will be secured through appropriate agreements from the cities.
2) Levee Lowering: Described under Secondary Benefits.
3) Levee Breaching: Described under Secondary Benefits.
4) Raise Sailing Lake Intake and other Infrastructure: Install new intake structure and raise existing electrical boxes, pumps, and associated infrastructure.
5) Create Habitat Transition Zone: Described under Secondary Benefits.
6) Bridge Breaches: Install 60-foot-span rail flatcar bridges over breaches in Pond A2W to provide for public access trail and maintain PG&E access road.
7) Public Recreation Features: Surface public access trails and re-grade for ADA access. Install two interpretive signs and benches and one raised viewing platform.

Attachment 2 – Project Justification Project 7 – Mountain View Shoreline Portion of SBSPR Project
Bay Area Regional Climate Change Preparedness Program Att. 2-103 2015 IRWM Implementation Grant Application
5. Description of potential adverse physical effects and what is being done to mitigate those impacts.
Some potential adverse effects to the environment come from the construction or implementation phase of the project, and others come from the ongoing operation or maintenance phase of the project. As discussed at length in the EIS/EIR for the SBSPR Project’s Phase 2 alternatives, almost all of the impacts in the various resource categories were determined to be less than significant or absent (i.e., a “No Impact” determination), and many others were found to be beneficial, which is a category only recognized under NEPA. The discussion below highlights some of the analyses and determinations that were used to assess the possibilities of adverse impacts.
In general, the greatest potential for adverse effects from the SBSPR Project from construction activities relates to earthmoving and importing of fill material. Earthmoving activities include levee breaches, levee lowering or removal, levee elevation increases or other improvements, and construction of habitat islands and habitat transition zones. For all of these activities, large construction equipment will be used, and there is the potential for adverse impacts related to air quality, water quality, noise, traffic, recreation, and other resources.
However, by following strict best management practices and other protocols for the timing, staging, and implementation of the construction activities, these impacts will largely be avoided completely or reduced to less than significant levels. For example, the large quantities of fill material to construct transition zones and islands and to raise levees will be imported from offsite excavation projects. By restricting the hours of delivery to off-peak (i.e., non-commute) hours, traffic impacts are largely avoided. Proven construction best management practices (BMPs) will be used to prevent leaks or spills and thus protect water quality. These same practices also minimize air pollutant emissions, which were found to be below those that would violate any air quality standards. There are no sensitive receptors for noise, air quality, or odors near enough to the project area to be affected.
The various forms of earthwork could also affect wildlife on the levees or in the surrounding waters, but preconstruction surveys, exclusion fencing, seasonal avoidance of special-status species, and construction monitoring would all be used to reduce these impacts to levels that are less than significant. The specifics of all these measures will be developed during the permitting processes with the various regulatory agencies. Part of the consideration of these possible impacts is the understanding that, while some temporary disturbance is necessary, the degree to which habitats would be restored and enhanced is greater by several orders of magnitude than the degree to which habitat would be temporarily affected.
The EIS/EIR analysis also showed that the project would not violate any land use policies or change the demand or requirements for public services, utilities, roads, or parking. The reasoning behind these conclusions is that the project would mostly be changing one form of open space (former salt-production ponds) to another (tidal marshes), which would occur on public lands (a portion of the Don Edwards National Wildlife Refuge) owned by USFWS.
There would be temporary adverse impacts to recreational use of portions of Shoreline Park during parts of the construction. Certain public trails and parking areas would be closed during material import and active placement into the ponds. This is unavoidable because of the safety risks of having hikers or bicyclists moving through a construction area. However, the increase in the trail miles and number of viewing areas would lead to a long-term increase in the amount and quality of public access and recreation in the area.
6. Description of whether the proposed project effectively addresses long-term drought preparedness goals.
The primary project benefit of reduced flood inundation does not address long-term drought preparedness goals.

Attachment 2 – Project Justification Project 7 – Mountain View Shoreline Portion of SBSPR Project
Bay Area Regional Climate Change Preparedness Program Att. 2-104 2015 IRWM Implementation Grant Application
References Cited for Primary Project Benefit
The City of Mountain View’s Shoreline Regional Park Community: Sea Level Rise Study Feasibility Report and Capital Improvement Program (ESA-PWA December 2012) can be found at www.esassoc.com/projects/mountain-view-shoreline-sea-level-rise-study.
Alviso-Mountain View Ponds Restoration Preliminary Design Memorandum (URS November 2014) can be found at http://www.southbayrestoration.org/planning/phase2.
Section 5 Potential Adverse Physical Effects analysis is based on South Bay Salt Pond Restoration Project, Phase 2 Draft Environmental Impact Statement/Report (AECOM July 2015), which will be available online after July 24,
2015, at www.southbayrestoration.org/planning/phase2. Pacific Institute. 2009. The Impacts of Sea-Level Rise on the California Coast. Prepared for the California Climate
Change Center. Conathan, Buchanan, and Polefka. 2014. The Economic Case For Restoring Coastal Ecosystems. The Center for
American Progress and OxFam America. National Research Council. 2012. Sea-Level Rise for the Coasts of California, Oregon, and Washington: Past,
Present, and Future. Washington, DC: The National Academies Press. Philip Williams & Associates, Ltd., and P. M. Faber. 2004. Design Guidelines for Tidal Wetland Restoration in San
Francisco Bay. The Bay Institute and California State Coastal Conservancy, Oakland, CA. 83 p. Shepard CC, Crain CM, Beck MW. 2011. The Protective Role of Coastal Marshes: A Systematic Review and Meta-
analysis. PLoS ONE 6(11): e27374. doi:10.1371/journal.pone.0027374 ESA PWA. 2013. Analysis of the Costs and Benefits of Using Tidal Marsh Restoration as a Sea Level Rise Adaptation
Strategy in San Francisco Bay. Prepared for the Bay Institute. Cheong, Silliman, Wong, van Wesenbeeck, Kim, and Guannel. 2013. Coastal Adaptation with Ecological
Engineering. Nature Climate Change. Published Online: 28 August 2013 | Doi: 10.1038/Nclimate1854. Arkema, Guannel, Verutes, Wood, Guerry, Ruckelshaus, Kareiva, Lacayo and Silver. 2013. Coastal Habitats Shield
People and Property from Sea-level Rise and Storms. Nature Climate Change. Published Online: 14 July 2013 | Doi: 10.1038/Nclimate1944.

Attachment 2 – Project Justification Project 7 – Mountain View Shoreline Portion of SBSPR Project
Bay Area Regional Climate Change Preparedness Program Att. 2-105 2015 IRWM Implementation Grant Application
Technical Analysis of Secondary Physical Benefits Claimed
1. Explanation of the need for the project, including recent and historical conditions that provide background for benefits to be claimed; e.g., recent water shortages, loss of habitat or ecosystem function, and water quality problems.
The South Bay has lost nearly 90% of the extensive tidal marsh system that continued in an unbroken band from Coyote Point in San Mateo County, along the Santa Clara County shoreline, to Robert’s Landing in San Leandro, Alameda County. Starting in 1857, the post-Gold Rush population began the process of diking off portions of these tidal marshes to create solar evaporation ponds for the production of salt. The Mountain View ponds were diked in the first quarter of the 20th century. By the 1950s, most of the South Bay’s tidal marshes had been converted to solar evaporation ponds. Other portions of the South Bay’s wetlands were used for landfills or filled for development. At the time of the South Bay Salt Ponds acquisition in 2003, the only tidal wetlands left in the South Bay, aside from a few restoration projects, were the disconnected fragments of marsh along the outside fringe of the salt pond berms.
Flood risk associated with these landscape changes is discussed above, but the loss of these historic tidal marshes did not just increase flood risks. These dramatic changes to the historic extent of tidal marshes have led to losses of fish and wildlife and degraded water quality in the San Francisco Bay. As a result, tidal wetland-dependent species including California Ridgway’s rail, salt marsh harvest mouse, and steelhead trout are now imperiled (see table below for listed species). An additional 19 fish species, 14 bird species, and 1 mammal species will benefit from the wetland restoration and the upland levee habitat created by the proposed project. In total, 23 fish species, 21 bird species, and 2 mammals species will benefit from the project.
PSP Table 5b - Secondary Annual Project Physical Benefits
Project Name: Project 7 - Mountain View Shoreline Portion of SBSPR Project Secondary Benefit Claimed: Habitat Creation and Restoration Units of the Benefit Claimed: Acres of habitat Additional Information About This Benefit: 690 acres of tidal wetland will be created by natural sedimentation processes once the salt pond levees are breached. 20 acres of upland habitat will be constructed to provide refugia for tidal marsh species during storms and high tides. Anticipated Useful Life of Project (years): 50
Year
Physical Benefits
Without Project With Project Change Resulting from Project
2016 0 - Project under construction starting December 2016
2017
0 - Salt pond levees breached to restore natural tidal flows to 690 acres. Project under construction to create 20 acres of upland transition zone.
2018 0 710 Project complete in July 2018.
690 acres of tidal wetland habitat and 20 acres of upland habitat created.
Last Year of Project Life (approximately 2058)
0 710 Wetland habitat and upland transition zone restored for the next 50 years.
Comments: Alviso-Mountain View Ponds Restoration Preliminary Design Memorandum (URS November 2014). Pond acreages from p. 1-17 of South Bay Salt Pond Restoration Project Final EIS/EIR (EDAW December 2007).

Attachment 2 – Project Justification Project 7 – Mountain View Shoreline Portion of SBSPR Project
Bay Area Regional Climate Change Preparedness Program Att. 2-106 2015 IRWM Implementation Grant Application
State and Federal Listed Species in the SBSPR Project Area Species Name Federal Ranking State Ranking Fish Northern California Steelhead Trout (Oncorhynchus mykiss irideus) FT ST Longfin Smelt (Spirinchus thaleichthys) Candidate ST Green Sturgeon (Acipenser medirostris) (Southern Distinct Population Segment) FT -- Chinook Salmon (O. tshawytscha) -- SC Birds California Ridgway’s Rail (Rallus obsoletus) FE SE California Least Tern (Sternula antillarum browni) FE SE California Black Rail (Laterallus jamaicensis coturniculus) SC ST San Francisco Common Yellowthroat (Geothlypis trichas sinuosa) -- SC Northern Harrier (Circus cyaneus) -- SC Bryant’s Savannah Sparrow (Passerculus sandwichensis alaudinus) -- SC Alameda Song Sparrow (Melospiza melodia pusillula) -- SC Mammals Salt Marsh Harvest Mouse (Reithrodontomys raviventris) FE SE
Ranking Key: FE = Federally Endangered FT = Federally Threatened
SE = State Endangered ST = State Threatened
SC = Species of Concern -- = Not Listed
Source: Species table complied by SCC staff and reviewed by biological consulting firm, HT Harvey & Associates.
Loss of tidal marsh has also led to a decline in natural water quality purification functions, one of the many ecosystem services once performed by the hundreds of thousands of acres of healthy tidal marsh in the bay. The operation of former salt ponds as managed ponds (i.e., circulating bay waters through water control structures) can lower water quality by decreasing dissolved oxygen (DO). Although circulation has improved in the former salt ponds, the ponds have large surface areas, shallow water depths, and long residence times, which makes them conducive to warm temperatures and excessive algal growth. This can lead to a severe and chronic depletion in DO levels when algae suffer die-off or respire during night-time hours.
2. Explanation of estimates of the without-project conditions (e.g., the levels of the physical benefits in the future, without the project, but with other planned projects).
In 2008, the SBSPR Project completed a 50-year plan for restoration and enhancement of the habitats of San Francisco Bay across the landscape, improvement of the existing level of flood protection, and creation of wildlife-oriented public access in South Bay Salt Pond Restoration Project Final Environmental Impact Statement/Report (EDAW December 2007). The project is to be implemented in multiple phases through an adaptive management framework.
The existing conditions, or No Action, analysis in the EDAW 2007 report indicated that significant adverse impacts to the environment would result without restoration or habitat enhancement of the salt ponds. Over time, unintended breaches of the ponds will increase as unengineered berms erode or fail. This will cause the flooding impacts described above and will also have negative impacts on habitat. Unplanned breaches do not optimize sediment accumulation, and indirect flows can create vector problems by allowing water to pond and not adequately drain, encouraging mosquito growth. Furthermore, the SBSPR Project’s intent is to carefully consider the habitat needs of the entire project area with each restoration action in each Phase. Unintended breaches may create wetland habitat but it could be in the wrong pond (e.g., a pond more appropriately set aside for snowy plovers, which like dry conditions).
Without raising the levees and restoring tidal marsh and upland habitat, permanent impacts to wildlife will result. For example, an unintended breach of Pond A1 or A2W could flood islands currently used by California least terns and other birds and destroy their nesting and roosting habitat.

Attachment 2 – Project Justification Project 7 – Mountain View Shoreline Portion of SBSPR Project
Bay Area Regional Climate Change Preparedness Program Att. 2-107 2015 IRWM Implementation Grant Application
The Mountain View project is the result of a five-year planning process undertaken by the SBSPR Project to identify numerous Phase 2 projects. The carefully planned mix of habitats has been reviewed by the project’s management team, science team, and stakeholders panel as well as the general public, and there is a general consensus that this suite of projects meets the SBSPR Project’s goals and is consistent with the adaptive management approach that is so central to the SBSPR Project. The inability to create 690 acres of tidal wetland and 20 acres of upland transition habitat will be a setback for the SBSPR Project and may trigger re-evaluation of all the projects proposed in Phase 2.
In addition, the attempt by the SBSPR Project to create sufficient habitat to aid in the recovery of endangered and threatened tidal marsh species will suffer if the Mountain View ponds are not constructed. The Mountain View ponds are a key link in the continuous band of salt marsh habitat that the SBSPR Project is trying to recreate in the South Bay to facilitate wildlife movement between marsh complexes.
3. Description of the methods used to estimate the secondary physical benefits.
The existing conditions of the ponds are in the Alviso-Mountain View Ponds Restoration Preliminary Design Memorandum (URS November 2014). The pond acreages are from Table 1-2 on p. 1-17 of the South Bay Salt Pond Restoration Project Final Environmental Impact Statement/Report (EDAW December 2007).
The estimated habitat benefits are based on the trajectory of past restoration projects in San Francisco Bay and review of the completed SBSPR Project Phase I projects. In newly restored marshes, natural sediment accretion from tidal action will raise the marsh plain, allowing vegetation to colonize within 5–10 years. Once at marsh-plain elevation, tidal flushing will create and maintain tidal channels and circulation. The creation of greater than 20 acres of high tide refugia habitat is estimated to increase habitat cover and plant survival during extreme tides and storms for marsh species. This is based on habitat assessments of other San Francisco Bay historic marshes with intact refugia areas. The full 710 acres of restored tidal marsh and upland transition habitat will not be realized until project construction is complete in 2018.
4. Identification/description of all new facilities, policies, and actions required to obtain the physical benefits, e.g., any City policies or procedures that need to be established in order for the benefits to be realized.
The actions and structures required to restore subsided former salt ponds to vegetated tidal wetlands include:
1) Levee Lowering: Approximately 4,730 feet of Pond A1 west levee lowered to 6.6 feet NAVD 88 to facilitate tidal exchange.
2) Levee Breaching: Existing levees will be breached in approximately 8 locations at sites of historic slough channels in Charleston Slough, Pond A1, and Pond A2W to allow tidal exchange.
By increasing tidal exchange, the ponds will naturally accrete sediment. Within 10 years, the bottom of the pond should rise to marsh-plain elevation and support cordgrass and pickleweed.
Tidal scour will improve hydraulic connections between channels of developing marsh and the bay, benefiting fish species, including steelhead trout. Water quality will also improve due to increased water circulation and the natural filtration function of wetlands.
3) Create Habitat Transition Zone: Place and grade upland fill material along 3,000 feet of the southern perimeter levee of Pond A1 and 3,000 feet along the southern perimeter levee of Pond A2W to create varying 15:1-to-30:1 slopes. These actions will create 20 acres of high-tide refugia habitat currently missing from much of southern San Francisco Bay. This increased habitat diversity and complexity should increase cover and survival during extreme tides for marsh species, such as Ridgway’s rail and the salt marsh harvest mouse, and provide a buffer between sensitive marsh species and the adjacent, heavily-used Shoreline Park.
4) Nesting Islands: Create up to 16 islands out of levee material. Surface would be treated to facilitate bird use.
5. Description of potential adverse physical effects and what is being done to mitigate those impacts.
In addition to the impacts described above under Primary Benefits, implementation of the project would create impacts related to the placement of fill to construct habitat transition zones and islands and to provide a wider base for increased levee height. Fill in jurisdictional waters would normally be an adverse environmental impact to the aquatic ecosystem and its water quality. However, by placing the fill in the ponds prior to breaching, turbidity

Attachment 2 – Project Justification Project 7 – Mountain View Shoreline Portion of SBSPR Project
Bay Area Regional Climate Change Preparedness Program Att. 2-108 2015 IRWM Implementation Grant Application
and disturbance impacts on fish and wildlife will be limited because the currently closed ponds do not contain such wildlife.
Filling portions of the ponds to create transitional habitat between the pond and the adjacent upland areas has the potential to adversely impact pond-dependent bird species, such as diving ducks and dabbling ducks. However, the SBSPR Project has committed to the ongoing implementation of a thoroughly reviewed and published adaptive management plan (AMP) that is intended to monitor the environment and apply responses from one project phase to the planning and design of subsequent project phases. Thus, while the expectation is that pond-dependent bird species will gradually relocate to some of the many remaining ponds in the South Bay over the many years it will take to fill in and vegetate the Mountain View Ponds, the AMP will monitor these birds to verify if they are relocating and respond accordingly if they are not. In that case, future SBSPR Project phases will retain and enhance more managed ponds to offset those impacts.
The AMP will also be used to adjust ongoing management of the Phase 2 ponds to avoid those adverse impacts that show signs of being greater than initially expected. For example, wildlife behavior will be monitored, and if changes in behavior are observed due to recreation use of trails and viewing areas, the locations or timing of certain trail access or seasons of use can be changed. Similar application of the AMP would be used if water quality is degraded or if scour or erosion occur in places or at rates unintended by the project designs.
In the operation and ongoing maintenance phase of the project, most of the impacts would be minimal or even beneficial. In most cases, the required maintenance effort would decrease (e.g., because there is less need to maintain outboard levees) and thus reduce potential impacts. The breached ponds will slowly accrete sediment and eventually begin to grow marsh vegetation. Wildlife will adapt to increased human presence on certain portions of trails and viewing areas. The same general types of monitoring and research activities that occur now would continue. In addition, it is expected that current predator and weed management activities would continue, but these activities occur now and, ultimately, are beneficial to the project. The City of Mountain View will also need to operate and maintain its water intake facilities located in the ponds, but by relocating these facilities, the project should reduce the need for maintenance and associated disturbance.
6. Description of whether the proposed project effectively addresses long-term drought preparedness goals.
The secondary project benefit of reduced flood risk does not address drought preparedness goals.
References Cited for Secondary Project Benefit
Alviso-Mountain View Ponds Restoration Preliminary Design Memorandum (URS November 2014) can be found at http://www.southbayrestoration.org/planning/phase2.
South Bay Salt Pond Restoration Project Final Environmental Impact Statement/Report (EDAW December 2007) can be found at http://www.southbayrestoration.org/EIR. Impacts of all alternatives, including No Action Alternative A, are summarized in Table ES-1 of the Executive Summary p. ES-23-31.
Historical information on tidal marshes and salt pond creation is from Grossing, R. M & Askevold, R. A., 2005, Baylands and Creeks of South San Francisco Bay: Oakland Museum of California, Oakland CA.
Section 5 Potential Adverse Physical Effects analysis is based on South Bay Salt Pond Restoration Project, Phase 2 Draft Environmental Impact Statement/Report (AECOM July 2015) which will be available on line after July 24,
2015 at www.southbayrestoration.org/planning/phase2. U.S. Fish and Wildlife Service. 2013. Recovery Plan for Tidal Marsh Ecosystems of Northern and Central California.
Sacramento, California. Xviii + 605 p. California Department of Fish and Game. 2005. California Wildlife: Conservation Challenges – California’s Wildlife
Action Plan. Sacramento, California. Goals Project. 1999. Baylands Ecosystem Habitat Goals. A report of habitat recommendations prepared by the San
Francisco Bay Area Wetland Ecosystem Goals Project. First Reprint. U.S. Environmental Protection Agency, San Francisco, Calif./S.F. Bay Regional Water Quality Control Board, Oakland Calif.
Goals Project. 2000. Baylands Ecosystem Species and Community Profiles: Life histories and environmental requirements of key plants, fish and wildlife. Prepared by the San Francisco Bay Area Wetland Ecosystem Goals Project. P.R. Olofson, editor. S.F. Bay Regional Water Quality Control Board, Oakland Calif.
Goals Project. Baylands Ecosystem Habitat Goals Science Update (in draft, 2015).

Attachment 2 – Project Justification Project 7 – Mountain View Shoreline Portion of SBSPR Project
Bay Area Regional Climate Change Preparedness Program Att. 2-109 2015 IRWM Implementation Grant Application
D. Direct Water-Related Benefit to a DAC
There are no Disadvantaged Communities (DAC) in or near the project site as presented in DWR’s DAC Mapping Tool.
The Mountain View project will provide direct flood damage reduction benefits to public property within 593 acres. However, less than 25% of the area served by this project meets the definition of a DAC.
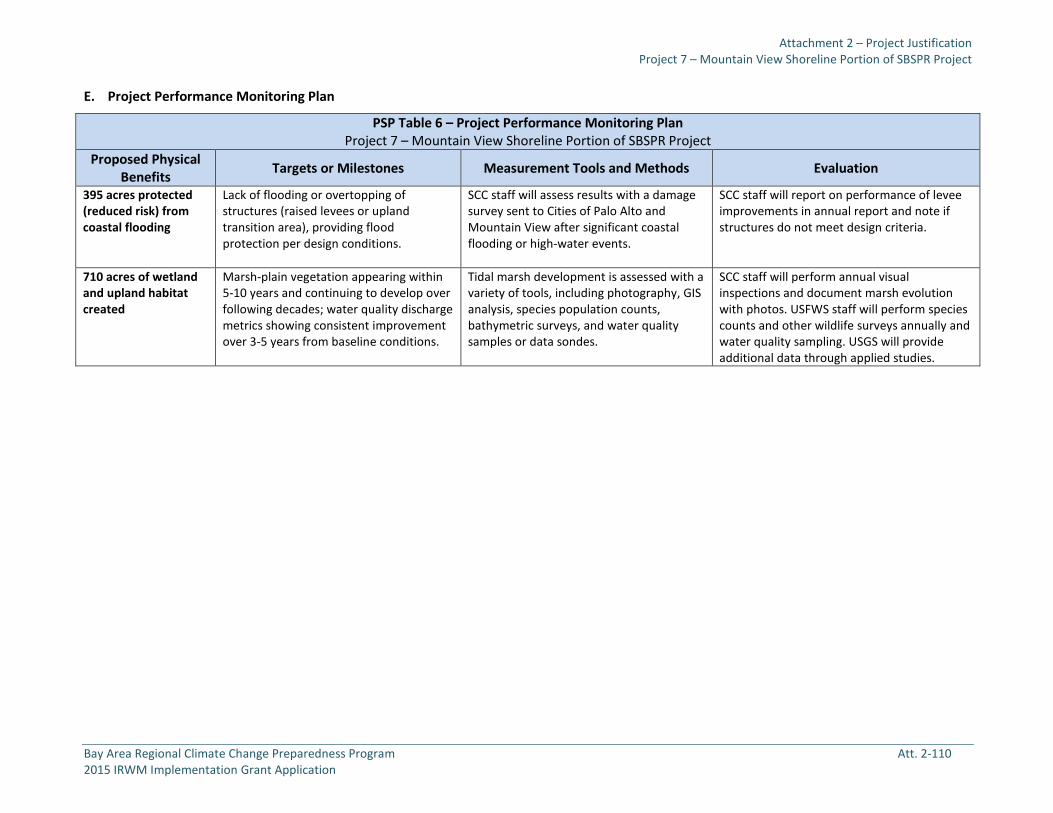
Attachment 2 – Project Justification Project 7 – Mountain View Shoreline Portion of SBSPR Project
Bay Area Regional Climate Change Preparedness Program Att. 2-110 2015 IRWM Implementation Grant Application
E. Project Performance Monitoring Plan
PSP Table 6 – Project Performance Monitoring Plan Project 7 – Mountain View Shoreline Portion of SBSPR Project
Proposed Physical Benefits Targets or Milestones Measurement Tools and Methods Evaluation
395 acres protected (reduced risk) from coastal flooding
Lack of flooding or overtopping of structures (raised levees or upland transition area), providing flood protection per design conditions.
SCC staff will assess results with a damage survey sent to Cities of Palo Alto and Mountain View after significant coastal flooding or high-water events.
SCC staff will report on performance of levee improvements in annual report and note if structures do not meet design criteria.
710 acres of wetland and upland habitat created
Marsh-plain vegetation appearing within 5-10 years and continuing to develop over following decades; water quality discharge metrics showing consistent improvement over 3-5 years from baseline conditions.
Tidal marsh development is assessed with a variety of tools, including photography, GIS analysis, species population counts, bathymetric surveys, and water quality samples or data sondes.
SCC staff will perform annual visual inspections and document marsh evolution with photos. USFWS staff will perform species counts and other wildlife surveys annually and water quality sampling. USGS will provide additional data through applied studies.

Attachment 2 – Project Justification Project 7 – Mountain View Shoreline Portion of SBSPR Project
Bay Area Regional Climate Change Preparedness Program Att. 2-111 2015 IRWM Implementation Grant Application
F. Cost-Effectiveness Analysis
PSP Table 7 evaluates whether the physical benefits provided by the project are provided at the least possible costs.
PSP Table 7 – Cost-Effectiveness Analysis Project name: Project 7 - Mountain View Shoreline Portion of SBSPR Project
Question 1 What are the types of benefits provided? Explain in as much detail as possible:
Flood Protection: The existing flood protection consists of non-engineered berms that regularly erode. Failure of the salt pond berm during storms or high tides could lead to extensive flooding inland that would inundate at least 395 acres in the City of Mountain View as well as Highway 101 (Silicon Valley’s major transportation route).
Habitat Creation and Restoration: The project will breach existing salt pond berms to create 690 acres of tidal wetland using natural sedimentation and vegetation processes. 20 acres of upland habitat will be constructed to provide refugia for tidal marsh species during storms and high tides.
Question 2 Have alternative methods been considered to achieve the same types and amounts of physical benefits as the proposed project been identified? If yes, list the methods (including the proposed project) and estimated costs.
The SBSPR Project went through an extensive five-year planning process to determine the highest and best value of each set of ponds in the South Bay. Through this process, it was determined that some ponds had greater value being retained and reconfigured as managed habitat, while others would be slated for restoration to tidal habitats. The Mountain View ponds were determined to be best suited to tidal wetland restoration, as opposed to being used to create “managed pond” habitat, that is, shallow ponded water habitat for migratory shorebirds. In addition, the SBSPR Project will implement an adaptive management program through which regional and local applied studies are being implemented to inform future design. All of the lessons learned from previous phases of the SBSPR Project are being applied to this project.
As to the specific project details, the SBSPR Project EIS/EIR is evaluating a range of alternatives and specific project features and methods. Several early concepts were discarded for not being cost-effective and not achieving the project goals. The physical benefits proposed by the project represent three years of discussion and analysis, including vetting at several public meetings.
Question 3 Is the proposed project the least cost alternative? Explain why the alternative was selected as the proposed project; why is this the preferred alternative? Explain accomplishments of the project that are different from the alternative project or methods.
Tidal marsh restoration is substantially more cost-effective than a reconfigured, managed pond and greatly reduces the amount of long-term maintenance the site requires. The restoration will largely rely on natural processes to establish and sustain the marsh habitat. Managed systems also carry a greater degree of uncertainty, given that they rely on engineered water control structures that must be operated by humans and that have a discrete lifespan. Tidal wetlands are in a dynamic equilibrium with the bay and, as such, can keep pace with sea-level rise, thus providing a more resilient shoreline.
In addition, the inclusion of Charleston Slough was selected, as it is not economically prudent to build a flood control levee between Charleston Slough and Pond A1, since they are both supposed to be tidal wetland restoration projects. Instead, it makes more sense from an integrated regional perspective to link Pond A1 with Charleston Slough to provide a higher-functioning marsh system while placing the flood risk reduction features in a more appropriate and mutually beneficial location.
Comments: Alviso-Mountain View Ponds Restoration Preliminary Design Memorandum (URS November 2014) can be found at http://www.southbayrestoration.org/planning/phase2.
Attachment 2 – Project Justification Project 7 – Mountain View Shoreline Portion of SBSPR Project
Bay Area Regional Climate Change Preparedness Program Att. 2-112 2015 IRWM Implementation Grant Application
G. References Cited
The City of Mountain View’s Shoreline Regional Park Community: Sea Level Rise Study Feasibility Report and Capital Improvement Program (ESA-PWA December 2012) can be found at www.esassoc.com/projects/mountain-view-shoreline-sea-level-rise-study.
Alviso-Mountain View Ponds Restoration Preliminary Design Memorandum (URS November 2014) can be found at http://www.southbayrestoration.org/planning/phase2.
South Bay Salt Pond Restoration Project Final Environmental Impact Statement/Report (EDAW December 2007) can be found at http://www.southbayrestoration.org/EIR. Impacts of all alternatives, including No Action Alternative A, are summarized in Table ES-1 of the Executive Summary p. ES-23-31. Pond acres are listed in Table 1-2, p. 1-17.
Historical information on tidal marshes and salt pond creation is from Grossing, R. M & Askevold, R. A., 2005, Baylands and Creeks of South San Francisco Bay: Oakland Museum of California, Oakland CA.
Section 5 Potential Adverse Physical Effects analysis is based on South Bay Salt Pond Restoration Project, Phase 2 Draft Environmental Impact Statement/Report (AECOM July 2015) which will be available on line after July 24,
2015 at www.southbayrestoration.org/planning/phase2. U.S. Fish and Wildlife Service. 2013. Recovery Plan for Tidal Marsh Ecosystems of Northern and Central California.
Sacramento, California. Xviii + 605 p. California Department of Fish and Game. 2005. California Wildlife: Conservation Challenges – California’s Wildlife
Action Plan. Sacramento, California. Goals Project. 1999. Baylands Ecosystem Habitat Goals. A report of habitat recommendations prepared by the San
Francisco Bay Area Wetland Ecosystem Goals Project. First Reprint. U.S. Environmental Protection Agency, San Francisco, Calif./S.F. Bay Regional Water Quality Control Board, Oakland Calif.
Goals Project. 2000. Baylands Ecosystem Species and Community Profiles: Life histories and environmental requirements of key plants, fish and wildlife. Prepared by the San Francisco Bay Area Wetland Ecosystem Goals Project. P.R. Olofson, editor. S.F. Bay Regional Water Quality Control Board, Oakland Calif.
Goals Project. Baylands Ecosystem Habitat Goals Science Update (in draft, 2015) Pacific Institute. 2009. The Impacts of Sea-Level Rise on the California Coast. Prepared for the California Climate
Change Center. Conathan, Buchanan, and Polefka. 2014. The Economic Case For Restoring Coastal Ecosystems. The Center for
American Progress and OxFam America. National Research Council. Sea-Level Rise for the Coasts of California, Oregon, and Washington: Past, Present, and
Future. Washington, DC: The National Academies Press, 2012. Philip Williams & Associates, Ltd., and P. M. Faber (2004). Design Guidelines for Tidal Wetland Restoration in San
Francisco Bay. The Bay Institute and California State Coastal Conservancy, Oakland, CA. 83 p. Shepard CC, Crain CM, Beck MW (2011) The Protective Role of Coastal Marshes: A Systematic Review and Meta-
analysis. PLoS ONE 6(11): e27374. doi:10.1371/journal.pone.0027374 ESA PWA. 2013. Analysis of the Costs and Benefits of Using Tidal Marsh Restoration as a Sea Level Rise Adaptation
Strategy in San Francisco Bay. Prepared for the Bay Institute. Cheong, Silliman, Wong, van Wesenbeeck, Kim, and Guannel. 2013. Coastal Adaptation with Ecological
Engineering. Nature Climate Change. Published Online: 28 August 2013 | Doi: 10.1038/Nclimate1854. Arkema, Guannel, Verutes, Wood, Guerry, Ruckelshaus, Kareiva, Lacayo and Silver. 2013. Coastal Habitats Shield
People and Property from Sea-level Rise and Storms. Nature Climate Change. Published Online: 14 July 2013 | Doi: 10.1038/Nclimate1944.
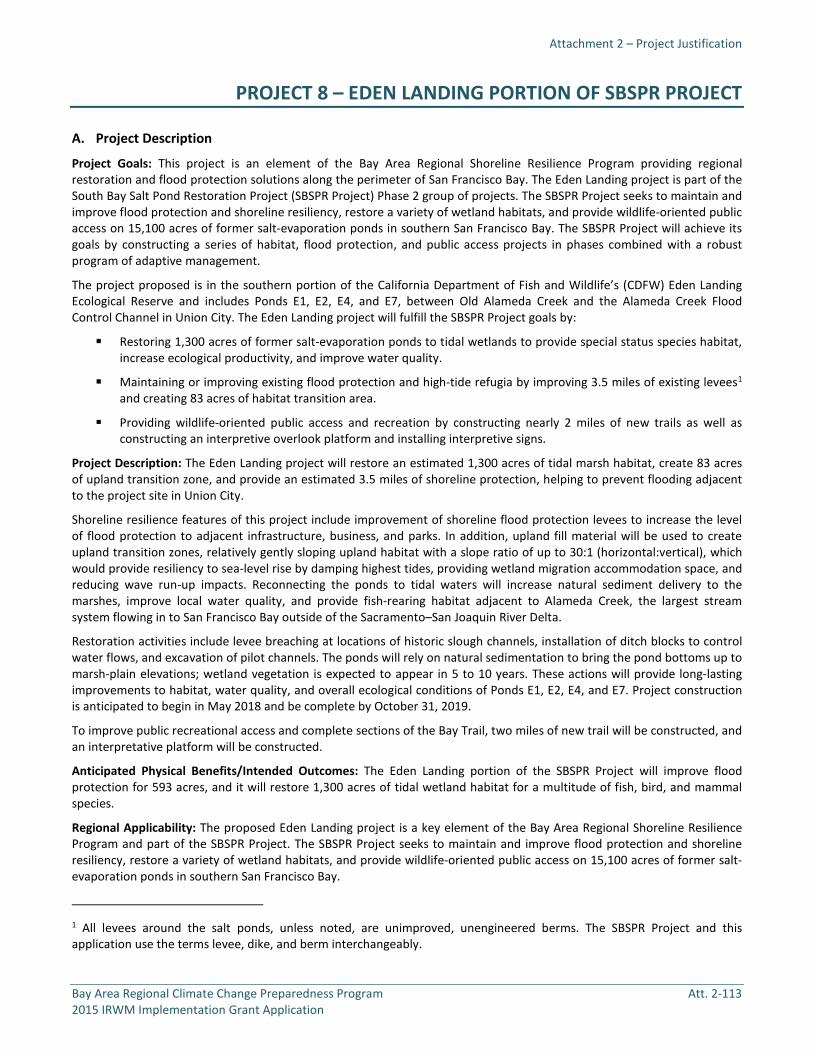
Attachment 2 – Project Justification
Bay Area Regional Climate Change Preparedness Program Att. 2-113 2015 IRWM Implementation Grant Application
PROJECT 8 – EDEN LANDING PORTION OF SBSPR PROJECT
A. Project Description
Project Goals: This project is an element of the Bay Area Regional Shoreline Resilience Program providing regional restoration and flood protection solutions along the perimeter of San Francisco Bay. The Eden Landing project is part of the South Bay Salt Pond Restoration Project (SBSPR Project) Phase 2 group of projects. The SBSPR Project seeks to maintain and improve flood protection and shoreline resiliency, restore a variety of wetland habitats, and provide wildlife-oriented public access on 15,100 acres of former salt-evaporation ponds in southern San Francisco Bay. The SBSPR Project will achieve its goals by constructing a series of habitat, flood protection, and public access projects in phases combined with a robust program of adaptive management.
The project proposed is in the southern portion of the California Department of Fish and Wildlife’s (CDFW) Eden Landing Ecological Reserve and includes Ponds E1, E2, E4, and E7, between Old Alameda Creek and the Alameda Creek Flood Control Channel in Union City. The Eden Landing project will fulfill the SBSPR Project goals by:
Restoring 1,300 acres of former salt-evaporation ponds to tidal wetlands to provide special status species habitat, increase ecological productivity, and improve water quality.
Maintaining or improving existing flood protection and high-tide refugia by improving 3.5 miles of existing levees1 and creating 83 acres of habitat transition area.
Providing wildlife-oriented public access and recreation by constructing nearly 2 miles of new trails as well as constructing an interpretive overlook platform and installing interpretive signs.
Project Description: The Eden Landing project will restore an estimated 1,300 acres of tidal marsh habitat, create 83 acres of upland transition zone, and provide an estimated 3.5 miles of shoreline protection, helping to prevent flooding adjacent to the project site in Union City.
Shoreline resilience features of this project include improvement of shoreline flood protection levees to increase the level of flood protection to adjacent infrastructure, business, and parks. In addition, upland fill material will be used to create upland transition zones, relatively gently sloping upland habitat with a slope ratio of up to 30:1 (horizontal:vertical), which would provide resiliency to sea-level rise by damping highest tides, providing wetland migration accommodation space, and reducing wave run-up impacts. Reconnecting the ponds to tidal waters will increase natural sediment delivery to the marshes, improve local water quality, and provide fish-rearing habitat adjacent to Alameda Creek, the largest stream system flowing in to San Francisco Bay outside of the Sacramento–San Joaquin River Delta.
Restoration activities include levee breaching at locations of historic slough channels, installation of ditch blocks to control water flows, and excavation of pilot channels. The ponds will rely on natural sedimentation to bring the pond bottoms up to marsh-plain elevations; wetland vegetation is expected to appear in 5 to 10 years. These actions will provide long-lasting improvements to habitat, water quality, and overall ecological conditions of Ponds E1, E2, E4, and E7. Project construction is anticipated to begin in May 2018 and be complete by October 31, 2019.
To improve public recreational access and complete sections of the Bay Trail, two miles of new trail will be constructed, and an interpretative platform will be constructed.
Anticipated Physical Benefits/Intended Outcomes: The Eden Landing portion of the SBSPR Project will improve flood protection for 593 acres, and it will restore 1,300 acres of tidal wetland habitat for a multitude of fish, bird, and mammal species.
Regional Applicability: The proposed Eden Landing project is a key element of the Bay Area Regional Shoreline Resilience Program and part of the SBSPR Project. The SBSPR Project seeks to maintain and improve flood protection and shoreline resiliency, restore a variety of wetland habitats, and provide wildlife-oriented public access on 15,100 acres of former salt-evaporation ponds in southern San Francisco Bay.
1 All levees around the salt ponds, unless noted, are unimproved, unengineered berms. The SBSPR Project and this application use the terms levee, dike, and berm interchangeably.

Attachment 2 – Project Justification Project 8 – Eden Landing Portion of SBSPR Project
Bay Area Regional Climate Change Preparedness Program Att. 2-114 2015 IRWM Implementation Grant Application
B. Project Map
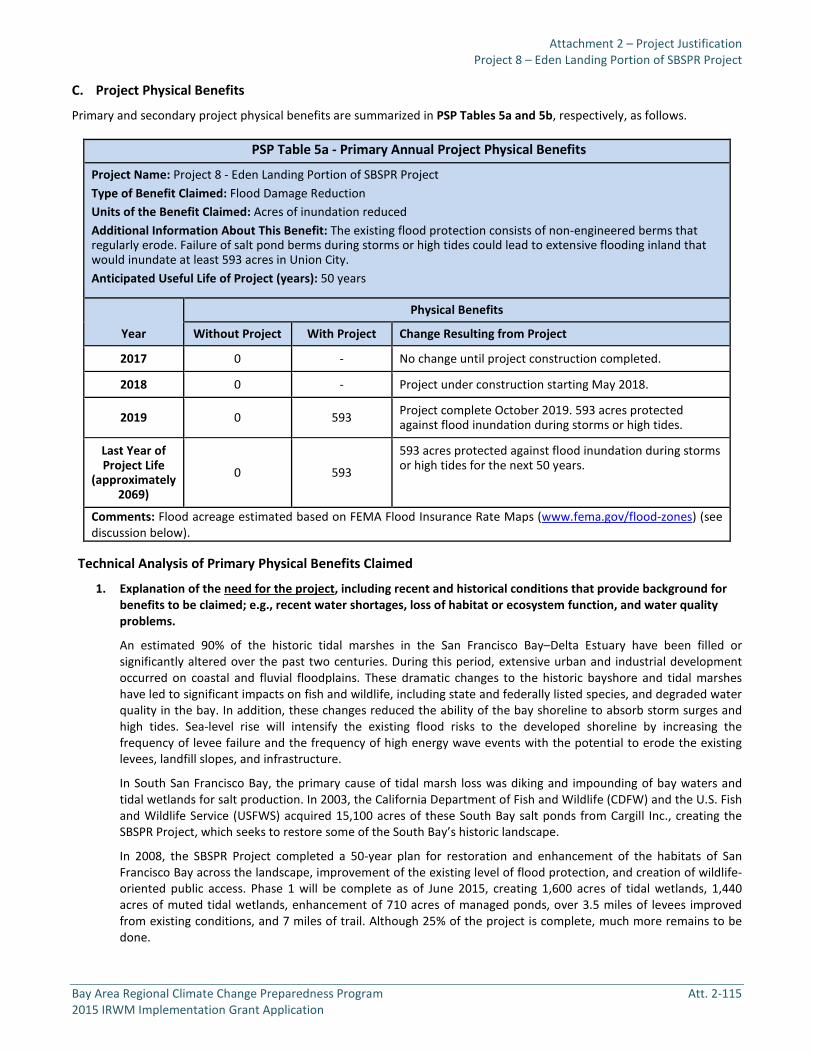
Attachment 2 – Project Justification Project 8 – Eden Landing Portion of SBSPR Project
Bay Area Regional Climate Change Preparedness Program Att. 2-115 2015 IRWM Implementation Grant Application
C. Project Physical Benefits
Primary and secondary project physical benefits are summarized in PSP Tables 5a and 5b, respectively, as follows.
Technical Analysis of Primary Physical Benefits Claimed
1. Explanation of the need for the project, including recent and historical conditions that provide background for benefits to be claimed; e.g., recent water shortages, loss of habitat or ecosystem function, and water quality problems.
An estimated 90% of the historic tidal marshes in the San Francisco Bay–Delta Estuary have been filled or significantly altered over the past two centuries. During this period, extensive urban and industrial development occurred on coastal and fluvial floodplains. These dramatic changes to the historic bayshore and tidal marshes have led to significant impacts on fish and wildlife, including state and federally listed species, and degraded water quality in the bay. In addition, these changes reduced the ability of the bay shoreline to absorb storm surges and high tides. Sea-level rise will intensify the existing flood risks to the developed shoreline by increasing the frequency of levee failure and the frequency of high energy wave events with the potential to erode the existing levees, landfill slopes, and infrastructure.
In South San Francisco Bay, the primary cause of tidal marsh loss was diking and impounding of bay waters and tidal wetlands for salt production. In 2003, the California Department of Fish and Wildlife (CDFW) and the U.S. Fish and Wildlife Service (USFWS) acquired 15,100 acres of these South Bay salt ponds from Cargill Inc., creating the SBSPR Project, which seeks to restore some of the South Bay’s historic landscape.
In 2008, the SBSPR Project completed a 50-year plan for restoration and enhancement of the habitats of San Francisco Bay across the landscape, improvement of the existing level of flood protection, and creation of wildlife-oriented public access. Phase 1 will be complete as of June 2015, creating 1,600 acres of tidal wetlands, 1,440 acres of muted tidal wetlands, enhancement of 710 acres of managed ponds, over 3.5 miles of levees improved from existing conditions, and 7 miles of trail. Although 25% of the project is complete, much more remains to be done.
PSP Table 5a - Primary Annual Project Physical Benefits
Project Name: Project 8 - Eden Landing Portion of SBSPR Project Type of Benefit Claimed: Flood Damage Reduction Units of the Benefit Claimed: Acres of inundation reduced Additional Information About This Benefit: The existing flood protection consists of non-engineered berms that regularly erode. Failure of salt pond berms during storms or high tides could lead to extensive flooding inland that would inundate at least 593 acres in Union City. Anticipated Useful Life of Project (years): 50 years
Year
Physical Benefits
Without Project With Project Change Resulting from Project
2017 0 - No change until project construction completed.
2018 0 - Project under construction starting May 2018.
2019 0 593 Project complete October 2019. 593 acres protected against flood inundation during storms or high tides.
Last Year of Project Life
(approximately 2069)
0 593
593 acres protected against flood inundation during storms or high tides for the next 50 years.
Comments: Flood acreage estimated based on FEMA Flood Insurance Rate Maps (www.fema.gov/flood-zones) (see discussion below).

Attachment 2 – Project Justification Project 8 – Eden Landing Portion of SBSPR Project
Bay Area Regional Climate Change Preparedness Program Att. 2-116 2015 IRWM Implementation Grant Application
South Bay Salt Pond Restoration Project Map
In June of 2014, the SBSPR Project released a preliminary alternatives analysis report describing the next phase of restoration, flood protection, and recreation elements in the Eden Landing Pond Complex. In addition to the habitat enhancement described in the Secondary Benefits section below, these SBSPR Project Phase 2 enhancements will help address some of the shoreline vulnerabilities of the adjacent East Bay communities. This proposal is focused on the bayward portion of the proposed SBSPR Project Phase 2 project at the Eden Landing Ecological Reserve.
The historic salt pond levees that protect the South Bay shoreline are non-engineered berms that are aging, are subject to potential failures, and have little-to-no ability to provide protection against sea-level rise. Given the present day flood risk, the salt pond levees cannot be breached for tidal wetland restoration, as that would increase the existing risk even more. While the existing system of salt pond dikes does provide some level of flood protection, at the same time, it precludes the restoration of these ponds to tidal wetlands. This project will address both of these problems. The flood risk will be addressed by improving existing inadequate berms and actually utilizing the restored wetlands as a source of storage and detention to mitigate high water levels adjacent to homes and businesses. When completed, the first phase of this effort should protect 593 acres in the Hayward and Union City area.
2. Explanation of estimates of the without-project conditions (i.e., the levels of the physical benefits in the future, without the project, but with other planned projects).
The salt pond levees are currently maintained to protect and provide wildlife values inside the ponds. Originally created to hold bay water for solar evaporation, the salt pond levees are not engineered levees and were never
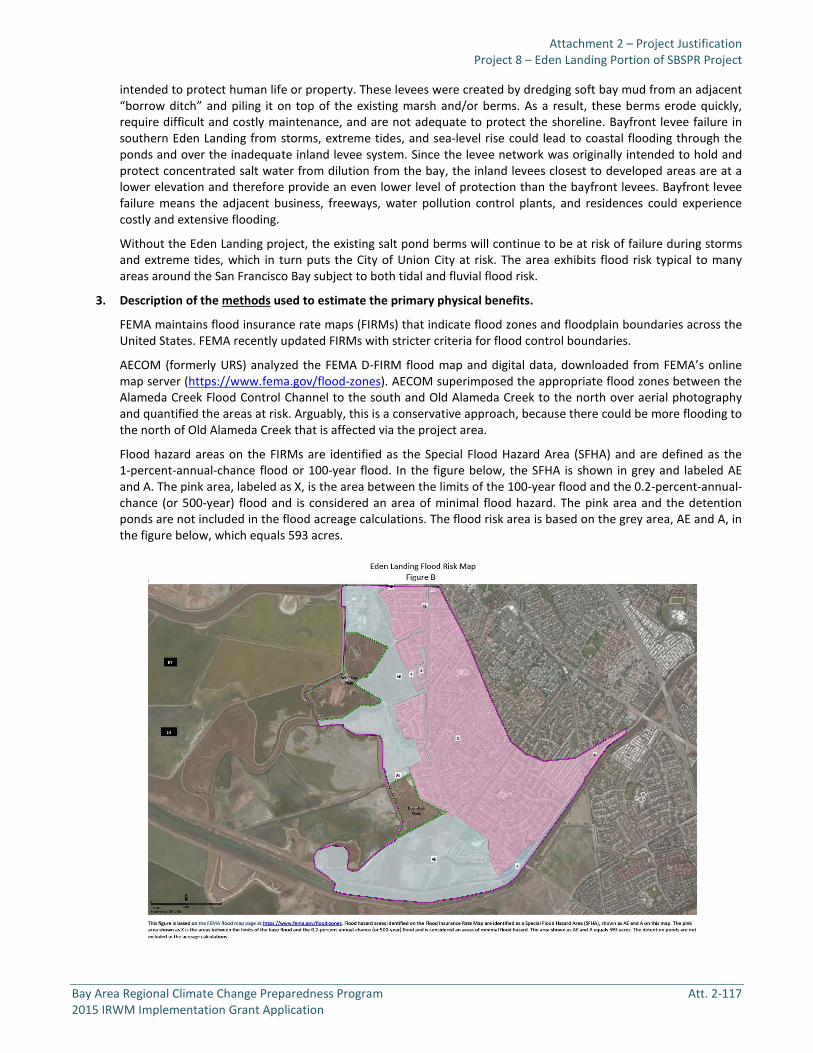
Attachment 2 – Project Justification Project 8 – Eden Landing Portion of SBSPR Project
Bay Area Regional Climate Change Preparedness Program Att. 2-117 2015 IRWM Implementation Grant Application
intended to protect human life or property. These levees were created by dredging soft bay mud from an adjacent “borrow ditch” and piling it on top of the existing marsh and/or berms. As a result, these berms erode quickly, require difficult and costly maintenance, and are not adequate to protect the shoreline. Bayfront levee failure in southern Eden Landing from storms, extreme tides, and sea-level rise could lead to coastal flooding through the ponds and over the inadequate inland levee system. Since the levee network was originally intended to hold and protect concentrated salt water from dilution from the bay, the inland levees closest to developed areas are at a lower elevation and therefore provide an even lower level of protection than the bayfront levees. Bayfront levee failure means the adjacent business, freeways, water pollution control plants, and residences could experience costly and extensive flooding.
Without the Eden Landing project, the existing salt pond berms will continue to be at risk of failure during storms and extreme tides, which in turn puts the City of Union City at risk. The area exhibits flood risk typical to many areas around the San Francisco Bay subject to both tidal and fluvial flood risk.
3. Description of the methods used to estimate the primary physical benefits.
FEMA maintains flood insurance rate maps (FIRMs) that indicate flood zones and floodplain boundaries across the United States. FEMA recently updated FIRMs with stricter criteria for flood control boundaries.
AECOM (formerly URS) analyzed the FEMA D-FIRM flood map and digital data, downloaded from FEMA’s online map server (https://www.fema.gov/flood-zones). AECOM superimposed the appropriate flood zones between the Alameda Creek Flood Control Channel to the south and Old Alameda Creek to the north over aerial photography and quantified the areas at risk. Arguably, this is a conservative approach, because there could be more flooding to the north of Old Alameda Creek that is affected via the project area.
Flood hazard areas on the FIRMs are identified as the Special Flood Hazard Area (SFHA) and are defined as the 1-percent-annual-chance flood or 100-year flood. In the figure below, the SFHA is shown in grey and labeled AE and A. The pink area, labeled as X, is the area between the limits of the 100-year flood and the 0.2-percent-annual-chance (or 500-year) flood and is considered an area of minimal flood hazard. The pink area and the detention ponds are not included in the flood acreage calculations. The flood risk area is based on the grey area, AE and A, in the figure below, which equals 593 acres.

Attachment 2 – Project Justification Project 8 – Eden Landing Portion of SBSPR Project
Bay Area Regional Climate Change Preparedness Program Att. 2-118 2015 IRWM Implementation Grant Application
4. Identification/description of all new facilities, policies, and actions required to obtain the physical benefits, e.g., any City policies or procedures that need to be established in order for the benefits to be realized.
The actions and structures required to increase shoreline resiliency include:
1) Levee Improvements: Primary coastal flood risk protection can be provided by standard approaches, such as constructing engineered levee improvements and/or a flood wall on the backside of the complex between the developed areas and the ponds. A new approach provides coastal flood risk protection by improving 2.06 miles of the existing levee along the existing outboard levees of Ponds E1 and E2. The levee would be raised and improved sufficiently to preclude catastrophic failures that sometimes occur on traditional, narrow levee features and would also include a broad slope that provides habitat elements such as a habitat transition zone. This improved levee will function similarly to a barrier island. The bayside levee protects against erosion and storm surge but tidal flows would still be able to enter through the creek channel and tidal wetlands will be able to develop on the interior side. This design decreases coastal flooding flood risk because there is a large storage capacity in the ponds and tidal wetlands slow tidal flow. Directing tidal flows to enter from the “side” along creek channels dampens high flood tides and protects the developed shoreline.
2) Construction of Mid-Complex Levee with Habitat Transition Zone: To provide additional protection, another habitat transition zone will be constructed along 1.5 miles of the eastern border of Ponds E7 and E4 to absorb storm run-up and high tides and provide additional areas for marsh migration with sea-level rise. This “mid-complex transition zone” would be built on top of the existing internal berms and levees of these ponds. The habitat values of this feature are described under Secondary Benefits.
3) Public Access Improvements: This feature is described under Secondary Benefits.
5. Description of potential adverse physical effects and what is being done to mitigate those impacts.
Some of the potential adverse effects to the environment come from the construction or implementation phase of the project, and others come from the ongoing operation or maintenance phase of the project. For the SBSPR Project’s Phase 2 alternatives at Eden Landing, almost all of the impacts in the various resource categories are expected to be less than significant or absent (i.e., a “No Impact” determination). Many others are likely to be beneficial, which is a category only recognized under NEPA. These expectations are based on the programmatic EIS/EIR for the SBSPR Project as a whole, the Phase 1 EIS/EIR for ponds at both the CDFW-managed Eden Landing Ecological Reserve, and in the USFWS-managed Don Edwards National Wildlife Refuge, as well as in the draft EIS/EIR for SBSPR Project Phase 2 actions at the Don Edwards National Wildlife Refuge. The same types of designs, implementation plans, management and operations practices, monitoring, and adaptive management techniques used in those instances will be applied to the SBSPR Project Phase 2 actions at Eden Landing. The discussion below highlights these analyses and expectations about the possibilities of adverse impacts.
In general, the greatest potential for adverse effects from the SBSPR Project from construction activities has to do with earthmoving and importing of fill material. Earthmoving activities include levee breaches, levee lowering or removal, levee elevation increases or other improvements, and construction of habitat islands and habitat transition zones. For all of these activities, large construction equipment will be used, and there is the potential for adverse impacts related to air quality, water quality, noise, traffic, recreation, and other resources.
However, by following strict best management practices and other protocols for the timing, staging, and implementation of the construction activities, these impacts will largely be avoided completely or reduced to less than significant levels. For example, the large quantities of fill material needed to construct transition zones and islands and to raise or improve levees will be imported from offsite excavation projects. By restricting the hours of delivery to off-peak (i.e., non-commute) hours, traffic impacts are largely avoided. Proven construction best management practices will be used to prevent leaks or spills and thus protect water quality. These same practices also minimize air pollutant emissions, which were found to be below those that would violate any air quality standards. There are no sensitive receptors for noise, air quality, or odors near enough to the project area to be affected.
The various forms of earthwork could also affect wildlife on the levees or in the surrounding waters, but preconstruction surveys, exclusion fencing, seasonal avoidance of special-status species, and construction monitoring would all be used to reduce these impacts to levels that are less than significant. The specifics of all

Attachment 2 – Project Justification Project 8 – Eden Landing Portion of SBSPR Project
Bay Area Regional Climate Change Preparedness Program Att. 2-119 2015 IRWM Implementation Grant Application
these measures will be developed during the permitting processes with the various regulatory agencies. Part of the consideration of these possible impacts is the understanding that, while some temporary disturbance is necessary, the degree to which habitats would be restored and enhanced is greater by several orders of magnitude than the degree to which habitat would be temporarily affected.
The SBSPR Project alternatives are also located, planned, and designed so that the project would not violate any land use policies or change the demand or requirements for public services, utilities, roads, or parking. The reasoning behind these conclusions is that the project would mostly be changing one form of open space (former salt-production ponds) to another (tidal marshes and/or enhanced managed ponds), which would occur on public lands (a portion of the Eden Landing Ecological Reserve) owned and managed by the CDFW.
There could be temporary adverse impacts to recreational use of portions of the existing trail network in and around Eden Landing that are operated by the East Bay Regional Park District. Depending on the alternatives selected, certain trails and parking areas may be closed during material import and active placement into the ponds, onto the levees, or for other construction issues. This is unavoidable because of the safety risks of having hikers or bicyclists moving through a construction area. However, the increase in trail miles and number of viewing areas would lead to a long-term increase in the amount and quality of public access and recreation in the area.
6. Description of whether the proposed project effectively addresses long-term drought preparedness goals.
The primary project benefit of reduced flood inundation does not address long-term drought preparedness goals.
References Cited for Primary Project Benefit
Flood acreage estimated based on FEMA Flood Insurance Rate Maps for the Eden Landing area. Maps can be found at www.fema.gov/flood-zones.
South Bay Salt Pond Restoration Project: Eden Landing Preliminary Alternatives Analysis Report (URS June 2014) can be found at http://www.southbayrestoration.org/planning/phase2.
South Bay Salt Pond Restoration Project Final Environmental Impact Statement/Report (EDAW December 2007) can be found at http://www.southbayrestoration.org/EIR. Impacts of all alternatives, including No Action Alternative A, are summarized in Table ES-1 of the Executive Summary p. ES-23-31. Pond acreages are listed in Table 1-2, p. 1-17.
Pacific Institute. 2009. The Impacts of Sea-Level Rise on the California Coast. Prepared for the California Climate Change Center.
Conathan, Buchanan, and Polefka. 2014. The Economic Case For Restoring Coastal Ecosystems. The Center for American Progress and OxFam America.
National Research Council. 2012. Sea-Level Rise for the Coasts of California, Oregon, and Washington: Past, Present, and Future. Washington, DC: The National Academies Press.
Philip Williams & Associates, Ltd., and P. M. Faber. 2004. Design Guidelines for Tidal Wetland Restoration in San Francisco Bay. The Bay Institute and California State Coastal Conservancy, Oakland, CA. 83 p.
Shepard CC, Crain CM, Beck MW. 2011. The Protective Role of Coastal Marshes: A Systematic Review and Meta-analysis. PLoS ONE 6(11): e27374. doi:10.1371/journal.pone.0027374.
ESA PWA. 2013. Analysis of the Costs and Benefits of Using Tidal Marsh Restoration as a Sea Level Rise Adaptation Strategy in San Francisco Bay. Prepared for the Bay Institute.
Cheong, Silliman, Wong, van Wesenbeeck, Kim, and Guannel. 2013. Coastal Adaptation with Ecological Engineering. Nature Climate Change. Published Online: 28 August 2013 | Doi: 10.1038/Nclimate1854.
Arkema, Guannel, Verutes, Wood, Guerry, Ruckelshaus, Kareiva, Lacayo, and Silver. 2013. Coastal Habitats Shield People and Property from Sea-level Rise and Storms. Nature Climate Change. Published Online: 14 July 2013 | Doi: 10.1038/Nclimate1944.
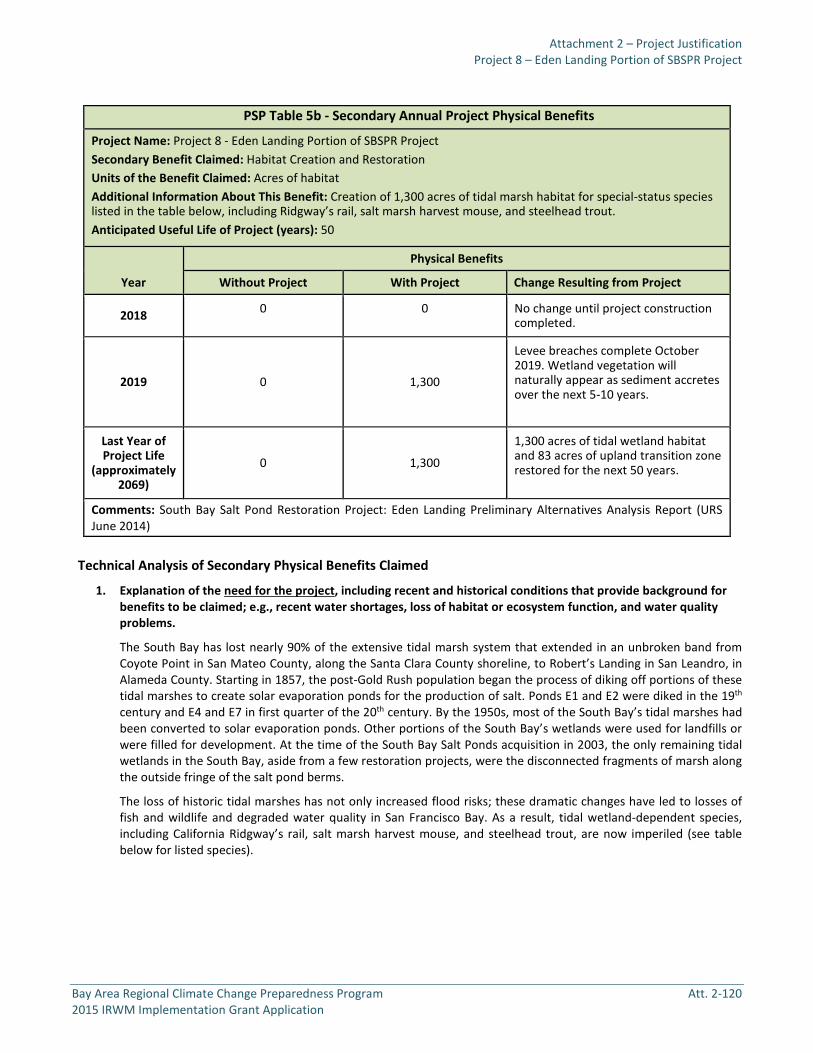
Attachment 2 – Project Justification Project 8 – Eden Landing Portion of SBSPR Project
Bay Area Regional Climate Change Preparedness Program Att. 2-120 2015 IRWM Implementation Grant Application
Technical Analysis of Secondary Physical Benefits Claimed
1. Explanation of the need for the project, including recent and historical conditions that provide background for benefits to be claimed; e.g., recent water shortages, loss of habitat or ecosystem function, and water quality problems.
The South Bay has lost nearly 90% of the extensive tidal marsh system that extended in an unbroken band from Coyote Point in San Mateo County, along the Santa Clara County shoreline, to Robert’s Landing in San Leandro, in Alameda County. Starting in 1857, the post-Gold Rush population began the process of diking off portions of these tidal marshes to create solar evaporation ponds for the production of salt. Ponds E1 and E2 were diked in the 19th century and E4 and E7 in first quarter of the 20th century. By the 1950s, most of the South Bay’s tidal marshes had been converted to solar evaporation ponds. Other portions of the South Bay’s wetlands were used for landfills or were filled for development. At the time of the South Bay Salt Ponds acquisition in 2003, the only remaining tidal wetlands in the South Bay, aside from a few restoration projects, were the disconnected fragments of marsh along the outside fringe of the salt pond berms.
The loss of historic tidal marshes has not only increased flood risks; these dramatic changes have led to losses of fish and wildlife and degraded water quality in San Francisco Bay. As a result, tidal wetland-dependent species, including California Ridgway’s rail, salt marsh harvest mouse, and steelhead trout, are now imperiled (see table below for listed species).
PSP Table 5b - Secondary Annual Project Physical Benefits
Project Name: Project 8 - Eden Landing Portion of SBSPR Project Secondary Benefit Claimed: Habitat Creation and Restoration Units of the Benefit Claimed: Acres of habitat Additional Information About This Benefit: Creation of 1,300 acres of tidal marsh habitat for special-status species listed in the table below, including Ridgway’s rail, salt marsh harvest mouse, and steelhead trout. Anticipated Useful Life of Project (years): 50
Year
Physical Benefits
Without Project With Project Change Resulting from Project
2018 0 0 No change until project construction completed.
2019 0 1,300
Levee breaches complete October 2019. Wetland vegetation will naturally appear as sediment accretes over the next 5-10 years.
Last Year of Project Life
(approximately 2069)
0 1,300
1,300 acres of tidal wetland habitat and 83 acres of upland transition zone restored for the next 50 years.
Comments: South Bay Salt Pond Restoration Project: Eden Landing Preliminary Alternatives Analysis Report (URS June 2014)

Attachment 2 – Project Justification Project 8 – Eden Landing Portion of SBSPR Project
Bay Area Regional Climate Change Preparedness Program Att. 2-121 2015 IRWM Implementation Grant Application
State and Federal Listed Species in the SBSPR Project Area Species Name Federal Ranking State Ranking Fish Northern California Steelhead Trout (Oncorhynchus mykiss irideus) FT ST Longfin Smelt (Spirinchus thaleichthys) Candidate ST Green Sturgeon (Acipenser medirostris) (Southern Distinct Population Segment) FT -- Chinook Salmon (O. tshawytscha) -- SC Birds California Ridgway’s Rail (Rallus obsoletus) FE SE California Least Tern (Sternula antillarum browni) FE SE California Black Rail (Laterallus jamaicensis coturniculus) SC ST San Francisco Common Yellowthroat (Geothlypis trichas sinuosa) -- SC Northern Harrier (Circus cyaneus) -- SC Bryant’s Savannah Sparrow (Passerculus sandwichensis alaudinus) -- SC Alameda Song Sparrow (Melospiza melodia pusillula) -- SC Mammals Salt Marsh Harvest Mouse (Reithrodontomys raviventris) FE SE
Ranking Key: FE = Federally Endangered FT = Federally Threatened
SE = State Endangered ST = State Threatened
SC = Species of Concern -- = Not Listed
Source: Species table complied by SCC staff and reviewed by biological consulting firm, HT Harvey & Associates.
2. Explanation of estimates of the without-project conditions.
In 2008, the SBSPR Project completed a 50-year plan for restoration and enhancement of the habitats of San Francisco Bay across the landscape, improvement of flood protection, and creation of wildlife-oriented public access in South Bay Salt Pond Restoration Project Final Environmental Impact Statement/Report (EDAW December 2007). The project is to be implemented in multiple phases through an adaptive management framework.
The existing conditions or No Action analysis in this report indicated significant adverse impacts to the environment without restoration or habitat enhancement of the salt ponds. Over time, the unintended breaches of the ponds will increase due to erosion and the unstable nature of non-engineered berms. This will cause the flooding impacts described above and will also have negative impacts on habitat. Unplanned breaches do not optimize sediment accumulation, and undirected flows can create vector problems by allowing water to pond and not adequately drain, encouraging mosquito growth. Furthermore, the SBSPR Project intent is to carefully consider the habitat needs of the entire project area with each restoration action in each phase. Unintended breaches may create wetland habitat in the wrong pond (e.g., in a pond more appropriately set aside for snowy plovers, which like dry conditions). More specifically to the proposed project area, an unintended breach of Pond E2 could flood habitat to be set aside for non-tidal marsh species.
The proposed Eden Landing project is the result of a five-year planning process undertaken by the SBSPR Project to identify numerous Phase 2 projects. The carefully-planned mix of habitats has been reviewed by the SBSPR Project’s management team, science team, and stakeholders forum as well as the general public, and there is a general consensus that this suite of projects meets the SBSPR Project’s goals and is consistent with the adaptive management approach central to the SBSPR Project. The inability to create 1,300 acres of tidal wetland and 83 acres of upland transition habitat will be a setback for the SBSPR Project and may trigger re-evaluation of all the projects proposed in Phase 2 of the SBSPR Project.
In addition, the attempt by the SBSPR Project to create sufficient habitat to aid in the recovery of endangered and threatened tidal marsh species will suffer if the Eden Landing E1, E2, E4, and E7 ponds are not restored. These ponds are a key link in the continuous band of salt marsh habitat that the SBSPR Project is trying to recreate in the South Bay to facilitate wildlife movement between marsh complexes.

Attachment 2 – Project Justification Project 8 – Eden Landing Portion of SBSPR Project
Bay Area Regional Climate Change Preparedness Program Att. 2-122 2015 IRWM Implementation Grant Application
3. Description of the methods used to estimate the secondary physical benefits.
The estimated habitat benefits were calculated using the pond acreages as a measure for the amount of wetland created. Pond acreages were calculated for the South Bay Salt Pond Restoration Project Final Environmental Impact Statement/Report (EDAW December 2007, Table 1-2, p. 1-17). Ponds E1, E2, E4, and E7 total 1,400 acres (see individual pond acreage indicated above on the Project Map). However, the amount of tidal wetlands to be restored has been adjusted by subtracting the estimated amount of fill placed in the ponds to create upland transition zone. The 83 total acres of fill (60 and 23 acres for the two upland transition areas) were calculated assuming a 30:1 slope out from the crest of the levee by the consultant firm that prepared the alternatives analysis (formerly URS, now AECOM) using GIS. Subtracting the upland transition zone from the total pond acres leaves 1,317 of new tidal wetlands. This application rounds the total tidal marsh created to 1,300.
Once the former salt pond berms are breached, based on the trajectory of past restoration projects in San Francisco Bay and of SBSPR Project Phase I projects, natural sediment accretion from tidal action is expected to raise the marsh plain, and vegetation will naturally colonize within 5–10 years. Once at marsh elevation, tidal flushing will create and maintain tidal channels and circulation. The creation of upland transition areas will provide high-tide refugia that will increase cover and survival during extreme tides and storms for marsh species based on habitat assessments of historic marshes with intact refugia areas.
4. Identification/description of all new facilities, policies, and actions required to obtain the physical benefits, e.g., any City policies or procedures that need to be established in order for the benefits to be realized.
The restoration components proposed for the Eden Landing complex comprise the following actions:
1) Levee Breaches and Pond Earthwork: The project will strategically breach the levees separating the ponds from Old Alameda Creek and from a remnant wetland north of the Alameda Creek Flood Control Project in order to allow bay waters to enter the site. The pilot channels will be created in order to direct sufficient flows into the interior of the ponds to improve habitat quality and connectivity for fish species. Flows will be directed by raising and lowering interior levees and by blocking off flows from the artificial “borrow ditch” channels adjacent to the levees with earthen ditch blocks. These standard components of tidal habitat restoration projects utilize natural processes to ensure proper site development and sustainability while minimizing flood risk, as discussed above.
2) Mid-Complex Levee and Habitat Transition Area: Utilizing either on-site sources, upland fill material from construction projects, or dredge material from channel maintenance projects, over 83 acres of transition habitat will be created adjacent to the bayfront levee improvements (60 acres) and adjacent to the mid-complex levee (23 acres). The bayfront levee transition zone provides high-tide refugia and an area for marsh migration with sea-level rise. The mid-complex habitat transition area provides similar benefits and would allow for staged restoration by providing flood protection to the areas behind it while the bay ponds are breached and restored to tidal marsh. The mid-complex transition area could be inexpensively breached to allow tidal marsh restoration in the inland and/or southern ponds in a future restoration phase, or this feature will remain as-is so that the rest of the ponds in southern Eden Landing can be maintained as enhanced managed ponds. This resilient design increases flood protection and allows future phased restoration implementation.
3) Additional Habitat Enhancements: Islands could be constructed from imported fill, as discussed above, or by reinforcing and leaving portions of existing levees in place and breaching around them. As ponds are subsequently breached and tidal marsh habitat develops, these islands would naturally transition to “marsh mounds,” which would be used as high-tide refugia for California Ridgway’s rail, salt marsh harvest mouse, and other sensitive marsh species.
4) Public access improvements: Two miles of ADA-accessible Bay Trail will be constructed along the eastern edge of the property and interpretive signs installed.
5. Description of potential adverse physical effects and what is being done to mitigate those impacts.
In addition to the potential adverse impacts described above under Primary Benefits, implementation of the Eden Landing project would create other impacts related to the placement of fill to construct habitat transition zones and islands and to provide a wider base for increased levee height. This would involve fill in waters, which would

Attachment 2 – Project Justification Project 8 – Eden Landing Portion of SBSPR Project
Bay Area Regional Climate Change Preparedness Program Att. 2-123 2015 IRWM Implementation Grant Application
normally be an adverse environmental impact to the aquatic ecosystem and its water quality. However, by placing the fill in the ponds prior to breaching, impacts on fish and wildlife will be limited because the currently closed or flow-controlled ponds do not contain large numbers of fish and because birds can relocate to less-disturbed areas.
The transition of habitat from ponds to tidal marshes also has the potential to adversely affect pond-dependent bird species, such as diving ducks and dabbling ducks. However, the project has committed to the ongoing implementation of a thoroughly reviewed and published adaptive management plan (AMP) that is intended to help take into account the responses of the environment to one project phase in planning and designing subsequent phases. Thus, while the expectation is that pond-dependent bird species will gradually relocate to some of the many remaining ponds in the South Bay over the many years it will take for the southern Eden Landing ponds to fill in and vegetate, the AMP will monitor such birds to verify if they are relocating and to respond accordingly if they are not. In that case, future project phases will retain and enhance more managed ponds to offset these impacts.
The AMP will also be used to adjust ongoing management of the SBSPR Project Phase 2 ponds to avoid those adverse impacts that show signs of being greater than initially expected. For example, wildlife behavior will be monitored, and if changes in behavior are observed due to recreation use of trails and viewing areas, the locations or timing of certain trail access or seasons of use can be changed. Similar application of the AMP would be used if water quality is degraded or if scour or erosion occur in places or at rates unintended by the project designs.
In the operations and ongoing maintenance phase of the project, most of the impacts are minimal or even beneficial. In most cases, the level of maintenance previously required for outboard levees would decrease and thus reduce impacts, as compared to the current situation. Breached ponds will slowly accrete sediment and eventually begin to grow marsh vegetation. Wildlife will adapt to the increased human presence on certain portions of trails and viewing areas. The same general types of monitoring and research activities as occur now would continue. In addition, it is expected that current predator and weed management activities would continue, but these activities occur now and, ultimately, are beneficial to the project.
6. Description of whether the proposed project effectively addresses long-term drought preparedness goals.
The secondary project benefit of habitat restoration does not address drought preparedness goals.
References Cited for Secondary Project Benefit South Bay Salt Pond Restoration Project: Eden Landing Preliminary Alternatives Analysis Report (URS June 2014)
can be found at http://www.southbayrestoration.org/planning/phase2.
South Bay Salt Pond Restoration Project Final Environmental Impact Statement/Report (EDAW December 2007) can be found at http://www.southbayrestoration.org/EIR. Impacts of all alternatives, including No Action Alternative A, are summarized in Table ES-1 of the Executive Summary p. ES-23-31. Pond acreages are listed in Table 1-2, p. 1-17.
Historical information on tidal marshes and salt pond creation is from Grossing, R. M & Askevold, R. A., 2005, Baylands and Creeks of South San Francisco Bay: Oakland Museum of California, Oakland CA.
U.S. Fish and Wildlife Service. 2013. Recovery Plan for Tidal Marsh Ecosystems of Northern and Central California. Sacramento, California. Xviii + 605 p.
California Department of Fish and Game. 2005. California Wildlife: Conservation Challenges – California’s Wildlife Action Plan. Sacramento, California.
Goals Project. 1999. Baylands Ecosystem Habitat Goals. A report of habitat recommendations prepared by the San Francisco Bay Area Wetland Ecosystem Goals Project. First Reprint. U.S. Environmental Protection Agency, San Francisco, Calif./S.F. Bay Regional Water Quality Control Board, Oakland Calif.
Goals Project. 2000. Baylands Ecosystem Species and Community Profiles: Life histories and environmental requirements of key plants, fish and wildlife. Prepared by the San Francisco Bay Area Wetland Ecosystem Goals Project. P.R. Olofson, editor. S.F. Bay Regional Water Quality Control Board, Oakland Calif.
Goals Project. Baylands Ecosystem Habitat Goals Science Update (in draft, 2015).

Attachment 2 – Project Justification Project 8 – Eden Landing Portion of SBSPR Project
Bay Area Regional Climate Change Preparedness Program Att. 2-124 2015 IRWM Implementation Grant Application
D. Direct Water-Related Benefit to a DAC
There are several Disadvantaged Community (DAC) block groups in the vicinity of the project site, including a block group of 1,425 residents (ID 060014403312), as presented in DWR’s DAC Mapping Tool.
The Eden Landing project will provide direct flood damage reduction benefits to residential homes and commercial businesses within 593 acres. However, less than 25% of the area served by this project meets the definition of a DAC.
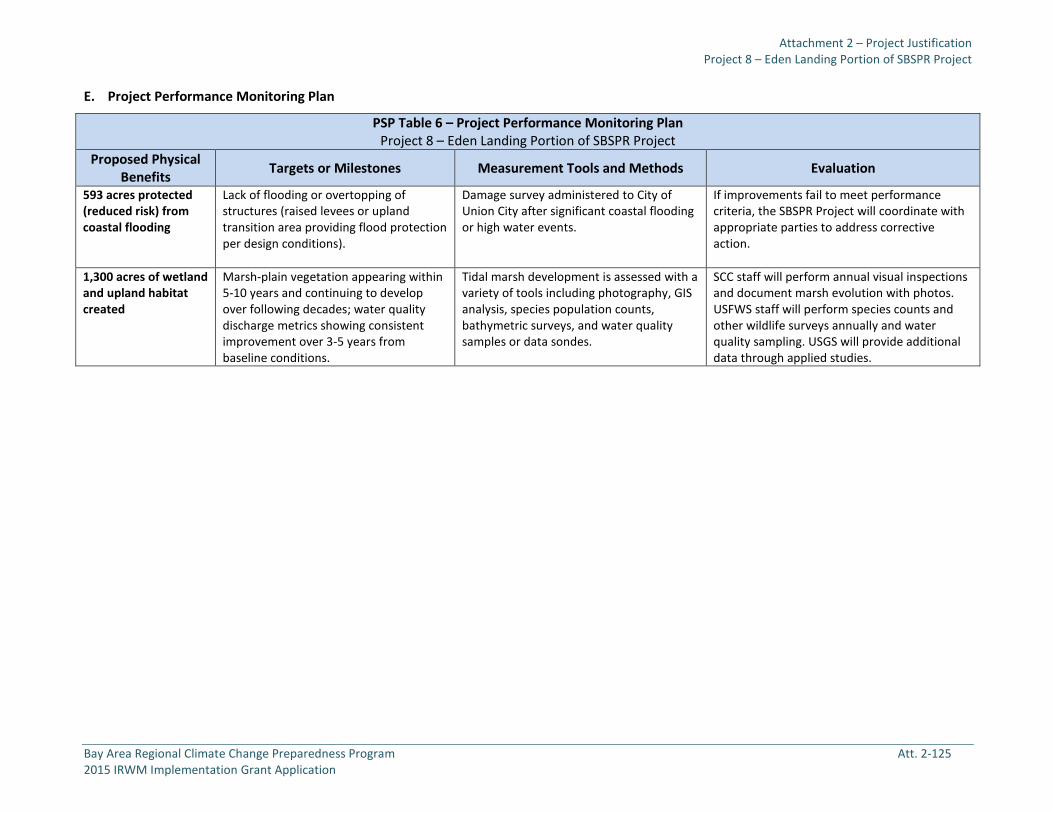
Attachment 2 – Project Justification Project 8 – Eden Landing Portion of SBSPR Project
Bay Area Regional Climate Change Preparedness Program Att. 2-125 2015 IRWM Implementation Grant Application
E. Project Performance Monitoring Plan
PSP Table 6 – Project Performance Monitoring Plan Project 8 – Eden Landing Portion of SBSPR Project
Proposed Physical Benefits Targets or Milestones Measurement Tools and Methods Evaluation
593 acres protected (reduced risk) from coastal flooding
Lack of flooding or overtopping of structures (raised levees or upland transition area providing flood protection per design conditions).
Damage survey administered to City of Union City after significant coastal flooding or high water events.
If improvements fail to meet performance criteria, the SBSPR Project will coordinate with appropriate parties to address corrective action.
1,300 acres of wetland and upland habitat created
Marsh-plain vegetation appearing within 5-10 years and continuing to develop over following decades; water quality discharge metrics showing consistent improvement over 3-5 years from baseline conditions.
Tidal marsh development is assessed with a variety of tools including photography, GIS analysis, species population counts, bathymetric surveys, and water quality samples or data sondes.
SCC staff will perform annual visual inspections and document marsh evolution with photos. USFWS staff will perform species counts and other wildlife surveys annually and water quality sampling. USGS will provide additional data through applied studies.

Attachment 2 – Project Justification Project 8 – Eden Landing Portion of SBSPR Project
Bay Area Regional Climate Change Preparedness Program Att. 2-126 2015 IRWM Implementation Grant Application
F. Cost-Effectiveness Analysis
PSP Table 7 evaluates whether the physical benefits provided by the project are provided at the least possible costs.
PSP Table 7 – Cost-Effectiveness Analysis Project name: Project 8 - Eden Landing Portion of SBSPR Project
Question 1 What are the types of benefits provided? Explain in as much detail as possible:
Flood Protection: The existing flood protection consists of non-engineered berms originally created to pond water for salt production. These berms regularly erode. Failure of salt pond berms during storms or high tides could lead to extensive flooding inland that would inundate at least 593 acres in Union City.
Habitat Creation and Restoration: Creation of 1,300 acres of tidal marsh habitat for special status species including Ridgway’s rail, salt marsh harvest mouse, and steelhead trout.
Question 2 Have alternative methods been considered to achieve the same types and amounts of physical benefits as the proposed project been identified? If yes, list the methods (including the proposed project) and estimated costs.
The South Bay Salt Pond Restoration Project went through an extensive, five-year planning process to determine the highest and best value of each set of ponds. Through this process, it was determined that some ponds had greater value if retained and reconfigured as managed habitat, while others were slated for restoration to tidal habitats. The ponds that are part of this proposed action were determined to be best-suited to tidal wetland restoration, as opposed to being used to create “managed pond” habitat, that is, shallow ponded water habitat for migratory shorebirds. In addition, the project has an adaptive management program through which regional and local applied studies are being implemented to inform future design. All of the lessons learned from previous phases of the SBSPR Project are being applied to this project.
As to specific project details, the EIS/EIR for Eden Landing will evaluate a range of alternatives and specific project features and methods. Already, through the alternatives analysis process, several early ideas were discarded as either not cost-effective or not achieving project goals. The physical benefits portrayed in this proposal represent three years of discussion and analysis, including vetting at several public meetings.
Question 3 Is the proposed project the least cost alternative?
The improvements at Eden Landing take advantage of the natural flood protection provided by tidal wetlands. By reinforcing the bayfront levee (which protects the wetlands from erosion) but still allowing tidal waters to enter the site from adjacent creeks and wetlands, the ponds will slow and delay high tides and stormwater. This approach is estimated by the Alameda County Public Works Agency to be less costly than building a large, engineered levee on the inland side of Eden Landing.
In addition, tidal marsh restoration is substantially more cost-effective than a reconfigured managed pond and greatly reduces the amount of long-term site maintenance. The restoration will largely rely on natural processes to establish and sustain the marsh habitat. Managed systems also carry a greater degree of uncertainty, given that they rely on engineered water control structures that must be operated by humans and that have a discrete life span. Tidal wetlands are in a dynamic equilibrium with the bay and, as such, can keep pace with sea-level rise, thus providing a much more resilient shoreline.
Comments: Reference: South Bay Salt Pond Restoration Project: Eden Landing Preliminary Alternatives Analysis Report (URS June 2014). http://www.southbayrestoration.org/planning/phase2.

Attachment 2 – Project Justification Project 8 – Eden Landing Portion of SBSPR Project
Bay Area Regional Climate Change Preparedness Program Att. 2-127 2015 IRWM Implementation Grant Application
G. References
South Bay Salt Pond Restoration Project: Eden Landing Preliminary Alternatives Analysis Report (URS June 2014) can be found at http://www.southbayrestoration.org/planning/phase2.
Flood acreage estimated based on FEMA Flood Insurance Rate Maps for the Eden Landing area. Maps can be found at www.fema.gov/flood-zones.
South Bay Salt Pond Restoration Project Final Environmental Impact Statement/Report (EDAW December 2007) can be found at http://www.southbayrestoration.org/EIR. Impacts of all alternatives, including No Action Alternative A, are summarized in Table ES-1 of the Executive Summary p. ES-23-31. Pond acreages are listed in Table 1-2, p. 1-17.
Historical information on tidal marshes and salt pond creation is from Grossing, R. M & Askevold, R. A., 2005, Baylands and Creeks of South San Francisco Bay: Oakland Museum of California, Oakland CA.
U.S. Fish and Wildlife Service. 2013. Recovery Plan for Tidal Marsh Ecosystems of Northern and Central California. Sacramento, California. Xviii + 605 p.
California Department of Fish and Game. 2005. California Wildlife: Conservation Challenges – California’s Wildlife Action Plan. Sacramento, California.
Goals Project. 1999. Baylands Ecosystem Habitat Goals. A report of habitat recommendations prepared by the San Francisco Bay Area Wetland Ecosystem Goals Project. First Reprint. U.S. Environmental Protection Agency, San Francisco, Calif./S.F. Bay Regional Water Quality Control Board, Oakland Calif.
Goals Project. 2000. Baylands Ecosystem Species and Community Profiles: Life histories and environmental requirements of key plants, fish and wildlife. Prepared by the San Francisco Bay Area Wetland Ecosystem Goals Project. P.R. Olofson, editor. S.F. Bay Regional Water Quality Control Board, Oakland Calif.
Goals Project. Baylands Ecosystem Habitat Goals Science Update (in draft, 2015)
Pacific Institute. 2009. The Impacts of Sea-Level Rise on the California Coast. Prepared for the California Climate Change Center.
Conathan, Buchanan, and Polefka. 2014. The Economic Case For Restoring Coastal Ecosystems. The Center for American Progress and OxFam America.
National Research Council. Sea-Level Rise for the Coasts of California, Oregon, and Washington: Past, Present, and Future. Washington, DC: The National Academies Press, 2012.
Philip Williams & Associates, Ltd., and P. M. Faber (2004). Design Guidelines for Tidal Wetland Restoration in San Francisco Bay. The Bay Institute and California State Coastal Conservancy, Oakland, CA. 83 p.
Shepard CC, Crain CM, Beck MW (2011) The Protective Role of Coastal Marshes: A Systematic Review and Meta-analysis. PLoS ONE 6(11): e27374. doi:10.1371/journal.pone.0027374
ESA PWA. 2013. Analysis of the Costs and Benefits of Using Tidal Marsh Restoration as a Sea Level Rise Adaptation Strategy in San Francisco Bay. Prepared for the Bay Institute.
Cheong, Silliman, Wong, van Wesenbeeck, Kim, and Guannel. 2013. Coastal Adaptation with Ecological Engineering. Nature Climate Change. Published Online: 28 August 2013 | Doi: 10.1038/Nclimate1854.
Arkema, Guannel, Verutes, Wood, Guerry, Ruckelshaus, Kareiva, Lacayo, and Silver. 2013. Coastal Habitats Shield People and Property from Sea-level Rise and Storms. Nature Climate Change. Published Online: 14 July 2013 | Doi: 10.1038/Nclimate1944.
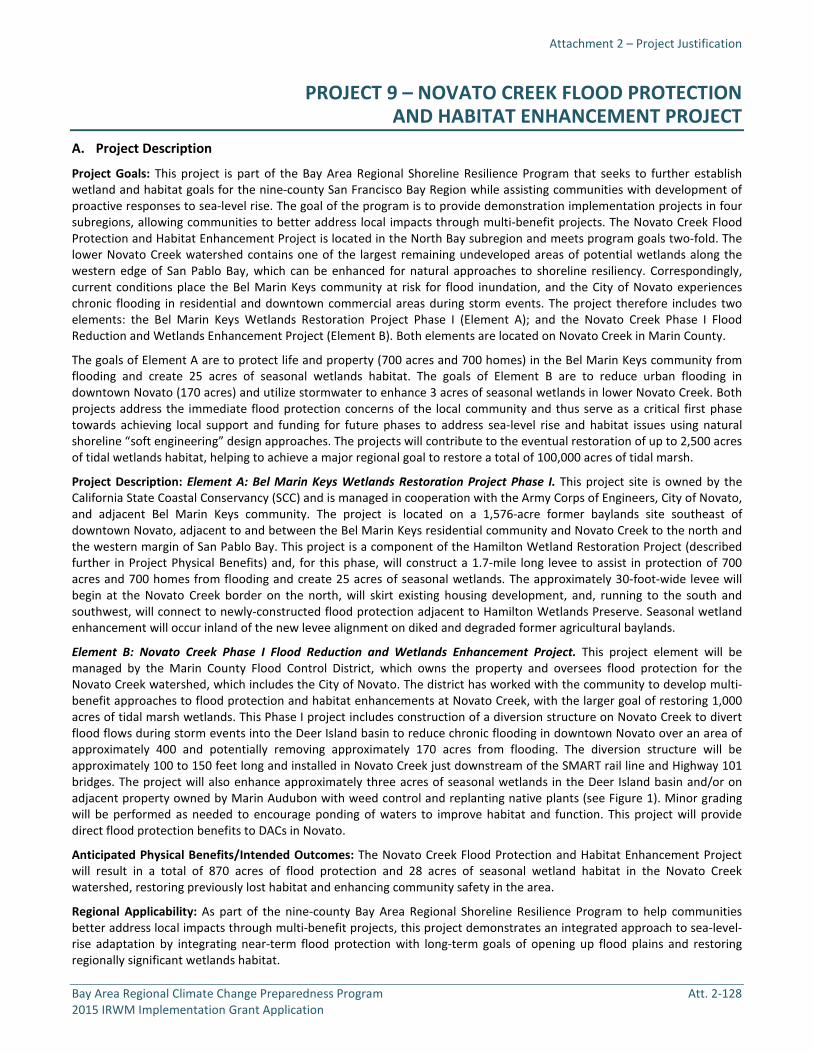
Attachment 2 – Project Justification
Bay Area Regional Climate Change Preparedness Program Att. 2-128
2015 IRWM Implementation Grant Application
PROJECT 9 – NOVATO CREEK FLOOD PROTECTION AND HABITAT ENHANCEMENT PROJECT
A. Project Description
Project Goals: This project is part of the Bay Area Regional Shoreline Resilience Program that seeks to further establish
wetland and habitat goals for the nine-county San Francisco Bay Region while assisting communities with development of
proactive responses to sea-level rise. The goal of the program is to provide demonstration implementation projects in four
subregions, allowing communities to better address local impacts through multi-benefit projects. The Novato Creek Flood
Protection and Habitat Enhancement Project is located in the North Bay subregion and meets program goals two-fold. The
lower Novato Creek watershed contains one of the largest remaining undeveloped areas of potential wetlands along the
western edge of San Pablo Bay, which can be enhanced for natural approaches to shoreline resiliency. Correspondingly,
current conditions place the Bel Marin Keys community at risk for flood inundation, and the City of Novato experiences
chronic flooding in residential and downtown commercial areas during storm events. The project therefore includes two
elements: the Bel Marin Keys Wetlands Restoration Project Phase I (Element A); and the Novato Creek Phase I Flood
Reduction and Wetlands Enhancement Project (Element B). Both elements are located on Novato Creek in Marin County.
The goals of Element A are to protect life and property (700 acres and 700 homes) in the Bel Marin Keys community from
flooding and create 25 acres of seasonal wetlands habitat. The goals of Element B are to reduce urban flooding in
downtown Novato (170 acres) and utilize stormwater to enhance 3 acres of seasonal wetlands in lower Novato Creek. Both
projects address the immediate flood protection concerns of the local community and thus serve as a critical first phase
towards achieving local support and funding for future phases to address sea-level rise and habitat issues using natural
shoreline “soft engineering” design approaches. The projects will contribute to the eventual restoration of up to 2,500 acres
of tidal wetlands habitat, helping to achieve a major regional goal to restore a total of 100,000 acres of tidal marsh.
Project Description: Element A: Bel Marin Keys Wetlands Restoration Project Phase I. This project site is owned by the
California State Coastal Conservancy (SCC) and is managed in cooperation with the Army Corps of Engineers, City of Novato,
and adjacent Bel Marin Keys community. The project is located on a 1,576-acre former baylands site southeast of
downtown Novato, adjacent to and between the Bel Marin Keys residential community and Novato Creek to the north and
the western margin of San Pablo Bay. This project is a component of the Hamilton Wetland Restoration Project (described
further in Project Physical Benefits) and, for this phase, will construct a 1.7-mile long levee to assist in protection of 700
acres and 700 homes from flooding and create 25 acres of seasonal wetlands. The approximately 30-foot-wide levee will
begin at the Novato Creek border on the north, will skirt existing housing development, and, running to the south and
southwest, will connect to newly-constructed flood protection adjacent to Hamilton Wetlands Preserve. Seasonal wetland
enhancement will occur inland of the new levee alignment on diked and degraded former agricultural baylands.
Element B: Novato Creek Phase I Flood Reduction and Wetlands Enhancement Project. This project element will be
managed by the Marin County Flood Control District, which owns the property and oversees flood protection for the
Novato Creek watershed, which includes the City of Novato. The district has worked with the community to develop multi-
benefit approaches to flood protection and habitat enhancements at Novato Creek, with the larger goal of restoring 1,000
acres of tidal marsh wetlands. This Phase I project includes construction of a diversion structure on Novato Creek to divert
flood flows during storm events into the Deer Island basin to reduce chronic flooding in downtown Novato over an area of
approximately 400 and potentially removing approximately 170 acres from flooding. The diversion structure will be
approximately 100 to 150 feet long and installed in Novato Creek just downstream of the SMART rail line and Highway 101
bridges. The project will also enhance approximately three acres of seasonal wetlands in the Deer Island basin and/or on
adjacent property owned by Marin Audubon with weed control and replanting native plants (see Figure 1). Minor grading
will be performed as needed to encourage ponding of waters to improve habitat and function. This project will provide
direct flood protection benefits to DACs in Novato.
Anticipated Physical Benefits/Intended Outcomes: The Novato Creek Flood Protection and Habitat Enhancement Project
will result in a total of 870 acres of flood protection and 28 acres of seasonal wetland habitat in the Novato Creek
watershed, restoring previously lost habitat and enhancing community safety in the area.
Regional Applicability: As part of the nine-county Bay Area Regional Shoreline Resilience Program to help communities
better address local impacts through multi-benefit projects, this project demonstrates an integrated approach to sea-level-
rise adaptation by integrating near-term flood protection with long-term goals of opening up flood plains and restoring
regionally significant wetlands habitat.
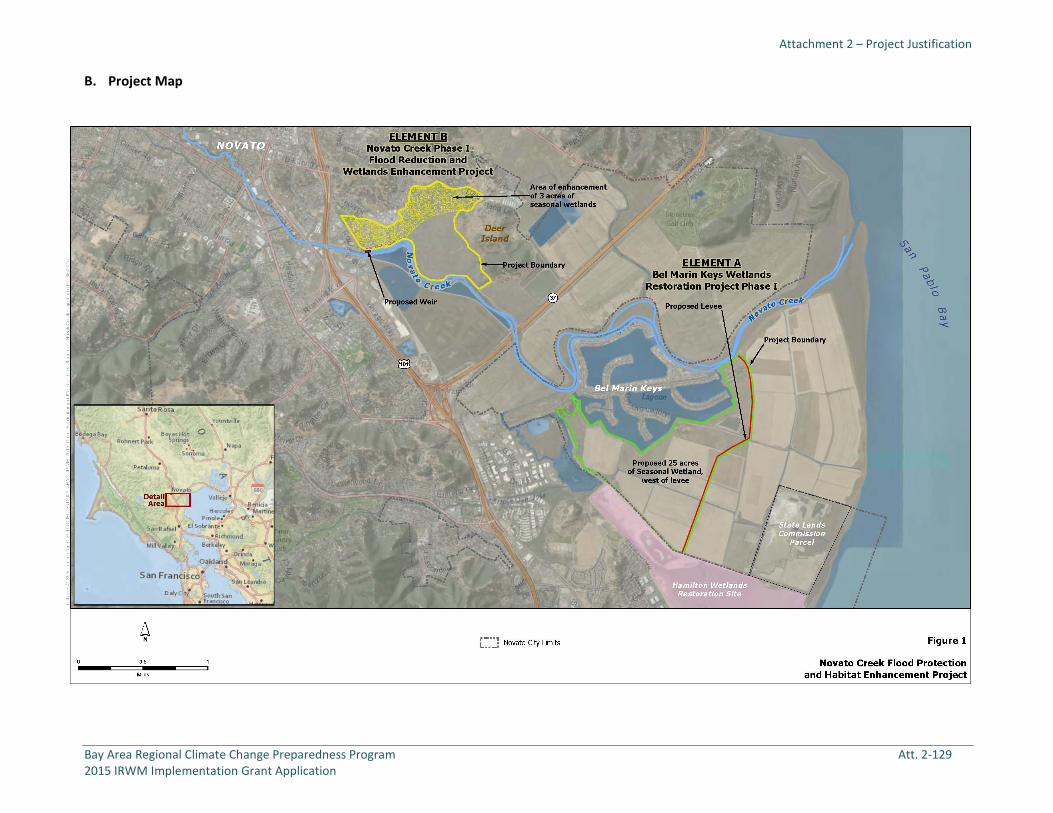
Attachment 2 – Project Justification
Bay Area Regional Climate Change Preparedness Program Att. 2-129
2015 IRWM Implementation Grant Application
B. Project Map

Attachment 2 – Project Justification
Bay Area Regional Climate Change Preparedness Program Att. 2-130
2015 IRWM Implementation Grant Application
C. Project Physical Benefits
Primary and secondary project physical benefits are summarized in PSP Tables 5a and 5b, respectively, as follows.
Technical Analysis of Primary Physical Benefits Claimed
1. Explanation of the need for the project, including recent and historical conditions that provide background for
benefits to be claimed; e.g., recent water shortages, loss of habitat or ecosystem function, and water quality
problems.
An estimated 90% of the historic tidal marshes in the San Francisco Bay-Delta Estuary have been filled or
significantly altered over the past two centuries. During this period extensive urban and industrial development
occurred on coastal and fluvial floodplains. These dramatic changes to the historic bayshore and tidal marshes
have led to significant impacts on fish and wildlife, including state and federally listed species, and degraded water
quality in the San Francisco Bay. In addition, these changes reduced the ability of the bay shoreline to absorb
storm surges and high tides. Sea-level rise will intensify the existing flood risks to the developed shoreline by
increasing the frequency of levee failure and the frequency of high energy wave events with the potential to erode
the existing levees, landfill slopes, and infrastructure.
Element A: Bel Marin Keys Wetlands Restoration Project Phase I. In San Pablo Bay, the primary cause of tidal
marsh loss was diking and impounding of bay waters and tidal wetlands for agriculture. The Hamilton Wetland
Restoration Project (HWR Project) was designed to restore tidal marsh and other wetlands that were lost when the
Bay Area was reclaimed for farming. Element A is the first implementation phase to restore the Bel Marin Keys
Unit V (BMKV) component of the HWR Project. The first phase of the HWR Project resulted in conversion of the
former Hamilton Army Airfield at the former military base, adjacent to BMKV, into a restored tidal marsh. Hamilton
PSP Table 5a - Primary Annual Project Physical Benefits
Project Name: Project 9 - Novato Creek Flood Protection and Habitat Enhancement Project
Type of Benefit Claimed: Flood Damage Reduction
Units of the Benefit Claimed: Acres of reduced inundation
Additional Information About This Benefit: The proposed levee will significantly reduce flood risks over approximately 870 acres in the lower Novato Creek area, which includes 700 residences in the City of Novato.
Anticipated Useful Life of Project (years): 50 years
Year
Physical Benefits
Without Project With Project Change Resulting from Project
2017 0 - Project under construction starting June 2017.
2018 0 - Project under construction.
2019 0 870 Project complete in October 2019.
870 acres will have significantly reduced flood risk.
Last Year of Project Life
(approximately 2069)
0 870 870 acres protected against flood inundation during storms or high tide for the next 50 years.
Comments: Element A: OCOF Sea Level Rise and Scenario Report by Our Coast, Our Future project:
www.pointblue.org/ocof. OCOF tool used to illustrate potential daily tidal flooding extent at 50 cm of sea-level rise
(extent greater for storm scenarios). Given that plans for levee to be designed will provide at least that much sea-
level rise protection (potentially up to 3 feet), then the extent behind the levee is area protected.
Element B: Results based on preliminary hydraulic modeling:
KHE Technical Memorandum. “Dredge reach and North Deer Island Spillway Parameters.” June 22, 2015.
WRECO Technical Memo. “Deer Island Weir Area of Flood Reduction.” June 22, 2015.
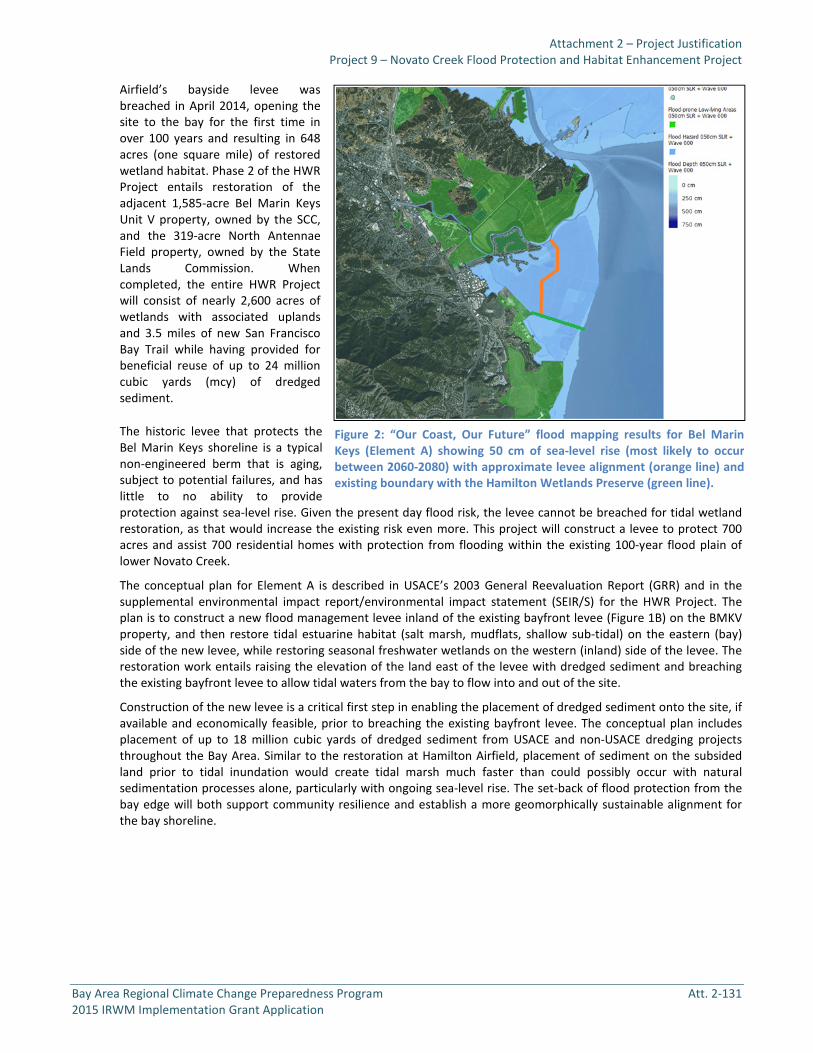
Attachment 2 – Project Justification
Project 9 – Novato Creek Flood Protection and Habitat Enhancement Project
Bay Area Regional Climate Change Preparedness Program Att. 2-131
2015 IRWM Implementation Grant Application
Airfield’s bayside levee was
breached in April 2014, opening the
site to the bay for the first time in
over 100 years and resulting in 648
acres (one square mile) of restored
wetland habitat. Phase 2 of the HWR
Project entails restoration of the
adjacent 1,585-acre Bel Marin Keys
Unit V property, owned by the SCC,
and the 319-acre North Antennae
Field property, owned by the State
Lands Commission. When
completed, the entire HWR Project
will consist of nearly 2,600 acres of
wetlands with associated uplands
and 3.5 miles of new San Francisco
Bay Trail while having provided for
beneficial reuse of up to 24 million
cubic yards (mcy) of dredged
sediment.
The historic levee that protects the
Bel Marin Keys shoreline is a typical
non-engineered berm that is aging,
subject to potential failures, and has
little to no ability to provide
protection against sea-level rise. Given the present day flood risk, the levee cannot be breached for tidal wetland
restoration, as that would increase the existing risk even more. This project will construct a levee to protect 700
acres and assist 700 residential homes with protection from flooding within the existing 100-year flood plain of
lower Novato Creek.
The conceptual plan for Element A is described in USACE’s 2003 General Reevaluation Report (GRR) and in the
supplemental environmental impact report/environmental impact statement (SEIR/S) for the HWR Project. The
plan is to construct a new flood management levee inland of the existing bayfront levee (Figure 1B) on the BMKV
property, and then restore tidal estuarine habitat (salt marsh, mudflats, shallow sub-tidal) on the eastern (bay)
side of the new levee, while restoring seasonal freshwater wetlands on the western (inland) side of the levee. The
restoration work entails raising the elevation of the land east of the levee with dredged sediment and breaching
the existing bayfront levee to allow tidal waters from the bay to flow into and out of the site.
Construction of the new levee is a critical first step in enabling the placement of dredged sediment onto the site, if
available and economically feasible, prior to breaching the existing bayfront levee. The conceptual plan includes
placement of up to 18 million cubic yards of dredged sediment from USACE and non-USACE dredging projects
throughout the Bay Area. Similar to the restoration at Hamilton Airfield, placement of sediment on the subsided
land prior to tidal inundation would create tidal marsh much faster than could possibly occur with natural
sedimentation processes alone, particularly with ongoing sea-level rise. The set-back of flood protection from the
bay edge will both support community resilience and establish a more geomorphically sustainable alignment for
the bay shoreline.
Figure 2: “Our Coast, Our Future” flood mapping results for Bel Marin
Keys (Element A) showing 50 cm of sea-level rise (most likely to occur
between 2060-2080) with approximate levee alignment (orange line) and
existing boundary with the Hamilton Wetlands Preserve (green line).

Attachment 2 – Project Justification
Project 9 – Novato Creek Flood Protection and Habitat Enhancement Project
Bay Area Regional Climate Change Preparedness Program Att. 2-132
2015 IRWM Implementation Grant Application
Figure 3: Element B - Proposed Novato Creek weir and flood protection
benefit area.
Element B: Novato Creek Phase I Flood Reduction and Wetlands Enhancement Project. Large areas of the City of
Novato currently suffer from chronic flooding even from storm events of less than the 5-year return interval,
depending on the storm duration, intensity, antecedent moisture conditions, and tide levels. This flooding is
concentrated in several residential communities along the creek and in the downtown commercial area. In
December 2014, storms resulted in
flooding of residential areas and
were threatening to flood downtown
Novato when the Marin County Flood
Control District mobilized a backhoe
during the storm to manually dig a
breach in the Novato Creek levees.
Manual breaching results in levee
damage and subsequent repair costs,
and it is not the method preferred by
the regulatory agencies.
To avoid manual breaching, this
project will construct an engineered
permanent flood flow diversion
structure that will be operated to
divert flood flows at critical
elevations to lessen and prevent
flooding and protect life and
property within the City of Novato.
This weir will meet modern goals for
multi-objective flood control that
combine habitat benefits with flood
protection benefits.
2. Explanation of estimates of the without-project conditions (e.g., the levels of the physical benefits in the future,
without the project, but with other planned projects).
The impacts of sea-level rise are projected to be most greatly felt along shorelines without established, integrated
solutions that can jointly achieve habitat goals and provide shoreline protection. These projects represent the
most significant currently planned contributions to ensuring resilience in the region.
Element A: Bel Marin Keys Wetlands Restoration Project Phase I. The existing BMKV bayfront levee is not
engineered and was never intended to protect human life or property. The levee was created by dredging soft bay
mud from adjacent areas and piling it up into a berm. As a result, the berm erodes quickly, requires difficult and
costly maintenance, and is not adequate to protect the shoreline. Bayfront levee failure from storms or extreme
tides could lead to coastal flooding through the BMKV property and overtop the inland levee system at the Bel
Marin Keys residential community. Without the project, the bayfront levee will continue to be at risk of failure and
the adjacent residences would potentially experience costly and extensive flooding.
Element B: Novato Creek Phase I Flood Reduction and Wetlands Enhancement Project. The without-project
conditions will result in continued flooding of the commercial downtown and residential areas, and DACs, of the
City of Novato. Without intervention, this flooding will worsen over time as the sea -level rises due to storm surge
and tidal propagation up-channel. At this time, there are no other projects planned and funded to address flooding
in the Novato watershed and provide habitat benefits; therefore, this project remains the primary proposed
solution that can be implemented with properties owned by the County of Marin.
3. Description of the methods used to estimate the primary physical benefits.
Element A: Bel Marin Keys Wetlands Restoration Project Phase I. FEMA maintains flood insurance rate maps
(FIRMs) that indicate flood zones and floodplain boundaries across the United States. FEMA recently updated
FIRMs with stricter criteria for flood control boundaries. Preliminary FIRM update maps show the entire project
area to be within a current special hazard zone.

Attachment 2 – Project Justification
Project 9 – Novato Creek Flood Protection and Habitat Enhancement Project
Bay Area Regional Climate Change Preparedness Program Att. 2-133
2015 IRWM Implementation Grant Application
The Our Coast, Our Future (OCOF) tool was used to show the extent of flooding at 50 cm of sea-level rise,
demonstrating that the outer BMKV is one of the first locations in the area to experience exacerbated daily tidal
flooding. Given plans for the new levee to provide at least that much sea-level rise protection, the extent shown
behind the levee is considered the area protected. Potential acreage reduction was calculated from model results
using geospatial analysis of the flood inundation maps.
Element B: Novato Creek Phase I Flood Reduction and Wetlands Enhancement Project. Marin County’s hydraulics
consultant estimated the area that would benefit from the flood overflow weir using the hydraulics models built as
part of the lower Novato Creek hydraulics project. The model ran the project design storm (a 50-year storm event)
against a spring tide to estimate the reduction in water surface elevation from the construction and operation of
the proposed weir. The models used are the USEPA model PCSWMM. The modeling results are shown in Figure 3.
Design consultants Kamman Hydrology and Engineering (KHE) and WRECO Inc. both prepared technical
memorandums documenting the flood reduction benefits of the proposed flood flow diversion structure.
Geospatial analysis of the modeling results shows a reduction in flooded area of approximately 400 acres and the
removal of approximately 170 acres from the floodplain.
4. Identification/description of all new facilities, policies, and actions required to obtain the physical benefits, e.g.,
any City policies or procedures that need to be established in order for the benefits to be realized.
Element A: Bel Marin Keys Wetlands Restoration Project Phase I. The proposed 1.7-mile levee is needed to
achieve the project’s primary physical benefits. Otherwise, there are no new required facilities, policies or
procedures required to construct the project. The property is owned and maintained by the State Coastal
Conservancy with full control to implement to the project.
Element B: Novato Creek Phase I Flood Reduction and Wetlands Enhancement Project. A flood flow diversion
structure will need to be constructed on property owned by Marin County and seasonal wetlands enhancements
constructed on properties owned by the County and or Marin Audubon. Other than the flow diversion structure,
no new facilities, policies, or procedures are required in order to construct the project.
5. Description of potential adverse physical effects and what is being done to mitigate those impacts.
Element A: Bel Marin Keys Wetlands Restoration Project Phase I. The 2003 SEIR/EIS for the HWR Project
identified potentially significant impacts that may not be mitigated to a less-than-significant level; however, these
potential impacts are not applicable to the project identified in this proposal (e.g., methylmercury production in
tidal wetland, impacts from unloading dredged material). Other potentially significant impacts would be mitigated
to a less-than-significant level as specified in the SEIR/EIS, including:
Increase in potential mosquito breeding habitat
Temporary disturbance to or mortality of various birds
Potential for construction-related mortality of outmigrating salmonid smolts
Potential disturbance to or mortality of special-status species resulting from monitoring and adaptive
management activities
Temporary loss of nesting habitat for the San Pablo song sparrow
Potential for spread of invasive non-native plants within and outside of restoration area during
construction activities
Construction-related emissions of PM-10 from terrestrial construction equipment
Construction-related emissions of ozone precursors from terrestrial equipment
Temporary increases in noise levels to more than 60 dBA during construction
Potential impacts to buried cultural deposits or human remains
See the SEIR/EIS Executive Summary Table ES-2: Summary of Impacts and Mitigation Measures for further details.
Other potential adverse effects were considered less than significant.
Element B: Novato Creek Phase I Flood Reduction and Wetlands Enhancement Project. Project impacts are
expected to consist of temporary and minor construction activities that will produce low levels of traffic, noise, and
dust impacts. These are expected to be fully mitigated via on-site best management practices.
State Coastal Conservancy staff have consulted with the relevant permitting authorities (Marin County permitting
meeting with agencies including the San Francisco Bay Regional Water Quality Control Board, USACE, NOAA

Attachment 2 – Project Justification
Project 9 – Novato Creek Flood Protection and Habitat Enhancement Project
Bay Area Regional Climate Change Preparedness Program Att. 2-134
2015 IRWM Implementation Grant Application
Fisheries, and the CDFW) and concluded that the only identified potential adverse impact is the entrainment of
juvenile salmonids into the Deer Island basin, an issue common to many flood reduction projects of this type. The
County of Marin is in consultation with NOAA Fisheries on approaches to address this and expects to deal with any
concerns in the design and CEQA phase of the project. Seasonal wetlands will be designed to avoid impacts to
other wetlands and be self-mitigating.
6. Description of whether the proposed project effectively addresses long-term drought preparedness goals.
The primary project benefit of reduced flood risk does not address long-term drought preparedness goals.
References Cited for Primary Project Benefit
USACE’s 2003 General Reevaluation Report (GRR) and in the Supplemental Environmental Impact
Report/Environmental Impact Statement (SEIR/S) for HWR Project.
KHE Technical Memorandum “Dredge reach and North Deer Island Spillway Parameters” June 22, 2015.
WRECO Technical Memo “Deer Island Weir Area of Flood Reduction” June 22, 2015.
Goals Project. 1999. Baylands Ecosystem Habitat Goals. A report of habitat recommendations prepared by the San
Francisco Bay Area Wetland Ecosystem Goals Project. First Reprint. U.S. Environmental Protection Agency, San
Francisco, Calif./S.F. Bay Regional Water Quality Control Board, Oakland Calif.
Goals Project. Baylands Ecosystem Habitat Goals Science Update (in draft, 2015).
Steere, J.T. and N. Schaefer 2001. Restoring the Estuary: Implementation Strategy of the San Francisco Bay Joint
Venture. San Francisco Bay Joint Venture, Oakland, California. 124 p.
Pacific Institute. 2009. The Impacts of Sea-Level Rise on the California Coast. Prepared for the California Climate
Change Center.
Conathan, Buchanan, and Polefka. 2014. The Economic Case For Restoring Coastal Ecosystems. The Center for
American Progress and OxFam America.
National Research Council. Sea-Level Rise for the Coasts of California, Oregon, and Washington: Past, Present, and
Future. Washington, DC: The National Academies Press, 2012.
Shepard CC, Crain CM, Beck MW (2011) The Protective Role of Coastal Marshes: A Systematic Review and Meta-
analysis. PLoS ONE 6(11): e27374. doi:10.1371/journal.pone.0027374.
ESA PWA. 2013. Analysis Of The Costs And Benefits Of Using Tidal Marsh Restoration As A Sea Level Rise
Adaptation Strategy In San Francisco Bay. Prepared for the Bay Institute.
Cheong, Silliman, Wong, van Wesenbeeck, Kim, and Guannel. 2013. Coastal Adaptation with Ecological
Engineering. Nature Climate Change. Published Online: 28 August 2013 | Doi: 10.1038/Nclimate1854.
Arkema, Guannel, Verutes, Wood, Guerry, Ruckelshaus, Kareiva, Lacayo and Silver. 2013. Coastal Habitats Shield
People and Property from Sea-level Rise and Storms. Nature Climate Change. Published Online: 14 July 2013 | Doi:
10.1038/Nclimate1944.

Attachment 2 – Project Justification
Project 9 – Novato Creek Flood Protection and Habitat Enhancement Project
Bay Area Regional Climate Change Preparedness Program Att. 2-135
2015 IRWM Implementation Grant Application
Technical Analysis of Secondary Physical Benefits Claimed
1. Explanation of the need for the project, including recent and historical conditions that provide background for
benefits to be claimed; e.g., recent water shortages, loss of habitat or ecosystem function, and water quality
problems.
Element A: Bel Marin Keys Wetlands Restoration Project Phase I. The Bel Marin Keys property was historically
tidal marsh. The area was diked off in the early 1900s and has primarily been a mix of poor and degraded seasonal
wetlands with ruderal non-native weeds. The ultimate goal of the project is to restore much of this area back to
tidal marsh. Seasonal wetlands have been a lost habitat type around the bay margin, as they were often the first
areas to be drained and graded over. Wetlands are often still present, though low-functioning, in semi-urbanized
and agricultural settings around the bay margin, where they may take the form of unmanaged depressions, borrow
ditches, and the like. They often do not support an ideal mix of species or provide habitat for the ideal duration or
timing for migratory species. The opportunity to locate purpose-built wetlands in areas ideally suited for migratory
waterfowl, that can be designed around target species and can address non-native and invasive plant concerns, is
relatively rare and of high value in meeting regional habitat goals.
PSP Table 5b - Secondary Annual Project Physical Benefits
Project Name: Project 9 - Novato Creek Flood Protection and Habitat Enhancement Project
Secondary Benefit Claimed: Habitat Restoration
Units of the Benefit Claimed: Acres of habitat restored
Additional Information About This Benefit: The existing wetlands onsite are of low quality. The project would restore an additional 28 acres of higher quality seasonal wetlands. Marin County Flood Control District and SCC restoration experience on similar sites indicates that habitat quantity and quality within seasonal wetlands is expected to increase each year following establishment, with approximately 5 years needed for full establishment. The project elements will constitute the initial phases of larger efforts to restore up to 2,500 acres of tidal wetlands in the lower Novato Creek region.
Anticipated Useful Life of Project (years): 50
Year
Physical Benefits
Without Project With Project Change Resulting from Project
2017 100 100 Project under construction starting June 2017.
2018 100 100 Project under construction.
2019 100 128 Project complete in October 2019.
Last Year of Project Life
(approximately 2069)
100 128
28 additional acres of high-quality seasonal wetlands for the next 50 years.
Comments: Existing wetlands footprint on the larger Bel Marin Keys and Marin County sites are estimated at
approximately 100 acres. The SEIR analyzed wetlands extent across the entire Bel Marin Keys site; see SEIR/S
p. 4-103–4-104: Impact BIO-16: Loss of Seasonal Wetlands:
“These areas occur as inclusions within highly disturbed non-native annual grassland. Because of their size,
location, and level of disturbance, the wetlands provide few of the functions and values of higher quality
seasonal wetlands…. The loss of seasonal wetlands is considered less than significant because of the relative
value of the wetlands and because the loss would be offset by the establishment of in-kind seasonal
wetlands elsewhere on the site that are expected to be of substantially higher habitat quality than the
present seasonal wetlands as well as substantially greater acreage of out-of-kind tidal wetlands.”

Attachment 2 – Project Justification
Project 9 – Novato Creek Flood Protection and Habitat Enhancement Project
Bay Area Regional Climate Change Preparedness Program Att. 2-136
2015 IRWM Implementation Grant Application
Seasonal wetlands provide critical support to the North American flyway, helping to support the Bay Area’s
diversity of waterfowl, as well as providing support to native local species.
Element B: Novato Creek Phase I Flood Reduction and Wetlands Enhancement Project.
The Deer Island basin was historically
primarily tidal marsh. The basin was diked
off in the late 1800s/early 1900s and has
primarily been a mix of poor and degraded
seasonal wetlands with ruderal non-native
weeds. The ultimate goal of the Novato
Creek project is to restore much of this area
back to tidal marsh. In the interim, the
project will enhance some of the existing
seasonal wetlands through control of non-
native weeds and minor grading to improve
drainage. The occasional influx of flood
flows from the proposed overflow weir
should enhance seasonal wetland function
in this area.
Seasonal wetlands have been a lost habitat
type around the bay margin, as they were
often the first areas to be drained and
graded over. Wetlands are often still
present, though low-functioning, in semi-
urbanized and agricultural settings around
the bay margin, where they may take the
form of unmanaged depressions, borrow ditches, and the like. They often do not support an ideal mix of species or
provide habitat for the ideal duration or timing for migratory species. The opportunity to locate purpose-built
wetlands in areas ideally suited for migratory waterfowl, that can be designed around target species and can
address non-native and invasive plant concerns, is relatively rare and of high value in meeting regional habitat
goals.
Seasonal wetlands provide critical support the to the North American flyway, helping support the Bay Area’s
diversity of waterfowl, as well as providing support to native local species.
Collectively, the Element A and Element B projects address known and ongoing flooding issues for the local
community while assisting in the restoration of habitat. Both elements represent initial phases that will contribute
to the eventual restoration of up to 2,500 acres of tidal wetlands habitat in the area, helping to achieve a major
regional goal to restore a total of 100,000 acres of tidal marsh.
2. Explanation of estimates of the without-project conditions (e.g., the levels of the physical benefits in the future,
without the project, but with other planned projects).
Element A: Bel Marin Keys Wetlands Restoration Project Phase I. Without the proposed project, progress in
reversing the historic loss of baylands habitats, called for by the Bay Area IRWM Plan, the Baylands Ecosystem
Habitat Goals, San Francisco Bay Basin Plan, San Francisco Bay Estuary Comprehensive Conservation and
Management Plan, and other regional plans, will be greatly slowed and, in places, halted.
As part of the 2003 feasibility study, USACE described and quantified “project outputs” by using a Habitat
Evaluation Procedure (HEP) cost-benefit analysis. The USACE analysis concluded that the existing condition of
subsided, farmed land had few benefits relative to the proposed wetland restoration.
Element B: Novato Creek Phase I Flood Reduction and Wetlands Enhancement Project. Without the project, the
wetland areas behind levees will continue to experience habitat degradation issues from non-native weed
infestations and a lack of winter water for ponding. Seasonal wetlands benefit both resident and migratory birds,
providing critical habitat. Large residential and commercial areas, including DACs, within the City of Novato will
experience continual and worsening flooding with sea-level rise and changes in rainfall precipitation patterns that
Figure 4: Site location map of Novato Creek Phase I project
(Element B). Location of proposed flood flow bypass weir and
seasonal wetland enhancements in Deer Island basin.

Attachment 2 – Project Justification
Project 9 – Novato Creek Flood Protection and Habitat Enhancement Project
Bay Area Regional Climate Change Preparedness Program Att. 2-137
2015 IRWM Implementation Grant Application
are expected to increase rainfall intensity, which tends to exacerbate flooding. Addressing this existing and
worsening flooding situation under this grant is the first phase of a long-term, larger project goal currently in
planning to evaluate the benefits of restoring large areas of diked-off former tidal marsh to active tidal marsh. The
project under this proposal is a critical first step in addressing chronic flooding issues within the City of Novato in
order to build local support and funding towards the larger restoration goals.
3. Description of the methods used to estimate the secondary physical benefits.
Element A: Bel Marin Keys Wetlands Restoration Project Phase I and Element B: Novato Creek Phase I Flood
Reduction and Wetlands Enhancement Project. Both project sites currently retain degraded elements of historical
baylands, which provide gently varied relief conducive to the construction of seasonal wetland features. Human
development pressure (e.g., agriculture) has removed historic hydrologic connections and introduced invasive and
other non-native plants. In each setting, the eventual amount of seasonal wetland enhancement will be
determined largely based on available funding, with greater amounts possible at increased funding levels. The
acreage of seasonal wetlands benefits proposed is therefore extrapolated based on Marin County Flood Control
District and SCC engineering restoration experience and discussions with Marin Audubon and STRAW (Students
and Teachers Restoring A Watershed), both of which organizations have conducted seasonal wetlands
enhancement and revegetation at many locations within the northern San Francisco Bay counties. Based on similar
projects, a per-acre cost of $50,000 was used to estimate the number of acres that can be enhanced under this
grant funding. Seasonal wetlands enhancements will include approximately 7,500 plants of the plug/stubby size, or
approximately one plant per 6–10 square feet. These costs are also used by CalTrans when it estimates costs for
enhancement of seasonal wetlands due to construction impacts. Enhanced seasonal wetlands can support a higher
quality of habitat function than wetlands at many non-purposed designed sites in the area, where generally
ephemeral ponding of agricultural lands provides temporary and sub-optimal foraging and nesting.
4. Identification/description of all new facilities, policies, and actions required to obtain the physical benefits, e.g.,
any City policies or procedures that need to be established in order for the benefits to be realized.
Element A: Bel Marin Keys Wetlands Restoration Project Phase I. The proposed seasonal wetlands enhancements,
along with the proposed 1.7-mile levee, are needed to achieve the project’s physical benefits. No other new
facilities, policies, or procedures are required to construct the project, as the property is owned and maintained by
the State Coastal Conservancy with full control to implement the project.
Element B: Novato Creek Phase I Flood Reduction and Wetlands Enhancement Project. Other than the project
weir, no new facilities, policies, or procedures are required or need to be established for this project.
5. Description of potential adverse physical effects and what is being done to mitigate those impacts. If none,
explanation of why.
Element A: Bel Marin Keys Wetlands Restoration Project Phase I. See discussion above under the Primary Project
Benefit.
Element B: Novato Creek Phase I Flood Reduction and Wetlands Enhancement Project. The primary potential
adverse effects and impacts from this benefit are those temporary impacts associated with access and
construction. These impacts may include noise, dust, and inadvertent impacts to any existing wetlands present at
the site. Prior to construction, a plan will be prepared that identifies existing wetlands and other resources and
develops construction access routes and design details and allowable work windows in order to mitigate impacts.
Construction and other impacts are expected to be only temporary and minimal, and easily managed by on-site
construction practices.
6. Description of whether the proposed project effectively addresses long-term drought preparedness goals.
The secondary project benefit of reduced habitat restoration does not address drought preparedness goals.
References Cited for Secondary Project Benefit
Goals Project. 1999. Baylands Ecosystem Habitat Goals. A report of habitat recommendations prepared by the San
Francisco Bay Area Wetland Ecosystem Goals Project. First Reprint. U.S. Environmental Protection Agency, San
Francisco, Calif./S.F. Bay Regional Water Quality Control Board, Oakland Calif.

Attachment 2 – Project Justification
Project 9 – Novato Creek Flood Protection and Habitat Enhancement Project
Bay Area Regional Climate Change Preparedness Program Att. 2-138
2015 IRWM Implementation Grant Application
Goals Project. 2000. Baylands Ecosystem Species and Community Profiles: Life histories and environmental
requirements of key plants, fish and wildlife. Prepared by the San Francisco Bay Area Wetland Ecosystem Goals
Project. P.R. Olofson, editor. S.F. Bay Regional Water Quality Control Board, Oakland Calif.
Goals Project. Baylands Ecosystem Habitat Goals Science Update (in draft, 2015)
Steere, J.T. and N. Schaefer 2001. Restoring the Estuary: Implementation Strategy of the San Francisco Bay Joint
Venture. San Francisco Bay Joint Venture, Oakland, California. 124 p.

Attachment 2 – Project Justification
Project 9 – Novato Creek Flood Protection and Habitat Enhancement Project
Bay Area Regional Climate Change Preparedness Program Att. 2-139
2015 IRWM Implementation Grant Application
D. Direct Water-Related Benefit to a DAC
While the majority of Novato does not qualify as a DAC, there are two out of the 34 census tract block groups in Novato
that do qualify as a DAC: Block Group Numbers 060411022021 and 060411032002. These DAC block groups are located
southwest of downtown Novato and encompass 3,048 people. The median household income of these block group
areas is $31,710 (DWR 2015 1).
Element B, the Novato Creek Phase I Flood Protection and Habitat Enhancement Project, would provide direct flood
protection benefits to the two block groups identified above. Approximately 134 (24.7%) out of 542 acres of the
Element B project benefit area are a DAC. This estimate is an approximation of the project flood modeling effort
described in Attachment 2, primary benefit response to Question 3 (also see Figure 3). The data used to generate the
benefit area estimates can be provided upon request.
Currently, the residential and downtown commercial areas of Novato experience chronic flooding during relatively low-
level storm events that coincide with high tides. The Element B project will directly reduce the risk of flood flows that
threaten the habitability of dwellings within Novato and its DACs by constructing a weir to divert flood flows to the
Deer Island basin.
Further discussion of the direct flood protection benefits of Element B for DACs is provided in Attachment 7.
1 Department of Water Resources (DWR). 2015. Disadvantaged Communities Mapping Tool. Available:
http://www.water.ca.gov/irwm/grants/resources_dac.cfm. Accessed July 2015.

Attachment 2 – Project Justification
Project 9 – Novato Creek Flood Protection and Habitat Enhancement Project
Bay Area Regional Climate Change Preparedness Program Att. 2-140
2015 IRWM Implementation Grant Application
E. Project Performance Monitoring Plan
PSP Table 6 – Project Performance Monitoring Plan
Project 9: Novato Creek Flood Protection and Habitat Enhancement Project
Proposed Physical
Benefits Targets or Milestones Measurement Tools and Methods Evaluation
Element A
700 acres of flood risk
reduction
Levee constructed and fully
functioning
As-built certified by Registered Engineer
Annual visual survey and photography
Periodic evaluation of levee integrity via visual
survey and photography
25 acres of seasonal
wetlands created
25 acres of seasonal wetlands
created
Biannual monitoring of wetlands vegetation Biannual surveys of wetlands vegetation will be
conducted to assess wetlands functioning.
Seasonal wetlands can take years to fully
develop, so a monitoring plan will be developed
in accordance with permit conditions.
Element B
170 acres of flood risk
reduction
Reduction of flooding in
residential and commercial areas
of down town Novato, including
DAC block groups
Increased level of flood protection in City of
Novato through high-water marks and visual
observations of flooding. The Marin County
Flood Control Division will monitor significant
storms and work with the City of Novato to
collect high-water marks and estimate their
recurrence interval with the existing hydraulic
models.
Water levels and high-water marks will be
collected following selected significant storm
events to evaluate performance of the flood
basin and overflow weir structure. Monitoring
is tied to significant storm events that are not
always predictable, but it is anticipated that at
least one event can be measured biannually.
Flood reports are collected by the City of
Novato and flood zone, and these reports will
be evaluated to assess performance. Note that
other factors, especially tide level, impact
performance of the weir.
3 acres of seasonal
wetlands created
3 acres of functioning season
seasonal wetlands
Biannual monitoring of wetlands vegetation Biannual surveys of wetlands vegetation will be
conducted to assess wetlands functioning.
Seasonal wetlands can take years to fully
develop, so a monitoring plan will be developed
in accordance with permit conditions.

Attachment 2 – Project Justification
Project 9 – Novato Creek Flood Protection and Habitat Enhancement Project
Bay Area Regional Climate Change Preparedness Program Att. 2-141
2015 IRWM Implementation Grant Application
F. Cost-Effectiveness Analysis
PSP Table 7 evaluates whether the physical benefits provided by the project are provided at the least possible costs.
PSP Table 7 – Cost-Effectiveness Analysis
Project name: Project 9 - Novato Creek Flood Protection and Habitat Enhancement Project
Question 1 What are the types of benefits provided? Explain in as much detail as possible:
Element A: This phase of the project will construct a 1.7-mile long levee to assist in protection of
700 acres and 700 homes from flooding and create 25 acres of seasonal wetlands. Wetlands will
be constructed with grading and fill of small contoured areas followed by seasonal planting of
appropriate native vegetation.
Element B: Increased flood protection over an area of up to 400 acres and a reduction in the area
of flooding of up to 170 acres of highly urbanized areas within the City of Novato that current
experience chronic flooding during even relatively small flood events. 1,900 buildings are
calculated to be in the footprint of the area that will benefit from the overflow weir construction.
Within the Deer Island basin or adjacent property owned by Marin Audubon, three acres of
degraded, weedy habitat will be restored to a functioning seasonal wetland with native plants.
Question 2 Have alternative methods been considered to achieve the same types and amounts of physical
benefits as the proposed project been identified?
If yes, list the methods (including the proposed project) and estimated costs.
Element A: Each of the alternatives considered in the SEIR/SEIS (2003) included construction of a
new levee. The levee will serve as the new bayfront shoreline once the existing bayfront levee is
breached as part of the planned wetlands restoration. In a report entitled “Conceptual Design
Report Proposed Bayfront Levee Bel Marin Keys Unit V Restoration Project” (2010), Moffatt &
Nichol (M&N) proposed a simplified alignment for the inland levee. While the conceptual plan
described in the GRR provides for the levee alignment to follow a sinuous path, M&N developed
conceptual designs for a straighter alignment to simplify the design and construction, resulting in
relatively lower construction cost. The levee design recommended by M&N would provide an
overall habitat breakdown of 25% seasonal wetlands and 75% tidal wetlands, which approximates
the habitat distribution in the GRR. The final designs for the levee will be based on M&N’s
conceptual designs.
Element B: Since 2012, the Marin County Watershed Group has been conducting its Novato Creek
Hydraulics Study, a two-year ongoing effort to evaluate flood reduction alternatives in the Novato
Creek watershed and baylands. The final report will be completed in January 2016, and
preliminary hydraulic modeling results show that the proposed flood overflow weir is the most
cost-effective alternative for addressing flooding within the City of Novato. The work is being
conducted with both one- and two-dimensional comprehensive hydrologic and hydraulic modeling
of the entire Novato Creek watershed. Draft costs for other similar alternatives are significantly
greater in cost. Final cost estimates will be in the final report due January 2016.
Question 3 Is the proposed project the least-cost alternative?
Element A: The greater Bel Marin Keys project was assessed for benefit to bird and fish species in
2002 using USACE’s Habitat Evaluation Procedure (HEP), which concluded that the project would
have a positive benefit-cost ratio.
As part of the 2003 feasibility study, the Corps of Engineers described and quantified project
outputs again using a HEP cost-benefit analysis in order to justify using dredged sediment to
expedite creation of salt marsh. The Corps’ analysis concluded that the existing condition of
subsided, farmed land had few benefits. The Corps also used HEP to compare a No Fill Alternative
to a fully-filled scenario and concluded that more habitat would benefit from the placement of

Attachment 2 – Project Justification
Project 9 – Novato Creek Flood Protection and Habitat Enhancement Project
Bay Area Regional Climate Change Preparedness Program Att. 2-142
2015 IRWM Implementation Grant Application
dredged sediment on the site.
Element B: The proposed project is the least-cost alternative. The Deer Island basin has already
been used for emergency flood flow storage as recently as during the December 2014 storm
events. The project location is owned by Marin County, so property acquisition and right-of-way
costs are not required. The proposed project will convert this currently non-engineered
emergency breach location into an engineered weir that can be controlled to provide flood and
habitat benefits at different water levels. The proposed project meets the goals of the flood
control district to relieve chronic flooding in the urban areas of the City of Novato.
Comments: References
Kamman Hydrology and Engineering (KHE). 2014. Technical Memorandum, Novato Watershed
Alternative A IWRMP. January 31.
KHE. 2014. Hydraulic Assessment of Existing Conditions Report, Novato Creek Watershed
Project. June.
KHE. 2015. Technical Memorandum, “Dredge Reach and North Deer Island Spillway
Parameters.” June 22.
Moffatt and Nichol (M&N). 2010. Conceptual Design Report Proposed Bayfront Levee Bel
Marin Keys Unit V Restoration Project Novato, California. February. M&N File No. 6438-01.
WRECO. 2015. Technical Memo, “Deer Island Weir Area of Flood Reduction.” June 22.

Attachment 2 – Project Justification
Bay Area Regional Climate Change Preparedness Program Att. 2-143
2015 IRWM Implementation Grant Application
Project Justification: Grant Administration
The grant administration description is provided in this section. Discussion of physical benefits, disadvantaged communities,
and cost-effectiveness of grant administration is not applicable.
Project
ID# Project Proponent Project Title
10 ABAG/SFEP Grant Administration

Attachment 2 – Project Justification
Bay Area Regional Climate Change Preparedness Program Att. 2-144
2015 IRWM Implementation Grant Application
PROJECT 10 – GRANT ADMINISTRATION
A. Project Description
Project Goal: The goal of the grant administration task is to ensure that IRWM grant funds are properly managed and
administered in accordance with DWR guidelines and requirements. The Bay Area Regional Climate Change Preparedness
Program consists of nine projects.
Project Description: The Association of Bay Area Governments/San Francisco Estuary Partnership (ABAG/SFEP) will
administer the 2015 grant funds and respond to DWR’s reporting and compliance requirements associated with the grant
administration. ABAG will act in a coordination role by: disseminating grant compliance information to the project
managers responsible for implementing the projects contained in this agreement; obtaining and retaining evidence of
compliance (e.g., reports, monitoring compliance documents, etc.); obtaining data for progress reports from individual
project managers; assembling and submitting progress reports to the State; and coordinating all invoicing and payment of
invoices. Key components of the grant administration task are described below.
Grant Administrator and Grant Recipient: ABAG is the official Council of Governments (COG) representing the San
Francisco Bay Area’s nine counties and 101 cities and towns. ABAG holds the distinction of being the first COG in
California and is the Bay Area’s official regional planning agency. Its mission is to strengthen cooperation and
coordination among local governments and address social, environmental, and economic issues that transcend local
borders. The San Francisco Estuary Partnership (SFEP), administered by ABAG, is one of 28 national programs under the
National Estuary Program of the U.S. Environmental Protection Agency (USEPA). SFEP’s mission is to protect and
restore the natural resources of the San Francisco Bay Estuary. SFEP staff members are ABAG employees. ABAG/SFEP
has participated in the regional IRWM planning effort since its inception.
Local Project Sponsor Oversight and Coordination Committee: ABAG is a voluntary membership and advisory
organization with limited statutory authority. The agency is governed by a general assembly and executive board with
standing and interagency committees all comprising local elected officials. The Bay Area Local Project Sponsors and
ABAG will form a Local Project Sponsor Oversight & Coordination Committee that will meet in person or by conference
call, as needed, to review progress/quarterly reports, resolve grant reimbursement or invoicing issues, and address
outstanding matters. In addition, the ABAG/SFEP Grant Manager will provide grant oversight and coordination with all
Local Project Sponsors, ensuring that reporting and invoicing are performed completely and that project progress is
being made according to schedule and concomitant with progress reports and field visits.
Local Project Sponsor Agreements: The Local Project Sponsor Agreements between ABAG and each Local Project
Sponsor will ensure that matching funds are committed and grant requirements are satisfied, which will reduce risk
exposure to ABAG in executing a grant agreement with the State on behalf of the Local Project Sponsors. All the
agreements will have similar general conditions, but each agreement will be tailored to the funding and grant
requirements applicable to the specific project. Generally, the Local Project Sponsor Agreements will address project-
specific issues. Issues affecting more than one project will be addressed by the Local Project Sponsor Oversight &
Coordination Committee. Agreements with Local Project Sponsors will be established by ABAG staff as described
below:
Local Project Sponsor Agreements will be negotiated and finalized with each Local Project Sponsor that receives
IRWM grant funding, and approval will be obtained from the ABAG Executive Board and the governing body of
each Local Project Sponsor. Each Local Project Sponsor will be expected to execute a Local Project Sponsor
Agreement before reimbursement is requested or distributed.
Each Local Project Sponsor Agreement will include standard formats for reporting project progress and making
reimbursement requests, resolving disputes, and addressing other conditions as specified in the Grant
Agreement between ABAG and DWR.
An analysis of project physical benefits, planned project monitoring measures, and cost-effectiveness has not been
provided, as these components are not applicable to the grant administration task.