
Project Guide - 4corn.co.uk
110
Project Guide Acom f
Transcript of Project Guide - 4corn.co.uk
Project Guide
Acomf

Project Guide

ii
Copyright© Acorn Computers Limited 1992, 1993
Published by Acorn Computers Technical Publications Department
Neither the whole nor any part of the information contained in. nor the product described in. this manual may be adapted or reproduced in any material form except with the prior written approval of Acorn Computers Limited.
The product described in this manual and products for use with it are subject to continuous development and improvement. All information of a technical nature and particulars of the product and its use (including the information and particulars in this manual) are given by Acorn Computers Limited in good faith. However. Acorn Computers Limited cannot accept any liability for any loss or damage arising from the use of any information or particulars in this manual.
If you have any comments on this manual. please complete the form at the back of the manual. and send it to the address given there.
Acorn supplies its products through an international dealer network. These outlets are trained in the use and support of Acorn products and are available to help resolve any queries you may have.
ACORN, the Acorn logo, ARCHIMEDES and ECONET are trademarks of Acorn Computers Limited.
All other trademarks are acknowledged.
Published by Acorn Computers Limited ISBN I 85250 133 2 Part number 0484.063 Issue I. January 1993

Contents
About this Guide v About the Acorn Advance Climate Project v
Introduction to the Advance weather database 1 Getting started 3 Moving between records in an Advance Database file '5 Searching for specific weather records 6 Extracting data from a Database file I 0
Project 1: Investigating seasonal variations in climate in the UK 13 Getting started 13 Searching for the Cambridge weather records I '3 Getting your Cambridge data into an Advance spreadsheet 16 Printing your spreadsheet 20 Studying the weather data 20
Plotting a graph of the climate changes through the seasons 21 Writing a report 28 Quitting Advance altogether 36 Summing up 37
Project 2: Investigating regional variations in climate in the UK 39 Getting started 40
Searching for several weather records 40 Getting your subset data into an Advance spreadsheet 42 Printing your spreadsheet 52
Plotting graphs of regiona I climate variations '52 Studying the climate data 59 Writing a report 60
Quitting Advance altogether 68 Summing up 68
iii
Contents
iv
Project 3: Comparing local climate to the UK average 69 Getting started 69 Getting data into an Advance spreadsheet 69 Getting your subset data into an Advance spreadsheet 71 Printing your spreadsheet 78 Plotting a graph comparing an area's temperature with the UK average 79
Further suggestions 83 Writing a report 85 Quitting Advance altogether 96 Summing up 96
Appendix A: Collecting your own climate data 97
About this Guide
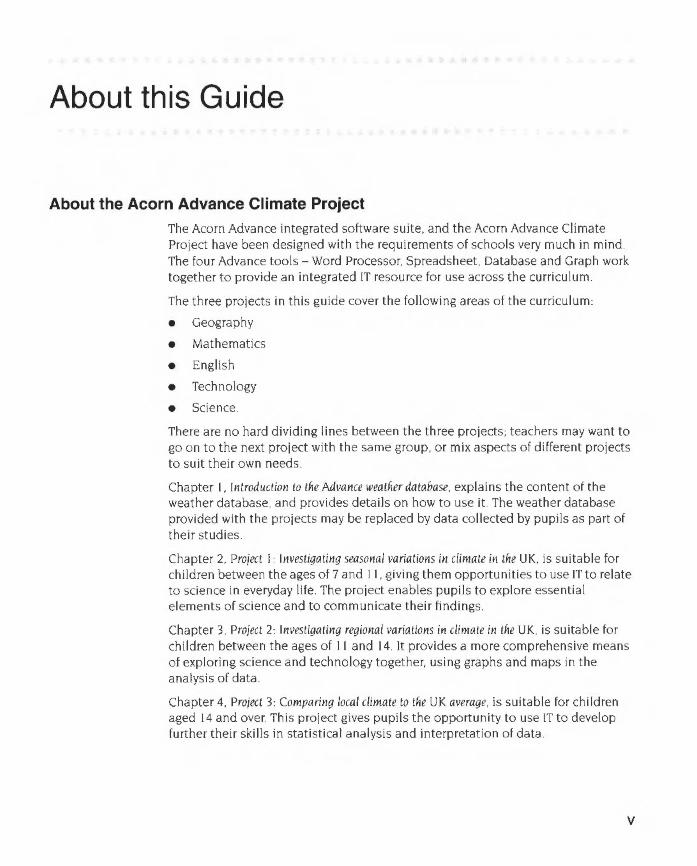
About the Acorn Advance Climate Project
The Acorn Advance integrated software suite. and the Acorn Advance Climate Project have been designed with the requirements of schools very much in mind. The four Advance tools- Word Processor. Spreadsheet, Database and Graph work together to provide an integrated IT resource for use across the curriculum
The three projects in this guide cover the following areas of the curriculum:
• Geography
• Mathematics
• English
• Technology
• Science.
There are no hard dividing lines between the three projects; teachers may want to go on to the next project with the same group, or mix aspects of different projects to suit their own needs.
Chapter I, Introduction to the Advance weather database. explains the content of the weather database. and provides details on how to use it. The weather database provided with the projects may be replaced by data collected by pupils as part of their studies
Chapter 2. Project I Investigating seasonal variations in climate in the UK. is suitable for children between the ages of 7 and II. giving them opportunities to use IT to relate to science in everyday life. The project enables pupils to explore essential elements of science and to communicate their findings.
Chapter 3. Project 2: Investigating regional variations in climate in the UK. is suitable for children between the ages of II and 14. It provides a more comprehensive means of exploring science and technology together. using graphs and maps in the analysis of data.
Chapter 4. Project 3· Comparing local climate to the UK average. is suitable for children aged 14 and over. This project gives pupils the opportunity to use IT to develop further their skills in statistical analysis and interpretation of data
v

About the Acorn Advance Climate Project
vi
1 Introduction to the Advance weather database
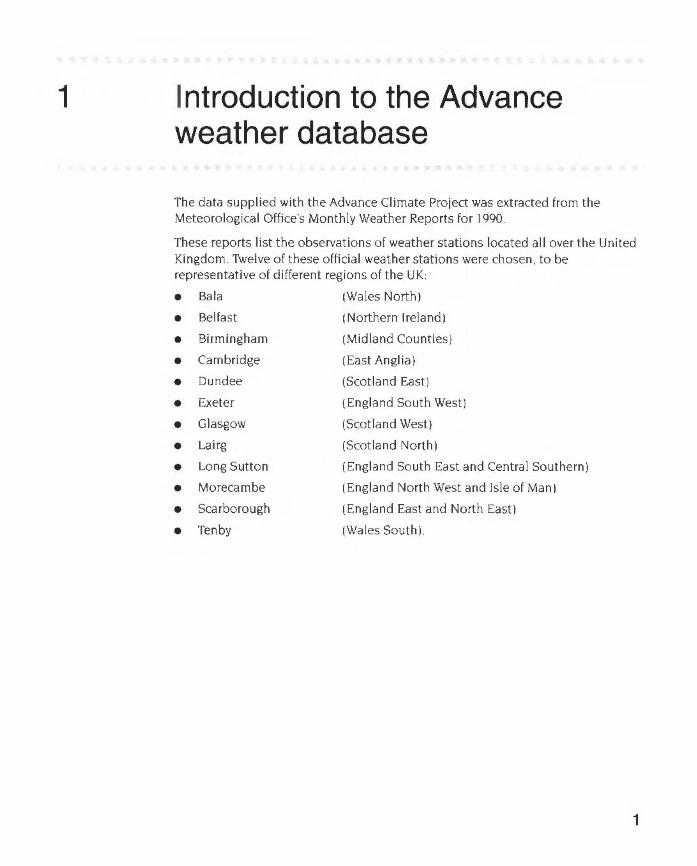
The data supplied with the Advance Climate Project was extracted from the Meteorological Office's Monthly Weather Reports for 1990.
These reports list the observations of weather stations located all over the United Kingdom. 'TWelve of these official weather stations were chosen. to be representative of different regions of the UK:
• Bala (Wales North)
• Belfast (Northern Ireland)
• Birmingham (Midland Counties)
• Cambridge (East Anglia)
• Dundee (Scotland East)
• Exeter (England South West)
• Glasgow (Scotland West)
• Lairg (Scotland North)
• Long Sutton (England South East and Central Southern)
• Morecambe (England North West and Isle of Man)
• Scarborough (England East and North East)
• Ten by (Wales South) .
1

2
This map shows the location of these weather stations
Lairg # 2 Dundee 3 Glasgow 4 Belfast 5 Scarborough 6 Morecambe
7 Bala 8 Birmingham 9 Cambridge 10 Ten by 11 Long Sutton 12 Exeter
The Climate Project data is stored in an Advance Database file ca lled Wea the rOB. This file is supplied on Advance Data disc B.
There are twelve records associated with each weather station; one for each month of the year. This gives a total of 144 records within the database.
Each project involves examining the data contained in the weaL her DB database file. and extracting the data which is relevant to the project.
Getting started
Introduction to the Advance weather database
Cambridge is used as the local weather station in the Climate Project. This is just an example; you should use the data for the station nearest to your home. or if you prefer, your own data. (Appendix A: Collecting your own climate data gives you some ideas about collect ing your own climate data.)
Before you start. you need to load Advance into your computer. Display the directory containing the !Advance icon on the screen, and then double-dick on the Advance icon. This loads Advance onto the icon bar ready for use.
when Advance is running, its icon is displayed on the icon bar --..,...--..--&
If you have not previously installed Advance on your computer, you should refer to the chapter Installing and running Advance on page 7 of the Advance User Guide now
Loading the weather database
To load the Advance weather database. WeatherDB:
Insert a copy of Advance Data disc B into the floppy disc drive.
2 Click on the floppy drive icon on the icon bar.
3 Double-dick on the Project directory. and then double-dick on the WeatherDB icon
If you are using a single floppy disc machine, your computer will then ask you to insert Advance Program Disc I. Insert Program Disc I and click on OK. You'll then be asked to insert Data disc B. Insert Data disc Band click on OK.
The weather database should now be loaded.
3

Getting started
4
The first record in the database is displayed on the screen.
NtithtrDB it 111% tJ -o-
Bala Jan 1990 -·her ••tton
n\ e-ra~~ dul~ holar.. '-ll ,oo,huh." I~
" ,t\er~ged;ul~ l<tll(ll:r.~ur.: t• •c
~\ Records: rnil\lmlhn ,,·mrx·r . .aun: ·=·· •c-144 Unsorhd 11\IIUilllUII lt"lllJXr<.'IIUI\. . .:7 •c
[i) Rdd ~<•••I r.unl.\11 lt""* mm
8Del
da) s -..11h houl
d~ ' ,. 11h lhunder
The records are already sorted into alphabetical order by weather station name.
Under each station. the records are sorted into calendar order So, the record you can see is the one which comes first in the alphabet. and has the name of the first month of the year. In this case it is the January record for Bala (unless data you've entered comes before this).

Introduction to the Advance weather database
Moving between records in an Advance Database file
To see other records. you can page through the records using the Record toolbox.
The Record toolbox on the left of the window shows you how many records there are in the database. and the number of the record currently displayed.
~ [?
• t - current record
~ ~ Re~~ 144 - -- total number of records Unsorhd r:±) Add r=:l ttl ·~
"
The Record toolbox has the following buttons which allow you to move between records:
A The First Record button takes you to the first record.
A The Previous Record button takes you to the previous record .
~ The Next Record button takes you to the next record.
I The Last Record button takes you to the last record .
5

Searching for specific weather records
Looking at the layout of the weather records
You' ll see as you move through the records. that each record in a database has exactly the same layout and field titles. but that the content of each record is different. it is only the information held in the field boxes which changes.
Unsorted [±) Rdd GDtl
I
field boxes containing data
Jan 1,990
~ u I• •c
12 1 •c
I<Jt.d raont.JI ::!().1 nom
Most of the fields in the Advance weather database have a visible field title There 1s one field which does not; the field which contains the name of the month
Searching for specific weather records
6
In Projects I and 2. you'll search for a specific set of records. and then save these records as a subset of the database. (A subset is any group of records which is just a part of the whole database.)
When you open a Database file. you automatica lly have access to the whole database. To see just a section of the database. you need to tell Advance which records you wish to see. You do this by searching for those records.
Introduction to the Advance weather database
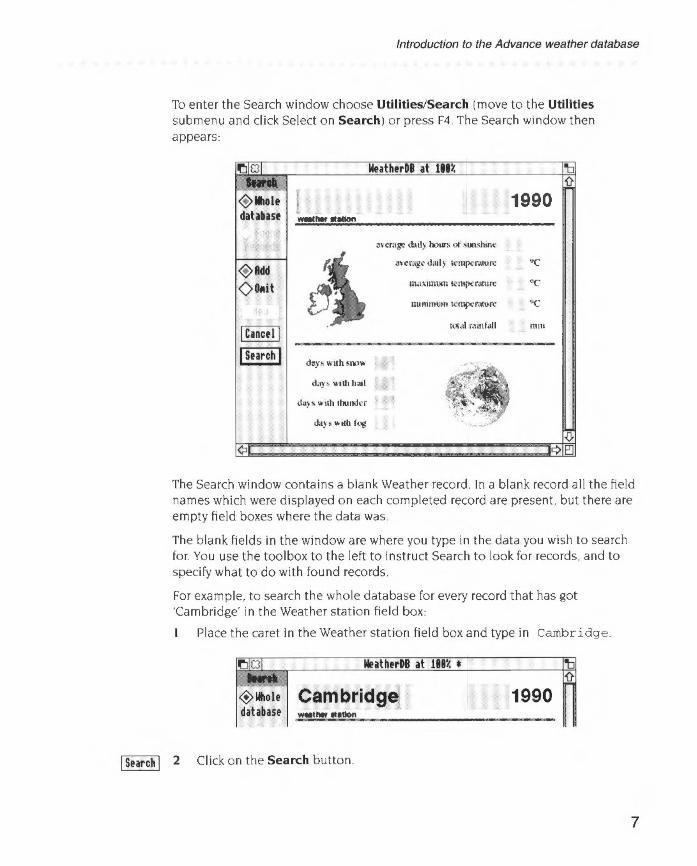
To enter the Search window choose Utilities/Search (move to the Utilities submenu and click Select on Search) or press F4 The Search window then appears
~ !smch!
r
-herllatlon
days with sno~
days w11h had
days with thunder
NeithtrDB it 111~
aver.•&C d:nl} hooo. ol \Uil.,htne
a\'emg.: dml) tempemture
m.1xomum tem.pemmre
nunnnum tempemture
total rmnfall
1990
•c
•c
•c
mm
The Search window contains a blank Weather record In a blank record all the field names which were displayed on each completed record are present . but there are empty field boxes where the data was.
The blank fields in the window are where you type in the data you wish to search for You use the toolbox to the left to instruct Search to look for records. and to specify what to do with found records.
For example. to search the whole database for every record that has got ·cambridge· in the Weather station field box:
I Place the ca ret in the Weather station field box and type in Cambridge.
~~~~ole Cambridgel database _,,_Illation
1990
I Smch I 2 Click on the Search button.
7

Searching for specific weather records
8
When you click on Search. Advance searches the whole database for records with Cambridge in the Weather station field .
When the search is fin ished. the Search window disappears and you're returned to the One Record window.
Instead of the 144 records that were previously available. twelve records are now contained in this window. and the first record of this set (January 1990) is automatically displayed on the screen:
12 records --.
Subset --. button
~ £3
I .. 1
• I Records: 12 Unsorttd ll)Rdd Gt.I
~slllset
¢
NtitherDB it 1 1% 'b '()-
Cambridge Jan 1990 w.thwlllation
uverug~.~ daoly hm~t~> ,{ ~>Unshonc 2.1 ,
~" nvcn~ge daol y temper(llurc 6.9 •c
muJumum temper(llurc 12.1 •c
o.s •c rnuumum tempcr(llurc
totul ruonf..JI ~ rnm
days witb snow 0
d11ys ,. .. th had 0
d~s "'"h th.mder 0
da) s with fog
.0. e::J
The twelve records that are displayed in the One Record window are the records that contained fields matching your search. The Subset button at the bottom of the toolbox is switched on. indicating that the One Record window is displaying a subset. and not the whole database.
You can now use the Record toolbox to see each of the Cambridge records in turn.
What If you make a mistake?
If you make a mistake when entering search data. you can use the delete key as normal to help put it right.
If you've made a mistake. but have also clicked on Search. Advance will try to find matching data. If no records match search data. a warning is displayed on the screen. When you click on OK. you're returned to the whole database in the One Record window.

Introduction to the Advance weather database
To try again, simply choose Utilities/Search. enter your search data and click on Search as before.
Restarting a search
If you want to search the whole database again to create a new subset. then you need to return to the Search window. click on New. type in your new search data. and click on Search.
Leaving the Search window
If you're in the Search window and you want to return to the One Record window without searching for any data. you can click on the Cancel button.
Saving a database subset
Once you've created a subset of records. it is best to save it as a separate database file. You do this by choosing File/Save. or by pressing F3. Use the Delete key to rub out the default name Subset and type an appropriate name into the dialogue box. Then drag the icon to your work directory.
Your subset is saved in a separate database which you can open from the desktop.
Quitting the main database
When you've finished working with the whole database. you close the database by clicking Select on the Close icon:
Close icon
• llutherDB at 181%
Cambridge Jan ~
1990
Any changes you've made to the structure of you r database are saved automatically while you work. so you are not asked whether you want to save your changes
9
Extracting data from a Database file
Extracting data from a Database file
10
You can export data from Advance Database files to use in other applications. including the Advance Spreadsheet and Word Processor.
To export data from the Database. you need to save the data in a file format which can be understood by the Spreadsheet or Word Processor
You can save data in two different file formats from the Database: CSV (Comma Separated Value) and TSV (Tab Separated Value) file formats. There is more information on exporting data in the Acorn Advance User Guide under Appendix A: Moving data between Advance tools on page 299.
Saving data as a CSV file
Each project uses CSV file format for transferring data. To save data in CSV file format:
2
4
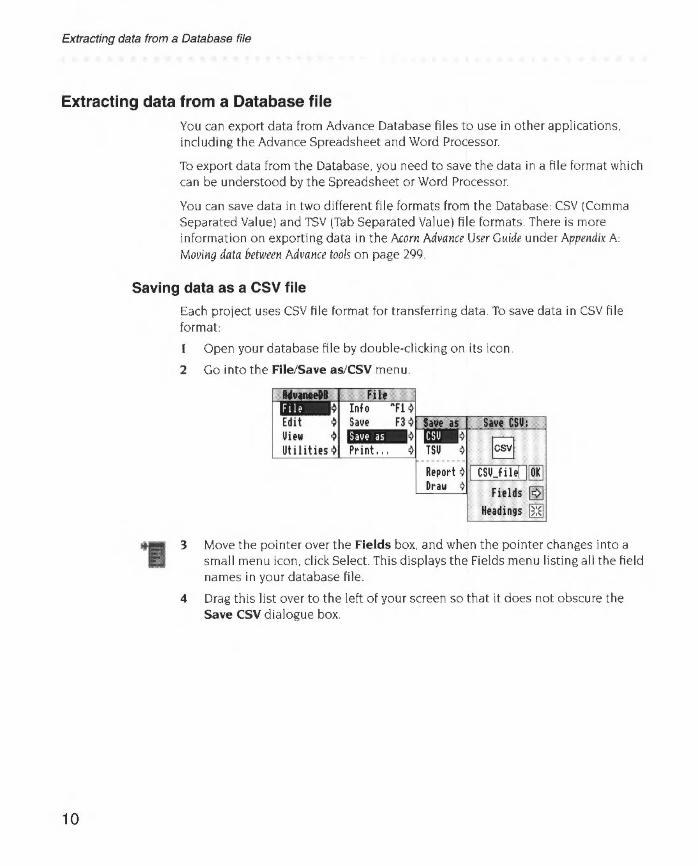
Open your database file by double-clicking on its icon.
Go into the File/Save as/CSV menu.
Move the pointer over the Fields box. and when the pointer changes into a small menu icon, click Select. This displays the Fields menu listing all the field names in your database file.
Drag this list over to the left of your screen so that it does not obscure the Save CSV dialogue box.
Introduction to the Advance weather database
hours of sunshine tet~~perature
t~~axit~~ut~~ tet~~perature
t~~init~~ut~~ tet~~perature total rainfall daiJS with snow daiJS with hail daiJS with thunder
with f
I CSU_subsetll[@
Fields ~ Hndings ~
.lJ 111111
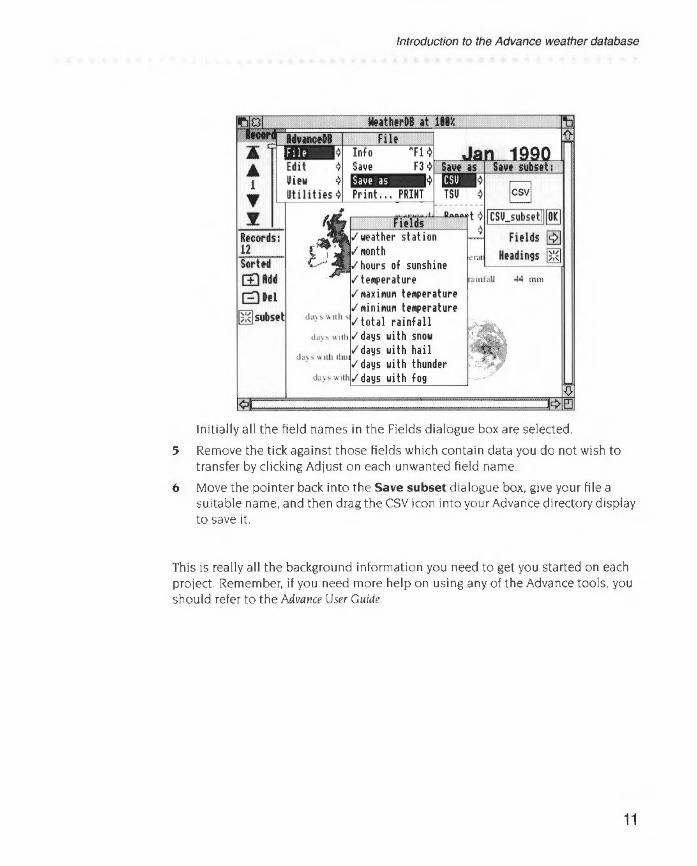
Initially all the field names in the Fields dialogue box are selected
5 Remove the tick against those fields which contain data you do not wish to transfer by clicking Adjust on each unwanted field name
6 Move the pointer back into the Save subset dialogue box, give your file a suitable name. and then drag the CSV icon into your Advance directory display to save it
This is really all the background information you need to get you started on each project. Remember, if you need more help on using any of the Advance tools. you should refer to the Advance User Guide.
11

Extracting data from a Database file
12

2
Getting started
Project 1: Investigating seasonal variations in climate in the UK
In this project. you'll use Advance to examine climate data for a single area in the British Isles. You can either use the data supplied with Advance or data you've collected for your own area.
The examples in this project use data for Cambridge, which is supplied on Advance Data disc B.
In the project. you'll examine the data for your chosen area. and show how temperature, rainfall, and hours of sunshine fluctuate with the seasons. You'll then produce a report based on your findings.
Load Advance into your computer and open the Advance weather database, WeatherDB, as explained in Getting started on page 3.
Searching for the Cambridge weather records
To examine the data for a single weather station. you need to search for all the records for that area. and then save them as a subset of the database.
13

Searching for the Cambridge weather records
14
To enter the Search window choose UtJlities/Search or press F4 The Search window then appears:
~Add 0 011it
~ I Starch I
T
day• wilh >1101'
days with lhund~r
days with fog
NeatherDB at 188%
:nerage cLuJ) hour.. 01 ~un,hme
•Hr.JgC d.uJ~ IC11!p.:UU~
IIIHUIUIQU ICIIlJlo'I'UIU~
101:11 l"dllllull
1990
Ill Ill
Place the caret in the Weather station field box and type in Cambridge (or the name of you r chosen weather station)
NeatherDB at 118% •
~lllolt dahbut
Cambridgej ---etlon
f!!arcEJ 2 Click on the Search button.
1990
Project 1: Investigating seasonal variations in climate in the UK
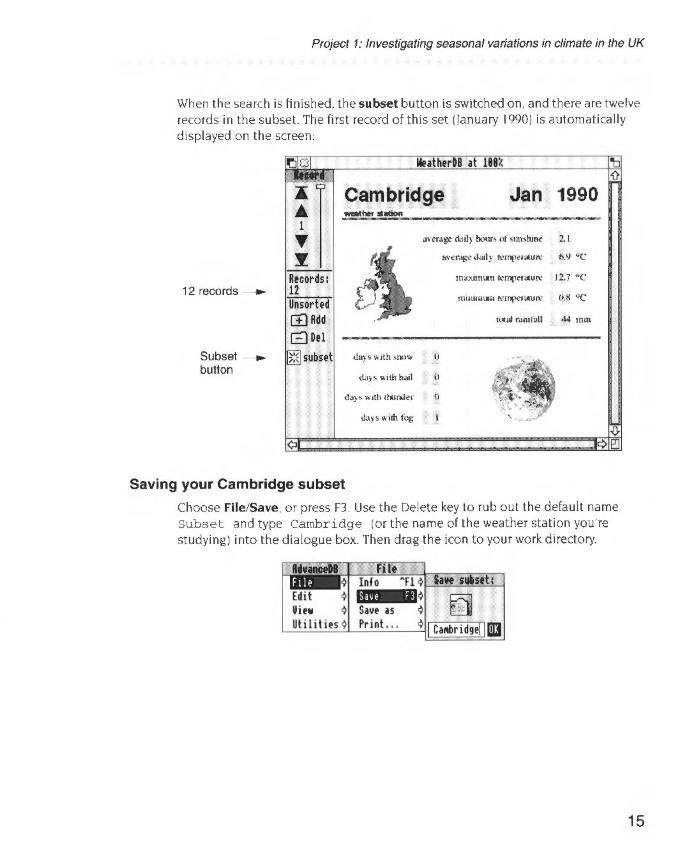
When the search is finished. the subset button is switched on. and there are twelve records in the subset. The first record of this set (January 1990) is automatically displayed on the screen:
12 records~ Unsorted [±) Rdd
GDtl
Subset ~ ~subset button
NeatherDB at 111%
Cambridge Jan 1990 _. ..... .cion
II\ erniJe d.ul) ho\11'\ 01 'un•hmt ll
t'\ a\Cr.ll:C dati~ ll'lllfltmlUn' 6.9 °C
IIU\.\IIIIUIII f'CIUI)ef':..U I"C 12.7 °C
manunutn n•mpcr.-urc liS °C
tl.(t~ rmnf:d.l 44 mm
days with ;n(lw n
d;~y; with hail n
days with thundcl' U
Saving your Cambridge subset
Choose File/Save. or press F3. Use the Delete key to rub out the default name Subset and type Cambridge (or the name of the weather station you're studying) into the dialogue box. Then drag the icon to your work directory
15
Getting your Cambridge data into an Advance spreadsheet
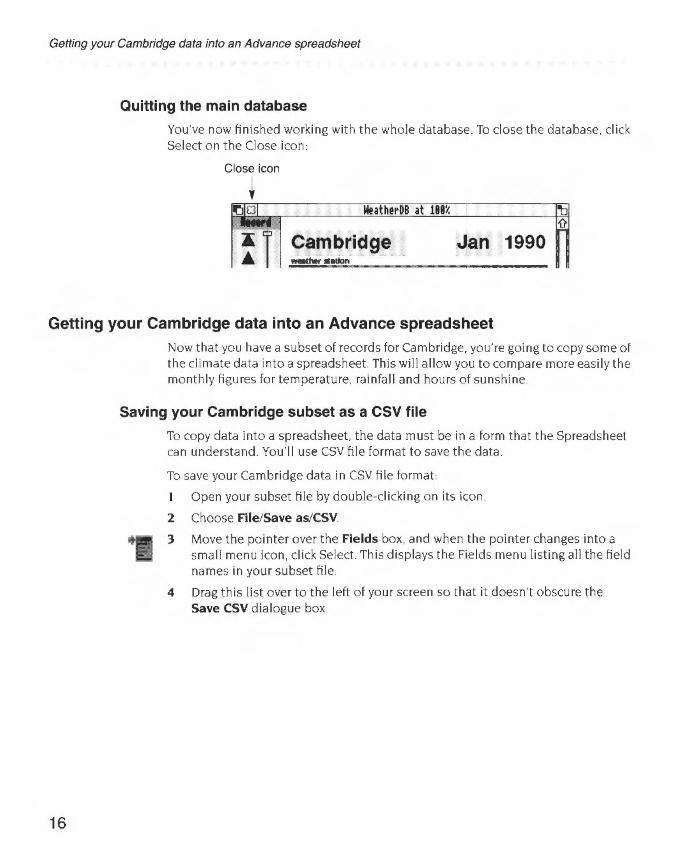
Quitting the main database
You've now finished working with the whole database. To close the database. click Select on the Close icon:
Close icon
t NfathtrDB at 111% I~
Cambridge Jan 1990 -···lion
Getting your Cambridge data into an Advance spreadsheet
16
Now that you have a subset of records for Cambridge, you' re going to copy some of the climate data into a spreadsheet This wi ll allow you to compare more easi ly the monthly figures for temperature. rainfall and hours of sunshine.
Saving your Cambridge subset as a CSV file
To copy data into a spreadsheet, the data must be in a form that the Spreadsheet can understand. You'll use CSV file format to save the data
To save your Cambridge data in CSV file format
l Open your subset file by double-clicking on its icon
2 Choose File/Save as/CSV.
3 Move the pointer over the Fields box. and when the pointer changes into a sma ll menu icon. click Select This displays the Fields menu listing all the field names in your subset file.
4 Drag this list over to the left of your screen so that it doesn't obscure the Save CSV dialogue box.

Project 1: Investigating seasonal variations in climate in the UK
hours of sunshine te1111erature .axi.u~ te1111erature ~ini.u~ te1111erature total rainfall days uith snow days uith hail days uith thunder
s ui th f
You can see that all the field names in the Fields dialogue box are currently selected.
5 You're only interested in the data for month, hours of sunshine. temperature and rainfall. Click Adjust on each unwanted field name to remove the tick against it. When you've finished. you r list will look like this
Fitllls weather station
./ .onth
./hours of sunshine
./ tei!IPerature ~axi.u~ te1111erature Nini.u~ te1111erature
./total rainfall days with snow days with hail days with thunder days with fog
6 Move the pointer back into the Save CSV dialogue box. and give your file a suitable name such as subsctcsv. Drag the CSV icon into your work directory display to save it.
Now close your subset file by clicking on the Close icon
17
GeNing your Cambridge data into an Advance spreadsheet
18
Freeing up memory
You won't need to use the Database tool again during this project. so it is wise to tell Advance not to save any computer memory for it To do this. click Menu on the Advance icon on the icon bar. and choose Minimise memory
Creating a spreadsheet for your data
2
[i]3 4
5
Click Menu on the Advance icon on the icon bar. and choose Create/Spreadsheet.
This displays a blank spreadsheet file. Cell AI is automatically selected. You'll use this cell to give your spreadsheet a title.
Type Weather in Cambridge during 199 0 (of course, if you aren't using Cambridge. you should type the name of the weather station you've chosen to work on).
Click on the Enter button to accept your tit le.
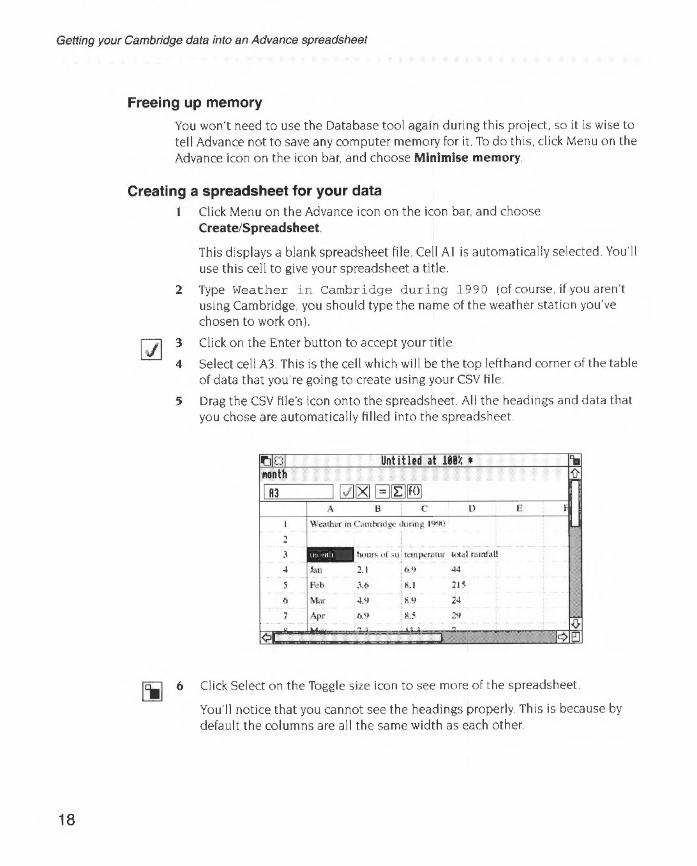
Select cell A3. This is the cell which wil l be the top lefthand corner of the table of data that you're going to create using your CSV file.
Drag the CSV file's icon onto the spreadsheet. All the headings and data that you chose are automatically filled into the spreadsheet
Wealhec on C.tmhndb.'t dunnll 1~1
J h<>u"' of w tCtnJl<.-rolur 1<~~• mon/.tll
4 Jan 2.1 (>.<J 44
Feb ~(> H. I 2 1 ~
(> M•v: 4.'} 8.'1 24
Apr ().9 85 2<)
Click Select on the Toggle size icon to see more of the spreadsheet.
You'll notice that you cannot see the headings properly This is because by default the columns are all the same width as each other

Project 1: Investigating seasonal variations in climate in the UK
7 To alter the width of the columns. double-click on the column label (the letter above the column) of the column which is too narrow Do this for columns B. C and D
double-click here to widen column B /
II'Sfo1 Untitled aY181% • 'il Mnth L fl I A3 I Ql~ l=EJlf.Ql
A B' c D E f
I Woulux m Cam badge dllnng 1'1<.10
2
~ houn. ot ~~~ tanperatut uxalmmf<~ll
4 r~rn 2. 1 (1.9 44
5 ~.: .l() S.J 215
"' .1 0 ou , ' '-
It is always sensible to save files regularly. Save your spreadsheet file now. Choose File/Save. give you r file the name CambSheeL and drag the Save as icon to your directory display.
Formatting your spreadsheet
At the moment. you r spreadsheet title doesn't stand out very well. You can improve this by changing the text size and emphasis (You could also change the font if you wish).
I Select cell A I
2 To change the ti t le text from 12 point to 18 point text. choose Effecvrext slze/18pt
Cell colour ~
Cell border ~
3 Then to make the text bold. choose Effect/Bold
19

Printing your spreadsheet
4 As you've enlarged the text. you need to increase the height of the row so that the text fits. You do this in the same way as you increased the column width; double-click on the corresponding row label. in this case the I at the left of the window
5 You can also see that the figures do not line up very well in the cells. they would look much better aligned to the right. To do this. select all the cells containing figures. and then choose Effect/Alignment/Right
6 Save your work.
Printing your spreadsheet
Now that you've improved the appearance of your spreadsheet. you can print it out. This will make it easier for you to see the information it contains.
Make sure that a suitable printer is correctly connected and set up. and that the !Printers application is loaded onto the icon bar (the RISC OS 3 User Guide describes this). If you have a I MB computer and wish to print. please refer to Appendix B: Using Advance on I MB or 2MB computers on page 303 of the Advance User Guide.
2 Switch off the row and column labels by choosing the Utilities/Labels option (otherwise you'll get the row and column labels down the side and across the top)
3 Select the area of your spreadsheet that you wish to print (cells A I to D15)
4 Then choose File/Print.
5 Tell Advance to print just the selected cells by clicking on Selection
6 Finally click on Print.
Studying the weather data
20
When you've collected your printout. look in turn at the figures for rainfall. hours of sunshine and temperature. Assume that the seasons are as follows:
Spring
Summer
Autumn
Winter
March. April and May
June. July and August
September. October and November
December. January and February
In which season is there the most rain in this area?
In which season is there the least rain?
Project 1: Investigating seasonal variations in climate in the UK
In which season is there the most sunshine in this area?
In which season is there the least sunshine?
Which season is the hottest in this area?
Which season is the coldest?
Further suggestions
If you have another look at your database subset, you could find out in what months there have been snow. (To do this you' ll need to open your database subset file )
Which season has the most snowy days?
If you are using a I MB computer. you should click Menu on the Advance icon on the icon bar. and choose Minimise memory when you have finished with the Database.
Plotting a graph of the climate changes through the seasons
The best way to see the seasonal variations in climate is to plot each type of weather on a graph. You can do this quite simply from your Spreadsheet unless you have a I MB computer.
(If you are using a I MB computer. please refer to Appendix B Using Advance on I MB or 2MB computers on page 303 of the Advance User Guide. The file GraphDatal in the Proj ectl directory contains the plot data you need )
Selecting plot data Switch the row and column labels back on by choosing Utilities/Labels.
2 Select rows 3 to I 5 by clicking on row label 3. and then clicking Adjust on row label 15.
3 You now need to specify whether you wish to send the data to the Graph tool as row data or column data. Your data is organised into columns. so choose Utilities/Graph type/Plot columns.
When you go to the Graph window from the Database or Spreadsheet the selected data is automatically copied by the Graph tool and is ready to be displayed (If no data is selected. all data is copied.)
21

PloNing a graph of the climate changes through the seasons
22
Opening the Graph tool
Open the Advance Graph tool from the Spreadsheet by choosing Utilities/Graphs. This displays the Graph window. On the left side of the Graph window is the Graph toolbox This allows you to choose which data to plot. and the type of graph to use to plot that data.
Toolbox button action
I X data displays a menu of fields you can plot on the X-axis
I Y data displays a menu of fields you can plot on the Y-axis
~ Pie selects a pie chart
lscatttriEJ Scatter selects a scatter graph
I Bar I~ Bar selects a bar chart
I Line 1!8 Line selects a line graph
• 20 20 selects 20, 30, or outline for graph display
I Drill Draw draws the graph in the graph area
I Clur Clear deletes the graph in the graph area, and clears any data in the X and Y buttons
When you go to the Graph window from the Database or Spreadsheet the selected data is automatically copied by the Graph tool and is ready to be displayed (I f no data is selected. all data is copied )
Creating graphs from the Spreadsheet is described in detail in the Advance User Guide under Displa!Jing results as a graph on page 114, and under More on grapf1s on page 189
Plotting a bar chart of monthly rainfall data
To plot the area monthly rainfall data:
I Click on the X data button. This displays a list of all the fi elds in the database.
1110
I hours of sunshine I h1111erature I total rainfall
Project 1: Investigating seasonal variations in climate in the UK
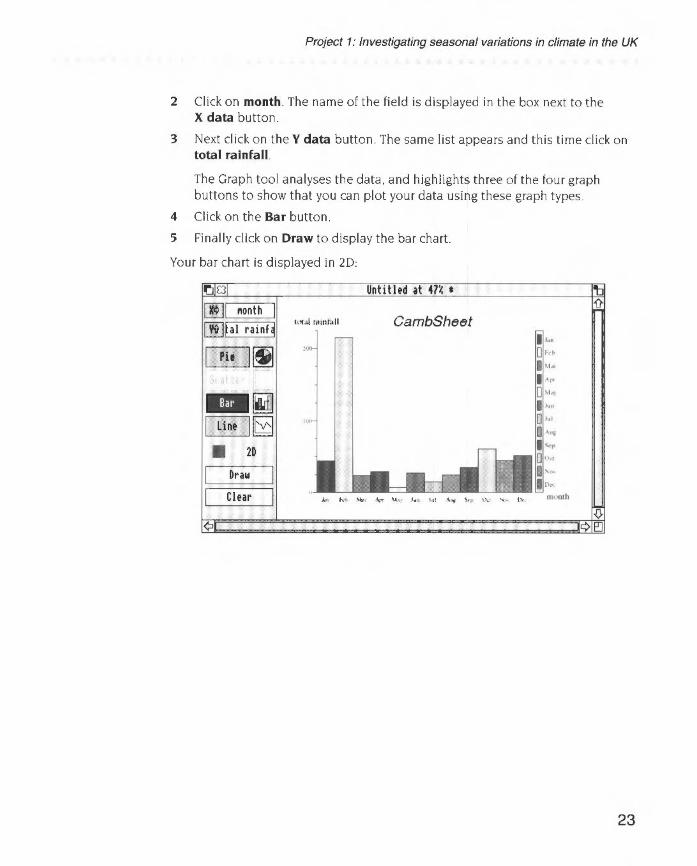
2 Click on month. The name of the field is displayed in the box next to the X data button.
3 Next click on the Y data button. The same list appears and this time click on total rainfall.
The Graph tool analyses the data, and highlights three of the four graph buttons to show that you can plot your data using these graph types.
4 Click on the Bar button.
5 Finally click on Draw to display the bar chart.
Your bar chart is displayed in 20:
[IDI 111onth [li]~al rainq
Pit I~
~ .--L-in-t -,I B
• 20
I Draw
I Clm
¢
Untitled it 47% •
CambSheet
23
Plotting a graph of the climate changes through the seasons
24
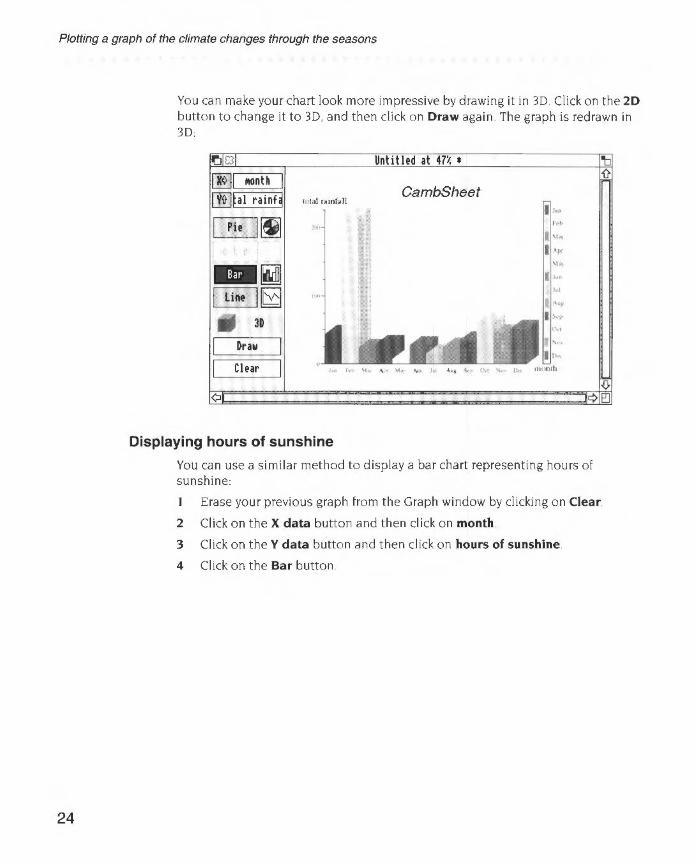
You can make your chart look more impressive by drawing it in 3D Click on the 20 button to change it to 3D, and then click on Draw again The graph is redrawn in 3D
~~ 110nth
[illfal rainq '""'lr.nnbll
Pie ~~
Clear
Displaying hours of sunshine
Untitled at 47% •
CambSheet
•··· I "• I .,.
" I '·•
, ..
You can use a similar method to display a bar chart representing hours of sunshine:
Erase your previous graph from the Graph window by clicking on Clear
2 Click on the X data button and then click on month
3 Click on the Y data button and then click on hours of sunshine
4 Click on the Bar button.

Project 1: Investigating seasonal variations in climate in the UK
5 Finally click on Draw to display the bar chart.
001 110nth
(!!]Is of suns! "'""' ,, 'un"""'"
Pit I~
,..------,~ I Lint liE! • 3D
I Draw
I Clear
¢
Untitled at 47% •
CambSheet
Your chart is automatically drawn in 3D. as 3D remains set.
. .... ,,.
IU('flth
6 Toggle the 3D button back to 2D by clicking on it twice. This toggles it from 3D to Outline. and then to 2D.
7 Click on Draw again to redraw the graph in 2D
Stacking bar charts to compare hours of sunshine with temperature
You can display more than one type of data on a graph Overlaying graphs on top of each other allows you to compare trends and variations in data
You currently have a bar chart representing monthly hours of sunshine. Now you'l l add to this a bar chart representing average daily temperature
I Click on the Y data button. The standard l ist of fields appears as before. This time click Adjust on daily temperature. 1\vo fields are now ticked.
¥ JxiSI <Hone>
~ I hours of sunshine ~ I tei!IPerature
I total rainfall
25

Plotting a graph of the climate changes through the seasons
2 The X data field sti ll shows month. so you just have to click on Draw:
26
001 MOnth rn:Jiunshine, tl
~ line I~
• 2D
I Draw
hi. •ur~ ol M lrl..JHI'h'
((>1\[X' !l\1\lll.' :t
"
I
Untitled at 4 % •
CambSheet
I I I I Clear .t. .. httt
' "'' A:;..- ''•:- J.11t l>.~ l Aus Sq1 0
¢
Drawing a line graph
You can also display your data as a line graph
Click on the Line button.
2 Click on Draw to display the line graph.
~1£31 Untitled at 47% •
~I Month I hou~ of sunshtll<'
~lunshine,tj lein[X'IlUUK' CambSheet
1i--
p ,&. ·' /'~ ,
\ I'«·~ ...
I ~ ... I"-
/ ~ • \..\
I, lar I~ \ II>-I
I
~-~ /'~ ..---. \ .~
• 2D /./ \v "'---- " I Draw I ~--
0
~ ........ ~=~···
motllh
~h~· ~ ·-· lt>~urrnh~
0\(lfllh I Clear I "" ~"' M~t ..... "" ,. ,,, ,.,, ~, <A• ' '" (),,
¢•
'b
{). ¢ e::J
'b '{}
{). ¢e::J
Project 1: Investigating seasonal variations in climate in the UK
It's a lot easier to see the seasonal differences in the data from the charts and graphs you've drawn.
For more on types of graph please refer to the Advance User Guide under Selecting the nqf1t grapf1 on page 281 .
Editing text on a graph
You can print a graph whenever you like. Before you do. it's a good idea to change the title to make it more informative.
By default, the Graph tool uses the filename of the spreadsheet. database. or CSV file as a title for the graph. To change the default title:
I Move the pointer over the title and double-click on it. A caret appears in the text.
2 Double-dick on the title aga in to select it.
3 Change the title to Sun and tempera Lure.
4 Change your title to bold text by triple-clicking on your title to select all the text and then choosing Effect/Bold .
Note Changes to text are not saved when you draw a new graph, so only change text when you' re satisfied with the rest of the graph
More information on editing graphs can be found in the Advance User Guide under Editing a graph on page 292.
Printing a graph
To print a graph.
I Make sure that a suitable printer is correctly connected and set up, and that the ! Printers application is loaded onto the icon bar (the RISC OS 3 User Guide describes this). If you have a I MB computer and wish to print. please refer to Using Advance on I MB or 2MB computers on page 303 of the Advance User Guide.
2 Make sure that the graph you wish to print is displayed in the Graph window.
3 Click somewhere in the Graph window (this makes sure that data is printed from the Graph window. not from any other window you might have open at the time).
4 Go into the Print box by choosing File/Print.
5 Type in the number of copies you want and click on Print
The graph displayed on the screen will be printed.
27
Writing a report
Saving a graph
You can save a graph in two formats; as Graph data or as a Draw file You'll be saving your graph as a Draw file.
Saving a graph as a Draw file
Saving a graph in Draw file format gives you a permanent record of the current graph. exactly as it's displayed on the screen. You can edit and annotate the Draw file using any of Draw's tools.
Save your graph as a Draw file:
I Go into the File/Save as Draw dialogue box and type in an suitable filename. (Note that this file is already saved as Drawl in the Proj ectl directory.)
2 Drag the icon to your directory display.
Note: Graphs saved as Draw files can take up a large amount of storage space. so make sure that you have enough space available on your disc.
Saving a graph as Graph data
A Graph data file contains all the data needed to redraw a graph, and any format settings (like text font and colour) but discards any edits you've made to the text
You don't need to do this now. but here's how to save a graph as a Graph data file: Go into the File/Save as Graph dialogue box and type in the filename. then drag the icon to your directory display
The file GraphDatal in the Projectl directory contains the data from your CambSheet spreadsheet file.
Closing files and freeing up memory
You won't need to use the Spreadsheet or Graph tools again during this project. so you should now close your open file(s).
Then click Menu on the Advance icon on the icon bar. and choose Minimise memory.
Writing a report
28
You can use the Advance Word Processor to produce a written report about the seasonal weather variations in your area.
Before you start work. you need to decide what you want to include in your document. and how you want it to look. As well as some text about what you've learned. you'll want to include some examples of the work you've done using the Advance Database. Spreadsheet and Graph tools

Project 1: Investigating seasonal variations in climate in the UK
You'lllay your document out as shown here:
text r text
table graph
text
page number
Creating a new document
To create a new Word Processor document. click Select on the Advance icon on the icon bar. A blank document appears. Click on the Toggle size icon to make the document fill the screen.
Scaling a document
By default. a document is displayed at ful l size (I 00%) It's often easier to work on a document when it's scaled in size (either to fit more on the screen. or to zoom in and get a closer look at something). Scale your document so that it's displayed at 80% of its full size.
Choose Utilities/Scale view.
2 Click on 80% and then on Scale.
29

Writing a report
30
Changing the page size
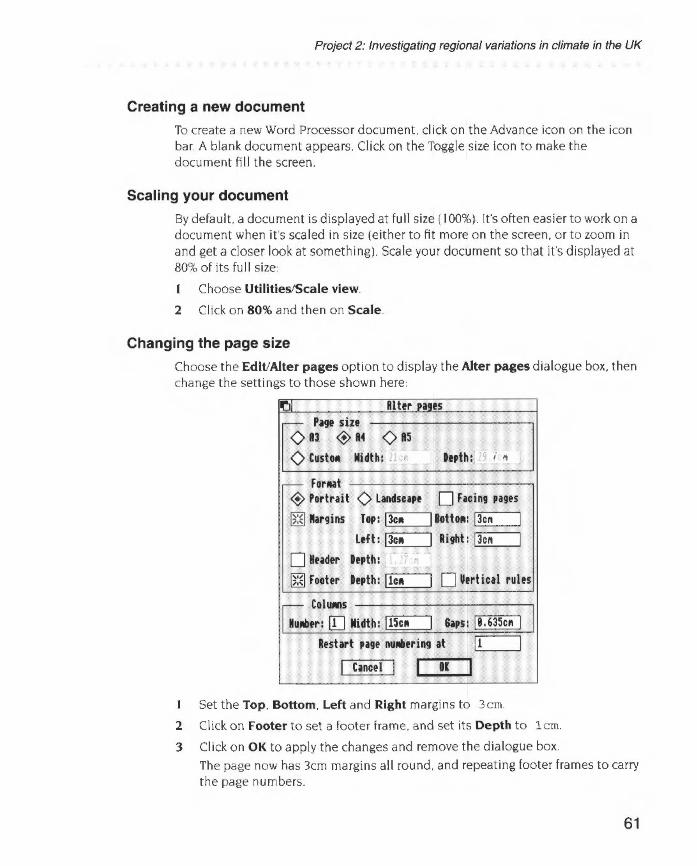
Choose the Edit/Alter pages option to display the Alter pages dialogue box. then change the sett ings to those shown here:
I~ Rlhr PittS
- Pi9e sin <> 13 ~ ·· <> 85
0 Custoa ltidth: Depth:
- For..at ~ Portrait 0 Landscape c=J Facing pages
~ llargins Top: l3ca I Botto11u l3cfll I Left: l3clll I Right: l3cfll I
0 Htader Depth: l "
~ Footer Depth: llc111 I c=J Utrtical rults
·~ Colu111s Mtr: [[I ltidth: l15clll I 6aps: 18. 635clll I l
Restart page nuMering at II I I Cancel I I OK I
I Set the Top. Bottom. Left and Right margins to 3cm
2 Click on Footer to set a footer frame. and set its Depth to lcm
3 Click on OK to apply the changes and remove the dialogue box.
The page now has 3cm margins all round. and repeating footer frames to carry the page numbers.
Choose File/Save. give your report an appropriate name and drag the Save icon to your directory display
Importing files into a document
You can import various file types including Ed it files (plain text). CSV files (the file format you used to save your subset data) and Draw fi les (the fi le format you used to save your graphs)
The method used for importing all types of file is the same- you simply place the caret where you want to insert the file, then drag the file's icon from a directory display into the text frame of the open Advance Word Processor document. As long as the file type is one that the Word Processor can understand. the file is added at that point.

Project 1: Investigating seasonal variations in climate in the UK
Importing text. graphics and data are all covered in detail in the chapter Learning more about the Word Processor on page 4 5 of the Advance User Guide
Importing text
There is some sample text in the file Textl which is in the Projectl directory of Advance Data disc B. To import this text into your report. simply select the file Text 1 and then drag the file icon to your open document. When you release the mouse button. the text appears in the document window You can of course write your own report. either in the Advance Word Processor. or in plain text which you can import.
Formatting text
To improve the look of your text. you need to change the appearance of the heading.
Select the heading by triple-clicking on it. then choose
• Effect/Text size/24 to make the text larger.
• Effect/Bold to make the heading bold .
• Effect/Alignment/Centre to centre the heading on the page.
Save your work.
Text editing techniques are explained under Chat1ging the appearance of the text on page 28 of the Advance User Guide.
Importing data
To import your spreadsheet data into the Word Processor
I Place the caret in the document at the point at which you wish the data to appear. as shown here:
place the caret here
c '-tlldied data foroor lo<.-al area w~l'll!r MaLiol'l. and 1\a\C found tnat the e ~r Cllall8e'S 111 ith the seasort..
lbro the follo'l'ing data in our ~nld}. 'allk- Ql ~e.-her ua
31
Writing a report
32
2 Then select the CSV file camb_csv (wh ich you created earlier) and drag the file icon to your open document.
3 Release the mouse button to drop the data into the document window.
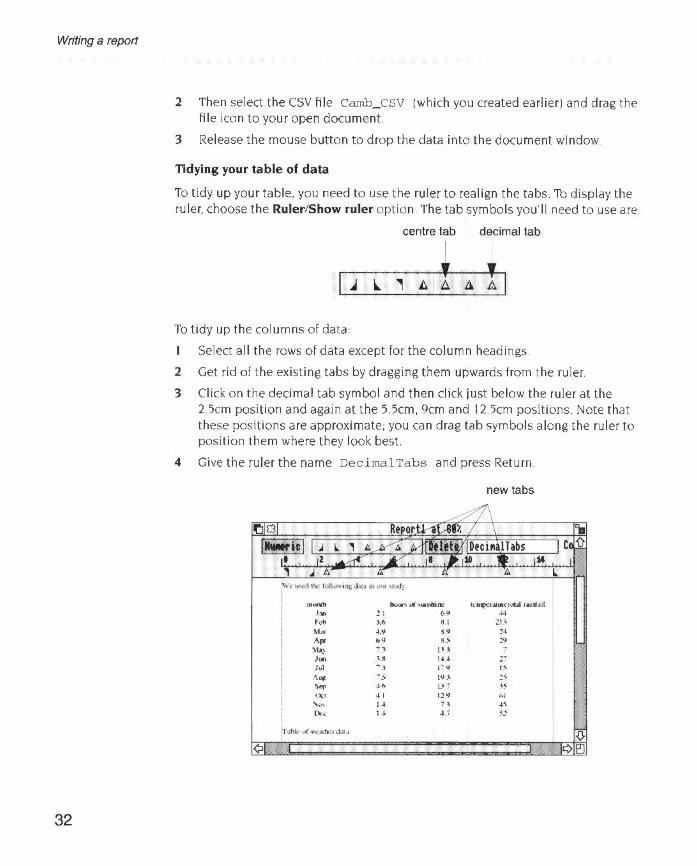
Tidying your table of data
To tidy up your table. you need to use the ruler to realign the tabs To display the ruler. choose the Ruler/Show ruler option. The tab symbols you'll need to use are:
centre tab decimal tab
To lidy up the columns of data:
I Select all the rows of data except for the column headings
2 Get rid of the existing tabs by dragging them upwards from the ruler
3 Click on the decimal tab symbol and then click just below the ruler at the 2.5cm position and again at the 5.5cm. 9cm and 12.5cm positions Note that these positions are approximate; you can drag tab symbols along the ruler to position them where they look best
4 Give the ruler the name Decimal Tabs and press Return
new tabs
••ood> ~ot .. wrh!ln..· ,,;f~f-~14.C.I.lf•U\I.!II , ... ! I <·~ .t-1 f'<t> ,\ {) H 21.\ ~~"' J\1 ~<I ;!.t
''"' i')9 s~ 1'1 ~Ia) ;3 Ill 7 Jun ).8 Ill Z1 Jul ... l .~ 11
''"~' -~ ~~' 1'\ Sq> .. ~ '" " (XI dl 1211 M
'"' I .I '.\ l~ lle< I~ 47 ~:
rr..,.., .,( •eaher .i.IIJ

Project 1: Investigating seasonal variations in climate in the UK
5 Next select the table's column headings only, and drag the existing tabs off the ruler
6 Click on the centre tab symbol and then click just below the ruler at the 2.2cm position and again at the 5.5cm, 9cm and 12 2cm posit ions.
7 Give the ruler the name CentreTabs and press Return
~101 Report! at 81% • 'II l••icii .J l , to t. ll. A llltlttti iCentrelabs I Ca ~ ,. .ll 14 .I ' .I. .111 .lu .lu .I , .Jt. t. t. t. l
" e t-.ed me (.,lolfoo,nng dau in (U ~tOO)
I fOOOih boub ot ... uel'obinr u:n~rcu.n. •••Ill •• lnloll .....
J;on 2.1 6.Y 4~
I'd> .16 ~ l ~l$
M• ... ~ ~.~ :!,1
API' 6.~ H~ :!II M .A) v 1.\. \ ' J, .. ~JI I~ 4 :!7 Jut 7 •. 1 11'1 IS
~ Aut 1S I IH .'!5 ¢1 't It I¢ e:J
8 The table headings are still selected, so you can now change the font by choosing Effect/Bold.
9 Finally, put the cursor at the end of the word rai n fa 1 1 and press Return.
Your table now looks much neater.
I 0 The line of text below the table is a caption which goes with the table. Select this line of text . and change its font to Italic. and its alignment to Centre.
I I Save your work.
Importing graphics To import a graph into your report. place the caret where you want the graph to appear, as shown here:
place the caret here
otlin'ing gr.rph sbo\\s tbal' is is warm "-OO MUlllj in the ~lHnmer. and cold '1\ i1h ft-\'iet hour.. or sunshine in the'~ int:er.
'raph of letn()CI'lllllte :tnd SUllS rune
l'he data SOO">'ll Wb measurro in bows fOI' ~Wbhioc . ;uxl dqve~ Cc~j!J) for ~mpe rature.
2 Select the Draw file Drawl and drag the file icon to your open document.
33
Writing a report
34
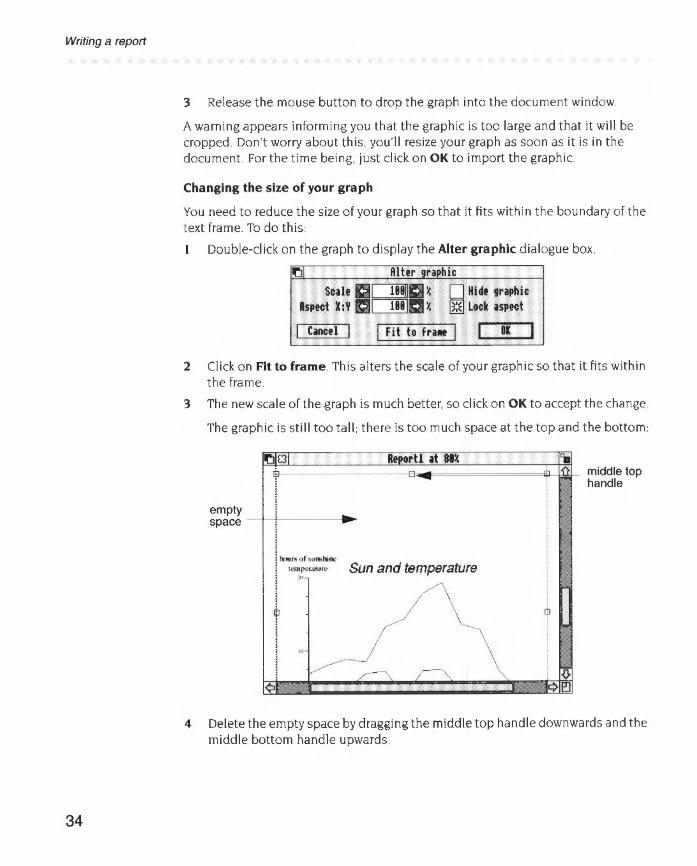
3 Release the mouse button to drop the graph into the document window.
A warning appears informing you that the graphic is too large and that it will be cropped Don't worry about this; you'll resize your graph as soon as it is in the document. For the time being, just click on OK to import the graphic.
Changing the size of your graph
You need to reduce the size of your graph so that it fits within the boundary of the text frame. To do this:
Double-click on the graph to display the Alter graphic dialogue box.
~I Rlhr mPhic Scilt l:l~a ~ 0 Hide griphic
Aspect X:Y I:ICJ:rna% ~ lock upect
I Cancel I I Fit to fra111 I OK
2 Click on Fit to frame. This alters the scale of your graphic so that it fits within the frame.
3 The new scale of the graph is much better. so click on OK to accept the change
The graphic is still too tall; there is too much space at the top and the bottom:
~101 lfportl at II% 'it lil {)> middle top ...
handle
empty -space ! ...
I ~~ooo .. .,r >U"'"'"" Sun and temperature ! tcnptnt~~>re ~·
!
-~ ~ r
i
I I v---· \
_r-··" r' I .0. ¢- ¢1P"
4 Delete the empty space by dragging the middle top handle downwards and the middle bottom handle upwards.

Project 1: Investigating seasonal variations in climate in the UK
5 The line of text directly below your graph is a caption which applies to the graph Select this line of text. and change its font to Italic. and its alignment to Centre as you did for the last caption
6 Save your work.
Inserting a page break
Your graph was too large to fit on the first page of your report. so Advance automatically created a second page. and placed the graph at the top of this page. The paragraph before the graph explains what the graph is. so it really needs to be on the same page as the graph.
To move it to the next page:
Place the caret at the beginning of the paragraph.
2 Choose Utilities/Insert/Column/page break to move it to the top of the second page.
llr'd(31 :t'hti\:ill09:;rl~Ji3Ph'~...,_:;ih;;i''i~;;·••·n. .ad'~ ·mlfw,un .. nr;::AJ~Okf'~'fd\'""1 ~ ~um: k\la boo~ot t"UI.,.hint: all thl: •w.u. ; r'f'1 1 j :···················.
I""~ Sun and tom';:,aturo
/~ ~v~, ~\
/ \VI
/ '--
+-~~~~~~~----~~~-.~~m: - ,. "'• • ,..... .... )A ""'' 1,. '\t ' - lirw· .
~··························c;~;",j--;;,;;~·;~:~;;A,;;;:",;;.i·;;;;~;;,~;.~· ... '1 ¢ (,'
Inserting a page number To add the page number to the bottom of each page go to the footer on the first page. (You can do this by double-clicking on any footer.)
2 Type Page and then press Space.
35

Quitting Advance altogether
3 Choose UtJiitiesllnsert/Page number.
The page number is inserted in the footer frame It is currently aligned to the lefthand side of the footer.
4 Double-click on the footer text to select it. and then choose Effect/ Alignment/Right align.
Checking the spelling
It is always wise to check your work for spelling mistakes when you've finished working on it. To do this. position the caret in the text and select the Utilities/Spelling/Check entire text opt ion. (This option checks all the text in a document. starting from the beginning.)
A dialogue box may appear warning you that the spelling checker has not yet been loaded. Click on SPELL to load the default spelling checker.
• If a spelling mistake is found. a dialogue box is displayed. and you can correct your mistake before continuing with the check.
• If no mistakes are found, the cursor simply moves to the end of the document
Save your work.
Printing
When you've finished your report. you can print it out
Make sure that a suitable printer is correctly connected and set up. and that the ! Printers application is loaded onto the icon bar (the RISC OS 3 User Guide describes this) . If you have a I MB computer and wish to print. please refer to Using Advance on I MB or 2MB computers on page 303 of the Advance User Guide.
To print you r report. choose File/Print and then click on Print in the dialogue box.
Quitting Advance altogether
36
To quit Advance altogether. press Menu on the Advance icon on the icon bar and then choose the Quit option
Summing up
Project 1: Investigating seasonal variations in climate in the UK
You've now finished your report on seasonal climate variations in the UK and have reached the end of Project I .
In this pro ject you have used the Advance Database, Spreadsheet Graph and Word Processor tools. and have learnt how to search for a group of records. transfer data to a spreadsheet, plot graphs from your data. and create a document containing examples of your work.
In the next project you will use more of the data in the weather database to investigate regional va riations in climate
37

Summing up
38
3 Project 2: Investigating regional variations in climate in the UK
In this project. you'll use Advance to compare climate data for four regions in the United Kingdom. You'll discover regional patterns in data and relate these to the UK climate quadrants. You can either use the data supplied with Advance or data you've collected for your own area.
The examples in this project use data supplied on Advance Data disc B.
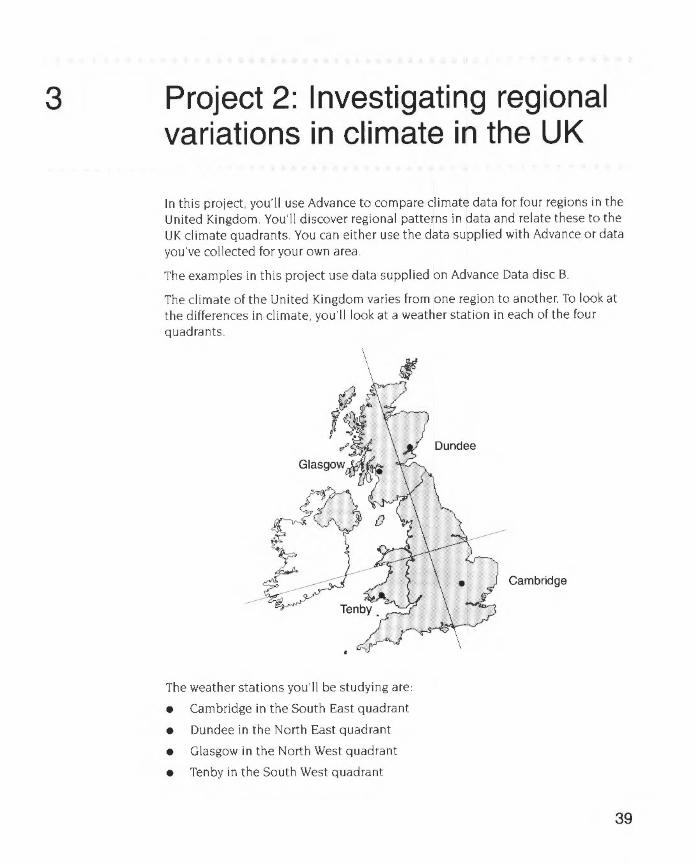
The climate of the United Kingdom varies from one region to another. To look at the differences in climate, you'll look at a weather station in each of the four quadrants.
Cambridge
The weather stations you'll be studying are:
• Cambridge in the South East quadrant
• Dundee in the North East quadrant
• Glasgow in the North West quadrant
• Tenby in the South West quadrant
39

Getting started
Getting started
Load Advance into your computer and open the Advance weather database. WeatherDB, as explained in Getting started on page 3
Searching for several weather records
40
To examine the data for a group of weather stations, you need to search for all the records for that area. and then save them as a subset o f the database
To enter the Search window choose Utilities/Search or press F4 The Search window then appears:
WeatherDB at 188% 'b
1990 ~Whole l database
;. -·her $1alion
"''emge daily hou~ ul wmhme 11
~Add
~\. U\ en~g~ tlall~ tcm(IC!r••urc
0 011it nHt\llllUI1l tcmpcro•ur\!'
rrummt•n tcmpcr.•ur(
I tined I u•..l r:unlwl mm
I Starch I d~' "llh ,..., ...
d~, .. uhhwl
d .. ~,. .... th ttolnckr
dty>WIIh I<~
¢
The records you want to search for are those for Cambridge, Dundee, Glasgow and Tenby. You can search for these in turn , or you can use the OR operator to search for them all at once.
Using operators to make searching easier is explained in the Advance User Guide under Finding data using operators on page 233.
Project 2: Investigating regional variations in climate in the UK
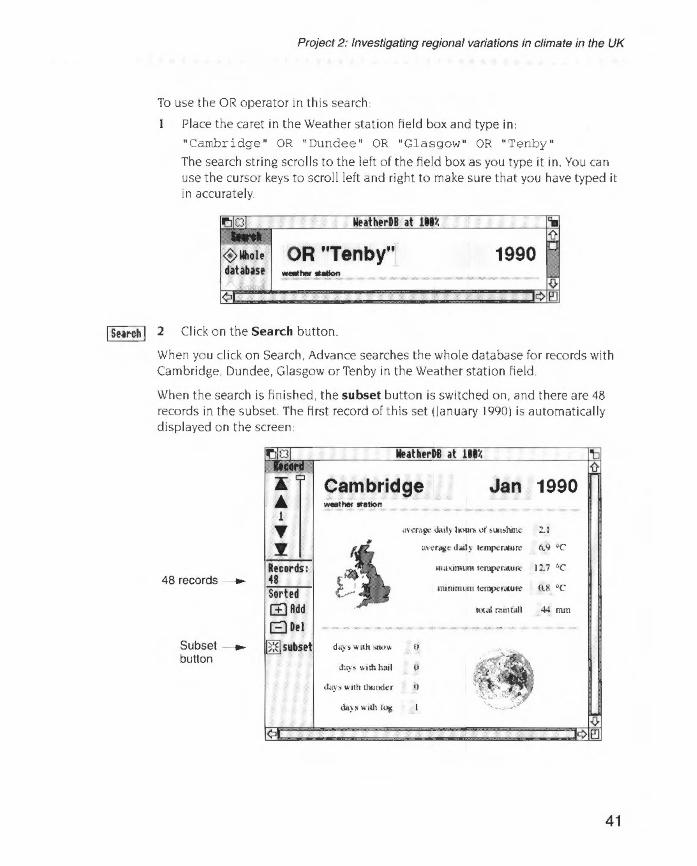
To use the OR operator in this search:
Place the caret in the Weather station field box and type in:
"Cambridge " OR "Dundee" OR "Glasgow" OR "Tenby" The search string scrolls to the left of the field box as you type it in . You can use the cursor keys to scroll left and right to make sure that you have typed it in accurately.
OR "Tenby" 1990
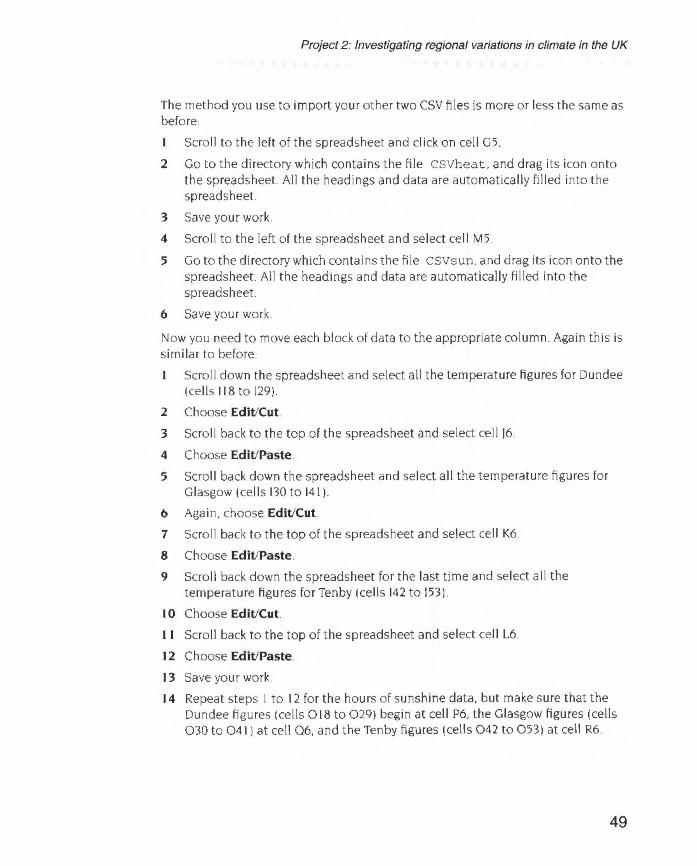
I Search I 2 Click on the Search button.
When you click on Search, Advance searches the whole database for records with Cambridge, Dundee. Glasgow or Ten by in the Weather station field .
When the search is finished, the subset button is switched on. and there are 48 records in the subset. The first record of this set (January 1990) is automatically d isplayed on the screen:
48 records~ bcords: 48 Sorted [±)Add GDfl
Mr~therDB at 11 %
Cambridge Jan 1990 - •'* lletlon
.tv em~ dati~ houl"> ol MtH>hme 2.1
~\ :tvent,ge dad> temperature (1,9 "C
ma .. mum t<:ntp<'r.llu~ 12.1 •c nunnnum kn~mtu~ 0.8 °C
~~~JI rnmtrul 44 mm
Subset~ ~subset day .... uh~nv~< o
button day> wtth hnol 0
da)' "''" ''"'
'tl
41

Getting your subset data into an Advance spreadsheet
Saving your regions subset
Choose File/Save, or press F3. Use the Delete key to rub out the default name SubseL and type regions (or some other appropriate filename) into the dialogue box. Then drag the icon to your work directory.
Quitting the main database
You've now finished working with the whole database. To close the database. click Select on the Close icon
Close icon
t ~LQL
Cambridge Jan 1990 waihef . atlon
Getting your subset data into an Advance spreadsheet
42
Now that you have a subset of cl imate records for each region , you're going to copy some of the data into a spreadsheet Th is will allow you to compare more easily the monthly figures for temperature. rainfall and hours of sunshine.
Saving your subset as a CSV file
To copy data into a spreadsheet. the data must be in a form that the Spreadsheet can understand . You'll use CSV file format to save the data.
You need to save your data into three separate CSV files; one file for each type of weather:
2
Open your subset file by double-clicking on its icon.
Choose File/Save as/CSV.
Move the pointer over the Fields box. and when the pointer changes into a small menu icon. click Select. This displays the Fields menu l isting all the field names in your subset file.

Project 2: Investigating regional variations in climate in the UK
4 Drag this list over to the left of your screen so that it doesn't obscure the Save CSV dia logue box.
Headings hours of sunshine te11111erature r.~mf,,JI
~axi~u~ te~perature
~ini~u~ te~erature
total rainfall days with snow days with hai I days with thunder days with fog
You can see that all the field names in the Fields dialogue box are currently selected
5 Your first CSV file will contain the data for weather station. month. and rainfall Click Adjust on each unwanted field name to remove the tick against it
When you have finished. your list shou ld look like this .
Fulds ,I weather stat ion ./ Mnth
hours of sunshine te~perature
~axiMu~ te~perature
~ini~u~ te~perature ./total rainfall
days with snow days with hail days with thunder days 11ith fog
6 Move the pointer back into the Save CSV dialogue box. and give your file a su itable name such as csvra in. Drag the CSV icon into your working directory display to save it.
43

Getting your subset data into an Advance spreadsheet
44
7 Your second CSV file will contain the data for weather station. month and hours or sunshine. Click Adjust on hours of sunshine to select it. and then click Adjust on total rainfall to remove the tick against it. Your list shou ld look like this:
.IlUdl .tweather station ./Month ./hours of sunshine
telllflerature ..axiiiUII hiiiPerature 11ini11U11 tfiiPtrature total rainfall days with snow days with hail days with thunder days with fog
8 Move the pointer back into the Save CSV dialogue box. and give your file a suitable name such as CSVsun. Drag the CSV icon into your working directory display to save it.
9 Your third CSV file will contain the data for weather station . month and temperature. Click Adjust on temperature to select it. and then click Adjust on hours of sunshine to remove the tick against it. Your list should look like this:
Fttltls ./we at her station ./110nt h
hours of sunshine 1.1 hiiiPerature
Ma xi iiUM teMPerature MiniiiUII teMPerature tota l rainfall days 11ith snow days 11ith hail days 11ith thunder days 11ith fog
10 Move the pointer back into the Save CSV dialogue box. and give your fi le a suitable name such as csvhcaL. Drag the CSV icon into your working directory display to save it
Now close your subset file by clicking on the Close icon.
Freeing up memory
You won't need to use the Database tool ror a while. so it's wise to tell Advance not to save any computer memory for it. To do this. click Menu on the Advance icon on the icon bar. and choose Minimise memory.

Project 2: Investigating regional variations in climate in the UK
Creating a spreadsheet for your data
I Click Menu on the Advance icon on the icon bar, and choose Create/Spreadsheet.
This displays a blank spreadsheet file You' ll start by adding some headings to the spreadsheet
2 Select cell B I . and give your spreadsheet the title Regional climate data for 1990.
I Jl 3 Click on the Enter button to accept you r t itle.
4 The first file of data you'll import is the file CSVrain, so click on cell C3, and type the main heading Rainfall in mil l imet res and press Return
5 Cell C4 is now selected. Type Cambridge then press Tab.
6 Next type Dundee and press Tab aga in.
7 Then type Glasgow and press Tab
8 Your last region heading is Tcnby. Type this and then cl ick on the Enter button.
9 Last ly, select cell 84, type Month and click on the Enter button
Your spreadsheet should look like this
£3 Untitltd at 188% • Month
¢
4
5
0
Rcgu.Jnal c lnmuc d.c.l for I WO
R:unlal l m rnillimeu~'
E F
45

Getting your subset data into an Advance spreadsheet
46
Adding rows
By default a new spreadsheet has 28 rows. You need to add more rows to your spreadsheet before you import your CSV file. so that there are enough rows for all your data.
l Click on a cell which is below all the text you have typed in so far (cell A5 for example).
2 Add 25 rows to the spreadsheet by choosing Edit/Rows/Add rows. and giving thevalue 25
Importing your data Click on cel l A5. This is the cell which will be the top lefthand corner of your imported climate data.
2 Go to the directory which contains the file csvrain. and drag its icon onto the spreadsheet. All the headings and data are automatical ly filled into the spreadsheet:
~101 Untitled at 111% • .. wathtr station '!)-
I AS I ~~ El~lilll A B c 0 E F
I RegkVI.d chmalC d ••• , lor I <Mt
2
3 Ratnf(~ I m nullunctn:s
4 Mooth C.unbrtdj!C Dundee Glasgow Ten b)
~ nK>nth totalraonfall
6 Cambridge Jan 44
7 Collllbridge Feb 215
II Cambndge Mar 24 ~ ¢ l¢e::J
3 It's always sensible to save files regularly. Save your spreadsheet file now. Choose File/Save, give your file the name RegionsSH and drag the Save icon to your directory display
~ 4 Click Select on the Toggle size icon to see more of the spreadsheet

Project 2 : Investigating regional variations in climate in the UK
Formatting your spreadsheet In order to be able to compare your figures using the Graph tool. you need to move some of the data:
Scroll down the spreadsheet and select all the figures for Dundee (cel ls C18 to C29)
'II i}
I Ql[8] 0~[Q] OK A B (' D
17 C•nbodg~ n.-. 52
·~ Oun<ke .J.m
1'1 Dundee h:h
~0 Otul<l.x .M .. :I Dundee Apr
2~ Otmdee \1.1~
~J Dund~ Jun
:!~ 01111<1<~ Jul
25 Duoo<oe Au~
1(• Dundee s~p
!7 Oundec 0..'1
2K DunJee ~)\
1') Dundee o.:. 3(1 Gla't!O"' 1:111 2(1() -().
¢ Q
2 Choose Edit/Cut
3 Scrol l back to the top o f the spreadsheet and select cell D6
4 Choose Edit/Paste
5 Scroll back down the spreadsheet and select all the figures for Glasgow (cells C30 to C4 1 ).
6 Again. choose Edit/Cut.
7 Scroll back to the lop of the spreadsheet and select cell E6.
8 Choose Edit/Paste
9 Scroll back down the spreadsheet for the last time and select all the figures for Tenby (cells C42 to C53)
I 0 Choose Edit/Cut
It Scro ll back to the lop o f the spreadsheet and select cell F6.
12 Choose Edit/Paste.
47

Getting your subset data into an Advance spreadsheet
48
Your spreadsheet now looks l ike this:
R¢:giontd dimat<) diAI.a (<>r 1990
2
J Rainfall in millimetre~
4 Month C<nnbl'id:gc Dundee Gla;go\\ Tenb~
5 w..-athcr 6tafi month rtKal rainfall
(j C;>mbt"id:ge .Jan 44
7 C:mbt"idg¢ 'Feb 215
8 , Mar 24
9 Apr 29
tO Ct>mbrid:ge May
II C.ombrtdge :Jun 27
Your rainfall data is now organised into a neat table. The spreadsheet still needs further editing, but at this stage it is better to add the remaining data. You can then do all your final editing in one go.
Adding more CSV data to your spreadsheet
Your spreadsheet has l 0 columns by default You need to add another eight columns to your spreadsheet before you import your next CSV file, so that there are enough columns for the data.
I Click on a cell which is to the right of all the data in your spreadsheet (cell G l for example).
2 Add eight columns to the spreadsheet by choosing Edit/Columns/Add columns, and giving the value 8.
3 To copy across the weather station headings, select cells C4 to F4, and then choose Edit/Copy.
4 Then click on celll4, and choose Edit/Paste.
5 Scroll across to cell 04, and choose Edit/Paste again.
6 Save your work.
Project 2: Investigating regional variations in climate in the UK
The method you use to import your other two CSV files is more or tess the same as before:
Scroll to the left of the spreadsheet and click on cell C5.
2 Co to the directory which contains the fi le CSVheat . and drag its icon onto the spreadsheet. All the headings and data are automatical ly filled into the spreadsheet.
3 Save your work.
4 Scroll to the left of the spreadsheet and select cell M5.
5 Go to the directory which contains the file CSVsun. and drag its icon onto the spreadsheet All the headings and data are automatica lly filled into the spreadsheet.
6 Save your work.
Now you need to move each block of data to the appropriate column. Aga in this is similar to before:
Scroll down the spreadsheet and select all the temperature figures for Dundee (cells 118 to 129)
2 Choose Edit/Cut
3 Scroll back to the top of the spreadsheet and select cell 16.
4 Choose Edit/Paste.
5 Scroll back down the spreadsheet and select al l the temperature figures for Glasgow (cells 130 to 141 ).
6 Again. choose Edit/Cut
7 Scroll back to the top o f the spreadsheet and select cell K6.
8 Choose Edit/Paste.
9 Scroll back down the spreadsheet for the last time and select all the temperature figures for Ten by (cells 142 to 153).
I 0 Choose Edit/Cut
II Scrol l back to the top of the spreadsheet and select cell L6.
12 Choose Edit/Paste.
13 Save your work.
14 Repeat steps I to 12 for the hours of sunsh ine data. but make sure that the Dundee figures (cells 018 to 029) begin at cell P6. the Glasgow figures (cells 030 to 041) at cell 06. and the Ten by figures (cells 042 to 053) at cell R6
49
Getting your subset data into an Advance spreadsheet
50
You now have all your data in the table. but there are a couple o f headings missing:
Select cell13 and enter the heading Temperature in degrees Celsius.
2 Select cell 03 and enter the head ing Hours of sunshine.
Deleting unnecessary data
There is now quite a bit of excess data in your spreadsheet (data which came across in your CSV files. but which you no longer need). To get rid of this. you need to delete some rows and columns.
Each time you need to delete cells. save your work before deleting Then. if you make a mistake while you're deleting, you should simply close your spreadsheet without saving it. You can then open the file again to get the spreadsheet back to its previous state.
Deleting rows
The easiest way to delete a row is to select all the row labels for the rows you want to delete Be careful to follow these steps in the correct order. as cell labels can change following a delete instruction.
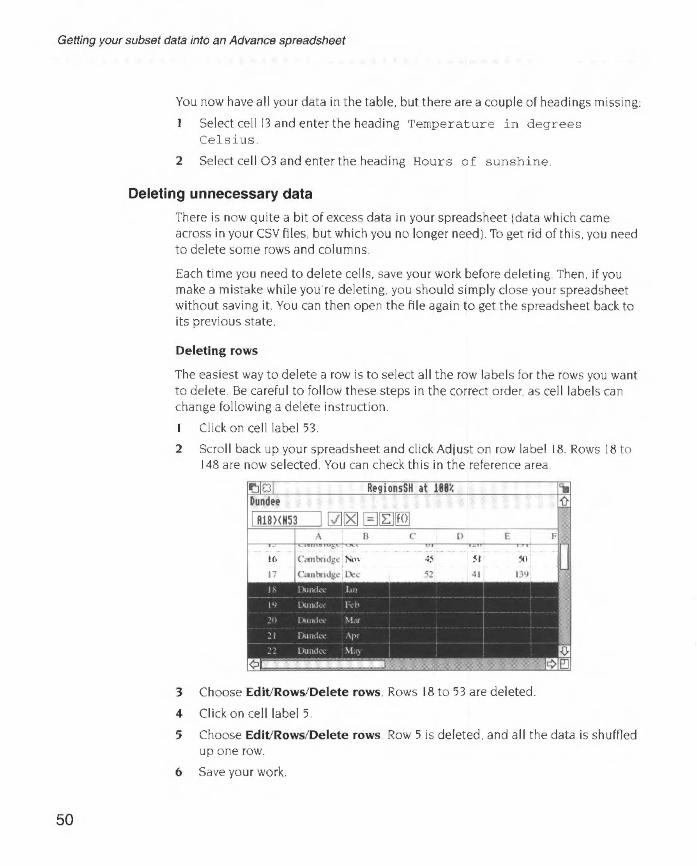
I Click on cell label 53 .
2 Scroll back up your spreadsheet and click Adjust on row label 18 Rows 18 to 148 are now selected. You can check this in the reference area.
3 Choose Edlt'Rows/Delete rows Rows 18 to 53 are deleted.
4 Click on cell label 5.
5 Choose Edlt'Rows/Delete rows Row 5 is deleted. and all the data is shufned up one row.
6 Save your work

Project 2: Investigating regional variations in climate in the UK
Deleting columns
You can now delete the unnecessary columns. Again. be careful to follow these steps in the correct order. as cell labels can change following a delete instruction
I Select on cell label A.
2 Choose Edit/Columns/Delete columns. Column A is deleted. and all the data is shuffled to the left.
3 Select cell labels F to G.
4 Choose Edit/Columns/Delete columns. Columns F and G are deleted.
5 Select cell labels J to K.
6 Choose Edit/Columns/Delete columns. Columns J and K are deleted
7 Save your work.
Improving the appearance of your spreadsheet
At the moment. your spreadsheet titles do not stand out very well. You can improve this by changing the text size and emphasis (You could also change the font if you wish)
Select the main title by cl icking on cell A I .
2 To change the tit le text from 12 point to 18 point text. choose Effect/Text slze/18pt
3 Then to make the text bold. choose Effect/Bold
4 As you have enlarged the text. you need to increase the height of the row so that the text fits. Double-click on the corresponding row label. in this case the I at the left of the window.
5 Select the whole of row 3 by clicking on the row 3 label.
6 Make the text bold by choosing Effect/Bold.
7 Save your work
If. while you're editing your spreadsheet. it looks as though some of the headings get cut off to fit in their cells, you can get them back again by simply clicking once on the appropriate cell(s) (Don't confuse this with double-cl icking on a label to widen a whole row or column.)
Formatting the data cells
You can see that at the moment the figures don't line up too well in the cells. they'd look much better aligned to the right. To do this. select the whole of the block of cells contain ing figures. and then choose Effect/Alignment/Right.
Save your work
51

Printing your spreadsheet
Printing your spreadsheet
Now that you've improved the appearance of your spreadsheet, you can print it out:
Make su re that a suitable printer is correctly connected and set up, and that the ! Printers application is loaded onto the icon bar (the RISC OS 3 User Guide describes this) . If you have a I MB computer and wish to print, please refer to Using Advance on I MB or 2MB computers on page 303 of the Advance User Guide
2 Switch off the row and column labels by choosing the Utilities/Labels option.
3 Then choose File/Print.
4 Tell Advance to print the spreadsheet sideways on the paper by clicking on Sideways.
5 Finally click on Print.
Plotting graphs of regional climate variations
52
The best way to see the seasona l variations in climate is to plot each type of weather on a graph. You can do this quite simply from the Spreadsheet unless you have a I MB computer
(If you are using a 1MB computer, please refer to Appendix B Using Advance on 1MB or 2MB computers on page 303 of the Advance User Guide. The file GraphDa ta2 in the Project2 directory contains the plot data you need)
Plotting line graphs of regional data Switch the row and column labels back on by choosing Utilities/Labels.
2 Select rows 4 to 16 by clicking on row label 4, and then clicking Adjust on row label16.
3 You now need to specify whether you wish to send the data to the Graph tool as row data or column data. Your data is organised into columns. so choose Utilities/Graph type/Plot columns
4 Open the Advance Graph tool by choosing Utilities/Graphs. This displays the Graph window.
When you go to the Graph window from the Database or Spreadsheet the selected data is automatically copied by the Graph tool and is ready to be displayed (If no data is selected. all data is copied .)
Project 2: Investigating regional variations in climate in the UK
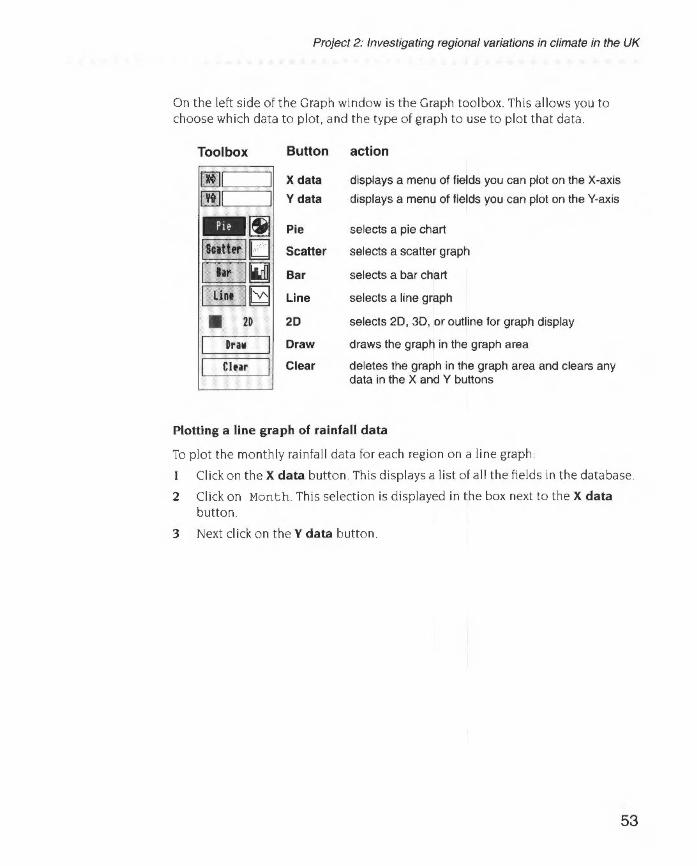
On the left side of the Graph window is the Graph toolbox This allows you to choose which data to plot. and the type of graph to use to plot that data
Toolbox Button action
X data displays a menu of fields you can plot on the X-axis
Y data displays a menu of fields you can plot on the Y-axis
~ Pie selects a pie chart
Jsctthr J[J Scatter selects a scatter graph
I lir I~ Bar selects a bar chart
I lint IB Line selects a line graph
• 2D 20 selects 20, 30, or outline for graph display
I Draw Draw draws the graph in the graph area
I Clear Clear deletes the graph in the graph area and clears any data in the X and Y buttons
Plotting a line graph of rainfall data
To plot the monthly rainfall data for each region on a line graph
I Click on the X data button. This displays a list of all the fields in the database.
2 Click on Month. This selection is displayed in the box next to the X data button
3 Next click on the Y data button.
53
Plotting graphs of regional climate variations
54
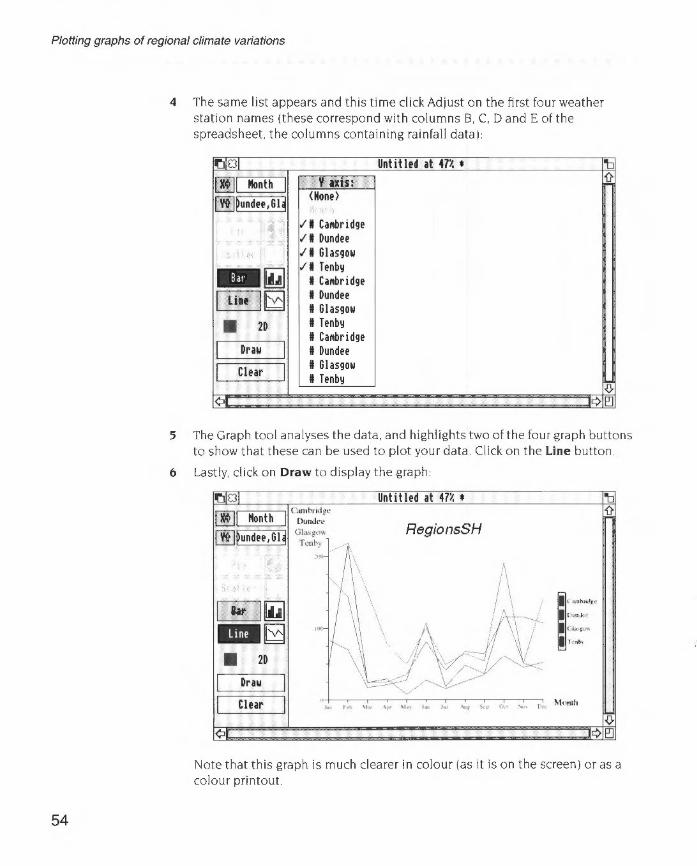
4 The same list appears and this time click Adjust on the first four weather station names (these correspond with columns 8, C, D and E of the spreadsheet, the columns containing rainfall data):
~101 Untitled at 47% • 'b
001 llonth I t 1xis: '(}-
<Hone> [!I]~undee,Gl~ r t
.. I' I Ca111br i dge ,... ·- I' I Dundee
I' I Glasgow
-~ I' I Tenby
I Ca111bridge
I liae H~J I Dundee I Glasgow
• 2D II Tenby II Ca111bridge
I Draw I II Dundee
I Clear I II Glasgow II Tenby
.0. ¢ • ¢e:J
5 The Graph tool analyses the data, and highlights two of the four graph buttons to show that these can be used to plot your data. Click on the Line button.
6 Lastly, click on Draw to display the graph:
~101
I 81r ~~ - [8 • 2D
I Draw
I Clear
Untitled at 47% •
RegionsSH
"b
Note that this graph is much clearer in colour (as it is on the screen) or as a colour printout.
Project 2: Investigating regional variations in climate in the UK
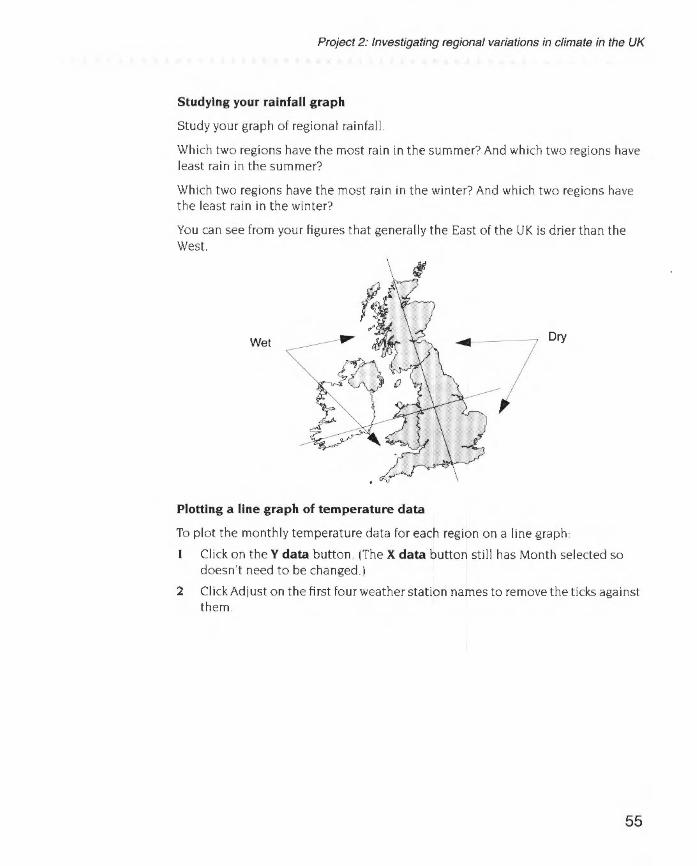
Studying your rainfall graph
Study your graph o f regional rainfal l.
Which two regions have the most rain in the summer? And which two regions have least rain in the summer?
Which two regions have the most rain in the winter? And which two regions have the least rain in the winter?
You can see from your figures that generally the East of the UK is drier than the West.
Wet Dry
Plotting a line graph of temperature data
To plot the monthly temperature data for each region on a l ine graph
Click on the Y data button. (The X data button sti ll has Month selected so doesn't need to be changed.)
2 Click Adjust on the first four weather station names to remove the ticks against them.
55

PloNing graphs of regional climate variations
56
3 Click Adjust on the second four weather station names to select them
(These second four station names correspond with columns F. G. Hand I of the spreadsheet. the columns contain ing temperature data):
Y IXisl <Hone)
I Callbridge I Dundee I Glasgo11 I Tenby
.I I Ca111br i dge
.II Dundl!l!
.II Glasgow
.I I Ttnby I Ca111bridge I Dundee I 6lasgo11 I Tl!nby
4 Click on Draw to display the graph·
~IC31 Untitled at 47% •
001 Month I ami'YI<lg<-Dundee
RegionsSH [IDPundee,Gl~ Gllb~OW v
Tcnb> "~ /\
I ~~ ;;;,L.~\ s J/ ~~ ~·---· I l1r I~ .... '·\ ' "'"""' lii.ii~ -= . ' ''"'""'
~ \~ I to• • 2D """" \ ~
I Dra11 I I Cltar I .... · ~ "• ,. '"'' ·~
.. ""' ,..~ "' , .. , I ' M'"''"
'il i)o
-{)
¢• Qe:J
Studying your temperature graph
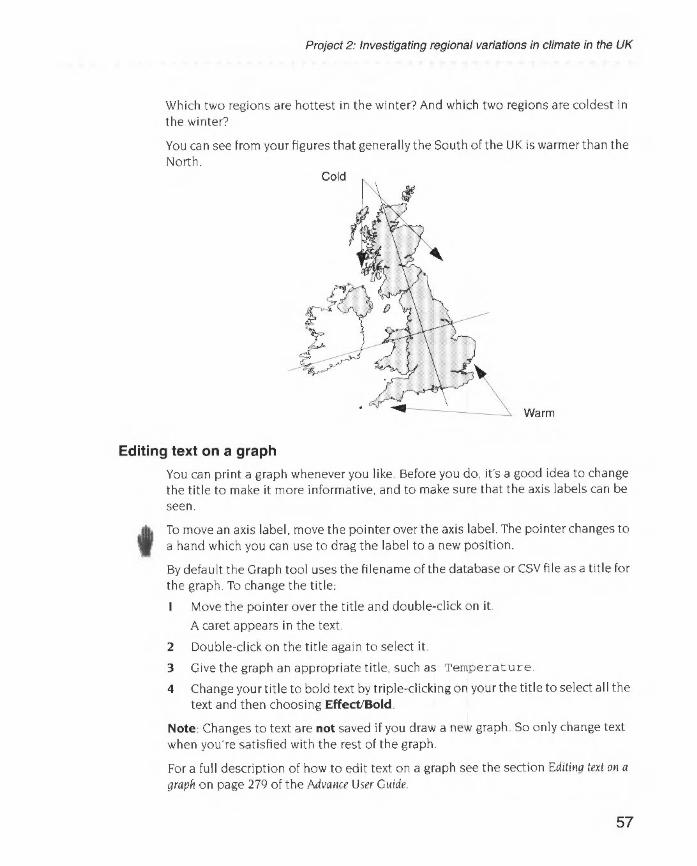
Study your graph of temperature.
Which two regions are hottest in the summer? And which two regions are coldest in the summer?
Project 2: Investigating regional variations in climate in the UK
Which two regions are hottest in the winter? And which two regions are coldest in the winter?
You can see from your figures that generally the South of the UK is warmer than the North
Warm
Editing text on a graph
You can print a graph whenever you like Before you do. it's a good idea to change the title to make it more informative. and to make sure that the axis labels can be seen
t To move an axis label. move the pointer over the axis label The pointer changes to a hand which you can use to drag the label to a new position
By default the Graph tool uses the filename of the database or CSY file as a title for the graph. To change the title:
I Move the pointer over the title and double-click on it.
A caret appears in the text
2 Double-click on the title again to select it.
3 Give the graph an appropriate title. such as Temperature.
4 Change your title to bold text by triple-clicking on your the title to select all the text and then choosing Effect/Bold.
Note: Changes to text are not saved if you draw a new graph. So only change text when you're satisfied with the rest of the graph.
For a fu ll description of how to edit text on a graph see the section Editing text on a graph on page 279 of the Advance User Guide.
57
Plotting graphs of regional climate variations
58
Printing a graph
To print a graph:
t Make sure that a suitable printer is correctly connected and set up, and that the ! Printers application is loaded onto the icon bar (the RISC OS 3 User Guide describes this). If you have a I MB computer and wish to print, please refer to Usi11g Adva11ce 011 I MB or 2MB computers on page 303 of the Adva11ce User Guide.
2 Make sure that the graph you wish to print is displayed in the Graph window.
3 Click somewhere in the Graph window (this makes sure that data is printed from the Graph window. not from any other window you might have open at the time).
4 Choosing File/Print to display the Print d ialogue box.
5 Type in the number of copies you want and click on Print.
The graph will be printed. including any edits you have made.
Saving a graph
You can save a graph in two formats: as Graph data or as a Draw file You'll be saving your graph as a Draw file
Saving a graph as a Draw file
Saving a graph in Draw file format gives you a permanent record of the current graph, exactly as it's displayed on the screen. You can edit and annotate the Draw file using any of Draw's tools.
Save the graph of temperature. which is cu rrently displayed on your screen. as a Draw file·
Go into the File/Save as Draw dialogue box and type in an appropriate filename. (Note that this file is already saved as Draw2 in the Proj ect2 directory.)
2 Drag the Save as icon to your directory.
Note: Graphs saved as Draw files can take up a large amount of storage space. so make sure that you have enough space ava ilable on your disc.
Saving a graph as Graph data
A Graph data file contains all the data needed to redraw a graph, and any format settings (like text font and colour) but discards any edits you've made to the text.

Project 2 : Investigating regional variations in climate in the UK
You don't need to do this now, but here's how to save a graph as a Graph data file: Go into the File/Save as Graph dialogue box and type in the filename. then drag the icon to your directory display.
The file GraphDa t a2 in the Project2 directory contains the data from your Reg i onsSH spreadsheet file.
For more on types of graph please refer to the Advance User Guide under Selecting the rigftt graph on page 28 1.
Creating graphs from the Spreadsheet is described in detail in the Advance User Guide under Displaying results as a grapft on page 11 4, and under More on graphs on page 189.
Studying the climate data When you have displayed and studied your climate graphs, you' ll be able to see regional patterns in the data. If you have used the data supplied wi th the Advance software, you'll see that the data fits with this map o f the UK climate quadrants:
Cool wet summers Cold wet winters
Warm wet summers Mild wet winters
Closing files and freeing up memory
Cool dry summers Cold dry winters
Warm dry summers Cool dry winters
You won't need to use the Spreadsheet tool for a whi le. so you should now close your fi le. Then cl ick Menu on the Advance icon on the icon bar. and choose Minimise memory.
59

Writing a report
Further suggestions
Writing a report
60
Plot a line graph of hours of sunshine.
Work out·
• which two regions have the most hours sunshine in the summer. and which two regions have the least hours of sunshine in the summer
• which two regions have the most hours sunshine in the winter. and which two regions have the least hours sunshine in the winter.
2 Have another look at your database subset by opening the file r egions. (If you are using a I MB computer. you shou ld close any open files. click Menu on the Advance icon on the icon bar. and choose M inimise memory before you do this.)
Find out in what months there have been snow and then work out which season has the most snowy days.
You can use Advance Word Processor to produce a written report about regional weather variations.
Before you start work. you need to decide what you want to include in your document. and how you want it to look. As well as some text about what you have learned. you may want to include some examples of the work you have done using the Database. Spreadsheet and Graph tools.
You'll lay your document out as shown here:
text text
table graph
text
••
page number
Project 2: Investigating regional variations in climate in the UK
Creating a new document
To create a new Word Processor document. click on the Advance icon on the icon bar A blank document appears. Click on the Toggle size icon to make the document fill the screen.
Scaling your document
By default. a document is displayed at full size (I 00%). It's often easier to work on a document when it's scaled in size (either to fit more on the screen. or to zoom in and get a closer look at something). Scale your document so that it's displayed at 80% of its full size:
Choose Utilities/Scale view.
2 Click on 80% and then on Scale.
Changing the page size
Choose the Edit/Alter pages option to display the Alter pages dialogue box. then change the settings to those shown here:
~I Rlttr PIUS
- Pitt sizt 0 113 ~ R4 o •s 0 Cush11 ltidth : Dtpth: l 1'1
- For111t ~ Portrt~it 0 lan4scaPt c=J ft~cint PittS
~ !Wgins Top: llc• lhtha: llc11 I ltft: llc11 I Ritht : llc11 I
0 Hudtr Dtptb:
~ Foohr Dtpth: l lCII I 0 Utrtical rules
~ CoiiUIIIS llbtr: [[] Nidth: l15c• I Glpst IB .635cfll I
Restart page nullbtrint at 11 I
I Cancel I I or I Set the Top, Bottom. Left and Right margins to 3cm.
2 Click on Footer to set a footer frame. and set its Depth to lcm.
3 Click on OK to apply the changes and remove the dialogue box.
The page now has 3cm margins all round. and repeating footer frames to carry the page numbers.
61

Writing a report
62
4 Choose File/Save or press F3. give your report an appropriate name and drag the Save icon to your directory display.
Importing files into a Word Processor document
You can import various file types including Edit files (plain text). CSV files (the file format you used to save your subset data) and Draw files (the file format you used to save your graphs).
The method used for importing all types of file is the same- you simply place the caret where you want to insert the file. then drag the file's icon from a directory display into the text frame of the open Advance Word Processor document. As long as the file type is one that the Word Processor can understand. the file is added at that point.
Importing text. graph ics and data are all covered in detail in the chapter Learning more about the Word Processor on page 45 of the Advance User Guide.
Importing text
There is some sample text in the file Text2 which is in the Project2 directory of Advance Data disc B. To import this text into your report. simply select the file Text2 and then drag the file icon to your open document When you release the mouse button. the text appears in the document window You can of course write your own report, either in the Advance Word Processor. or in plain text which you can import
Formatting text
To improve the look of your text. you need to change the appearance of the heading.
Select all the heading text by triple-cl icking on it. then choose
• Effect/Text slz.e/24 to make the text larger
• Effect/Bold to make the heading bold
• Effect/Alignment/Centre to centre the head ing on the page.
Save your work.
Text editing techniques are explained under Changing the appearance of lhe text on page 28 in the Advance User Guide.
Importing data
To import some of your spreadsheet data into your report. you need to open your spreadsheet file.

Project 2: Investigating regional variations in climate in the UK
Double-click on the file RegionsSH.
2 Select the area of the spreadsheet that you wish to copy In this case. select the figures for rainfall (cells A4 to E16):
3 Choose Edit/Copy.
4 Place the caret in the Word Processor document at the point at which you wish the data to appear as shown here:
place the caret here
Regio variations in climate in the UK
able of regional cainf'lllt dial a.
5 Choose Edit/Paste.
Note that you cannot copy and paste between Advance tools if you are using a I MB computer; please refer to Appendix B: Using Advance on I MB or 2MB computers on page 303 of the Advance User Guide. The CSV file Reg ionsCSV in the Proj ect2 directory contains the data you need.
63
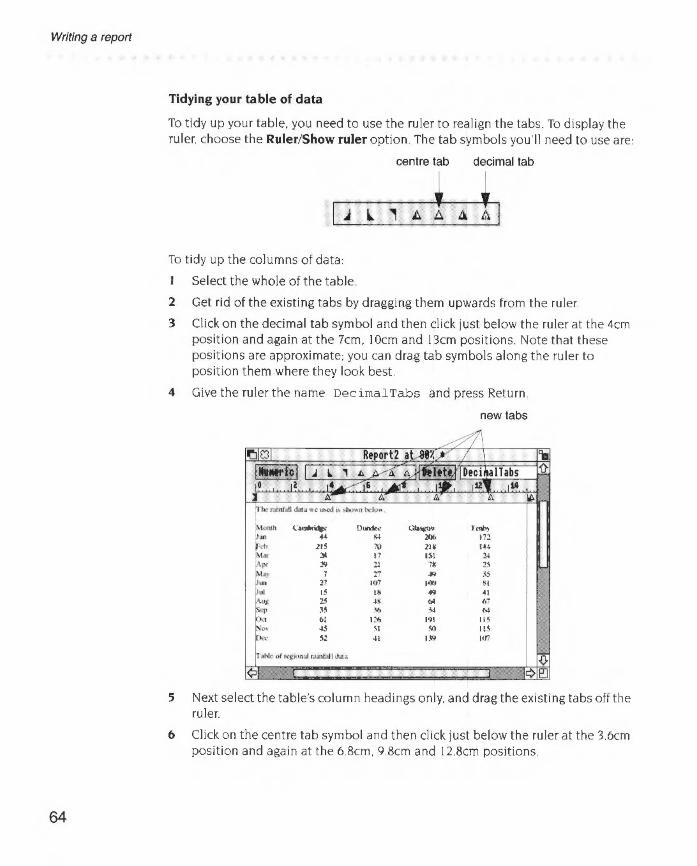
Writing a report
64
Tidying your table of data
To tidy up your table. you need to use the ru ler to realign the tabs. To display the ruler. choose the Ruler/Show ruler option. The tab symbols you' ll need to use are:
centre tab decimal tab
, To tidy up the columns of data:
Select the whole of the table.
2 Get rid of the existing tabs by dragging them upwards from the ruler.
3 Click on the decimal tab symbol and then click just below the ruler at the 4cm position and again at the 7cm. I Ocm and 13cm positions. Note that these positions are approximate; you can drag tab symbols along the ruler to position them where they look best.
4 Give the ruler the name Decimal Tabs and press Return .
new tabs
r he rant• diu.-~ ~bad b ~~· bc)o.
,,_ (;&l1!bnd!:lt OCindt~ c:;a."4'""' r~ ,., 4~ fl.! lOb 17~
~! ~15 'II 21¥ IU 1A 17 Ul 24
Apr :!'1 21 7• 2' \!') .
~ .... " , ... ~ to" I~J 81 ... IS Ill ..... 41 Ujl 2.$ ~8 ().1 ()7
S<t> ·'~ :-6 ~ N l,l I~ I'll ItS 45 51 ~ "' :\l 41 t.W 107
.>1\k> or~ .. '""" r•inl'.tll d:ll•
5 Next select the table's column headings only, and drag the existing tabs off the ruler.
6 Click on the centre tab symbol and then click just below the ruler at the 3.6cm position and again at the 6 8cm. 9.8cm and l2.8cm positions
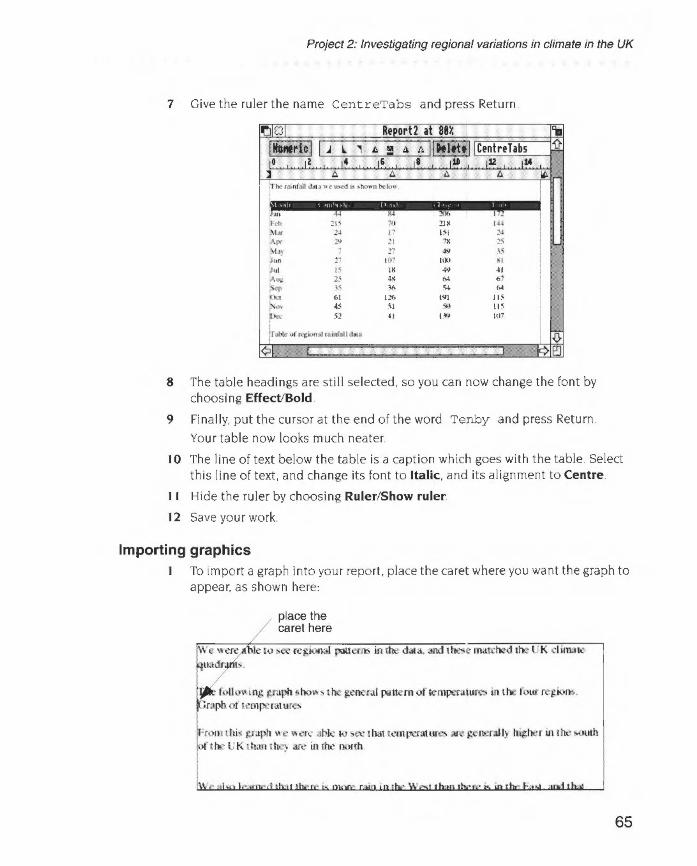
Project 2: Investigating regional variations in climate in the UK
7 Give the ruler the name Cent reTabs and press Return
~1£31 Rmrt2 at 88% 'il llhl•ric ll J L. , I.
= .1 A II Dtlttt ii Centrehbs ~ ,. ,z '"
,, ,. t:l.t ,u tM [~! l 6 6 6 6 ~ •rr.e rain( .. daa •c ~ i6 ~ho"An bdo~ I
~·· 44 ~ Yll> r . ... ctl !I~ 70 :!1~ 144 ~~. 2-1 p t<t 2-1 !AI'< 2'1 !I 7~ 1:< ;'>1.1) 7 !) 4'1 \~
~:: !) 10" l<kl •t 15 ·~ 4Y ~I
Au;<. 1$ 4.'! ~ ('l ~ }5 .)(, S4 (~
~o..~ r.J l l(• I \II II< ~"' ~s Sl ~~ It< ~ 51 41 ll'l '"' lroble uf "'""""' raintolt data i ~
¢1u w ]¢e:J
8 The table headings are still selected, so you can now change the font by choosing Effect/Bold
9 Finally, put the cursor at the end of the word Tenby and press Return .
Your table now looks much neater.
I 0 The line of text below the table is a caption which goes with the table Select this line of text. and change its font to Italic, and its alignment to Centre.
II Hide the ruler by choosing Ruler/Show ruler.
12 Save your work.
Importing graphics To import a graph into your report. place the caret where you want the graph to appear. as shown here:
place the caret here
e to ~:-ee rcgi<»tal patternts in t.hl! data, and the-.e matched tile UK cl imate
rolh>llllllJt yapofuho~~ !hie gooer.1J pattern ofWtnpeT.ltl~ ill the rt)UJ f'CI,!iol'b .
jraph ot temperature-.
rom thl' j!Taph we 111er ... abk to ~e.:: that temperature. are l,!enerall) hJi.ller m the 1-oolh I the l! K th.m tb..~ ar~ in ttK' tlOith
65
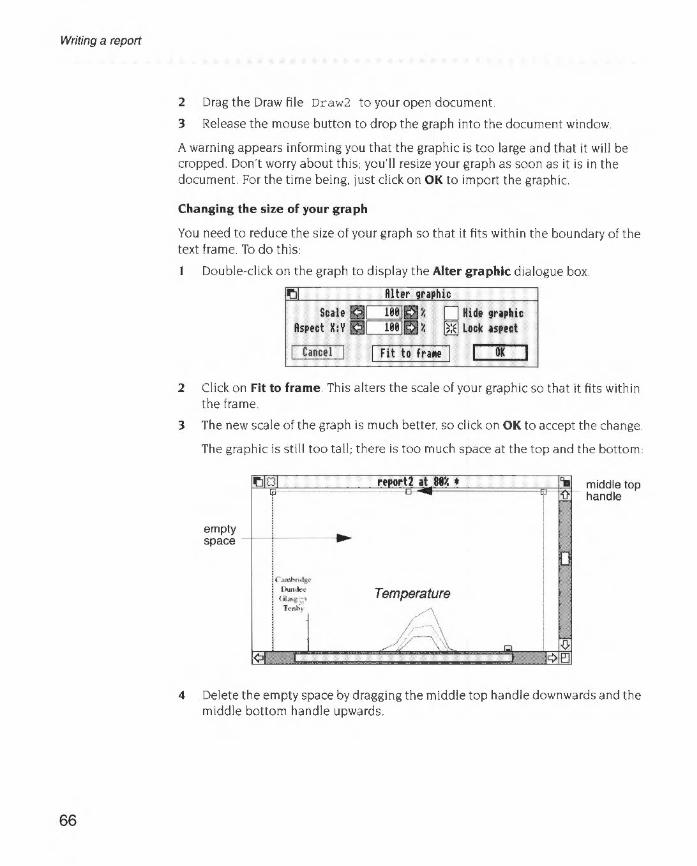
Writing a report
66
2 Drag the Draw file Draw2 to your open document
3 Release the mouse button to drop the graph into the document window.
A warning appears informing you that the graphic is too large and that it will be cropped. Don't worry about this; you'll resize your graph as soon as it is in the document For the time being, just click on OK to import the graphic.
Changing the size of your graph
You need to reduce the size of your graph so that it fits within the boundary of the text frame. To do this:
Double-click on the graph to display the Alter graphic dialogue box.
~I Alter graphic
Scale ICI~a ~ 0 Mide graphic Aspect X: Y ICic::=:mJII:I% ~ locl< aspect
I Cancel I I Fit to fra111e I OK
2 Click on Fit to frame This alters the scale of your graphic so that it fits within the frame.
3 The new sca le of the graph is much better. so click on OK to accept the change
The graphic is still too ta ll ; there is too much space at the top and the bottom:
empty space -
~I OJ ljl . ... ... ·····-····
I 1- j
I jc ... nbto¥ ! Dundee i Gl~t:;? I ,~,
¢1:: :ri
····--.··
~
report2 at 81% • .......................... tt-
Temperature
~\ ~\\ r=l
*~
'II pd
~
J
II"'"
In . ~
.. ~
~ J::J
middle top handle
4 Delete the empty space by dragging the middle top handle downwards and the middle bottom handle upwards.
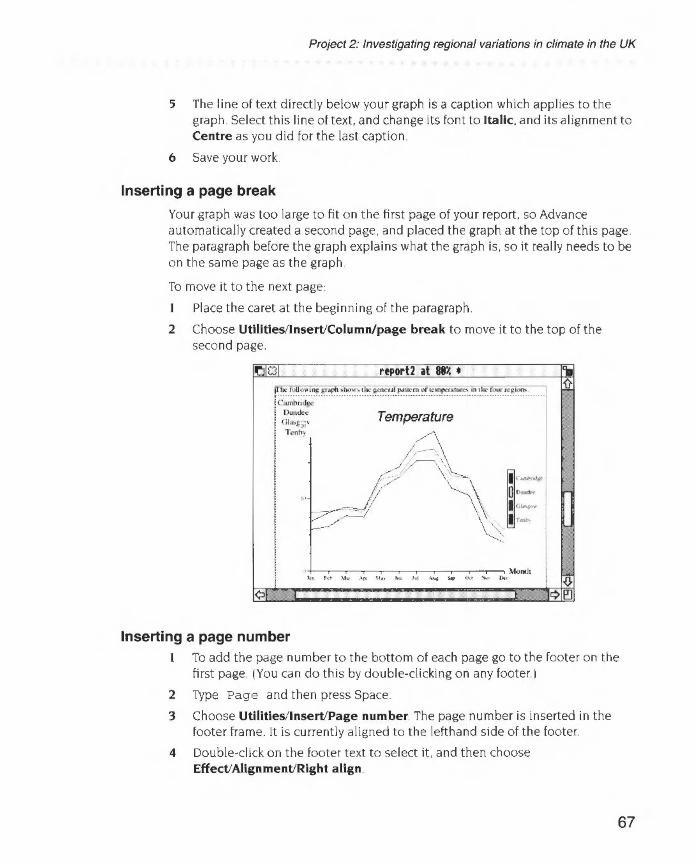
Project 2: Investigating regional variations in climate in the UK
5 The line of text directly below your graph is a caption which applies to the graph. Select this line of text. and change its font to Italic. and its alignment to Centre as you did for the last caption.
6 Save your work
Inserting a page break
Your graph was too large to fit on the first page of your report. so Advance automatically created a second page. and placed the graph at the top of this page. The paragraph before the graph explains what the graph is, so it really needs to be on the same page as the graph.
To move it to the next page:
Place the caret at the beginning of the paragraph.
2 Choose Utllltles/lnsert/Column/page break to move it to the top of the second page.
~1€31 rtport2 at 81% • ~ ~ ~-~~~~-·-~-~¥..:~~~-·!Oi~~~-~~.?1.~.~!!~.!!:~~!~.~-~~ ..... I C.unitn<~se
Uun~.., Temperature I Gla.g;~· Tenh}
;--
~' ~ ··-~~ ··-I '
~ I ·• \to nth ... ..... "• "" \4, • .. , .. ""' ... "" .... "" I
¢1 1 ~> "' .::1¢1P'
Inserting a page number To add the page number to the bottom of each page go to the footer on the first page. (You can do this by double-clicking on any footer)
2 Type Page and then press Space.
3 Choose Utilities/Insert/Page number. The page number is inserted in the footer frame. It is currently aligned to the lefthand side of the footer.
4 Double-click on the footer text to select it. and then choose Effect/Alignment/Right align.
67

Quitting Advance altogether
Checking the spelling
It is always wise to check your work for spelling mistakes when you've finished working on it. To do this, position the caret in the text and select the Utilities/Spelling/Check entire text option. (This option checks all the text in a document, starling from the beginning.)
A dialogue box may appear warning you that the spelling checker has not yet been loaded Click on SPELl to load the default spelling checker.
• If a spelling mistake is found, a dialogue box is displayed and you can correct your mistake before continuing with the check.
• If no mistakes are found, the cursor simply moves to the end of the document.
Save your work.
Printing
When you've finished your report. you can print it out.
Make sure that a suitable printer is correctly connected and set up. and that the !Printers application is loaded onto the icon bar (the RISC OS 3 User Gwde describes this) If you have a I MB computer and wish to print please refer to Using Advance on I M B or 2MB computers on page 303 of the Advance User Guide
To print your report. choose File/Print and then click on Print in the dialogue box.
Quitting Advance altogether
Summing up
68
To quit Advance altogether. press Menu on the Advance icon on the icon bar and then click Select on the Quit option
You've now finished your report on regional variations in climate in the UK and have reached the end of Project 2. You have used the Advance Database. Spreadsheet. Graph and Word Processor tools.
In th is project you have learnt how to
• search a database for a several records at once
• transfer data to a spreadsheet and format it so that you have a neat table
• plot data for four weather stations on the same graph
• create a report containing examples of your work.
In the next project you'lllook at one type of data across all twelve weather stations. and will work out the monthly average for each station. to use for comparison

4 Project 3: Comparing local climate to the UK average
In this project. you'll use Advance to compare climate data for your own region with the rest of the United Kingdom. You'll finish by producing a report on your findings.
The examples in this project use the climate data supplied on Advance Data disc B.
Getting started Load Advance into your computer and open the Advance weather database. We a LherDB. as explained in Getting started on page 3.
Getting data into an Advance spreadsheet The best way to compare data is to import it into a spreadsheet file. To do this. the data must be in a form that the Spreadsheet can understand.
You'll save the temperature data for all weather stations as a CSV file You'll then transfer all this data into a spreadsheet file in order to work out the average monthly temperature, and use a graph to compare th1s average with the temperature data for your area.
Saving data as a CSV file Choose File/Save as/CSV.
2 Move the pointer over the word 'Fields'. and when the pointer changes into a smal l menu icon. click Select. This displays the Fields menu listing all the field names in your database file.
69
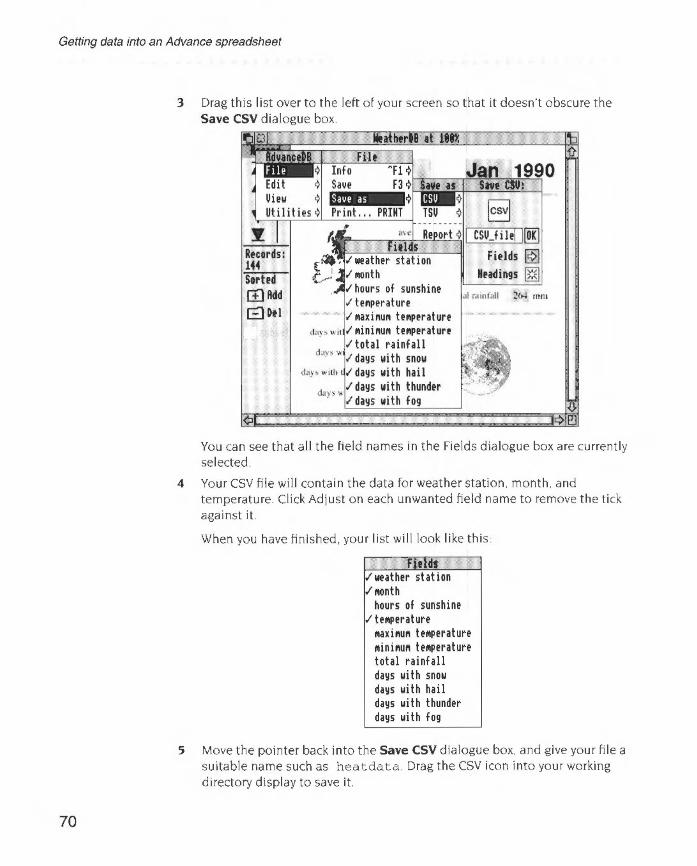
Getting data into an Advance spreadsheet
70
3 Drag this list over to the left of your screen so that it doesn't obscure the Save CSV dialogue box.
1•----......-..-J--=~1 1 CSU_filt I(@
te111perature l!laXii!IUI!I te111perature lllinii!IUI!I te111perature total rainfall days with snow days with hai I days with thunder
with fog
Fields ~ Hudings ~
You can see that all the field names in the Fields dialogue box are currently selected
4 Your CSV file will contain the data for weather station. month. and temperature. Click Adjust on each unwanted field name to remove the tick against it.
When you have finished. your list will look like this
Fields .I we at her station .I IIIOnth
hours of sunshine .I te111perature
l!laxii!IUI!I te111perature 111inii!IUI!I te111perature total rainfall days with snow days with hail days with thunder days with fog
5 Move the pointer back into the Save CSV dialogue box. and give your file a suitable name such as heatdata. Drag the CSV icon into your working directory display to save it

Project 3: Comparing local climate to the UK average
Quitting the main database
To close the database. click Select on the Close icon
Close icon
' ~~~Jl0~3b.l-----------~~at~h~er~DB~at~l~l~l~~· I~
·~. r· $t • Cambridge Jan 1990 _,,_ •• lion
Freeing up memory
You won't need to use the Database tool for a while. so it is wise to tel l Advance not to save any computer memory for it. To do this. click Menu on the Advance icon on the icon bar. and choose Minimise memory
Getting your subset data into an Advance spreadsheet
Now that you have saved your data in CSV format. you can open a new spreadsheet
Creating a spreadsheet for your data Click Menu on the Advance icon on the icon bar. and choose Create/Spreadsheet
This displays a blank spreadsheet file. You'll start by adding some headings to the spreadsheet
2 Select cell B1, and type the title Comparing temperature data.
~3 Click on the Enter button to enter your title.
Adding rows and columns
By default a new spreadsheet has 28 rows and I 0 co!umns. You need to add more rows and columns to your spreadsheet before you import your CSV file. so that there is enough room for al l your data.
I Click on a cell which is below all the text you have typed in so far (cell A3 for example)
2 Add 120 rows to the spreadsheet by choosing Edit/Rows/Add rows. and giving the value 120
71
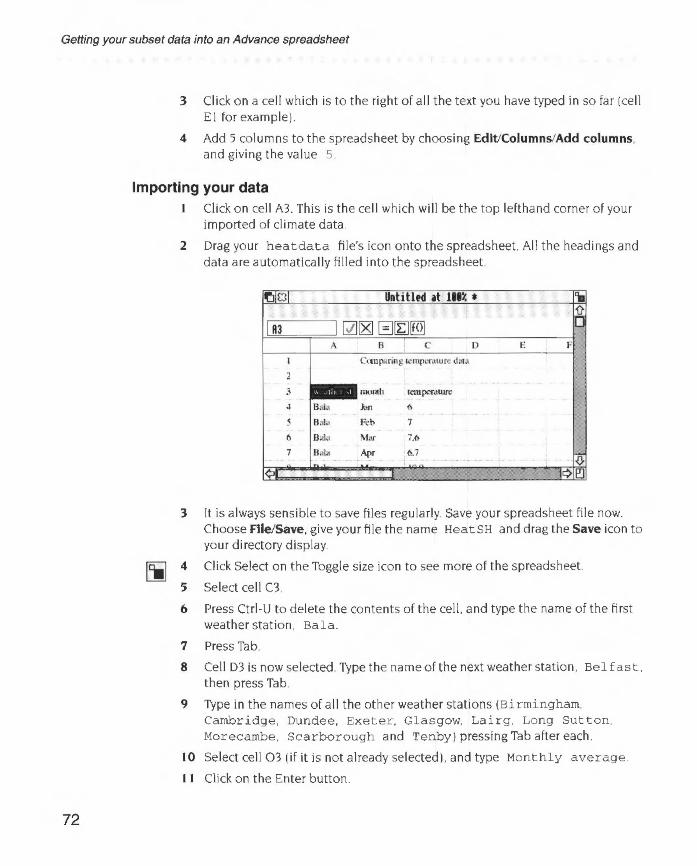
Getting your subset data into an Advance spreadsheet
72
3 Click on a cell which is to the right of all the text you have typed in so far (cell E I for example) .
4 Add 5 columns to the spreadsheet by choosing Edit/Columns/Add columns. and giving the value 5.
Importing your data
2
3
5
6
7
8
Click on cell A3. This is the cell which will be the top lefthand corner of your imported of climate data.
Drag your heatdata file's icon onto the spreadsheet. All the headings and data are automatically filled into the spreadsheet
(\wnrormg remp..-r.11ure dac,t
2
·' month ldnper.uure
4 Bala .l.ln 6
5 Bala Frb 1
() Ba!:t M.w 7.6
7 Bala Apr
It is always sensible to save files regularly. Save your spreadsheet file now. Choose File/Save. give your file the name HeatSH and drag the Save icon to your directory display
Click Select on the Toggle size icon to see more of the spreadsheet
Select cell C3
Press Ctri-U to delete the contents of the cell. and type the name of the first weather station. Bala.
Press Tab.
Cell D3 is now selected. Type the name of the next weather station. Be l fast. then press Tab.
9 Type in the names of all the other weather stations (Birmingham. Cambridge, Dundee, Exeter. Glasgow, La i rg , Long Sutton, Morecambe. Scarborough and Tenby) pressing Tab after each.
10 Select cell 03 (if it is not already selected). and type Monthly average.
II Click on the Enter button.

Project 3: Comparing local climate to the UK average
12 Save your work.
You'll notice that you cannot see the headings properly This is because by default the columns are all the same width as each other
13 To alter the width of the columns. double-dick on the column label (the letter above the column) of the column which is too narrow Do this for columns E. K. L. M and 0.
double-click here to widen column E
\ ~101 HutSH it 111% \ .. Monthly mrage \ ~ I o3 I~~ G~lilll 1'-J
A B c D ~··
F
I COOtploring tem~ratut'C d,ua
2
J weatl¥:r st month Bula Bdfa~t Bumtn~lao C.unhrtd
4 Buta J:m c. ~ El:ola Feb 7
6 B.tla. Mar 7.b ~ ¢ .. *'*' ,. .... ~·-'41~·· .;,~ <
1¢ eJ
You now have all the temperature data in your spreadsheet. and appropriate titles to assist you while you edit your table.
Editing your spreadsheet
In order to use the Graph tool to compare your figures. you need to move some of the data
Scroll down the spreadsheet and select all the figu res for Belfast (cells Cl6 to C27).
2 Choose Edit/Cut.
3 Scroll back to the top of the spreadsheet and select cell 04.
4 Choose Edit/Paste.
5 Scroll down the spreadsheet and select all the figures for Birmingham (cel ls C28 to C39) .
6 Again. choose Edit/Cut.
7 Scroll back to the top of the spreadsheet and select cell E4.
8 Choose Edit/Paste.
9 Save your work.
73
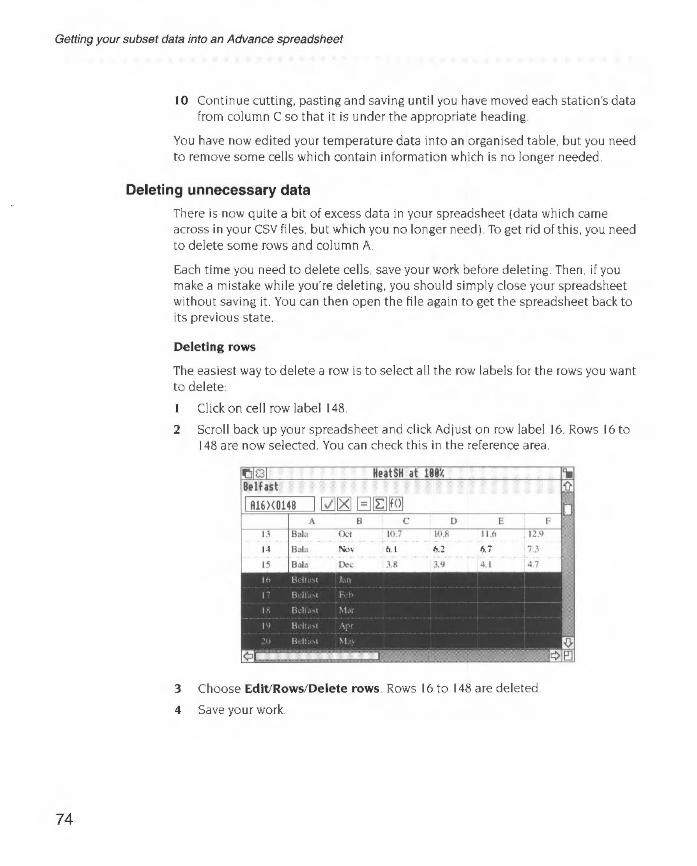
Getting your subset data into an Advance spreadsheet
74
I 0 Continue cutting, pasting and saving until you have moved each station's data from column C so that it is under the appropriate heading
You have now edited your temperature data into an organised table. but you need to remove some cells which contain information which is no longer needed
Deleting unnecessary data
There is now quite a bit of excess data in your spreadsheet (data which came across in your CSV files. but which you no longer need) To get rid of this. you need to delete some rows and column A.
Each time you need to delete cells, save your work before deleting Then, if you make a mistake while you're deleting, you should simply close your spreadsheet without saving it. You can then open the file again to get the spreadsheet back to its previous state.
Deleting rows
The easiest way to delete a row is to select all the row labels for the rows you want to delete:
Click on cell row label 148.
2 Scroll back up your spreadsheet and click Adjust on row label 16 Rows 16 to 148 are now selected. You can check this in the reference area
3 Choose Edit/Rows/Delete rows. Rows 16 to 148 are deleted.
4 Save your work.

Project 3: Comparing local climate to the UK average
Deleting columns
Click on column label A.
2 Choose Edit/Columns/Delete columns Column A is deleted. and all the data is shufned to the left
Your table now contains only relevant data.
Improving the appearance of your spreadsheet
At the moment. your spreadsheet titles do not stand out very well . You can improve this by changing the text size and emphasis. (You could also change the font if you wish).
I Select the main title by clicking on cell AI.
2 To change the title text from 12 point to bold 18 text. choose Effect/Text slze/18pt.
3 Then to make the text bold. choose Effect/Bold.
4 As you have enlarged the text. you need to increase the height of the row so that the text fits. You do this in the same way as you increased the column width; click on the corresponding row label. in this case the I at the left of the window.
5 Select the whole of row 3 by clicking on the row 3 label
6 Make the text bold by choosing Effect/Bold.
7 Again. you won't be able to see some of the column headings completely Alter the width of these columns by double-clicking on the column label of each column which is too narrow.
8 Save your work.
~lc:ll HutSH it 111% • "'I '(}
I N1><N15 I ~181 01tJtml A B c u '"
I Comparing temperature data 2
J DkJDih Bllbt Bdta.~ Dlrmln,hlim Cambrkll¢ l>un
4 Jan () S.7 6.J ().<) ~.~ = ~ Feb 7 ~.!\ 7. 1 Ill ,, I (I Mar 7.(• 8 8.5 KY 1\.3
7 Apr 6.7 7.6 7Y K.S 1\.1
0 .... IOQ Q · ~ 0 ,, " .().
¢ r ~IP'
75
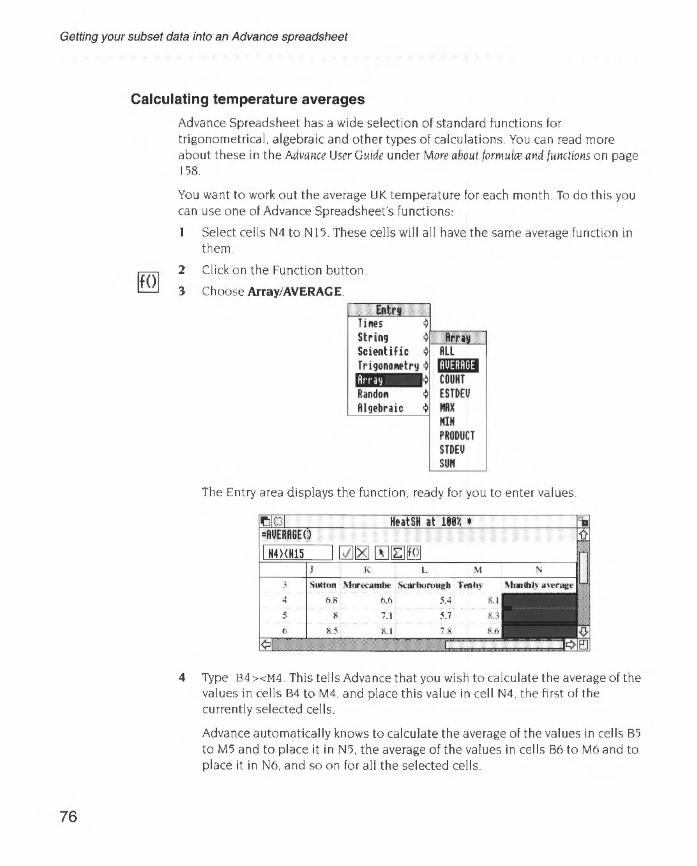
Getting your subset data into an Advance spreadsheet
76
Calculating temperature averages
Advance Spreadsheet has a wide selection of standard functions for trigonometrical. algebraic and other types of calculations You can read more about these in the Advance User Guide under More about formu/Cf and functions on page 158
You want to work out the average UK temperature for each month To do this you can use one of Advance Spreadsheet's functions.
Select cells N4 toN 15. These cells will all have the same average function in them.
2 Click on the Function button.
3 Choose Array/AVERAGE
Entrt Ti.es String
¢ ¢
Scientific ~
Trigono.etr'.l_ ~
Iii liD Rando11 j Algebraic
Rm!l RLL lil1JI;Iil~l COUNT ESTDEU IIRX IUN PRODUCT STDEU SUM
The Entry area displays the function. ready for you to enter values
4 Type B4 ><M4. This tells Advance that you wish to ca lculate the average of the values in cells 84 to M4. and place this value in cell N4. the first of the currently selected cells.
Advance automatically knows to calculate the average of the values in cells 85 to M5 and to place it in N5. the average of the values in cells B6 to M6 and to place it in N6. and so on for all the selected cells

Project 3: Comparing local climate to the UK average
5 To perform the calculations. click on the Enter button.
6 A message appears warning you that you're about to change a block of cells. Click on Accept.
3 Sutton Morecanlbt Scarborougb Teab)
4 6.6 5.4 l\.1
.'i 7.1 ~.7 IU
6 8. 1 7.8 it6
7 8.] 7.6 S.3
8 12.9 12.8
Changing number format
The average UK temperature for each month is now displayed in the appropriate row. but the values look rather untidy as they do not have equal numbers of figures after the decimal point. To round the values to have just one figure after the decimal point. you need to change the number format
1 If they are not still highlighted. select cells N4 toN 15
2 Choose Effects/Number format display the Number format dialogue box.
3 Click on the Fixed decimal button and give the value 1 as shown here:
~ ..., flrMt - Type r- lttiti~t displiy -----0 Integer O H• ~-99 ~ Fixed deciAal 0 Dih 0 99 0 Scientific 0 General O <m 0 Currency r- Thousands stpirator--
Deci~~~al placts: DOIJI:J ~ ilone 0 Period Before nuMber: t::::j 0 CoMi o spm After nu11ber:
ICaml l I Rpp}!j I
When you click on Apply. the figures in your spreadsheet are updated.
4 Save your work.
77
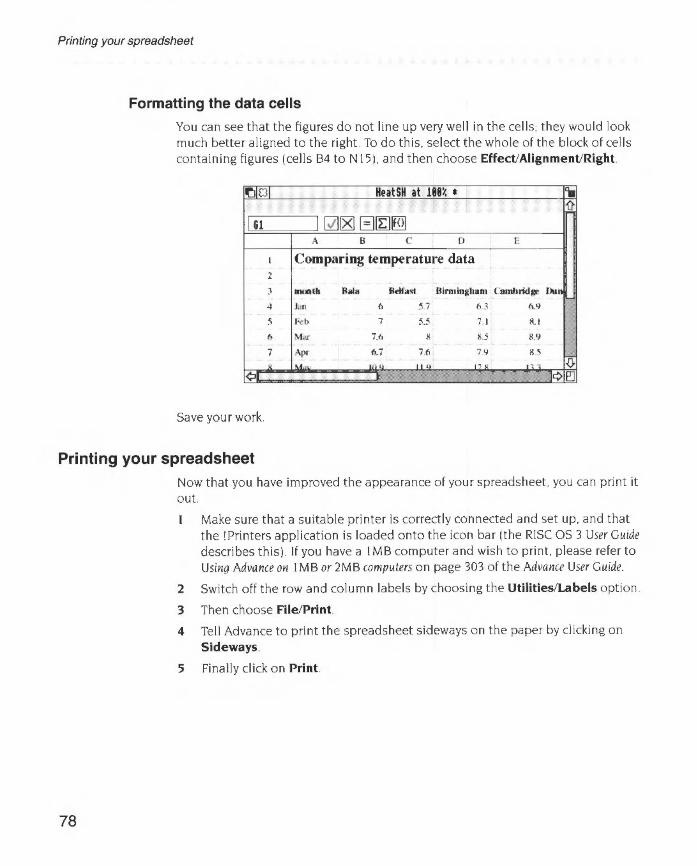
Printing your spreadsheet
Formatting the data cells
You can see that the figures do not line up very well in the cells. they would look much better aligned to the right. To do this. select the whole of the block of cells containing figures (cells 84 toN 15). and then choose Effect/Alignment/Right
~101 HutsH at 111% • I '\I 11-
1&1 I ~~ El~lilll A B c 0 E
l Comparing temperature data 2
J mootb Billa Bdfast lllrmlnjllmm ('ambrid'-oe £.lu1
4 k•n 6 5.7 6.1 1>.9
5 Feb 7 5.5 7. 1 S.l
6 ~i.:Jr 7.6 ~ 8.5 8.'1
1 Apr 6.7 76 79 K5 ~ jl .... '"" ' "" "~
¢ • . > ·' " F ' l¢e::J
Save your work.
Printing your spreadsheet
78
Now that you have improved the appearance of your spreadsheet. you can print it out
Make sure that a suitable printer is correctly connected and set up, and that the ! Printers application is loaded onto the icon bar (the RISC OS 3 User Guide describes this). If you have a I MB computer and wish to print. please refer to Using Advance on I MB or 2MB computers on page 303 of the Advance User Guide.
2 Switch off the row and column labels by choosing the Utilities/Labels option.
3 Then choose File/Print.
4 Tell Advance to print the spreadsheet sideways on the paper by clicking on Sideways.
5 Fina lly click on Print.
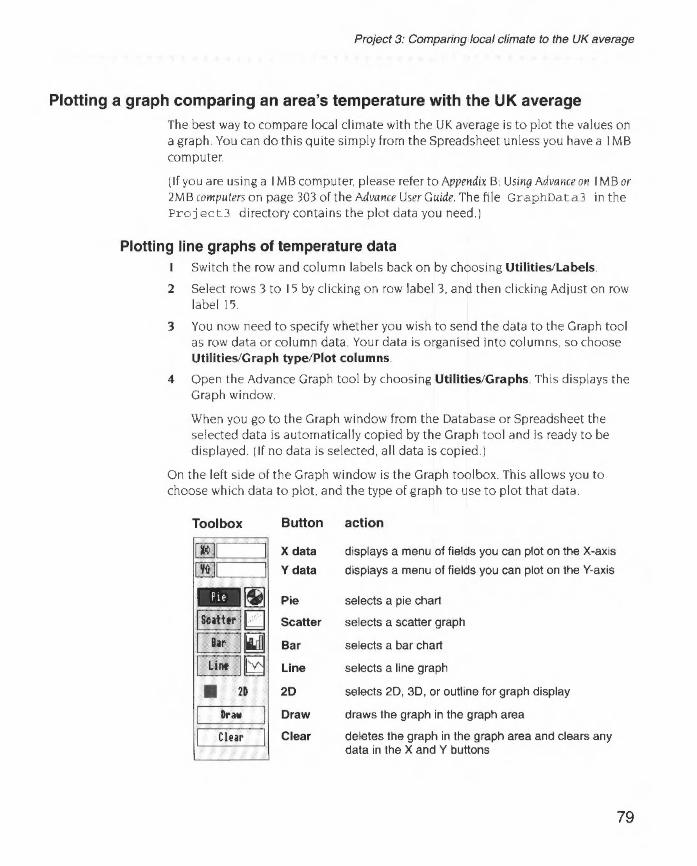
Project 3: Comparing local climate to the UK average
Plotting a graph comparing an area's temperature with the UK average
The best way to compare local climate with the UK average is to plot the values on a graph. You can do this quite simply from the Spreadsheet unless you have a I MB computer.
(If you are using a I MB computer. please refer to Appendix B: Using Advance on I MB or 2MB computers on page 303 of the Advance User Guide. The file GraphData3 in the Proj ect3 directory contains the plot data you need.)
Plotting line graphs of temperature data Switch the row and column labels back on by choosing Utilities/Labels
2 Select rows 3 to I 5 by clicking on row label 3, and then clicking Adjust on row label 15.
3 You now need to specify whether you wish to send the data to the Graph tool as row data or column data. Your data is organised into columns. so choose Utilities/Graph type/Plot columns
4 Open the Advance Graph tool by choosing Utilities/Graphs. This displays the Graph window
When you go to the Graph window from the Database or Spreadsheet the selected data is automatically copied by the Graph tool and is ready to be displayed (If no data is selected. all data is copied.)
On the left side or the Graph window is the Graph toolbox. This allows you to choose which data to plot. and the type of graph to use to plot that data.
Toolbox Button action
I X data displays a menu of fields you can plot on the X-axis
I Y data displays a menu of fields you can plot on the Y-axis
~ Pie selects a pie chart
jsutttr IICJ Scatter selects a scatter graph
I Bar I~ Bar selects a bar chart
I Lint I~ Line selects a line graph
• 2D 20 selects 20, 30, or outline for graph display
I Dr~w I Draw draws the graph in the graph area
I Clur J Clear deletes the graph in the graph area and clears any data in the X and Y buttons
79

Plotting a graph comparing an area's temperature with the UK average
80
Plotting a line graph of temperature data
To plot the month ly temperature data for each region on a line graph:
I Click on the X data button. This displays a list of all the fields in the database.
2 Click on Month. This selection is displayed in the box next to the X data button.
3 Next click on the Y data button.
4 The same list appears and this lime click Ad just on Cambridge and Monthly average:
~QI I UISI led at 4n • 'b
001 1110nth I <None> 'fr
I:!!Jie,Monthhl Bala
~ e Belfast Birfllinghafll
r v Callbridge
~-~ Dundee Exeter
I LIH I~ Glasgo" lairg
• 2D long Sutton Morecafllbe
I Dr a" I Scarborough
I Cltar I Ten by v Monthly average
~ ¢ JQP"
5 The Graph tool analyses the data, and high lights two of the four graph buttons to show that you can plot your data using these graph types. Click on the Line button.
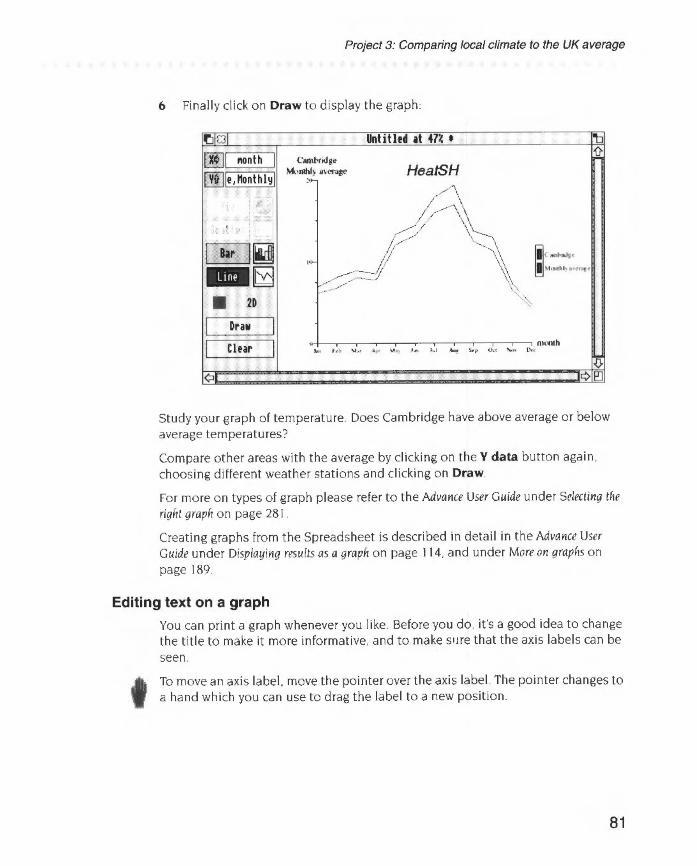
Project 3: Comparing local climate to the UK average
6 Finally click on Draw to display the graph:
001 ..onth I [IDle, Monthly!
I~ El
• 20
I Draw
I Clear
¢
Untitled it 47~ •
HeatSH
• month ~ hl - ~ - ~ M - ~ fu ~ ~
Study your graph of temperature. Does Cambridge have above average or below average temperatures?
Compare other areas with the average by clicking on the V data button again. choosing different weather stations and clicking on Draw
For more on types of graph please refer to the Advance User Guide under Selecting the right graph on page 281
Creating graphs from the Spreadsheet is described in detail in the Advance User Guide under Displaying results as a graph on page 114, and under More on graphs on page 189.
Editing text on a graph
t
You can print a graph whenever you like. Before you do. it's a good idea to change the title to make it more informative. and to make s•Jre that the axis labels can be seen.
To move an axis label . move the pointer over the axis label. The pointer changes to a hand which you can use to drag the label to a new position .
81
Plotting a graph comparing an area's temperature with the UK average
82
By default the Graph tool uses the filename of the database or CSV file as a title for the graph. To change the title:
I Move the pointer over the title and double-click on it A caret appears in the text
2 Double-dick on the t itle again to select it.
3 Give the graph an appropriate title.
4 Change your t itle to bold text by triple-clicking on the title to select all the text and then choosing Effect/Bold.
Note: Changes to text are not saved if you draw a new graph So only change text when you're satisfied with the rest of the graph.
For a full description of how to edit text on a graph see the section Editing text on a graph on page 279 of the Advance User Guide.
Printing a graph
To print a graph:
Make sure that a suitable printer is correctly connected and set up. and that the !Printers application is loaded onto the icon bar (the RISC OS 3 User Guide describes this) . If you have a I MB computer and wish to print. please refer to Using Advance on I MB or 2MB computers on page 303 of the Advance User Guide.
2 Make sure that the graph you wish to print is displayed in the Graph window
3 Click somewhere in the Graph window (this makes sure that data is printed from the Graph window. not from any other wmdow you might have open at the time).
4 Go into the Print box by choosing File/Print.
5 Type in the number of copies you want and click on Print
The graph will be printed. including any edits you have made.
Saving a graph
You can save a graph in two formats; as Graph data or as a Draw file. You'll be saving your graph as a Draw file.
Saving a gra ph as a Draw file
Saving a graph in Draw file format gives you a permanent record of the current graph, exactly as it's displayed on the screen. You can edit and annotate the Draw file using any of Draw's tools.
Save your graph as a Draw file:
Project 3: Comparing local climate to the UK average
Go into the File/Save as Draw dialogue box and type in a suitable filename. (Note that this file is already saved as Draw3 in the Project 3 directory.)
2 Drag the icon to your directory display.
Note Graphs saved as Draw files can take up a large amount of storage space. so make sure that you have enough space available on your disc
Saving a graph as Graph data
A Graph data file contains all the data needed to redraw a graph, and any format settings (like text font and colour) but discards any edits you've made to the text.
You don't need to do this now. but here's how to save a graph as a Graph data file: Go into the File/Save as Graph dialogue box and type in the fi lename. then drag the icon to your directory display.
The fi le GraphData3 in the Proj ect3 directory conta ins the data from your spreadsheet file.
Closing files and freeing up memory
You won't need to use the Spreadsheet or Graph tools again for a while. so you should now close your open file(s) .
Then click Menu on the Advance icon on the icon bar, and choose Minimise memory
Further suggestions
Other comparisons
You may like to compare rainfall and hours of sunshine data. To do this you'll need to go back to the Database, create a CSV file of your chosen data and import this into a new spreadsheet, where you can edit it as before
Sorting records
The records in the Advance weather database are supplied sorted into alphabetical order using the weather station name.
Under each station. the records are sorted into calendar order. So. the record you can see is the one which comes first in the alphabet. and has the name of the first month of the year. In this case it is the January record for Ba la (unless data you have entered comes before this).
You can however sort your database into any order you like
83

Further suggestions
Sorting can be very useful for finding a piece of data quickly. You'll use sorting to find out which weather station had the highest and lowest temperatures during 1990.
To begin a sort. load WeatherDB into Advance. and the choose the Utilities/Sort option. The Sort window is then displayed:
~ I Sort I
MfathtrDB at 111% • ~
- ----------- ·-... cr~sr dail) hotn ol :.url'hnu I # I
r---, I I , ___ ,
! f1" ! :nerogedail) len~J)er.tu~ I I
: ~ : maximwn remp.:Nu~ I , I I I
: : minirnunt tem~r.•u•-e I I I I
:_ ____ . __________ J ~ttl r.unfolll
r---; oc .._ ___ , r---· ._ _ _]•c
r---1 •c ___ , r=lmm
.---., I I
__ J
.---, da) > -..uh h"'l :_ __ j
d'l)'s wolh thunder ,---"'1 I I • ___ J
,---., day~> wnh tog L__J
.-------------, I ' I I I I I I I I I
I I I I I I
I I I _______ .;. _____ .J
You can see the current sort options; first. sort weather stations into alphabetical order. second. sort months into date order.
Sorting into order of temperature
84
Sorting minimum temperatures
To remove the current sort settings, click on the Clear button.
2 Click Select in the minimum temperature field . The label 'I 1-9' appears inside the field. The ·I · indicates that this is the first sort field, ·I -9' indicates that this is a numeric field which will be used to sort the records into ascending order (the record with the lowest minimum temperature will be placed first in the database)
3 Then click on the Sort button
After a few seconds you are returned to the One Record window. The records have been sorted into numeric order using the contents of the minimum temperature field box.

Project 3: Comparing local climate to the UK average
The first record is the January record for Lairg. If you page through the database you'll see that this is the record with the lowest minimum temperature.
Sorting maximum temperatures
Although your sort showed you the record with the lowest recorded minimum temperature. it did not help you to find the highest recorded temperature. To find this. you need to do a second sort. this time using the maximum temperature field.
Writing a report
Remove the current sort setting by clicking on the Clear button
2 Click Select in the maximum temperature field. The label '1 1-9' appears inside the field.
3 You want the record with the highest temperature to be placed first in the database. so click Select again in the maximum temperature field. The label changes to read 'I 9- 1'.
4 Then click on the Sort button.
After a few seconds you are returned to the One Record window. The records have been sorted into numeric order using the contents or the maximum temperature field box
The first record is the August record for Cambridge
Sorting is explained in detail in the Advance User Guide under Sorting records on page 226
You can use the Advance Word Processor to produce a written report about your findings
Before you start work. you need decide what you want to include in your document. and how you want it to look. As well as some text about what you have learned. you may want to include some examples of the work you have done using the Advance Database. Spreadsheet and Graph tool.
85
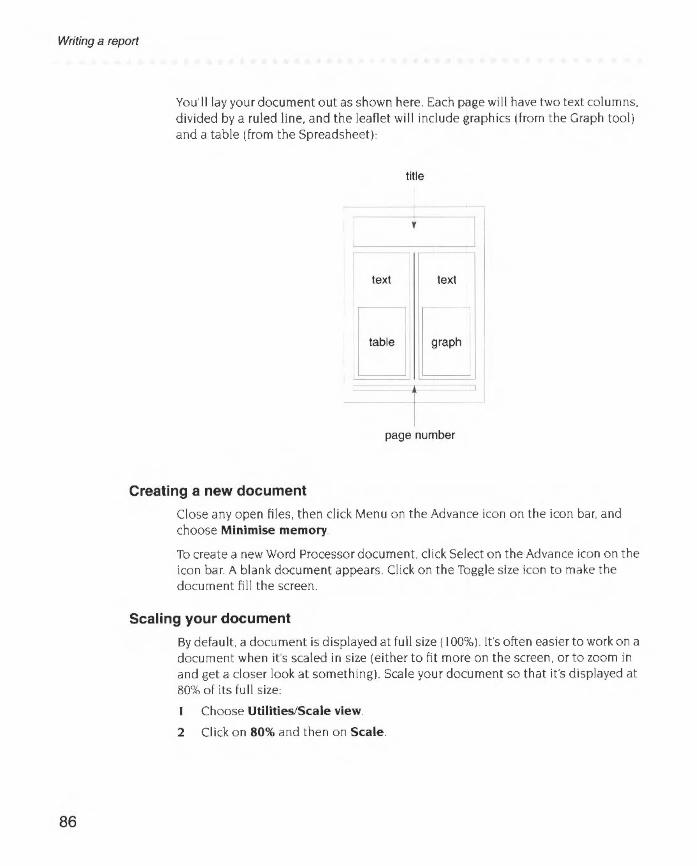
Writing a report
86
You'lllay your document out as shown here. Each page will have two text columns. divided by a ru led line, and the leaflet will include graphics (from the Graph tool) and a table (from the Spreadsheet):
title
-'
text text
page number
Creating a new document
Close any open files. then click Menu on the Advance icon on the icon bar, and choose Minimise memory.
To create a new Word Processor document. click Select on the Advance icon on the icon bar. A blank document appears. Cl ick on the Toggle size icon to make the document fill the screen.
Scaling your document
By default. a document is displayed at full size (I 00%). It's often easier to work on a document when it's sca led in size (either to fit more on the screen. or to zoom in and get a closer look at something). Scale your document so that it's displayed at 80% of its full size:
Choose Utilities/Scale view.
2 Click on 80% and then on Scale.

Project 3: Comparing local climate to the UK average
Changing the page size
Choose the Edit/Alter pages option to d isplay the Alter pages dialogue box. Change the settings in this box to those shown below
~ Rlhr Pi'lfS
.-- Pige sin 0 R3 ~ A4 0 AS
0 Custo11 llidth : Dtpth:
.-- ForiNt ~Portrait 0 landscape c=J Facing pagts
1§1 Margins Top: iLSScll I Botto11: i1.4Scll I left: it. 284cll I Right: it. 287cll I
~ Htader Depth: i4cll I ~ Footer Depth: IL27clll I ~ Vertical rules
~~ Colu1111s IIIIer: [] Width: IB. 897clll I Gaps: I8.63Sclll I I
Rtstart page nullber ing at 11 I
I Cancel I I OK I Cl ick on Header and Footer to set header and footer frames
2 Set the Depth of the Header frame to 4cm
3 Click in the Vertical rules box to specify a vert ical line between the columns.
4 Change the Columns Number to 2.
87
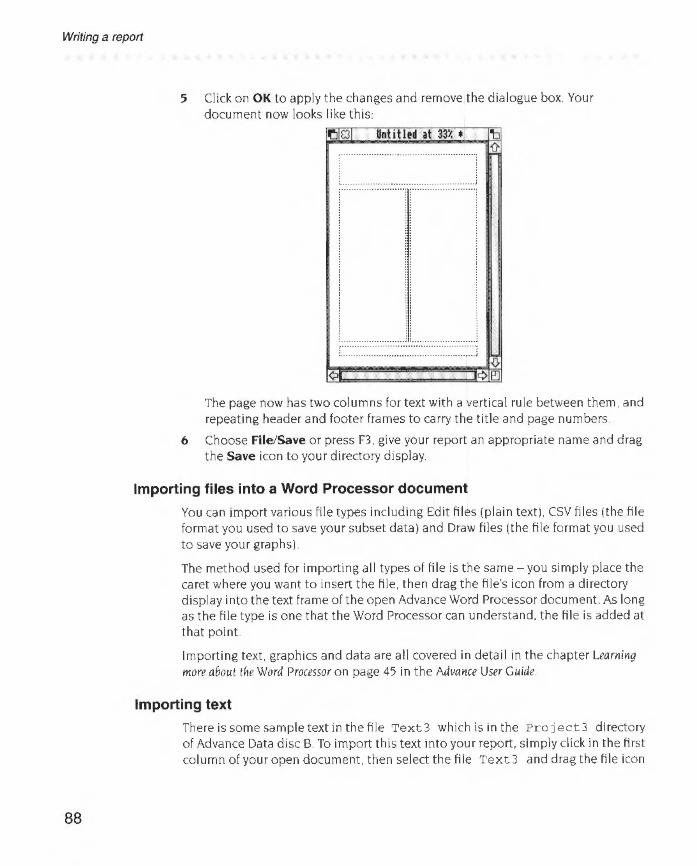
Writing a report
88
5 Click on OK to apply the changes and remove the dialogue box. Your document now looks like this:
=~~~, o=3,_l__,..Un..,..h,..,.. t.,....l ~...,..d -i ,...t =33=%-.-_,...,'b '{} , ................................................... !
: ................................................... : l' ........................ ~ l' ........................ ~ : :: : : :: : ~ j 1 1
l ll : 1 ~ ~ l
I I, I
¢
l ......................... j ~ . . . • ••••••..•••.•...• t···················································· .. :.. •••••••••••••••••••••••••••••••••••••••••••••••••••• J
The page now has two columns for text with a vertica l ru le between them. and repeating header and footer frames to carry the title and page numbers.
6 Choose File/Save or press F3. give your report an appropriate name and drag the Save icon to your directory display.
Importing files into a Word Processor document
You can import various file types including Edit files (plain text). CSV files (the file format you used to save your subset data) and Draw files (the file format you used to save your graphs) .
The method used for importing al l types of fi le is the same- you simply place the caret where you want to insert the file. then drag the fi le's icon from a directory display into the text frame of the open Advance Word Processor document As long as the file type is one that the Word Processor can understand. the file is added at that point
Importing text. graphics and data are all covered in deta i l in the chapter Learning more about the Word Processor on page 45 in the Advance User Guide
Importing text
There is some sample text in the fi le Text3 wh ich is in the Proj ect3 directory of Advance Data disc B. To import this text into your report. simply click in the first column of your open document. then select the file Text3 and drag the file icon
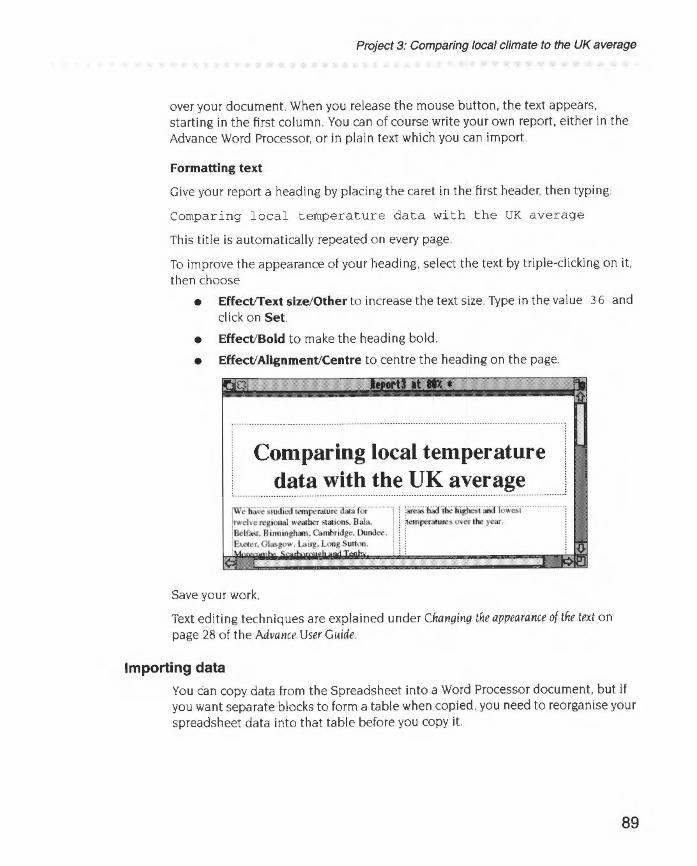
Project 3: Comparing local climate to the UK average
over your document. When you release the mouse button. the text appears. sta rting in the first column. You can of course write your own report. either in the Advance Word Processor. or in plain text which you can import.
Formatting text
G1ve your report a heading by placing the caret in the first header. then typing:
Comparing local temperature data with the UK average
This title is automatically repeated on every page.
To improve the appearance of your heading. select the text by triple-clicking on it. then choose
• Effect/Text size/Other to increase the text size. Type in the value 3 6 and cl ick on Set.
• Effect/Bold to make the heading bold.
• Effect/Alignment/Centre to centre the heading on the page.
Comparing local temperature data with the UK average
Save your work.
Text editing techniques are explained under Changing the appearance of the text on page 28 of the Advance User Guide.
Importing data
You can copy data from the Spreadsheet into a Word Processor document. but if you want separate blocks to form a table when copied. you need to reorganise your spreadsheet data into that table before you copy it.
89
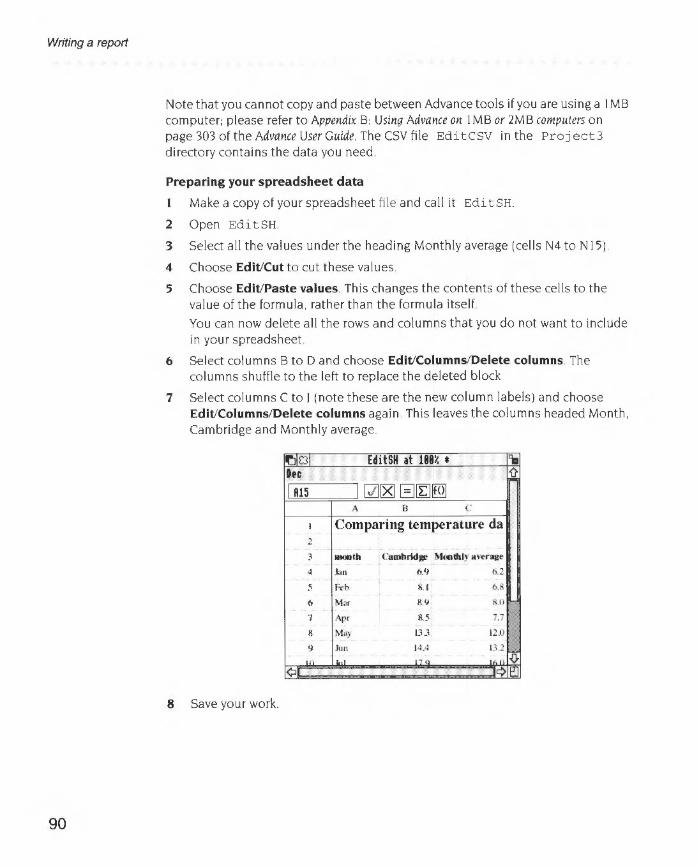
Writing a report
90
Note that you cannot copy and paste between Advance tools if you are using a I MB computer; please refer to Appendix B: Using Advance on I MB or 2MB computers on page 303 of the Advance User Guide. The CSV fi le Edi tCSV in the Proj ect3 directory contains the data you need.
Preparing your spreadsheet data
I Make a copy of your spreadsheet fi le and call it Edi LSH.
2 Open Edi tSH.
3 Select all the values under the heading Month ly average (cells N4 toN 15).
4 Choose Edit/Cut to cut these va lues.
5 Choose Edit/Paste values. Th is changes the contents of these cells to the value of the formula. rather than the formula itself.
You can now delete all the rows and columns that you do not want to include in your spreadsheet
6 Select columns B to D and choose Edit/Columns/Delete columns. The columns shuffle to the left to replace the deleted block
7 Select columns C to J (note these are the new column labels) and choose Edit/Columns/Delete columns again . This leaves the columns headed Month, Cambridge and Month ly average.
~lf.:JI EditSH at 188% • '11 Dec i}
lm I ~~ B~lilll A B c
I Comparing temperature da 2
3 munt.h Cambrldg.e Monthl-y lll'ffllge
4 .kln 6.9 6.2 + ·
5 Feb 8.1 6.8
6 Mar &.9 8.0
7 Apr 8.5 7.7 . ~
8 May 133 12.0···.~ 9 Jun 14.4 13.2 "'1!1-
Ill 1'70 . " .0. ¢• ¢eJ
8 Save your work.

Project 3: Comparing local climate to the UK average
Copying from the Spreadsheet into the Word Processor
You can now copy the data into your report
Select rows 3 to 15 by clicking on the row labels
2 Choose Edit/Copy.
3 Go back to your report and place the caret in the document at the point at which you wish the data to appear:
~101 RfPort3 lit 81% • '11 -I ('fed IJI b dlttabast. I'IW ~ sp<eadsh..'d. \\'~ : ~ w'tr~ tho!n able 10 ~ th.! sptc.od•h«< ~~ click here
\ W<>tk <'lUI !be lllOOtbly UK •~•npetlllul\" a\~·~~-
'The data fur oorown art~.~ . ..00 tilt tll<IO'llhly :0\etaJ:e> w~ .:-akula~ed rue $h""" ~l,>w.
~ ! kable oflorol duta :ond illllfllhl) *'e"'8"' ! lwe u>ed uline srapllm hdpu.> compat< the In' t'rOJ< tempettllllre 'Wile$ wtth those of lour hlCal v.<athtr <tllllulOl.
i ! ~ ¢1~ ]Q E!J
4 Choose Edit/Paste .
You now have your data in your document.
Tidying your table of data
Your data has been copied into your report exactly as it appeared in the spreadsheet However, if you have used a CSV file to transfer your data, you will find that the monthly average figures now have several numbers after the decimal point. Delete the extra figures after the decimal point, rounding up where appropriate.
To tidy up the general appearance of your table. you need to use the ruler to realign the tabs. To display the ruler. choose the Ruler/Show ruler option. The tab symbols you'll need to use are
centre tab decimal tab
91

Writing a report
92
To tidy up the columns of data:
I Highlight the whole of the table.
2 Get rid of the three existing tabs by dragging them upwards from the ruler.
3 Click on the decimal tab symbol and then click just below the ruler at the 3cm position and again 6.5cm position. Note that these positions are approximate; you can drag tab symbols along the ruler to position them where they look best.
4 Give the ruler the name Decimal Tabs and press Return.
5 Next select the table's column headings only, and drag the existing tabs off the ruler.
6 Click on the centre tab symbol and then click just below the ruler at the 3cm position and again at the 6.5cm position.
7 Give the ruler the name CentreTabs and press Return.
~1(31 RePort3 at 81~ • ... 1••1•11 J L. , A= A A lr!!Ii!!J ID•ci.a!Tabs• I Copy to -o-• ll . I • •' •• •• .a ,u ,:II ,sa
A A A A A A
~ ~ 6.9 6.1 Feb 3.1 6.8 Mat 3.9 3.0 Apt 8.5 7.7 M:l) 13.3 12.0 un 1<1.4 13.2 ul 17.9 16.0
A us 19.3 16.9 Sep 13.7 I~
Oct 1:!.9 11.3 No- ?.3 6.5 Dec 4.7 4.3 : .0.
¢ --c)eJ
8 The table headings are still selected. so you can now change the font by choosing Effect/Bold.
Your table now looks much neater.
9 The l ine of text below the table is a caption which goes with the table. Select this line of text. and change its font to Italic, and its alignment to Centre.
10 Hide the ru ler by choosing Ruler/Show ruler.
II Save your work.

Project 3: Comparing local climate to the UK average
Importing graphics To import a graph into your report. place the caret where you want the graph to appear. as shown here:
place the caret here
Comparing local temperature data with the UK average
, ··li:i\-e·~iooiecrrenijie'r.iiiireiliii.i· ro;··········:
i"•~h~ t<lfta! weather SIMtons. Bala. ! ;&11"-". Bmn ~ • CambrKI~. Dll~. ;
---.
!&et<r. Gl:asgow.l1i' Long Sooon. ! ~JI.t<>r(Carnb<, Smrborougli Tmb). . ~
!Wt- oopkd rhe tiara. whidl WM intiolly : i>~orcd ill u d.>u.ba!e, inro a spreadshtet. We : . :~.,then abklrouserhe ~"-10 ! ! !wort out tbe monthly UK letlll""liiUR! i i
¢
roHowing V"f'h •"""'• u; th31 bndge had abo•t- a••"'!" """prrlllum.
<lllriiJ the whole y .. r.Tetnpernlu~ dllrtnJ tilt mOIII.II of Au gUS~ were con!ldctably abo''" the avemge.
I
2 Select the Draw file Draw3 and drag the file icon to your open document.
3 Release the mouse button to drop the graph into the document window.
A warning appears informing you that the graphic is too large and that it will be cropped. Don't worry about this: you'll resize your graph as soon as it is in the document. For the time being, just click on OK to import the graphic.
Changing the slze of your graph
You need to reduce the size of your graph so that it fits within the boundary of the text frame Scroll down to the next page of your document and then ·
I Double-click on the graph to display the Alter graphic dialogue box
~I llhr 1r1phic
Se~lt &Ell% Rsptct X: Y 111 ~
~ Hidt triPhic leek HPtCt
I CiRCtl I I Fit to friM I I or I 2 Click on Fit to frame. This alters the scale of your graphic so that it fits within
the frame.
3 The new scale of the graph is much better, so click on OK to accept the change.
93

Writing a report
The graphic is still too tall: there is too much space at the top and the bottom:
empty space
~. 0\\'~·iiM·iiii-ial a.:: ·<Lio~· t~<•'t<riti.itii;········ ···~
_ .._,_""'"' middle top handle
4 Delete the empty space by dragging the middle top handle downwards and the middle bottom handle upwards
5 The line of text below your graph is a caption which applies to the graph. Select thi s line of text, and change its font to Italic. and its alignment to Centre as you did for the last caption.
6 Save your work.
Inserting a page number
94
To add the page number to the bottom of each page go to the footer on the first page. (You can do this by double-clicking on any footer.)
2 Type Page and then press Space.
3 Choose Ut11ltles/lnsert!Page number.
The page number is inserted in the footer frame It IS currently al igned to the lefthand side of the footer.

Project 3: Comparing local climate to the UK average
4 Double-click on the footer text to select it, and then choose Effect! Alignment/Centre.
IIJI£31 :Aug ~Sep ~Oct ~N.w io..c
19-~ JJ.7 J2.9
7:3 4.1
16.9 12.~
11.3 6.5 4.3
Report3 at 88% • : :OOUIIXISC ll OfUC'f 0 "nu $p«'l l<'
~infomlati<lll. ond wereable to lind whw:h !areas hnd the highest and lowe-st !1'\.'111!'<-'rotu.re' o><:r the ye-ar.
: Tablt• <(IIJ!I.ol dilla all<i lfh'lflllily m'r.l'agt•J : : :
!we 1110.~1 "line gt<aph to hell) us C.llllpure the! ~ver~gc temperatuRe ' ·alu<.os with ill<- af ~
~lll·~·~.~~.h<:'f.•IJllillil.' ........................... j
Checking the spelling
It is always wise to check your work for spelling mistakes when you've finished working on it. To do this. position the caret in the text and select the Utilities/Spelling/Check entire text option. (This option checks all the text in a document. starting from the beginning.)
A dialogue box may appear warning you that the spelling checker has not yet been loaded. Click on SPELL to load the default spel ling checker.
• If a spelling mistake is found. a dialogue box is displayed. and you can correct your mistake before continuing with the check.
• If no mistakes are found. the cursor simply moves to the end of the document.
Save your work.
Printing
When you've finished your report. you can print it out.
Make sure that a suitable printer is correctly connected and set up. and that the !Printers application is loaded onto the icon bar (the RISC OS 3 User Guide describes this) If you have a 1MB computer and wish to print, please refer to Using Advance on 1MB or 2MB computers on page 303 of the Advance User Guide.
To print your report. choose File/Print and then click on Print in the dialogue box.
95

Quitting Advance altogether
Quitting Advance altogether
Summing up
96
To quit Advance altogether, press Menu on the Advance icon on the icon bar and then click Select on the Quit option.
You've now finished your report on comparing local climate to the UK average and have reached the end of Project 3. You have used the Advance Database. Spreadsheet. Graph and Word Processor tools.
In this project you have learnt how to:
• search a database for several records at once:
• transfer al l temperature data to a spreadsheet and format it so that you have a neat table
• calculate average monthly figures for temperature
• compare local data with other areas and with the ca lcu lated average, all on the same graph
• sort the database to extract maximum and minimum information
• create a two~column report containing examples of your work.
The projects in this guide have shown you just a few of the features of the Acorn Advance software suite. For further reference. please see the Advance User Guide.
Appendix A: Collecting your own climate data
If you wish to record your weather for inclusion in the weather database. there are kits available for schools from:
Hatfield Advisory Unit: Computers in Education
126 Great North Road
Hatfield
Herts
Tel: 0707 2667 14
Michael lay Publications
St Just
Cornwall
Tel: 0736 787808
If you wish to add local data for 1990 to the database. you may like to purchase the appropriate Meteorological Office Monthly Weather Reports These can be obtained from:
Her Majesty's Stationery Office
49 High Holborn
London
WCIV 6HB
Her Majesty's Stationery Office
80 Chichester Street
Belfast
BT l 4JY
Schools that have Campus PI us have access to a considerable range of weather and cl imate data on Prestel These schools also have access to Meteosat images and da ily weather data for Gosport (a service provided for Hampshire Microtechnology Centre and Campus 2000 by St Vincent's 6th Form College. Gosport).
I low to add data to your database is explained under Entering data on page 211 of the Acorn Advance User Guide.
97

98

Reader's Comment Form Acorn Advance Climate Project Guide
We wou ld greatly appreciate your comments about this Manua l. wh ich wi ll be taken into account for the next issue:
Did you find the information you wanted?
Do you like the way the information Is presented?
General comments:
If there is not enough room for your comments, please continue overleal
How would you classify your experience with computers I
D F'irsHime user Used computers before Experienced user Programmer
Cut out (or photocopy) and post to Dept RC. Technical Publ ications Acorn Computers Limited 645 Newmarket Road Cambridge CB5 8PB England
Your name and address:
This information will only be used to get in touch with you in case we wish to explore your comments further J

s ~ • • • • • • • ~ : ~ • • • • • '


SKD 78