Project cycle management - Tearfund...
83
ROOTS ROOTS: Resourcing Organisations with Opportunities for Transformation and Sharing Project cycle management 5 ROOTS
Transcript of Project cycle management - Tearfund...

ROOTS
ROOTS: Resourcing Organisations with Opportunities for Transformation and Sharing
Project cycle management
5 ROOTS
ROOTS 5 PCM brand E.indd FC1ROOTS 5 PCM brand E.indd FC1 3/3/09 11:05:39 am3/3/09 11:05:39 am
■ ROOTS 9 – Reducing risk of disaster in our communities. Looks at a process called ‘Participatory Assessment of Disaster Risk’, which enables communities to consider the hazards they face, their vulnerabilities, their capacities, and how they can take action to reduce disaster risk.
■ ROOTS 10 – Organisational governance. Looks at governance principles and issues so that organisations can improve their governance structure or set up a governing body if they do not already have one.
■ ROOTS 11 – Partnering with the local church. Looks at how Christian organisations can work more closely with local churches.
■ ROOTS 12 – Human resource management. Looks at policy and practice relating to people who work for an organisation, including information about recruitment, contracts and managing and developing staff.
All are available in English, French, Spanish and Portuguese.
For further details write to:Resources Development, Tearfund, 100 Church Road, Teddington, TW11 8QE, UK or email: [email protected]
© Tearfund 2003Reprinted 2009
ISBN 978 1 904364 21 7
Published by Tearfund. A company limited by guarantee. Registered in England No 994339. Registered Charity No 265464.
Tearfund is a Christian relief and development agency working with a global network of local churches to help eradicate poverty.
Tearfund, 100 Church Road, Teddington, TW11 8QE, UKTel: +44 (0)20 8977 9144Email: [email protected]: www.tearfund.org/tilz
5Project cycle management
By Rachel Blackman
Cartoons: Bill Crooks
Design: www.wingfinger.co.uk
The author wishes to thank Isabel Carter, Mike Carter, Toyditz Cosico, Dewi Hughes, Sheila Melot, Hilda Mukui, David Mundy for their input. Thanks to our partners who field tested this resource. Thanks to the Centre for International Development and Training, University of Wolverhampton, for training Tearfund’s International Group staff in Project cycle management in July 2002. Their training materials have been used as a basis for some of the sections in this resource.
Knowing how Tearfund’s publications are used by partners and other organisations helps us to improve the quality of future publications. If you wish to give feedback on this book, please write to Tearfund or email: [email protected]
Other titles in the ROOTS series are:
■ ROOTS 1 and 2 – Advocacy toolkitA set of two separate books: Understanding advocacy (ROOTS 1) and Practical action in advocacy (ROOTS 2). Available only as a set.
■ ROOTS 3 – Capacity self-assessment. An organisational assessment tool to enable organisations to identify their capacity-building needs.
■ ROOTS 4 – Peace-building within our communities. Learning points taken from case studies of Tearfund partners who have been involved in encouraging peace and reconciliation in communities.
■ ROOTS 6 – Fundraising. Shows how to develop a fundraising strategy and contains ideas to help organisations diversify their funding base.
■ ROOTS 7 – Child participation. Looks at the importance of including children in community life and in project planning, implementation and evaluation.
■ ROOTS 8 – HIV and AIDS: taking action. Looks at how Christian organisations can respond to the challenges brought by HIV and AIDS, such as reducing the impact of HIV and AIDS, preventing the spread of HIV and addressing HIV and AIDS issues within organisations.
ROOTS
ROOTS 5 PCM brand E.indd FC2ROOTS 5 PCM brand E.indd FC2 3/3/09 11:05:41 am3/3/09 11:05:41 am

ROOTS 5 PROJECT CYCLE MANAGEMENT
© T E A R F U N D 2 0 0 3
Project cycle management
by Rachel Blackman
© T E A R F U N D 2 0 0 3
ROOTS 5 PCM brand E.indd 1ROOTS 5 PCM brand E.indd 1 3/3/09 11:05:41 am3/3/09 11:05:41 am

ROOTS 5 PROJECT CYCLE MANAGEMENT
2
ROOTS 5 PCM brand E.indd 2ROOTS 5 PCM brand E.indd 2 3/3/09 11:05:41 am3/3/09 11:05:41 am

ROOTS 5 PROJECT CYCLE MANAGEMENT
3
Contents Glossary 5
Introduction 7 Planning 8
The project cycle 10
SECTION 1 Project identification 13
SECTION 2 Project design 19 2.1 Stakeholder analysis 20
2.2 Research 29
2.3 Problem analysis 34
2.4 Logical frameworks 38
Completing a log frame 41 • STAGE 1 Summary of objectives 41 • STAGE 2 Assumptions 45 • STAGE 3 Indicators and evidence 51
2.5 Proposal 59
2.6 Action planning 59
SECTION 3 Implementation and evaluation 65
SECTION 4 Celebrating success 73
SECTION 5 Appendices 75 Interaction with donors 75
Suggested workshop timetable 77
© T E A R F U N D 2 0 0 3
ROOTS 5 PCM brand E.indd 3ROOTS 5 PCM brand E.indd 3 3/3/09 11:05:42 am3/3/09 11:05:42 am

ROOTS 5 PROJECT CYCLE MANAGEMENT
4
ROOTS 5 PCM brand E.indd 4ROOTS 5 PCM brand E.indd 4 3/3/09 11:05:42 am3/3/09 11:05:42 am
ROOTS 5 PROJECT CYCLE MANAGEMENT
5
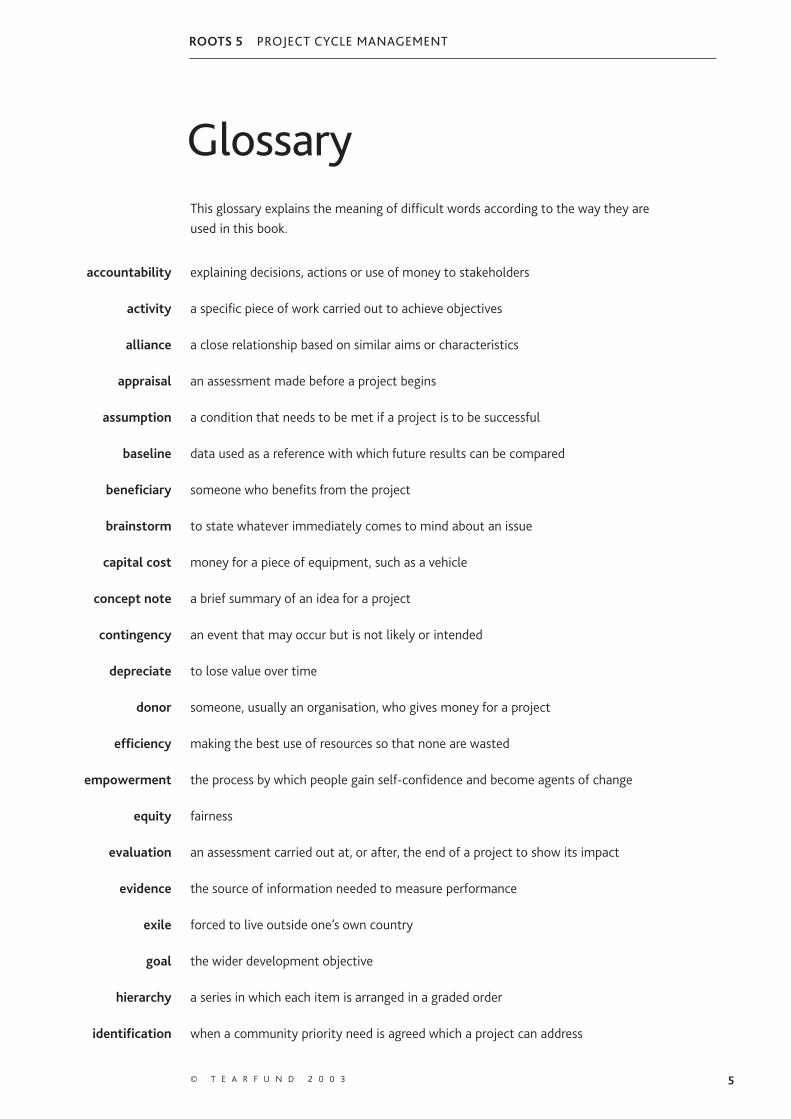
GlossaryThis glossary explains the meaning of difficult words according to the way they are used in this book.
accountability explaining decisions, actions or use of money to stakeholders
activity a specific piece of work carried out to achieve objectives
alliance a close relationship based on similar aims or characteristics
appraisal an assessment made before a project begins
assumption a condition that needs to be met if a project is to be successful
baseline data used as a reference with which future results can be compared
beneficiary someone who benefits from the project
brainstorm to state whatever immediately comes to mind about an issue
capital cost money for a piece of equipment, such as a vehicle
concept note a brief summary of an idea for a project
contingency an event that may occur but is not likely or intended
depreciate to lose value over time
donor someone, usually an organisation, who gives money for a project
efficiency making the best use of resources so that none are wasted
empowerment the process by which people gain self-confidence and become agents of change
equity fairness
evaluation an assessment carried out at, or after, the end of a project to show its impact
evidence the source of information needed to measure performance
exile forced to live outside one’s own country
goal the wider development objective
hierarchy a series in which each item is arranged in a graded order
identification when a community priority need is agreed which a project can address
© T E A R F U N D 2 0 0 3
ROOTS 5 PCM brand E.indd 5ROOTS 5 PCM brand E.indd 5 3/3/09 11:05:42 am3/3/09 11:05:42 am
ROOTS 5 PROJECT CYCLE MANAGEMENT
6 T E A R F U N D R O O T S R E S O U R C E S
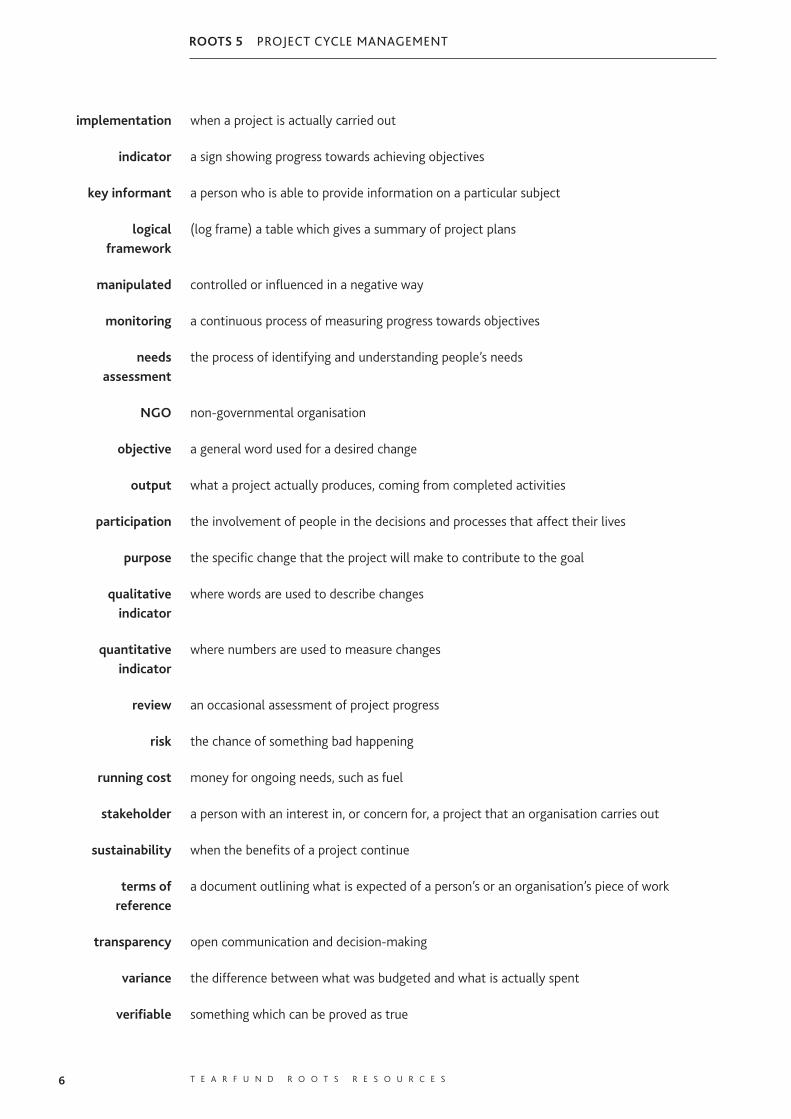
implementation when a project is actually carried out
indicator a sign showing progress towards achieving objectives
key informant a person who is able to provide information on a particular subject
logical (log frame) a table which gives a summary of project plans framework
manipulated controlled or influenced in a negative way
monitoring a continuous process of measuring progress towards objectives
needs the process of identifying and understanding people’s needs assessment
NGO non-governmental organisation
objective a general word used for a desired change
output what a project actually produces, coming from completed activities
participation the involvement of people in the decisions and processes that affect their lives
purpose the specific change that the project will make to contribute to the goal
qualitative where words are used to describe changes indicator
quantitative where numbers are used to measure changes indicator
review an occasional assessment of project progress
risk the chance of something bad happening
running cost money for ongoing needs, such as fuel
stakeholder a person with an interest in, or concern for, a project that an organisation carries out
sustainability when the benefits of a project continue
terms of a document outlining what is expected of a person’s or an organisation’s piece of work reference
transparency open communication and decision-making
variance the difference between what was budgeted and what is actually spent
verifiable something which can be proved as true
ROOTS 5 PCM brand E.indd 6ROOTS 5 PCM brand E.indd 6 3/3/09 11:05:42 am3/3/09 11:05:42 am
ROOTS 5 PROJECT CYCLE MANAGEMENT
7© T E A R F U N D 2 0 0 3
IntroductionProject cycle management (PCM) is the term given to the process of planning and managing projects, programmes and organisations. It is used widely in the business sector and is increasingly being used by development organisations. Development projects sometimes fail because they are badly planned and do not take account of some important factors, particularly the needs and views of stakeholders. PCM is based around a project cycle, which ensures that all aspects of projects are considered. A central value of the PCM method is that aspects of the project are reconsidered throughout the project cycle to ensure that any changes which have occurred are included in the project design. As a result, projects are more likely to be successful and sustainable.
PCM involves a set of planning tools which feed into the logical framework (commonly known as a log frame). The log frame is a table which gives a summary of the project plans. Some donors now expect log frames to be submitted alongside project proposals. Log frames can seem quite complex to many people. This means that some organisations find they are unable to access donor funding. This book explains the process of completing log frames in a simple way in order to increase the ability of organisations to access such funding. However, organisations may want to start to use the log frame for all their projects, whether they are applying for donor funding or not. This is because the process of completing the log frame is in many ways more useful than the end product. The process is important for project success, sustainability and organisational learning.
Throughout the book we talk about using project cycle management for projects because this is probably the main way in which PCM will be used. However, all of the tools can be used just as effectively for planning programmes and managing and developing organisations.
ROOTS 5 PCM brand E.indd 7ROOTS 5 PCM brand E.indd 7 3/3/09 11:05:43 am3/3/09 11:05:43 am
8 T E A R F U N D R O O T S R E S O U R C E S
ROOTS 5 PROJECT CYCLE MANAGEMENT
T E A R F U N D R O O T S R E S O U R C E S
Planning
Why is good planning
important?
‘The plans of the diligent lead to profit as surely as haste leads to poverty.’ Proverbs 21:5
There is a phrase ‘If you fail to plan, you plan to fail.’ Think of examples of when things have gone wrong because planning was not carried out adequately. Why did things go wrong? What was not taken account of?
There are many reasons why planning is a good idea. Planning helps to:
■ think ahead and prepare for the future
■ ensure the right direction
■ identify issues that will need to be addressed
■ consider whether a project is possible
■ make the best use of resources
■ motivate staff
■ ensure smooth running of projects
■ clarify goals and develop vision
■ establish the reason for doing something
■ choose between options
■ obtain funds and other resources
■ allocate resources and responsibilities
■ guide implementation of projects
■ achieve the best results.
The book of Nehemiah tells how Nehemiah led the rebuilding of the wall of Jerusalem, which had been burnt down by the Babylonians.
■ Chapter 1 tells us about Nehemiah’s calling by God to the task. What does this chapter tell us about:
• Nehemiah’s sensitivity to God’s will?
• Nehemiah’s motivation behind the task?
• Nehemiah’s attitude as a leader?
• Nehemiah’s compassion?
• Nehemiah’s attitude to prayer?
■ All of the above factors gave Nehemiah vision for the task ahead.
• How does this challenge us in our attitude towards the work we do?
■ Proverbs 16:3 tells us ‘Commit to the Lord whatever you do and your plans will succeed.’
• What does this verse tell us about the link between prayer and planning? Is prayer alone is enough? Is planning alone enough?
• Do we plan prayerfully in our work?
Catching the vision
ROOTS 5 PCM brand E.indd 8ROOTS 5 PCM brand E.indd 8 3/3/09 11:05:43 am3/3/09 11:05:43 am
ROOTS 5 PROJECT CYCLE MANAGEMENT
9© T E A R F U N D 2 0 0 3
There are many barriers to planning. These include:
■ lack of time, or not making time to plan
■ not knowing how to plan
■ difficulty in getting the right people together
■ finding it difficult to plan because the future is so uncertain
■ wanting to do things immediately because the need is urgent, rather than think about them.
The following examples show lack of planning:
■ Someone from another country imports forks because he sees people eating with their fingers. However, in that country people usually eat with their fingers. This project does not address a real need.
■ A sanitation project is started because people are dying of diarrhoea. People believe that diarrhoea is caused by evil spirits, so they have difficulty in understanding the relevance of the project.
■ An agricultural project wants to help very poor people. An agriculturalist starts a programme of vegetable growing. While the project is technically very successful, very poor people do not benefit because they have no land.
■ A fisheries project digs ponds, but they do not hold enough water because the soil does not contain enough clay. Not enough technical information was obtained.
■ A handicraft project helps people to make shoulder bags. A year later there are large stocks of unsold bags because not enough research had been done into the marketing aspects of the project.
■ A project builds latrines, but the women do not use them because the area is badly lit and they fear attack by men. Social and cultural factors have not been taken into account.
Who should plan? A key question in the process of planning is ‘who should be involved?’ There are both advantages and disadvantages of planning alone and with different types of people.
Think through the following situations in terms of time, decision-making, conflict, responsibility,
knowledge, ownership, resources and motivation:
■ Imagine a manager in a relief and development organisation. What are the advantages of the
manager planning a project alone? What are the disadvantages?
■ Imagine a few members of staff of a relief and development organisation planning a project
together. What are the advantages? What are the disadvantages?
■ Imagine members of staff of a relief and development organisation planning a project with
community members. What are the advantages? What are the disadvantages?
Which of these situations is best? Why? How can some of the disadvantages of that situation be
overcome?
Advantages and disadvantages
ROOTS 5 PCM brand E.indd 9ROOTS 5 PCM brand E.indd 9 3/3/09 11:05:44 am3/3/09 11:05:44 am

ROOTS 5 PROJECT CYCLE MANAGEMENT
LESSON LEARNING
10 T E A R F U N D R O O T S R E S O U R C E S
The project cycleThe process of planning and managing projects can be drawn as a cycle. Each phase of the project leads to the next.
IDENTIFICATION To identify what a project will focus on, we need to find out who should benefit and what their needs are. A ‘needs assessment’ will give an overview of community problems. A ‘capacity assessment’ will help identify which problem the project should address.
DESIGN Once it is decided to go ahead with the project, we can start to think about the detail. This involves carrying out further research into the people affected by a problem and how they are affected by it. We also need to consider the risks to the project and how we will measure the project’s performance.
IMPLEMENTATION During the implementation of the project it is important to monitor and review the progress of the project and any outside changes that affect it. The project plans should be adjusted where necessary.
EVALUATION Evaluation should be carried out at or after project completion. Evaluation could be carried out a few months or years after the project has finished in order to assess its long-term impact and sustainability.
LESSON LEARNING While the project cycle is a useful way of outlining the stages of a project, it has one drawback: it makes it look as though one tool follows another. In fact, many of the planning tools can be used at any stage of the project. They should be repeated throughout the project’s life to ensure that any changes that might affect project success are accounted for. Findings should also be used for organisational learning and to improve other projects.
Identification
Implementation
Evaluation
MonitoringReviewing
Design
ROOTS 5 PCM brand E.indd 10ROOTS 5 PCM brand E.indd 10 3/3/09 11:05:44 am3/3/09 11:05:44 am
ROOTS 5 PROJECT CYCLE MANAGEMENT
11
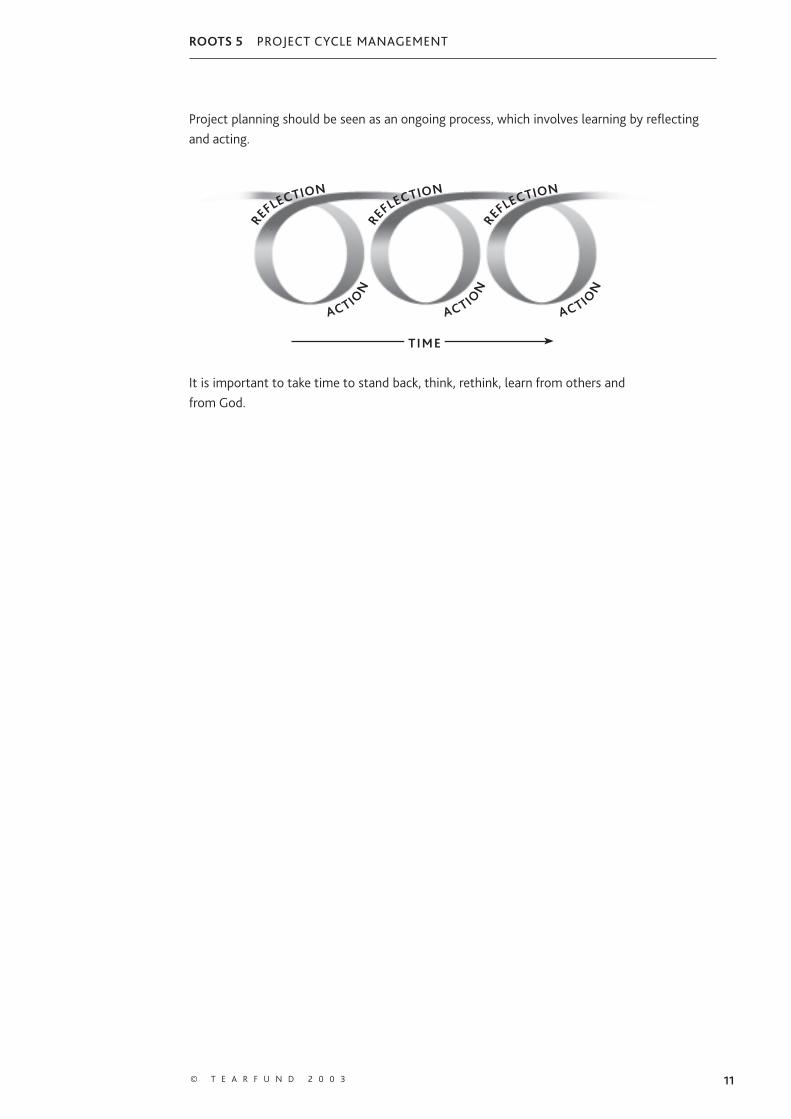
Project planning should be seen as an ongoing process, which involves learning by reflecting and acting.
It is important to take time to stand back, think, rethink, learn from others and from God.
© T E A R F U N D 2 0 0 3
REFLECTION
ACTION
REFLECTION
ACTION
REFLECTION
ACTION
TIME
ROOTS 5 PCM brand E.indd 11ROOTS 5 PCM brand E.indd 11 3/3/09 11:05:46 am3/3/09 11:05:46 am

ROOTS 5 PROJECT CYCLE MANAGEMENT
12
ROOTS 5 PCM brand E.indd 12ROOTS 5 PCM brand E.indd 12 3/3/09 11:05:46 am3/3/09 11:05:46 am
13© T E A R F U N D 2 0 0 3
ROOTS 5 PROJECT CYCLE MANAGEMENTSECTION
13© T E A R F U N D 2 0 0 3
Project identification
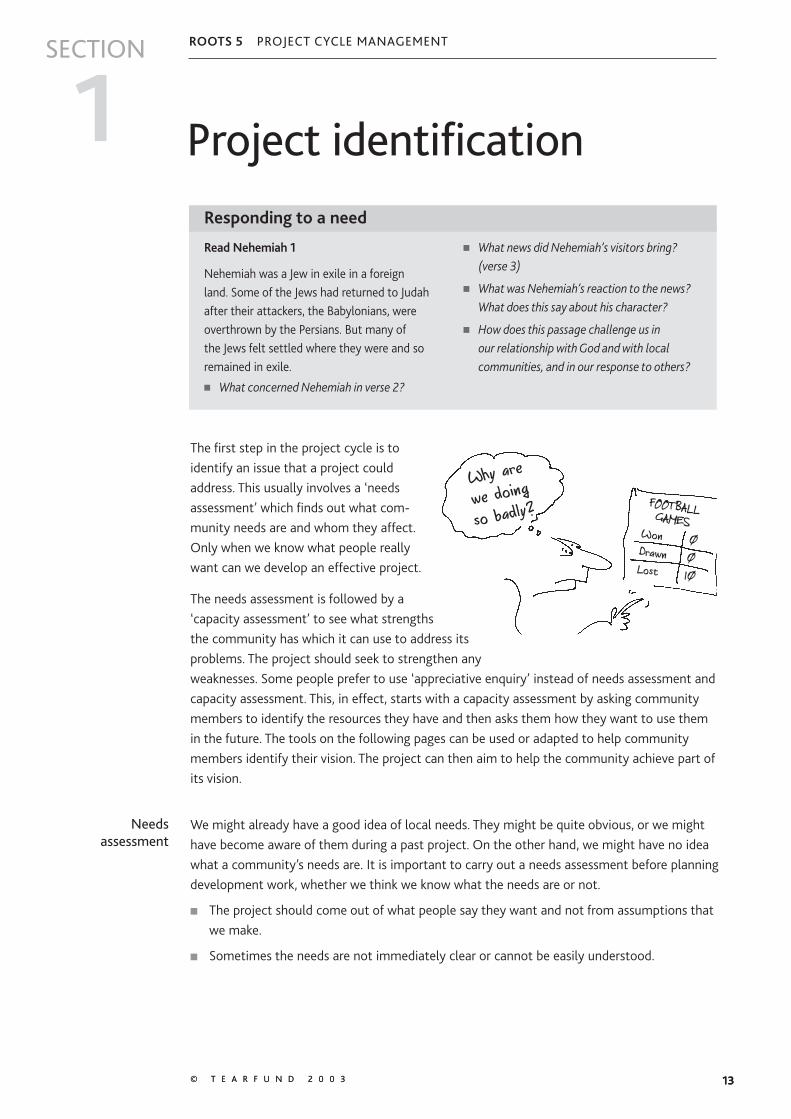
The first step in the project cycle is to identify an issue that a project could address. This usually involves a ‘needs assessment’ which finds out what com-munity needs are and whom they affect. Only when we know what people really want can we develop an effective project.
The needs assessment is followed by a ‘capacity assessment’ to see what strengths the community has which it can use to address its problems. The project should seek to strengthen any weaknesses. Some people prefer to use ‘appreciative enquiry’ instead of needs assessment and capacity assessment. This, in effect, starts with a capacity assessment by asking community members to identify the resources they have and then asks them how they want to use them in the future. The tools on the following pages can be used or adapted to help community members identify their vision. The project can then aim to help the community achieve part of its vision.
Needs assessment
We might already have a good idea of local needs. They might be quite obvious, or we might have become aware of them during a past project. On the other hand, we might have no idea what a community’s needs are. It is important to carry out a needs assessment before planning development work, whether we think we know what the needs are or not.
■ The project should come out of what people say they want and not from assumptions that we make.
■ Sometimes the needs are not immediately clear or cannot be easily understood.
Read Nehemiah 1
Nehemiah was a Jew in exile in a foreign land. Some of the Jews had returned to Judah after their attackers, the Babylonians, were overthrown by the Persians. But many of the Jews felt settled where they were and so remained in exile. ■ What concerned Nehemiah in verse 2?
■ What news did Nehemiah’s visitors bring? (verse 3)
■ What was Nehemiah’s reaction to the news? What does this say about his character?
■ How does this passage challenge us in our relationship with God and with local communities, and in our response to others?
Responding to a need
1
Why are
we doing
so badly?FOOTBALLGAMES
Won 0Drawn 0Lost 10
ROOTS 5 PCM brand E.indd 13ROOTS 5 PCM brand E.indd 13 3/3/09 11:05:47 am3/3/09 11:05:47 am

14 T E A R F U N D R O O T S R E S O U R C E S
ROOTS 5 PROJECT CYCLE MANAGEMENTProject identification1
■ By talking to different people, we will be able to understand how problems affect people differently. For example, poor access to clean water may affect women more than men because women have to walk a long way to fetch water.
■ Circumstances change:
• There may be new people in the community.
• There may be new needs.
• Old needs might have been addressed.
• Problems might be affecting people differently.
■ Needs assessment gives people an opportunity to prioritise their needs, which leads to a more sustainable development project.
The time spent carrying out a needs assessment may vary according to the contact we have had with a community in the past. In general, needs assessment is done fairly quickly. At this stage, we are trying to gain an impression of needs and who the project beneficiaries might be. We are not looking for too much detail. Further research into stakeholders and causes and effects of the problem is carried out during the design phase of the project cycle.
Try to talk to a variety of people, such as key community members or representatives of community groups. Or use methods that can draw out the views of many people in a short space of time, such as community mapping. We do not want to be raising expectations or wasting people’s time. Make sure that the people we talk to include women, men, girls, boys, the elderly, people with disabilities etc.
There are many tools that enable communities to identify their needs. A few tools are outlined below as examples of some of the options available. These tools can be adapted for the capacity assessment.
The kind of questions we ask makes a difference to the information we can gather. Asking the
wrong kind of questions will limit the information discovered. The important thing is to avoid
closed questions where people can answer only yes or no. For example, ‘Isn’t the new health
post wonderful?’ Try to use open-ended questions which allow the person replying to give more
information. For example, ‘What do you think of the new health post?’
Listen carefully, and explore people’s answers. It is useful to have some key questions in front of
us, but be careful not to miss the answers because we are preparing the next question. Be flexible
and be ready to ask unprepared questions if someone says something interesting. To explore
people’s answers, questions normally begin with one of the six ‘helping words’: What? When?
Where? Who? Why? How?
Asking questions
ROOTS 5 PCM brand E.indd 14ROOTS 5 PCM brand E.indd 14 3/3/09 11:05:47 am3/3/09 11:05:47 am
15© T E A R F U N D 2 0 0 3
ROOTS 5 PROJECT CYCLE MANAGEMENTProject identification1
TOOL 1 Listening
By listening for the issues about which people have the strongest feelings, it is possible to identify the issues that they most want addressed and projects which they are most likely to participate in. A team of people (development workers or village members) ask a community or group questions to find out what people are worried, sad, happy, fearful, hopeful or angry about. The questions should be open-ended. It is important to have a clear idea about what we are looking for so we can make sense of the answers.
TOOL 2 Interviewing
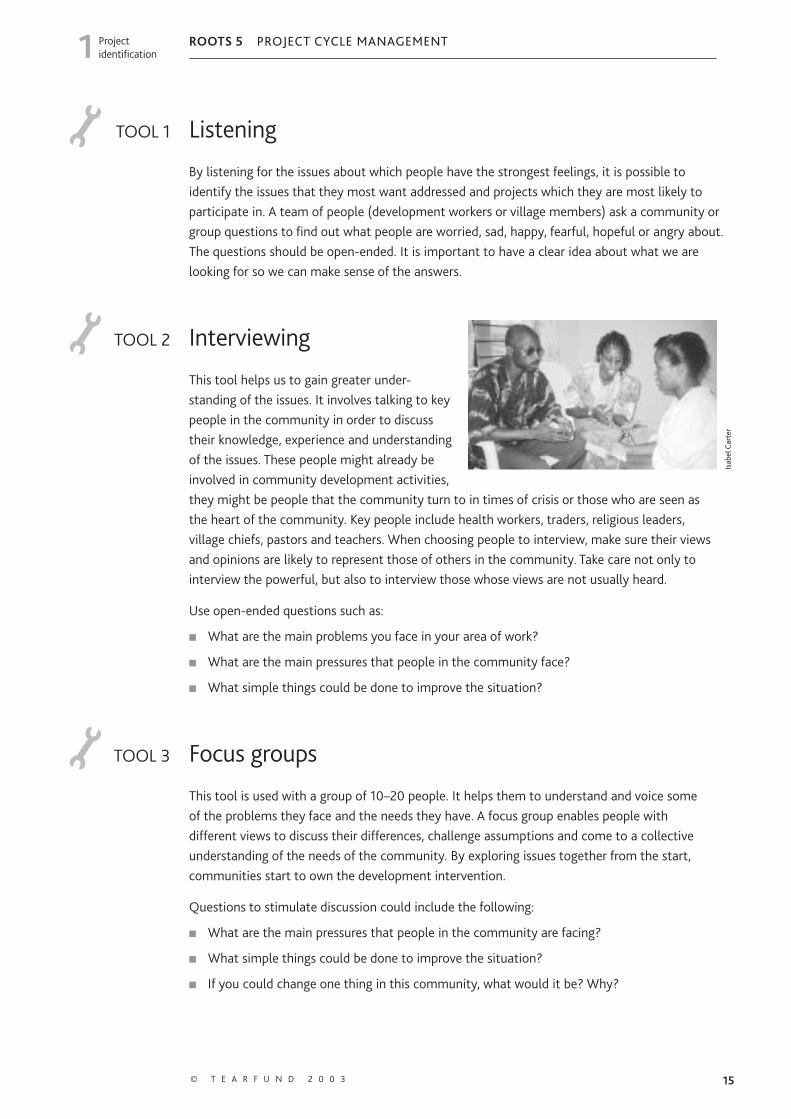
This tool helps us to gain greater under-standing of the issues. It involves talking to key people in the community in order to discuss their knowledge, experience and understanding of the issues. These people might already be involved in community development activities, they might be people that the community turn to in times of crisis or those who are seen as the heart of the community. Key people include health workers, traders, religious leaders, village chiefs, pastors and teachers. When choosing people to interview, make sure their views and opinions are likely to represent those of others in the community. Take care not only to interview the powerful, but also to interview those whose views are not usually heard.
Use open-ended questions such as:
■ What are the main problems you face in your area of work?
■ What are the main pressures that people in the community face?
■ What simple things could be done to improve the situation?
TOOL 3 Focus groups
This tool is used with a group of 10 –20 people. It helps them to understand and voice some of the problems they face and the needs they have. A focus group enables people with different views to discuss their differences, challenge assumptions and come to a collective understanding of the needs of the community. By exploring issues together from the start, communities start to own the development intervention.
Questions to stimulate discussion could include the following:
■ What are the main pressures that people in the community are facing?
■ What simple things could be done to improve the situation?
■ If you could change one thing in this community, what would it be? Why?
Isab
el C
arte
r
ROOTS 5 PCM brand E.indd 15ROOTS 5 PCM brand E.indd 15 3/3/09 11:05:48 am3/3/09 11:05:48 am

16 T E A R F U N D R O O T S R E S O U R C E S
ROOTS 5 PROJECT CYCLE MANAGEMENTProject identification1
TOOL 4 Community mapping
This tool involves community members drawing a map of their community to tell their story together. They draw either on paper or outside on the ground, using whatever resources are available. They are given little guidance of what to include. The important point of the exercise is to discuss what people have drawn. The map might show the natural and physical resources in the area – forests, rivers, roads, houses, wells. It might show important people and organisations.
Once the map has been drawn, encourage discussion by asking questions such as:
■ How did you decide what to include? What was excluded?
■ What was emphasised? Which are the most important parts?
■ What was difficult to represent?
■ What were the areas of disagreement?
■ What can we learn from the map about the needs of the community?
To gain greater understanding of the issues facing different groups within the community, the groups should work separately. A map by young people may show very different information from that of older women.
Questions for discussion could include:
■ What differences are there between the maps?
■ Why are there differences?
■ How does the information from each map help to make a more complete picture of the community?
Agreeing priority needs
Once the needs have been identified, community members should be given the opportunity to say which needs they feel are a priority. Ask them to group their needs into general issues such as water, health, land and food. It does not necessarily matter how they are grouped, but it is important that people can see how their concerns have been included.
Once the needs have been grouped, community members can decide which of the issues should be given priority. Write all of the issues onto separate pieces of paper. Community members then place them in order in a line from the most important to the least important. Encourage them to discuss and negotiate with each other and to move the pieces of paper around until they all agree.
Alternatively, write or draw the needs on separate paper bags. Give each person six seeds, stones or beads to use as counters. Each person in turn is invited to put their counters in the relevant bags, according to their priorities. They should put three counters for their first priority, two for their second and one for their third priority. The counters in each bag are then counted and the results announced. The needs are ranked according to the results.
tata
hara
kiji
lila
ROOTS 5 PCM brand E.indd 16ROOTS 5 PCM brand E.indd 16 3/3/09 11:05:49 am3/3/09 11:05:49 am
17© T E A R F U N D 2 0 0 3
ROOTS 5 PROJECT CYCLE MANAGEMENTProject identification1
This tool should help to identify the main issue to address. There may be more than one priority issue to start with and the group will have to choose whether to take all priority issues at once or focus on one at a time.
Capacity assessmentCommunities should be encouraged to use their own capacities and resources to address the problems they face. It is therefore important to carry out a capacity assessment after needs assessment to identify strengths that the community could use to address the problems they identified earlier. The project, if needed, should focus on strengthening the community’s capacities to address their problems. By doing this, we are facilitating the community to address their problems rather than addressing their problems for them.
Capacity assessment involves six types of assets:
HUMAN These enable people to make use of their other resources. They include skills, knowledge, ability to work and good health.
SOCIAL These are based on relationships and include organisations and groups within the community, political structures and informal networks.
NATURAL These form the local environment and include land, trees, water, air, climate and minerals.
PHYSICAL These are man-made, such as building, transport, water supply and sanitation services, energy sources and telecommunications.
ECONOMIC These are things that people can use to sustain their livelihoods, such as money and savings, grain stores, livestock, tools and equipment.
SPIRITUAL These include faith, scripture, guidance and prayer.
Using participatory techniques, such as those used for the needs assessment, ask community members to identify their capacities. Remember to ask a range of community members, as different people have different perspectives.
Write the capacities onto a large piece of paper and ask community members to identify how they could be used to address the problems identified during the needs assessment. Then ask community members to think about which capacities should be strengthened so that they can start to address their priority problems themselves. This is what the project should focus on.
ROOTS 5 PCM brand E.indd 17ROOTS 5 PCM brand E.indd 17 3/3/09 11:05:50 am3/3/09 11:05:50 am
18 T E A R F U N D R O O T S R E S O U R C E S
ROOTS 5 PROJECT CYCLE MANAGEMENTProject identification1
Decide whether it is realistic for our organisation to strengthen the community’s capacity to meet the priority need:
■ Does meeting the need fit in with our mission?
■ Does meeting the need agree with our values?
■ Does meeting the need fit into our strategy?
■ Will meeting the need be too risky?
■ Do we have enough experience?
■ Do we have enough resources?
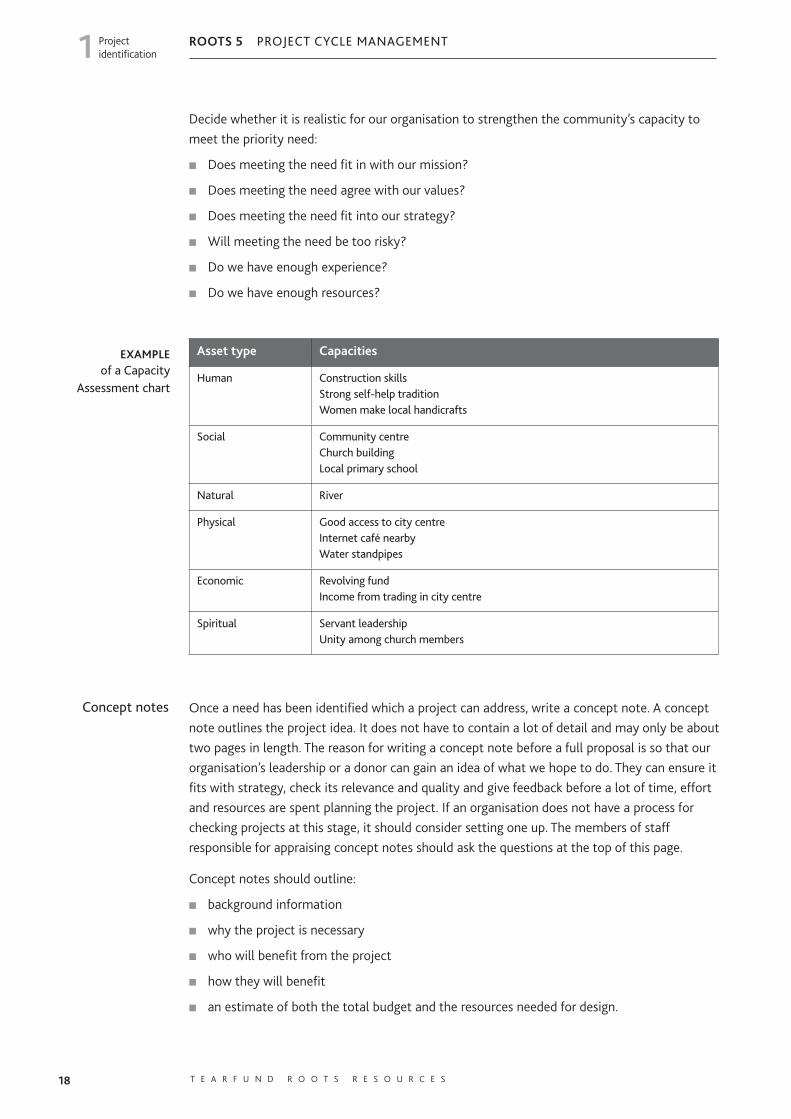
Asset type Capacities
Human Construction skillsStrong self-help traditionWomen make local handicrafts
Social Community centreChurch buildingLocal primary school
Natural River
Physical Good access to city centreInternet café nearbyWater standpipes
Economic Revolving fundIncome from trading in city centre
Spiritual Servant leadershipUnity among church members
Concept notes Once a need has been identified which a project can address, write a concept note. A concept note outlines the project idea. It does not have to contain a lot of detail and may only be about two pages in length. The reason for writing a concept note before a full proposal is so that our organisation’s leadership or a donor can gain an idea of what we hope to do. They can ensure it fits with strategy, check its relevance and quality and give feedback before a lot of time, effort and resources are spent planning the project. If an organisation does not have a process for checking projects at this stage, it should consider setting one up. The members of staff responsible for appraising concept notes should ask the questions at the top of this page.
Concept notes should outline:
■ background information
■ why the project is necessary
■ who will benefit from the project
■ how they will benefit
■ an estimate of both the total budget and the resources needed for design.
EXAMPLEof a Capacity
Assessment chart
ROOTS 5 PCM brand E.indd 18ROOTS 5 PCM brand E.indd 18 3/3/09 11:05:50 am3/3/09 11:05:50 am
ROOTS 5 PROJECT CYCLE MANAGEMENTSECTION
Project design
Once a priority community need has been identified, we can start to think about how it can be addressed. Project design consists of:
■ stakeholder analysis
■ research, including problem analysis
■ log frame
■ risk analysis
■ action planning
■ budgeting.
Note that the analyses – stakeholder, problem and risk – can be carried out before the design stage. Stakeholder and risk analyses should be carried out on a regular basis throughout the project cycle.
19© T E A R F U N D 2 0 0 3
Nehemiah had a good job. He was cupbearer to the king (Nehemiah 1:11). This meant that he tested the king’s food and wine to check that it had not been poisoned. The king put a lot of trust in him, and Nehemiah was probably a personal advisor to him. ■ Read Nehemiah 2:1-9.
• In verse 2, why do we think Nehemiah was afraid? (Ezra 4 might help.)
■ However, verses 5-9 show us that Nehemiah had planned in detail what he wanted to do and how he wanted to do it.
• What did Nehemiah do before answering the king’s question? (verse 4)
• What kind of things had Nehemiah planned for?
• What can we learn from this for the way we plan our projects?
■ Read Nehemiah 3.
• What does this chapter tell us about the amount of participation in the project?
■ Read Nehemiah 2:17.
• How did Nehemiah encourage people to participate in the project?
• What does this say about his leadership skills?
■ Some people rebuilt more than one section of the wall.
• Why do we think they participated so passionately?
■ Nehemiah 3:5 tells us that some people refused to participate in the project.
• How should we respond to people who do not want to participate?
Planning the rebuilding of the wall
2
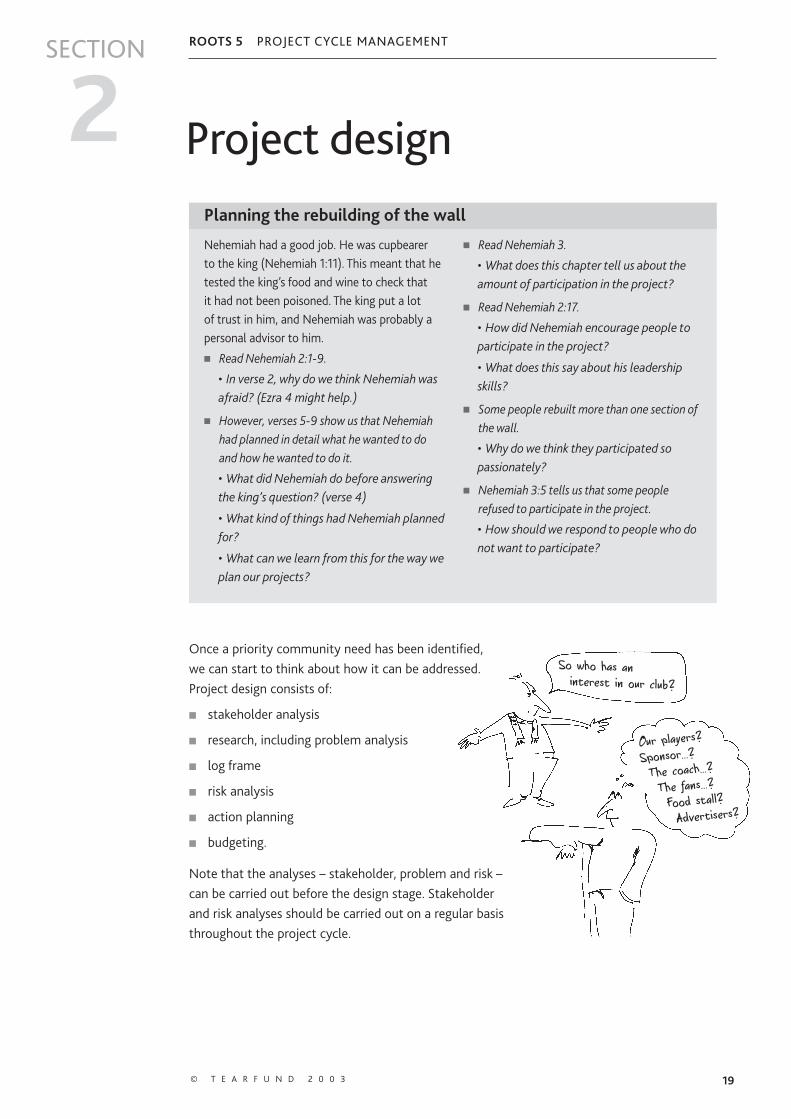
So who has an interest in our club?
Our players?Sponsor…?The coach…?The fans…?Food stall?Advertisers?
ROOTS 5 PCM brand E.indd 19ROOTS 5 PCM brand E.indd 19 3/3/09 11:05:50 am3/3/09 11:05:50 am
20 T E A R F U N D R O O T S R E S O U R C E S
ROOTS 5 PROJECT CYCLE MANAGEMENTProject design2
2.1 Stakeholder analysis‘Stakeholders’ are:
■ people affected by the impact of an activity
■ people who can influence the impact of an activity.
Stakeholders can be individuals, groups, a community or an institution.
Stakeholder groups are made up of people who share a common interest, such as an NGO, church leaders and the community. However, such groups often contain many sub-groups. Seeing the community as one stakeholder group can be meaningless because some people may have very different interests from others in the same community. It may be necessary to divide the community into a number of sub-groups according to aspects such as status, age, gender, wealth and ethnicity. These sub-groups may be affected by the project in different ways, and some sub-groups may have a lot more influence on the impact of the project than others.
It might also be unwise to view the government as one stakeholder group. It may be necessary to list government ministries as different stakeholder groups if they have different, and even conflicting, opinions about a development proposal. Government at national, state and local levels may also have very different interests.
Stakeholders include:
■ USER GROUPS – people who use the resources or services in an area
■ INTEREST GROUPS – people who have an interest in, an opinion about, or who can affect the use of, a resource or service
■ BENEFICIARIES of the project
■ DECISION-MAKERS
■ THOSE OFTEN EXCLUDED from the decision-making process.
Stakeholders could belong to one or more of these groups. For example, someone might be a user of a handpump (user group), and also involved in the water user association that manages it (interest group, decision-maker).
Stakeholders are not only those who shout the loudest. Those who are often excluded from the decision-making process due to age, gender or ethnicity are those who are most likely to lose out if they are not included in the project planning. What methods could be used to ensure these stakeholders are involved?
Stakeholders include the winners and the losers as a result of the project. While most stakeholders will benefit from the project, there may be others who will be negatively affected by the action taken.
Stakeholders can be divided into two main types:
■ PRIMARY STAKEHOLDERS who benefit from, or are adversely affected by, an activity. This term describes people whose well-being may be dependent on a resource or service or area (e.g. a forest) that the project addresses. Usually they live in the area or very near the
ROOTS 5 PCM brand E.indd 20ROOTS 5 PCM brand E.indd 20 3/3/09 11:05:51 am3/3/09 11:05:51 am
21© T E A R F U N D 2 0 0 3
ROOTS 5 PROJECT CYCLE MANAGEMENTProject design2
resources in question. They often have few options when faced with change, so they have difficulty adapting. Primary stakeholders are usually vulnerable. They are the reason why a project is carried out – the end users.
■ SECONDARY STAKEHOLDERS include all other people and institutions with an interest in the resources or area being considered. They are the means by which project objectives can be met, rather than an end in themselves.
If stakeholders are not identified at the project planning stage, the project is at risk of failure. This is because the project cannot take into account the needs and aims of those who will come into contact with it.
About stakeholder analysis1
Stakeholder analysis is a useful tool for identifying stakeholders and describing the nature of their stake, roles and interests. Stakeholder analysis helps to:
■ improve the project’s understanding of the needs of those affected by a problem
■ reveal how little we know as outsiders, which encourages those who do know to participate
■ identify potential winners and losers as a result of the project
■ reduce, or hopefully remove, potential negative project impacts
1 Based on Guidance notes: ODA (1995) How to do a Stakeholder Analysis of Aid Projects and Programmes
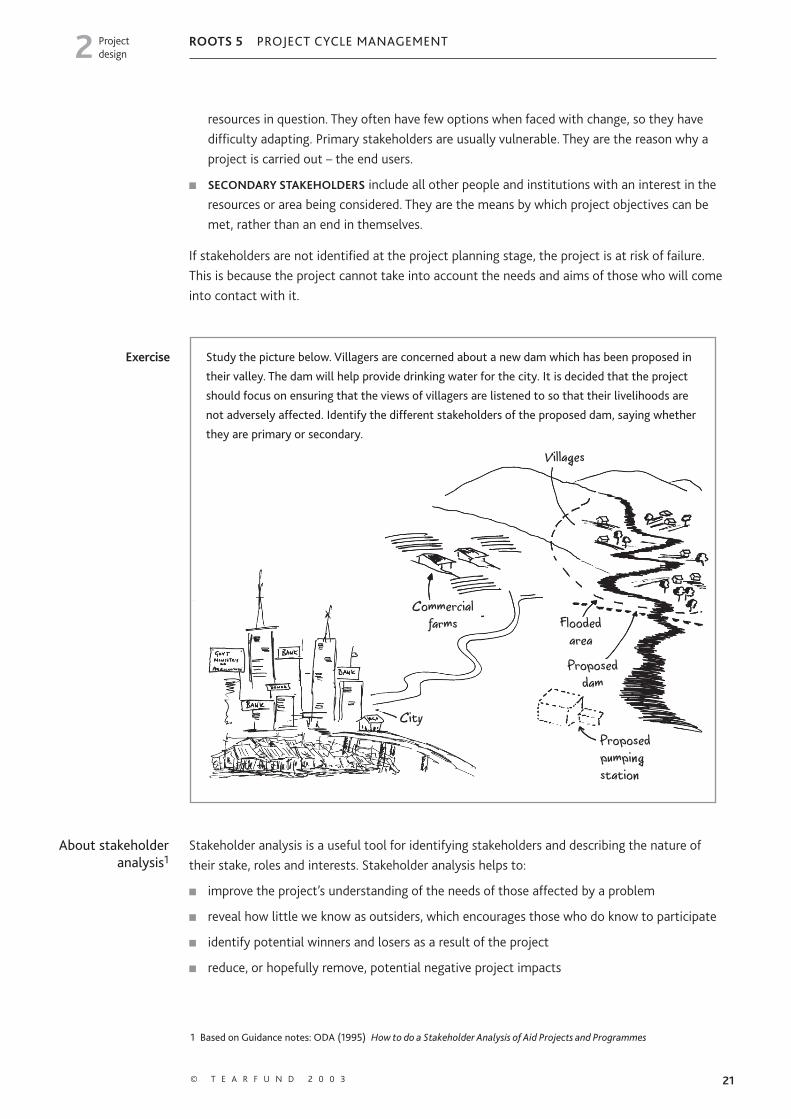
Study the picture below. Villagers are concerned about a new dam which has been proposed in
their valley. The dam will help provide drinking water for the city. It is decided that the project
should focus on ensuring that the views of villagers are listened to so that their livelihoods are
not adversely affected. Identify the different stakeholders of the proposed dam, saying whether
they are primary or secondary.
Exercise
VillagesVillages
CommercialCommercialfarmsfarms FloodedFlooded
areaarea
ProposedProposeddamdam
ProposedProposedpumpingpumpingstationstation
CityCity
ROOTS 5 PCM brand E.indd 21ROOTS 5 PCM brand E.indd 21 3/3/09 11:05:52 am3/3/09 11:05:52 am

22 T E A R F U N D R O O T S R E S O U R C E S
ROOTS 5 PROJECT CYCLE MANAGEMENTProject design2
■ identify those who have the rights, interests, resources, skills and abilities to take part in, or influence the course of, the project
■ identify who should be encouraged to take part in the project planning and implementation
■ identify useful alliances which can be built upon
■ identify and reduce risks which might involve identifying possible conflicts of interest and expectation among stakeholders so that conflict is avoided.
Stakeholder analysis should be done when possible projects are identified. It should be reviewed at later stages of the project cycle to check that the needs of the stakeholders are being adequately addressed.
It is important to be aware that there are risks in doing a stakeholder analysis:
■ The analysis is only as good as the information used. Sometimes it is difficult to get the necessary information, and many assumptions will have to be made.
■ Tables can oversimplify complex situations.
There are a number of ways of doing stakeholder analysis. The method provided below is just one approach. The approach taken will vary depending on the type of project that is being proposed. For example, for an advocacy project we would need to consider different aspects of stakeholders than we would for a development project. The method given below is quite general and can be adapted to whatever type of project is being proposed.
Ideally, stakeholder analysis should be carried out with representatives of as many stake holder groups as possible. It might not always be practical to do so if the stakeholders are widely spread. However, if there is a danger that important stakeholders might be excluded, more time and resources should be invested in doing the stakeholder analysis to make sure they are included.
METHOD OF CARRYING OUT STAKEHOLDER ANALYSIS
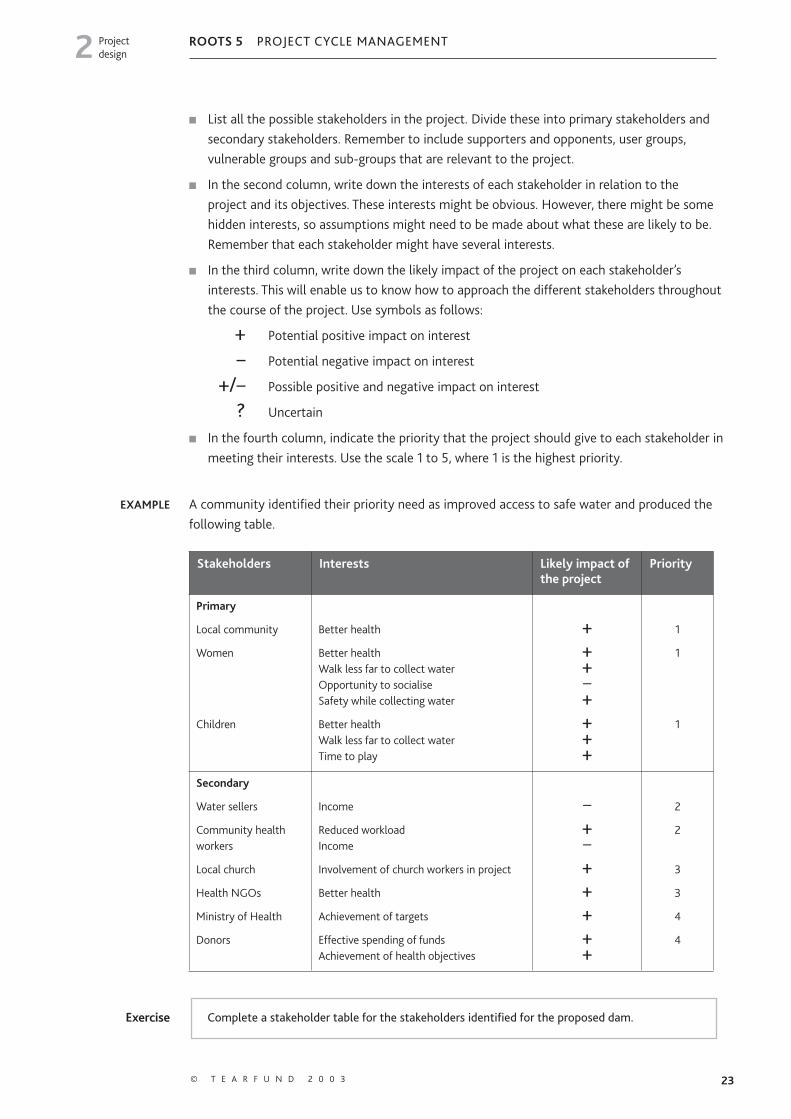
STEP 1 Stakeholder table
Copy the table below onto a large sheet of paper.
Stakeholders Interests Likely impact of the project
Priority
Primary
Secondary
ROOTS 5 PCM brand E.indd 22ROOTS 5 PCM brand E.indd 22 3/3/09 11:05:53 am3/3/09 11:05:53 am
23© T E A R F U N D 2 0 0 3
ROOTS 5 PROJECT CYCLE MANAGEMENTProject design2
■ List all the possible stakeholders in the project. Divide these into primary stakeholders and secondary stakeholders. Remember to include supporters and opponents, user groups, vulnerable groups and sub-groups that are relevant to the project.
■ In the second column, write down the interests of each stakeholder in relation to the project and its objectives. These interests might be obvious. However, there might be some hidden interests, so assumptions might need to be made about what these are likely to be. Remember that each stakeholder might have several interests.
■ In the third column, write down the likely impact of the project on each stakeholder’s interests. This will enable us to know how to approach the different stakeholders throughout the course of the project. Use symbols as follows:
+ Potential positive impact on interest
– Potential negative impact on interest
+/– Possible positive and negative impact on interest
? Uncertain
■ In the fourth column, indicate the priority that the project should give to each stake holder in meeting their interests. Use the scale 1 to 5, where 1 is the highest priority.
EXAMPLE A community identified their priority need as improved access to safe water and produced the following table.
Stakeholders Interests Likely impact of the project
Priority
Primary
Local community
Women
Children
Better health
Better healthWalk less far to collect waterOpportunity to socialiseSafety while collecting water
Better healthWalk less far to collect waterTime to play
+++_++++
1
1
1
Secondary
Water sellers
Community health workers
Local church
Health NGOs
Ministry of Health
Donors
Income
Reduced workloadIncome
Involvement of church workers in project
Better health
Achievement of targets
Effective spending of fundsAchievement of health objectives
_
+_
+++++
2
2
3
3
4
4
Complete a stakeholder table for the stakeholders identified for the proposed dam.Exercise
ROOTS 5 PCM brand E.indd 23ROOTS 5 PCM brand E.indd 23 3/3/09 11:05:54 am3/3/09 11:05:54 am
24 T E A R F U N D R O O T S R E S O U R C E S
ROOTS 5 PROJECT CYCLE MANAGEMENTProject design2
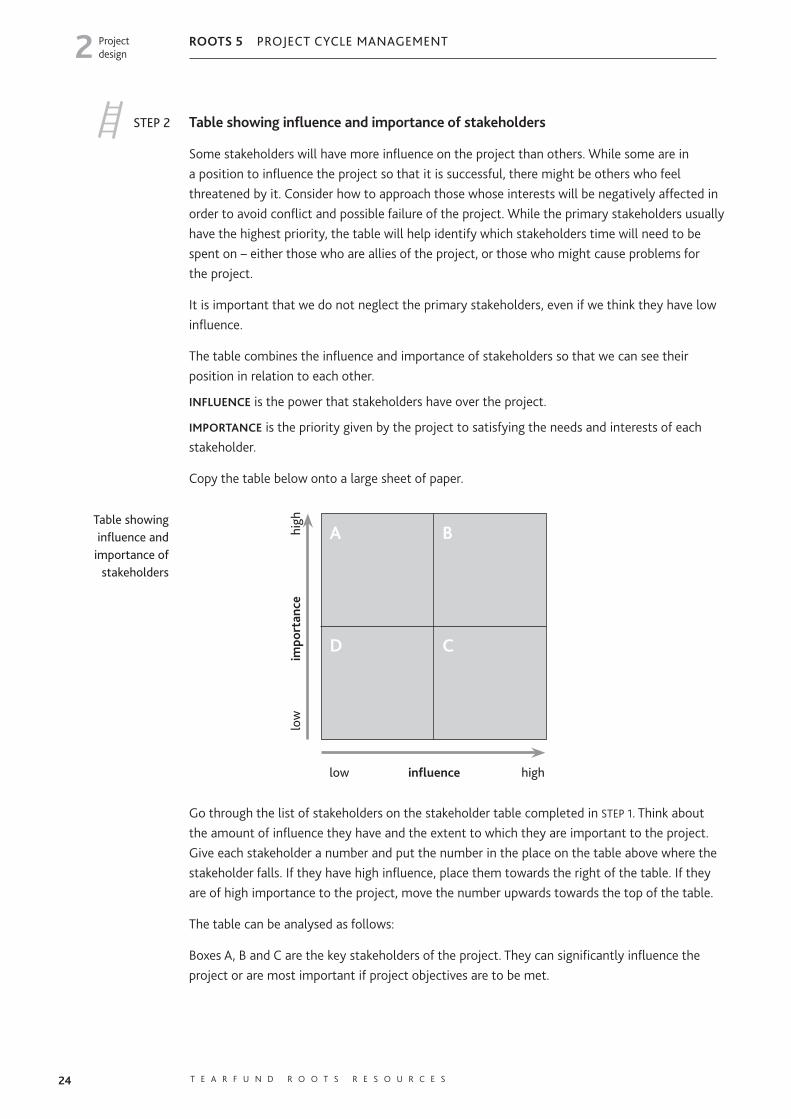
STEP 2 Table showing influence and importance of stakeholders
Some stakeholders will have more influence on the project than others. While some are in a position to influence the project so that it is successful, there might be others who feel threatened by it. Consider how to approach those whose interests will be negatively affected in order to avoid conflict and possible failure of the project. While the primary stakeholders usually have the highest priority, the table will help identify which stakeholders time will need to be spent on – either those who are allies of the project, or those who might cause problems for the project.
It is important that we do not neglect the primary stakeholders, even if we think they have low influence.
The table combines the influence and importance of stakeholders so that we can see their position in relation to each other.
INFLUENCE is the power that stakeholders have over the project.
IMPORTANCE is the priority given by the project to satisfying the needs and interests of each stakeholder.
Copy the table below onto a large sheet of paper.
Go through the list of stakeholders on the stakeholder table completed in STEP 1. Think about the amount of influence they have and the extent to which they are important to the project. Give each stakeholder a number and put the number in the place on the table above where the stakeholder falls. If they have high influence, place them towards the right of the table. If they are of high importance to the project, move the number upwards towards the top of the table.
The table can be analysed as follows:
Boxes A, B and C are the key stakeholders of the project. They can significantly influence the project or are most important if project objectives are to be met.
high
im
port
ance
low
highinfluencelow
Table showing influence and
importance of stakeholders
A B
D C
ROOTS 5 PCM brand E.indd 24ROOTS 5 PCM brand E.indd 24 3/3/09 11:05:54 am3/3/09 11:05:54 am

25© T E A R F U N D 2 0 0 3
ROOTS 5 PROJECT CYCLE MANAGEMENTProject design2
BOX A Stakeholders of high importance to the project, but with low influence. They need special initiatives to ensure their interests are protected.
BOX B Stakeholders of high importance to the project, who can also influence its success. It is important to develop good working relationships with these stakeholders to ensure adequate support for the project.
BOX C Stakeholders with high influence who can affect the project impact, but whose interests are not the target of the project. These stakeholders may be a source of risk. Relationships with these stakeholders are important and will need careful monitoring. These stakeholders may be able to cause problems for the project and it may be too risky to go ahead with the project at all.
BOX D Stakeholders of low priority but who may need limited monitoring and evaluation to check that they have not become high priority.
EXAMPLE The community identified their priority need as improved access to safe water, and produced the following table.
STEP 3 Identify appropriate stakeholder participation
Participation is essential in development work, but in practice it is a concept that has been misused. Participation means different things to different people in different situations. In its widest sense, participation is the involvement of people in development projects. For example, someone can be said to participate by:
■ attending a meeting, even though they do not say anything
■ taking part in the decision-making process
high
im
port
ance
low
highinfluencelow
Primary stakeholders
1 Local community 2 Women 3 Children
Secondary stakeholders
4 Water sellers 5 Community health workers 6 Local church 7 Health NGOs 8 Ministry of Health 9 Donors
32
1
67
8
5
9 4
A B
D C
Complete a table showing the influence and importance of stakeholders for the dam project.Exercise
ROOTS 5 PCM brand E.indd 25ROOTS 5 PCM brand E.indd 25 3/3/09 11:05:55 am3/3/09 11:05:55 am
26 T E A R F U N D R O O T S R E S O U R C E S
ROOTS 5 PROJECT CYCLE MANAGEMENTProject design2
■ contributing materials, money or labour
■ providing information
■ answering questions for a survey.
Often, so-called participatory projects do not actively involve stakeholders (especially primary stakeholders) in decision-making and project implementation. This can lead to unsuccessful development projects. Stakeholder participation in decision-making throughout the whole project cycle (project planning, implementation, monitoring and evaluation) is likely to result in:
■ IMPROVED EFFECTIVENESS Participation increases the sense of ownership of the project by beneficiaries, which increases the likelihood of project objectives being achieved.
■ ENHANCED RESPONSIVENESS If people participate at the planning stage, the project is more likely to target effort and inputs at perceived needs.
■ IMPROVED EFFICIENCY If local knowledge and skills are drawn on, the project is more likely to be good quality, stay within budget and finish on time. Mistakes can be avoided and disagreements minimised.
■ IMPROVED SUSTAINABILITY AND SUSTAINABLE IMPACT More people are committed to carrying on the activity after outside support has stopped.
■ EMPOWERMENT AND INCREASED SELF-RELIANCE Active participation helps to develop skills and confidence amongst beneficiaries.
■ IMPROVED TRANSPARENCY AND ACCOUNTABILITY, because stakeholders are given information and decision-making power.
■ IMPROVED EQUITY if the needs, interests and abilities of all stakeholders are taken into account.
Active participation is likely to have many benefits, although it is not a guarantee of project success. Achieving full participation is not easy. It can also take a lot of time, and conflicting interests are likely to come to the surface.
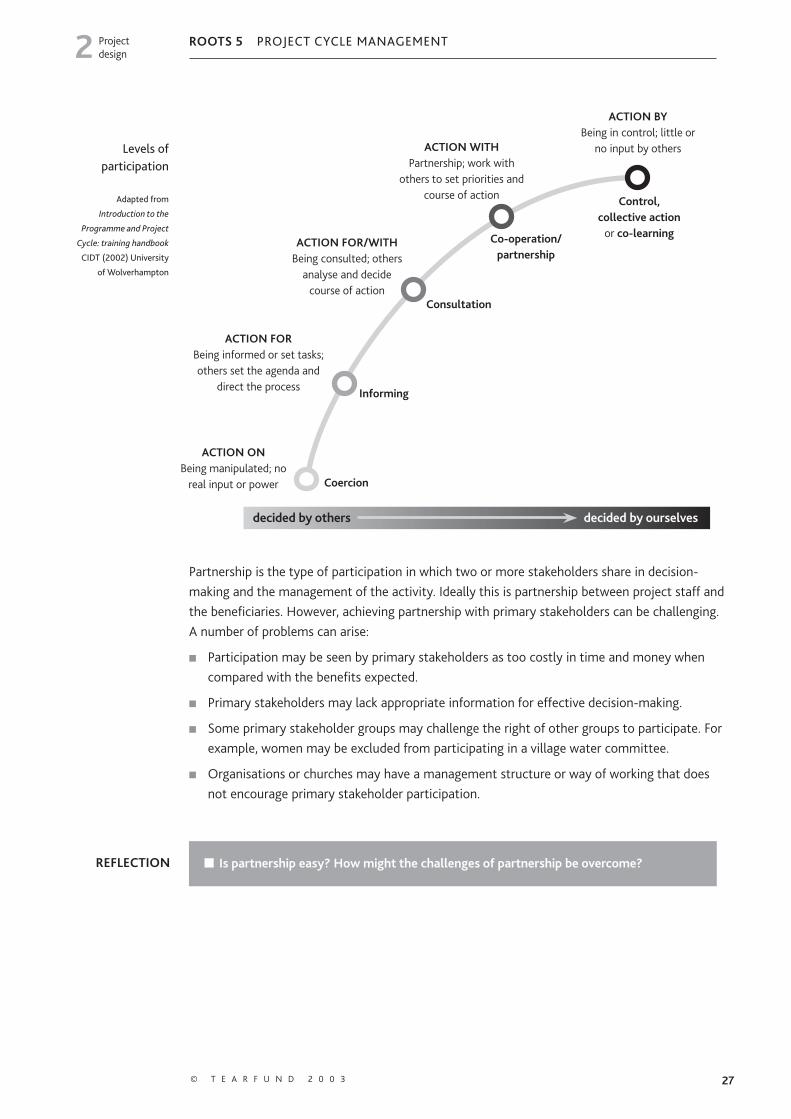
The diagram opposite outlines the different levels of participation. The lowest level may be better described as involvement rather than participation. The higher up the diagram, the greater the level of participation. Organisations need to decide what level of participation is best. Different levels of participation will be appropriate for different stakeholders at different stages of the project cycle.
■ In what circumstances might the highest level of participation not be appropriate?
■ Some people would say that near the bottom of the levels there is community involvement but not participation. What is the
difference between involvement and participation? When does involvement start to become participation?
■ In what circumstances might the lower levels of participation be appropriate?
REFLECTION
ROOTS 5 PCM brand E.indd 26ROOTS 5 PCM brand E.indd 26 3/3/09 11:05:55 am3/3/09 11:05:55 am
27© T E A R F U N D 2 0 0 3
ROOTS 5 PROJECT CYCLE MANAGEMENTProject design2
Partnership is the type of participation in which two or more stakeholders share in decision-making and the management of the activity. Ideally this is partnership between project staff and the beneficiaries. However, achieving partnership with primary stakeholders can be challenging. A number of problems can arise:
■ Participation may be seen by primary stakeholders as too costly in time and money when compared with the benefits expected.
■ Primary stakeholders may lack appropriate information for effective decision-making.
■ Some primary stakeholder groups may challenge the right of other groups to participate. For example, women may be excluded from participating in a village water committee.
■ Organisations or churches may have a management structure or way of working that does not encourage primary stakeholder participation.
Levels of participation
Control, collective action
or co-learning
ACTION ONBeing manipulated; no
real input or power
Informing
Consultation
Co-operation/ partnership
ACTION FORBeing informed or set tasks; others set the agenda and
direct the process
ACTION FOR/WITHBeing consulted; others
analyse and decide course of action
ACTION WITHPartnership; work with
others to set priorities and course of action
ACTION BYBeing in control; little or
no input by others
Coercion
decided by ourselvesdecided by others
Adapted from
Introduction to the
Programme and Project
Cycle: training handbook
CIDT (2002) University
of Wolverhampton
■ Is partnership easy? How might the challenges of partnership be overcome?REFLECTION
ROOTS 5 PCM brand E.indd 27ROOTS 5 PCM brand E.indd 27 3/3/09 11:05:56 am3/3/09 11:05:56 am

28 T E A R F U N D R O O T S R E S O U R C E S
ROOTS 5 PROJECT CYCLE MANAGEMENTProject design2
To identify what level of participation is appropriate for different stakeholders, draw a summary participation matrix similar to the one below. The columns represent the levels of participation on the diagram on the previous page. The rows represent the stages of the project cycle. Work through the list of stakeholders in the stakeholder matrix. Think about the extent to which they should participate for each stage of the project cycle. Consider the amount of interest or influence they have. There may be ways that we can involve them in the project which help to increase their interest or influence. Ensure that primary stakeholders participate as fully as possible to encourage ownership of the project.
TYPE OF PARTICIPATION
Inform Consult Partnership Control
STA
GE
IN P
ROJE
CT
Identification
Design
Implementation
and Monitoring
Reviewing
Evaluation
It is important to keep revising this table. During the project cycle we might find that stakeholders, who we thought should participate to a great extent, are actually not interested in participating. Or we might find that to be responsive to how the project is going, we want to encourage some stakeholders to participate more.
EXAMPLE The rural community identified their priority need as improved access to safe water, and filled in a matrix table with the following information.
TYPE OF PARTICIPATION
Inform Consult Partnership Control
STA
GE
IN P
ROJE
CT
Identification Health NGOs
Donor
Cross section of
community
Design Donor Community
Women
Children
Water sellers
Health workers
Health NGOs
Ministry of Health
Local church
Project staff
Implementation
and Monitoring
Donor Women, children
Water sellers
Local church
Health workers
Project staff
Reviewing Donor Women, children
Water sellers
Local church
Health workers
Evaluation Donor Ministry of Health
Health NGOs
Community
Summary participation
matrix
ROOTS 5 PCM brand E.indd 28ROOTS 5 PCM brand E.indd 28 3/3/09 11:05:56 am3/3/09 11:05:56 am

29© T E A R F U N D 2 0 0 3
ROOTS 5 PROJECT CYCLE MANAGEMENTProject design2
When the table is completed, think about how participation of stakeholders might actually happen. For example, if we think a women’s group should be consulted at the planning stage, consider how this might be carried out. We might decide to hold a special meeting, or to attend one of their meetings. It is important to consider our options so that we can ensure those who we think should participate in the project respond to our invitation.
The community should select members who will represent them in the project committee. Encourage them to ensure a good gender balance. These members might then require training and discussion of their expected roles and responsibilities in the project.
2.2 ResearchAll development work should be based on accurate, reliable and sufficient information. Good information is important in order to:
■ understand the context in which the project is taking place
■ understand the causes and effects of the issue that is being addressed
■ understand what others are doing in order to avoid duplication and to work together if appropriate
■ ensure that the response takes into account all factors and is the most appropriate and effective for the situation
■ understand how the context is changing so the response can address potential future needs or prevent problems from arising
■ justify the course of action to our organisation, beneficiaries, donors and others we are working with
■ learn from past successes and mistakes
■ provide good evidence for the response.
Research enables us to find out the facts about the need. This will help us to know how best to address it. Research involves talking to people or accessing written information.
Thorough research should look at social, technical, economic, environmental and political factors. This might help to identify new stakeholders and risks to the project. Consider:
■ the area’s history
■ geography, climate, environment, e.g. main features, map, communication, area, seasonal problems
■ population – numbers, age and sex profile
■ social systems and structures – religious divisions, status of women, social institutions
Complete a summary participation matrix for the dam project.Exercise
ROOTS 5 PCM brand E.indd 29ROOTS 5 PCM brand E.indd 29 3/3/09 11:05:57 am3/3/09 11:05:57 am

30 T E A R F U N D R O O T S R E S O U R C E S
ROOTS 5 PROJECT CYCLE MANAGEMENTProject design2
■ politics – local political hierarchies; effects of central government, e.g. stability, policies on food prices
■ religion and world view – religious beliefs, groups and churches
■ culture – norms and practices, other cultural groups in the area, languages
■ living conditions – types of housing, water and sanitation
■ economics – sources of income, crops, landholding, average daily wage
■ education – schools, literacy rates
■ health – mortality rates, causes of death and illness, local health services
■ services and development programmes – government or NGO, community’s previous experience.
The information collected can be used as a baseline against which progress during the course of the project can be compared.
Use a mixture of secondary and primary information to ensure that what we are told is valid. For example, if community members say that their children do not attend school because they cannot afford school uniforms, it might be a good idea to check with the local authorities that children actually need to wear uniforms.
There are many different ways of collecting information. Some possibilities are listed below. It is tempting to spend a lot of time collecting information and then not have time to take action. It is important to get a balance between having enough information to enable us to act upon it and gathering too much so that we will never act!
■ What is the situation now? For example, if the community has identified water as their
priority need, we might want to ask them questions like ‘How many people live in the area?’,
How much water does each person have now?’, ‘Where does the water come from?’, ‘How is
the water collected now?’, ‘Who collects the water now?’, ‘How long does it take to collect
the water?’, ‘How clean is the water now?’
■ How will the need grow? What are the future implications if the need is not met?
For example, ‘How many people will be in the area in five years time?’
■ How should things be? Government departments or books can provide some information.
For example, ‘How much water does each person need for a healthy life?’
■ What possible improvements could be made? This might involve approaching government
departments and technical experts. The community should also be given an opportunity to put
forward options. For example, ‘What other sources of clean water are available in the area?’,
‘Who owns or controls the other sources?’, ‘What technical options are there?’
■ What other local organisations are working on the issue? Who are they? Can we work
together?
Some questions to ask
ROOTS 5 PCM brand E.indd 30ROOTS 5 PCM brand E.indd 30 3/3/09 11:05:57 am3/3/09 11:05:57 am
31© T E A R F U N D 2 0 0 3
ROOTS 5 PROJECT CYCLE MANAGEMENTProject design2
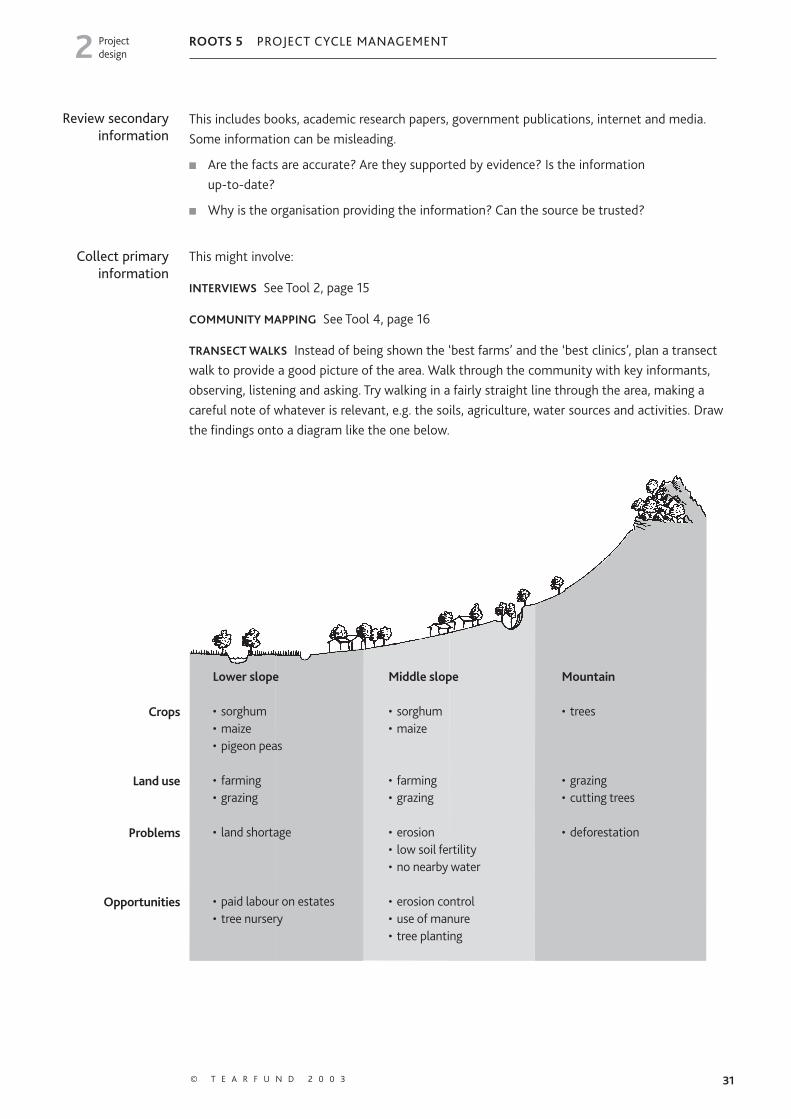
Review secondary information
This includes books, academic research papers, government publications, internet and media. Some information can be misleading.
■ Are the facts are accurate? Are they supported by evidence? Is the information up-to-date?
■ Why is the organisation providing the information? Can the source be trusted?
Collect primary information
This might involve:
INTERVIEWS See Tool 2, page 15
COMMUNITY MAPPING See Tool 4, page 16
TRANSECT WALKS Instead of being shown the ‘best farms’ and the ‘best clinics’, plan a transect walk to provide a good picture of the area. Walk through the community with key informants, observing, listening and asking. Try walking in a fairly straight line through the area, making a careful note of whatever is relevant, e.g. the soils, agriculture, water sources and activities. Draw the findings onto a diagram like the one below.
Crops
Land use
Problems
Opportunities
Lower slope
• sorghum• maize• pigeon peas
• farming• grazing
• land shortage
• paid labour on estates• tree nursery
Middle slope
• sorghum• maize
• farming• grazing
• erosion• low soil fertility• no nearby water
• erosion control• use of manure• tree planting
Mountain
• trees
• grazing• cutting trees
• deforestation
ROOTS 5 PCM brand E.indd 31ROOTS 5 PCM brand E.indd 31 3/3/09 11:05:58 am3/3/09 11:05:58 am

32 T E A R F U N D R O O T S R E S O U R C E S
ROOTS 5 PROJECT CYCLE MANAGEMENTProject design2
SEASONAL CALENDARS are used to show month by month changes of subjects like rainfall, labour, diet, sickness and prices. Ask community members when their year starts, the names of the months and seasons and choose which to use. Mark the units on the ground or on paper. Using stones or beans, ask them to indicate the amount of whatever subject is being discussed. For example, allow them to place up to ten beans for each subject for each month. Encourage people to discuss until they are in agreement. Ask questions about why the numbers vary. The example shows that income is very low between February and April. By asking questions, such as ‘Why do incomes increase in May?’ we can find out a lot of useful information.
TIMELINE A timeline is used to show major local events, ecological change, disease and population trends. Agree how many years the timeline should cover. Draw a horizontal line on a large piece of paper and write the years along it. Ask community members to discuss key events and to write them in. The example below is a timeline of well-being, which is used to reflect on the well-being of the community in recent years. Events that influenced well-being are included.
1995 1997 1998 1999 2000 2002
Good harvestBuilt food stores
Moderate rains
Rehabilitated two classrooms
Drought Starvation
Stealing of cattle
Migration
No rains
Walked 5km to collect water from lake
Good harvests
Built animal crush, classrooms and teachers’ houses Moderate rains
Shallow well dug
Rains spoilt crops
Built pit latrines and tanks
1996 2001
GO
OD
BAD
OK
Ill-health Income Farmwork
Jan 6 5 4
Feb 2 1 6
Mar 3 1 9
Apr 3 1 8
May 7 3 1
Jun 8 4 1
Jul 3 5 3
Aug 2 8 7
Sep 2 3 4
Oct 2 2 3
Nov 3 5 1
Dec 7 9 1
ROOTS 5 PCM brand E.indd 32ROOTS 5 PCM brand E.indd 32 3/3/09 11:05:58 am3/3/09 11:05:58 am
33© T E A R F U N D 2 0 0 3
ROOTS 5 PROJECT CYCLE MANAGEMENTProject design2
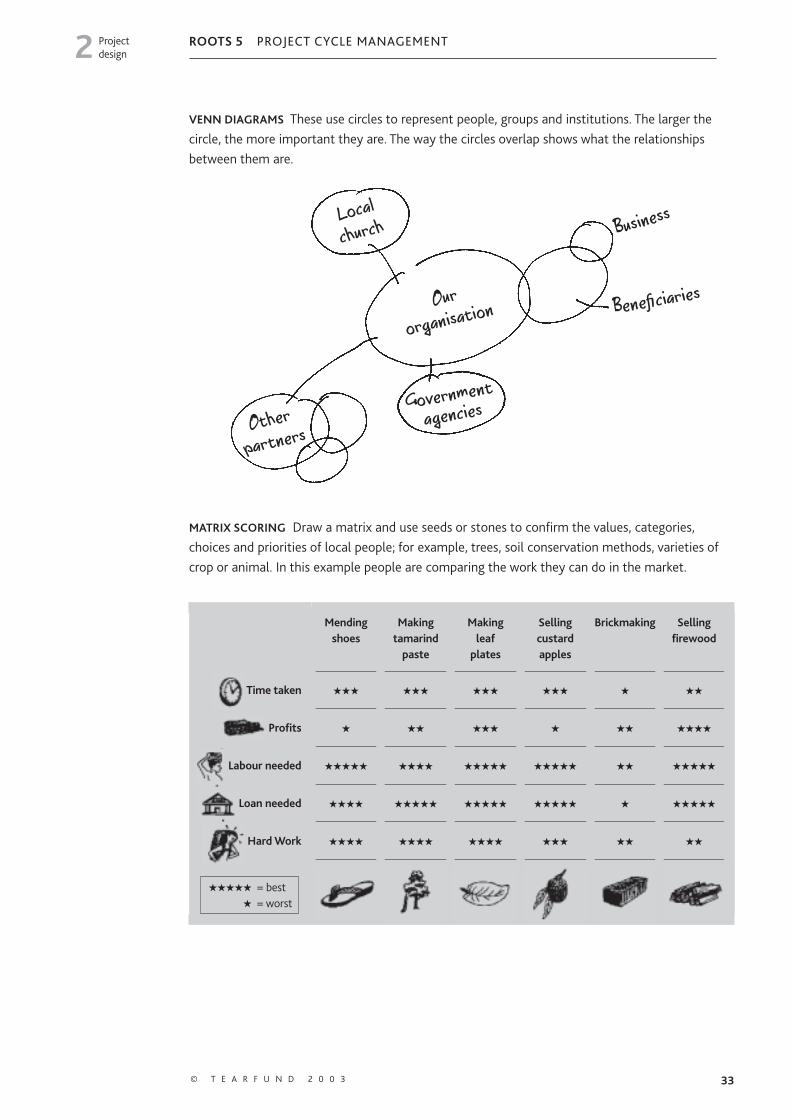
VENN DIAGRAMS These use circles to represent people, groups and institutions. The larger the circle, the more important they are. The way the circles overlap shows what the relationships between them are.
MATRIX SCORING Draw a matrix and use seeds or stones to confirm the values, categories, choices and priorities of local people; for example, trees, soil conservation methods, varieties of crop or animal. In this example people are comparing the work they can do in the market.
Mending shoes
Making tamarind
paste
Making leaf
plates
Selling custard apples
Brickmaking Selling firewood
Time taken ★★★ ★★★ ★★★ ★★★ ★ ★★
Profits ★ ★★ ★★★ ★ ★★ ★★★★
Labour needed ★★★★★ ★★★★ ★★★★★ ★★★★★ ★★ ★★★★★
Loan needed ★★★★ ★★★★★ ★★★★★ ★★★★★ ★ ★★★★★
Hard Work ★★★★ ★★★★ ★★★★ ★★★ ★★ ★★
★★★★★ = best ★ = worst
Localchurch
Ourorganisat
ion
Other partners
Governmentagencies
Business
Benefi ciaries
ROOTS 5 PCM brand E.indd 33ROOTS 5 PCM brand E.indd 33 3/3/09 11:05:59 am3/3/09 11:05:59 am
34 T E A R F U N D R O O T S R E S O U R C E S
ROOTS 5 PROJECT CYCLE MANAGEMENTProject design2
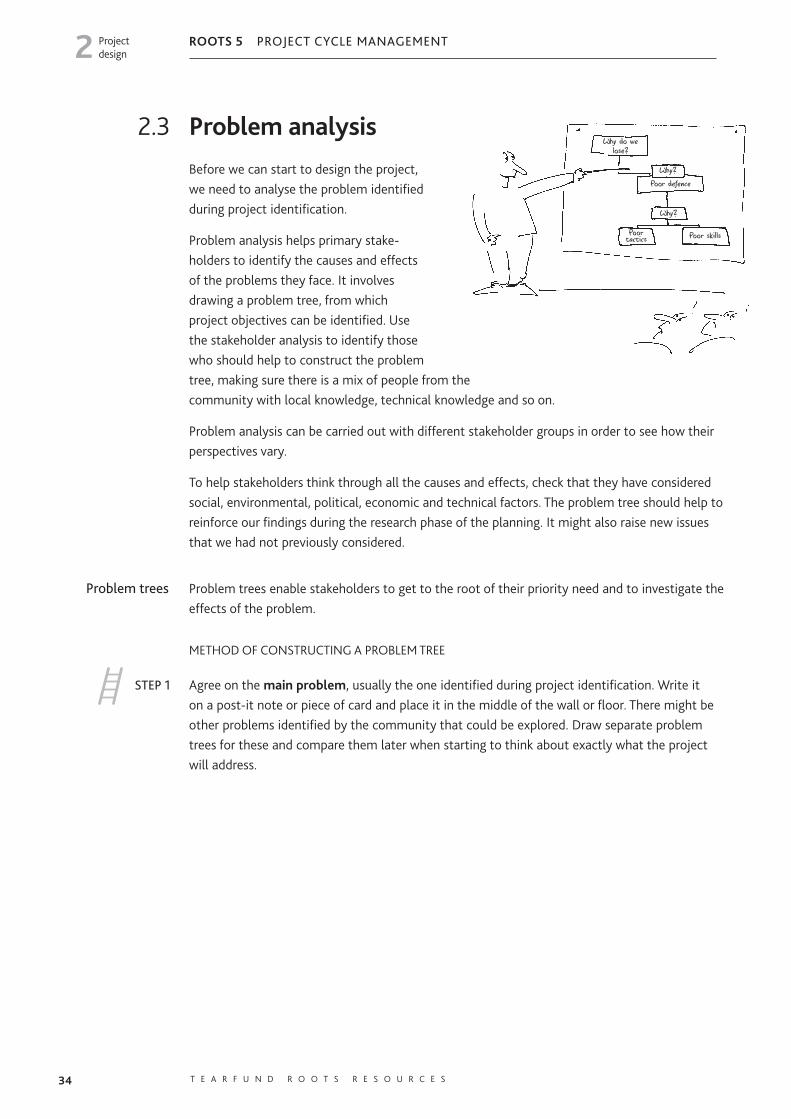
2.3 Problem analysisBefore we can start to design the project, we need to analyse the problem identified during project identification.
Problem analysis helps primary stake-holders to identify the causes and effects of the problems they face. It involves drawing a problem tree, from which project objectives can be identified. Use the stakeholder analysis to identify those who should help to construct the problem tree, making sure there is a mix of people from the community with local knowledge, technical knowledge and so on.
Problem analysis can be carried out with different stakeholder groups in order to see how their perspectives vary.
To help stakeholders think through all the causes and effects, check that they have considered social, environmental, political, economic and technical factors. The problem tree should help to reinforce our findings during the research phase of the planning. It might also raise new issues that we had not previously considered.
Problem trees Problem trees enable stakeholders to get to the root of their priority need and to investigate the effects of the problem.
METHOD OF CONSTRUCTING A PROBLEM TREE
STEP 1 Agree on the main problem, usually the one identified during project identification. Write it on a post-it note or piece of card and place it in the middle of the wall or floor. There might be other problems identified by the community that could be explored. Draw separate problem trees for these and compare them later when starting to think about exactly what the project will address.
Why do we lose?
Why?
Why?
Poor defence
Poor tactics Poor skills
ROOTS 5 PCM brand E.indd 34ROOTS 5 PCM brand E.indd 34 3/3/09 11:06:00 am3/3/09 11:06:00 am
35© T E A R F U N D 2 0 0 3
ROOTS 5 PROJECT CYCLE MANAGEMENTProject design2
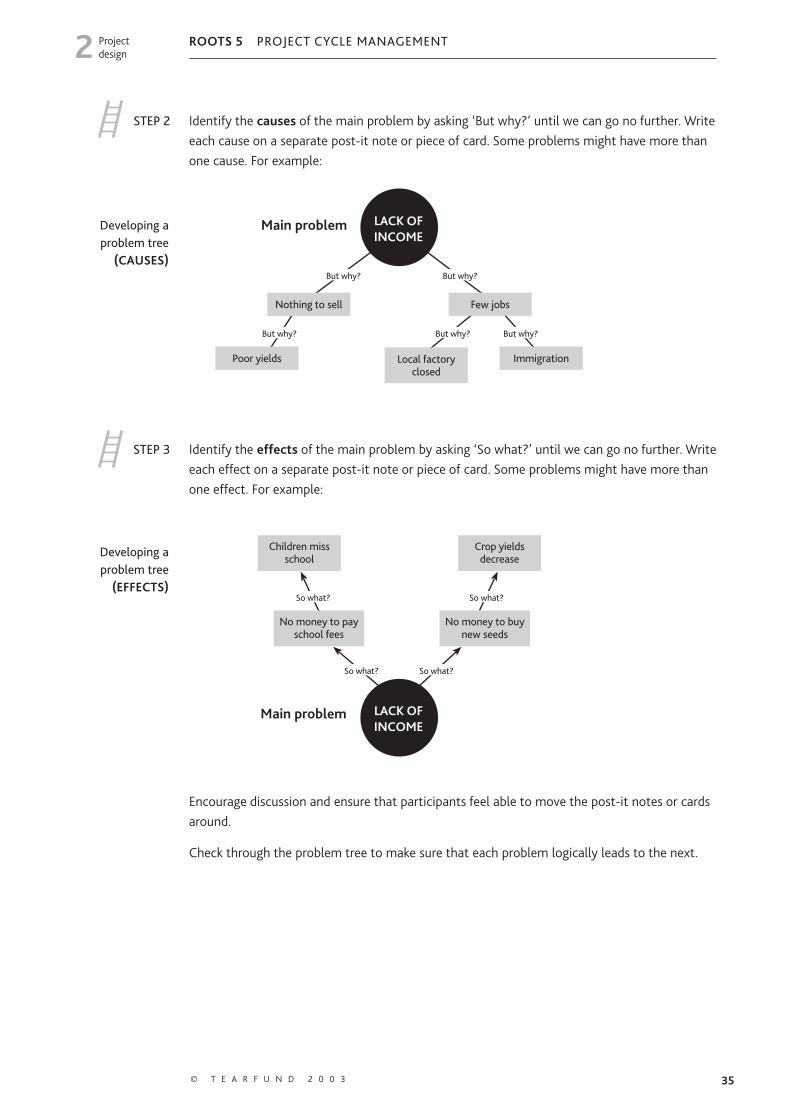
STEP 2 Identify the causes of the main problem by asking ‘But why?’ until we can go no further. Write each cause on a separate post-it note or piece of card. Some problems might have more than one cause. For example:
STEP 3 Identify the effects of the main problem by asking ‘So what?’ until we can go no further. Write each effect on a separate post-it note or piece of card. Some problems might have more than one effect. For example:
Encourage discussion and ensure that participants feel able to move the post-it notes or cards around.
Check through the problem tree to make sure that each problem logically leads to the next.
Developing aproblem tree
(CAUSES)
LACK OF INCOME
Nothing to sell Few jobs
Local factory closed
ImmigrationPoor yields
But why?But why?
But why? But why? But why?
Main problem
Main problem
Children miss school
Crop yields decrease
So what?
No money to buy new seeds
So what?
No money to pay school fees
So what?
LACK OF INCOME
So what?
Developing aproblem tree
(EFFECTS)
ROOTS 5 PCM brand E.indd 35ROOTS 5 PCM brand E.indd 35 3/3/09 11:06:01 am3/3/09 11:06:01 am
36 T E A R F U N D R O O T S R E S O U R C E S
ROOTS 5 PROJECT CYCLE MANAGEMENTProject design2
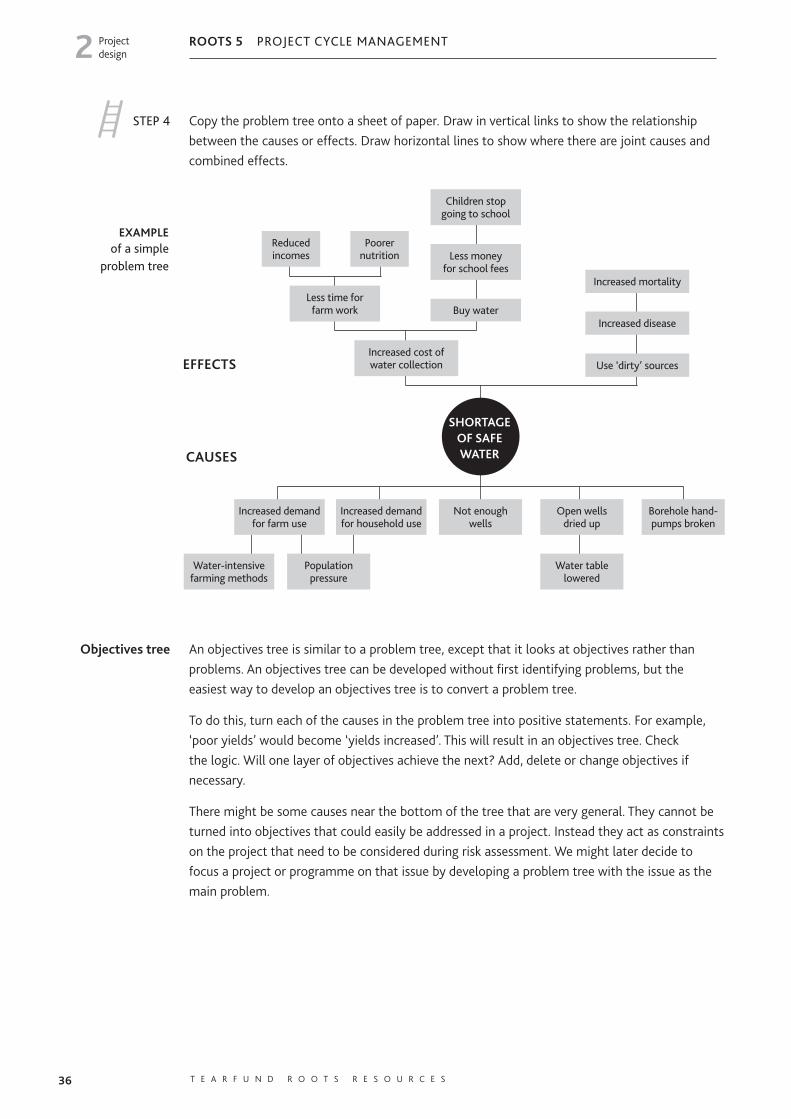
STEP 4 Copy the problem tree onto a sheet of paper. Draw in vertical links to show the relationship between the causes or effects. Draw horizontal lines to show where there are joint causes and combined effects.
Objectives tree An objectives tree is similar to a problem tree, except that it looks at objectives rather than problems. An objectives tree can be developed without first identifying problems, but the easiest way to develop an objectives tree is to convert a problem tree.
To do this, turn each of the causes in the problem tree into positive statements. For example, ‘poor yields’ would become ‘yields increased’. This will result in an objectives tree. Check the logic. Will one layer of objectives achieve the next? Add, delete or change objectives if necessary.
There might be some causes near the bottom of the tree that are very general. They cannot be turned into objectives that could easily be addressed in a project. Instead they act as constraints on the project that need to be considered during risk assessment. We might later decide to focus a project or programme on that issue by developing a problem tree with the issue as the main problem.
Increased cost of water collection Use ‘dirty’ sources
Increased disease
Increased mortalityLess time for
farm work
Reduced incomes
Poorer nutrition
Children stop going to school
Less money for school fees
Buy water
SHORTAGE OF SAFE WATER
Increased demand for household use
Not enoughwells
Open wells dried up
Borehole hand-pumps broken
Increased demand for farm use
Population pressure
Water-intensive farming methods
Water table lowered
EXAMPLE of a simple
problem tree
CAUSES
EFFECTS
ROOTS 5 PCM brand E.indd 36ROOTS 5 PCM brand E.indd 36 3/3/09 11:06:01 am3/3/09 11:06:01 am

37© T E A R F U N D 2 0 0 3
ROOTS 5 PROJECT CYCLE MANAGEMENTProject design2
Focusing the project
If we try to address all of the objectives we have identified, we will find we have a very expensive and lengthy project. It is therefore necessary to focus on one or a few areas of the objectives tree. If more than one objectives tree has been drawn, we will need to decide which of these to focus on for the project.
Ask the following questions:
■ Which objectives should we address?
■ Which combination of objectives are most likely to bring about the most positive change?
Issues to consider are:
■ cost
■ benefits to primary stakeholders
■ likelihood of achieving the objectives
■ risks (see page 45)
■ whether other organisations are already addressing the problem
■ sustainability
■ environmental impact.
Look at the objectives tree and identify the branches that the project could address. For example, for the objectives tree above, it might be decided to address the right-hand branch (circled).
It is a good idea to come back to the objectives tree later when starting to think of project assumptions. All the objectives that are left in the objectives tree can be viewed as constraints which could affect project success.
ACCESS TO SAFE WATER IMPROVED
Wastage at house-hold level reduced
More wellsdug
Wells protected and yielding
Handpumps repaired
Demand for farm use reduced
Population pressure
CONSTRAINT
Farming made more water-
efficient
Water table reached
EXAMPLE of an objectives tree with focus
on one area
ROOTS 5 PCM brand E.indd 37ROOTS 5 PCM brand E.indd 37 3/3/09 11:06:02 am3/3/09 11:06:02 am

38 T E A R F U N D R O O T S R E S O U R C E S
ROOTS 5 PROJECT CYCLE MANAGEMENTProject design2
2.4 Logical frameworks (log frames)Now that the project has been identified and detailed information has been collected, we can start to plan exactly how the project will function. A useful way of doing this may be to use a logical framework (log frame). The process of completing the log frame helps to think through all the factors that should be considered for planning a successful project. Even if people are not planning to develop a log frame, it may help to use the tools included in the log frame approach when planning projects.
What is a log frame?
The log frame is a tool used to help strengthen project design, implementation and evaluation. Although it is constructed during the planning stage of a project, the log frame is a living document, which should be consulted and altered throughout the project’s life cycle.
The log frame is a table of four rows and four columns, where all the key parts of a project can be inserted as a clear set of statements: the project goal, purpose, outputs and activities, with their indicators, evidence and assumptions. It shows the project’s structure and describes the project logically. The log frame does not show every detail of the project. It is an overview of the key factors. Details can be given in other documents, such as the proposal, budget and activity schedule, which accompany the log frame.
Summary Indicators Evidence Assumptions
Goal
Purpose
Outputs
Activities
Most donors use the log frame format above. However, some turn log frames on their side so that the objectives run across the top of the table with the summary, indicators, evidence and assumptions down the side. Having carried out a stakeholder analysis and done research, we can answer the question, ‘Where are we now?’
The log frame asks a series of further questions:
■ Where do we want to be? (GOAL, PURPOSE)
■ How will we get there? (OUTPUTS, ACTIVITIES)
■ How will we know when we have got there? (INDICATORS)
■ What will show us we have got there? (EVIDENCE)
■ What are the potential problems along the way? (ASSUMPTIONS)
Log frame
ROOTS 5 PCM brand E.indd 38ROOTS 5 PCM brand E.indd 38 3/3/09 11:06:02 am3/3/09 11:06:02 am
39© T E A R F U N D 2 0 0 3
ROOTS 5 PROJECT CYCLE MANAGEMENTProject design2
Why use a log frame?
Log frames are useful because they:
■ help people to organise their thinking
■ help people to think logically
■ help identify weaknesses in project design
■ ensure key indicators are identified from the start of the project so that monitoring and evaluation are easier
■ ensure that people involved in the project use the same terminology
■ help people to summarise a project plan on a few sides of paper. This helps them to communicate their plan simply with others, although a log frame is no substitute for writing a full plan.
However, the log frame approach does have limitations:
■ Project management can become rigid unless the log frame is continually checked and adjusted.
■ As the approach involves participation by a number of different stakeholders, good leadership and facilitation skills are needed to ensure stakeholders understand the approach and actively participate in it.
■ Since the approach builds on analysis of a problem, it might not be viewed as appropriate in cultures where people do not openly discuss problems.
■ The terminology used can be threatening to some stakeholders. The approach itself can be very difficult to understand in some cultures.
Who should complete the log frame?
Where possible, the primary stakeholders should be involved in developing the log frame. It should be developed by the people most closely involved in project imple men tation. It is possible that the concept of the log frame will not be easily understood by primary stakeholders. However, as the process is as important as the end product, participatory processes could be used to guide stakeholders through the questions and help them to identify some of the project components. Then the log frame table could later be completed by project staff.
Terminology
Different organisations use different terms for the components of the log frame. We explain the terms simply below. Wherever we are aware of alternative names used by other organisations, we provide that name in brackets. The terms will be explained further in the section about completing a log frame.
ROOTS 5 PCM brand E.indd 39ROOTS 5 PCM brand E.indd 39 3/3/09 11:06:03 am3/3/09 11:06:03 am
40 T E A R F U N D R O O T S R E S O U R C E S
ROOTS 5 PROJECT CYCLE MANAGEMENTProject design2
Summary(Intervention logic)
The Summary outlines the project’s objectives: what it hopes to achieve and how. There are many different words that describe different types of objectives. We use the term ‘objective’ as a general term for a desired change. In the log frame, the summary separates out the different levels of objectives to form a ‘hierarchy of objectives’ and uses special terms to refer to each level.
Goal The Goal refers to the overall problem we are trying to address. It is sometimes referred to as the wider development objective. This might be improved incomes, improved access to water or reduced crime. Example: Improved farm productivity by small farmers.
Purpose The Purpose is the specific change that we want the project to make to contribute to the achievement of the goal. It is sometimes called the Immediate Project Objective.Example: Improved farming methods and varieties of rice adopted by small farmers.
Outputs The Outputs are what we want to see as a result of our activities, in order to fulfil the purpose. Example: Improved crop varieties acceptable to users made available and distributed.
Activities The Activities describe the tasks we will carry out. Example: Farmer participatory research into crop varieties.
Indicators(Measurable/
Objectively Verifiable Indicators
– OVIs)
Indicators answer the question ‘How do we know when we have got there?’ They are signs which measure project performance against objectives and play an important part in monitoring and evaluation. Example: 75% of small farmers in the diocese have adopted new rice varieties by the end of year 3.
Evidence(Means of
Verification – MoVs)
Evidence refers to the source of the information needed to measure performance, who will be responsible for collecting it, and how often. Example: Sample survey carried out by project staff at the end of year 3.
Assumptions Assumptions refer to the conditions that could affect progress, success or long-term sustainability of the project. There may be external factors which cannot be controlled or which we choose not to control. It may be possible to reduce the project’s vulnerability to factors which cannot be controlled. These could include climatic change, price changes and government policies.
ROOTS 5 PCM brand E.indd 40ROOTS 5 PCM brand E.indd 40 3/3/09 11:06:03 am3/3/09 11:06:03 am
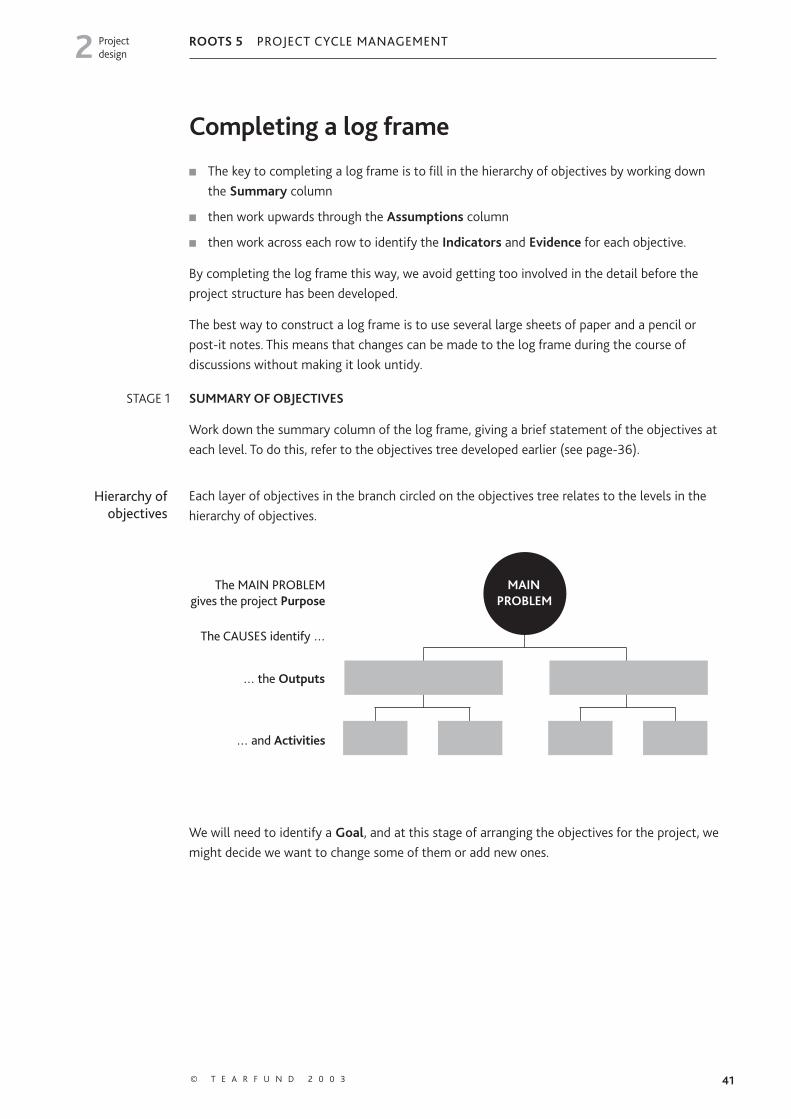
41© T E A R F U N D 2 0 0 3
ROOTS 5 PROJECT CYCLE MANAGEMENTProject design2
Completing a log frame
■ The key to completing a log frame is to fill in the hierarchy of objectives by working down the Summary column
■ then work upwards through the Assumptions column
■ then work across each row to identify the Indicators and Evidence for each objective.
By completing the log frame this way, we avoid getting too involved in the detail before the project structure has been developed.
The best way to construct a log frame is to use several large sheets of paper and a pencil or post-it notes. This means that changes can be made to the log frame during the course of discussions without making it look untidy.
STAGE 1 SUMMARY OF OBJECTIVES
Work down the summary column of the log frame, giving a brief statement of the objectives at each level. To do this, refer to the objectives tree developed earlier (see page-36).
Hierarchy of objectives
Each layer of objectives in the branch circled on the objectives tree relates to the levels in the hierarchy of objectives.
We will need to identify a Goal, and at this stage of arranging the objectives for the project, we might decide we want to change some of them or add new ones.
The MAIN PROBLEM gives the project Purpose
MAIN PROBLEM
… the Outputs
The CAUSES identify …
… and Activities
ROOTS 5 PCM brand E.indd 41ROOTS 5 PCM brand E.indd 41 3/3/09 11:06:04 am3/3/09 11:06:04 am

42 T E A R F U N D R O O T S R E S O U R C E S
ROOTS 5 PROJECT CYCLE MANAGEMENTProject design2
Explanation of objectives
GOAL This is the wider, long-term development goal. It is a desired state where a need or problem no longer exists or is significantly improved. The project will contribute towards this long-term impact, but will not achieve it itself. The goal could be the same for a number of projects and for a number of organisations. The goal might be a government objective or United Nations Millennium Development Goal.
Examples: ■ Improved health in children.
■ Decreased incidence and impact of diarrhoeal disease.
PURPOSE What change or benefit do we want the project to achieve? Try to include both material benefits and positive social change in the purpose statement.
There should be only one purpose. If we have more than one purpose, the project will be difficult to manage, so we should consider having separate projects. Each should have a separate log frame but will share the same goal.
Examples: ■ Increased immunisation in the project area.
■ Increased access to, and use of, safe water in the diocese.
OUTPUTS What outputs are needed to achieve the purpose? In other words, what will the project deliver? Outputs are what the project team has control over. Typically there may be three to six outputs.
Examples: ■ Team of healthcare workers strengthened and functioning.
■ Improved sources of safe water.
ACTIVITIES How will we deliver the outputs? It is likely that there will be a long list of activities to carry out. However, the log frame should not include too much detail. A detailed outline of the activities should be given in a separate activity schedule (see page-60).
The activity statements should start with an active verb.
Examples: ■ Recruit healthcare workers.
■ Upgrade current wells and establish new wells.
It is not necessary to set targets (quantity or quality) at this stage. This can be done when column 2 (indicators) is filled in. Use numbering to ensure that the activities are linked to their output (see example of a log frame on page 57).
Imagine organising a wedding. What would the goal, purpose, outputs and activities be?
Write them on cards and arrange them in an objectives tree.
Exercise
ROOTS 5 PCM brand E.indd 42ROOTS 5 PCM brand E.indd 42 3/3/09 11:06:04 am3/3/09 11:06:04 am
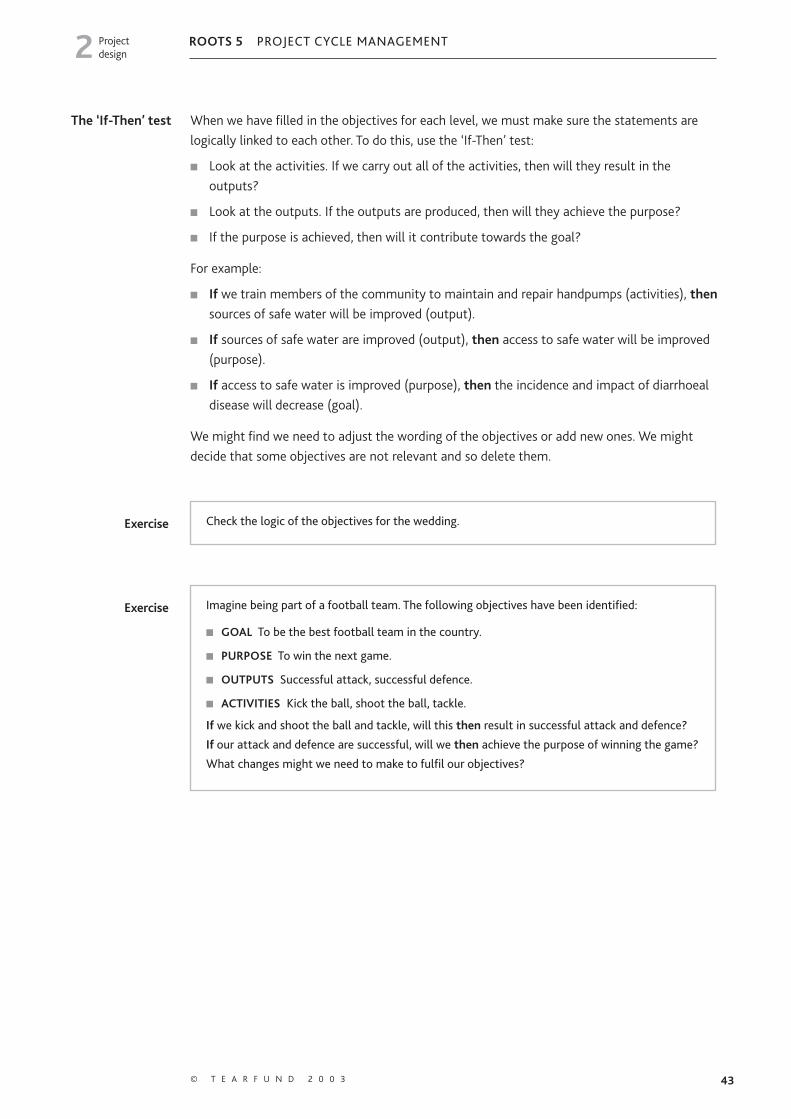
43© T E A R F U N D 2 0 0 3
ROOTS 5 PROJECT CYCLE MANAGEMENTProject design2
The ‘If-Then’ test When we have filled in the objectives for each level, we must make sure the statements are logically linked to each other. To do this, use the ‘If-Then’ test:
■ Look at the activities. If we carry out all of the activities, then will they result in the outputs?
■ Look at the outputs. If the outputs are produced, then will they achieve the purpose?
■ If the purpose is achieved, then will it contribute towards the goal?
For example:
■ If we train members of the community to maintain and repair handpumps (activities), then sources of safe water will be improved (output).
■ If sources of safe water are improved (output), then access to safe water will be improved (purpose).
■ If access to safe water is improved (purpose), then the incidence and impact of diarrhoeal disease will decrease (goal).
We might find we need to adjust the wording of the objectives or add new ones. We might decide that some objectives are not relevant and so delete them.
Check the logic of the objectives for the wedding.Exercise
Imagine being part of a football team. The following objectives have been identified:
■ GOAL To be the best football team in the country.
■ PURPOSE To win the next game.
■ OUTPUTS Successful attack, successful defence.
■ ACTIVITIES Kick the ball, shoot the ball, tackle.
If we kick and shoot the ball and tackle, will this then result in successful attack and defence?
If our attack and defence are successful, will we then achieve the purpose of winning the game?
What changes might we need to make to fulfil our objectives?
Exercise
ROOTS 5 PCM brand E.indd 43ROOTS 5 PCM brand E.indd 43 3/3/09 11:06:04 am3/3/09 11:06:04 am

44 T E A R F U N D R O O T S R E S O U R C E S
ROOTS 5 PROJECT CYCLE MANAGEMENTProject design2
EXAMPLE of completed column 1 of log frame
Summary Indicators Evidence Assumptions
Goal Decreased incidence and impact of diarrhoeal disease
Purpose Improved access to, and use of, safe water in diocese
Outputs 1 Participatory management systems set up for needs identification, planning and monitoring
2 Improved sources of safe water
3 Raised community awareness of good hygiene practices
Activities 1.1 Establish water user committees (WUCs)
1.2 Provide training for WUC members in surveying, planning, monitoring and proposal writing
1.3 Communities carry out baseline and monitoring surveys of water use and needs and submit proposals
1.4 Hold joint Diocese, District Water Department and WUC regional planning meetings
2.1 WUCs select Community Water Workers (CWWs) and agree incentives
2.2 Train CWWs to dig and cover wells and to maintain and repair handpumps
2.3 Upgrade current wells and establish new wells
2.4 Arrange for District Water Department to test water quality
2.5 CWWs repair and maintain handpumps
3.1 Train existing Community Health Promoters (CHPs) to increase their knowledge of diarrhoeal disease and the need for good hygiene practice
3.2 Community Health Promoters train men, women and children in good hygiene practice
ROOTS 5 PCM brand E.indd 44ROOTS 5 PCM brand E.indd 44 3/3/09 11:06:05 am3/3/09 11:06:05 am

45© T E A R F U N D 2 0 0 3
ROOTS 5 PROJECT CYCLE MANAGEMENTProject design2
STAGE 2 ASSUMPTIONS
We have checked that each objective should lead to the one above using the ‘If-Then’ test. However, we can never be 100% sure that each objective will lead to the next because there will always be a risk that external factors will affect the link. Most projects fail, not because of bad project design, but because of lack of attention to these factors that are either outside the control of the project or which are too difficult or costly to control. In the log frame we need to show that we have thought about what these factors might be.
To complete the assumptions column of the log frame, first consider the risks linked to the project.
Risk assessment Risk is the potential for unwanted happenings. Every activity involves risks. If they happen, some risks will affect the activity more than others. Risk assessment helps to identify them and consider the likelihood of them happening and their likely impact. The risks can then be managed by changing the project plans to ensure the risks are minimised.
Possible risks include:
■ climatic – rainfall
■ human – labour strikes, beneficiaries unwilling to try new techniques, project staff leaving the organisation
■ economic – crop prices being unstable
■ political – government policies
■ projects by other agencies not remaining on schedule.
METHOD OF RISK ASSESSMENT
Start with some large sheets of paper.
STEP 1 Identify the risks by:
■ looking at the various analyses that have been carried out, for example, stakeholder, economic, environmental, social, problem
■ going back to the objectives tree (page 37) and considering the constraints
Zapo Soap Company
Very sorry but we can no longersupport this
football club!
My greatest risk and nightmare!
Aggm!
ROOTS 5 PCM brand E.indd 45ROOTS 5 PCM brand E.indd 45 3/3/09 11:06:05 am3/3/09 11:06:05 am

46 T E A R F U N D R O O T S R E S O U R C E S
ROOTS 5 PROJECT CYCLE MANAGEMENTProject design2
■ looking at each objective in the log frame and brainstorming the assumptions that have to be made in order for the higher objective to be achieved. A useful series of questions to ask is:
• If we do these activities, what can stop us from delivering these outputs? • If we are successful in delivering these outputs, what can stop us from achieving this purpose? • If the purpose is achieved, what would stop it contributing to the goal?
STEP 2 Use an Impact/Probability matrix to evaluate the risks.
List all the risks and number them. Then consider how likely it is that each one will happen (probability) and what the impact of each risk happening might be. Think of the impact on project success and also the impact on the beneficiaries. Place the numbers in the matrix.
For example, in a project to improve yields, the first risk identified is that farmers might not adopt new varieties of seed. The probability of this happening is considered to be medium and the impact on the project if this risk happens is high. So a ‘1’ is placed in the relevant box.
Impact
LOW MEDIUM HIGH
Prob
abili
ty
LOW
MEDIUM 1
HIGH 2
1 Farmers might not adopt new varieties of seed
2 Rains may fail
STEP 3 Think about measures that will reduce or eliminate the risks. We may want to pay less attention to the risks that are low probability and low impact, although simple steps might reduce these. It is important to pay attention to the risks towards the bottom right-hand corner of the Impact/Probability matrix (high probability and high impact) as these in particular threaten the success of the project. If these risks cannot be reduced, it might be necessary to cancel the project.
For example, the risk that farmers will not adopt new varieties of seed is quite important. A measure to reduce the risk could be to ensure farmer participation in choosing the new varieties. If the rains fail, the project could fail. Irrigation might need to be considered as a project objective.
Remember to add these risk-reducing measures to the project objectives. In terms of the log frame, this will involve adding more activities and possibly outputs.
Impact/Probability matrix
ROOTS 5 PCM brand E.indd 46ROOTS 5 PCM brand E.indd 46 3/3/09 11:06:07 am3/3/09 11:06:07 am
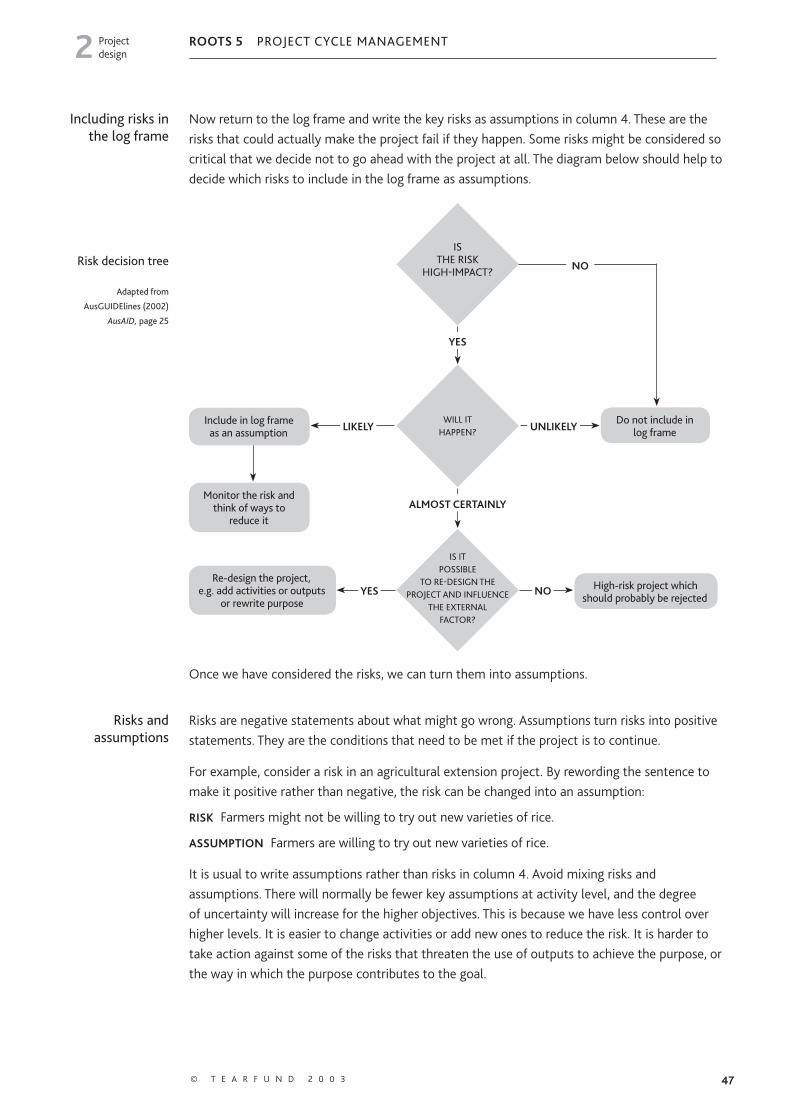
47© T E A R F U N D 2 0 0 3
ROOTS 5 PROJECT CYCLE MANAGEMENTProject design2
Including risks in the log frame
Now return to the log frame and write the key risks as assumptions in column 4. These are the risks that could actually make the project fail if they happen. Some risks might be considered so critical that we decide not to go ahead with the project at all. The diagram below should help to decide which risks to include in the log frame as assumptions.
Once we have considered the risks, we can turn them into assumptions.
Risks and assumptions
Risks are negative statements about what might go wrong. Assumptions turn risks into positive statements. They are the conditions that need to be met if the project is to continue.
For example, consider a risk in an agricultural extension project. By rewording the sentence to make it positive rather than negative, the risk can be changed into an assumption:
RISK Farmers might not be willing to try out new varieties of rice.
ASSUMPTION Farmers are willing to try out new varieties of rice.
It is usual to write assumptions rather than risks in column 4. Avoid mixing risks and assumptions. There will normally be fewer key assumptions at activity level, and the degree of uncertainty will increase for the higher objectives. This is because we have less control over higher levels. It is easier to change activities or add new ones to reduce the risk. It is harder to take action against some of the risks that threaten the use of outputs to achieve the purpose, or the way in which the purpose contributes to the goal.
Risk decision tree
Do not include in log frame
Monitor the risk and think of ways to
reduce it
Re-design the project,e.g. add activities or outputs
or rewrite purpose
High-risk project which should probably be rejected
UNLIKELYLIKELYInclude in log frame as an assumption
NOYES
IS IT POSSIBLE
TO RE-DESIGN THE PROJECT AND INFLUENCE
THE EXTERNAL FACTOR?
NO
ALMOST CERTAINLY
WILL IT HAPPEN?
IS THE RISK
HIGH-IMPACT?
YES
Adapted from
AusGUIDElines (2002)
AusAID, page 25
ROOTS 5 PCM brand E.indd 47ROOTS 5 PCM brand E.indd 47 3/3/09 11:06:07 am3/3/09 11:06:07 am
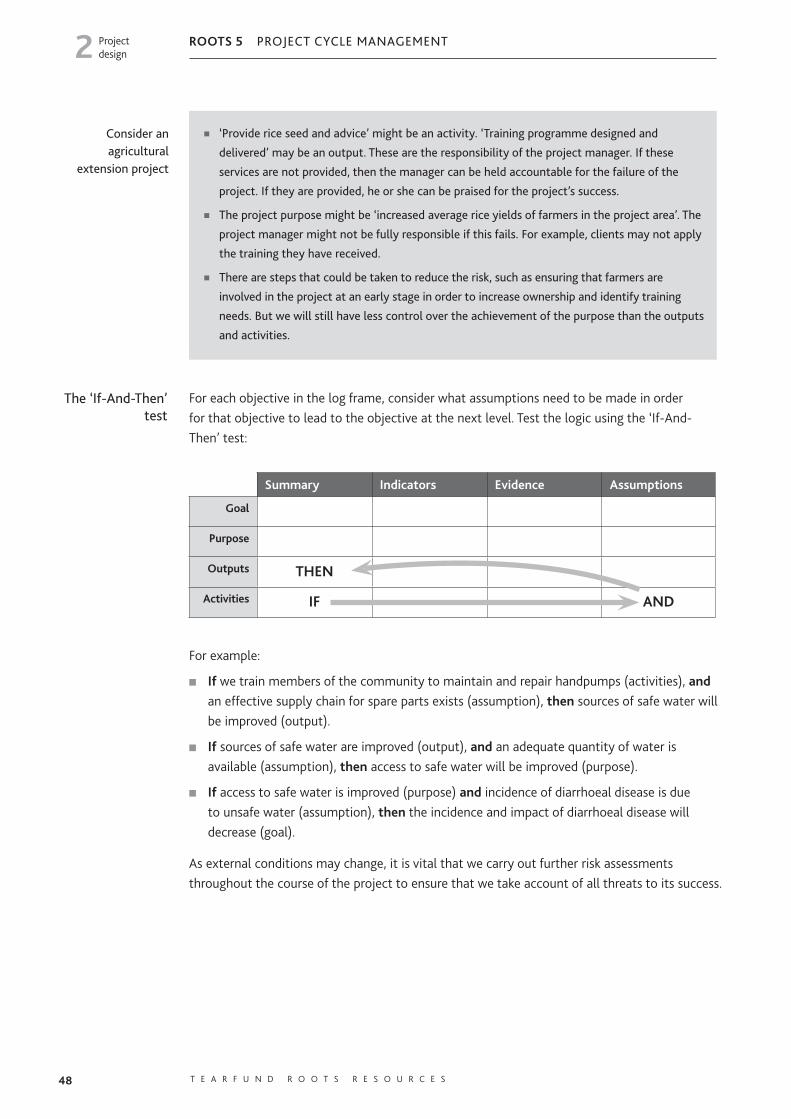
48 T E A R F U N D R O O T S R E S O U R C E S
ROOTS 5 PROJECT CYCLE MANAGEMENTProject design2
The ‘If-And-Then’ test
For each objective in the log frame, consider what assumptions need to be made in order for that objective to lead to the objective at the next level. Test the logic using the ‘If-And-Then’ test:
Summary Indicators Evidence Assumptions
Goal
Purpose
Outputs THEN
Activities IF AND
For example:
■ If we train members of the community to maintain and repair handpumps (activities), and an effective supply chain for spare parts exists (assumption), then sources of safe water will be improved (output).
■ If sources of safe water are improved (output), and an adequate quantity of water is available (assumption), then access to safe water will be improved (purpose).
■ If access to safe water is improved (purpose) and incidence of diarrhoeal disease is due to unsafe water (assumption), then the incidence and impact of diarrhoeal disease will decrease (goal).
As external conditions may change, it is vital that we carry out further risk assessments throughout the course of the project to ensure that we take account of all threats to its success.
■ ‘Provide rice seed and advice’ might be an activity. ‘Training programme designed and
delivered’ may be an output. These are the responsibility of the project manager. If these
services are not provided, then the manager can be held accountable for the failure of the
project. If they are provided, he or she can be praised for the project’s success.
■ The project purpose might be ‘increased average rice yields of farmers in the project area’. The
project manager might not be fully responsible if this fails. For example, clients may not apply
the training they have received.
■ There are steps that could be taken to reduce the risk, such as ensuring that farmers are
involved in the project at an early stage in order to increase ownership and identify training
needs. But we will still have less control over the achievement of the purpose than the outputs
and activities.
Consider an agricultural
extension project
ROOTS 5 PCM brand E.indd 48ROOTS 5 PCM brand E.indd 48 3/3/09 11:06:08 am3/3/09 11:06:08 am
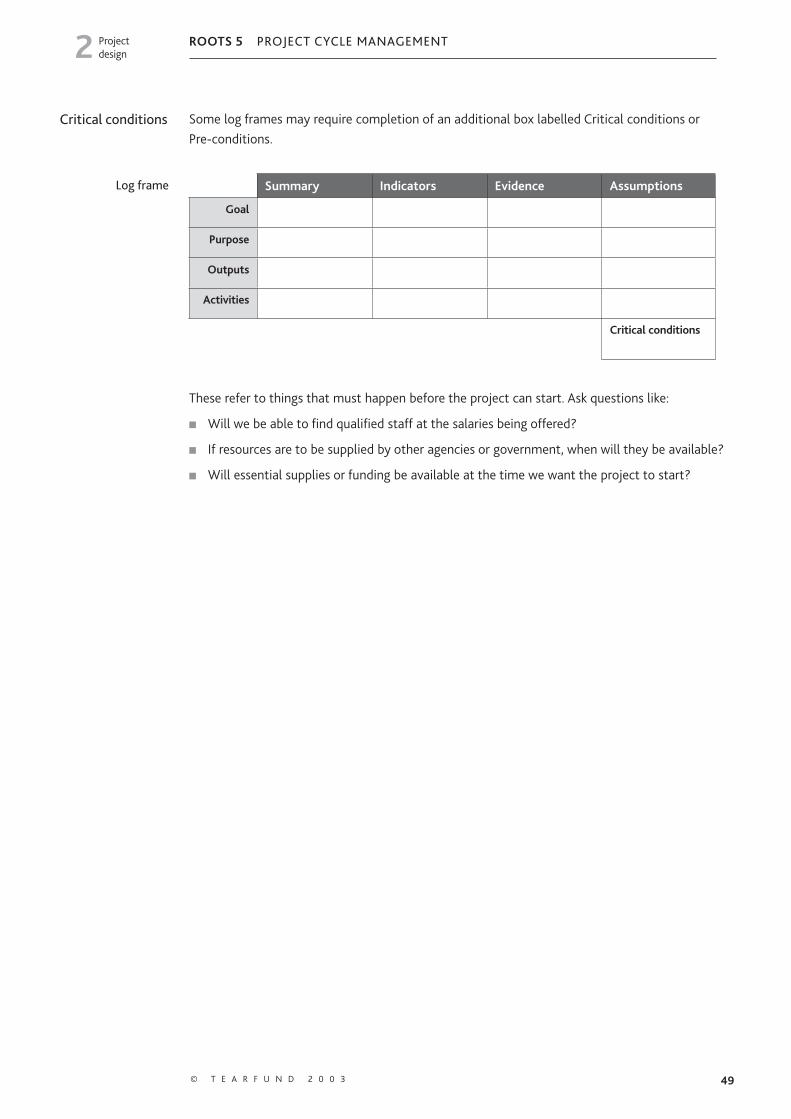
49© T E A R F U N D 2 0 0 3
ROOTS 5 PROJECT CYCLE MANAGEMENTProject design2
Critical conditions Some log frames may require completion of an additional box labelled Critical conditions or Pre-conditions.
Summary Indicators Evidence Assumptions
Goal
Purpose
Outputs
Activities
Critical conditions
These refer to things that must happen before the project can start. Ask questions like:
■ Will we be able to find qualified staff at the salaries being offered?
■ If resources are to be supplied by other agencies or government, when will they be available?
■ Will essential supplies or funding be available at the time we want the project to start?
Log frame
ROOTS 5 PCM brand E.indd 49ROOTS 5 PCM brand E.indd 49 3/3/09 11:06:08 am3/3/09 11:06:08 am
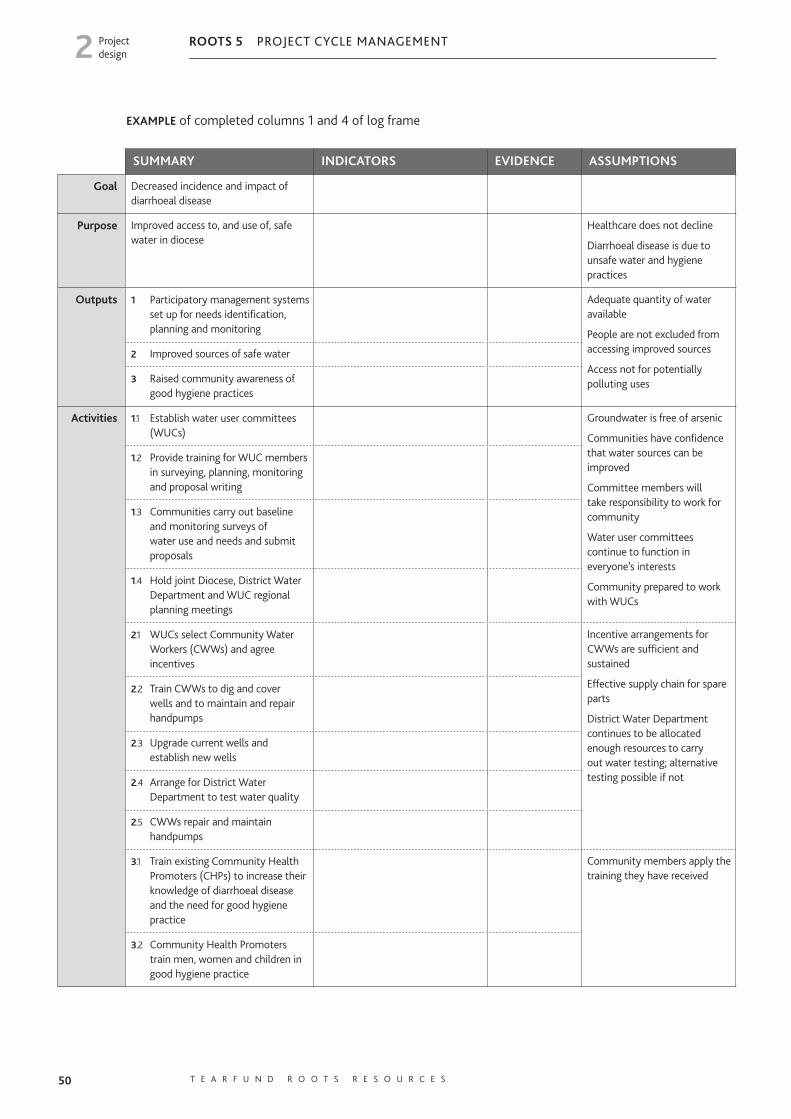
50 T E A R F U N D R O O T S R E S O U R C E S
ROOTS 5 PROJECT CYCLE MANAGEMENTProject design2
EXAMPLE of completed columns 1 and 4 of log frame
SUMMARY INDICATORS EVIDENCE ASSUMPTIONS
Goal Decreased incidence and impact of diarrhoeal disease
Purpose Improved access to, and use of, safe water in diocese
Healthcare does not decline
Diarrhoeal disease is due to un safe water and hygiene practices
Outputs 1 Participatory management systems set up for needs identification, planning and monitoring
Adequate quantity of water available
People are not excluded from accessing improved sources
Access not for potentially polluting uses
2 Improved sources of safe water
3 Raised community awareness of good hygiene practices
Activities 1.1 Establish water user committees (WUCs)
Groundwater is free of arsenic
Communities have confidence that water sources can be improved
Committee members will take responsibility to work for community
Water user committees continue to function in everyone’s interests
Community prepared to work with WUCs
1.2 Provide training for WUC members in surveying, planning, monitoring and proposal writing
1.3 Communities carry out baseline and monitoring surveys of water use and needs and submit proposals
1.4 Hold joint Diocese, District Water Department and WUC regional planning meetings
2.1 WUCs select Community Water Workers (CWWs) and agree incentives
Incentive arrangements for CWWs are sufficient and sustained
Effective supply chain for spare parts
District Water Department continues to be allocated enough resources to carry out water testing; alternative testing possible if not
2.2 Train CWWs to dig and cover wells and to maintain and repair handpumps
2.3 Upgrade current wells and establish new wells
2.4 Arrange for District Water Department to test water quality
2.5 CWWs repair and maintain handpumps
3.1 Train existing Community Health Promoters (CHPs) to increase their knowledge of diarrhoeal disease and the need for good hygiene practice
Community members apply the training they have received
3.2 Community Health Promoters train men, women and children in good hygiene practice
ROOTS 5 PCM brand E.indd 50ROOTS 5 PCM brand E.indd 50 3/3/09 11:06:08 am3/3/09 11:06:08 am

51© T E A R F U N D 2 0 0 3
ROOTS 5 PROJECT CYCLE MANAGEMENTProject design2
STAGE 3 INDICATORS AND EVIDENCE
Indicators (column 2 of
log frame)
Indicators are targets that show progress towards achieving objectives. They answer the question ‘How do we know whether or not what we planned is happening, or has happened?’ Indicators help us to monitor, review and evaluate the project. They enable us to know whether the project plans need adjusting. They help us to learn lessons from a project in order to avoid making the same mistakes in other projects.
Log frames sometimes call indicators ‘Objectively Verifiable Indicators’. The term ‘objectively’ is used because indicators should not depend on the point of view of the person measuring them. It should not matter who measures them – the same result should be reached. So it is better to ask two people to measure attendance at a meeting by counting the number of people there, than to ask them to grade atten dance on a scale of very poor, poor, adequate, good or very good. One person might think attendance is very good while another might think it is only adequate. This would depend on their past experience of meetings and their own expectations of how many people might attend this one.
It is important to think about who should identify and measure the indicators. Primary stakeholders should have an opportunity to set indicators because:
■ it enhances the ownership and transparency of the project
■ primary stakeholders might be able to think of appropriate indicators that project staff based outside the community would not have considered
■ some things are most easily measured by the primary stakeholders themselves
■ primary stakeholders can be encouraged and empowered by the progress of the project.
Types of indicators
There are many different types of indicators to consider. Try to be creative and use a mixture in order to ensure that the objectives can be measured effectively and that monitoring and evaluation needs can be met.
■ FORMATIVE indicators (also called Milestones) are used during an activity, phase or project to show whether progress is on track. SUMMATIVE indicators are used at the end of the project for evaluation.
So how are we going to measure
our success?
Well,The goals scoredGames wonCrowd numbersMedia coverage!
ROOTS 5 PCM brand E.indd 51ROOTS 5 PCM brand E.indd 51 3/3/09 11:06:09 am3/3/09 11:06:09 am

52 T E A R F U N D R O O T S R E S O U R C E S
ROOTS 5 PROJECT CYCLE MANAGEMENTProject design2
■ DIRECT indicators measure the objective directly, such as the number of children attending school.INDIRECT indicators (also called Proxy indicators) are used if direct indicators are not appropriate or possible if, for example:
• results cannot be measured directly, such as quality of life
• direct indicators are too expensive to measure
• direct indicators can only be measured after the project has ended.
For example, to measure an increase in literacy it might be difficult or costly to interview children, but the number of books borrowed from the school library might give you an indication of whether or not literacy has increased.
It can be very difficult to measure people’s incomes without offending them. Instead, we could look at changes in household expenditure. This might involve choosing a list of items that a household might have, including a few luxury items, and see how expenditure changes over time. We could also look at sales figures of local shops and services as these are likely to be affected by changes in the incomes of the local population.
It is easier to measure behaviour than feelings because behaviour can be observed. So if we want to measure whether people feel more confident, we could observe how often they speak in community meetings.
QUANTITATIVE indicators can be analysed in numerical form – who, what, when, where, how much, how many, how often? This might include:
■ how often things happen
■ number of people involved or affected
■ growth rates
■ uptake, for example, school enrolment, visits to clinic, adoption of new seed varieties.
QUALITATIVE indicators measure things that cannot be counted, like:
■ satisfaction, opinions
■ decision-making ability
■ changes in attitude.
Try to use a mixture of quantitative and qualitative indicators so that we can be sure to capture the real progress and impact of the project.
Imagination is very important when setting indicators. It can help to ask a group of stakeholders setting indicators to close their eyes and imagine how the situation will be improved by the end of the project. What do they hear, see, touch, feel and smell that will be different when the main problem has been addressed? If we are aiming for holistic development, then our impact on spiritual well-being should be as great as that on physical well-being. Spiritual indicators are particularly difficult to set. Indirect indicators might have to be used.
ROOTS 5 PCM brand E.indd 52ROOTS 5 PCM brand E.indd 52 3/3/09 11:06:10 am3/3/09 11:06:10 am

53© T E A R F U N D 2 0 0 3
ROOTS 5 PROJECT CYCLE MANAGEMENTProject design2
Setting good indicators
Indicators should be:
■ RELEVANT Is the indicator relevant to the objective it is measuring? For example, if an objective is ‘to increase handpump use’, measuring the number of handpumps produced would not a good indicator because it does not measure how many are actually being used.
■ SUFFICIENT Is more than one indicator needed?
■ SPECIFIC Quality, quantity, time (see QQT box on page 54).
■ MEASURABLE Can the indicator realistically be measured?
■ SENSITIVE TO THE CHANGES that will be happening as a result of the project or programme – if the planned changes happen, will the indicator still be appropriate and measurable?
■ COST-EFFECTIVE Can the indicators be measured with reasonable cost and effort? Is the cost of measuring the indicators proportionate to the total project cost?
■ AVAILABLE Can the indicator be measured at the planned time? For example, consider seasonal climatic change.
■ ECONOMIC Yield per hectare, production per labourer, eggs per day, production of handicraft
items per month, average income, land area per household, cattle per household, percentage
of people with bank accounts, percentage of people above or below the poverty line,
percentage of people without land, rate of migration.
■ SOCIAL Infant mortality rate, number of deaths, literacy rate, average years in formal
schooling, number of students entering secondary education, difference between male and
female wages, percentage of women receiving training, percentage of people attending
meetings, representation of disadvantaged groups on committees.
■ ENVIRONMENTAL Fish harvested per year, length of fallow, forest cleared each year, water
availability in soil, erosion, percentage of households practising composting, average time to
collect fuel wood each day.
■ SPIRITUAL Crime rate, divorce rate, church membership, attendance at church meetings.
Adapted from Introduction to the Programme and Project Cycle: training handbook CIDT (2002) University of Wolverhampton
EXAMPLESof basic indicators
ROOTS 5 PCM brand E.indd 53ROOTS 5 PCM brand E.indd 53 3/3/09 11:06:10 am3/3/09 11:06:10 am
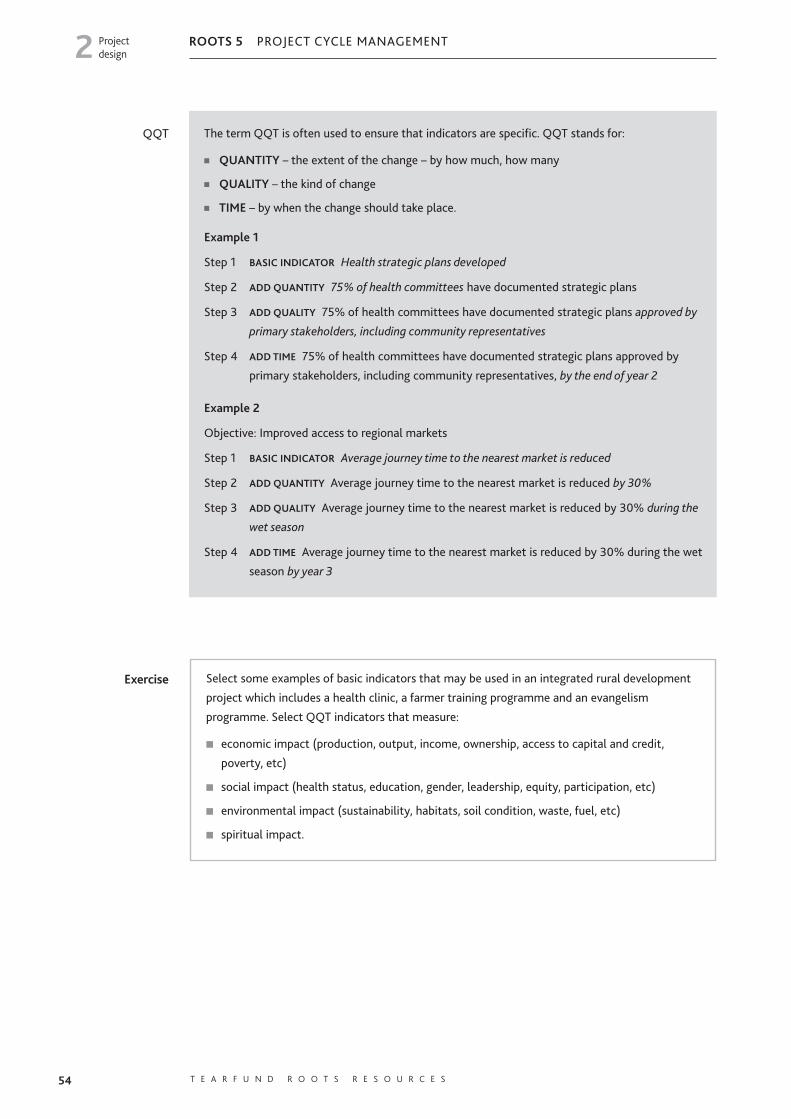
54 T E A R F U N D R O O T S R E S O U R C E S
ROOTS 5 PROJECT CYCLE MANAGEMENTProject design2
Select some examples of basic indicators that may be used in an integrated rural development
project which includes a health clinic, a farmer training programme and an evangelism
programme. Select QQT indicators that measure:
■ economic impact (production, output, income, ownership, access to capital and credit,
poverty, etc)
■ social impact (health status, education, gender, leadership, equity, participation, etc)
■ environmental impact (sustainability, habitats, soil condition, waste, fuel, etc)
■ spiritual impact.
The term QQT is often used to ensure that indicators are specific. QQT stands for:
■ QUANTITY – the extent of the change – by how much, how many
■ QUALITY – the kind of change
■ TIME – by when the change should take place.
Example 1
Step 1 BASIC INDICATOR Health strategic plans developed
Step 2 ADD QUANTITY 75% of health committees have documented strategic plans
Step 3 ADD QUALITY 75% of health committees have documented strategic plans approved by
primary stakeholders, including community representatives
Step 4 ADD TIME 75% of health committees have documented strategic plans approved by
primary stakeholders, including community representatives, by the end of year 2
Example 2
Objective: Improved access to regional markets
Step 1 BASIC INDICATOR Average journey time to the nearest market is reduced
Step 2 ADD QUANTITY Average journey time to the nearest market is reduced by 30%
Step 3 ADD QUALITY Average journey time to the nearest market is reduced by 30% during the
wet season
Step 4 ADD TIME Average journey time to the nearest market is reduced by 30% during the wet
season by year 3
QQT
Exercise
ROOTS 5 PCM brand E.indd 54ROOTS 5 PCM brand E.indd 54 3/3/09 11:06:11 am3/3/09 11:06:11 am
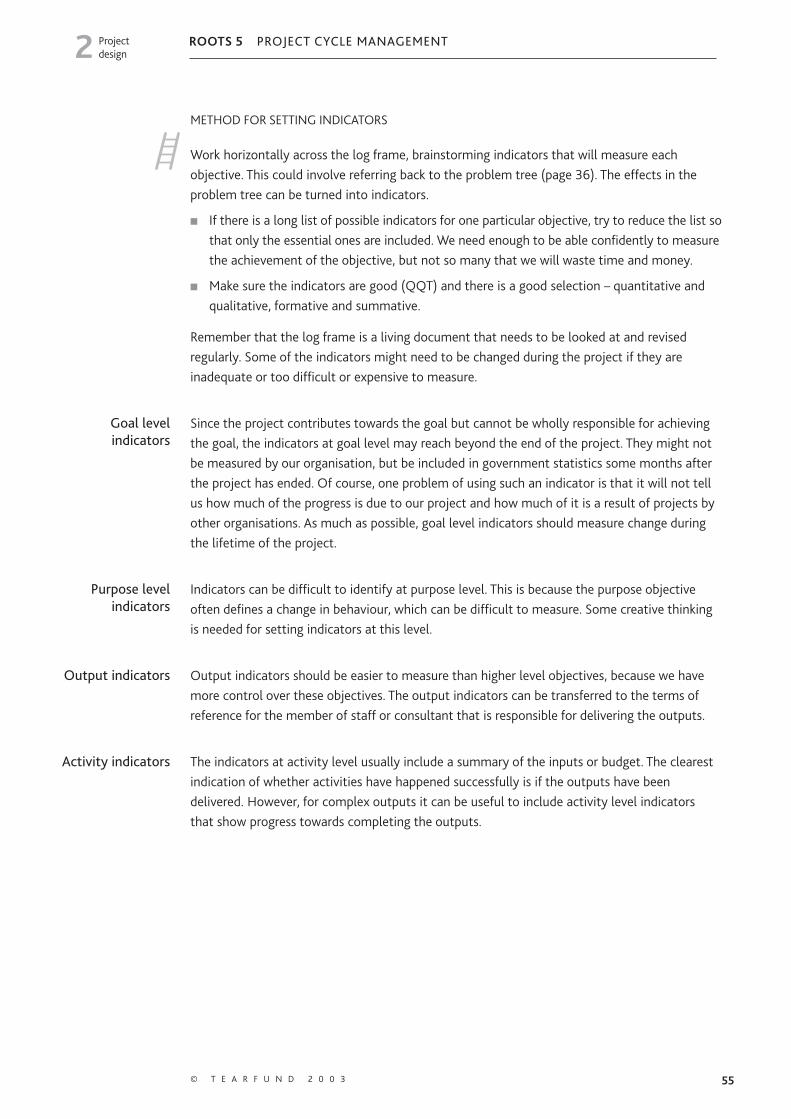
55© T E A R F U N D 2 0 0 3
ROOTS 5 PROJECT CYCLE MANAGEMENTProject design2
METHOD FOR SETTING INDICATORS
Work horizontally across the log frame, brainstorming indicators that will measure each objective. This could involve referring back to the problem tree (page 36). The effects in the problem tree can be turned into indicators.
■ If there is a long list of possible indicators for one particular objective, try to reduce the list so that only the essential ones are included. We need enough to be able confidently to measure the achievement of the objective, but not so many that we will waste time and money.
■ Make sure the indicators are good (QQT) and there is a good selection – quantitative and qualitative, formative and summative.
Remember that the log frame is a living document that needs to be looked at and revised regularly. Some of the indicators might need to be changed during the project if they are inadequate or too difficult or expensive to measure.
Goal level indicators
Since the project contributes towards the goal but cannot be wholly responsible for achieving the goal, the indicators at goal level may reach beyond the end of the project. They might not be measured by our organisation, but be included in government statistics some months after the project has ended. Of course, one problem of using such an indicator is that it will not tell us how much of the progress is due to our project and how much of it is a result of projects by other organisations. As much as possible, goal level indicators should measure change during the lifetime of the project.
Purpose level indicators
Indicators can be difficult to identify at purpose level. This is because the purpose objective often defines a change in behaviour, which can be difficult to measure. Some creative thinking is needed for setting indicators at this level.
Output indicators Output indicators should be easier to measure than higher level objectives, because we have more control over these objectives. The output indicators can be transferred to the terms of reference for the member of staff or consultant that is responsible for delivering the outputs.
Activity indicators The indicators at activity level usually include a summary of the inputs or budget. The clearest indication of whether activities have happened successfully is if the outputs have been delivered. However, for complex outputs it can be useful to include activity level indicators that show progress towards completing the outputs.
ROOTS 5 PCM brand E.indd 55ROOTS 5 PCM brand E.indd 55 3/3/09 11:06:11 am3/3/09 11:06:11 am
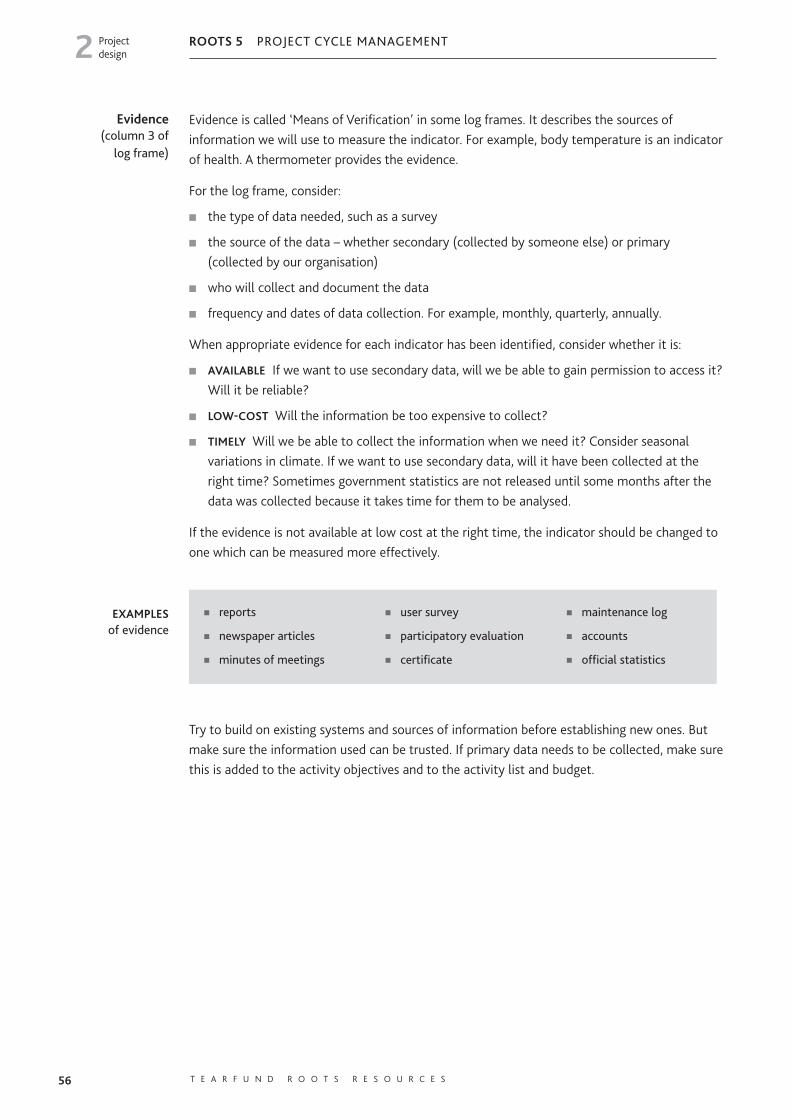
56 T E A R F U N D R O O T S R E S O U R C E S
ROOTS 5 PROJECT CYCLE MANAGEMENTProject design2
Evidence (column 3 of
log frame)
Evidence is called ‘Means of Verification’ in some log frames. It describes the sources of information we will use to measure the indicator. For example, body temperature is an indicator of health. A thermometer provides the evidence.
For the log frame, consider:
■ the type of data needed, such as a survey
■ the source of the data – whether secondary (collected by someone else) or primary (collected by our organisation)
■ who will collect and document the data
■ frequency and dates of data collection. For example, monthly, quarterly, annually.
When appropriate evidence for each indicator has been identified, consider whether it is:
■ AVAILABLE If we want to use secondary data, will we be able to gain permission to access it? Will it be reliable?
■ LOW-COST Will the information be too expensive to collect?
■ TIMELY Will we be able to collect the information when we need it? Consider seasonal variations in climate. If we want to use secondary data, will it have been collected at the right time? Sometimes government statistics are not released until some months after the data was collected because it takes time for them to be analysed.
If the evidence is not available at low cost at the right time, the indicator should be changed to one which can be measured more effectively.
Try to build on existing systems and sources of information before establishing new ones. But make sure the information used can be trusted. If primary data needs to be collected, make sure this is added to the activity objectives and to the activity list and budget.
■ reports
■ newspaper articles
■ minutes of meetings
■ user survey
■ participatory evaluation
■ certificate
■ maintenance log
■ accounts
■ official statistics
EXAMPLES of evidence
ROOTS 5 PCM brand E.indd 56ROOTS 5 PCM brand E.indd 56 3/3/09 11:06:12 am3/3/09 11:06:12 am

57© T E A R F U N D 2 0 0 3
ROOTS 5 PROJECT CYCLE MANAGEMENTProject design2
EXAMPLE of completed columns 2 and 3 of log frame
Summary Indicators Evidence Assumptions
Goal Decreased incidence and impact of diarrhoeal disease
Mortality rate due to diarrhoeal disease reduced by 5% by end of year 3
Incidence of diarrhoeal disease in dio cese reduced by 50% by end of year 3
Government statistics
Local health centre statistics
Purpose Improved access to, and use of, safe water in diocese
All households accessing at least 15 litres water per person per day by end of year 3
Average distance of households to nearest safe water less than 500m by end of year 3
Household survey report
Household survey report
Healthcare does not decline
Diarrhoeal disease is due to un safe water and hygiene practices
Outputs 1 Participatory management systems set up for needs identification, planning and monitoring
Diocese and community joint plans and budgets in place by end of month 9
At least 90% of WUCs raise local contributions by end of year 1
Plans and budgets
WUC logbooks
Adequate quantity of water available
People are not excluded from accessing improved sources
Access not for potentially polluting uses
Hygiene practices are culturally acceptable
2 Improved sources of safe water At least 90 improved or new sources of safe water established and in operation by end of year 2
WUC logbooks
Water quality test reports
3 Raised community awareness of good hygiene practices
Number of people washing hands after defecating increased to 75% of target population by end of month 30
Survey of knowledge, attitudes and practice
Activities 1.1 Establish water user committees (WUCs)
30 WUCs established in five diocesan regions by end of month 3
Once established, WUC meetings held once a month
Constitutions of WUCs
Minutes of meetings
Membership list
Groundwater is free of arsenic
Communities have confidence that water sources can be improved
Committee members will take responsibility to work for community
Water user committees continue to function in everyone’s interests
Community prepared to work with WUCs
1.2 Provide training for WUC members in surveying, planning, monitoring and proposal writing
All WUC members trained by end of month 5
Training records
1.3 Communities carry out baseline and monitoring surveys of water use and needs and submit proposals
All WUCs complete baseline surveys and submit proposals by month 7
Survey reports and proposals
1.4 Hold joint Diocese, District Water Department and WUC regional planning meetings
Agreement reached with Water Department and all WUCs by end of month 9
Minutes of meetings
Letters of agreement
continued on page 58
ROOTS 5 PCM brand E.indd 57ROOTS 5 PCM brand E.indd 57 3/3/09 11:06:12 am3/3/09 11:06:12 am
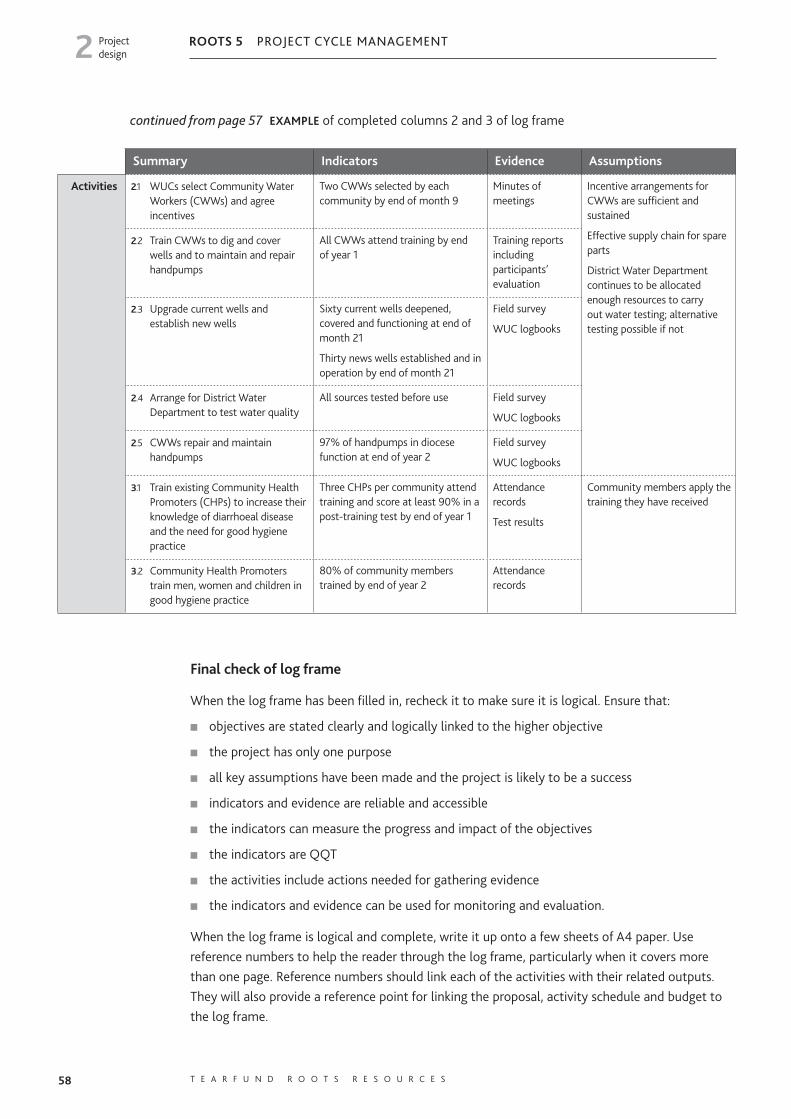
58 T E A R F U N D R O O T S R E S O U R C E S
ROOTS 5 PROJECT CYCLE MANAGEMENTProject design2
Final check of log frame
When the log frame has been filled in, recheck it to make sure it is logical. Ensure that:
■ objectives are stated clearly and logically linked to the higher objective
■ the project has only one purpose
■ all key assumptions have been made and the project is likely to be a success
■ indicators and evidence are reliable and accessible
■ the indicators can measure the progress and impact of the objectives
■ the indicators are QQT
■ the activities include actions needed for gathering evidence
■ the indicators and evidence can be used for monitoring and evaluation.
When the log frame is logical and complete, write it up onto a few sheets of A4 paper. Use reference numbers to help the reader through the log frame, particularly when it covers more than one page. Reference numbers should link each of the activities with their related outputs. They will also provide a reference point for linking the proposal, activity schedule and budget to the log frame.
continued from page 57 EXAMPLE of completed columns 2 and 3 of log frame
Summary Indicators Evidence Assumptions
Activities 2.1 WUCs select Community Water Workers (CWWs) and agree incentives
Two CWWs selected by each community by end of month 9
Minutes of meetings
Incentive arrangements for CWWs are sufficient and sustained
Effective supply chain for spare parts
District Water Department continues to be allocated enough resources to carry out water testing; alternative testing possible if not
2.2 Train CWWs to dig and cover wells and to maintain and repair handpumps
All CWWs attend training by end of year 1
Training reports including participants’ evaluation
2.3 Upgrade current wells and establish new wells
Sixty current wells deepened, covered and functioning at end of month 21
Thirty news wells established and in operation by end of month 21
Field survey
WUC logbooks
2.4 Arrange for District Water Department to test water quality
All sources tested before use Field survey
WUC logbooks
2.5 CWWs repair and maintain handpumps
97% of handpumps in diocese function at end of year 2
Field survey
WUC logbooks
3.1 Train existing Community Health Promoters (CHPs) to increase their knowledge of diarrhoeal disease and the need for good hygiene practice
Three CHPs per community attend training and score at least 90% in a post-training test by end of year 1
Attendance records
Test results
Community members apply the training they have received
3.2 Community Health Promoters train men, women and children in good hygiene practice
80% of community members trained by end of year 2
Attendance records
ROOTS 5 PCM brand E.indd 58ROOTS 5 PCM brand E.indd 58 3/3/09 11:06:13 am3/3/09 11:06:13 am
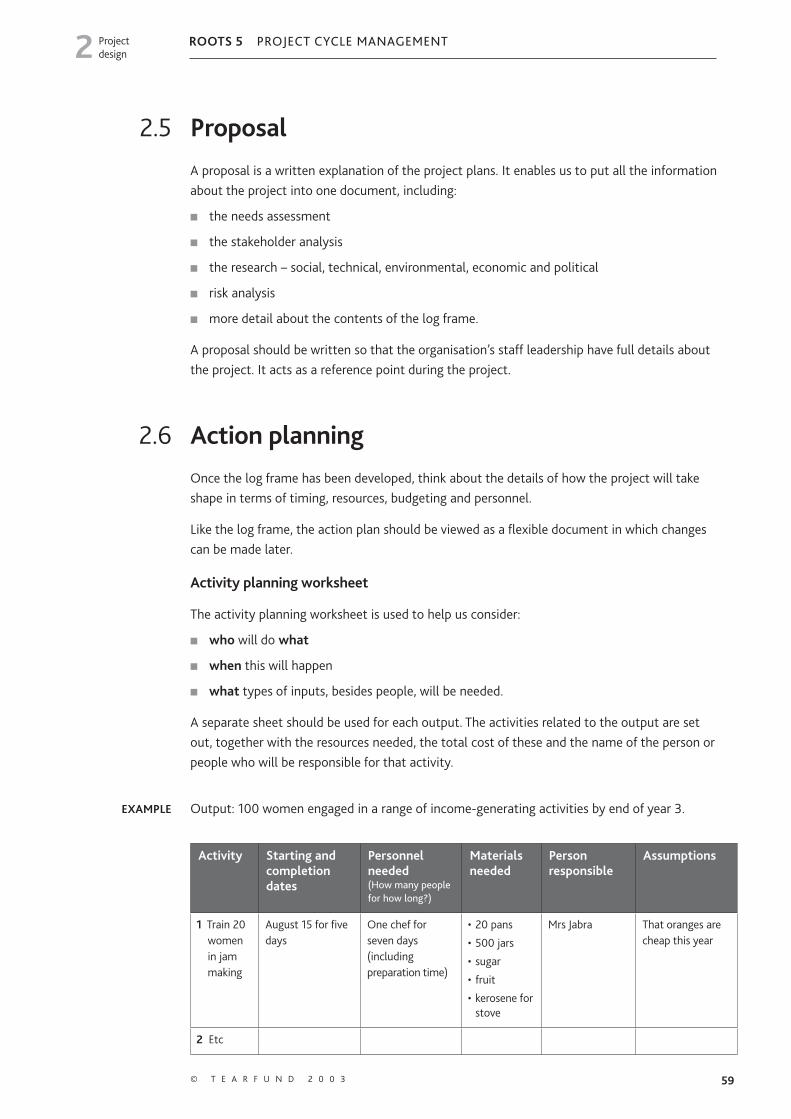
59© T E A R F U N D 2 0 0 3
ROOTS 5 PROJECT CYCLE MANAGEMENTProject design2
2.5 ProposalA proposal is a written explanation of the project plans. It enables us to put all the information about the project into one document, including:
■ the needs assessment
■ the stakeholder analysis
■ the research – social, technical, environmental, economic and political
■ risk analysis
■ more detail about the contents of the log frame.
A proposal should be written so that the organisation’s staff leadership have full details about the project. It acts as a reference point during the project.
2.6 Action planningOnce the log frame has been developed, think about the details of how the project will take shape in terms of timing, resources, budgeting and personnel.
Like the log frame, the action plan should be viewed as a flexible document in which changes can be made later.
Activity planning worksheet
The activity planning worksheet is used to help us consider:
■ who will do what
■ when this will happen
■ what types of inputs, besides people, will be needed.
A separate sheet should be used for each output. The activities related to the output are set out, together with the resources needed, the total cost of these and the name of the person or people who will be responsible for that activity.
EXAMPLE Output: 100 women engaged in a range of income-generating activities by end of year 3.
Activity Starting and completion dates
Personnel needed (How many people for how long?)
Materials needed
Person responsible
Assumptions
1 Train 20 women in jam making
August 15 for five days
One chef for seven days (including preparation time)
• 20 pans
• 500 jars
• sugar
• fruit
• kerosene forstove
Mrs Jabra That oranges are cheap this year
2 Etc
ROOTS 5 PCM brand E.indd 59ROOTS 5 PCM brand E.indd 59 3/3/09 11:06:13 am3/3/09 11:06:13 am

60 T E A R F U N D R O O T S R E S O U R C E S
ROOTS 5 PROJECT CYCLE MANAGEMENTProject design2
Monitoring and reviewing systems
Remember to include monitoring and reviewing in the activity planning worksheet. Think about who will collect the evidence for the indicators and who will analyse it. Identify who will be responsible for making decisions about changing the project design as a result of lessons learnt. Ensure that stakeholders are involved in this process.
If the information gathered during project identification and research is not enough to give baseline data for the indicators that have been identified, then a baseline survey should be carried out before the project implementation starts. This means that there will be data to compare progress against. For example, an indicator is ‘attendance by girls at the primary school increased by 50%’. For the baseline survey, the number of girls attending the primary school should be counted. When progress is monitored later on, the number of girls attending school can be counted and then compared with the figures in the baseline survey.
Activity schedule (known as a Gantt chart)
The activity schedule enables us to consider when our activities will happen and for how long. This will help us to think about when would be appropriate to carry out the different activities. Timing will depend on things such as:
■ seasonal weather patterns
■ availability of trainers
■ availability of materials.
The activity schedule helps us to look at the sequencing of activities because some activities will depend on others being completed first.
Use the activity schedule during the project to monitor progress. Ask questions like:
■ Why are these activities not happening to schedule?
■ What will be the effect of this on other project activities?
■ How can we catch up?
The activity schedule should be viewed as a flexible document and can be altered if new circumstances arise.
The lines in the chart indicate the time span for each activity. Make some lines thicker if the activity is intense, and so avoid planning too many intense activities at the same time. Put the initials of the member of the team who is responsible for the activity above each line. The chart format can be altered if we want to indicate activities on a week-by-week basis.
ROOTS 5 PCM brand E.indd 60ROOTS 5 PCM brand E.indd 60 3/3/09 11:06:14 am3/3/09 11:06:14 am
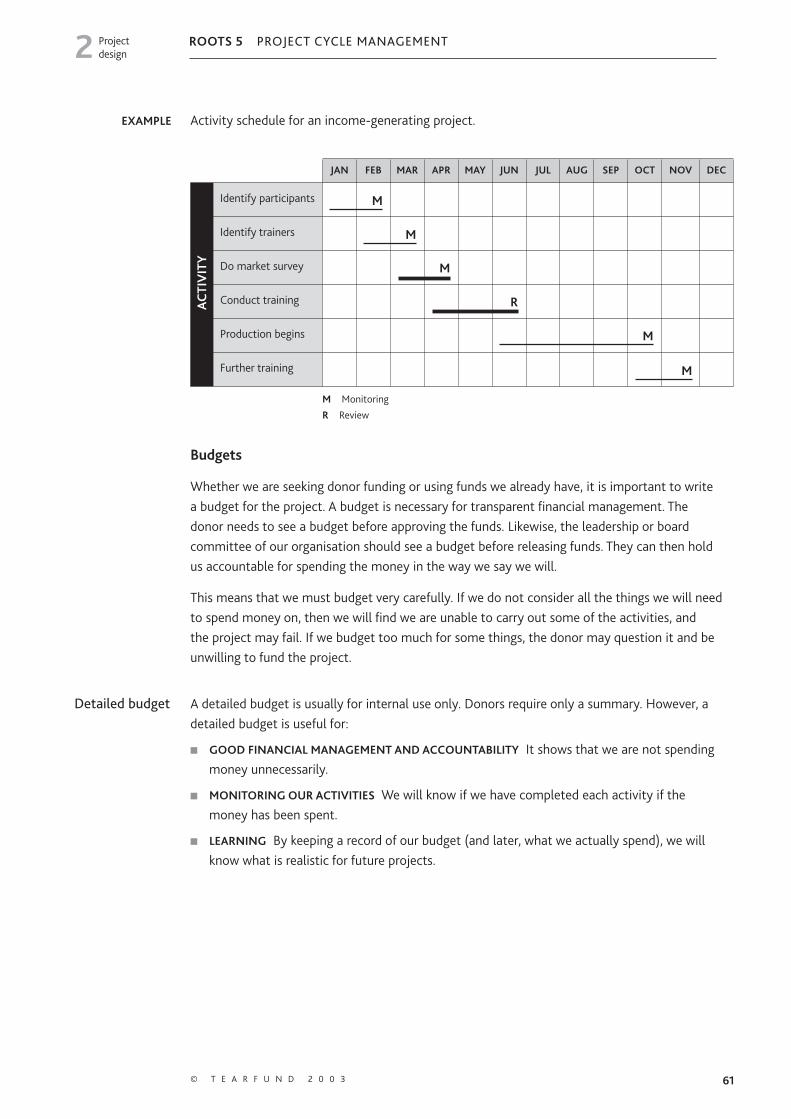
61© T E A R F U N D 2 0 0 3
ROOTS 5 PROJECT CYCLE MANAGEMENTProject design2
EXAMPLE Activity schedule for an income-generating project.
JAN FEB MAR APR MAY JUN JUL AUG SEP OCT NOV DEC
AC
TIV
ITY
Identify participants
Identify trainers
Do market survey
Conduct training
Production begins
Further training
M Monitoring
R Review
Budgets
Whether we are seeking donor funding or using funds we already have, it is important to write a budget for the project. A budget is necessary for transparent financial manage ment. The donor needs to see a budget before approving the funds. Likewise, the leadership or board committee of our organisation should see a budget before releasing funds. They can then hold us accountable for spending the money in the way we say we will.
This means that we must budget very carefully. If we do not consider all the things we will need to spend money on, then we will find we are unable to carry out some of the activities, and the project may fail. If we budget too much for some things, the donor may question it and be unwilling to fund the project.
Detailed budget A detailed budget is usually for internal use only. Donors require only a summary. However, a detailed budget is useful for:
■ GOOD FINANCIAL MANAGEMENT AND ACCOUNTABILITY It shows that we are not spending money unnecessarily.
■ MONITORING OUR ACTIVITIES We will know if we have completed each activity if the money has been spent.
■ LEARNING By keeping a record of our budget (and later, what we actually spend), we will know what is realistic for future projects.
M
M
M
R
M
M
ROOTS 5 PCM brand E.indd 61ROOTS 5 PCM brand E.indd 61 3/3/09 11:06:14 am3/3/09 11:06:14 am
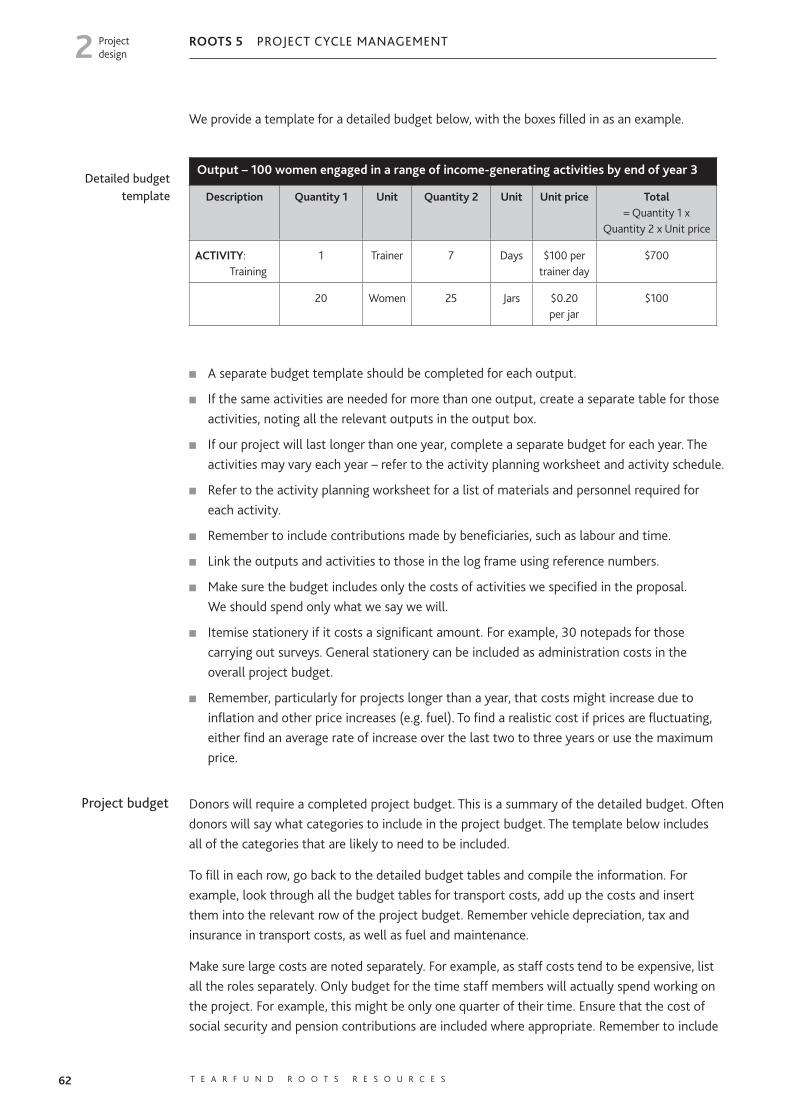
62 T E A R F U N D R O O T S R E S O U R C E S
ROOTS 5 PROJECT CYCLE MANAGEMENTProject design2
We provide a template for a detailed budget below, with the boxes filled in as an example.
Output – 100 women engaged in a range of income-generating activities by end of year 3
Description Quantity 1 Unit Quantity 2 Unit Unit price Total= Quantity 1 x
Quantity 2 x Unit price
ACTIVITY: Training
1 Trainer 7 Days $100 per trainer day
$700
20 Women 25 Jars $0.20 per jar
$100
■ A separate budget template should be completed for each output.
■ If the same activities are needed for more than one output, create a separate table for those activities, noting all the relevant outputs in the output box.
■ If our project will last longer than one year, complete a separate budget for each year. The activities may vary each year – refer to the activity planning worksheet and activity schedule.
■ Refer to the activity planning worksheet for a list of materials and personnel required for each activity.
■ Remember to include contributions made by beneficiaries, such as labour and time.
■ Link the outputs and activities to those in the log frame using reference numbers.
■ Make sure the budget includes only the costs of activities we specified in the proposal. We should spend only what we say we will.
■ Itemise stationery if it costs a significant amount. For example, 30 notepads for those carrying out surveys. General stationery can be included as administration costs in the overall project budget.
■ Remember, particularly for projects longer than a year, that costs might increase due to inflation and other price increases (e.g. fuel). To find a realistic cost if prices are fluctuating, either find an average rate of increase over the last two to three years or use the maximum price.
Project budget Donors will require a completed project budget. This is a summary of the detailed budget. Often donors will say what categories to include in the project budget. The template below includes all of the categories that are likely to need to be included.
To fill in each row, go back to the detailed budget tables and compile the information. For example, look through all the budget tables for transport costs, add up the costs and insert them into the relevant row of the project budget. Remember vehicle depreciation, tax and insurance in transport costs, as well as fuel and maintenance.
Make sure large costs are noted separately. For example, as staff costs tend to be expensive, list all the roles separately. Only budget for the time staff members will actually spend working on the project. For example, this might be only one quarter of their time. Ensure that the cost of social security and pension contributions are included where appropriate. Remember to include
Detailed budget template
ROOTS 5 PCM brand E.indd 62ROOTS 5 PCM brand E.indd 62 3/3/09 11:06:15 am3/3/09 11:06:15 am
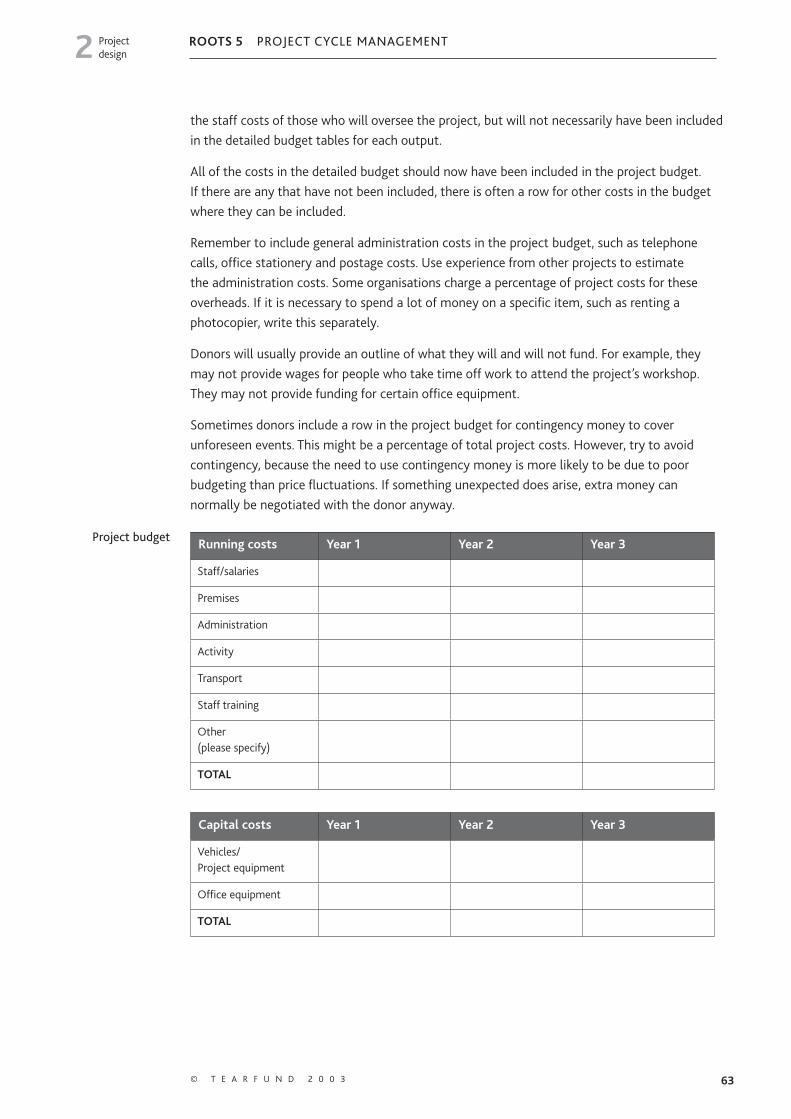
63© T E A R F U N D 2 0 0 3
ROOTS 5 PROJECT CYCLE MANAGEMENTProject design2
the staff costs of those who will oversee the project, but will not necessarily have been included in the detailed budget tables for each output.
All of the costs in the detailed budget should now have been included in the project budget. If there are any that have not been included, there is often a row for other costs in the budget where they can be included.
Remember to include general administration costs in the project budget, such as telephone calls, office stationery and postage costs. Use experience from other projects to estimate the administration costs. Some organisations charge a percentage of project costs for these overheads. If it is necessary to spend a lot of money on a specific item, such as renting a photocopier, write this separately.
Donors will usually provide an outline of what they will and will not fund. For example, they may not provide wages for people who take time off work to attend the project’s workshop. They may not provide funding for certain office equipment.
Sometimes donors include a row in the project budget for contingency money to cover unforeseen events. This might be a percentage of total project costs. However, try to avoid contingency, because the need to use contingency money is more likely to be due to poor budgeting than price fluctuations. If something unexpected does arise, extra money can normally be negotiated with the donor anyway.
Running costs Year 1 Year 2 Year 3
Staff/salaries
Premises
Administration
Activity
Transport
Staff training
Other(please specify)
TOTAL
Capital costs Year 1 Year 2 Year 3
Vehicles/Project equipment
Office equipment
TOTAL
Project budget
ROOTS 5 PCM brand E.indd 63ROOTS 5 PCM brand E.indd 63 3/3/09 11:06:15 am3/3/09 11:06:15 am
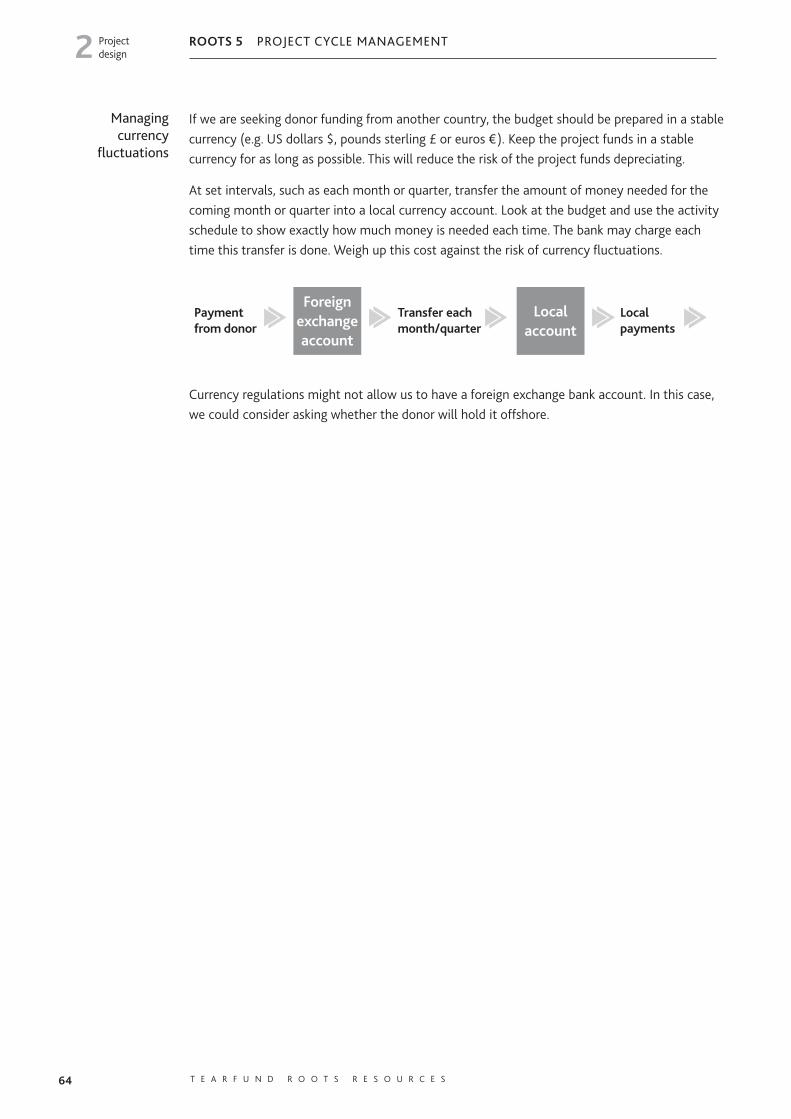
64 T E A R F U N D R O O T S R E S O U R C E S
ROOTS 5 PROJECT CYCLE MANAGEMENTProject design2
Managing currency
fluctuations
If we are seeking donor funding from another country, the budget should be prepared in a stable currency (e.g. US dollars $, pounds sterling £ or euros €). Keep the project funds in a stable currency for as long as possible. This will reduce the risk of the project funds depreciating.
At set intervals, such as each month or quarter, transfer the amount of money needed for the coming month or quarter into a local currency account. Look at the budget and use the activity schedule to show exactly how much money is needed each time. The bank may charge each time this transfer is done. Weigh up this cost against the risk of currency fluctuations.
Currency regulations might not allow us to have a foreign exchange bank account. In this case, we could consider asking whether the donor will hold it offshore.
Foreign exchange account
Local account
Payment from donor
Transfer each month/quarter
Local payments
ROOTS 5 PCM brand E.indd 64ROOTS 5 PCM brand E.indd 64 3/3/09 11:06:15 am3/3/09 11:06:15 am
ROOTS 5 PROJECT CYCLE MANAGEMENTSECTION
Implementation and evaluation
During the implementation phase, there are things we must do:
■ Update the stakeholder analysis to check that there are no new stakeholders who might influence project success or who should be invited to participate. Also, the circumstances of stakeholders identified at the beginning of the project may change. For example, some might have been pushed further into poverty and we might want to include them as primary beneficiaries. On the other hand, some secondary stakeholders might change their viewpoint and become a threat to the project.
■ Reassess the risks to the project.
■ Monitor and review the progress the project is making towards its objectives.
■ Feed the learning from monitoring and reviewing back into the project design.
■ Go back to the log frame and make adjustments or improvements where appropriate.
The indicators identified in the log frame show how we will know if change has occurred. Monitoring, reviewing and evaluation are the terms used for the process of measuring and analysing the indicators.
Why should we do monitoring, reviewing and
evaluation?
There are two main reasons for measuring our performance:
■ ACCOUNTABILITY We need to show those who give us resources and those who benefit from our work that we are using the resources wisely.
■ LESSON LEARNING By measuring, analysing and reflecting on our performance, we can learn lessons that will enable us to either change our project plans or change our approach to other projects.
65© T E A R F U N D 2 0 0 3
■ At the beginning of Nehemiah 4 we are told that some people were opposed to the project.
• What was Nehemiah’s response? (verse 9)
• How did Nehemiah change his plans in order to manage the risk to the project? (verses 9, 13, 16-22)
• What can we learn from Nehemiah’s experience for the projects we plan?
Responding to changes
3
ROOTS 5 PCM brand E.indd 65ROOTS 5 PCM brand E.indd 65 3/3/09 11:06:16 am3/3/09 11:06:16 am
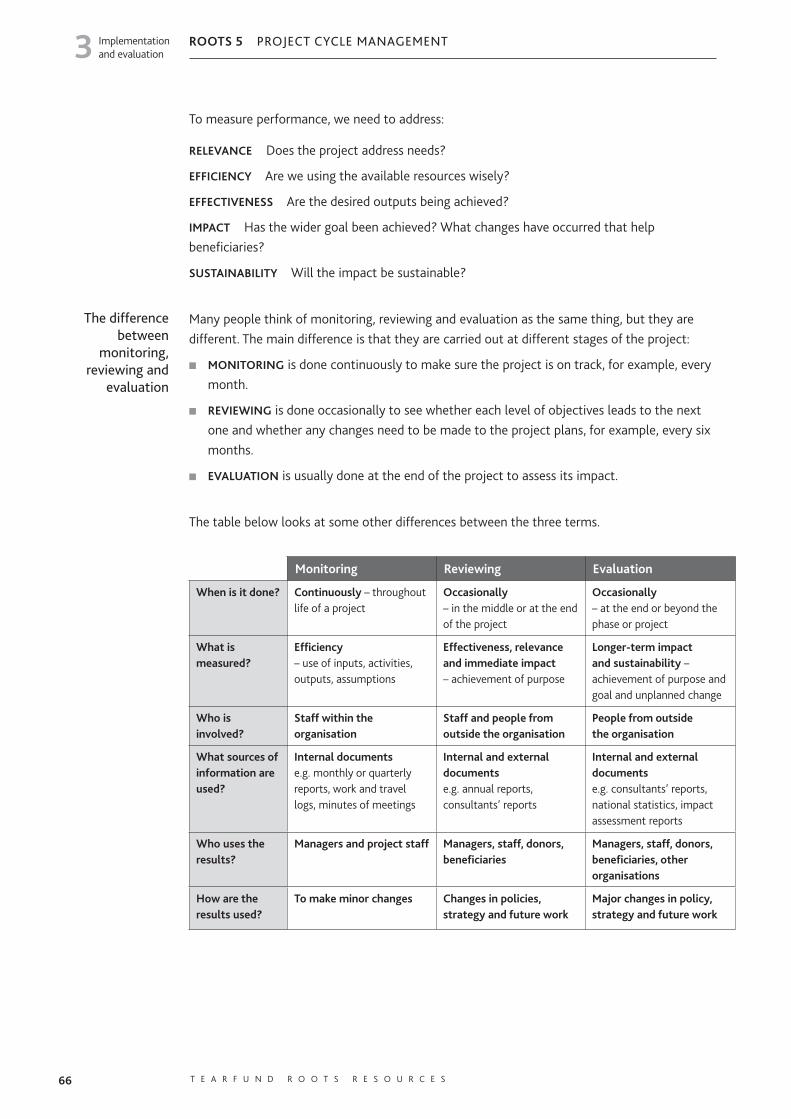
66 T E A R F U N D R O O T S R E S O U R C E S
ROOTS 5 PROJECT CYCLE MANAGEMENTImplemen tation and evaluation3
To measure performance, we need to address:
RELEVANCE Does the project address needs?
EFFICIENCY Are we using the available resources wisely?
EFFECTIVENESS Are the desired outputs being achieved?
IMPACT Has the wider goal been achieved? What changes have occurred that help beneficiaries?
SUSTAINABILITY Will the impact be sustainable?
The difference between
monitoring, reviewing and
evaluation
Many people think of monitoring, reviewing and evaluation as the same thing, but they are different. The main difference is that they are carried out at different stages of the project:
■ MONITORING is done continuously to make sure the project is on track, for example, every month.
■ REVIEWING is done occasionally to see whether each level of objectives leads to the next one and whether any changes need to be made to the project plans, for example, every six months.
■ EVALUATION is usually done at the end of the project to assess its impact.
The table below looks at some other differences between the three terms.
Monitoring Reviewing Evaluation
When is it done? Continuously – throughout life of a project
Occasionally – in the middle or at the end of the project
Occasionally – at the end or beyond the phase or project
What is measured?
Efficiency – use of inputs, activities, outputs, assumptions
Effectiveness, relevance and immediate impact – achievement of purpose
Longer-term impact and sustainability – achievement of purpose and goal and unplanned change
Who is involved?
Staff within the organisation
Staff and people from outside the organisation
People from outside the organisation
What sources of information are used?
Internal documents e.g. monthly or quarterly reports, work and travel logs, minutes of meetings
Internal and external documents e.g. annual reports, consultants’ reports
Internal and external documents e.g. consultants’ reports, national statistics, impact assessment reports
Who uses the results?
Managers and project staff Managers, staff, donors, beneficiaries
Managers, staff, donors, beneficiaries, other organisations
How are the results used?
To make minor changes Changes in policies, strategy and future work
Major changes in policy, strategy and future work
ROOTS 5 PCM brand E.indd 66ROOTS 5 PCM brand E.indd 66 3/3/09 11:06:16 am3/3/09 11:06:16 am
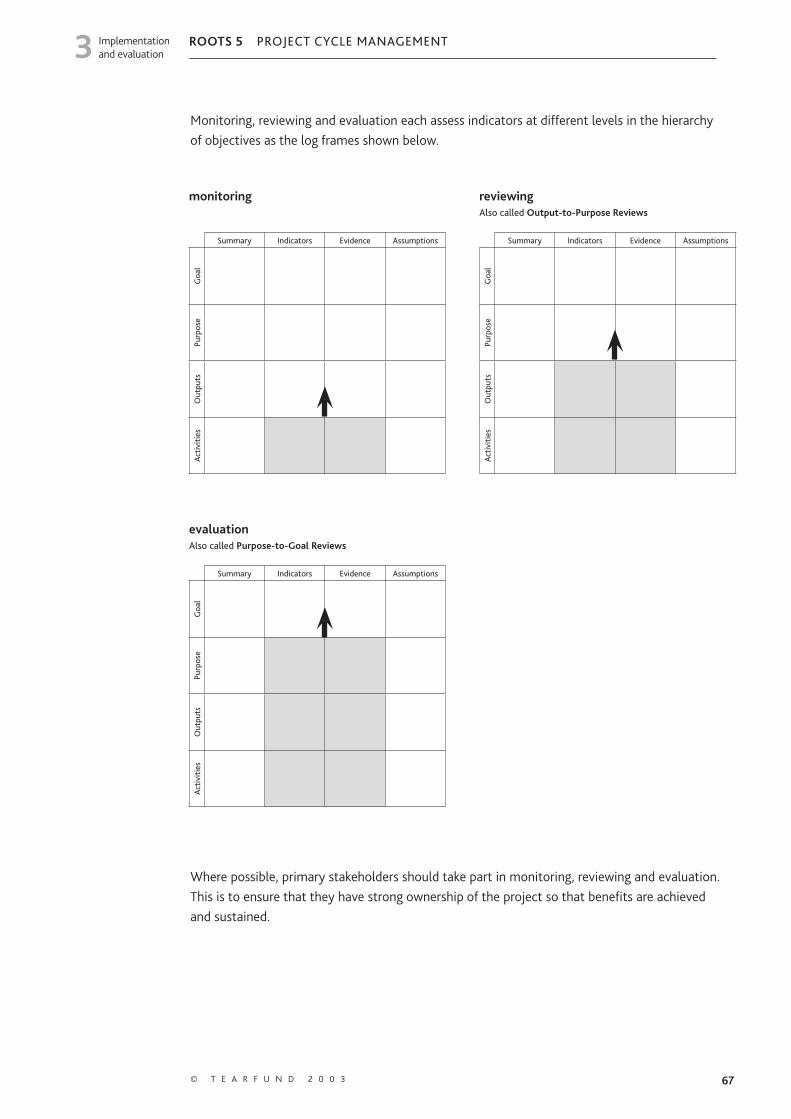
67© T E A R F U N D 2 0 0 3
ROOTS 5 PROJECT CYCLE MANAGEMENTImplemen tation and evaluation3
Monitoring, reviewing and evaluation each assess indicators at different levels in the hierarchy of objectives as the log frames shown below.
Where possible, primary stakeholders should take part in monitoring, reviewing and evaluation. This is to ensure that they have strong ownership of the project so that benefits are achieved and sustained.
reviewingAlso called Output-to-Purpose Reviews
Summary Indicators Evidence Assumptions
Goa
lPu
rpos
eO
utpu
tsAc
tiviti
es
monitoring
Summary Indicators Evidence Assumptions
Goa
lPu
rpos
eO
utpu
tsAc
tiviti
es
evaluationAlso called Purpose-to-Goal Reviews
Summary Indicators Evidence Assumptions
Goa
lPu
rpos
eO
utpu
tsAc
tiviti
es
ROOTS 5 PCM brand E.indd 67ROOTS 5 PCM brand E.indd 67 3/3/09 11:06:17 am3/3/09 11:06:17 am
68 T E A R F U N D R O O T S R E S O U R C E S
ROOTS 5 PROJECT CYCLE MANAGEMENTImplemen tation and evaluation3
By using indicators to measure progress, we will know whether or not we have achieved our objectives. However, what they will not automatically tell us is why the objectives have not been achieved. We will need to investigate this in order to learn lessons and be fully accountable to those funding and those benefiting from our work. Factors might be internal or external. Internal factors might include overlooking risks, identifying the wrong needs or misidentifying stakeholders. Community members are likely to be key in identifying reasons why objectives have not been fulfilled.
It is important to remember that God’s timing might be different from what we expect, and we may need to change our plans accordingly.
Monitoring and reviewing might show that, while the project is not on track materially, more people are going to church. On the other hand, it is important to be aware of spiritual attack which might stop us achieving our project objectives or which ensure that attitudes do not change. This might cause us to pray and refocus our plans.
Since using the log frame approach ensures that indicators are identified at the planning stage, monitoring, reviewing and evaluation should be straightforward. The format below enables us to document our performance as a summary. These summaries are to full monitoring, reviewing and evaluation reports, what log frames are to full proposals. Donors will usually provide reporting guidelines for the full reports.
To complete the summary
reports
■ Copy the summary and indicators from the log frame into the first two columns.
■ Report against each indicator in the progress column. Add any unplanned activities that have been carried out underneath.
■ Comment against each indicator and make recommendations where appropriate. Note unexpected outcomes in the comments and recommendations column and the extent to which the assumptions are being met.
■ In the ratings column, place a number to show whether, at the current time, the objective is likely to be achieved or not.
ROOTS 5 PCM brand E.indd 68ROOTS 5 PCM brand E.indd 68 3/3/09 11:06:17 am3/3/09 11:06:17 am

ROOTS 5 PROJECT CYCLE MANAGEMENTImplemen tation and evaluation3
Out
puts
69© T E A R F U N D 2 0 0 3
MO
NIT
ORI
NG
Su
mm
ary
Repo
rt
Act
ivit
ies
*RAT
ING
S 1
Like
ly to
be
achi
eved
2
Like
ly to
be
larg
ely
achi
eved
3
Like
ly to
be
part
ially
ach
ieve
d 4
Like
ly to
be
achi
eved
to a
ver
y lim
ited
exte
nt
5 U
nlik
ely
to b
e ac
hiev
ed
X T
oo e
arly
to ju
dge
the
exte
nt o
f ach
ieve
men
t
Proj
ect t
itle
Coun
try
Perio
d co
vere
d D
ate
prep
ared
Pr
epar
ed b
y
RATI
NG
*C
OM
MEN
TS A
ND
REC
OM
MEN
DAT
ION
SPR
OG
RESS
IND
ICAT
ORS
OF
AC
HIE
VEM
ENT
PRO
JEC
T ST
RUC
TURE
ROOTS 5 PCM brand E.indd 69ROOTS 5 PCM brand E.indd 69 3/3/09 11:06:17 am3/3/09 11:06:17 am
ROOTS 5 PROJECT CYCLE MANAGEMENTImplemen tation and evaluation3
70 T E A R F U N D R O O T S R E S O U R C E S
Purp
ose
REV
IEW
ING
Su
mm
ary
Repo
rt
Out
puts
*RAT
ING
S 1
Like
ly to
be
achi
eved
2
Like
ly to
be
larg
ely
achi
eved
3
Like
ly to
be
part
ially
ach
ieve
d 4
Like
ly to
be
achi
eved
to a
ver
y lim
ited
exte
nt
5 U
nlik
ely
to b
e ac
hiev
ed
X T
oo e
arly
to ju
dge
the
exte
nt o
f ach
ieve
men
t
Proj
ect t
itle
Coun
try
Perio
d co
vere
d D
ate
prep
ared
Pr
epar
ed b
y
RATI
NG
*C
OM
MEN
TS A
ND
REC
OM
MEN
DAT
ION
SPR
OG
RESS
IND
ICAT
ORS
OF
AC
HIE
VEM
ENT
PRO
JEC
T ST
RUC
TURE
ROOTS 5 PCM brand E.indd 70ROOTS 5 PCM brand E.indd 70 3/3/09 11:06:18 am3/3/09 11:06:18 am
ROOTS 5 PROJECT CYCLE MANAGEMENTImplemen tation and evaluation3
71© T E A R F U N D 2 0 0 3
Goa
l
EVA
LUAT
ION
Su
mm
ary
Repo
rt
Purp
ose
*RAT
ING
S 1
Like
ly to
be
achi
eved
2
Like
ly to
be
larg
ely
achi
eved
3
Like
ly to
be
part
ially
ach
ieve
d 4
Like
ly to
be
achi
eved
to a
ver
y lim
ited
exte
nt
5 U
nlik
ely
to b
e ac
hiev
ed
X T
oo e
arly
to ju
dge
the
exte
nt o
f ach
ieve
men
t
Proj
ect t
itle
Coun
try
Perio
d co
vere
d D
ate
prep
ared
Pr
epar
ed b
y
RATI
NG
*C
OM
MEN
TS A
ND
REC
OM
MEN
DAT
ION
SPR
OG
RESS
IND
ICAT
ORS
OF
AC
HIE
VEM
ENT
PRO
JEC
T ST
RUC
TURE
ROOTS 5 PCM brand E.indd 71ROOTS 5 PCM brand E.indd 71 3/3/09 11:06:18 am3/3/09 11:06:18 am

72 T E A R F U N D R O O T S R E S O U R C E S
ROOTS 5 PROJECT CYCLE MANAGEMENTImplemen tation and evaluation3
Financial reporting Report on project spending at set intervals, usually alongside monitoring, reviewing and evaluation reports. Below is a template for doing this.
Description Budget Actual spending Variance
■ In the Description column, insert the labels from the project budget, such as administration costs and transport costs.
■ Next to each description, insert the budget in the Budget column.
■ In the Actual Spending column, insert how much money has actually been spent.
■ The variance is the difference between the Budget and Actual Spending, expressed as a percentage. To calculate the variance, use the sum below:
The variance can be positive or negative. If the variance is high – for example, above plus or minus 15% – explain why. If the variance is positive, say ‘We have not spent the budget because …’ If the variance is negative, say ‘We have overspent because …’
(Budget – Actual)
BudgetVariance = x 100
ROOTS 5 PCM brand E.indd 72ROOTS 5 PCM brand E.indd 72 3/3/09 11:06:18 am3/3/09 11:06:18 am
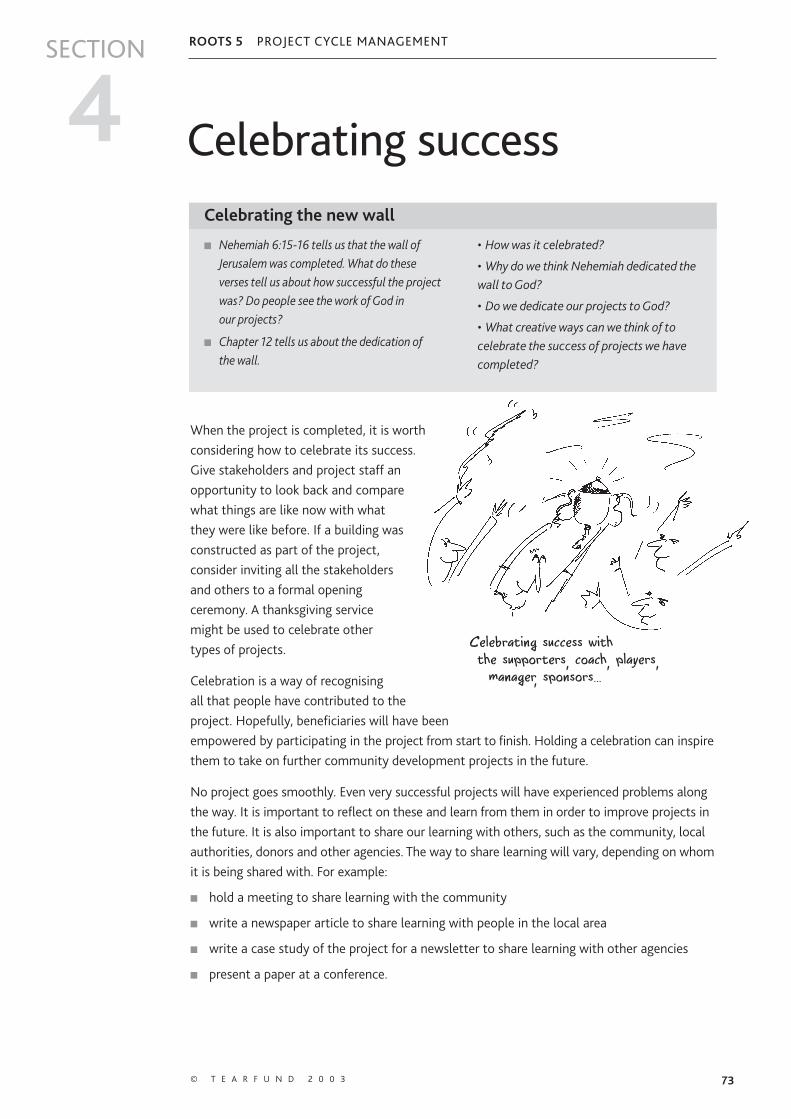
ROOTS 5 PROJECT CYCLE MANAGEMENTSECTION
73© T E A R F U N D 2 0 0 3
Celebrating success
When the project is completed, it is worth considering how to celebrate its success. Give stakeholders and project staff an opportunity to look back and compare what things are like now with what they were like before. If a building was constructed as part of the project, consider inviting all the stakeholders and others to a formal opening ceremony. A thanksgiving service might be used to celebrate other types of projects.
Celebration is a way of recognising all that people have contributed to the project. Hopefully, beneficiaries will have been empowered by participating in the project from start to finish. Holding a celebration can inspire them to take on further community development projects in the future.
No project goes smoothly. Even very successful projects will have experienced problems along the way. It is important to reflect on these and learn from them in order to improve projects in the future. It is also important to share our learning with others, such as the community, local authorities, donors and other agencies. The way to share learning will vary, depending on whom it is being shared with. For example:
■ hold a meeting to share learning with the community
■ write a newspaper article to share learning with people in the local area
■ write a case study of the project for a newsletter to share learning with other agencies
■ present a paper at a conference.
■ Nehemiah 6:15-16 tells us that the wall of Jerusalem was completed. What do these verses tell us about how successful the project was? Do people see the work of God in our projects?
■ Chapter 12 tells us about the dedication of the wall.
• How was it celebrated?
• Why do we think Nehemiah dedicated the wall to God?
• Do we dedicate our projects to God?
• What creative ways can we think of to celebrate the success of projects we have completed?
Celebrating the new wall
4
Celebrating success with the supporters, coach, players,
manager, sponsors…
ROOTS 5 PCM brand E.indd 73ROOTS 5 PCM brand E.indd 73 3/3/09 11:06:19 am3/3/09 11:06:19 am

ROOTS 5 PROJECT CYCLE MANAGEMENT
74
ROOTS 5 PCM brand E.indd 74ROOTS 5 PCM brand E.indd 74 3/3/09 11:06:19 am3/3/09 11:06:19 am
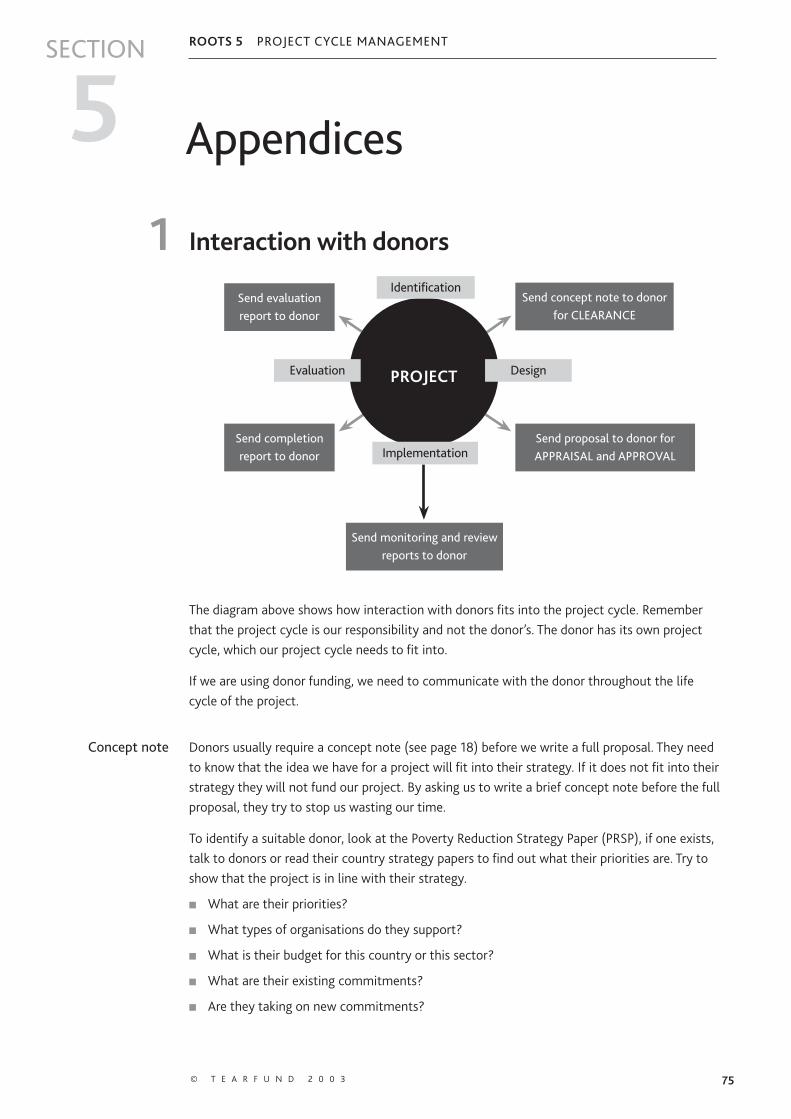
ROOTS 5 PROJECT CYCLE MANAGEMENTSECTION
75© T E A R F U N D 2 0 0 3
Appendices
1 Interaction with donors
The diagram above shows how interaction with donors fits into the project cycle. Remember that the project cycle is our responsibility and not the donor’s. The donor has its own project cycle, which our project cycle needs to fit into.
If we are using donor funding, we need to communicate with the donor throughout the life cycle of the project.
Concept note Donors usually require a concept note (see page 18) before we write a full proposal. They need to know that the idea we have for a project will fit into their strategy. If it does not fit into their strategy they will not fund our project. By asking us to write a brief concept note before the full proposal, they try to stop us wasting our time.
To identify a suitable donor, look at the Poverty Reduction Strategy Paper (PRSP), if one exists, talk to donors or read their country strategy papers to find out what their priorities are. Try to show that the project is in line with their strategy.
■ What are their priorities?
■ What types of organisations do they support?
■ What is their budget for this country or this sector?
■ What are their existing commitments?
■ Are they taking on new commitments?
Send concept note to donor
for CLEARANCE
Send proposal to donor for APPRAISAL and APPROVAL
Send completion report to donor
Send evaluation report to donor
Send monitoring and review reports to donor
Implementation
Design
Identification
Evaluation PROJECT
5
ROOTS 5 PCM brand E.indd 75ROOTS 5 PCM brand E.indd 75 3/3/09 11:06:20 am3/3/09 11:06:20 am

76 T E A R F U N D R O O T S R E S O U R C E S
ROOTS 5 PROJECT CYCLE MANAGEMENTAppendices5
Donors usually produce guidelines to outline what information the concept note should include. Generally, concept notes should include a brief introduction to the organi-sation and an outline of who will benefit from the project and how. Give an estimate of the total budget. Ask the donor if there are any queries about the concept note. Make sure all the information they ask for is included. After the concept note has been submitted they might get in contact for clarification if necessary.
Proposal Donors will always require a full proposal if they like the concept note. They usually provide guidelines to outline what information they need. Standard requirements include identification of bene ficiaries, problem analysis, objectives, risk assessment, monitoring and evaluation and sustainability. All proposals must be accompanied by a detailed budget. Most large donors will require a log frame with the proposal. Others might require a log frame if large sums of money are being asked for.
Once the proposal has been sent to the donor, they will appraise it to decide whether they are willing and able to fund the project. There might be quite a lot of interaction with them at this stage if they want clarification or changes. Hopefully they will decide to approve the project.
Reporting Throughout the implementation phase of the project, report progress to the donor. During the design phase and through communication with the donor, establish how often they require reports. For example, they may require monitoring reports every six months, review reports every year and a completion report at the end of the project.
Evaluation Sometimes the donor will fund an evaluation after the project has been completed. This is usually carried out by independent consultants.
ROOTS 5 PCM brand E.indd 76ROOTS 5 PCM brand E.indd 76 3/3/09 11:06:20 am3/3/09 11:06:20 am
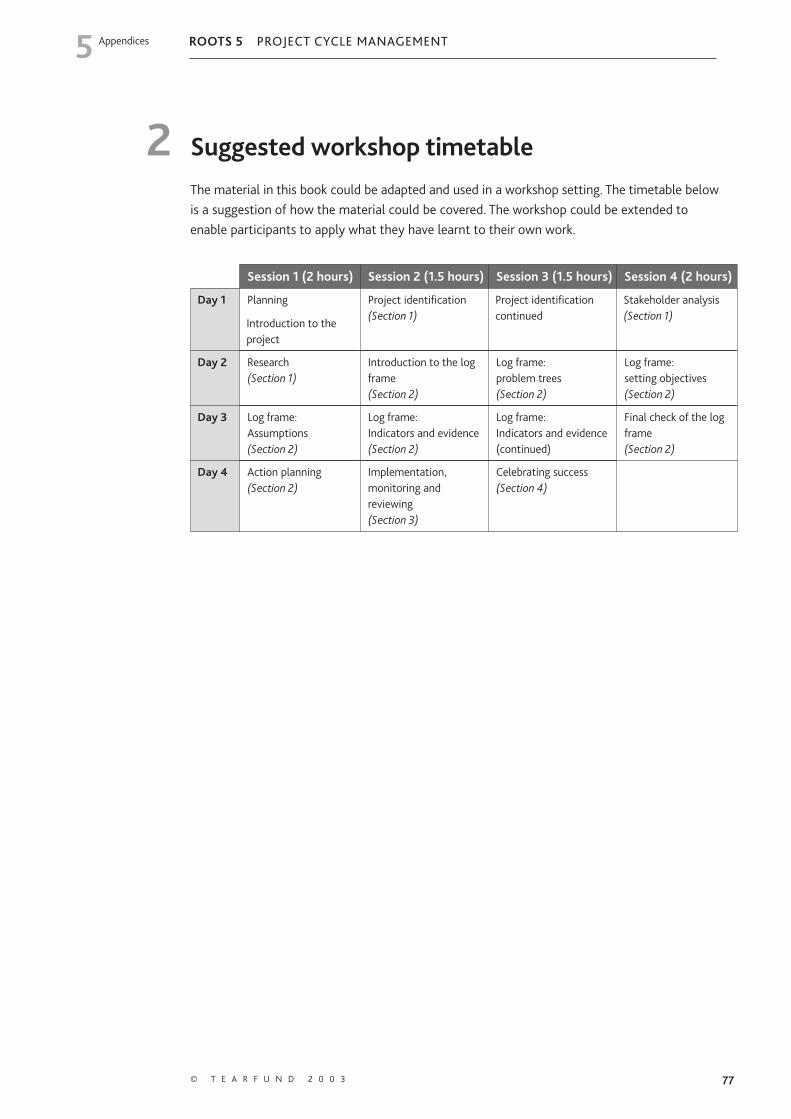
77© T E A R F U N D 2 0 0 3
ROOTS 5 PROJECT CYCLE MANAGEMENTAppendices5
2 Suggested workshop timetableThe material in this book could be adapted and used in a workshop setting. The timetable below is a suggestion of how the material could be covered. The workshop could be extended to enable participants to apply what they have learnt to their own work.
Session 1 (2 hours) Session 2 (1.5 hours) Session 3 (1.5 hours) Session 4 (2 hours)
Day 1 Planning
Introduction to the project
Project identification (Section 1)
Project identification continued
Stakeholder analysis (Section 1)
Day 2 Research (Section 1)
Introduction to the log frame (Section 2)
Log frame: problem trees (Section 2)
Log frame:setting objectives (Section 2)
Day 3 Log frame: Assumptions(Section 2)
Log frame:Indicators and evidence(Section 2)
Log frame:Indicators and evidence(continued)
Final check of the log frame(Section 2)
Day 4 Action planning(Section 2)
Implementation, monitoring and reviewing(Section 3)
Celebrating success(Section 4)
ROOTS 5 PCM brand E.indd 77ROOTS 5 PCM brand E.indd 77 3/3/09 11:06:20 am3/3/09 11:06:20 am

ROOTS 5 PROJECT CYCLE MANAGEMENT
78
Notes
T E A R F U N D R O O T S R E S O U R C E S
ROOTS 5 PCM brand E.indd 78ROOTS 5 PCM brand E.indd 78 3/3/09 11:06:21 am3/3/09 11:06:21 am

ROOTS 5 PROJECT CYCLE MANAGEMENT
79
Notes
© T E A R F U N D 2 0 0 3
ROOTS 5 PCM brand E.indd 79ROOTS 5 PCM brand E.indd 79 3/3/09 11:06:21 am3/3/09 11:06:21 am

ROOTS 5 PROJECT CYCLE MANAGEMENT
80
Notes
T E A R F U N D R O O T S R E S O U R C E S
ROOTS 5 PCM brand E.indd 80ROOTS 5 PCM brand E.indd 80 3/3/09 11:06:21 am3/3/09 11:06:21 am

Project cycle management
By Rachel Blackman
ISBN 978 1 904364 21 7
Published by Tearfund
100 Church Road, Teddington, TW11 8QE, UK
19241 – (0209)
E
ROOTS 5 PCM brand E.indd BC2ROOTS 5 PCM brand E.indd BC2 3/3/09 11:06:21 am3/3/09 11:06:21 am