Project Core Team National Househol… · 1 Project Core Team Secretary Vicente C. Sotto III...
126
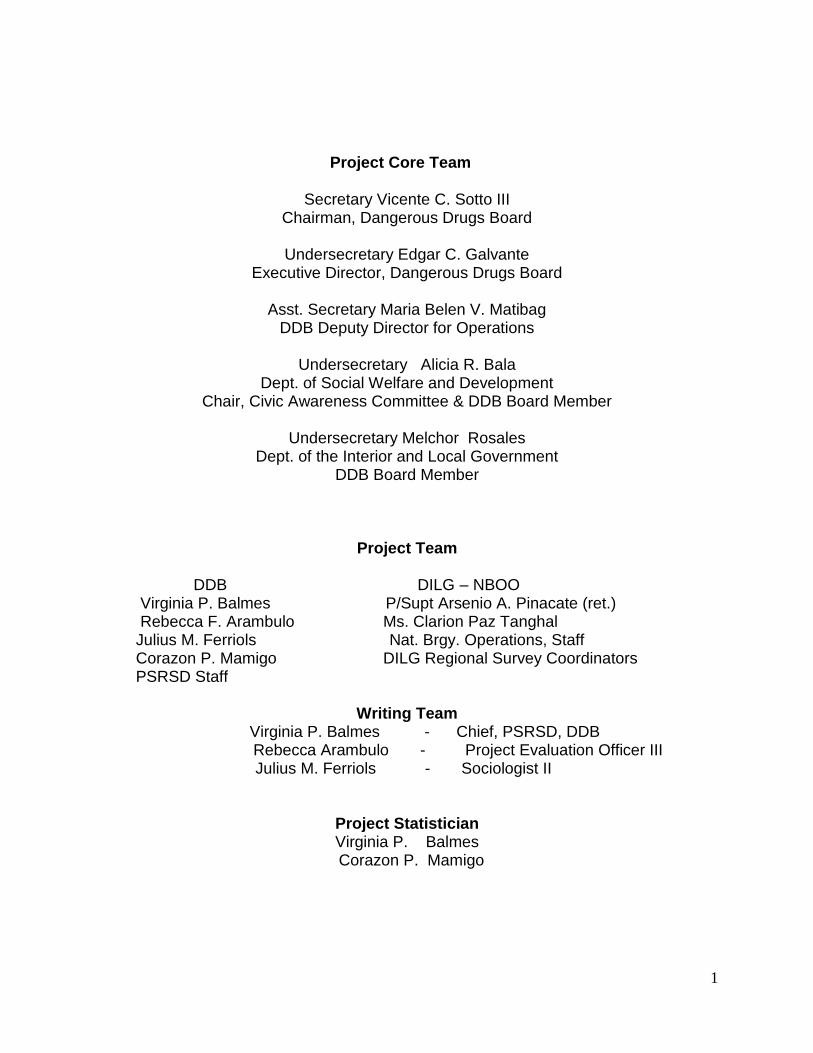
1 Project Core Team Secretary Vicente C. Sotto III Chairman, Dangerous Drugs Board Undersecretary Edgar C. Galvante Executive Director, Dangerous Drugs Board Asst. Secretary Maria Belen V. Matibag DDB Deputy Director for Operations Undersecretary Alicia R. Bala Dept. of Social Welfare and Development Chair, Civic Awareness Committee & DDB Board Member Undersecretary Melchor Rosales Dept. of the Interior and Local Government DDB Board Member Project Team DDB DILG – NBOO Virginia P. Balmes P/Supt Arsenio A. Pinacate (ret.) Rebecca F. Arambulo Ms. Clarion Paz Tanghal Julius M. Ferriols Nat. Brgy. Operations, Staff Corazon P. Mamigo DILG Regional Survey Coordinators PSRSD Staff Writing Team Virginia P. Balmes - Chief, PSRSD, DDB Rebecca Arambulo - Project Evaluation Officer III Julius M. Ferriols - Sociologist II Project Statistician Virginia P. Balmes Corazon P. Mamigo
Transcript of Project Core Team National Househol… · 1 Project Core Team Secretary Vicente C. Sotto III...
1
Project Core Team
Secretary Vicente C. Sotto III Chairman, Dangerous Drugs Board
Undersecretary Edgar C. Galvante
Executive Director, Dangerous Drugs Board
Asst. Secretary Maria Belen V. Matibag DDB Deputy Director for Operations
Undersecretary Alicia R. Bala
Dept. of Social Welfare and Development Chair, Civic Awareness Committee & DDB Board Member
Undersecretary Melchor Rosales
Dept. of the Interior and Local Government DDB Board Member
Project Team
DDB DILG – NBOO Virginia P. Balmes P/Supt Arsenio A. Pinacate (ret.) Rebecca F. Arambulo Ms. Clarion Paz Tanghal Julius M. Ferriols Nat. Brgy. Operations, Staff Corazon P. Mamigo DILG Regional Survey Coordinators PSRSD Staff
Writing Team
Virginia P. Balmes - Chief, PSRSD, DDB Rebecca Arambulo - Project Evaluation Officer III
Julius M. Ferriols - Sociologist II
Project Statistician Virginia P. Balmes
Corazon P. Mamigo
2
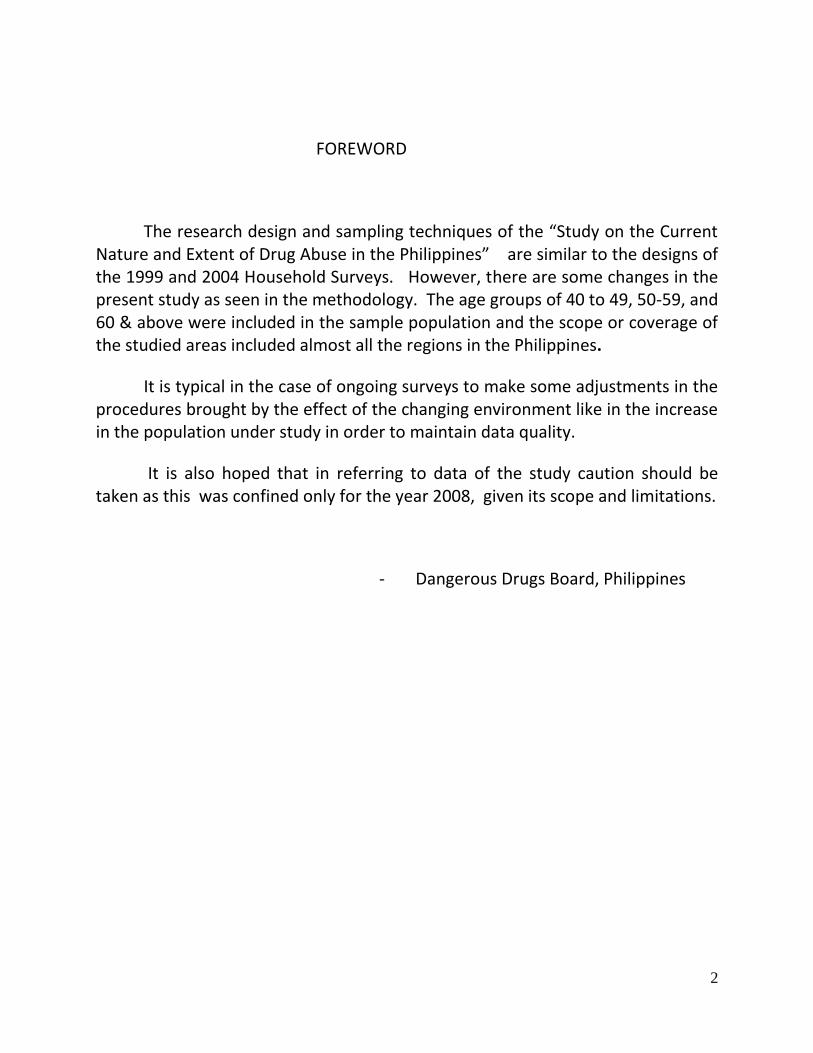
FOREWORD
The research design and sampling techniques of the “Study on the Current Nature and Extent of Drug Abuse in the Philippines” are similar to the designs of the 1999 and 2004 Household Surveys. However, there are some changes in the present study as seen in the methodology. The age groups of 40 to 49, 50-59, and 60 & above were included in the sample population and the scope or coverage of the studied areas included almost all the regions in the Philippines.
It is typical in the case of ongoing surveys to make some adjustments in the procedures brought by the effect of the changing environment like in the increase in the population under study in order to maintain data quality.
It is also hoped that in referring to data of the study caution should be taken as this was confined only for the year 2008, given its scope and limitations.
- Dangerous Drugs Board, Philippines
3
Table of Contents
Executive Summary……..………………………………………………………………………………..1 Brief Description...………………………………………………………………………………...1 Objectives of the Study.…………………………………………………………………………..1 Methodology…………….…………………………………………………………………………2 Data Gathering Procedure….……………………………………………………………………3 The Findings……………………………………………………………………………………….4 Implications and Recommendations…….……………………………………………………...7 Introduction………………………………………………………………………………………………..9 The Government Response……………………………………………………………………..9
Statement of the Problem………………………………………………………………………10 Significance of the Study……………… ……………………………………………………….11 Limitation of the Study…………………… …………………………………………………….11
Methods and Procedures………………………………………………………………………………12 Research Design………………………………………………………………………………..12 Sampling Technique…………………………………………………………………………….12 Scope of the Study Areas………………………………………………………………………13 The Sample……………………………………………………………………………………...13 Distribution of Respondents……………………………………………………………………14
The Profile of Respondents…………………………………………………………………….16 The Instrument Used………………………......................................................................19 Mode of Data Gathering.……………………………………………………………………….20 The Data Gathering Procedure………………………………………………………………..20 Treatment of Data……………………………………………………………………………….21 Definition of Terms………………………………………………………………………………21
Results and Discussions………………………………………………………………………………23 Those Who Have Tried Using Drugs………………………………………………………………..….24
Profile of Those Who Have Tried Using Drugs………………………………………………24 National Characteristics………………………………………………………………………...24 Profile of Respondents Who Have Tried Using Drugs Across Region by Variables…….24 Across Region by Age Group…………………………………………………….……………26 Across Region by Gender……………………………………………………….……………..28 Across Region by Civil Status………………………………………………………….………28 Across Region by Highest Educational Attainment………………………………………….29 Across Region by Classification…………………………………………………………….…31
Current Users ………………………………………………………………... …………………………34 National Findings of Current Drug User Respondents………………………………………………..35 Salient Characteristics of Current Drug User-Respondents………………………………..35
Findings on Current User Respondents Drug Usage……………………………………….37 Commonly Abused Drugs………………………………………………………………………37 Age Group and Type of Drugs Abused……………………………………………………….38 Gender and Type of Drugs Abuse…………………………………………………………….39 Highest Educational Attainment and Type of Drugs Abused……………………………….39 Civil Status and Type of Drugs Abuse………………………………………………………...41 Classification and Type of Drugs Abused…………………………………………………… 42 Frequency of Drug and Substance Abuse……………………………………………………43 Route/Mode of Use …………………………………………………………………………… 44 Sources of Drugs……………………………………………………………………………......44
4
Amount Spent per Drug Intake………………………………………………………..............45 Regional Findings of Current Users Across Variables………………………………………………..45 Significant Regional Findings of Current User Respondents……………………………… 45 Current Users Across Region and Province by Gender…………………………………….46 Regional Findings on Type of Drugs Abuse……………………………………………………………50 Commonly Abused Drugs Across Region…………………………………………………….50 Drug of Abuse by Age Group and Gender Across Region………………………………….51 Type of Drug Abused by Highest Educational Attainment Across Region………………..53 Frequency of Drug Usage Across Region……………………………………………………55 Source of Drugs Across Region……………………………………………………………….60 Route of Use Across Region…………………………………………………………………...61 Those Who Stopped Using…………………………………………………………………………… 65 Those Who Stopped Using Drugs……………………………………………………………..66 Those Who Have Stopped by Classification………………………………………………... 67 Reasons for First Use, Continued Use, Stopping Drug Use, and for Not Using Drugs....... 70 Reasons for First Use…………………………………………………………………………..71 Reasons for Continued Abuse of Drugs…………………………………………………….. 71 Reasons for Stopping Drug Use……………………………………………………………… 72 Reasons for Not Using Dangerous Drugs…………………………………………………… 73 Drug Awareness and Level of Awareness………………………………………………………….74 Awareness on Drug Abuse Problem…………………………………………………………………... 75 Respondents‟ Awareness on Drug Abuse Problem at the Barangay, City/ Municipality and Country Levels……………………………………………………..76 By Age Group……………………………………………………………………………………76 By Gender………………………………………………………………………………………..76 By Civil Status……………………………………………………………………………………76 By Highest Educational Attainment……………………………………………………………77 By Classification…………………………………………………………………………………77 Awareness of Drug Problem at the Barangay, City/Municipality and Country Levels by
Region…………………………………………………………………………………..77 Respondents‟ Level of Awareness of the Drug Problem in the Barangay,
City/Municipality and Country………………………………………………………...79 By Region………………………………………………………………………………………...79 By Age Group……………………………………………………………………………………80 By Gender………………………………………………………………………………………..81 By Civil Status……………………………………………………………………………………81 By Highest Educational Attainment……………………………………………………………82 By Classification…………………………………………………………………………………83 Respondents‟ Awareness on the Presence of Drug Users in the Barangay by
Region Across Variables……………………………………………………………...85 By Age Group…………………………………………………………………………………....86 By Gender………………………………………………………………………………………..86 By Civil Status……………………………………………………………………………………86 By Highest Educational Attainment……………………………………………………………87 By Classification…………………………………………………………………………………88 Respondents‟ Awareness on the Presence of Drug Pushers in the Barangay by Region by Variables…………………………………………………………………...89 By Age Group……………………………………………………………………………………89 By Gender………………………………………………………………………………………..90 By Civil Status……………………………………………………………………………………90 By Highest Educational Attainment……………………………………………………………91 By Classification…………………………………………………………………………………91 Respondents‟ Awareness on the Presence of Clandestine Drug Laboratories in the
5
Barangay by Region…………………………………………………………………..93 By Age Group……………………………………………………………………………………93 By Gender……………………………………………………………………………………......94 By Civil Status……………………………………………………………………………………94 By Highest Educational Attainment……………………………………………………………95 By Classification…………………………………………………………………………………96 Respondents‟ Awareness on the Presence of Injecting Drug Users in the Barangay By Region………………………………………………………………………………97 By Age Group……………………………………………………………………………………97 By Gender………………………………………………………………………………………..97 By Civil Status……………………………………………………………………………………98 By Highest Educational Attainment……………………………………………………………99 By Classification……………………………………………………………………………......100 Perception on the Number of Users, Pushers, Clandestine Laboratories and Injecting
Drug Users in the Barangay………………………………………………………….101 Respondents‟ Awareness of Drug Prevention Programs Implemented in the
Barangay………………………………………………………………………………..101 By Age Group…………………………………………………………………………………….101 By Gender………………………………………………………………………………………...102 By Civil Status…………………………………………………………………………………...103 By Highest Educational Attainment………………………………………………………….103 By Classification………………………………………………………………………………..104 By Region……………………………………………………………………………………….106 Respondents‟ Awareness on Drug Abuse Programs Implemented in the Barangay
by Region and Gender………………………………………………………………107 Respondents‟ Awareness on Drug Abuse Programs Implemented in the Barangay By Region and Age Group…………………………………………………………..107 Respondents‟ Awareness on Drug Abuse Programs Implemented in the Barangay By Region and Highest Educational Attainment………………………………….107 Respondents‟ Awareness on Drug Abuse Programs Implemented in the Barangay By Region and Civil Status………………………………………………………….108 Respondents‟ Awareness on Drug Abuse Programs Implemented in the Barangay By Region and Classification………………………………………………………..108 Programs Being Implemented in the Barangay…………………………………………….109
Agencies Implementing the Drug Abuse Prevention Programs and Projects in the Barangay………………………………………………………………………………110
Respondents‟ Comments and Recommendations to Address the Drug Problem……...111
National Estimates……………………………………………………………………………………..112 National Estimate of Those Who Tried Drugs and Current Drug Users………………..…………113 Those Who have tried Drugs…………………………………………………………………113 Current Drug Users……………………………………………………………………………114 Implications and Recommendations…………...…………………………………………………..115
6
Tables: Table 1 Distribution of Respondents by Region…………………………..………………………......15 Table 2 Distribution of Respondents across Variable……………………….………………………..17 Table 3 Distribution of Respondents by Classification ……..………………………………………..18 Table 4 National Characteristics of Those Who Have Tried Drugs.............................…………....25 Table 5 Classification of Those Who Have Tried Drugs ……………………………………………..26 Table 6 Distribution of Respondents Who Have Tried Using Drugs across Region by Age Group……………………………………………………………………………………………..27 Table 7 Respondents Who have Tried across Region by Gender ……………………………..…..28 Table 8 Respondents Who Have Tried Using Drugs across Region by Civil Status………….…..29 Table 9 Distribution of Respondents Who Have Tried Using Drugs across Region by
Educational Attainment………………………………………………………..………………..30
Table 10 Distribution of Respondents Who Have Tried Using Drugs across Region by Classification……………………………………………………………………………………..31
Table 11 Profile of Current User Respondents…………………………..……………………………36 Table 12 Distribution of Current Users by Type of Drugs Abuse……………….……………………38 Table 13 Distribution of Current Users by Age Group and Type of Drug …..………………………38 Table 14 Distribution of Current Users by Gender and Type of Drugs Abused ………...…………39 Table 15 Distribution of Current Users According to Highest Educational Attainment
and Type of Drugs Abused …………….………………………………………………………40 Table 16 Distribution of Current Users by Civil Status and Type of Drugs Abused ………………41 Table 17 Distribution of Current Drug Users According to Classification and Type of Drugs
Abused……………………………………………………………………………………………42 Table 18 Distribution of Current User Respondents according to Type of Drugs Used and
Frequency of Use...........................……………………………………………………………43 Table 19 Distribution of Current User Respondents according to Type of Drugs Used and
Mode of Use ……………………….……………………………………………………………44 Table 20 Distribution of Current User Respondents by Sources of Drugs……….…………………44 Table 21 Current User Respondents‟ Minimum, Average and Maximum Amount
Spent per Drug Intake by Drug Type …………………………………………………………45 Table 22 Distribution of Current Users by Region ……………………………………………………46
7
Table 23 Distribution of Current Drug User Respondents across Region/Province
and City/Municipality by Gender ………………………………………………………………47 Table 24 Distribution of Current Users according to Drugs of Abuse by Region ……,,,,…………51 Table 25 Distribution of Current Drug User Respondents according to Age Group and
Gender across Region by Type of Drugs Abuse…………………….………………………52 Table 26 Distribution of Current Drug User Respondents according to Highest
Educational Attainment and Gender across Region by Type of Drugs Abuse ………..…54 Table 27 Distribution of Current Drug User Respondents according to Frequency of Use and
Gender by Type of Drugs and Region ……………………………..…………………………56 Table 28 Distribution of Current Drug User Respondents by Sources of Drugs and Region ……60 Table 29 Distribution of Current Drug User Respondents according to Type of Drugs Used by
Region, Mode of Use and Gender……………….……………………………………………61 Table 30 Profile of Those Who Stopped Using Drugs..………………………………………………66 Table 31 Distribution of Respondents of Those Who Stopped Using Drugs according to
Classification by Region……………………………..…………………………………………68 Table 32 Reasons for Trying Drugs the First Time….………………………………………………...71 Table 33 Reasons for Continued Use…………….………..………………………………………..…72 Table 34 Reason for Stopping Drug Use……………......................…………………………………72 Table 35 Reason for Not Using Drugs …………………….………………………………………...…73 Table 36 Respondents Level of Awareness of the Drug Problem in the Barangay,
City/Municipality and in the Country ................………………………………………………75 Table 37 Level of Awareness on Drug Abuse Problem at the
Barangay/City/Municipality/Country Level by Region ………………………………………78 Table 38 Level of Awareness on the Drug Abuse Problem at the
Barangay/City/Municipality/Country Level by Age Group ……….…………………………80 Table 39 Level of Awareness on the Drug Abuse Problem at the
Barangay/City/Municipality/Country Level by Gender ………………………………………81 Table 40 Level of Awareness on Drug Abuse Problem at the
Barangay/City/Municipality/Country Level by Civil Status……………..……………………82 Table 41 Level of Awareness on the Drug Abuse Problem at the
Barangay/City/Municipality/Country Level by Highest Educational Attainment ……….…83
Table 42 Level of Awareness on Drug Abuse Problem at the Barangay/City/Municipality/Country Level by Classification ….……………………………84
Table 43 Respondents‟ Awareness on the Presence of Drug Users in the Barangay……….……85
8
Table 44 Respondents‟ Awareness on Presence of Drug Users in the Barangay by Age Group….………………………………………………………………………………………….86
Table 45 Respondents‟ Awareness on Presence of Drug Users in the Barangay by Gender.......86 Table 46 Respondents‟ Awareness on Presence of Drug Users in the Barangay by Civil
Status…………………………………..…………………………………………………………87 Table 47 Respondents‟ Awareness on Presence of Drug Users in the Barangay by Highest
Educational Attainment ……………...…………………………………………………………87 Table 48 Respondents‟ Awareness on Presence of Drug Users in the Barangay by
Classification ………………………………………………………………………………….…88
Table 49 Respondents‟ Awareness on Presence of Drug Pushers in the Barangay by Region……………………………………………………………………………………….……89
Table 50 Respondents‟ Awareness on Presence of Drug Pushers in the Barangay by
Gender ...…………………………………………………………………………………………90 Table 51 Respondents‟ Awareness on Presence of Drug Pushers in the Barangay by
Civil Status ………………………………………………………………………………………90
Table 52 Respondents‟ Awareness on Presence of Drug Pushers in the Barangay by Highest Educational Attainment ………………………………………………………………91
Table 53 Respondents‟ Awareness on Presence of Drug Pushers in the Barangay by Classification…………………………………………………………………………………..…92
Table 54 Respondents‟ Awareness on Presence of Clandestine Drug Laboratories in the Barangay by Region ……………………………………………………………………………93
Table 55 Respondents‟ Awareness on Presence of Clandestine Drug Laboratories in the
Barangay by Age Group…………………………………..…………………………………... 94 Table 56 Respondents‟ Awareness on Presence of Clandestine Drug Laboratories in the
Barangay by Gender…………………………………………………………………………… 94 Table 57 Respondents‟ Awareness on Presence of Clandestine Drug Laboratories in the
Barangay by Civil Status……………………..………………………………………………… 95 Table 58 Respondents‟ Awareness on Presence of Clandestine Drug Laboratories in the
Barangay by Highest Educational Attainment ….…………………………………………… 95 Table 59 Respondents‟ Awareness on Presence of Clandestine Drug Laboratories in the
Barangay by Classification …………………………….……………………………………… 96 Table 60 Respondents‟ Awareness on Presence of Injecting Drug Users in the Barangay by
Region ……………………………………………………………………………………………97 Table 61 Respondents‟ Awareness on Presence of Injecting Drug Users in the Barangay by
Age Group…………..……………………………………………………………………………98 Table 62 Respondents‟ Awareness on Presence of Injecting Drug Users in the Barangay by
Gender ……………………………...……………………………………………………………98 Table 63 Respondents‟ Awareness on Presence of Injecting Drug Users in the Barangay by
9
Civil Status…………...……………..…………………………………………………………… 99 Table 64 Respondents‟ Awareness on Presence of Injecting Drug Users in the Barangay by
Highest Educational Attainment …………………………………………………………… …99 Table 65 Respondents‟ Awareness on Presence of Injecting Drug Users in the Barangay by
Classification………………………………………………………………………………… …100 Table 66 Respondents‟ Awareness of the Number of Drug Users, Pushers, Clandestine
Laboratories and Injecting Drug Users in the Barangay ……………………………………101 Table 67 Respondents‟ Awareness on Drug Abuse Program in the Barangay by Age Group…..102 Table 68 Respondents‟ Awareness on Drug Abuse Program in the Barangay by Gender……….102 Table 69 Respondents‟ Awareness on Drug Abuse Program in the Barangay by Civil Status . 103 Table 70 Respondents‟ Awareness on Drug Abuse Program in the Barangay by Highest
Educational Attainment ……………………………………..……………………………….. 104 Table 71 Respondents‟ Awareness on Drug Abuse Program in the Barangay by Highest
Educational Attainment……………………………………………………………………….. 105
Table 72 Respondents‟ Awareness on Drug Abuse Prevention Program ……………………….. 106 Table 73 Drug Abuse Prevention Programs Implemented in the Barangays…………………….. 109 Table 74 Agencies Implementing Drug Prevention Programs in the Barangay………………….. 110 Table 75 Respondents‟ Suggestions/Recommendations to Address the Drug Problem.......….. 111
1
A STUDY ON THE CURRENT NATURE AND EXTENT OF DRUG ABUSE IN THE PHILIPPINES
Executive Summary
Brief Description
The research study was undertaken by the Dangerous Drugs Board in collaboration with the Department of the Interior and Local Government and National Barangay Office in the 16 regions of the country. A total of 12,714 respondents proportionately distributed to age groups 10-19, 20-29; 30-39; 40 -49 and 50 & above, served as subjects. The data gathering activities were conducted from June to November 2008. Objectives of the Study
This aimed to determine the current nature and extent of drug abuse in the Philippines.
Specifically, it was conducted:
1. To determine the nature and characteristics of current drug use in terms of the following: a. Dangerous drugs used; b. Frequency of drug use; c. Sources of dangerous drugs; d. Amount spent per drug intake; e. Mode of drug use; and f. Reasons for first use, continued use, stopping drug use and for not using
drugs.
2. To determine the knowledge and perception of the respondents with regard to the following: a. The level of awareness of the drug problem in their barangay, city/
municipality and in the country b. The presence of users, pushers, injecting drug users and clandestine drug
laboratories in their barangay; c. Awareness of the drug abuse programs being implemented in their
barangays; and d. Suggestions and recommendations to address the drug problem.
3. To determine the national estimate of current and lifetime drug users in the country.
2
Methodology
Research Design
This study used the descriptive-survey method After-Only (one shot survey) as
the research design. The objectives of the survey basically collects factual information
on the current nature and extent of drug problem in the country, aptly required the
utilization of said method. Survey research as explained (Wikipedia,2008) involves
selecting a sample of respondents from a population and administering a standardized
questionnaire to them. The questionnaire can be a written document that is completed
by the person being surveyed, or an online questionnaire, face-to-face interview, or
done through telephone interview. By surveys it is possible to collect data from large or
small populations (sometimes referred to as the universe of a study).
Kenneth L. Kramer (1991) explained that survey research have three distinct
characteristics : first, the purpose of survey is to produce quantitative descriptions of
some aspects of the study population, second, it may be primarily concerned either
with relationships between variables, or with third, projecting findings descriptively to a
predefined population, as in this survey, the respondents‟ characteristics related to drug
problem, i.e. level of awareness on drug problem and patterns of drug use and the
estimates of current users.
Sampling Technique
As the scope of the survey is nationwide, the multi-stage sampling technique was
employed in the selection of the study sites, to which sampling is done at each level:
simple random sampling technique (fishbowl/lottery) in selecting 40% of
the provinces in each region; and 10% of the municipalities in each
province;
the purposive sampling in including the capital city of each province or, in
the absence of such, the capital town of the province, in the sampling
frame;
3
systematic sampling technique in choosing two barangays from each city
and municipality wherein the total number of barangays was divided by
2, to get the sampling interval; and then simple random in selecting the 2
barangays
Proportional stratified sampling in determining the number of respondents
per age brackets in each barangay.
Scope & Actual Studied Areas
The studied areas include 16 regions, 29 provinces, 91 municipalities/cities (64
municipalities and 27 cities) and 182 barangays in the actual data gathering activities.
Of the 182 barangays, 89 are urban and 93, rural barangays.
Instruments Used
The main tool used in gathering data is a questionnaire which contains items
culled from the existing instruments that DDB utilized in its previous survey studies. It
has four parts - Part 1 – elicited the respondents demographic data; Part II - asked for
the level awareness on the drug abuse problem in the barangay, city/municipality and in
the country; Part III- deals with the respondents experience and practices on the drug
abuse and Part IV elicited the respondents‟ comments and suggestion to address the
drug problem.
Data Gathering Procedure
Orientation on the mechanics of the data gathering was conducted by the
Dangerous Drugs Board‟s Research and Statistics Division, while the data gathering
was undertaken in collaboration with the local government units specifically the Office of
the Mayors, health units and barangays.
The joint team of DDB and DILG also conducted backtracking activities in the
Cordillera Administrative Region, Region II, Region III, Region VI, Region X to
4
determine the reasons why other regions have not reported or not yet conducted the
data gathering. Data gathering in some areas were not simultaneously conducted due
to the following reasons: delayed downloading of funds, conflict with their priority
projects and reconstruction of the region/province/s due to typhoon-related damages,
etc.
The Sample
A total of 12,714 respondents served as subjects of the survey. This sample size
is more than sufficient, as the computed sample size using Slovin‟s formula at alpha .01
was 9,999.52677.
As mentioned earlier, proportional sampling was used using the projected
population per age bracket for 2008* was applied to identify the number of respondents
needed per age bracket and per barangay. In the previous surveys only the 10-44
years old was the focused of the survey, however, to determine the number of those
who abused drugs in the older age groups and due to the regional and international
commitment of the Board in information sharing, age bracket of 44 and above was
included in the present survey. Listed below was the sample size used in the survey by
age group based on proportional sampling technique:
* based on the 2004 NSO projection on age brackets 10-64 years old
Age Group Number & Percent of Respondents*
10-19 = 21 (30.0%) 20-29 = 17 (24.28%) 30-39 = 13 (18.57%) 40-49 = 11 (15.71%) 50-59 = 6 (8.57%)
60 and above = 2 (2.85%) Total 70 The Findings 1. Results of the survey indicated that out of the 12,714 respondents, 1,344 or 10.57%
have tried drugs.
2. Of the total number of respondents (12,714), 11,370 or 89.42% did not try drugs.
5
3. Of those (1,344) who have tried drugs, 1,022 or 8.03% of the total respondents have stopped using drugs.
4. Of the 1,344 who tried drugs, 322 or 2.5% of the total respondents continued their drug taking behavior or were current drug users.
5. Highest among regions with current user-respondents (n=322 or 2.5% of 12,714)
were Regions VII with 146 or 1.15%, Region X with 48 or 0.38%, and the National Capital Region, 31 or 0.24%. Findings also revealed that there was no current user interviewed in Region 1 and IV-B. Respondents who have tried drugs in these regions said they have stopped using drugs at the time of the survey. Findings, however, is not conclusive that these regions are drug free.
Profile of Current Users (n=322 or 2.5% of 12,714 respondents) 6. The most vulnerable age groups were those belonging 10-19 with 88 (0.69%); and
20-29 – 102 or (0.80%) and 30-39 – 67 (0.53%) years old.
7. More males, 296 or 2.33%, and single, 172 or 1.35% respondents continued their drug taking behavior.
8. With regards to educational attainment, findings show that the current user
respondents were those in the high school level with 131 or 1.03%.
9. In terms of classification of current drug-user respondents, a large percentage was unemployed (0.87%, employee in the private sector, 65 or 0.51%, out-of-school youth, 59 or 0.46% and the students, 35 or 0.28%.
Current Users’ Patterns of Drug Usage
10. As to type of drugs, methamphetamine hydrochloride (shabu) were abused by 243
or 1.91%, cannabis (marijuana), with 94 or 0.74% and contact cement, 24 or 0.19% of currents user-respondents.
11. With regards to age group by drug type, shabu and marijuana were abused by those
in the age brackets of 10-19; 20-29, 30-49 and 50-59, while contact cement by those in the 10-19, 20-29 and 30-39 age groups.
12. In terms of frequency of drug usage, a large percentage of current drug-user
respondents abused shabu , marijuana and contact cement on a weekly basis.
13. Findings showed that the minimum and highest amount spent per drug intake on the following drugs were as follows:
Methamphetamine (Shabu) - Min - P100. - Ave. – P455
Cannabis (MJ) - Min. - P5.00 - Ave. – P36.
6
Contact Cement - Min. - P30. - Ave – P10.
14. The common route of administration or uses of drugs as claimed by current users were: shabu by sniffing/inhalation, marijuana, through smoking/inhalation and contact cement by sniffing.
15. The sources of drugs they abused mentioned by current user-respondents were:
pushers,(1.28%) classmate/friends who is a pusher (1.10%); from the drugs I am pushing (0.09%); and hardware (0.03%).
Reasons for First Use, Continued Use, Stopping Drug Use and Not using Drugs 16. Reasons for first use of drugs given were curiosity; peer pressure; personal
problems (family and marital).
17. Reasons for continued use - peer influence, family personal and work-related problems and family, personal and work-related problems aggravated by peer influence.
18. Of those who tried drugs (1,344), 76.04% stopped using drugs. The reasons for
stopping drug use (n=1,022 or 76.04 of those who tried drugs%) were: nothing good happened in life (56.36%); tried once and stopped (28.67%); got sick because of using drugs, (6.6%); and jailed (6.6%) because of drug use.
Awareness on the Drug Problem in the City/Municipality and In the Country 19. The awareness of the respondents on the drug abuse problem in the barangays,
city/municipality and in the country levels were on “average level of awareness.”
20. The minimum and highest number of pushers, users, injecting drug users, and clandestine laboratory based on the responses of those who were aware of the drug problem in their barangays is as follows: pushers – minimum, 1, highest 10; pusher – minimum 1 – highest – 10; minimum; injecting drug users – 1, highest 2; and for clandestine laboratory – minimum – 1 – highest was 2.
21. The top 5 programs being implemented in the barangays to address the drug problem were as follows: conduct of anti-drug advocacy campaign, seminars/symposia; sports activities for the youth and people in the barangays; various anti-drug abuse activities conducted by the barangays, municipal and city officials; dissemination of anti-drug campaign, posters and leaflets; and implement curfew hours for minors.
22. The agencies implementing the programs in the barangays as mentioned by the respondents were LGUs/barangays; Philippine Drug Enforcement Agency (PDEA);
7
other government agencies (DILG, DOH, DSWD, DTI, BFAD); school institutions and the Dangerous Drugs Board.
Population Estimate Based on the Results of the Survey 23. Based on the results of the survey it was estimated that there could be 1,715, 854*
current drug users or 2.5% of the 2008 projected *Filipino population aged 10-64 years old. *Based on the 2008 NSCB population projections of age 10-64 years old.
Implications and Recommendations
1. In terms of current drug users and those who have tried drugs, among the regions, Region VII and X topped the list which implies that programs of the government (educational, prevention, treatment and rehabilitation and others) should be strengthened in these regions while remaining vigilant in other regions.
2. In terms of age group and educational qualification, current drug users were concentrated on age brackets 10-19 and 20-29. This could be taken to mean that these age groups (elementary, high school and college students) were the most vulnerable to drug abuse. Hence, it is recommended that programs/lessons on drug prevention and control be integrated in the basic education curriculum as well as in the tertiary education curriculum. In basic education, it could be in the Social Studies of the Makabayan strand; in the tertiary, in any appropriate Social Science course. Likewise, the availability of contact cement and solvent should be looked into. Imposing regulations in selling these items to minors by hardware/store is also recommended, as it was found out that those aged 10-19 buy primarily from them.
3. In terms of gender and educational attainment in all regions, the male high school students topped the list of respondents who continue to abuse drugs. It is thus recommended that DDB anti-drugs campaign be intensified among high school students.
4. The unemployed topped the list of current users at the time of the interview/survey. This was probably the reason why the respondents themselves recommended job opportunities and livelihood programs for the youth and the unemployed as a means of addressing the drug problem.
This study recommends that while the DDB cannot provide jobs to the unemployed, its programs and activities should include this sector, particularly in activities/programs which provide opportunities to learn better coping skills, develop self-esteem, and spiritual enhancement.
8
5. Continuing to use drugs is blamed on the influence of friends who themselves are using drugs. This was reported by the respondents from 11 out of 13 regions with current users. Peer influence as reason for drug abuse is a manifestation of a deep rooted problem in the family and need to be addressed. It is recommended that the programs and activities of the Dangerous Drugs Board focus on family-oriented activities that would develop/ strengthen family relationships, and coping mechanism to face personal, marital, school, work-related problems. A strong family foundation is a tool against drug abuse and the youth or individual will not seek the company of peers if he/she is happy at home.
6. Evaluation of the programs/projects implemented from 2005-2008 should be undertaken to determine its outcome/impact and that information materials being used/disseminated for public awareness be assessed to determine its applicability to the present drug situation or influence to target beneficiaries.
7. Conduct of regular surveys on the general population, students, workers, special studies on focus groups, and ethnographic studies on high risk-groups such as transportation workers, call center agents, street families, urban yuppies are recommended to come up with evidence-based programs and projects to address the drug problem in the country.
8. Based on the results of the survey it was estimated that there could be 1.7 M current drug users and pointed to a downward trend in the abuse of dangerous drugs as compared to past years. While the study cannot answer what causes the decline in drug abuse the following reasons maybe considered: the intensive and heightened supply reduction efforts conducted by Philippine Drug Enforcement Agency (PDEA) and other law enforcement agencies, strict implementation of DDB policies like the mandatory drug testing for the applicants of driver‟s license, the military, firearms holders, random drug test among students, and the realization of DDB‟s programs and projects in collaboration with its partner agencies, the local government units and other non-government organizations since 2005 up to present. These efforts, policies, programs and endeavors are possibly reaping positive results in curbing the drug problem in the country, and the vision to become a drug-resistant country in 2010 is a realistic goal to pursue.
9
A Study on the Current Nature and Extent of Drug in the Philippines
A joint project of the
Dangerous Drugs Board (DDB) and the Department of the Interior and Local
Government-National Barangay Operations Office
(DILG-NBOO)
INTRODUCTION
The drug problem in the country has not waned over the years as seen in the
seizures of big volumes of dangerous drugs and its chemical precursors, arrests of
persons involved in the illicit drug trade, and the discovery and dismantling of
clandestine laboratories and storage facilities of dangerous drugs.
The magnitude of the drug abuse problem can also be gleaned in the results of
surveys conducted by the Dangerous Drugs Board in 1991 and 2004. The results of the
said surveys were as follows: Based on the results of the 1999 DDB survey, it was
estimated that there could be 3.4. M drug users in the country at that time. Of this, 1.8
million were regular users, while 1.6, occasional users. In 2004, based on the results
of the DDB survey conducted in selected regions and studied areas in the Luzon,
Visayas, Mindanao and the National Capital Region having 12,000 respondents with
ages 10 to 44 years old, it was estimated that there might be 6.7 million drug users at
the time of the survey. Methamphetamine Hydrochloride (shabu), cannabis
(marijuana) and contact cement (Ex. rugby) were the most abused drugs of those who
admitted to have continued their drug taking behavior.
The Government Response
In response to the problem, the Dangerous Drugs Board adopted the United
Nations Office on Drugs and Crime‟s (UNODC) strategies to counteract the drug
problem in the country. These were the pillar of actions on drug demand reduction, drug
supply reduction, drug advocacy/awareness and response, alternative development,
and the regional and international cooperation. The Board‟s accomplishments,
programs and projects, under these pillars were documented in its Annual Reports of
2005-2007. Successful collaborative efforts undertaken by the Dangerous Drugs
10
Board, the Philippine Drug Enforcement Agencies and its partner agencies among its
regional and international counterparts can also be gleaned in these reports.
In order to continue being responsive, and to assess the efforts being done by
the government in addressing the drug problem after four years, the Dangerous Drugs
Board approved the conduct of the 2008 Household Survey in collaboration with the
Department of the Interior of the Local Government - National Barangay Operations
Office. This is to come up with new data that would measure the extent of the drug
abuse problem in the country that would serve as the basis for the formulation and
prioritization of programs and projects, redirection (if necessary) or formulation of new
policies to counteract the drug problem.
Statement of the Problem
This study was conducted by the Dangerous Drugs Board in collaboration with
the Department of the Interior and Local Government - National Barangay Operations
Office (DILG-NBOO). Primarily, the study aimed to determine the current nature and
extent of drug abuse problem in the country.
Its specific objectives were as follows:
4. To determine the nature and characteristics of current drug use in terms of
the following:
a. Dangerous drugs used;
b. Frequency of drug use;
c. Sources of dangerous drugs;
d. Amount spent per drug intake;
e. Mode of drug use; and
f. Reasons for first use, continued use, stopping drug use and for not using
drugs.
5. To determine the knowledge and perception of the respondents with regard to
the following:
a. The level of awareness of the drug problem in their barangay, city/
municipality and in the country
11
b. The presence of users, pushers, injecting drug users and clandestine drug
laboratories in their barangay;
c. Awareness of the drug abuse programs being implemented in their
barangays; and
d. Suggestions and recommendations to address the drug problem.
6. To determine the national estimate of current and lifetime drug users in the
country.
Significance of the Study
Results of this survey will provide the Dangerous Drugs Board and its partner
agencies new information on the current nature and extent of the drug problem that
would serve as baseline information for prioritization, strengthening or redirection of
programs, projects and activities, and formulation of new policies (if necessary) to
address the drug problem in the country.
Limitation of the Study
The Study on the Current Nature and Extent of Drug Abuse in the Philippines
covered the 16 regions in the country. It was limited to the methods used to elicit the
information needed, studied sites, and on the research objectives in determining
current nature and extent of drug use problem, and the variables included in the survey.
It also provided estimates of those who have tried drugs and current drug users on age
groups 10-19, 20-29, 30-39, 40-49, 50-59 and 60 & above.
The data gathering in some regions was also delimited to the actual
implementation due to circumstances beyond control. Schedule of data gathering was
June 1-30, 2008 but was rescheduled in some regions due prioritization of the projects
of the agency already scheduled for implementation, rehabilitation of typhoon-related
damages, and security reasons.
12
METHODS AND PROCEDURES
Research Design
This study used the descriptive-study method one-shot After-Only as the
research design. The objectives of the study basically collects factual information on
the current nature and extent of drug problem in the country, aptly required the
utilization of said method. Survey research as explained (Wikipedia, 2008) involves
selecting a sample of respondents from a population and administering a pre-tested and
validated questionnaire to them. The questionnaire can be a written document that is
completed by the person being surveyed, or an online questionnaire, face-to-face
interview, or done through telephone interview. By surveys it is possible to collect data
from large or small populations (sometimes referred to as the universe of a study).
Kenneth L. Kramer (1991) explained that survey research have three distinct
characteristics : first, the purpose of survey is to produce quantitative descriptions of
some aspects of the study population, second, it may be primarily concerned either
with relationships between variables, or with third, projecting findings descriptively to a
predefined population, as in this survey, the respondents‟ characteristics related to drug
problem, i.e. level of awareness on drug problem and patterns of drug use and the
estimates of current users.
Sampling Technique
As the scope of the study is nationwide, the multi-stage sampling technique was
employed in the selection of the study sites, to which sampling is done at each level:
simple random sampling technique (fishbowl/lottery) in selecting 40% of
the provinces in each region; and 10% of the municipalities in each
province;
the purposive sampling in including the capital city of each province or, in
the absence of such, the capital town of the province, in the sampling
frame;
Proportional stratified sampling in determining the number of respondents
per age brackets in each barangay.
13
systematic sampling technique in choosing two barangays from each city
and municipality wherein the total number of barangays was divided by
2, and then simple random in selecting the 2 barangays
Scope of the Study Areas
The studied areas included 16 regions, 27 provinces, 64 municipalities and 27
cities, and 182 barangays (see Appendix A). As to barangays, the coverage included
89 urban and 93 rural barangays. Due to security reasons in the region of ARMM, the
data gathering activities was delayed and the questionnaires was submitted only during
the first week of December where the encoding and processing of data is almost
complete.
The joint team of DDB and DILG also conducted backtracking activities in the
Cordillera Administrative Region, Region II, Region III, Region VI, and Region X to
determine the reasons why these regions have not reported or have not yet conducted
the data gathering. Data gathering in some areas were not simultaneously conducted
due to the following reasons: delayed downloading of funds, conflict with their priority
projects, and rehabilitation of the region/province/s due to typhoon-related damages,
etc.
The Sample
A total of 12,714 respondents served as subjects of the study. This sample size
is more than sufficient, as the computed sample size using Slovin‟s formula at alpha .01
was 9,999.52677.
As mentioned earlier, proportional sampling was employed using the projected
population per age bracket (based on 2008 NSCB projected population on age 10-64
years old to get the number of respondents needed per barangay.
The groupings begin with age 10 as the minimum and 60 and above as the
maximum, for it was reported that there were drug users being brought to the treatment
and rehabilitation centers below 14 years of age and beyond the age of 60 (Dangerous
Drugs Board Report, Facility-Based, 2003-2007). Further, inclusion of those within the
45 and above age groups was made in this survey to answer the need of DDB on its
regional and international commitment on information exchange/sharing, wherein in the
14
past years (UNODC Global Assessment Report, 2006, 2007) the Philippines‟ drug users
population aged 10-44 was compared with the global population of drug users within the
15 to 64 years old.
Listed below was the sample size used in the study per age group by barangay
based on proportional sampling technique:
Age Group Number & Percent of Respondents*
10-19 = 21 (30.0%)
20-29 = 17 (24.28%)
30-39 = 13 (18.57%)
40-49 = 11 (15.71%)
50-59 = 6 (8.57%)
60 and above = 2 (2.85%)
Total 70 (100%)
Distribution of Respondents
The respondents for the different regions have varied sample sizes since
proportionate sampling required more respondents from regions with bigger population
but percentage wise they were equal in representation, since each region is
represented by 40% of its provinces.
15
Table 1. Distribution of Respondents by Region
Region Respondents %
1 1,260 9.91
2 700 5.51
3 700 5.51
4-A 1,119 8.80
4-B 560 4.40
5 1120 8.81
6 980 7.71
7 1,260 9.91
8 840 6.61
9 560 4.40
10 549 4.32
11 560 4.40
12 560 4.40
CARAGA 686 5.40
NCR 700 5.51
CAR 560 4.40
TOTAL 12,714 100.00
In terms of the region, Regions 1 and 7 have the highest number of
respondents (1,260 or 9.91%), followed by Region 5 (1,120) or 8.81), then by Region
4-A (1,119) or 8.80%). Region 10 had the least number of respondents (549 or 4.32%).
16
The Profile of Respondents
By age group, the category 10-19 have the highest percentage (30.01%),
followed by 20-29 (24.34%), then by 30-39 (18.57%). Last in rank was the category 60
and above, with 3.18%.
In terms of gender, there were more males (7,014or 55.17%) than females
(5,700 or 44.83%) who were interviewed
By civil status, the sample was largely married and single, with the married
respondents (5,955 or 46.89%) ranking number one, followed by single respondents
(5,805 or 45.67%). The least number of respondents were single-parents (22 or 0.17%)
and divorced with (1 or .01%).
On highest educational attainment, respondents largely belonged to those who
were in the high school level (3,917 or 30.81%, followed by those in the college level
(2,714 or 21.35. %). The least, 14 or 0.11% were postgraduate degree holders.
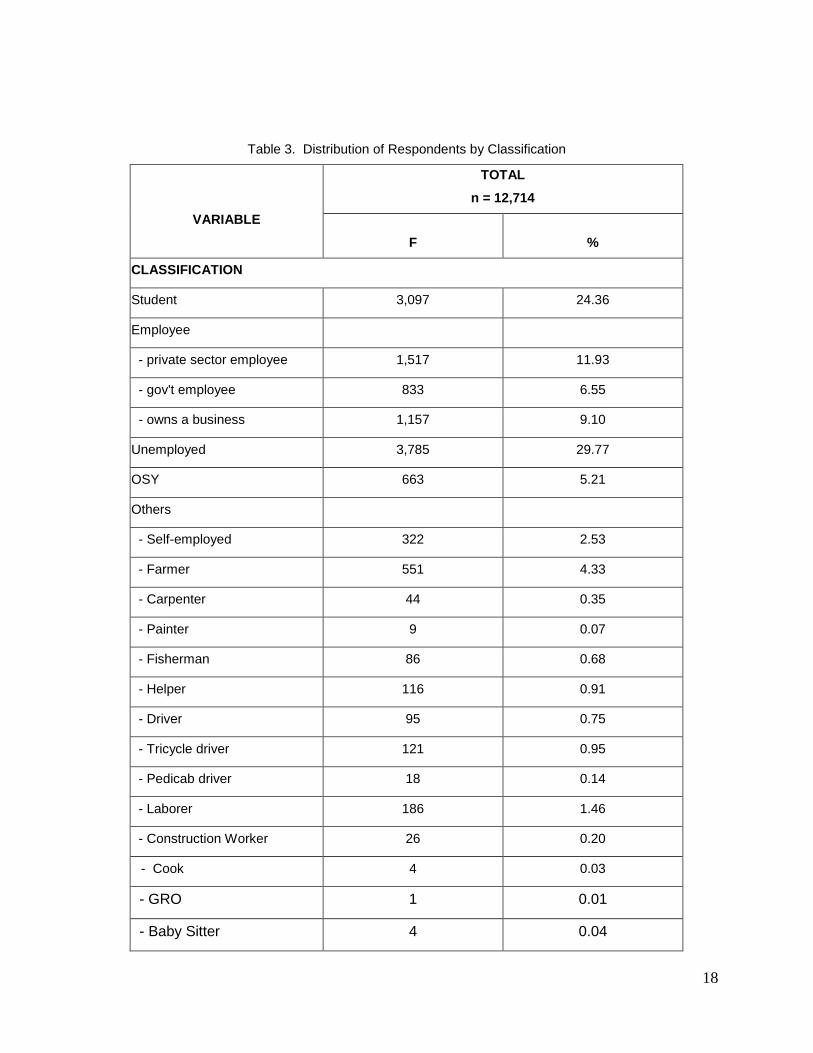
By classification, respondents who were unemployed comes first in the list of
respondents, with 3,785 or 29.77 %, followed by students (3,097 or 24.36%), then the
private sector employees (1,517) or 11.93%) . Those in the “Others” classification
included the farmers(551 or 4.33%), and self-employed (322 or 2.53%).
The tabular presentation of the profile of respondents is in Tables 2 and 3.
17
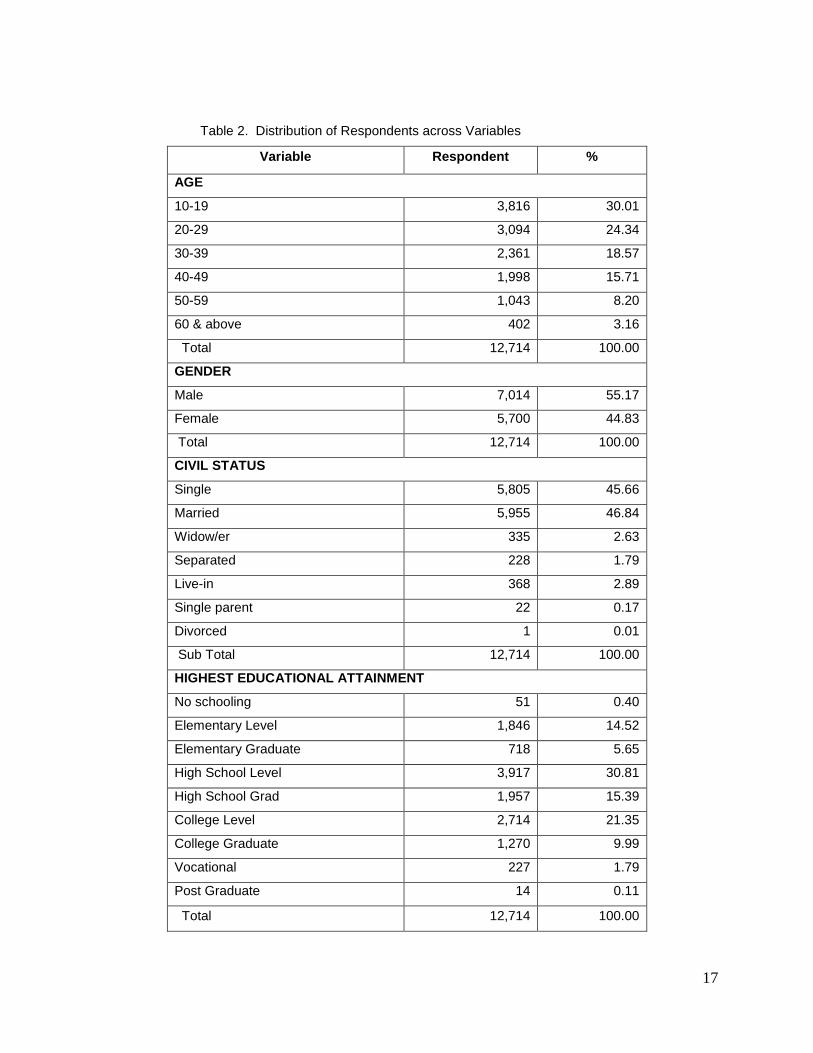
Table 2. Distribution of Respondents across Variables
Variable Respondent %
AGE
10-19 3,816 30.01
20-29 3,094 24.34
30-39 2,361 18.57
40-49 1,998 15.71
50-59 1,043 8.20
60 & above 402 3.16
Total 12,714 100.00
GENDER
Male 7,014 55.17
Female 5,700 44.83
Total 12,714 100.00
CIVIL STATUS
Single 5,805 45.66
Married 5,955 46.84
Widow/er 335 2.63
Separated 228 1.79
Live-in 368 2.89
Single parent 22 0.17
Divorced 1 0.01
Sub Total 12,714 100.00
HIGHEST EDUCATIONAL ATTAINMENT
No schooling 51 0.40
Elementary Level 1,846 14.52
Elementary Graduate 718 5.65
High School Level 3,917 30.81
High School Grad 1,957 15.39
College Level 2,714 21.35
College Graduate 1,270 9.99
Vocational 227 1.79
Post Graduate 14 0.11
Total 12,714 100.00
18
Table 3. Distribution of Respondents by Classification
VARIABLE
TOTAL
n = 12,714
F %
CLASSIFICATION
Student 3,097 24.36
Employee
- private sector employee 1,517 11.93
- gov't employee 833 6.55
- owns a business 1,157 9.10
Unemployed 3,785 29.77
OSY 663 5.21
Others
- Self-employed 322 2.53
- Farmer 551 4.33
- Carpenter 44 0.35
- Painter 9 0.07
- Fisherman 86 0.68
- Helper 116 0.91
- Driver 95 0.75
- Tricycle driver 121 0.95
- Pedicab driver 18 0.14
- Laborer 186 1.46
- Construction Worker 26 0.20
- Cook 4 0.03
- GRO 1 0.01
- Baby Sitter 4 0.04
19
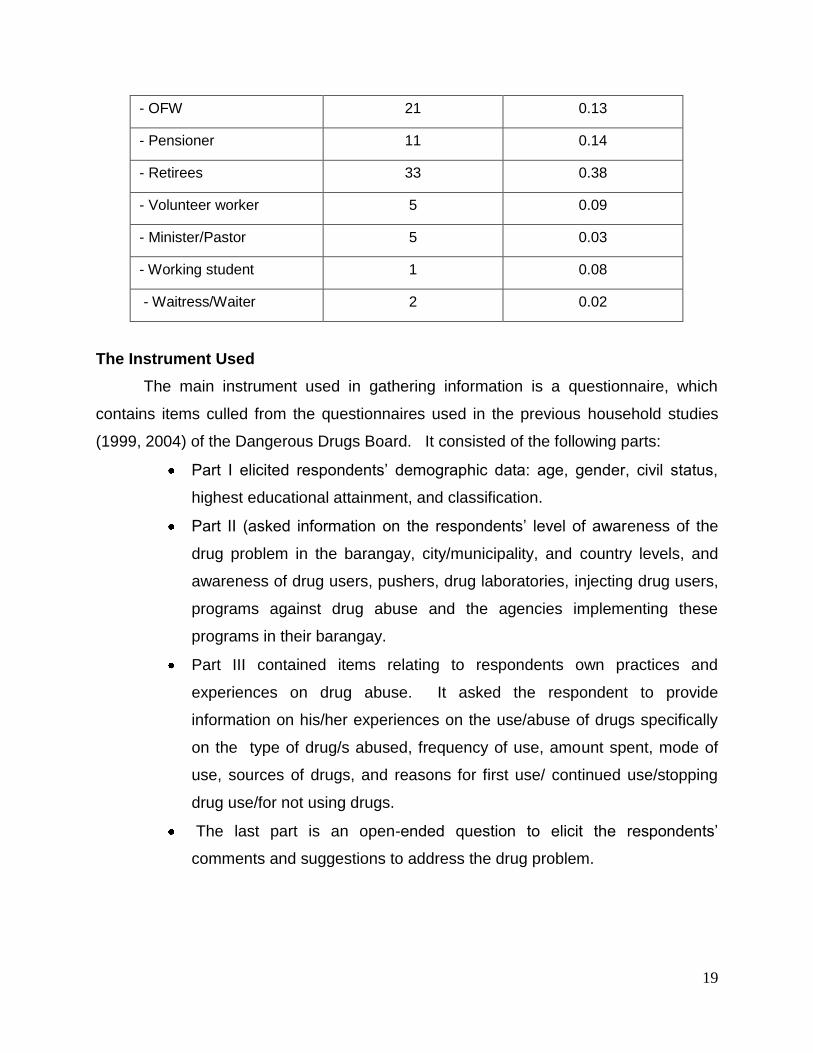
- OFW 21 0.13
- Pensioner 11 0.14
- Retirees 33 0.38
- Volunteer worker 5 0.09
- Minister/Pastor 5 0.03
- Working student 1 0.08
- Waitress/Waiter 2 0.02
The Instrument Used
The main instrument used in gathering information is a questionnaire, which
contains items culled from the questionnaires used in the previous household studies
(1999, 2004) of the Dangerous Drugs Board. It consisted of the following parts:
Part I elicited respondents‟ demographic data: age, gender, civil status,
highest educational attainment, and classification.
Part II (asked information on the respondents‟ level of awareness of the
drug problem in the barangay, city/municipality, and country levels, and
awareness of drug users, pushers, drug laboratories, injecting drug users,
programs against drug abuse and the agencies implementing these
programs in their barangay.
Part III contained items relating to respondents own practices and
experiences on drug abuse. It asked the respondent to provide
information on his/her experiences on the use/abuse of drugs specifically
on the type of drug/s abused, frequency of use, amount spent, mode of
use, sources of drugs, and reasons for first use/ continued use/stopping
drug use/for not using drugs.
The last part is an open-ended question to elicit the respondents‟
comments and suggestions to address the drug problem.
20
Mode of Data Gathering
There were two methods by which the questionnaire was administered: guided
interview and self-administered. The bases for using either of the method are
respondents‟ level of education and willingness to be interviewed. If the respondent
was unwilling (due to the sensitiveness of the topic) and seemed more comfortable
answering the questionnaire by himself/herself, then the self-administered method was
used; and if the respondent needed help to answer the questions, then the interview-
administered method was utilized.
The Data Gathering Procedure
Prior to the collection of data, the following were undertaken by the DDB
Research Team and the DILG-NBOO Staff:
a. Informed various DILG Regional Directors in 17 regions regarding the conduct of
the survey;
b. Identified the regional focal persons who attended the orientation training in
Manila;
c. Conducted the Orientation-Training on the mechanics of the data gathering on
May 23, 2008, attended by 17 regional focal persons.
d. Regional orientation conducted by DILG focal persons in their regional,
provincial and city/municipality officers;
e. Identification of enumerators (barangay nutrition scholars, barangay health
workers and volunteers or barangay officials) in each city/municipality; and
f. Orientation of the enumerators on the mechanics of the survey, questionnaire-
administration, spot mapping and matrix for backtracking.
As soon as the procedures were echoed to the DILG focal persons and
enumerators, the data gathering followed. The starting point or the street where the
data gathering commenced depends on the location of the barangay, ( e.g. either the
first street from the barangay office, house of the barangay captain, highway , school,
church, coastline, etc). The first 10th household nearest the said starting point was
selected, and subsequent households were chosen using a fixed interval of 9
households in between the sampled household. This means that every 10th household
21
was surveyed until the required number of respondents per each age bracket was
realized in the data gathering.
All accomplished questionnaires were submitted to the Team Leaders and then
to the regional focal persons prior to submission to DILG head office and DDB.
Treatment of Data
Encoding and processing of data was done by student-encoders from the
Philippine Normal University using MS Excel while the Statistical Package for Social
Scientists (SPSS) was used by PSRSD in the processing of data.
For quantitative data, descriptive statistics were employed in the form of
frequency distribution from which percentages were computed for nominal data, and for
interval data, the means in the form of ratings.
The interval scale of the mean used for level of awareness is:
1.0 - 1.49 low level of awareness
1.50 - 2.49 average level of awareness
2.50 - 3.00 high level of awareness
For qualitative data, responses were tabulated and tallied, and frequencies were
obtained for response categories.
Definition of Terms
The following terms were operationally defined for better understanding:
Barangay – the smallest political unit in the Philippines having at least 1,000
inhabitants
Current users - those who continue to use drugs six months to one year on a daily,
weekly, monthly basis, prior to and during the time of the conduct of the survey.
(2004 DDB survey).
Drug use - refers to the deliberate administration of drugs and chemical
substances to one‟s self for purposes other than its intended medical purposes.
Household – a social unit consisting of person living alone or a group of persons who
sleep in the same housing unit; and have a common arrangement in the preparation
and consumption of food.
22
Projected Population - the 2004 estimates of the National Statistics Office (NSO) of
the Philippine population belonging to 10-64 years old.
Survey - refers to one of the techniques in gathering or collecting information on a
representative segment of the population under study of descriptive research.
Sample size – the number of respondents representing the universe, that is, the
population under study, of those within 10-64 years old.
Simple Random Sampling – each element in the population has a chance to be
included in the sample,
Region – are administrative groupings of provinces in the Philippines. They do not
have political power, except for ARMM, and merely serve for administrative purposes.
Route of use – the manner by which the drug is taken into the body by the drug user
either through inhalation, sniffing, oral ingestion, and or injection.
Tried using - those who have tried drugs at least once and stopped.
23
Results and Discussions
24
The results and discussions were arranged based on the objectives of the study,
hence, findings begin with the discussion on the respondents who have tried using
drugs.
THOSE WHO HAVE TRIED USING DRUGS
a. Profile of Those Who Have Tried Using Drugs
National Characteristics
The following are the salient findings of those who tried drugs:
Of the 1,334 who have tried drugs, 25.74% came from Region 7, followed
by Region 10 with 10.34%, and the National Capital Region, 9.82%.
As to age of first drug use, the youngest was 9 years old and the oldest
was 59. Average age of first use was 21.
As to age distribution, less than one third (31.99%) belonged to the age
group of 20-29 years old; followed by those in the 30-39 age group. The
least of persons who have tried drugs belonged to the 50 and above age
bracket.
With regards to gender, there were more males (87.35%) than females
who have tried drugs.
Predominantly, a large percentage of single and married respondents,
44.20% and 43.38%, respectively, have tried drugs, Those with live-in
partners come third (6.92%).
Of the 1,344 who have tried drugs, 448 (33.33%) have reached high
school level, 226 (16.82%) were high school graduates and 336 (25.00%)
have reached college. Only 4 (0.30%) of those who tried drugs have no
formal schooling.
As to the classification, the unemployed represents 30.73%, followed by
those employed in the private sector (16.22%), students, with 10.49% and
the out-of-school youth (OSY). with 9.97%.
The tabular presentation on the national profile of those who have tried using
drugs and their classifications can be seen in Tables 4 and 5.
25
Table 4. National Characteristics of Those Who Have Tried Drugs
By Age Group F %
10-19 263 19.57
20-29 430 31.99
30-39 347 25.82
40-49 216 16.07
50-59 74 5.51
60 & above 14 1.04
Total 1,344 100.00
By Gender
Male 1,174 87.35
Female 170 12.65
Total 1,344 100.00
By Civil Status
Single 594 44.20
Married 583 43.38
Widow/er 24 1.79
Separated 47 3.50
Live-in 93 6.92
Single parent 3 0.22
Total 1,344 100.00
By Highest Educational Attainment
No schooling 4 0.30
Elementary Level 135 10.04
Elementary Graduate 65 4.84
High School Level 448 33.33
High School Grad 226 16.82
College Level 336 25.00
College Graduate 91 6.77
Vocational 39 2.90
Total 1,344 100.00
26
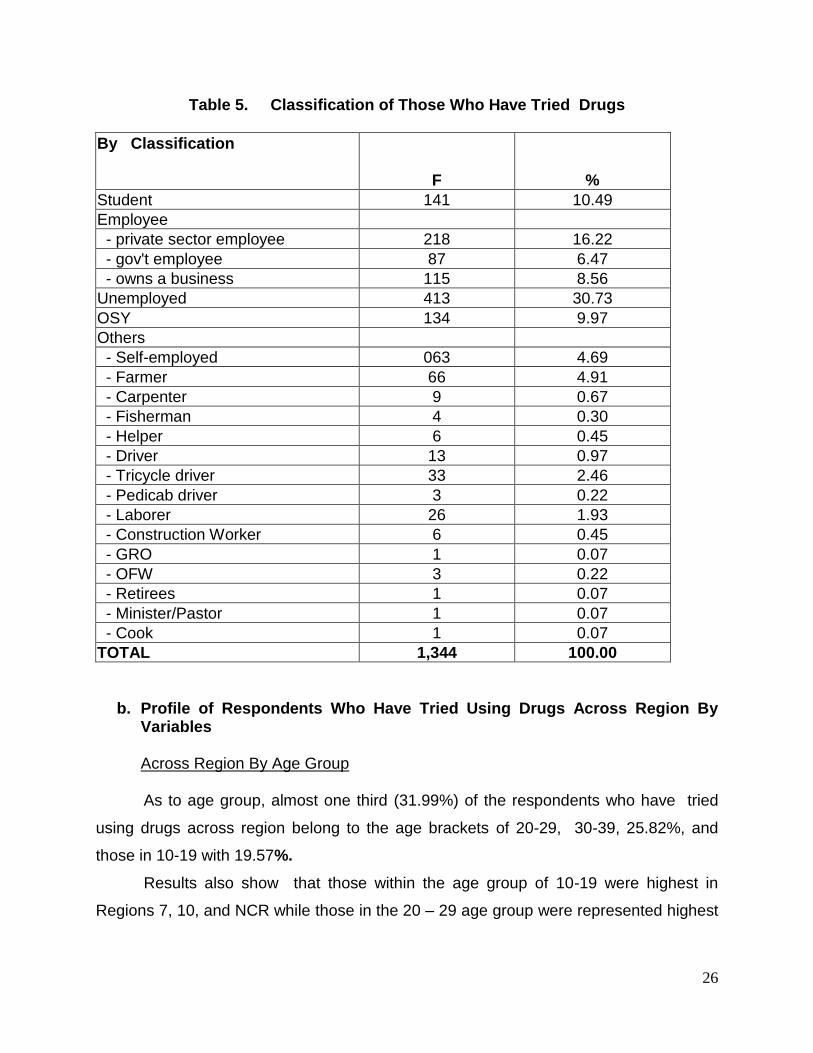
Table 5. Classification of Those Who Have Tried Drugs
By Classification
F %
Student 141 10.49
Employee
- private sector employee 218 16.22
- gov't employee 87 6.47
- owns a business 115 8.56
Unemployed 413 30.73
OSY 134 9.97
Others
- Self-employed 063 4.69
- Farmer 66 4.91
- Carpenter 9 0.67
- Fisherman 4 0.30
- Helper 6 0.45
- Driver 13 0.97
- Tricycle driver 33 2.46
- Pedicab driver 3 0.22
- Laborer 26 1.93
- Construction Worker 6 0.45
- GRO 1 0.07
- OFW 3 0.22
- Retirees 1 0.07
- Minister/Pastor 1 0.07
- Cook 1 0.07
TOTAL 1,344 100.00
b. Profile of Respondents Who Have Tried Using Drugs Across Region By Variables Across Region By Age Group
As to age group, almost one third (31.99%) of the respondents who have tried
using drugs across region belong to the age brackets of 20-29, 30-39, 25.82%, and
those in 10-19 with 19.57%.
Results also show that those within the age group of 10-19 were highest in
Regions 7, 10, and NCR while those in the 20 – 29 age group were represented highest
27
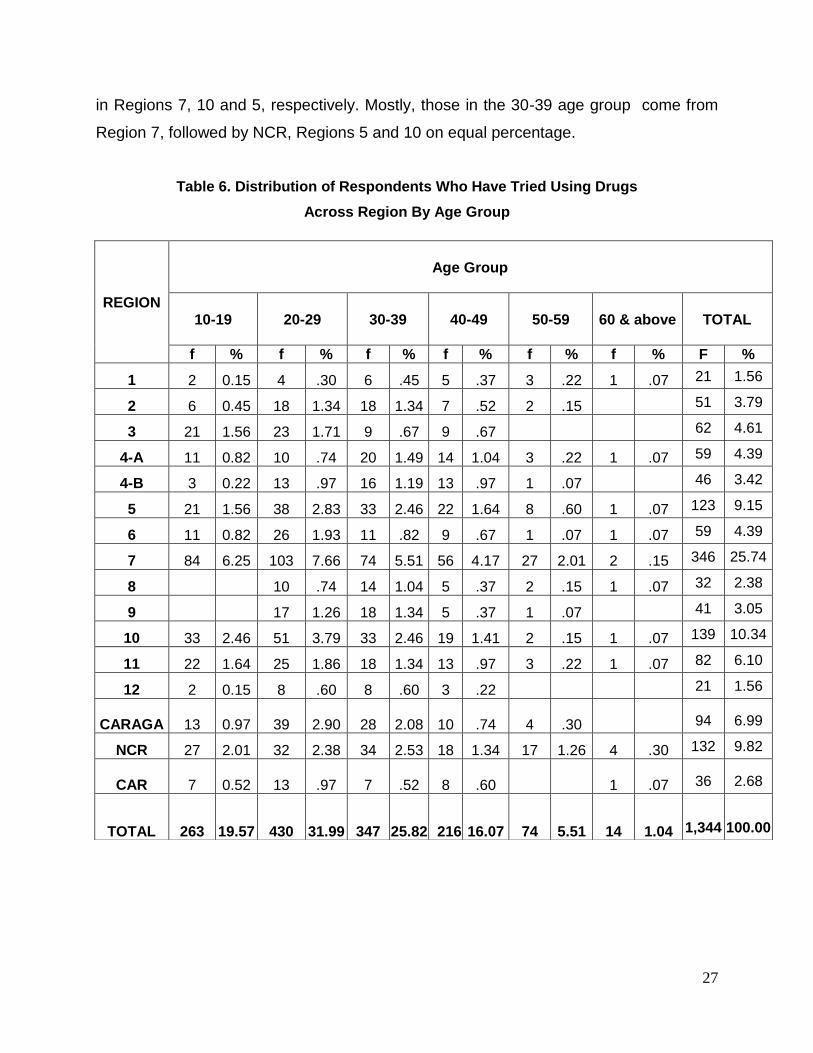
in Regions 7, 10 and 5, respectively. Mostly, those in the 30-39 age group come from
Region 7, followed by NCR, Regions 5 and 10 on equal percentage.
Table 6. Distribution of Respondents Who Have Tried Using Drugs
Across Region By Age Group
REGION
Age Group
10-19
20-29
30-39 40-49 50-59 60 & above TOTAL
f % f % f % f % f % f % F %
1 2 0.15 4 .30 6 .45 5 .37 3 .22 1 .07 21 1.56
2 6 0.45 18 1.34 18 1.34 7 .52 2 .15 51 3.79
3 21 1.56 23 1.71 9 .67 9 .67 62 4.61
4-A 11 0.82 10 .74 20 1.49 14 1.04 3 .22 1 .07 59 4.39
4-B 3 0.22 13 .97 16 1.19 13 .97 1 .07 46 3.42
5 21 1.56 38 2.83 33 2.46 22 1.64 8 .60 1 .07 123 9.15
6 11 0.82 26 1.93 11 .82 9 .67 1 .07 1 .07 59 4.39
7 84 6.25 103 7.66 74 5.51 56 4.17 27 2.01 2 .15 346 25.74
8 10 .74 14 1.04 5 .37 2 .15 1 .07 32 2.38
9 17 1.26 18 1.34 5 .37 1 .07 41 3.05
10 33 2.46 51 3.79 33 2.46 19 1.41 2 .15 1 .07 139 10.34
11 22 1.64 25 1.86 18 1.34 13 .97 3 .22 1 .07 82 6.10
12 2 0.15 8 .60 8 .60 3 .22 21 1.56
CARAGA 13 0.97 39 2.90 28 2.08 10 .74 4 .30 94 6.99
NCR 27 2.01 32 2.38 34 2.53 18 1.34 17 1.26 4 .30 132 9.82
CAR 7 0.52 13 .97 7 .52 8 .60 1 .07 36 2.68
TOTAL 263 19.57 430 31.99 347 25.82 216 16.07 74 5.51 14 1.04
1,344 100.00
28
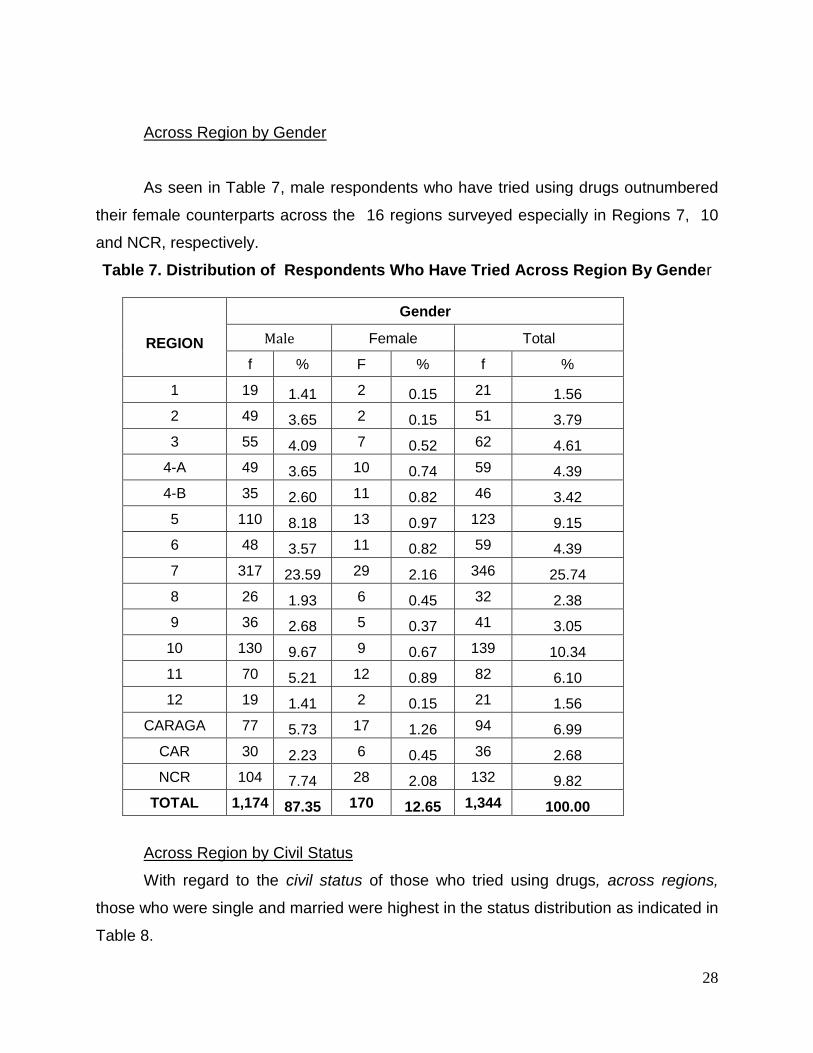
Across Region by Gender
As seen in Table 7, male respondents who have tried using drugs outnumbered
their female counterparts across the 16 regions surveyed especially in Regions 7, 10
and NCR, respectively.
Table 7. Distribution of Respondents Who Have Tried Across Region By Gender
REGION
Gender
Male Female Total
f % F % f %
1 19 1.41 2 0.15 21 1.56
2 49 3.65 2 0.15 51 3.79
3 55 4.09 7 0.52 62 4.61
4-A 49 3.65 10 0.74 59 4.39
4-B 35 2.60 11 0.82 46 3.42
5 110 8.18 13 0.97 123 9.15
6 48 3.57 11 0.82 59 4.39
7 317 23.59 29 2.16 346 25.74
8 26 1.93 6 0.45 32 2.38
9 36 2.68 5 0.37 41 3.05
10 130 9.67 9 0.67 139 10.34
11 70 5.21 12 0.89 82 6.10
12 19 1.41 2 0.15 21 1.56
CARAGA 77 5.73 17 1.26 94 6.99
CAR 30 2.23 6 0.45 36 2.68
NCR 104 7.74 28 2.08 132 9.82
TOTAL 1,174 87.35 170 12.65 1,344 100.00
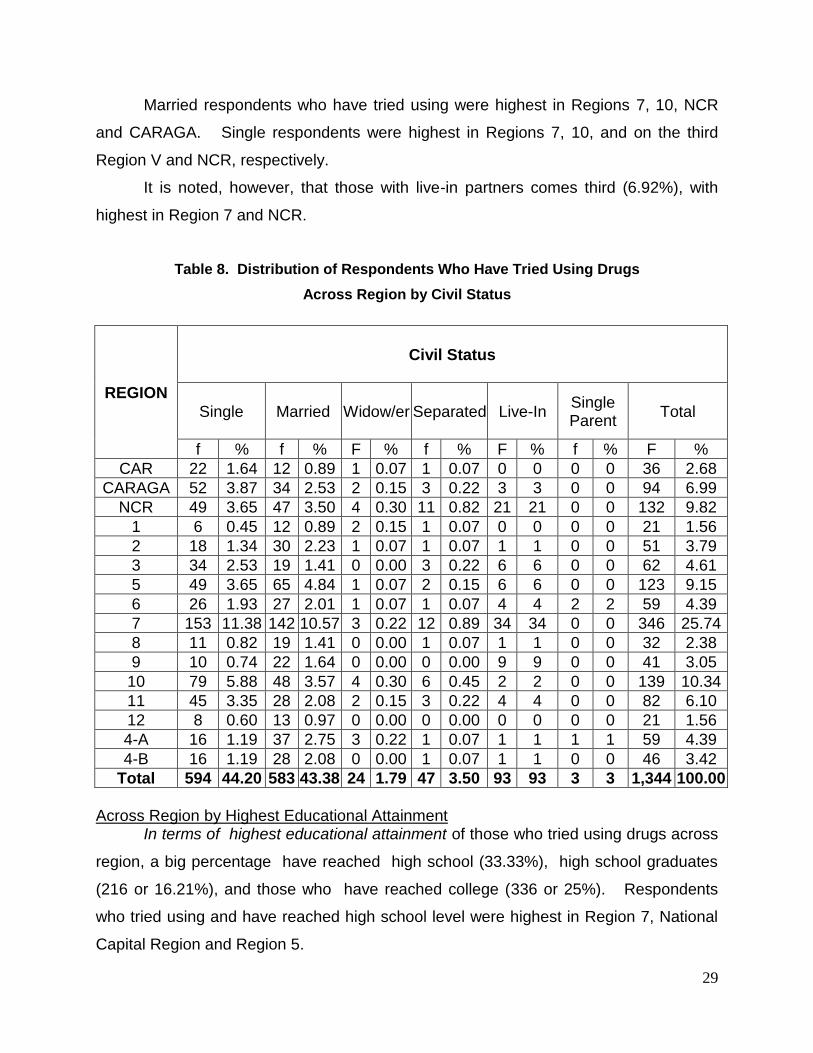
Across Region by Civil Status
With regard to the civil status of those who tried using drugs, across regions,
those who were single and married were highest in the status distribution as indicated in
Table 8.
29
Married respondents who have tried using were highest in Regions 7, 10, NCR
and CARAGA. Single respondents were highest in Regions 7, 10, and on the third
Region V and NCR, respectively.
It is noted, however, that those with live-in partners comes third (6.92%), with
highest in Region 7 and NCR.
Table 8. Distribution of Respondents Who Have Tried Using Drugs
Across Region by Civil Status
Across Region by Highest Educational Attainment In terms of highest educational attainment of those who tried using drugs across
region, a big percentage have reached high school (33.33%), high school graduates
(216 or 16.21%), and those who have reached college (336 or 25%). Respondents
who tried using and have reached high school level were highest in Region 7, National
Capital Region and Region 5.
REGION
Civil Status
Single
Married
Widow/er Separated Live-In Single Parent
Total
f % f % F % f % F % f % F %
CAR 22 1.64 12 0.89 1 0.07 1 0.07 0 0 0 0 36 2.68
CARAGA 52 3.87 34 2.53 2 0.15 3 0.22 3 3 0 0 94 6.99
NCR 49 3.65 47 3.50 4 0.30 11 0.82 21 21 0 0 132 9.82
1 6 0.45 12 0.89 2 0.15 1 0.07 0 0 0 0 21 1.56
2 18 1.34 30 2.23 1 0.07 1 0.07 1 1 0 0 51 3.79
3 34 2.53 19 1.41 0 0.00 3 0.22 6 6 0 0 62 4.61
5 49 3.65 65 4.84 1 0.07 2 0.15 6 6 0 0 123 9.15
6 26 1.93 27 2.01 1 0.07 1 0.07 4 4 2 2 59 4.39
7 153 11.38 142 10.57 3 0.22 12 0.89 34 34 0 0 346 25.74
8 11 0.82 19 1.41 0 0.00 1 0.07 1 1 0 0 32 2.38
9 10 0.74 22 1.64 0 0.00 0 0.00 9 9 0 0 41 3.05
10 79 5.88 48 3.57 4 0.30 6 0.45 2 2 0 0 139 10.34
11 45 3.35 28 2.08 2 0.15 3 0.22 4 4 0 0 82 6.10
12 8 0.60 13 0.97 0 0.00 0 0.00 0 0 0 0 21 1.56
4-A 16 1.19 37 2.75 3 0.22 1 0.07 1 1 1 1 59 4.39
4-B 16 1.19 28 2.08 0 0.00 1 0.07 1 1 0 0 46 3.42
Total 594 44.20 583 43.38 24 1.79 47 3.50 93 93 3 3 1,344 100.00
30
In other levels of education, those who finished high school were highest in
Regions 7, 10, and 5, while those who reached college level were from Regions 7,
NCR and 10, respectively.
Table 9. Dist. of Respondents Who Have Tried Using Drugs Across Region By Educational Attainment
REGION
Highest Educational Attainment
No
Schooling
Elem. Level
Elem.
Graduate
High School Level
High School
Graduate
College Level
College
Graduate
Vocational
Total
F % F % f % F % f % F % f % f % f %
CAR 0 0.00 2 0.15 2 0.15 8 0.60 4 0.30 9 0.67 11 0.82
2
0.15
36 2.68
CARAGA 1 0.07 10 0.74 10 0.74 31 2.31 16 1.19 18 1.34 10 0.74
0.37
94 6.99
NCR
0 0.00 12 0.89 12 0.89 64 4.76 10 0.74 31 2.31 3 0.22
9
0.67
132 9.82
1
0 0.00 2 0.15 2 0.15 8 0.60 3 0.22 5 0.37 0 0.00 2
0.15
21 1.56
2
0 0.00 3 0.22 3 0.22 10 0.74 17 1.26 9 0.67 3 0.22 3
0.22
51 3.79
3
0 0.00 3 0.22 3 0.22 23 1.71 6 0.45 22 1.64 0 0.00 7
0.52
62 4.61
5
0 0.00 15 1.12 15 1.12 39 2.90 27 2.01 24 1.79 12 0.89 1
0.07
123 9.15
6
0 0.00 2 0.15 2 0.15 24 1.79 13 0.97 11 0.82 3 0.22 1
0.07
59 4.39
7
2 0.15 38 0.01 38 2.83 116 8.63 49 3.65 100 7.44 22 1.64 3
0.22
346 25.74
8
0 0.00 10 0.74 10 0.74 4 0.30 7 0.52 5 0.37 6 0.45 0
0.00
32 2.38
9
0 0.00 6 0.45 6 0.45 12 0.89 7 0.52 11 0.82 1 0.07 0
0.00
41 3.05
10
1 0.07 11 0.82 11 0.82 38 2.83 34 2.53 29 2.16 7 0.52 4
0.30
139 10.34
11
0 0.00 6 0.45 6 0.45 30 2.23 12 0.89 26 1.93 5 0.37 0
0.00
82 6.10
12
0 0.00 5 0.37 5 0.37 3 0.22 4 0.30 5 0.37 3 0.22 0
0.00
21 1.56
4-A
0 0.00 5 0.37 5 0.37 22 1.64 9 0.07 18 1.34 2 0.15 1
0.07
59 4.39
4-B
0 0.00 5 0.37 0 0.00 16 1.19 8 0.60 13 0.97 3 0.22 1
0.07
46 3.42
TOTAL 4 0.30 135 7.23 65 9.67 448 33.33 216 16.21 336 25.00 91 6.77
39
2.90
1,344 100.00
31
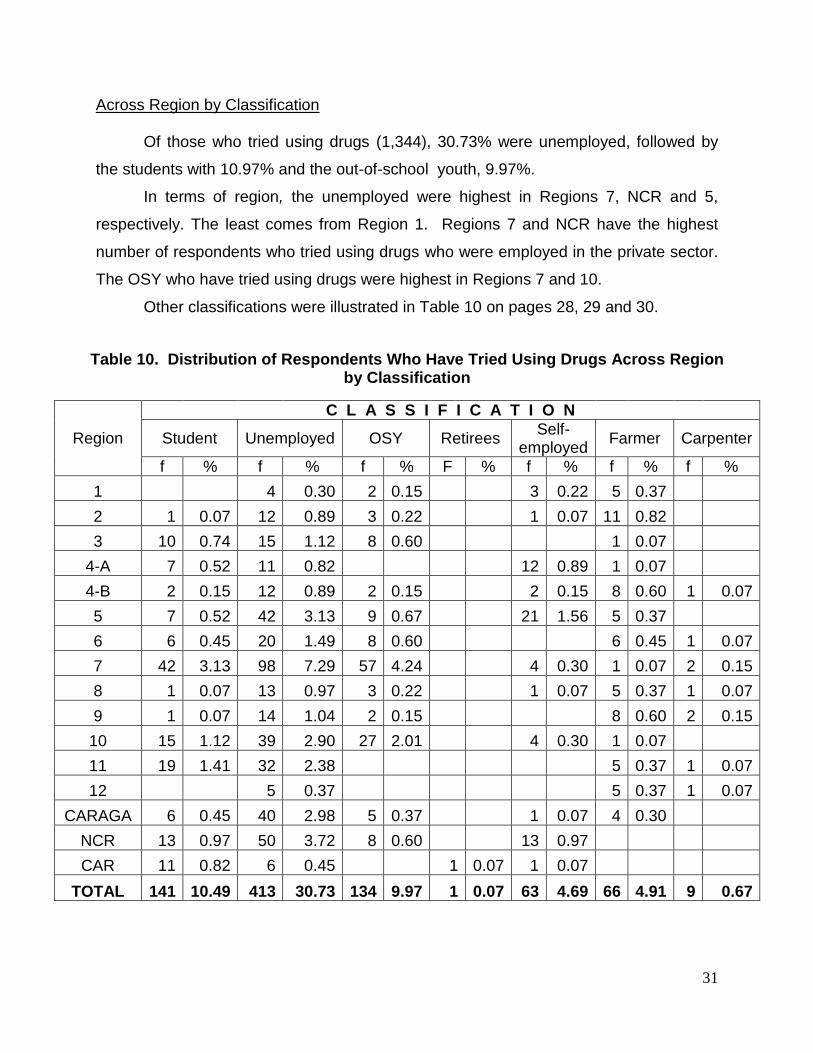
Across Region by Classification
Of those who tried using drugs (1,344), 30.73% were unemployed, followed by
the students with 10.97% and the out-of-school youth, 9.97%.
In terms of region, the unemployed were highest in Regions 7, NCR and 5,
respectively. The least comes from Region 1. Regions 7 and NCR have the highest
number of respondents who tried using drugs who were employed in the private sector.
The OSY who have tried using drugs were highest in Regions 7 and 10.
Other classifications were illustrated in Table 10 on pages 28, 29 and 30.
Table 10. Distribution of Respondents Who Have Tried Using Drugs Across Region by Classification
Region
C L A S S I F I C A T I O N
Student Unemployed OSY Retirees Self-
employed Farmer Carpenter
f % f % f % F % f % f % f %
1 4 0.30 2 0.15 3 0.22 5 0.37
2 1 0.07 12 0.89 3 0.22 1 0.07 11 0.82
3 10 0.74 15 1.12 8 0.60 1 0.07
4-A 7 0.52 11 0.82 12 0.89 1 0.07
4-B 2 0.15 12 0.89 2 0.15 2 0.15 8 0.60 1 0.07
5 7 0.52 42 3.13 9 0.67 21 1.56 5 0.37
6 6 0.45 20 1.49 8 0.60 6 0.45 1 0.07
7 42 3.13 98 7.29 57 4.24 4 0.30 1 0.07 2 0.15
8 1 0.07 13 0.97 3 0.22 1 0.07 5 0.37 1 0.07
9 1 0.07 14 1.04 2 0.15 8 0.60 2 0.15
10 15 1.12 39 2.90 27 2.01 4 0.30 1 0.07
11 19 1.41 32 2.38 5 0.37 1 0.07
12 5 0.37 5 0.37 1 0.07
CARAGA 6 0.45 40 2.98 5 0.37 1 0.07 4 0.30
NCR 13 0.97 50 3.72 8 0.60 13 0.97
CAR 11 0.82 6 0.45 1 0.07 1 0.07
TOTAL 141 10.49 413 30.73 134 9.97 1 0.07 63 4.69 66 4.91 9 0.67
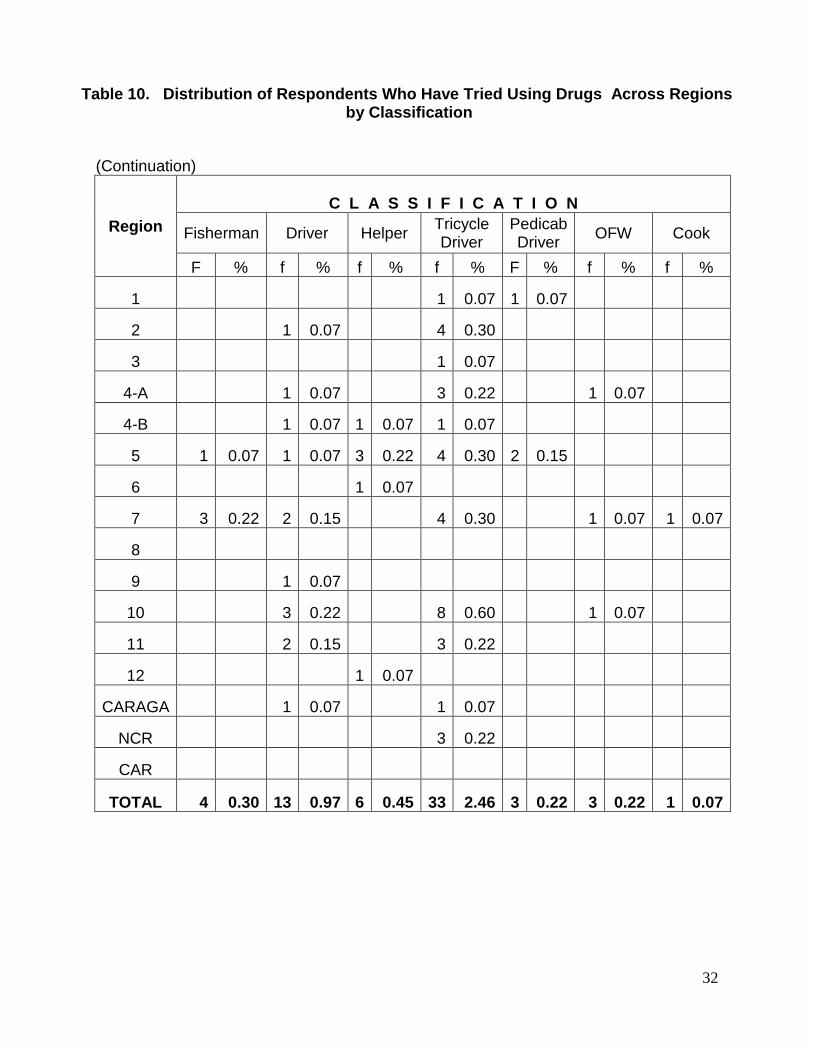
32
(Continuation)
Region
C L A S S I F I C A T I O N
Fisherman Driver Helper Tricycle Driver
Pedicab Driver
OFW Cook
F % f % f % f % F % f % f %
1 1 0.07 1 0.07
2 1 0.07 4 0.30
3 1 0.07
4-A 1 0.07 3 0.22 1 0.07
4-B 1 0.07 1 0.07 1 0.07
5 1 0.07 1 0.07 3 0.22 4 0.30 2 0.15
6 1 0.07
7 3 0.22 2 0.15 4 0.30 1 0.07 1 0.07
8
9 1 0.07
10 3 0.22 8 0.60 1 0.07
11 2 0.15 3 0.22
12 1 0.07
CARAGA 1 0.07 1 0.07
NCR 3 0.22
CAR
TOTAL 4 0.30 13 0.97 6 0.45 33 2.46 3 0.22 3 0.22 1 0.07
Table 10. Distribution of Respondents Who Have Tried Using Drugs Across Regions by Classification
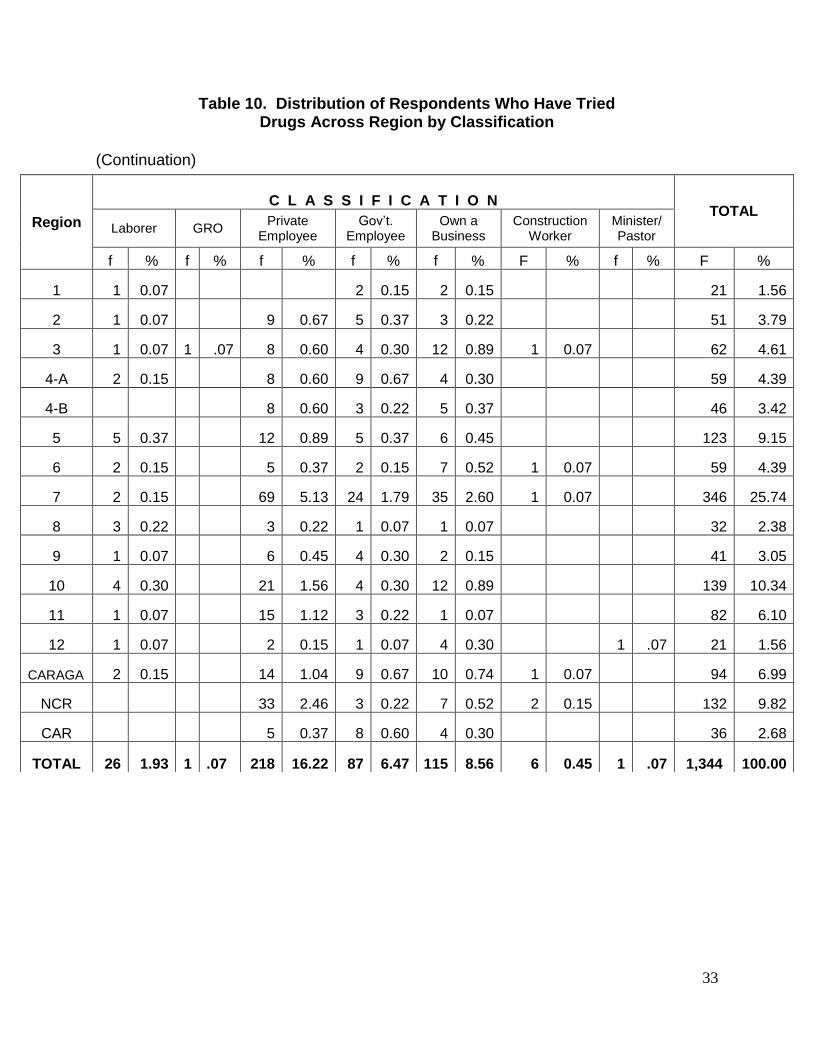
33
(Continuation)
Table 10. Distribution of Respondents Who Have Tried Drugs Across Region by Classification
Region
C L A S S I F I C A T I O N
TOTAL Laborer GRO
Private Employee
Gov‟t. Employee
Own a Business
Construction Worker
Minister/ Pastor
f % f % f % f % f % F % f % F %
1 1 0.07 2 0.15 2 0.15 21 1.56
2 1 0.07 9 0.67 5 0.37 3 0.22 51 3.79
3 1 0.07 1 .07 8 0.60 4 0.30 12 0.89 1 0.07 62 4.61
4-A 2 0.15 8 0.60 9 0.67 4 0.30 59 4.39
4-B 8 0.60 3 0.22 5 0.37 46 3.42
5 5 0.37 12 0.89 5 0.37 6 0.45 123 9.15
6 2 0.15 5 0.37 2 0.15 7 0.52 1 0.07 59 4.39
7 2 0.15 69 5.13 24 1.79 35 2.60 1 0.07 346 25.74
8 3 0.22 3 0.22 1 0.07 1 0.07 32 2.38
9 1 0.07 6 0.45 4 0.30 2 0.15 41 3.05
10 4 0.30 21 1.56 4 0.30 12 0.89 139 10.34
11 1 0.07 15 1.12 3 0.22 1 0.07 82 6.10
12 1 0.07 2 0.15 1 0.07 4 0.30 1 .07 21 1.56
CARAGA 2 0.15 14 1.04 9 0.67 10 0.74 1 0.07 94 6.99
NCR 33 2.46 3 0.22 7 0.52 2 0.15 132 9.82
CAR 5 0.37 8 0.60 4 0.30 36 2.68
TOTAL 26 1.93 1 .07 218 16.22 87 6.47 115 8.56 6 0.45 1 .07 1,344 100.00
34
CURRENT USERS
A. National Findings Across Variable
B. Regional Findings Across Variable
35
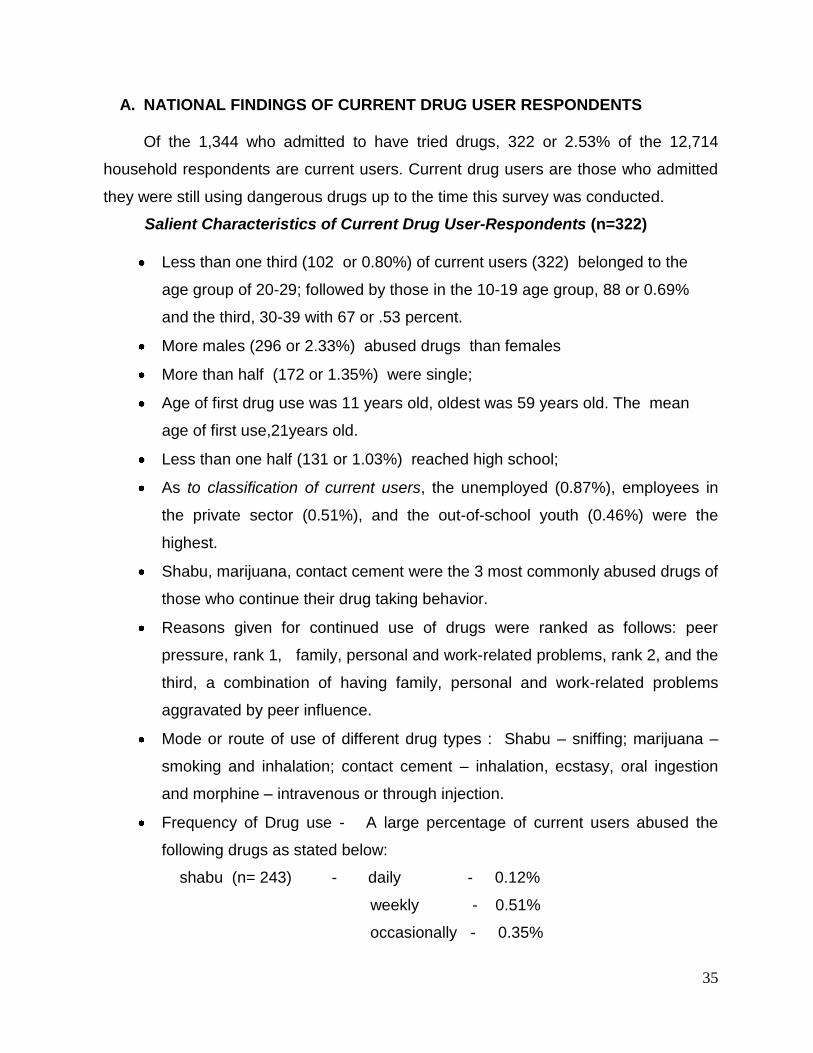
A. NATIONAL FINDINGS OF CURRENT DRUG USER RESPONDENTS
Of the 1,344 who admitted to have tried drugs, 322 or 2.53% of the 12,714
household respondents are current users. Current drug users are those who admitted
they were still using dangerous drugs up to the time this survey was conducted.
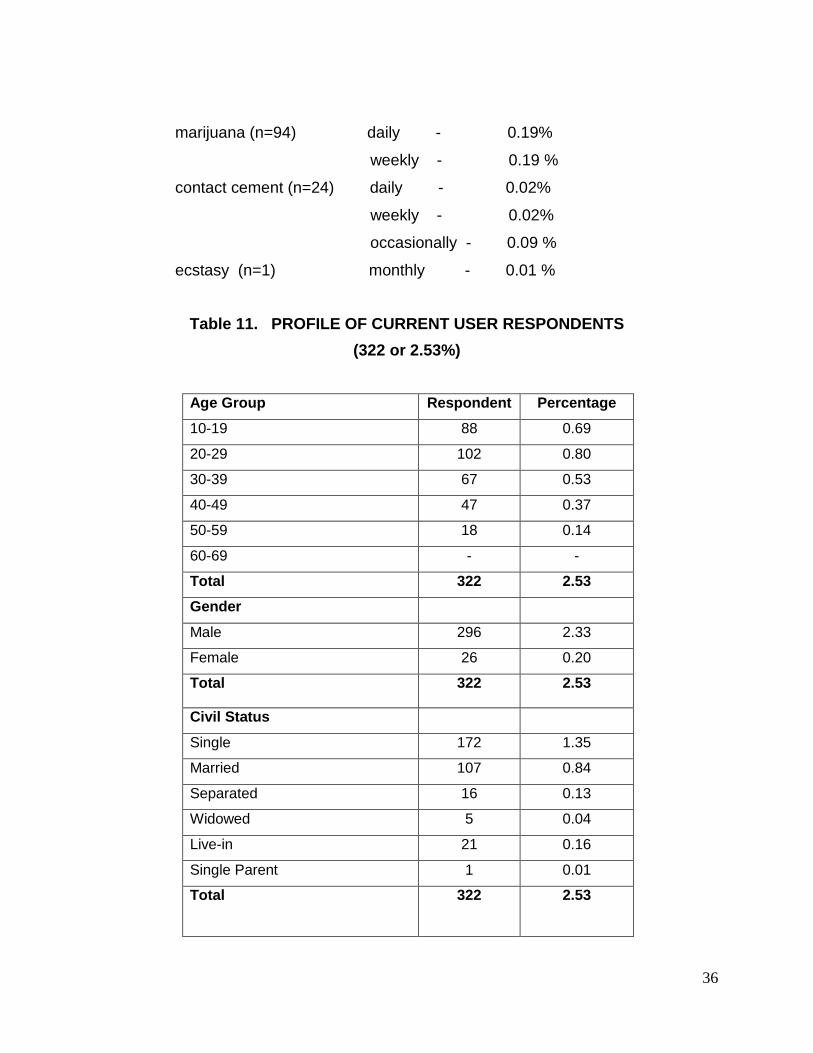
Salient Characteristics of Current Drug User-Respondents (n=322)
Less than one third (102 or 0.80%) of current users (322) belonged to the
age group of 20-29; followed by those in the 10-19 age group, 88 or 0.69%
and the third, 30-39 with 67 or .53 percent.
More males (296 or 2.33%) abused drugs than females
More than half (172 or 1.35%) were single;
Age of first drug use was 11 years old, oldest was 59 years old. The mean
age of first use,21years old.
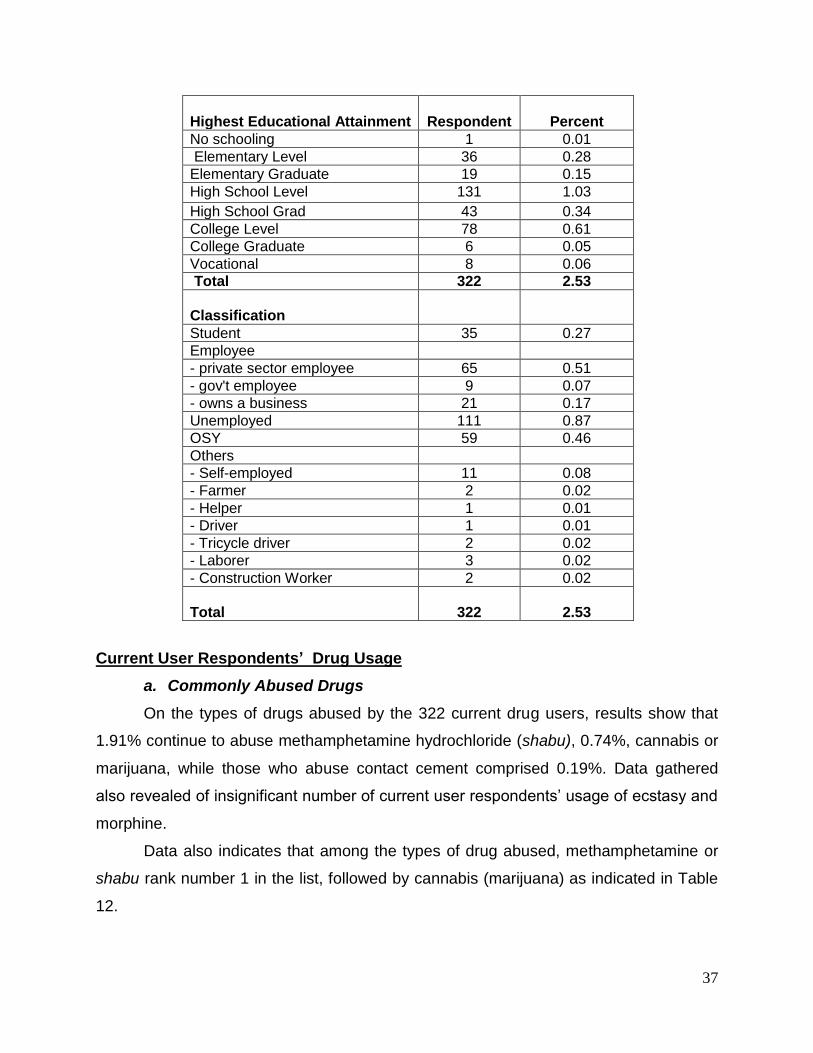
Less than one half (131 or 1.03%) reached high school;
As to classification of current users, the unemployed (0.87%), employees in
the private sector (0.51%), and the out-of-school youth (0.46%) were the
highest.
Shabu, marijuana, contact cement were the 3 most commonly abused drugs of
those who continue their drug taking behavior.
Reasons given for continued use of drugs were ranked as follows: peer
pressure, rank 1, family, personal and work-related problems, rank 2, and the
third, a combination of having family, personal and work-related problems
aggravated by peer influence.
Mode or route of use of different drug types : Shabu – sniffing; marijuana –
smoking and inhalation; contact cement – inhalation, ecstasy, oral ingestion
and morphine – intravenous or through injection.
Frequency of Drug use - A large percentage of current users abused the
following drugs as stated below:
shabu (n= 243) - daily - 0.12%
weekly - 0.51%
occasionally - 0.35%
36
marijuana (n=94) daily - 0.19%
weekly - 0.19 %
contact cement (n=24) daily - 0.02%
weekly - 0.02%
occasionally - 0.09 %
ecstasy (n=1) monthly - 0.01 %
Table 11. PROFILE OF CURRENT USER RESPONDENTS
(322 or 2.53%)
Age Group Respondent Percentage
10-19 88 0.69
20-29 102 0.80
30-39 67 0.53
40-49 47 0.37
50-59 18 0.14
60-69 - -
Total 322 2.53
Gender
Male 296 2.33
Female 26 0.20
Total 322 2.53
Civil Status
Single 172 1.35
Married 107 0.84
Separated 16 0.13
Widowed 5 0.04
Live-in 21 0.16
Single Parent 1 0.01
Total
322 2.53
37
Highest Educational Attainment
Respondent
Percent
No schooling 1 0.01
Elementary Level 36 0.28
Elementary Graduate 19 0.15
High School Level 131 1.03
High School Grad 43 0.34
College Level 78 0.61
College Graduate 6 0.05
Vocational 8 0.06
Total 322 2.53
Classification
Student 35 0.27
Employee
- private sector employee 65 0.51
- gov't employee 9 0.07
- owns a business 21 0.17
Unemployed 111 0.87
OSY 59 0.46
Others
- Self-employed 11 0.08
- Farmer 2 0.02
- Helper 1 0.01
- Driver 1 0.01
- Tricycle driver 2 0.02
- Laborer 3 0.02
- Construction Worker 2 0.02
Total
322
2.53
Current User Respondents’ Drug Usage
a. Commonly Abused Drugs
On the types of drugs abused by the 322 current drug users, results show that
1.91% continue to abuse methamphetamine hydrochloride (shabu), 0.74%, cannabis or
marijuana, while those who abuse contact cement comprised 0.19%. Data gathered
also revealed of insignificant number of current user respondents‟ usage of ecstasy and
morphine.
Data also indicates that among the types of drug abused, methamphetamine or
shabu rank number 1 in the list, followed by cannabis (marijuana) as indicated in Table
12.
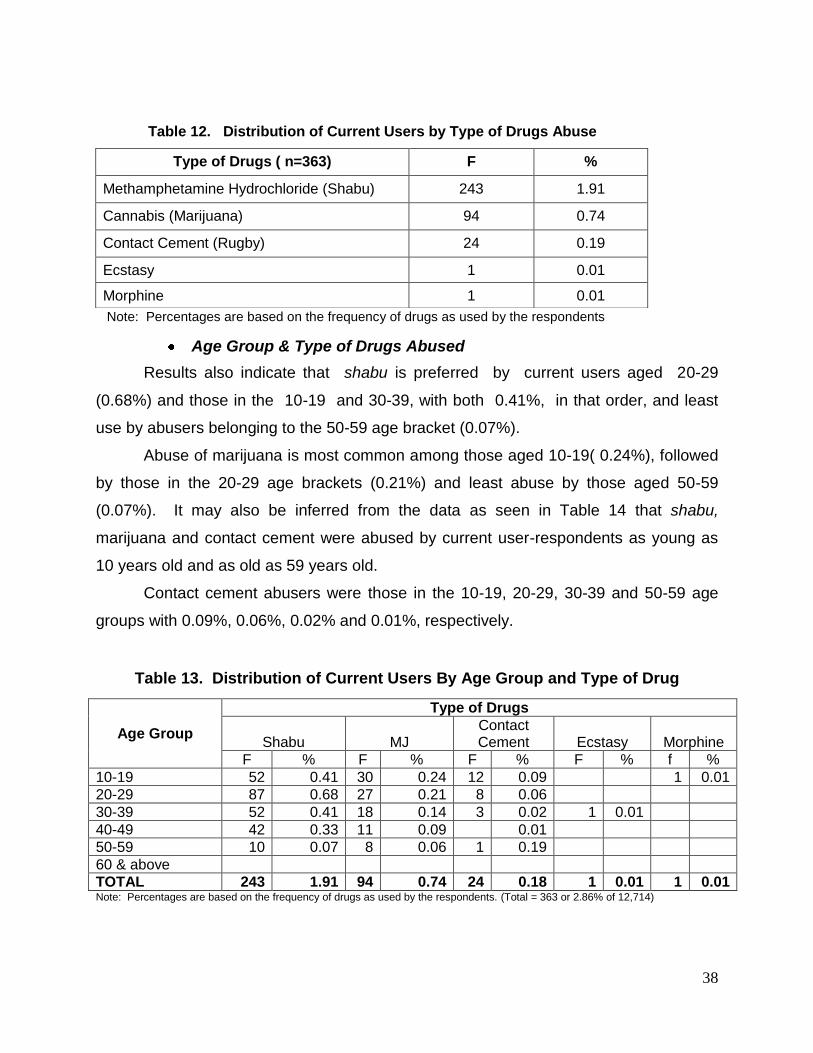
38
Table 12. Distribution of Current Users by Type of Drugs Abuse
Note: Percentages are based on the frequency of drugs as used by the respondents
Age Group & Type of Drugs Abused
Results also indicate that shabu is preferred by current users aged 20-29
(0.68%) and those in the 10-19 and 30-39, with both 0.41%, in that order, and least
use by abusers belonging to the 50-59 age bracket (0.07%).
Abuse of marijuana is most common among those aged 10-19( 0.24%), followed
by those in the 20-29 age brackets (0.21%) and least abuse by those aged 50-59
(0.07%). It may also be inferred from the data as seen in Table 14 that shabu,
marijuana and contact cement were abused by current user-respondents as young as
10 years old and as old as 59 years old.
Contact cement abusers were those in the 10-19, 20-29, 30-39 and 50-59 age
groups with 0.09%, 0.06%, 0.02% and 0.01%, respectively.
Table 13. Distribution of Current Users By Age Group and Type of Drug
Note: Percentages are based on the frequency of drugs as used by the respondents. (Total = 363 or 2.86% of 12,714)
Type of Drugs ( n=363) F %
Methamphetamine Hydrochloride (Shabu) 243 1.91
Cannabis (Marijuana) 94 0.74
Contact Cement (Rugby) 24 0.19
Ecstasy 1 0.01
Morphine 1 0.01
Age Group
Type of Drugs
Shabu MJ Contact Cement Ecstasy Morphine
F % F % F % F % f %
10-19 52 0.41 30 0.24 12 0.09 1 0.01
20-29 87 0.68 27 0.21 8 0.06
30-39 52 0.41 18 0.14 3 0.02 1 0.01
40-49 42 0.33 11 0.09 0.01
50-59 10 0.07 8 0.06 1 0.19
60 & above
TOTAL 243 1.91 94 0.74 24 0.18 1 0.01 1 0.01
39
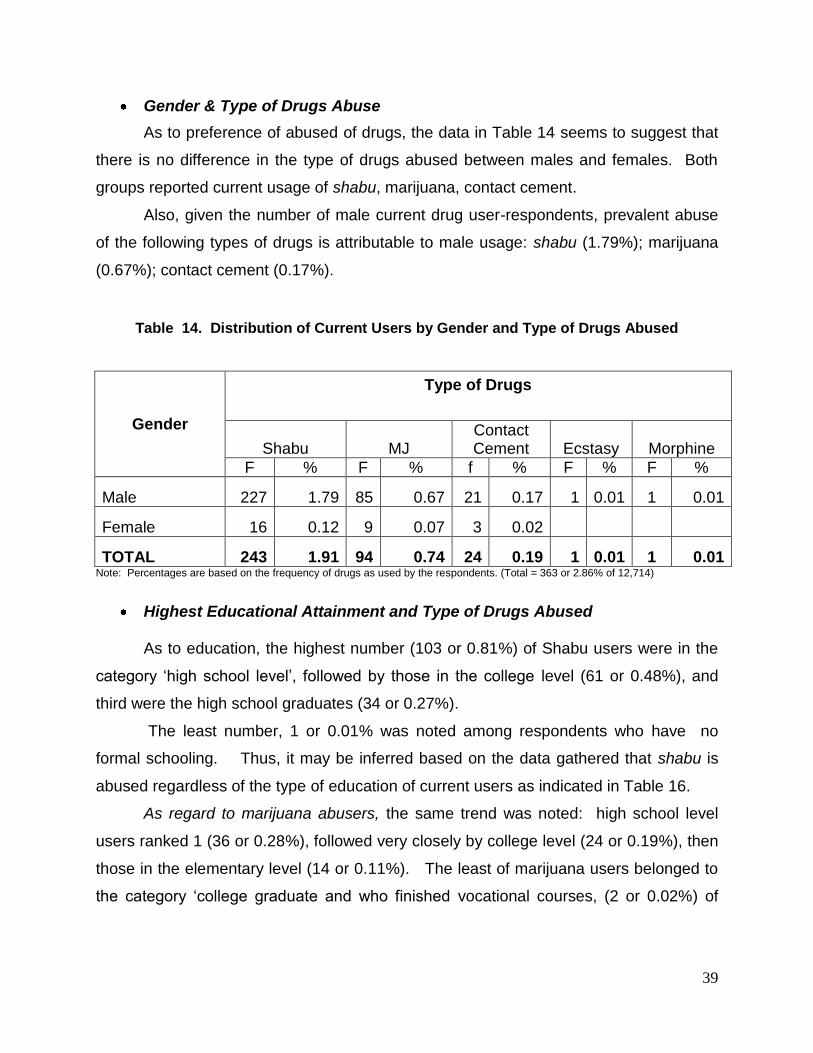
Gender & Type of Drugs Abuse
As to preference of abused of drugs, the data in Table 14 seems to suggest that
there is no difference in the type of drugs abused between males and females. Both
groups reported current usage of shabu, marijuana, contact cement.
Also, given the number of male current drug user-respondents, prevalent abuse
of the following types of drugs is attributable to male usage: shabu (1.79%); marijuana
(0.67%); contact cement (0.17%).
Table 14. Distribution of Current Users by Gender and Type of Drugs Abused
Gender
Type of Drugs
Shabu MJ Contact Cement Ecstasy Morphine
F % F % f % F % F %
Male 227 1.79 85 0.67 21 0.17 1 0.01 1 0.01
Female 16 0.12 9 0.07 3 0.02
TOTAL 243 1.91 94 0.74 24 0.19 1 0.01 1 0.01 Note: Percentages are based on the frequency of drugs as used by the respondents. (Total = 363 or 2.86% of 12,714)
Highest Educational Attainment and Type of Drugs Abused
As to education, the highest number (103 or 0.81%) of Shabu users were in the
category „high school level‟, followed by those in the college level (61 or 0.48%), and
third were the high school graduates (34 or 0.27%).
The least number, 1 or 0.01% was noted among respondents who have no
formal schooling. Thus, it may be inferred based on the data gathered that shabu is
abused regardless of the type of education of current users as indicated in Table 16.
As regard to marijuana abusers, the same trend was noted: high school level
users ranked 1 (36 or 0.28%), followed very closely by college level (24 or 0.19%), then
those in the elementary level (14 or 0.11%). The least of marijuana users belonged to
the category „college graduate and who finished vocational courses, (2 or 0.02%) of
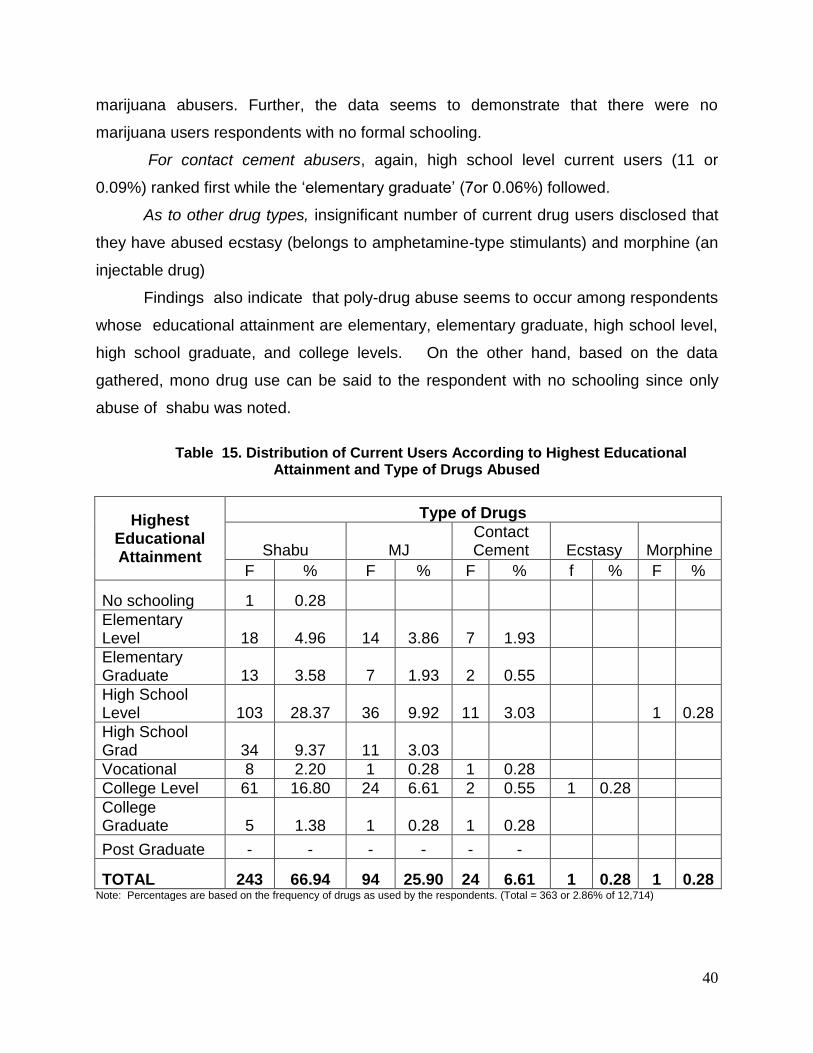
40
marijuana abusers. Further, the data seems to demonstrate that there were no
marijuana users respondents with no formal schooling.
For contact cement abusers, again, high school level current users (11 or
0.09%) ranked first while the „elementary graduate‟ (7or 0.06%) followed.
As to other drug types, insignificant number of current drug users disclosed that
they have abused ecstasy (belongs to amphetamine-type stimulants) and morphine (an
injectable drug)
Findings also indicate that poly-drug abuse seems to occur among respondents
whose educational attainment are elementary, elementary graduate, high school level,
high school graduate, and college levels. On the other hand, based on the data
gathered, mono drug use can be said to the respondent with no schooling since only
abuse of shabu was noted.
Table 15. Distribution of Current Users According to Highest Educational
Attainment and Type of Drugs Abused
Highest Educational Attainment
Type of Drugs
Shabu MJ Contact Cement Ecstasy Morphine
F % F % F % f % F %
No schooling 1 0.28
Elementary Level 18 4.96 14 3.86 7 1.93
Elementary Graduate 13 3.58 7 1.93 2 0.55
High School Level 103 28.37 36 9.92 11 3.03 1 0.28
High School Grad 34 9.37 11 3.03
Vocational 8 2.20 1 0.28 1 0.28
College Level 61 16.80 24 6.61 2 0.55 1 0.28
College Graduate 5 1.38 1 0.28 1 0.28
Post Graduate - - - - - -
TOTAL 243 66.94 94 25.90 24 6.61 1 0.28 1 0.28 Note: Percentages are based on the frequency of drugs as used by the respondents. (Total = 363 or 2.86% of 12,714)
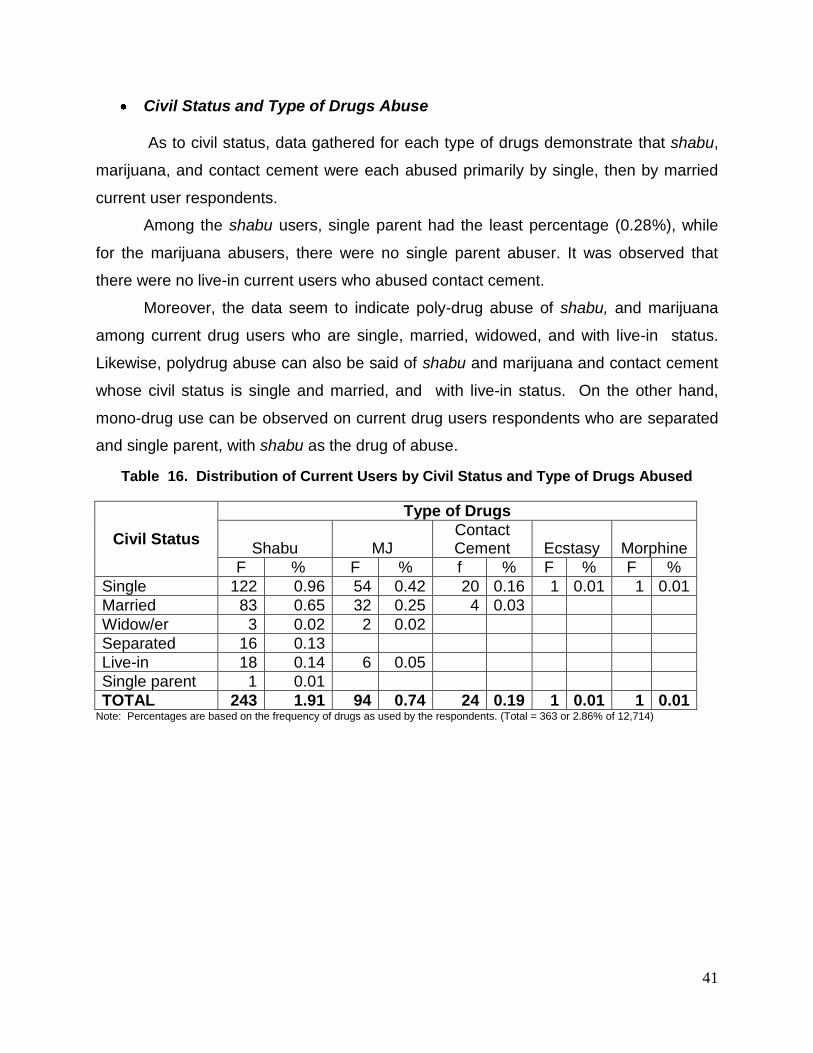
41
Civil Status and Type of Drugs Abuse
As to civil status, data gathered for each type of drugs demonstrate that shabu,
marijuana, and contact cement were each abused primarily by single, then by married
current user respondents.
Among the shabu users, single parent had the least percentage (0.28%), while
for the marijuana abusers, there were no single parent abuser. It was observed that
there were no live-in current users who abused contact cement.
Moreover, the data seem to indicate poly-drug abuse of shabu, and marijuana
among current drug users who are single, married, widowed, and with live-in status.
Likewise, polydrug abuse can also be said of shabu and marijuana and contact cement
whose civil status is single and married, and with live-in status. On the other hand,
mono-drug use can be observed on current drug users respondents who are separated
and single parent, with shabu as the drug of abuse.
Table 16. Distribution of Current Users by Civil Status and Type of Drugs Abused
Civil Status
Type of Drugs
Shabu MJ Contact Cement Ecstasy Morphine
F % F % f % F % F %
Single 122 0.96 54 0.42 20 0.16 1 0.01 1 0.01
Married 83 0.65 32 0.25 4 0.03
Widow/er 3 0.02 2 0.02
Separated 16 0.13
Live-in 18 0.14 6 0.05
Single parent 1 0.01
TOTAL 243 1.91 94 0.74 24 0.19 1 0.01 1 0.01 Note: Percentages are based on the frequency of drugs as used by the respondents. (Total = 363 or 2.86% of 12,714)
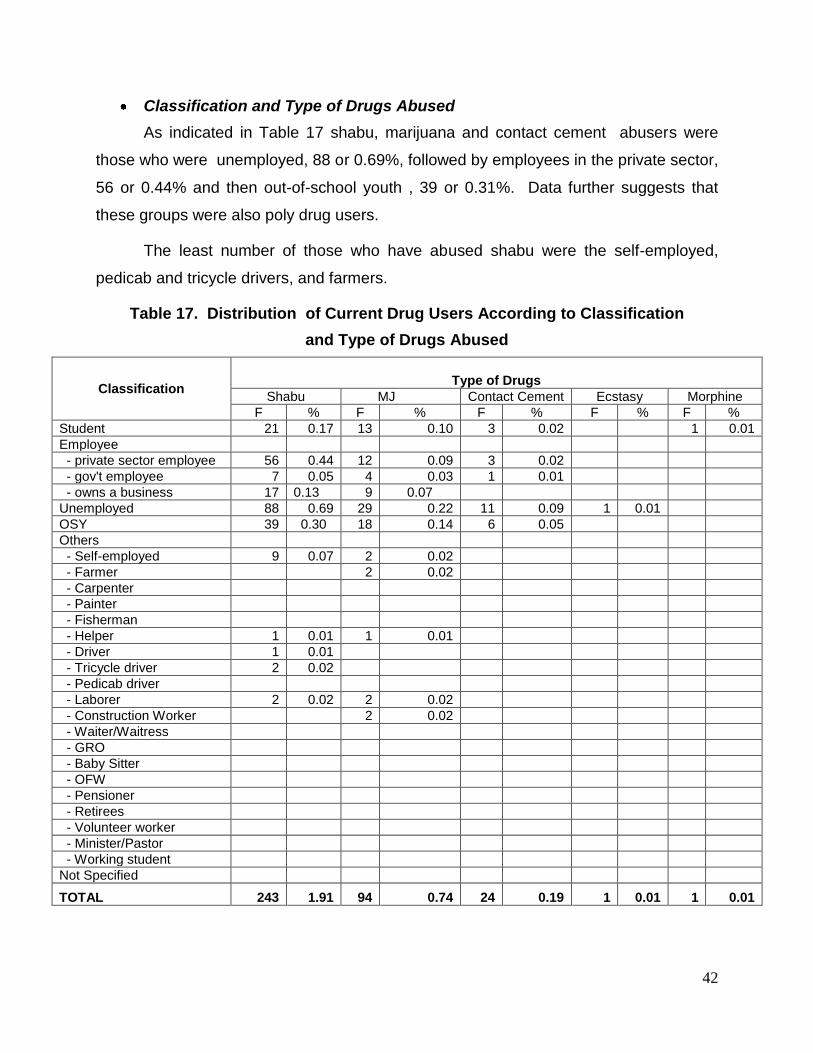
42
Classification and Type of Drugs Abused
As indicated in Table 17 shabu, marijuana and contact cement abusers were
those who were unemployed, 88 or 0.69%, followed by employees in the private sector,
56 or 0.44% and then out-of-school youth , 39 or 0.31%. Data further suggests that
these groups were also poly drug users.
The least number of those who have abused shabu were the self-employed,
pedicab and tricycle drivers, and farmers.
Table 17. Distribution of Current Drug Users According to Classification
and Type of Drugs Abused
Classification
Type of Drugs
Shabu MJ Contact Cement Ecstasy Morphine
F % F % F % F % F %
Student 21 0.17 13 0.10 3 0.02 1 0.01
Employee
- private sector employee 56 0.44 12 0.09 3 0.02
- gov't employee 7 0.05 4 0.03 1 0.01
- owns a business 17 0.13 9 0.07
Unemployed 88 0.69 29 0.22 11 0.09 1 0.01
OSY 39 0.30 18 0.14 6 0.05
Others
- Self-employed 9 0.07 2 0.02
- Farmer 2 0.02
- Carpenter
- Painter
- Fisherman
- Helper 1 0.01 1 0.01
- Driver 1 0.01
- Tricycle driver 2 0.02
- Pedicab driver
- Laborer 2 0.02 2 0.02
- Construction Worker 2 0.02
- Waiter/Waitress
- GRO
- Baby Sitter
- OFW
- Pensioner
- Retirees
- Volunteer worker
- Minister/Pastor
- Working student
Not Specified
TOTAL 243 1.91 94 0.74 24 0.19 1 0.01 1 0.01
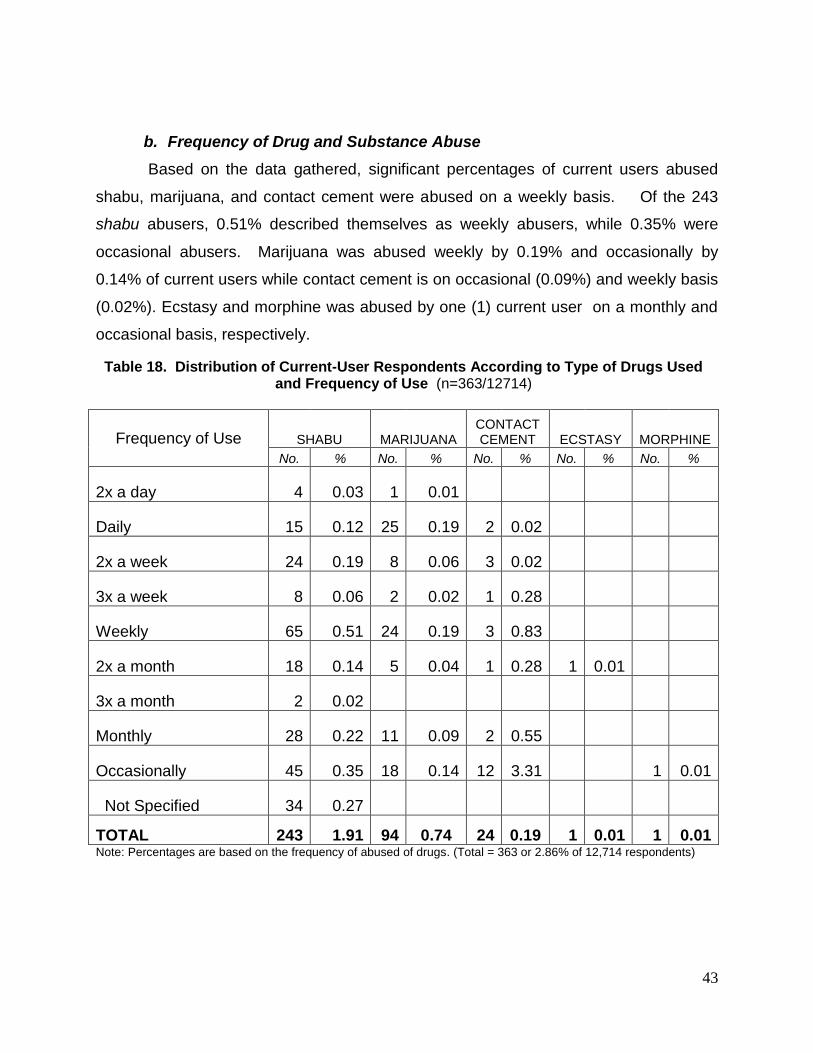
43
b. Frequency of Drug and Substance Abuse
Based on the data gathered, significant percentages of current users abused
shabu, marijuana, and contact cement were abused on a weekly basis. Of the 243
shabu abusers, 0.51% described themselves as weekly abusers, while 0.35% were
occasional abusers. Marijuana was abused weekly by 0.19% and occasionally by
0.14% of current users while contact cement is on occasional (0.09%) and weekly basis
(0.02%). Ecstasy and morphine was abused by one (1) current user on a monthly and
occasional basis, respectively.
Note: Percentages are based on the frequency of abused of drugs. (Total = 363 or 2.86% of 12,714 respondents)
Table 18. Distribution of Current-User Respondents According to Type of Drugs Used and Frequency of Use (n=363/12714)
Frequency of Use SHABU MARIJUANA CONTACT CEMENT ECSTASY MORPHINE
No. % No. % No. % No. % No. %
2x a day 4 0.03 1 0.01
Daily 15 0.12 25 0.19 2 0.02
2x a week 24 0.19 8 0.06 3 0.02
3x a week 8 0.06 2 0.02 1 0.28
Weekly 65 0.51 24 0.19 3 0.83
2x a month 18 0.14 5 0.04 1 0.28 1 0.01
3x a month 2 0.02
Monthly 28 0.22 11 0.09 2 0.55
Occasionally 45 0.35 18 0.14 12 3.31 1 0.01
Not Specified 34 0.27
TOTAL 243 1.91 94 0.74 24 0.19 1 0.01 1 0.01
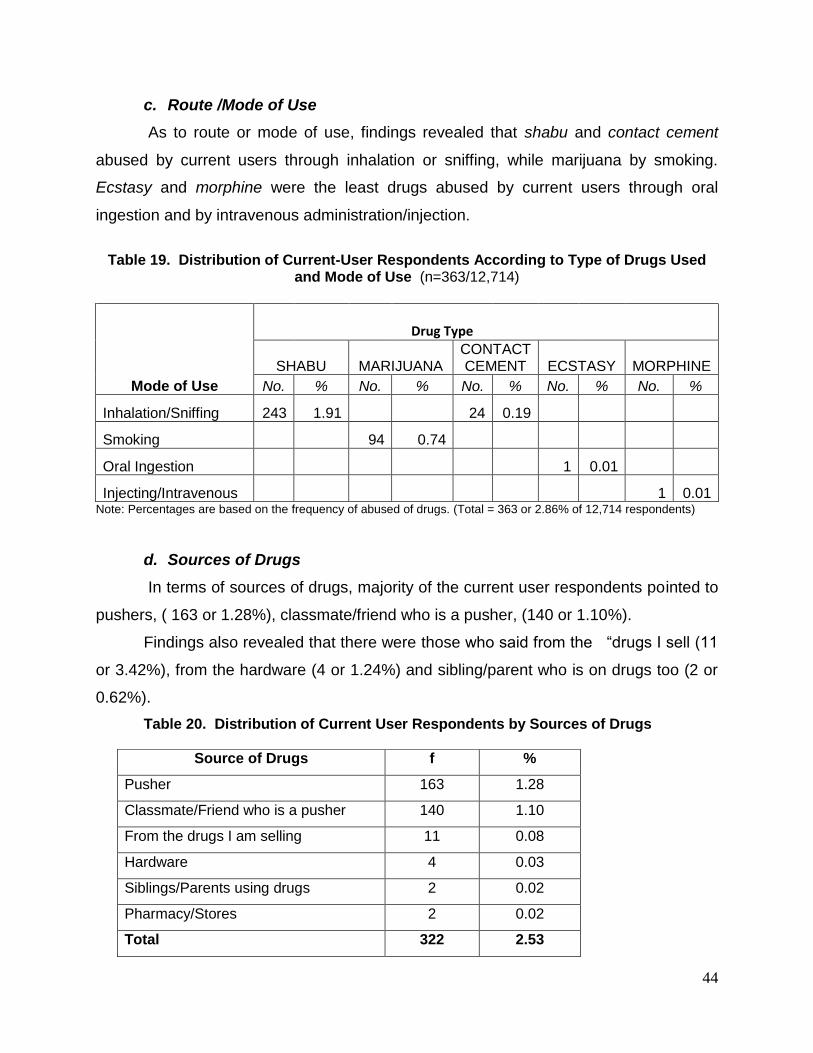
44
c. Route /Mode of Use
As to route or mode of use, findings revealed that shabu and contact cement
abused by current users through inhalation or sniffing, while marijuana by smoking.
Ecstasy and morphine were the least drugs abused by current users through oral
ingestion and by intravenous administration/injection.
Table 19. Distribution of Current-User Respondents According to Type of Drugs Used
and Mode of Use (n=363/12,714)
Mode of Use
Drug Type
SHABU MARIJUANA CONTACT CEMENT ECSTASY MORPHINE
No. % No. % No. % No. % No. %
Inhalation/Sniffing 243 1.91 24 0.19
Smoking 94 0.74
Oral Ingestion 1 0.01
Injecting/Intravenous 1 0.01 Note: Percentages are based on the frequency of abused of drugs. (Total = 363 or 2.86% of 12,714 respondents)
d. Sources of Drugs
In terms of sources of drugs, majority of the current user respondents pointed to
pushers, ( 163 or 1.28%), classmate/friend who is a pusher, (140 or 1.10%).
Findings also revealed that there were those who said from the “drugs I sell (11
or 3.42%), from the hardware (4 or 1.24%) and sibling/parent who is on drugs too (2 or
0.62%).
Table 20. Distribution of Current User Respondents by Sources of Drugs
Source of Drugs f %
Pusher 163 1.28
Classmate/Friend who is a pusher 140 1.10
From the drugs I am selling 11 0.08
Hardware 4 0.03
Siblings/Parents using drugs 2 0.02
Pharmacy/Stores 2 0.02
Total 322 2.53
45
e. Amount Spent per Drug Intake
As to amount spent per drug type abused, the current user-respondents gave the
following information on the minimum, average and maximum amount spent per drug
intake. For shabu, the minimum was P100, while the average is P445, the maximum
was P6,000 per intake. The amount spent for other drug types is seen on Table.
Table 21. Current User Respondents’ Minimum, Average and Maximum Amount Spent Per Drug Intake By Drug Type
Drug Type Minimum Average Maximum
Methamphetamine(Shabu) P100.00 P455.00 P6,000.00
Cannabis P5.00 P36.00 P300.00
Contact Cement P 30.00 P10.00 P100.00
B. REGIONAL FINDINGS OF CURRENT USERS ACROSS VARIABLES
Significant Regional Findings
Regions VII (146 or 1.15%), Region X (48 or 0.38%) and NCR (31 or 0.24%), respectively, have the highest number of current users
As the region were represented by 40% of its provinces, the highest number of current users came from Cebu province in Region 7, with 127 current users or 1.90%, followed by Lanao del Norte (48 or 0.38%). The least number current user respondents was in Quirino province in Region 2, with 2 or 0.2%
In the National Capital Region, the highest number of current users came from Quezon City, (24 or 0.19%).
As evidenced by the data gathered, no current users were interviewed in Regions 1, 4-B and 12. However, those who have tried using drugs in these regions mentioned, Regions 1(21or 0.17% ), 4-B (46 or 0.36%) and 12 (21 or 0.17%) have stopped using drugs at the time of the survey. Findings do not also conclude that there are no current users in these regions.
As to gender by region and province, results show that there were more male current user respondents than female. The highest numbers of male current user respondents interviewed were from Cebu Province in Region VII, Lanao Del Norte in Region X, and in Compostela Valley in Region XII as shown on Table 22.
46
Table 22. Distribution of Current Users by Region
Region
Current Users
Percentage
Region I - -
Region II 2 0.02
Region III 4 0.03
Region IV-A 6 0.05
Region IV-B
Region V 19 0.15
Region VI 14 0.11
Region VII 146 1.14
Region VIII 3 0.02
Region IX 6 0.05
Region X 48 0.38
Region XI 24 0.19
Region XII
CARAGA 17 0.13
NCR 31 0.24
CAR 2 0.02
TOTAL 322 2.53
Current Users Across Region and Province by Gender
As to gender by region and province, results show that there were more male
current user respondents than female. The highest numbers of male current user
respondents were interviewed in Cebu Province in Region VII, Lanao Del Norte in
Region X, and in Compostela Valley in Region XII.
In terms of province, results illustrate that the highest number of current users
came from Cebu Province (127 or 1%) in Region VII, followed by Lanao del Norte (46 or
0.36 %) in Region X. Again, as in the national level, there were more males who
continue to abuse drugs (current users) in the provinces than females.
Moreover, male current users were highest in the municipalities of San Remigio
and Sibonga in Province in Region VII, Baloi in Region 10 and Monkayo, Compostela
Valley in Region XI. In Metro Manila, highest number of current users came from
Quezon City with 24 or 0.19%.
47
Table 23. Distribution of Current Drug User-Respondents Across Region/Province and City/Municipality by Gender(n=322)
Region Province City/Municipality
G e n d e r
Total Male Female
F % f % F %
2 QUIRINO Cabarroguis 2 0.02 2 0.02
3
PAMPANGA Lubao 2 0.02 2 0.02
ZAMBALES Botolan 1 0.01 1 0.01 2 0.02
Sub Total 3 0.02 1 0.01 4 0.02
40-A
QUEZON Atimonan 2 0.02 2 0.02
Lucena City 1 0.01 1 0.01
Real 3 0.02 3 0.02
Sub Total 6 0.05 6 0.05
5
CAMARINES SUR Libmanan 1 0.01 1 0.01
Ocampo 5 0.04 5 0.04
Tinambac 4 0.03 1 0.01 5 0.04
SORSOGON Irosin 1 0.01 1 0.01
Sorsogon 6 0.05 1 0.31 7 0.06
Sub Total 17 5.28 2 0.62 19 0.15
6
ILOILO Iloilo 4 0.03 4 0.03
Janiuay 3 0.02 2 0.02 5 0.04
Jaro 3 0.02 3 0.02
Oton 2 0.02 2 0.02
Sub Total 12 0.09 2 0.02 14 0.10
48
7
CEBU Aloguinsan 7 0.06 7 0.06
Carmen 14 0.10 2 0.02 16 0.11
San Remegio 76 0.59 5 0.04 81 0.64
Sibonga 22 0.17 1 0.01 23 0.18
NEGROS ORIENTAL Dumaguete City 6 0.05 1 0.01 7 0.06
Manjuyod 9 0.07 9 0.07
Sibulan 3 0.02 3 0.02
Sub Total 137 1.08 9 0.07 146 1.15
8
WESTERN SAMAR Calbayog City 1 0.01 1 0.01
Gandara 1 0.01 1 0.01
Sta. Margarita 1 0.01 1 0.01
Sub Total 3 0.02 3 0.02
49
9
ZAMBOANGA DEL NORTE
Dapitan City 4 0.04 4 0.04
Pres. Manuel A. Roxas 1 0.01 1 0.01
Sergio Osmena 1 0.01 1 0.01
Sub Total 5 0.05 1 0.31 6 0.05
10
CAMIGUIN Mambajao 2 0.02 2 0.02
LANAO DEL NORTE
Bacolod 1 0.01 1 0.01
Baloi 38 0.29 38 0.29
Iligan City 7 0.06 7 0.06
Sub Total 48 0.37 48 0.37
11 COMPOSTELA VALLEY Monkayo 21 0.17 3 0.02 24 0.17
CARAGA
AGUSAN DEL SUR Prosperidad 1 0.02 1 0.02 2 0.02
SURIGAO DEL NORTE
Placer 2 0.02 2 0.02
Sison 11 0.09 11 0.09
Surigao City 2 0.02 2 0.02
Sub Total 16 0.13 1 0.01 17 0.13
NCR
METRO MANILA
Malabon 2 0.02 1 0.01 3 0.02
Marikina 1 0.01 1 0.01
Pasay 2 0.02 1 0.01 3 0.02
Quezon City 20 0.16 4 0.03 24 0.19
Sub Total 24 0.19 7 0.06 31 0.24
CAR KALINGA Tabuk 2 0.02 2 0.02
TOTAL 296 2.33 26 0.20 322 2.53
50
Regional Findings on Type of Drugs Abuse
The data on type of drugs abused were subjected to further statistical treatment
and were cross tabulated with other variables under study namely: by region, age,
gender, civil status, highest educational attainment, and classification of current users.
With regards to dangerous drugs and substances continuously abused across
region by current user respondents, findings show that four (4) types of drugs - shabu,
marijuana, contact cement, ecstasy or morphine are being abused in Region 7 and 11,
while Region 3, and 4-A, suggests that of shabu, marijuana and contact cement.
As regards to highest number of shabu abusers, Region 7 has the highest
percentage (0.92%), followed by Region 10 with 0.34% and the National Capital
Region, 0.21%. The least number (1 or 0.01%) of shabu usage is from CAR.
Cannabis (marijuana) users were prevalent again in Region 7, with 0.28%,
followed by Region 6 and 11, both with 0.08%. Regions 3, 4-A and CAR have the least
number (0.01%) of marijuana abusers.
Among the regions which reported some use of contact cement, CARAGA has 9
(0.07%) respondents, followed by Region 7, with 7 or 0.05%. The least number is
Region 9, with 1 or 0.01%.
a. Commonly Abused Drugs Across Region
Regions 4-A, 7, 10, 12, CARAGA, and NCR, with Regions 7 and 10 were noted
to have incidence of abuse of shabu, marijuana and contact cement.
As evidenced by the data presented in Table 27, findings reveal that current
drug user respondents in Regions 3, 4-A, 5,6,7,8,9,10, 11, CARAGA, NCR and CAR
are seemingly poly-drug abusers. Mono drug usage of one drug type (marijuana) was
noted in Region 2 and also the region with the least number of current user respondents
(2 or 0.02%).
51
Table 24. Distribution of Current Users According to Drugs of Abuse by Region
Region
Type of Drugs ( n=363)
Shabu MJ Contact Cement Ecstasy Morphine
F % F % f % F % f %
1
2 2 0.02
3 4 0.03 1 0.01
4-A 5 0.04 1 0.01
4-B
5 13 0.10 8 0.06
6 7 0.06 11 0.09
7 117 0.92 35 0.27 7 0.06 1 0.01
8 1 0.01 2 0.02
9 3 0.02 3 0.02 1 0.01
10 43 0.34 3 0.02 3 0.02
11 11 0.09 11 0.09 2 0.02 1 0.01
12
CARAGA 11 0.09 13 0.10 9 0.07
NCR 27 0.21 3 0.02 2 0.02
CAR 1 0.01 1 0.01
TOTAL 243 1.91 94 0.74 24 0.19 1 0.01 1 0.01 Note: Percentages are based on the frequency of drugs as used by the respondents.
Drug of Abuse by Age Group and Gender Across Region
As to age group and gender across region, current user respondents in Regions
5,6,7, 10 and NCR were identified between the ages 10-59 years old and were
predominantly males. Data also suggests of poly drug abuse in these regions as
respondents admitted to have continuously abused shabu, marijuana and contact
cement.
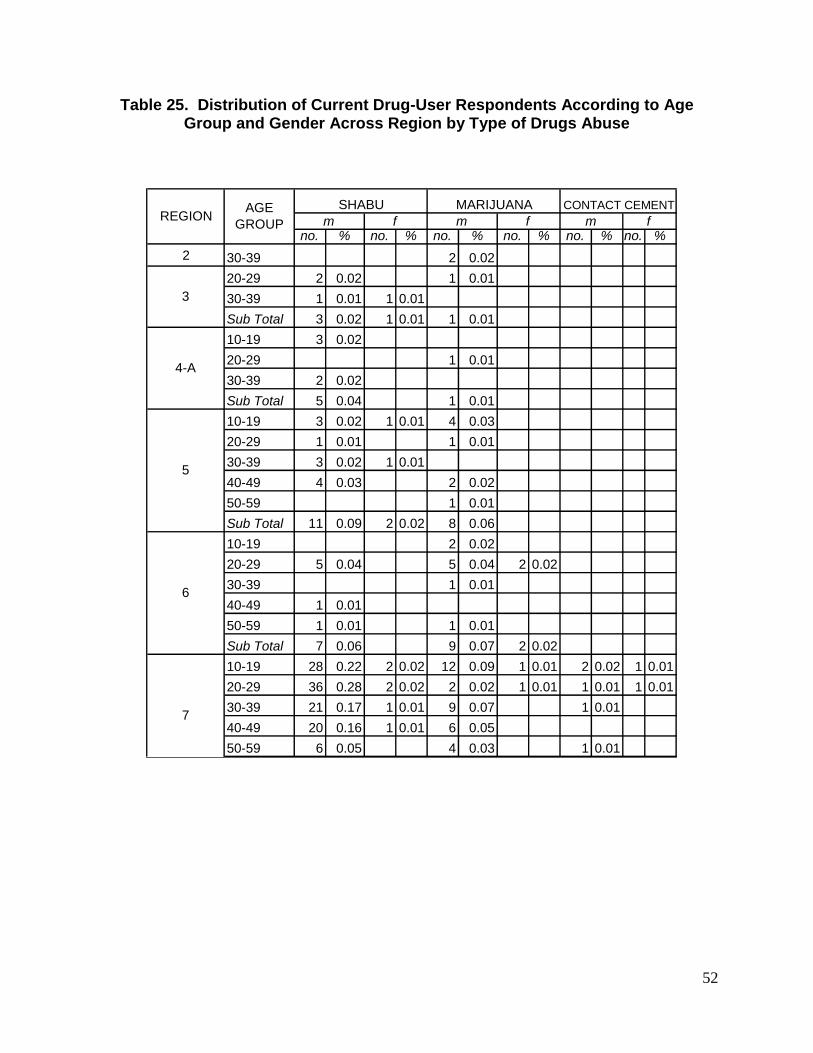
52
Table 25. Distribution of Current Drug-User Respondents According to Age Group and Gender Across Region by Type of Drugs Abuse
no. % no. % no. % no. % no. % no. %
2 30-39 2 0.02
20-29 2 0.02 1 0.01
30-39 1 0.01 1 0.01
Sub Total 3 0.02 1 0.01 1 0.01
10-19 3 0.02
20-29 1 0.01
30-39 2 0.02
Sub Total 5 0.04 1 0.01
10-19 3 0.02 1 0.01 4 0.03
20-29 1 0.01 1 0.01
30-39 3 0.02 1 0.01
40-49 4 0.03 2 0.02
50-59 1 0.01
Sub Total 11 0.09 2 0.02 8 0.06
10-19 2 0.02
20-29 5 0.04 5 0.04 2 0.02
30-39 1 0.01
40-49 1 0.01
50-59 1 0.01 1 0.01
Sub Total 7 0.06 9 0.07 2 0.02
10-19 28 0.22 2 0.02 12 0.09 1 0.01 2 0.02 1 0.01
20-29 36 0.28 2 0.02 2 0.02 1 0.01 1 0.01 1 0.01
30-39 21 0.17 1 0.01 9 0.07 1 0.01
40-49 20 0.16 1 0.01 6 0.05
50-59 6 0.05 4 0.03 1 0.01
6
fAGE
GROUP
SHABU
m f
CONTACT CEMENT
m f
MARIJUANA
mREGION
3
4-A
5
7
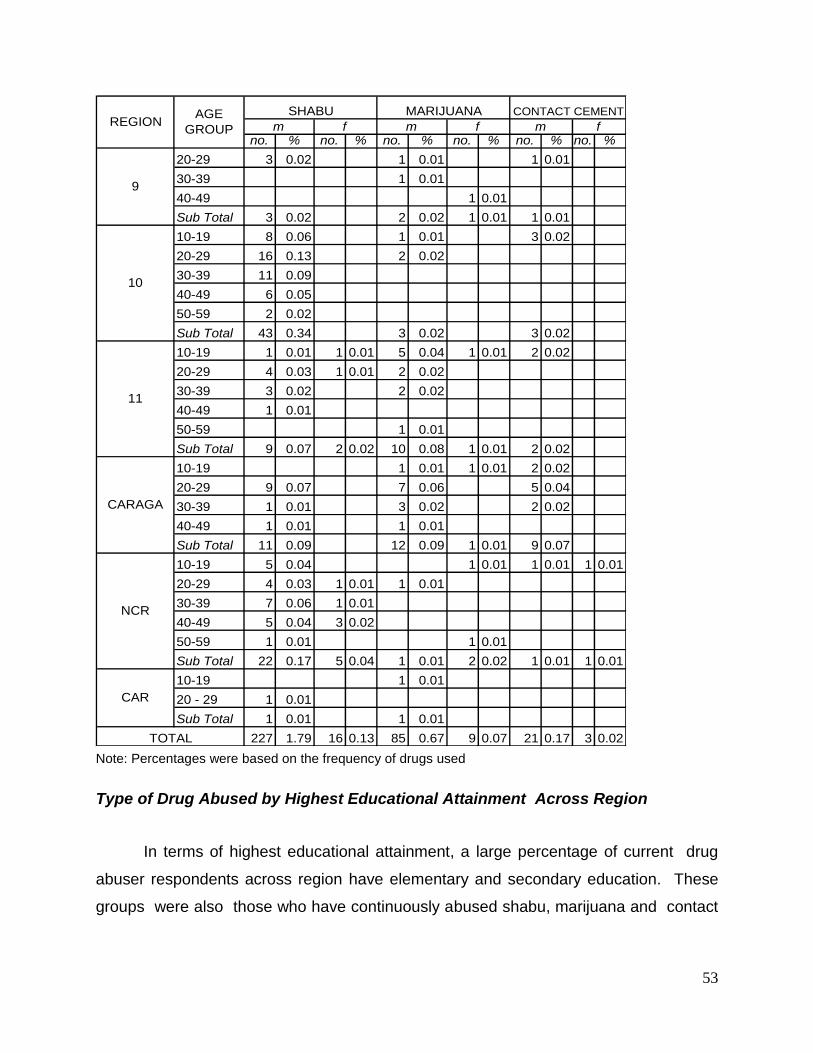
53
no. % no. % no. % no. % no. % no. %
20-29 3 0.02 1 0.01 1 0.01
30-39 1 0.01
40-49 1 0.01
Sub Total 3 0.02 2 0.02 1 0.01 1 0.01
10-19 8 0.06 1 0.01 3 0.02
20-29 16 0.13 2 0.02
30-39 11 0.09
40-49 6 0.05
50-59 2 0.02
Sub Total 43 0.34 3 0.02 3 0.02
10-19 1 0.01 1 0.01 5 0.04 1 0.01 2 0.02
20-29 4 0.03 1 0.01 2 0.02
30-39 3 0.02 2 0.02
40-49 1 0.01
50-59 1 0.01
Sub Total 9 0.07 2 0.02 10 0.08 1 0.01 2 0.02
10-19 1 0.01 1 0.01 2 0.02
20-29 9 0.07 7 0.06 5 0.04
30-39 1 0.01 3 0.02 2 0.02
40-49 1 0.01 1 0.01
Sub Total 11 0.09 12 0.09 1 0.01 9 0.07
10-19 5 0.04 1 0.01 1 0.01 1 0.01
20-29 4 0.03 1 0.01 1 0.01
30-39 7 0.06 1 0.01
40-49 5 0.04 3 0.02
50-59 1 0.01 1 0.01
Sub Total 22 0.17 5 0.04 1 0.01 2 0.02 1 0.01 1 0.01
10-19 1 0.01
20 - 29 1 0.01
Sub Total 1 0.01 1 0.01
227 1.79 16 0.13 85 0.67 9 0.07 21 0.17 3 0.02
NCR
9
CAR
fAGE
GROUP
SHABU
m f
CONTACT CEMENT
m f
MARIJUANA
mREGION
TOTAL
10
11
CARAGA
Note: Percentages were based on the frequency of drugs used
Type of Drug Abused by Highest Educational Attainment Across Region
In terms of highest educational attainment, a large percentage of current drug
abuser respondents across region have elementary and secondary education. These
groups were also those who have continuously abused shabu, marijuana and contact
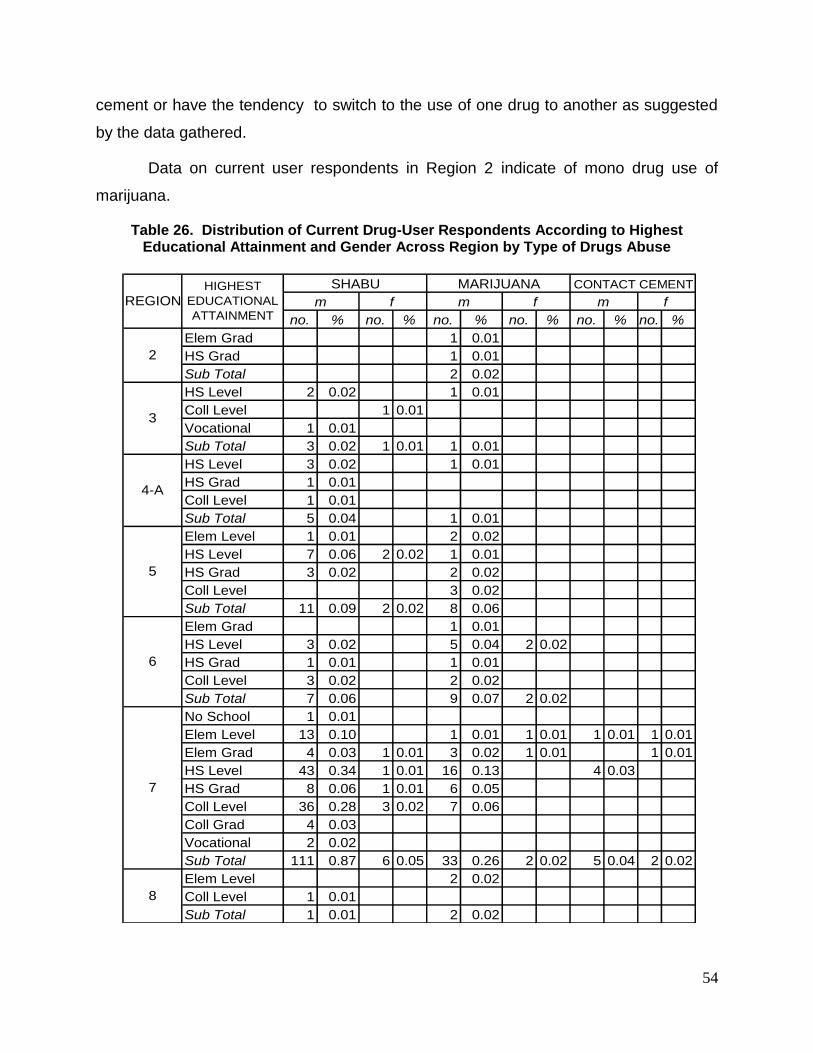
54
cement or have the tendency to switch to the use of one drug to another as suggested
by the data gathered.
Data on current user respondents in Region 2 indicate of mono drug use of
marijuana.
Table 26. Distribution of Current Drug-User Respondents According to Highest Educational Attainment and Gender Across Region by Type of Drugs Abuse
no. % no. % no. % no. % no. % no. %
Elem Grad 1 0.01
HS Grad 1 0.01
Sub Total 2 0.02
HS Level 2 0.02 1 0.01
Coll Level 1 0.01
Vocational 1 0.01
Sub Total 3 0.02 1 0.01 1 0.01
HS Level 3 0.02 1 0.01
HS Grad 1 0.01
Coll Level 1 0.01
Sub Total 5 0.04 1 0.01
Elem Level 1 0.01 2 0.02
HS Level 7 0.06 2 0.02 1 0.01
HS Grad 3 0.02 2 0.02
Coll Level 3 0.02
Sub Total 11 0.09 2 0.02 8 0.06
Elem Grad 1 0.01
HS Level 3 0.02 5 0.04 2 0.02
HS Grad 1 0.01 1 0.01
Coll Level 3 0.02 2 0.02
Sub Total 7 0.06 9 0.07 2 0.02
No School 1 0.01
Elem Level 13 0.10 1 0.01 1 0.01 1 0.01 1 0.01
Elem Grad 4 0.03 1 0.01 3 0.02 1 0.01 1 0.01
HS Level 43 0.34 1 0.01 16 0.13 4 0.03
HS Grad 8 0.06 1 0.01 6 0.05
Coll Level 36 0.28 3 0.02 7 0.06
Coll Grad 4 0.03
Vocational 2 0.02
Sub Total 111 0.87 6 0.05 33 0.26 2 0.02 5 0.04 2 0.02
Elem Level 2 0.02
Coll Level 1 0.01
Sub Total 1 0.01 2 0.02
5
7
8
6
SHABU MARIJUANA
m f
3
CONTACT CEMENT
2
REGIONHIGHEST
EDUCATIONAL
ATTAINMENTm f m f
4-A
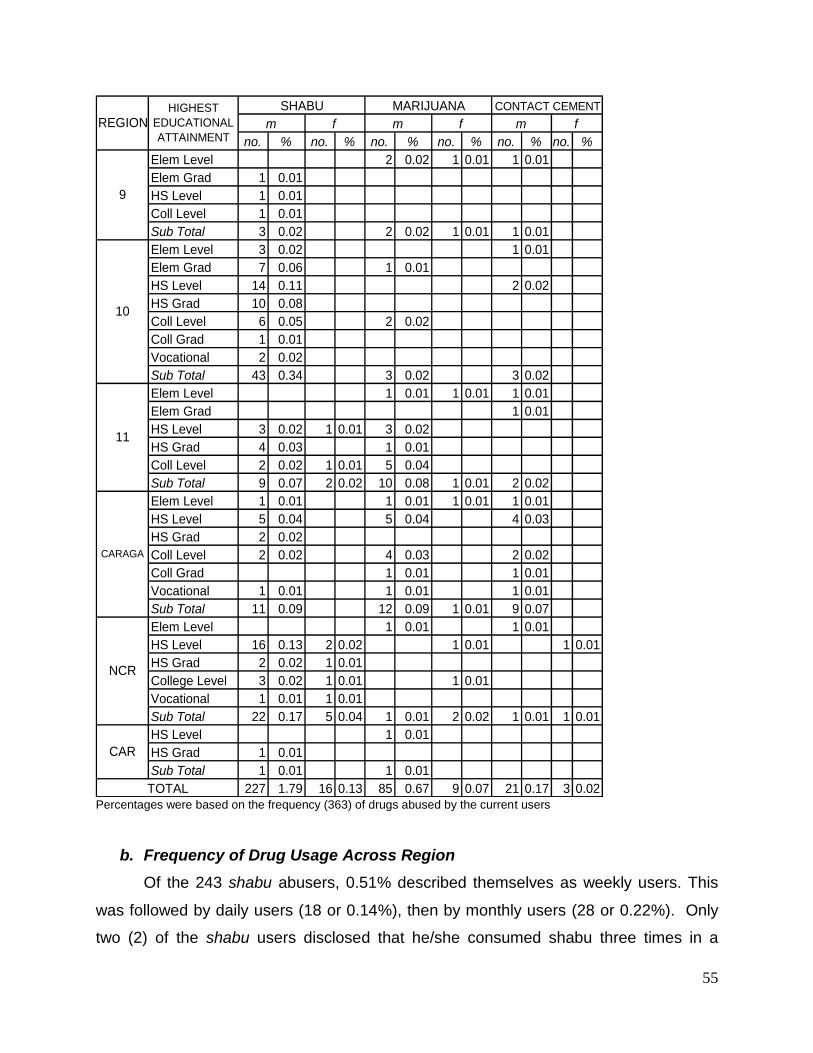
55
no. % no. % no. % no. % no. % no. %
Elem Level 2 0.02 1 0.01 1 0.01
Elem Grad 1 0.01
HS Level 1 0.01
Coll Level 1 0.01
Sub Total 3 0.02 2 0.02 1 0.01 1 0.01
Elem Level 3 0.02 1 0.01
Elem Grad 7 0.06 1 0.01
HS Level 14 0.11 2 0.02
HS Grad 10 0.08
Coll Level 6 0.05 2 0.02
Coll Grad 1 0.01
Vocational 2 0.02
Sub Total 43 0.34 3 0.02 3 0.02
Elem Level 1 0.01 1 0.01 1 0.01
Elem Grad 1 0.01
HS Level 3 0.02 1 0.01 3 0.02
HS Grad 4 0.03 1 0.01
Coll Level 2 0.02 1 0.01 5 0.04
Sub Total 9 0.07 2 0.02 10 0.08 1 0.01 2 0.02
Elem Level 1 0.01 1 0.01 1 0.01 1 0.01
HS Level 5 0.04 5 0.04 4 0.03
HS Grad 2 0.02
Coll Level 2 0.02 4 0.03 2 0.02
Coll Grad 1 0.01 1 0.01
Vocational 1 0.01 1 0.01 1 0.01
Sub Total 11 0.09 12 0.09 1 0.01 9 0.07
Elem Level 1 0.01 1 0.01
HS Level 16 0.13 2 0.02 1 0.01 1 0.01
HS Grad 2 0.02 1 0.01
College Level 3 0.02 1 0.01 1 0.01
Vocational 1 0.01 1 0.01
Sub Total 22 0.17 5 0.04 1 0.01 2 0.02 1 0.01 1 0.01
HS Level 1 0.01
HS Grad 1 0.01
Sub Total 1 0.01 1 0.01
227 1.79 16 0.13 85 0.67 9 0.07 21 0.17 3 0.02
CARAGA
CAR
TOTAL
NCR
11
10
REGIONHIGHEST
EDUCATIONAL
ATTAINMENT
SHABU MARIJUANA
m f m f
CONTACT CEMENT
9
m f
Percentages were based on the frequency (363) of drugs abused by the current users
b. Frequency of Drug Usage Across Region
Of the 243 shabu abusers, 0.51% described themselves as weekly users. This
was followed by daily users (18 or 0.14%), then by monthly users (28 or 0.22%). Only
two (2) of the shabu users disclosed that he/she consumed shabu three times in a
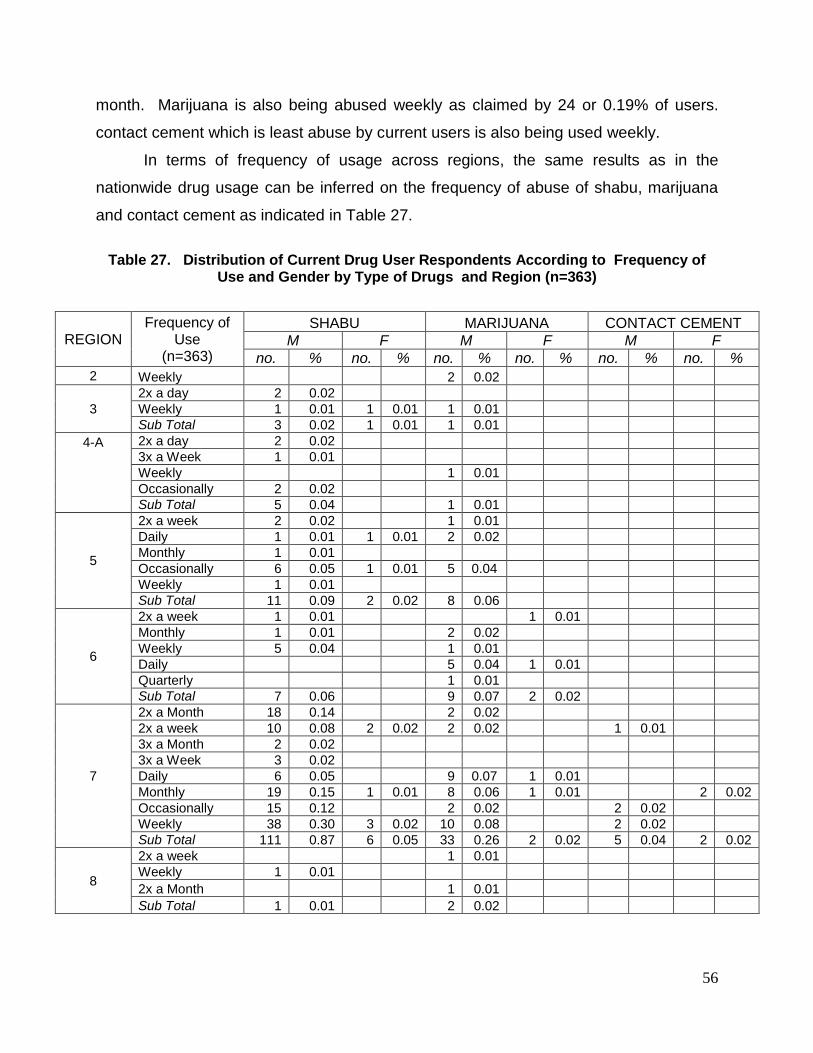
56
month. Marijuana is also being abused weekly as claimed by 24 or 0.19% of users.
contact cement which is least abuse by current users is also being used weekly.
In terms of frequency of usage across regions, the same results as in the
nationwide drug usage can be inferred on the frequency of abuse of shabu, marijuana
and contact cement as indicated in Table 27.
Table 27. Distribution of Current Drug User Respondents According to Frequency of
Use and Gender by Type of Drugs and Region (n=363)
REGION Frequency of
Use (n=363)
SHABU MARIJUANA CONTACT CEMENT M F M F M F
no. % no. % no. % no. % no. % no. % 2 Weekly 2 0.02
3
2x a day 2 0.02
Weekly 1 0.01 1 0.01 1 0.01
Sub Total 3 0.02 1 0.01 1 0.01
4-A
2x a day 2 0.02
3x a Week 1 0.01
Weekly 1 0.01
Occasionally 2 0.02
Sub Total 5 0.04 1 0.01
5
2x a week 2 0.02 1 0.01
Daily 1 0.01 1 0.01 2 0.02
Monthly 1 0.01
Occasionally 6 0.05 1 0.01 5 0.04
Weekly 1 0.01
Sub Total 11 0.09 2 0.02 8 0.06
6
2x a week 1 0.01 1 0.01
Monthly 1 0.01 2 0.02
Weekly 5 0.04 1 0.01
Daily 5 0.04 1 0.01
Quarterly 1 0.01
Sub Total 7 0.06 9 0.07 2 0.02
7
2x a Month 18 0.14 2 0.02
2x a week 10 0.08 2 0.02 2 0.02 1 0.01
3x a Month 2 0.02
3x a Week 3 0.02
Daily 6 0.05 9 0.07 1 0.01
Monthly 19 0.15 1 0.01 8 0.06 1 0.01 2 0.02
Occasionally 15 0.12 2 0.02 2 0.02
Weekly 38 0.30 3 0.02 10 0.08 2 0.02
Sub Total 111 0.87 6 0.05 33 0.26 2 0.02 5 0.04 2 0.02
8
2x a week 1 0.01
Weekly 1 0.01
2x a Month 1 0.01
Sub Total 1 0.01 2 0.02
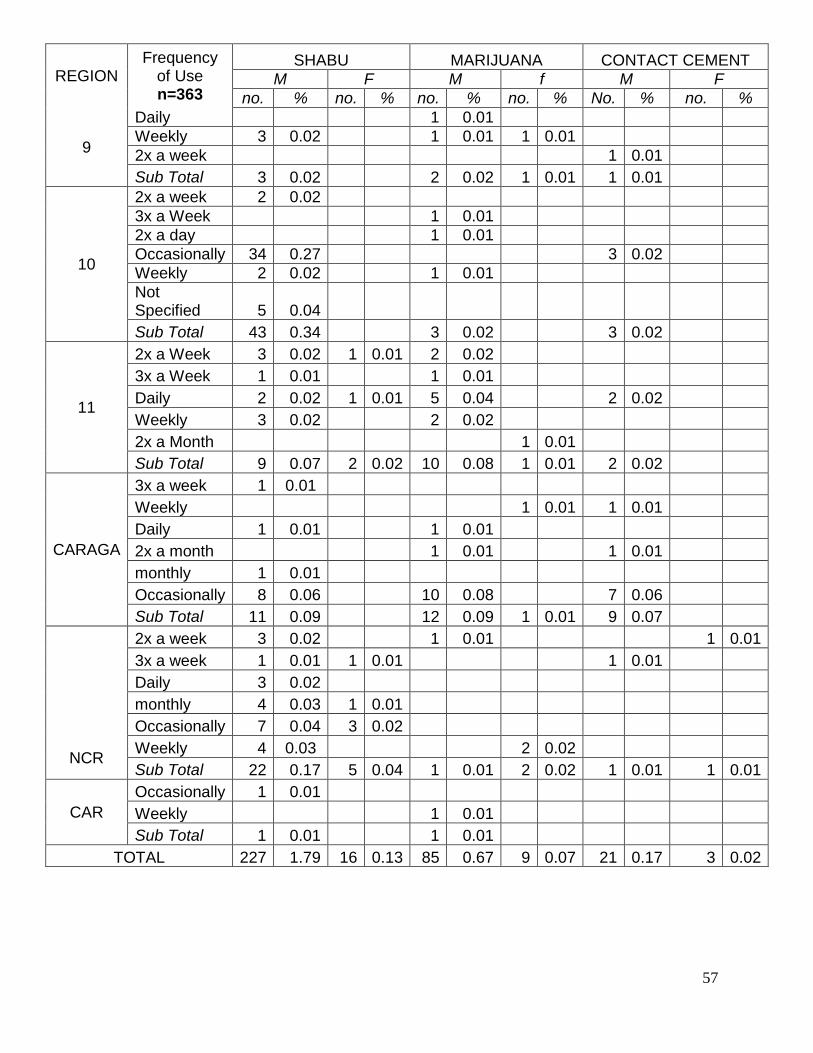
57
REGION Frequency
of Use n=363
SHABU MARIJUANA CONTACT CEMENT
M F M f M F
no. % no. % no. % no. % No. % no. %
9
Daily 1 0.01
Weekly 3 0.02 1 0.01 1 0.01
2x a week 1 0.01
Sub Total 3 0.02 2 0.02 1 0.01 1 0.01
10
2x a week 2 0.02
3x a Week 1 0.01
2x a day 1 0.01
Occasionally 34 0.27 3 0.02
Weekly 2 0.02 1 0.01
Not Specified 5 0.04
Sub Total 43 0.34 3 0.02 3 0.02
11
2x a Week 3 0.02 1 0.01 2 0.02
3x a Week 1 0.01 1 0.01
Daily 2 0.02 1 0.01 5 0.04 2 0.02
Weekly 3 0.02 2 0.02
2x a Month 1 0.01
Sub Total 9 0.07 2 0.02 10 0.08 1 0.01 2 0.02
CARAGA
3x a week 1 0.01
Weekly 1 0.01 1 0.01
Daily 1 0.01 1 0.01
2x a month 1 0.01 1 0.01
monthly 1 0.01
Occasionally 8 0.06 10 0.08 7 0.06
Sub Total 11 0.09 12 0.09 1 0.01 9 0.07
NCR
2x a week 3 0.02 1 0.01 1 0.01
3x a week 1 0.01 1 0.01 1 0.01
Daily 3 0.02
monthly 4 0.03 1 0.01
Occasionally 7 0.04 3 0.02
Weekly 4 0.03 2 0.02
Sub Total 22 0.17 5 0.04 1 0.01 2 0.02 1 0.01 1 0.01
CAR
Occasionally 1 0.01
Weekly 1 0.01
Sub Total 1 0.01 1 0.01
TOTAL 227 1.79 16 0.13 85 0.67 9 0.07 21 0.17 3 0.02
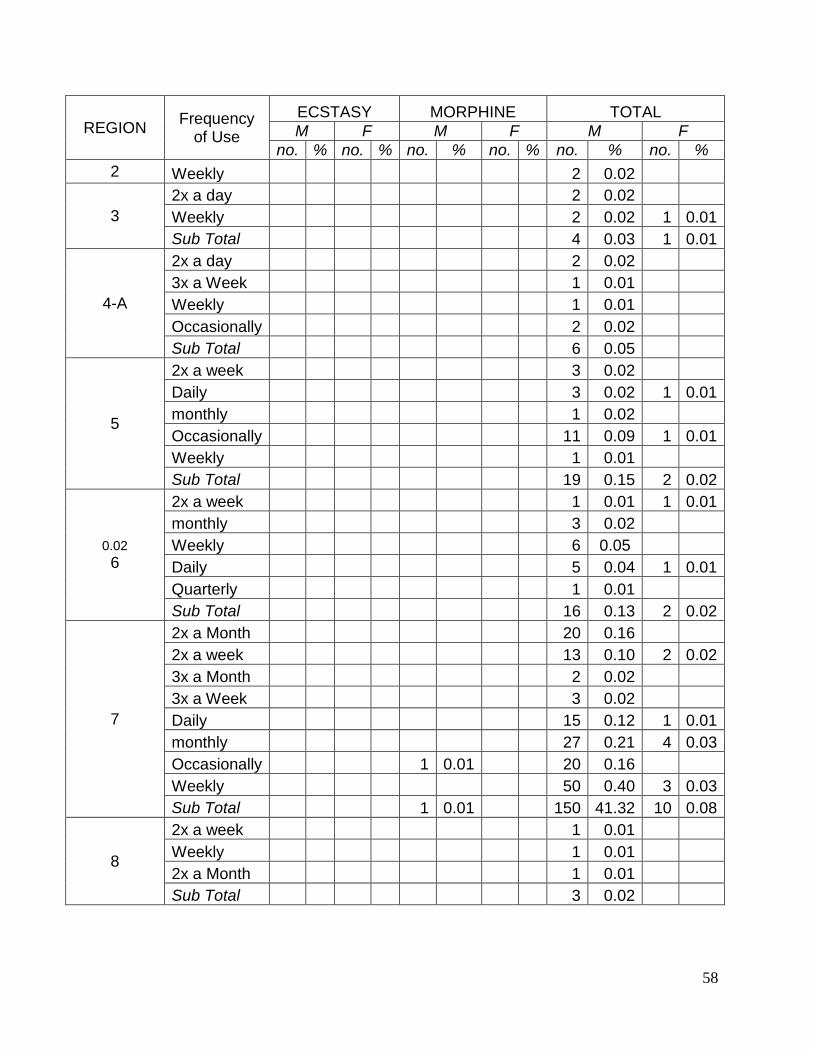
58
REGION Frequency
of Use
ECSTASY MORPHINE TOTAL
M F M F M F
no. % no. % no. % no. % no. % no. %
2 Weekly 2 0.02
3
2x a day 2 0.02
Weekly 2 0.02 1 0.01
Sub Total 4 0.03 1 0.01
4-A
2x a day 2 0.02
3x a Week 1 0.01
Weekly 1 0.01
Occasionally 2 0.02
Sub Total 6 0.05
5
2x a week 3 0.02
Daily 3 0.02 1 0.01
monthly 1 0.02
Occasionally 11 0.09 1 0.01
Weekly 1 0.01
Sub Total 19 0.15 2 0.02
0.02
6
2x a week 1 0.01 1 0.01
monthly 3 0.02
Weekly 6 0.05
Daily 5 0.04 1 0.01
Quarterly 1 0.01
Sub Total 16 0.13 2 0.02
7
2x a Month 20 0.16
2x a week 13 0.10 2 0.02
3x a Month 2 0.02
3x a Week 3 0.02
Daily 15 0.12 1 0.01
monthly 27 0.21 4 0.03
Occasionally 1 0.01 20 0.16
Weekly 50 0.40 3 0.03
Sub Total 1 0.01 150 41.32 10 0.08
8
2x a week 1 0.01
Weekly 1 0.01
2x a Month 1 0.01
Sub Total 3 0.02
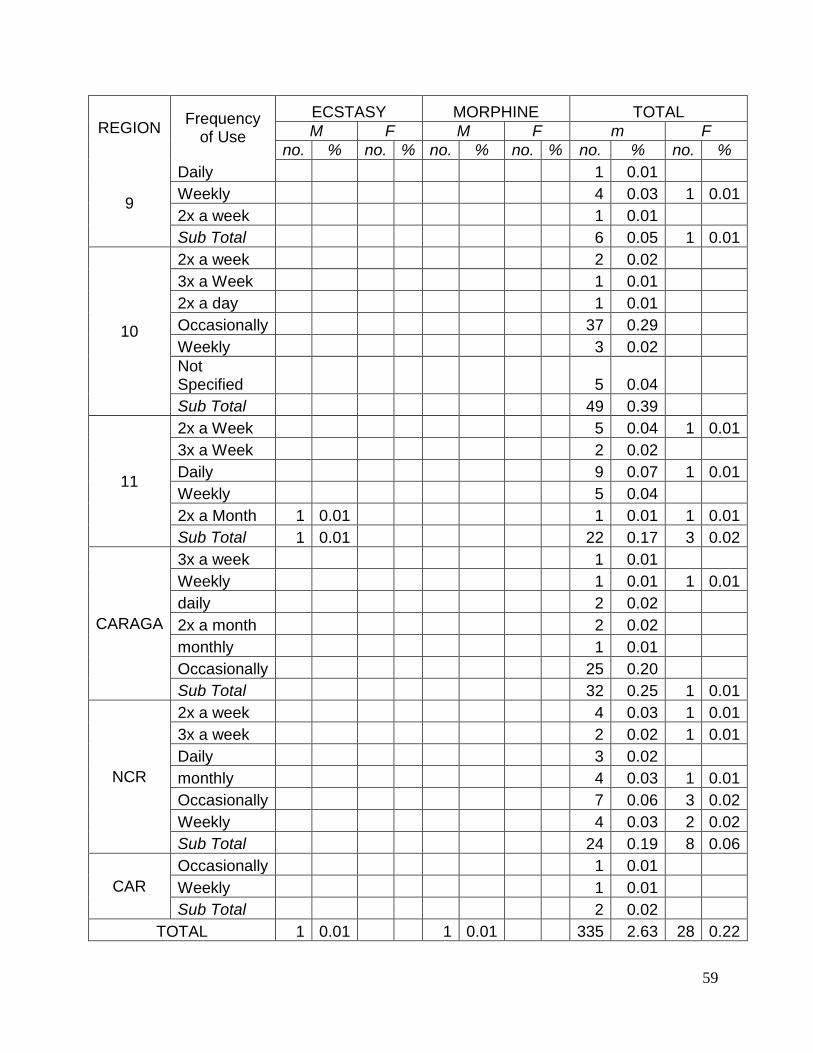
59
REGION Frequency
of Use
ECSTASY MORPHINE TOTAL
M F M F m F
no. % no. % no. % no. % no. % no. %
9
Daily 1 0.01
Weekly 4 0.03 1 0.01
2x a week 1 0.01
Sub Total 6 0.05 1 0.01
10
2x a week 2 0.02
3x a Week 1 0.01
2x a day 1 0.01
Occasionally 37 0.29
Weekly 3 0.02
Not Specified 5 0.04
Sub Total 49 0.39
11
2x a Week 5 0.04 1 0.01
3x a Week 2 0.02
Daily 9 0.07 1 0.01
Weekly 5 0.04
2x a Month 1 0.01 1 0.01 1 0.01
Sub Total 1 0.01 22 0.17 3 0.02
CARAGA
3x a week 1 0.01
Weekly 1 0.01 1 0.01
daily 2 0.02
2x a month 2 0.02
monthly 1 0.01
Occasionally 25 0.20
Sub Total 32 0.25 1 0.01
NCR
2x a week 4 0.03 1 0.01
3x a week 2 0.02 1 0.01
Daily 3 0.02
monthly 4 0.03 1 0.01
Occasionally 7 0.06 3 0.02
Weekly 4 0.03 2 0.02
Sub Total 24 0.19 8 0.06
CAR
Occasionally 1 0.01
Weekly 1 0.01
Sub Total 2 0.02
TOTAL 1 0.01 1 0.01 335 2.63 28 0.22
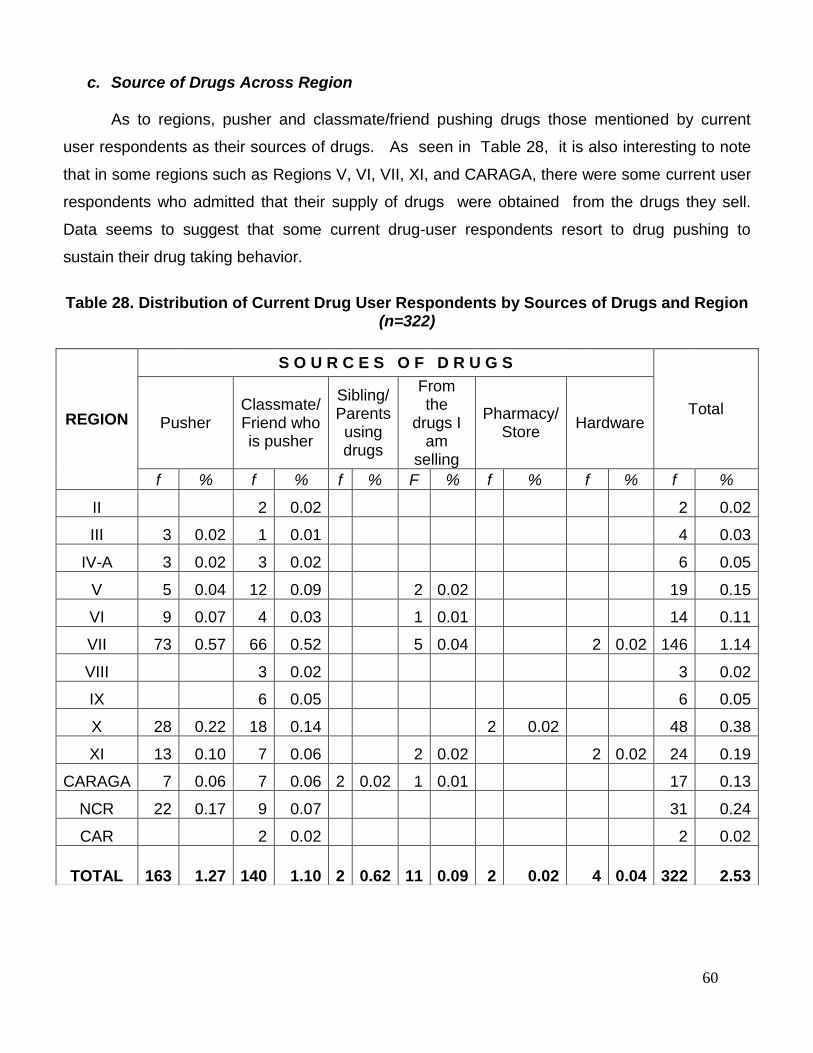
60
c. Source of Drugs Across Region
As to regions, pusher and classmate/friend pushing drugs those mentioned by current
user respondents as their sources of drugs. As seen in Table 28, it is also interesting to note
that in some regions such as Regions V, VI, VII, XI, and CARAGA, there were some current user
respondents who admitted that their supply of drugs were obtained from the drugs they sell.
Data seems to suggest that some current drug-user respondents resort to drug pushing to
sustain their drug taking behavior.
Table 28. Distribution of Current Drug User Respondents by Sources of Drugs and Region
(n=322)
REGION
S O U R C E S O F D R U G S
Total Pusher
Classmate/ Friend who is pusher
Sibling/ Parents using drugs
From the
drugs I am
selling
Pharmacy/ Store
Hardware
f % f % f % F % f % f % f %
II 2 0.02 2 0.02
III 3 0.02 1 0.01 4 0.03
IV-A 3 0.02 3 0.02 6 0.05
V 5 0.04 12 0.09 2 0.02 19 0.15
VI 9 0.07 4 0.03 1 0.01 14 0.11
VII 73 0.57 66 0.52 5 0.04 2 0.02 146 1.14
VIII 3 0.02 3 0.02
IX 6 0.05 6 0.05
X 28 0.22 18 0.14 2 0.02 48 0.38
XI 13 0.10 7 0.06 2 0.02 2 0.02 24 0.19
CARAGA 7 0.06 7 0.06 2 0.02 1 0.01 17 0.13
NCR 22 0.17 9 0.07 31 0.24
CAR 2 0.02 2 0.02
TOTAL 163 1.27 140 1.10 2 0.62 11 0.09 2 0.02 4 0.04 322 2.53
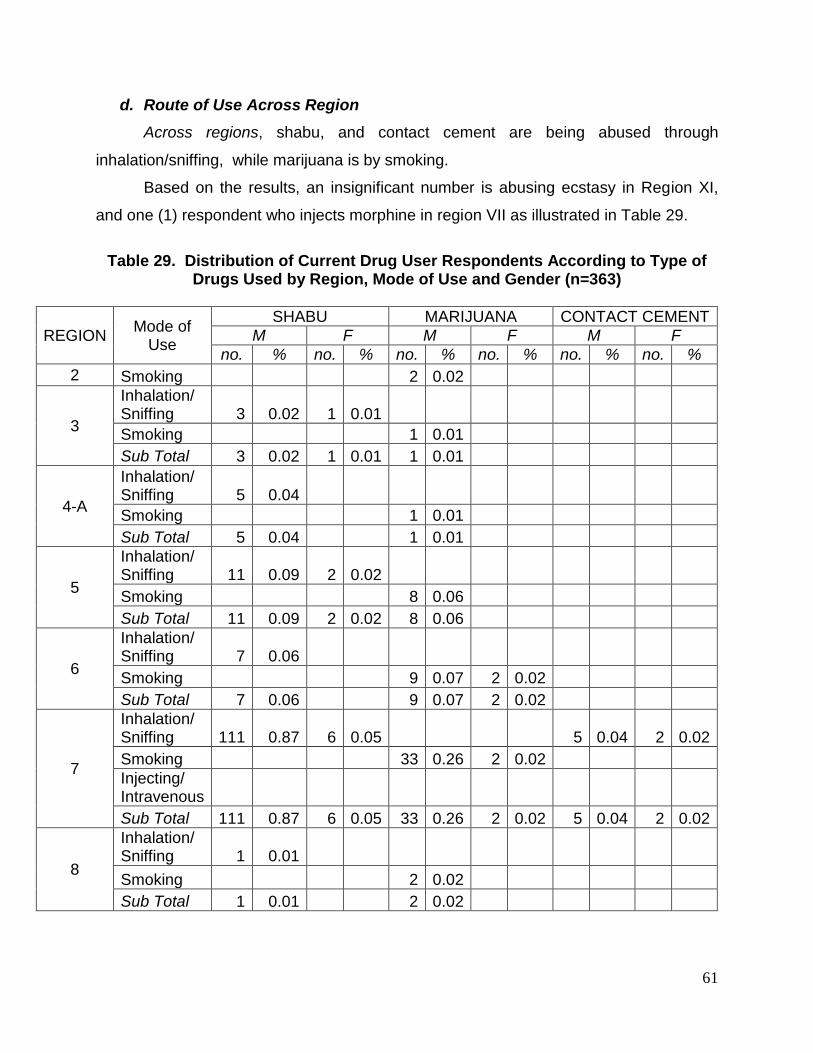
61
d. Route of Use Across Region
Across regions, shabu, and contact cement are being abused through
inhalation/sniffing, while marijuana is by smoking.
Based on the results, an insignificant number is abusing ecstasy in Region XI,
and one (1) respondent who injects morphine in region VII as illustrated in Table 29.
Table 29. Distribution of Current Drug User Respondents According to Type of
Drugs Used by Region, Mode of Use and Gender (n=363)
REGION Mode of
Use
SHABU MARIJUANA CONTACT CEMENT
M F M F M F
no. % no. % no. % no. % no. % no. %
2 Smoking 2 0.02
3
Inhalation/ Sniffing 3 0.02 1 0.01
Smoking 1 0.01
Sub Total 3 0.02 1 0.01 1 0.01
4-A
Inhalation/ Sniffing 5 0.04
Smoking 1 0.01
Sub Total 5 0.04 1 0.01
5
Inhalation/ Sniffing 11 0.09 2 0.02
Smoking 8 0.06
Sub Total 11 0.09 2 0.02 8 0.06
6
Inhalation/ Sniffing 7 0.06
Smoking 9 0.07 2 0.02
Sub Total 7 0.06 9 0.07 2 0.02
7
Inhalation/ Sniffing 111 0.87 6 0.05 5 0.04 2 0.02
Smoking 33 0.26 2 0.02
Injecting/ Intravenous
Sub Total 111 0.87 6 0.05 33 0.26 2 0.02 5 0.04 2 0.02
8
Inhalation/ Sniffing 1 0.01
Smoking 2 0.02
Sub Total 1 0.01 2 0.02
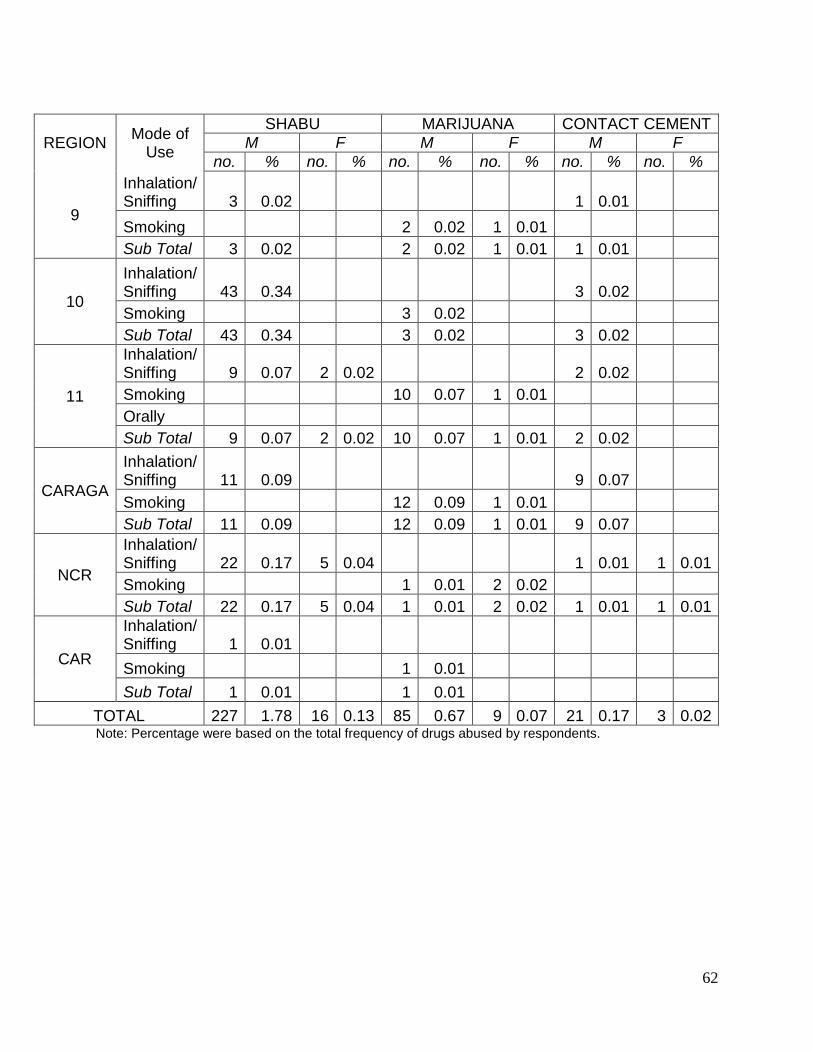
62
REGION Mode of
Use
SHABU MARIJUANA CONTACT CEMENT
M F M F M F
no. % no. % no. % no. % no. % no. %
9
Inhalation/ Sniffing 3 0.02 1 0.01
Smoking 2 0.02 1 0.01
Sub Total 3 0.02 2 0.02 1 0.01 1 0.01
10
Inhalation/ Sniffing 43 0.34 3 0.02
Smoking 3 0.02
Sub Total 43 0.34 3 0.02 3 0.02
11
Inhalation/ Sniffing 9 0.07 2 0.02 2 0.02
Smoking 10 0.07 1 0.01
Orally
Sub Total 9 0.07 2 0.02 10 0.07 1 0.01 2 0.02
CARAGA
Inhalation/ Sniffing 11 0.09 9 0.07
Smoking 12 0.09 1 0.01
Sub Total 11 0.09 12 0.09 1 0.01 9 0.07
NCR
Inhalation/ Sniffing 22 0.17 5 0.04 1 0.01 1 0.01
Smoking 1 0.01 2 0.02
Sub Total 22 0.17 5 0.04 1 0.01 2 0.02 1 0.01 1 0.01
CAR
Inhalation/ Sniffing 1 0.01
Smoking 1 0.01
Sub Total 1 0.01 1 0.01
TOTAL 227 1.78 16 0.13 85 0.67 9 0.07 21 0.17 3 0.02 Note: Percentage were based on the total frequency of drugs abused by respondents.
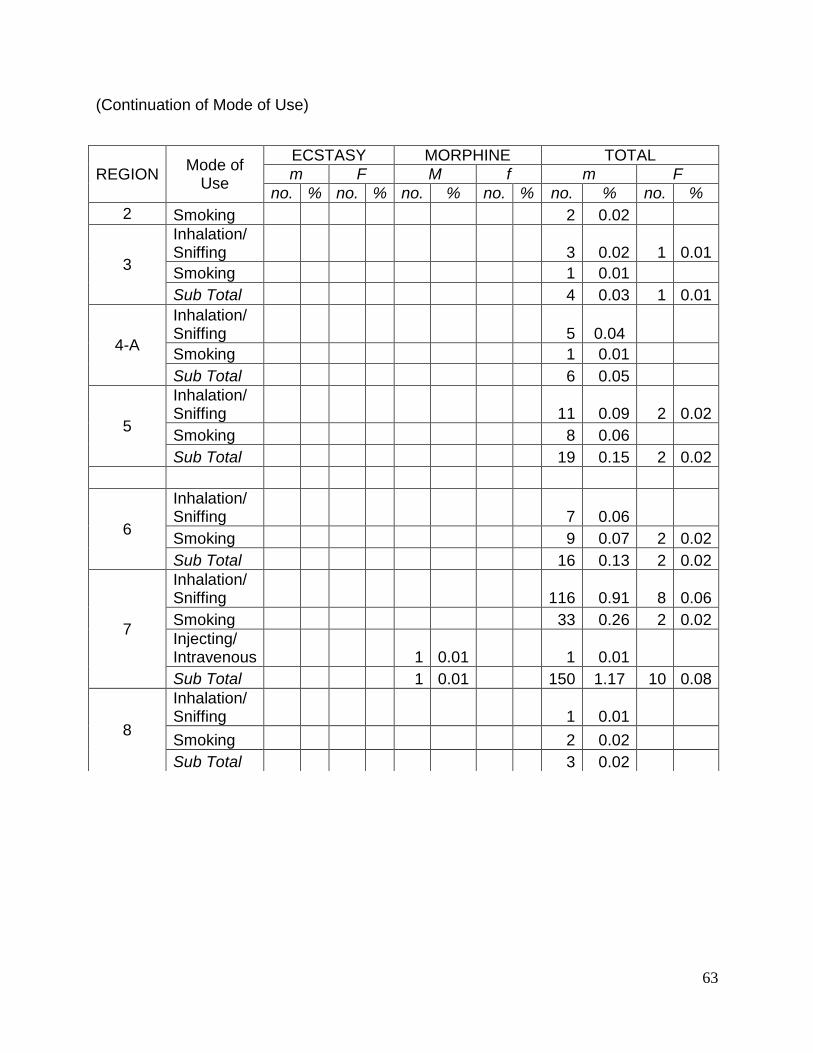
63
(Continuation of Mode of Use)
REGION Mode of
Use
ECSTASY MORPHINE TOTAL
m F M f m F
no. % no. % no. % no. % no. % no. %
2 Smoking 2 0.02
3
Inhalation/ Sniffing 3 0.02 1 0.01
Smoking 1 0.01
Sub Total 4 0.03 1 0.01
4-A
Inhalation/ Sniffing 5 0.04
Smoking 1 0.01
Sub Total 6 0.05
5
Inhalation/ Sniffing 11 0.09 2 0.02
Smoking 8 0.06
Sub Total 19 0.15 2 0.02
6
Inhalation/ Sniffing 7 0.06
Smoking 9 0.07 2 0.02
Sub Total 16 0.13 2 0.02
7
Inhalation/ Sniffing 116 0.91 8 0.06
Smoking 33 0.26 2 0.02
Injecting/ Intravenous 1 0.01 1 0.01
Sub Total 1 0.01 150 1.17 10 0.08
8
Inhalation/ Sniffing 1 0.01
Smoking 2 0.02
Sub Total 3 0.02
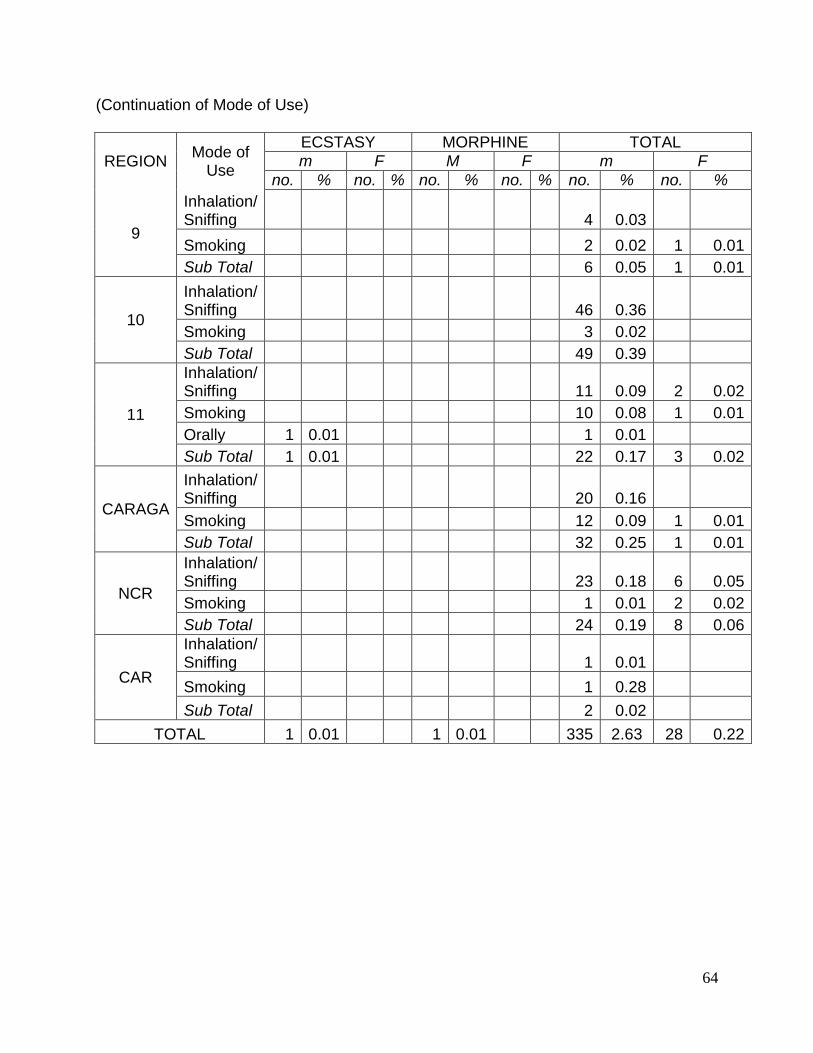
64
(Continuation of Mode of Use)
REGION Mode of
Use
ECSTASY MORPHINE TOTAL
m F M F m F
no. % no. % no. % no. % no. % no. %
9
Inhalation/ Sniffing 4 0.03
Smoking 2 0.02 1 0.01
Sub Total 6 0.05 1 0.01
10
Inhalation/ Sniffing 46 0.36
Smoking 3 0.02
Sub Total 49 0.39
11
Inhalation/ Sniffing 11 0.09 2 0.02
Smoking 10 0.08 1 0.01
Orally 1 0.01 1 0.01
Sub Total 1 0.01 22 0.17 3 0.02
CARAGA
Inhalation/ Sniffing 20 0.16
Smoking 12 0.09 1 0.01
Sub Total 32 0.25 1 0.01
NCR
Inhalation/ Sniffing 23 0.18 6 0.05
Smoking 1 0.01 2 0.02
Sub Total 24 0.19 8 0.06
CAR
Inhalation/ Sniffing 1 0.01
Smoking 1 0.28
Sub Total 2 0.02
TOTAL 1 0.01 1 0.01 335 2.63 28 0.22
65
THOSE WHO STOPPED USING
66
THOSE WHO STOPPED USING DRUGS (n=1,022)
Of the 1,344 respondents who have tried drugs, 1,022 or 76.04% have stopped
using drugs. The significant characteristics of those who stopped using drugs were as
follows:
Majority of those who have stopped using drugs were males (85.91%);
Less than one third (32.09%) belonged to the age group 20-29 years old,
followed by those in the 30-39 age group; the least were those in the 60 and
above age group;
As to civil status, they were mostly married (46.58%), and single (41.29%);
there were also those who were single parents (0.20%);
Significantly, a large percentage of those who have stopped using drugs have
high levels of education, with 31.02 % in the high school level and 25.24% have
reached college level of education. The least of those who have tried drugs were
in the category “vocational “ (3.03%).
As to classification, the unemployed topped the list of those who have stopped
using drugs, followed by the self-employed and the students.
The tabular profile of those who stopped using can be seen in the table below.
Table 30. PROFILE OF THOSE WHO STOPPED USING DRUGS (n=1,022)
VARIABLES Number %
Sex
Male 878 85.91
Female 144 14.09
Age
10-19 175 17.12
20-29 328 32.09
30-39 280 27.40
40-49 169 16.54
50-59 66 5.48
60 & above 14 1.37
Civil Status
Single 422 41.29
Married 476 46.58
Widowed 19 1.86
Separated 31 3.03
67
Those Who Have Stopped by Classification
In terms of classification, the same characteristics as in the national findings can
be observed across region. The unemployed is highest in Regions VII (55 or 5.38%), V
(35 or 3.42%), NCR (39 or 3.82% and CARAGA (32 or 3.12%). Students are highest in
Regions VII, NCR and XI, respectively which can be gleaned in Table 31.
Live-in 72 7.05
Single Parent 2 0.20 Highest Educational Attainment
No Formal Education 3 0.29
Elementary level 99 9.69
Elementary Graduate 46 4.50
High School level 317 31.02
High School Graduate 183 17.91
Vocational 31 3.03
College Level 258 25.24
College Graduate 85 8.32
Classification
Self –employed 216 21.14
Students 106 10.37
Private Employees 156 15.26
Government Employees
78 7.63
Public Transport Drivers
46 4.50
Entertainers 1 0.10
Others
Unemployed 303 29.65
OSY 75 7.34
68
Table 31. Distribution of Respondents of Those Who Stopped Using Drugs According to Classification by Region
REGION
Classification
Student Unemployed Private
Employee Government Employee
Own Business
Self-Employed OSY Farmer
F % f % f % F % f % F % f % f %
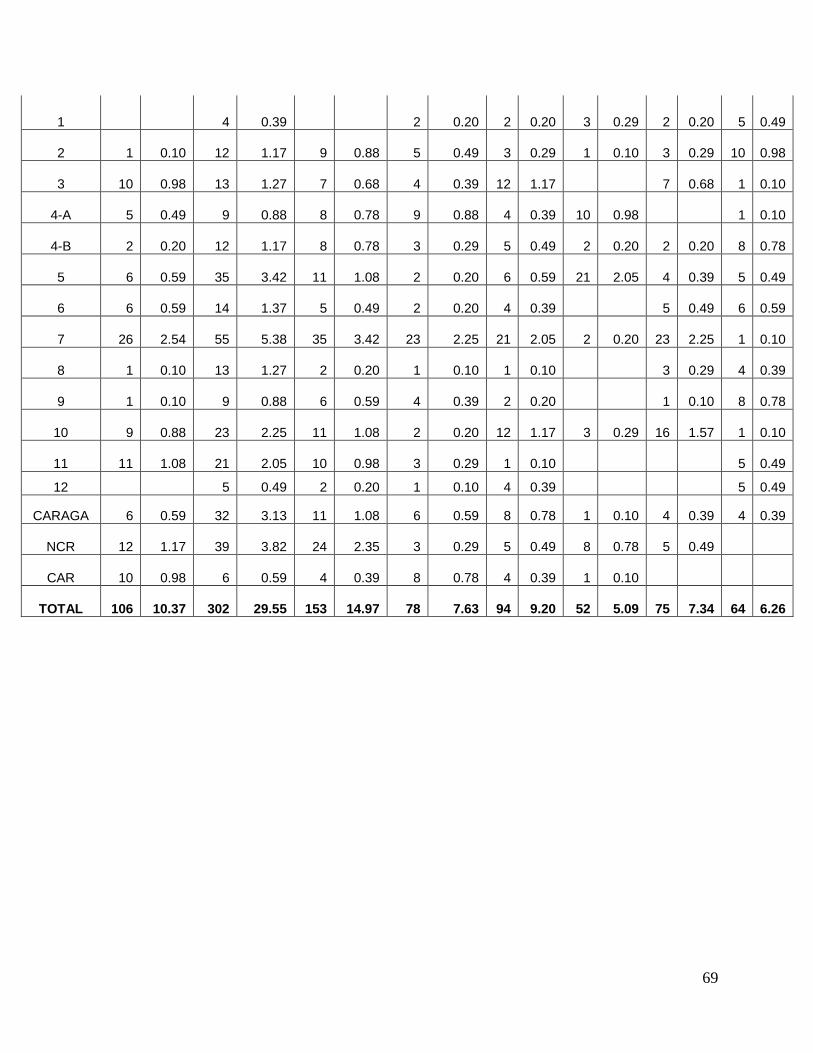
69
1 4 0.39 2 0.20 2 0.20 3 0.29 2 0.20 5 0.49
2 1 0.10 12 1.17 9 0.88 5 0.49 3 0.29 1 0.10 3 0.29 10 0.98
3 10 0.98 13 1.27 7 0.68 4 0.39 12 1.17 7 0.68 1 0.10
4-A 5 0.49 9 0.88 8 0.78 9 0.88 4 0.39 10 0.98 1 0.10
4-B 2 0.20 12 1.17 8 0.78 3 0.29 5 0.49 2 0.20 2 0.20 8 0.78
5 6 0.59 35 3.42 11 1.08 2 0.20 6 0.59 21 2.05 4 0.39 5 0.49
6 6 0.59 14 1.37 5 0.49 2 0.20 4 0.39 5 0.49 6 0.59
7 26 2.54 55 5.38 35 3.42 23 2.25 21 2.05 2 0.20 23 2.25 1 0.10
8 1 0.10 13 1.27 2 0.20 1 0.10 1 0.10 3 0.29 4 0.39
9 1 0.10 9 0.88 6 0.59 4 0.39 2 0.20 1 0.10 8 0.78
10 9 0.88 23 2.25 11 1.08 2 0.20 12 1.17 3 0.29 16 1.57 1 0.10
11 11 1.08 21 2.05 10 0.98 3 0.29 1 0.10 5 0.49
12 5 0.49 2 0.20 1 0.10 4 0.39 5 0.49
CARAGA 6 0.59 32 3.13 11 1.08 6 0.59 8 0.78 1 0.10 4 0.39 4 0.39
NCR 12 1.17 39 3.82 24 2.35 3 0.29 5 0.49 8 0.78 5 0.49
CAR 10 0.98 6 0.59 4 0.39 8 0.78 4 0.39 1 0.10
TOTAL 106 10.37 302 29.55 153 14.97 78 7.63 94 9.20 52 5.09 75 7.34 64 6.26
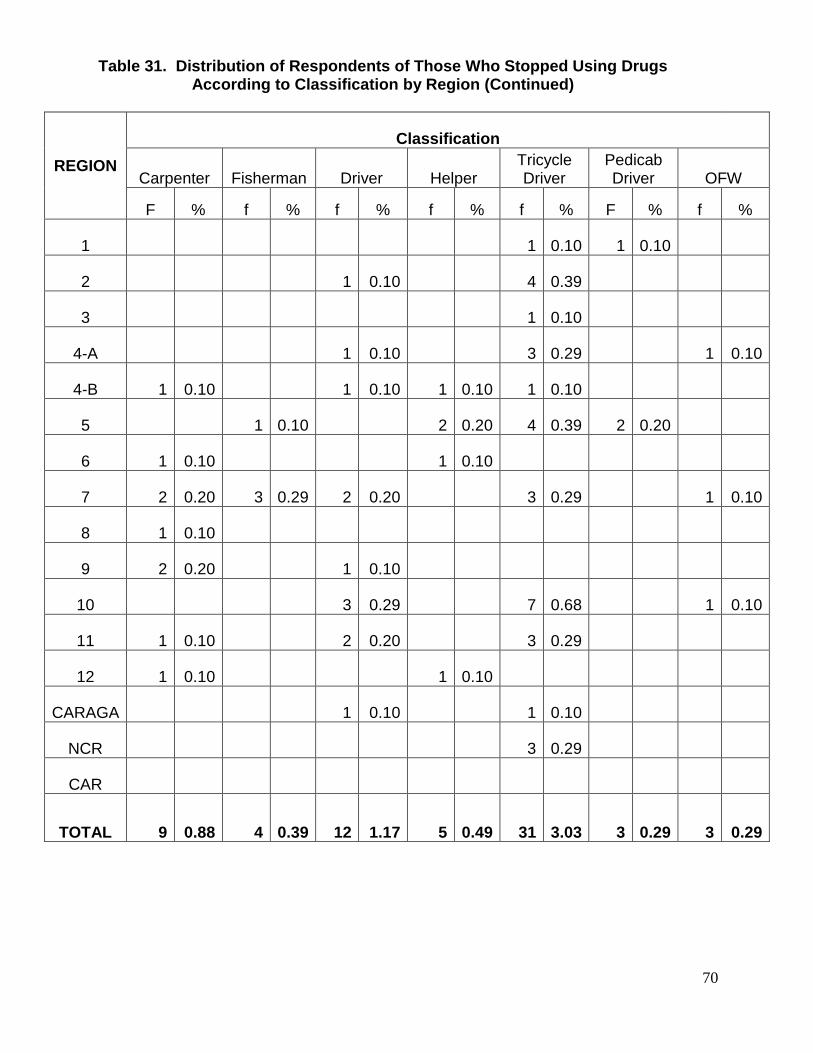
70
Table 31. Distribution of Respondents of Those Who Stopped Using Drugs According to Classification by Region (Continued)
REGION
Classification
Carpenter Fisherman Driver Helper Tricycle Driver
Pedicab Driver OFW
F % f % f % f % f % F % f %
1 1 0.10 1 0.10
2 1 0.10 4 0.39
3 1 0.10
4-A 1 0.10 3 0.29 1 0.10
4-B 1 0.10 1 0.10 1 0.10 1 0.10
5 1 0.10 2 0.20 4 0.39 2 0.20
6 1 0.10 1 0.10
7 2 0.20 3 0.29 2 0.20 3 0.29 1 0.10
8 1 0.10
9 2 0.20 1 0.10
10 3 0.29 7 0.68 1 0.10
11 1 0.10 2 0.20 3 0.29
12 1 0.10 1 0.10
CARAGA 1 0.10 1 0.10
NCR 3 0.29
CAR
TOTAL 9 0.88 4 0.39 12 1.17 5 0.49 31 3.03 3 0.29 3 0.29
71
REASONS FOR:
FIRST USE
CONTINUED USE
STOPPING DRUG USE
FOR NOT USING DRUGS
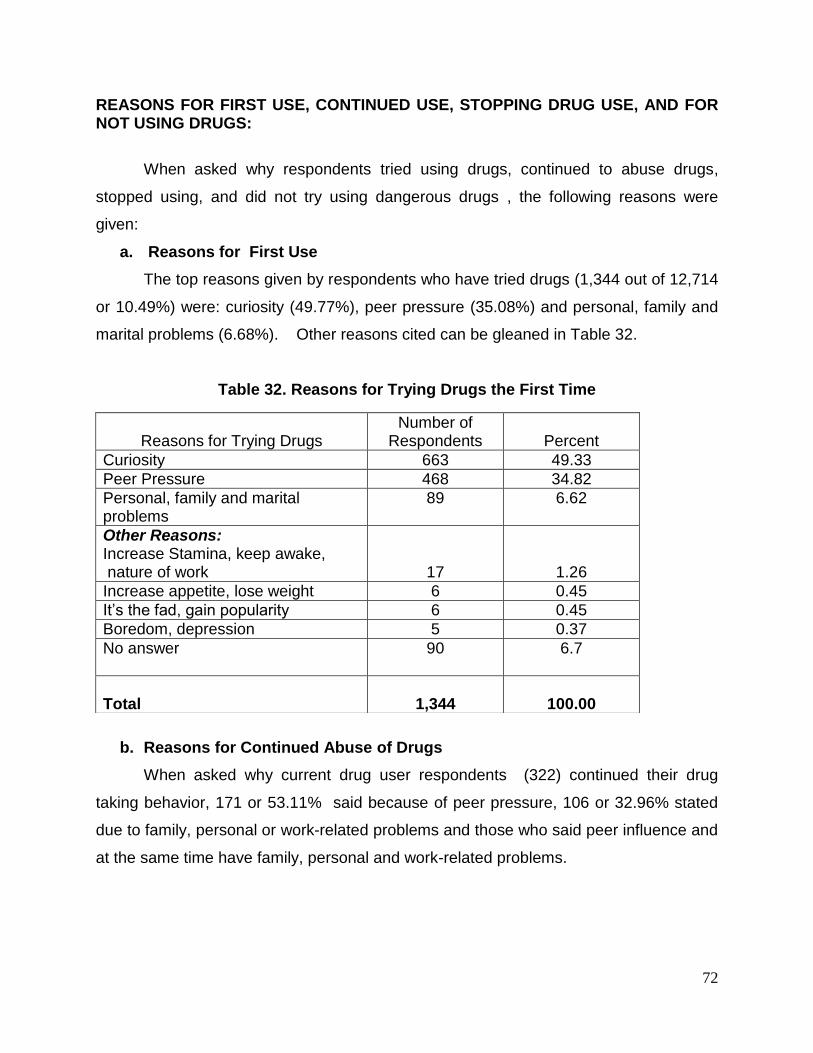
72
REASONS FOR FIRST USE, CONTINUED USE, STOPPING DRUG USE, AND FOR NOT USING DRUGS:
When asked why respondents tried using drugs, continued to abuse drugs,
stopped using, and did not try using dangerous drugs , the following reasons were
given:
a. Reasons for First Use
The top reasons given by respondents who have tried drugs (1,344 out of 12,714
or 10.49%) were: curiosity (49.77%), peer pressure (35.08%) and personal, family and
marital problems (6.68%). Other reasons cited can be gleaned in Table 32.
Table 32. Reasons for Trying Drugs the First Time
b. Reasons for Continued Abuse of Drugs
When asked why current drug user respondents (322) continued their drug
taking behavior, 171 or 53.11% said because of peer pressure, 106 or 32.96% stated
due to family, personal or work-related problems and those who said peer influence and
at the same time have family, personal and work-related problems.
Reasons for Trying Drugs
Number of Respondents
Percent
Curiosity 663 49.33
Peer Pressure 468 34.82
Personal, family and marital problems
89 6.62
Other Reasons: Increase Stamina, keep awake, nature of work
17
1.26
Increase appetite, lose weight 6 0.45
It‟s the fad, gain popularity 6 0.45
Boredom, depression 5 0.37
No answer
90 6.7
Total
1,344
100.00
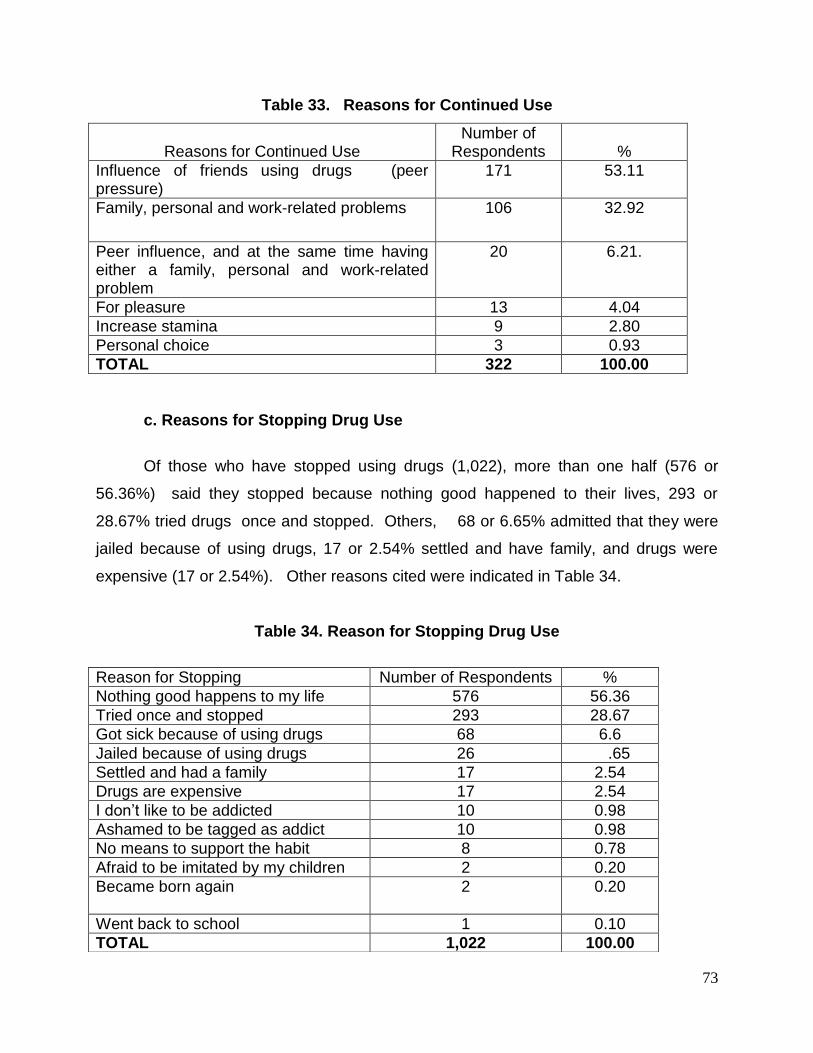
73
Table 33. Reasons for Continued Use
Reasons for Continued Use
Number of Respondents
%
Influence of friends using drugs (peer pressure)
171 53.11
Family, personal and work-related problems 106 32.92
Peer influence, and at the same time having either a family, personal and work-related problem
20 6.21.
For pleasure 13 4.04
Increase stamina 9 2.80
Personal choice 3 0.93
TOTAL 322 100.00
c. Reasons for Stopping Drug Use
Of those who have stopped using drugs (1,022), more than one half (576 or
56.36%) said they stopped because nothing good happened to their lives, 293 or
28.67% tried drugs once and stopped. Others, 68 or 6.65% admitted that they were
jailed because of using drugs, 17 or 2.54% settled and have family, and drugs were
expensive (17 or 2.54%). Other reasons cited were indicated in Table 34.
Table 34. Reason for Stopping Drug Use
Reason for Stopping Number of Respondents %
Nothing good happens to my life 576 56.36
Tried once and stopped 293 28.67
Got sick because of using drugs 68 6.6
Jailed because of using drugs 26 .65
Settled and had a family 17 2.54
Drugs are expensive 17 2.54
I don‟t like to be addicted 10 0.98
Ashamed to be tagged as addict 10 0.98
No means to support the habit 8 0.78
Afraid to be imitated by my children 2 0.20
Became born again
2 0.20
Went back to school 1 0.10
TOTAL 1,022 100.00
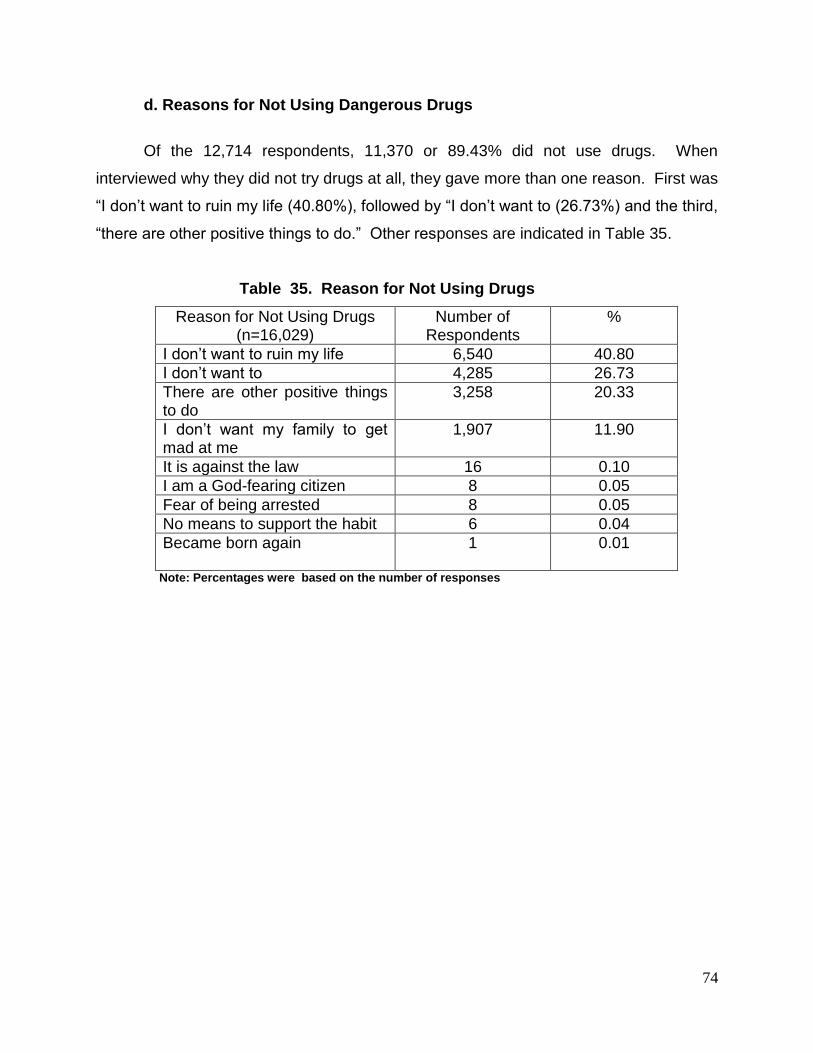
74
d. Reasons for Not Using Dangerous Drugs
Of the 12,714 respondents, 11,370 or 89.43% did not use drugs. When
interviewed why they did not try drugs at all, they gave more than one reason. First was
“I don‟t want to ruin my life (40.80%), followed by “I don‟t want to (26.73%) and the third,
“there are other positive things to do.” Other responses are indicated in Table 35.
Table 35. Reason for Not Using Drugs
Reason for Not Using Drugs (n=16,029)
Number of Respondents
%
I don‟t want to ruin my life 6,540 40.80
I don‟t want to 4,285 26.73
There are other positive things to do
3,258 20.33
I don‟t want my family to get mad at me
1,907 11.90
It is against the law 16 0.10
I am a God-fearing citizen 8 0.05
Fear of being arrested 8 0.05
No means to support the habit 6 0.04
Became born again
1 0.01
Note: Percentages were based on the number of responses
75
1. DRUG ABUSE AWARENESS & LEVEL OF AWARENESS ON THE FOLLOWING:
DRUG ABUSE PROBLEM IN THE BARANGAY, CITY/MUNICIPALITY & COUNTRY
PRESENCE OF USERS, PUSHERS & CLANDESTINE LABORATORIES IN THE BARANGAY
DRUG PREVENTION PROGRAMS IMPLEMENTED
AGENCIES IMPLEMENTING DRUG PREVENTION PROGRAMS IN THE BARANGAY
2. COMMENTS & RECOMMENDATIONS TO ADDRESS THE DRUG ABUSE PROBLEM
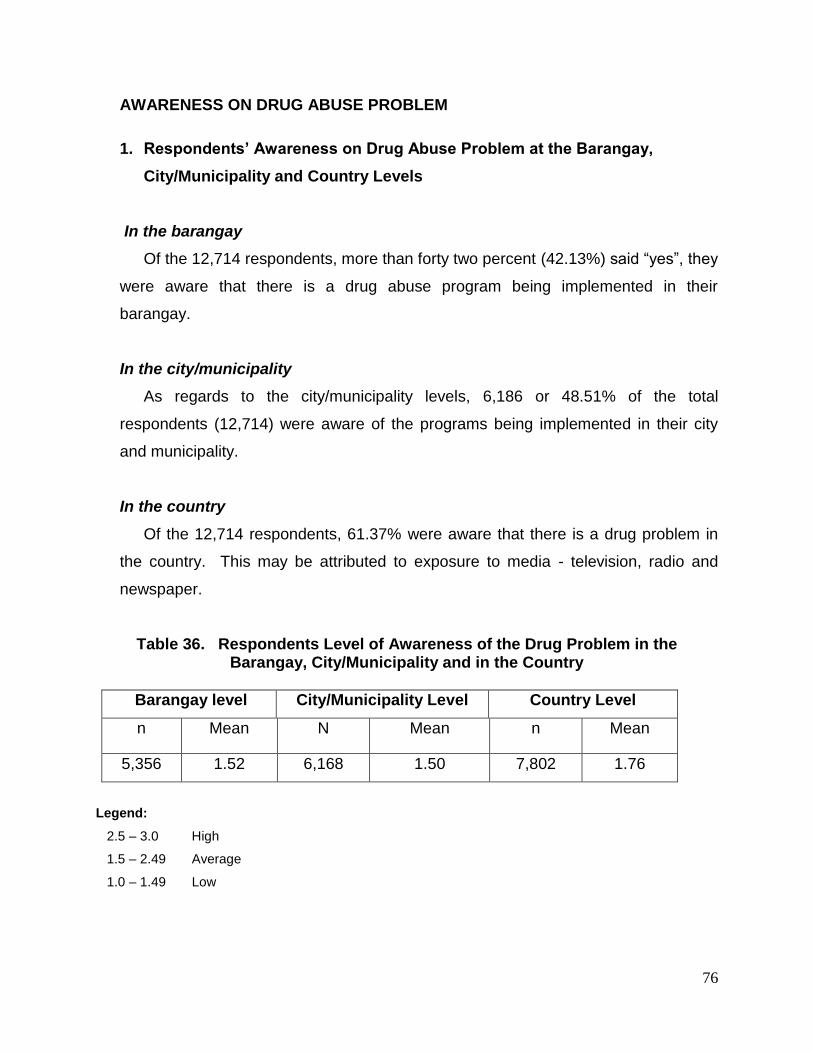
76
AWARENESS ON DRUG ABUSE PROBLEM
1. Respondents’ Awareness on Drug Abuse Problem at the Barangay,
City/Municipality and Country Levels
In the barangay
Of the 12,714 respondents, more than forty two percent (42.13%) said “yes”, they
were aware that there is a drug abuse program being implemented in their
barangay.
In the city/municipality
As regards to the city/municipality levels, 6,186 or 48.51% of the total
respondents (12,714) were aware of the programs being implemented in their city
and municipality.
In the country
Of the 12,714 respondents, 61.37% were aware that there is a drug problem in
the country. This may be attributed to exposure to media - television, radio and
newspaper.
Table 36. Respondents Level of Awareness of the Drug Problem in the Barangay, City/Municipality and in the Country
Barangay level City/Municipality Level Country Level
n Mean N Mean n Mean
5,356 1.52 6,168 1.50 7,802 1.76
Legend:
2.5 – 3.0 High
1.5 – 2.49 Average
1.0 – 1.49 Low
77
1.1 By Age Group
Of the respondents who said „yes‟ that they were aware of the drug abuse
problem in their barangay, the most aware were those from ages 10-19, followed by
those from 20-29 and 30-39. In the municipality/city and country level, the same age
groups were the most aware of the drug abuse problem. As in the findings across
regions, the respondents had knowledge most of the drug problem in the country
level followed by the city/municipality and least in their barangay.
Findings implies that people has the tendency to say no when asked whether
there is a drug problem in their barangay and municipality or city, but tend to say yes
if asked about it at the country level.
1.2 By Gender
Data reveal that males were more aware than the females on the drug abuse
problem in all levels (barangay, city/municipality and country) for the group of
respondents who said yes when ask if there is such problem. They were also most
aware of the country problem.
However, for those who said „no‟ that there was no such problem in their
barangay, city, municipality and country data revealed that the females were more
negative in their answers in the barangay but not in the country level. There were
more males who said no, than the females.
The trend shows that as the respondents‟ domain of the drug problem goes
farther from the barangay, the percentage of knowledge increases. It tends to show
that people would deny the existence such problem in their barangay but would
accept such happening in the country.
1.3 By Civil Status
Those who said yes to the presence of drug problem in the barangay,
municipality/city and country levels were mostly the married respondents. Those
who are single also recognized the problem followed by those who have live-in
partners. The same trend is observed that a minimum percentage would say it
78
happen in their barangay (33.57%) gradually increasing in the municipality/city level
(40.41%) and the country level (53.98%)
On the other hand, there were more people who deny the problem in the
barangay level (65.03%), gradually decreasing in the municipality/city level
(56.43%), and lower in the country level (42.88%)
1.4 By Highest Educational Attainment
The most number who recognized the problem of drug abuse in all levels
were the respondents who are in the high school. This corroborated the earlier
findings of the survey that those whose ages ranged from 10-19 were the most
knowledgeable of the presence of the drug problem. This was followed by those
who are in the college level and those who graduated from high school. The data
seem to suggest that education is a factor in the drug abuse problem awareness.
1.5 By Classification
When the respondents were grouped according to employment status, the
most number who said yes to the presence of drug abuse problem in the barangay,
municipality/city, and country levels, were the unemployed, possibly because they
were the ones vulnerable to the problem.
The students were the second large group who recognized the problem
followed by the employees in the private sector, the OSY or out of school youth,
those who own business, and the farmers. The awareness of these groups may be
brought by the fact that they have encountered the problem or have touched the
lives of their loved ones one way or another.
Awareness of Drug Problem at the Barangay, City/Municipality and Country
Levels By Region
In terms of awareness on the drug abuse problem at the Barangay level,
Region 7 respondents were the most aware, followed by Regions 5, and NCR. This
was based on those who said „yes‟ (5,356 or 42.13%) when asked if there is a
problem on drug abuse in their barangay. The least aware of the drug problem were
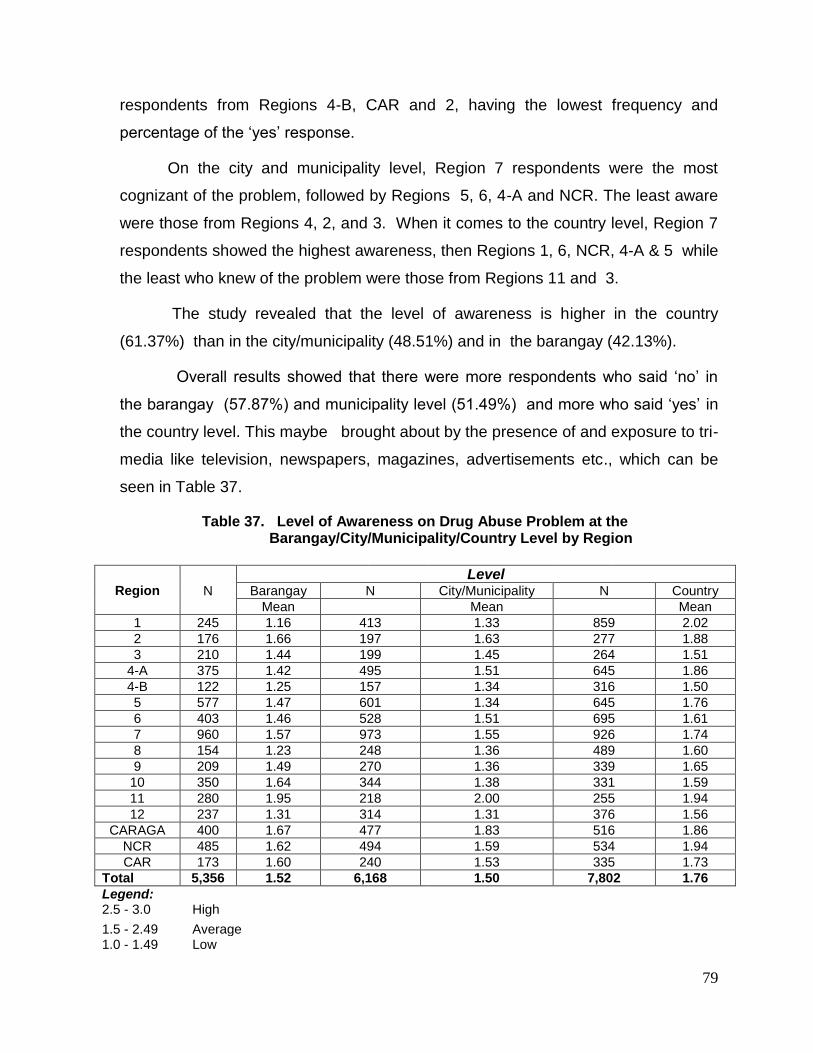
79
respondents from Regions 4-B, CAR and 2, having the lowest frequency and
percentage of the „yes‟ response.
On the city and municipality level, Region 7 respondents were the most
cognizant of the problem, followed by Regions 5, 6, 4-A and NCR. The least aware
were those from Regions 4, 2, and 3. When it comes to the country level, Region 7
respondents showed the highest awareness, then Regions 1, 6, NCR, 4-A & 5 while
the least who knew of the problem were those from Regions 11 and 3.
The study revealed that the level of awareness is higher in the country
(61.37%) than in the city/municipality (48.51%) and in the barangay (42.13%).
Overall results showed that there were more respondents who said „no‟ in
the barangay (57.87%) and municipality level (51.49%) and more who said „yes‟ in
the country level. This maybe brought about by the presence of and exposure to tri-
media like television, newspapers, magazines, advertisements etc., which can be
seen in Table 37.
Table 37. Level of Awareness on Drug Abuse Problem at the Barangay/City/Municipality/Country Level by Region
Level
Region N Barangay N City/Municipality N Country
Mean Mean Mean
1 245 1.16 413 1.33 859 2.02
2 176 1.66 197 1.63 277 1.88
3 210 1.44 199 1.45 264 1.51
4-A 375 1.42 495 1.51 645 1.86
4-B 122 1.25 157 1.34 316 1.50
5 577 1.47 601 1.34 645 1.76
6 403 1.46 528 1.51 695 1.61
7 960 1.57 973 1.55 926 1.74
8 154 1.23 248 1.36 489 1.60
9 209 1.49 270 1.36 339 1.65
10 350 1.64 344 1.38 331 1.59
11 280 1.95 218 2.00 255 1.94
12 237 1.31 314 1.31 376 1.56
CARAGA 400 1.67 477 1.83 516 1.86
NCR 485 1.62 494 1.59 534 1.94
CAR 173 1.60 240 1.53 335 1.73
Total 5,356 1.52 6,168 1.50 7,802 1.76
Legend: 2.5 - 3.0 High
1.5 - 2.49 Average 1.0 - 1.49 Low
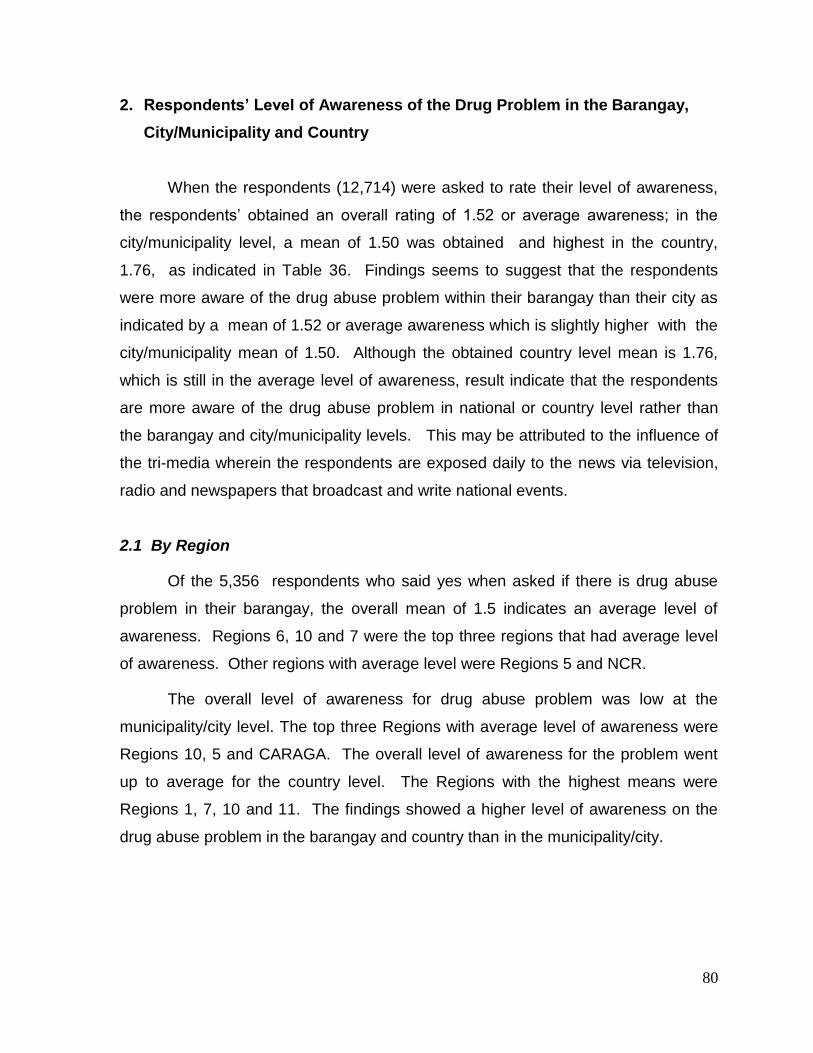
80
2. Respondents’ Level of Awareness of the Drug Problem in the Barangay,
City/Municipality and Country
When the respondents (12,714) were asked to rate their level of awareness,
the respondents‟ obtained an overall rating of 1.52 or average awareness; in the
city/municipality level, a mean of 1.50 was obtained and highest in the country,
1.76, as indicated in Table 36. Findings seems to suggest that the respondents
were more aware of the drug abuse problem within their barangay than their city as
indicated by a mean of 1.52 or average awareness which is slightly higher with the
city/municipality mean of 1.50. Although the obtained country level mean is 1.76,
which is still in the average level of awareness, result indicate that the respondents
are more aware of the drug abuse problem in national or country level rather than
the barangay and city/municipality levels. This may be attributed to the influence of
the tri-media wherein the respondents are exposed daily to the news via television,
radio and newspapers that broadcast and write national events.
2.1 By Region
Of the 5,356 respondents who said yes when asked if there is drug abuse
problem in their barangay, the overall mean of 1.5 indicates an average level of
awareness. Regions 6, 10 and 7 were the top three regions that had average level
of awareness. Other regions with average level were Regions 5 and NCR.
The overall level of awareness for drug abuse problem was low at the
municipality/city level. The top three Regions with average level of awareness were
Regions 10, 5 and CARAGA. The overall level of awareness for the problem went
up to average for the country level. The Regions with the highest means were
Regions 1, 7, 10 and 11. The findings showed a higher level of awareness on the
drug abuse problem in the barangay and country than in the municipality/city.
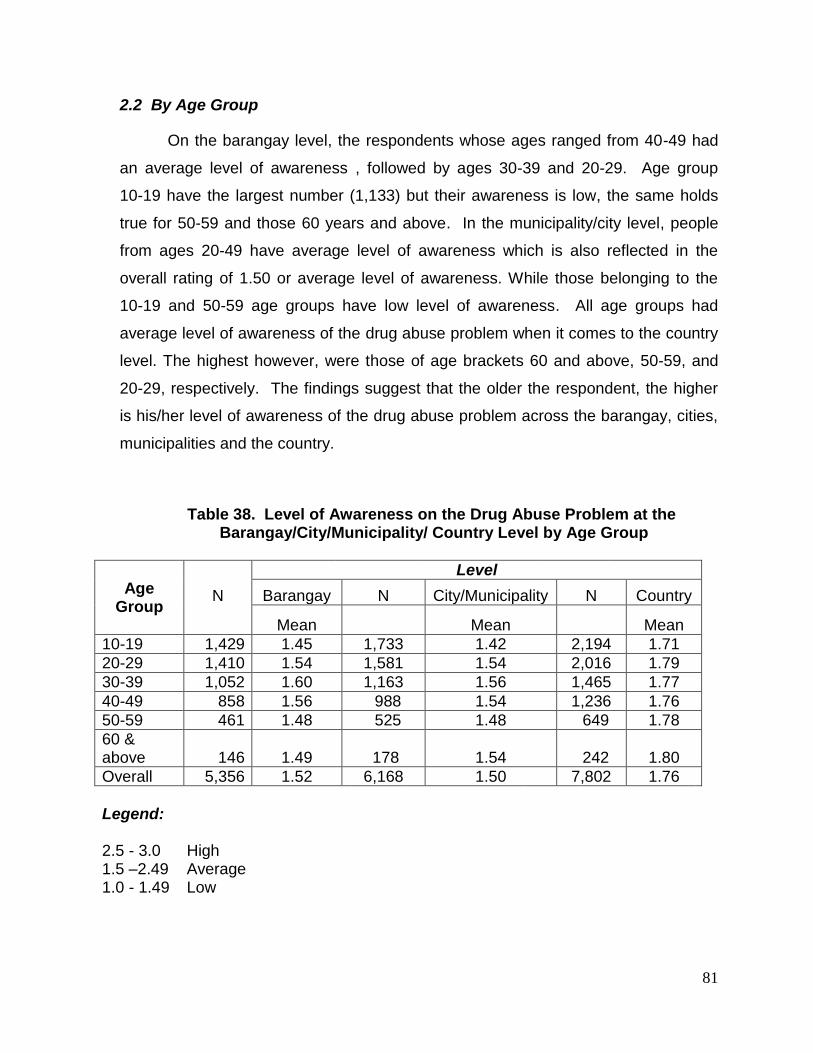
81
2.2 By Age Group
On the barangay level, the respondents whose ages ranged from 40-49 had
an average level of awareness , followed by ages 30-39 and 20-29. Age group
10-19 have the largest number (1,133) but their awareness is low, the same holds
true for 50-59 and those 60 years and above. In the municipality/city level, people
from ages 20-49 have average level of awareness which is also reflected in the
overall rating of 1.50 or average level of awareness. While those belonging to the
10-19 and 50-59 age groups have low level of awareness. All age groups had
average level of awareness of the drug abuse problem when it comes to the country
level. The highest however, were those of age brackets 60 and above, 50-59, and
20-29, respectively. The findings suggest that the older the respondent, the higher
is his/her level of awareness of the drug abuse problem across the barangay, cities,
municipalities and the country.
Table 38. Level of Awareness on the Drug Abuse Problem at the Barangay/City/Municipality/ Country Level by Age Group
Age
Group
Level
N Barangay N City/Municipality N Country
Mean Mean Mean
10-19 1,429 1.45 1,733 1.42 2,194 1.71
20-29 1,410 1.54 1,581 1.54 2,016 1.79
30-39 1,052 1.60 1,163 1.56 1,465 1.77
40-49 858 1.56 988 1.54 1,236 1.76
50-59 461 1.48 525 1.48 649 1.78
60 & above 146 1.49 178 1.54 242 1.80
Overall 5,356 1.52 6,168 1.50 7,802 1.76
Legend: 2.5 - 3.0 High 1.5 –2.49 Average 1.0 - 1.49 Low
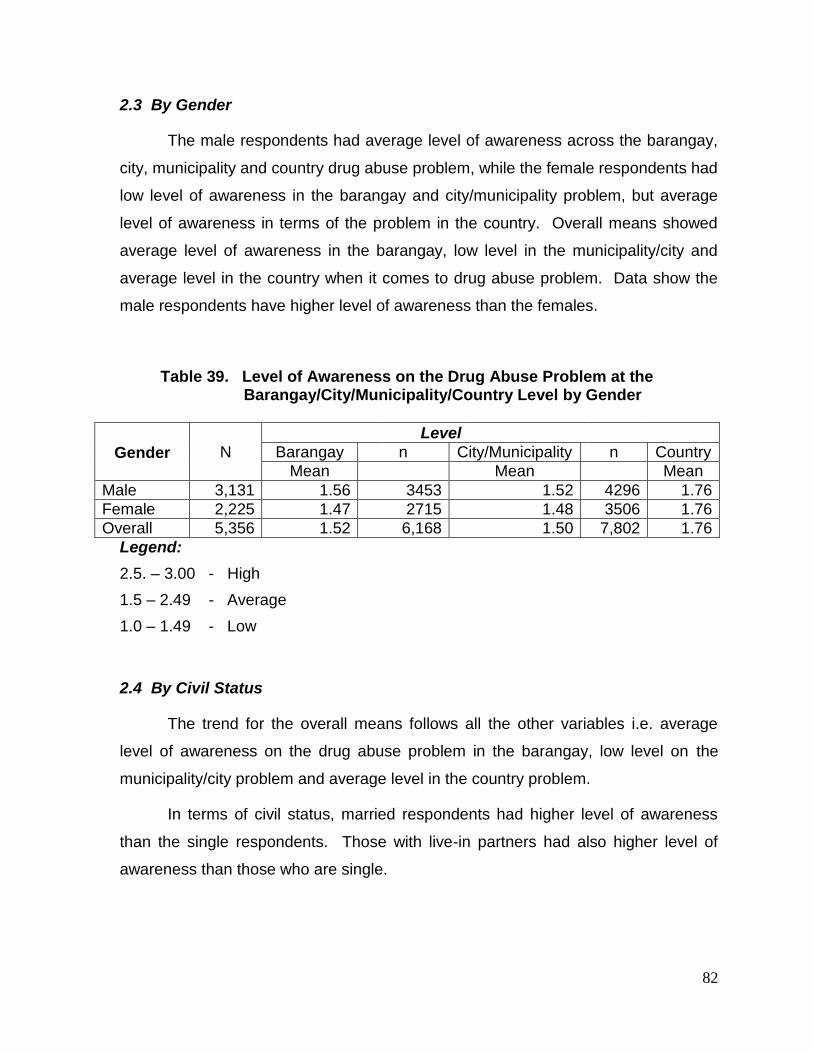
82
2.3 By Gender
The male respondents had average level of awareness across the barangay,
city, municipality and country drug abuse problem, while the female respondents had
low level of awareness in the barangay and city/municipality problem, but average
level of awareness in terms of the problem in the country. Overall means showed
average level of awareness in the barangay, low level in the municipality/city and
average level in the country when it comes to drug abuse problem. Data show the
male respondents have higher level of awareness than the females.
Table 39. Level of Awareness on the Drug Abuse Problem at the Barangay/City/Municipality/Country Level by Gender
Gender
Level
N Barangay n City/Municipality n Country
Mean Mean Mean
Male 3,131 1.56 3453 1.52 4296 1.76
Female 2,225 1.47 2715 1.48 3506 1.76
Overall 5,356 1.52 6,168 1.50 7,802 1.76
Legend:
2.5. – 3.00 - High
1.5 – 2.49 - Average
1.0 – 1.49 - Low
2.4 By Civil Status
The trend for the overall means follows all the other variables i.e. average
level of awareness on the drug abuse problem in the barangay, low level on the
municipality/city problem and average level in the country problem.
In terms of civil status, married respondents had higher level of awareness
than the single respondents. Those with live-in partners had also higher level of
awareness than those who are single.
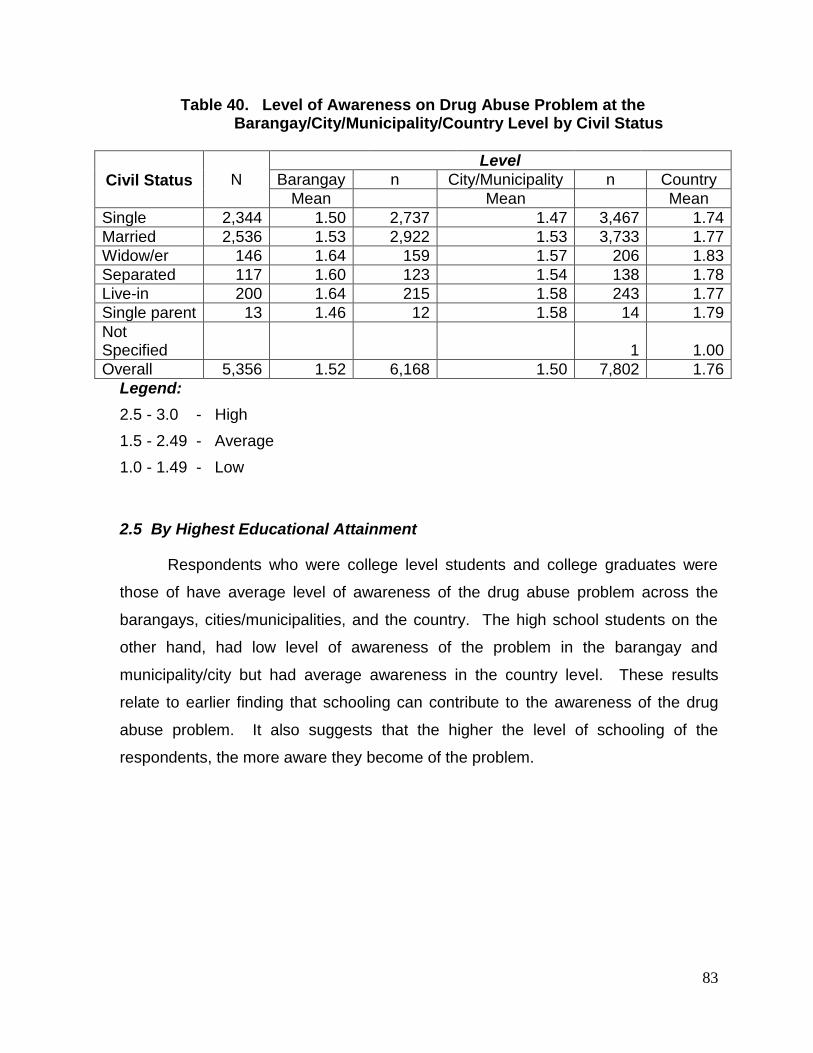
83
Table 40. Level of Awareness on Drug Abuse Problem at the Barangay/City/Municipality/Country Level by Civil Status
Civil Status
Level
N Barangay n City/Municipality n Country
Mean Mean Mean
Single 2,344 1.50 2,737 1.47 3,467 1.74
Married 2,536 1.53 2,922 1.53 3,733 1.77
Widow/er 146 1.64 159 1.57 206 1.83
Separated 117 1.60 123 1.54 138 1.78
Live-in 200 1.64 215 1.58 243 1.77
Single parent 13 1.46 12 1.58 14 1.79
Not Specified 1 1.00
Overall 5,356 1.52 6,168 1.50 7,802 1.76
Legend:
2.5 - 3.0 - High
1.5 - 2.49 - Average
1.0 - 1.49 - Low
2.5 By Highest Educational Attainment
Respondents who were college level students and college graduates were
those of have average level of awareness of the drug abuse problem across the
barangays, cities/municipalities, and the country. The high school students on the
other hand, had low level of awareness of the problem in the barangay and
municipality/city but had average awareness in the country level. These results
relate to earlier finding that schooling can contribute to the awareness of the drug
abuse problem. It also suggests that the higher the level of schooling of the
respondents, the more aware they become of the problem.
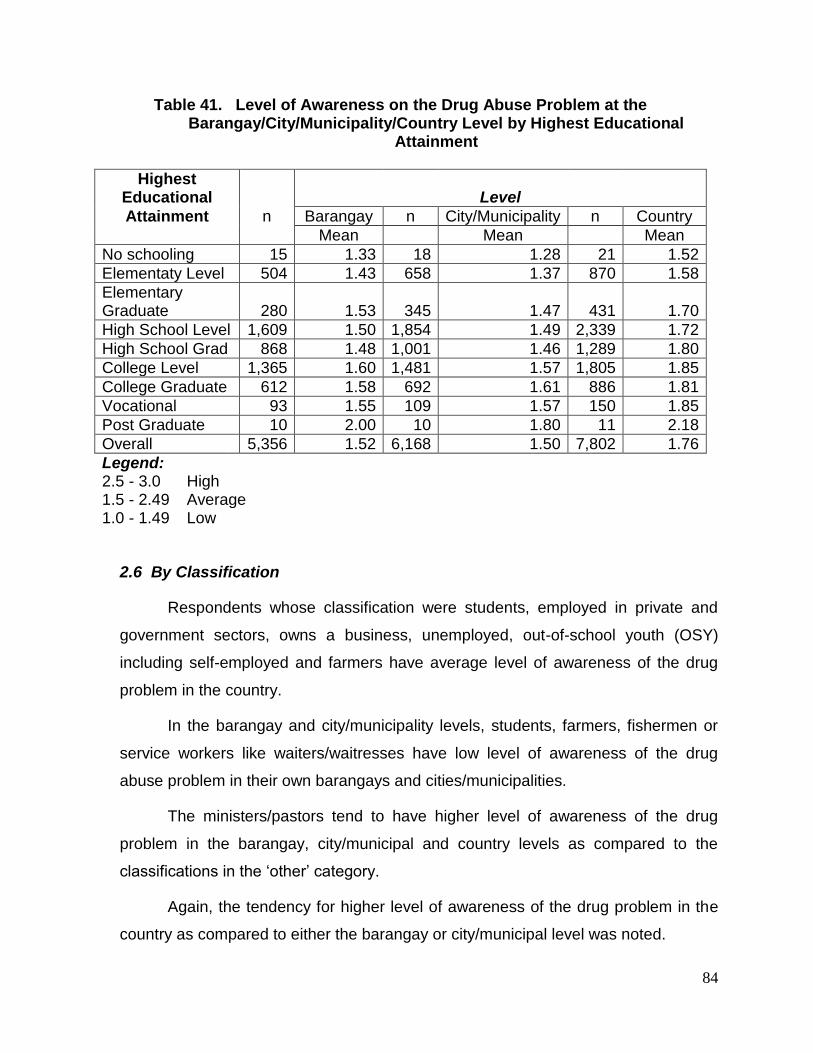
84
Table 41. Level of Awareness on the Drug Abuse Problem at the Barangay/City/Municipality/Country Level by Highest Educational
Attainment
Highest Educational Level
Attainment n Barangay n City/Municipality n Country
Mean Mean Mean
No schooling 15 1.33 18 1.28 21 1.52
Elementaty Level 504 1.43 658 1.37 870 1.58
Elementary Graduate 280 1.53 345 1.47 431 1.70
High School Level 1,609 1.50 1,854 1.49 2,339 1.72
High School Grad 868 1.48 1,001 1.46 1,289 1.80
College Level 1,365 1.60 1,481 1.57 1,805 1.85
College Graduate 612 1.58 692 1.61 886 1.81
Vocational 93 1.55 109 1.57 150 1.85
Post Graduate 10 2.00 10 1.80 11 2.18
Overall 5,356 1.52 6,168 1.50 7,802 1.76
Legend: 2.5 - 3.0 High 1.5 - 2.49 Average 1.0 - 1.49 Low
2.6 By Classification
Respondents whose classification were students, employed in private and
government sectors, owns a business, unemployed, out-of-school youth (OSY)
including self-employed and farmers have average level of awareness of the drug
problem in the country.
In the barangay and city/municipality levels, students, farmers, fishermen or
service workers like waiters/waitresses have low level of awareness of the drug
abuse problem in their own barangays and cities/municipalities.
The ministers/pastors tend to have higher level of awareness of the drug
problem in the barangay, city/municipal and country levels as compared to the
classifications in the „other‟ category.
Again, the tendency for higher level of awareness of the drug problem in the
country as compared to either the barangay or city/municipal level was noted.
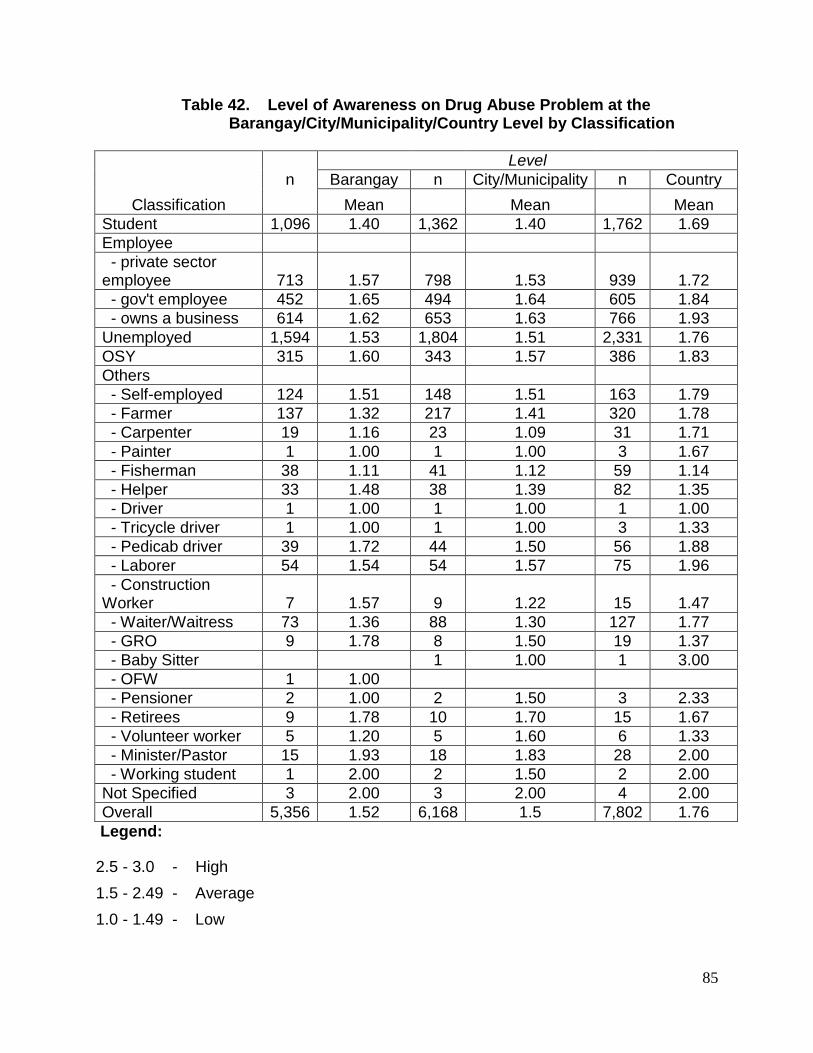
85
Table 42. Level of Awareness on Drug Abuse Problem at the Barangay/City/Municipality/Country Level by Classification
Classification
Level
n Barangay n City/Municipality n Country
Mean Mean Mean
Student 1,096 1.40 1,362 1.40 1,762 1.69
Employee
- private sector employee 713 1.57 798 1.53 939 1.72
- gov't employee 452 1.65 494 1.64 605 1.84
- owns a business 614 1.62 653 1.63 766 1.93
Unemployed 1,594 1.53 1,804 1.51 2,331 1.76
OSY 315 1.60 343 1.57 386 1.83
Others
- Self-employed 124 1.51 148 1.51 163 1.79
- Farmer 137 1.32 217 1.41 320 1.78
- Carpenter 19 1.16 23 1.09 31 1.71
- Painter 1 1.00 1 1.00 3 1.67
- Fisherman 38 1.11 41 1.12 59 1.14
- Helper 33 1.48 38 1.39 82 1.35
- Driver 1 1.00 1 1.00 1 1.00
- Tricycle driver 1 1.00 1 1.00 3 1.33
- Pedicab driver 39 1.72 44 1.50 56 1.88
- Laborer 54 1.54 54 1.57 75 1.96
- Construction Worker 7 1.57 9 1.22 15 1.47
- Waiter/Waitress 73 1.36 88 1.30 127 1.77
- GRO 9 1.78 8 1.50 19 1.37
- Baby Sitter 1 1.00 1 3.00
- OFW 1 1.00
- Pensioner 2 1.00 2 1.50 3 2.33
- Retirees 9 1.78 10 1.70 15 1.67
- Volunteer worker 5 1.20 5 1.60 6 1.33
- Minister/Pastor 15 1.93 18 1.83 28 2.00
- Working student 1 2.00 2 1.50 2 2.00
Not Specified 3 2.00 3 2.00 4 2.00
Overall 5,356 1.52 6,168 1.5 7,802 1.76
Legend:
2.5 - 3.0 - High
1.5 - 2.49 - Average
1.0 - 1.49 - Low
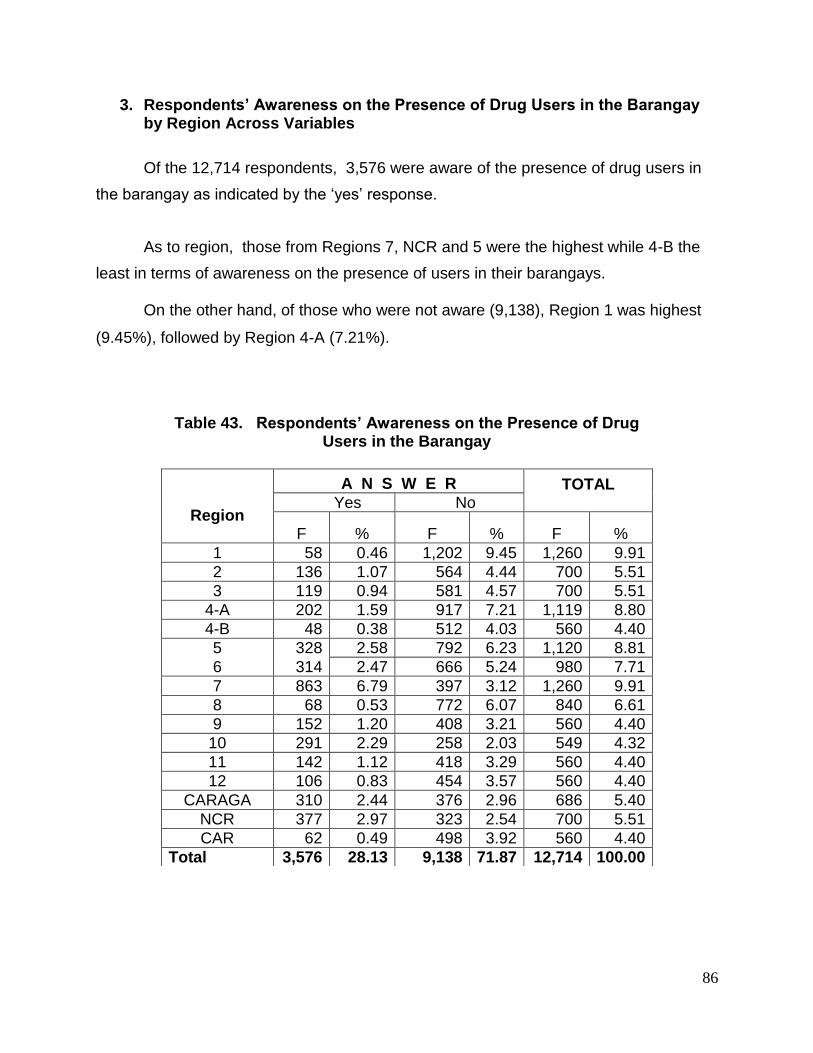
86
3. Respondents’ Awareness on the Presence of Drug Users in the Barangay by Region Across Variables
Of the 12,714 respondents, 3,576 were aware of the presence of drug users in
the barangay as indicated by the „yes‟ response.
As to region, those from Regions 7, NCR and 5 were the highest while 4-B the
least in terms of awareness on the presence of users in their barangays. On the other hand, of those who were not aware (9,138), Region 1 was highest
(9.45%), followed by Region 4-A (7.21%).
Table 43. Respondents’ Awareness on the Presence of Drug Users in the Barangay
Region
A N S W E R TOTAL Yes No
F % F % F %
1 58 0.46 1,202 9.45 1,260 9.91
2 136 1.07 564 4.44 700 5.51
3 119 0.94 581 4.57 700 5.51
4-A 202 1.59 917 7.21 1,119 8.80
4-B 48 0.38 512 4.03 560 4.40
5 328 2.58 792 6.23 1,120 8.81
6 314 2.47 666 5.24 980 7.71
7 863 6.79 397 3.12 1,260 9.91
8 68 0.53 772 6.07 840 6.61
9 152 1.20 408 3.21 560 4.40
10 291 2.29 258 2.03 549 4.32
11 142 1.12 418 3.29 560 4.40
12 106 0.83 454 3.57 560 4.40
CARAGA 310 2.44 376 2.96 686 5.40
NCR 377 2.97 323 2.54 700 5.51
CAR 62 0.49 498 3.92 560 4.40
Total 3,576 28.13 9,138 71.87 12,714 100.00
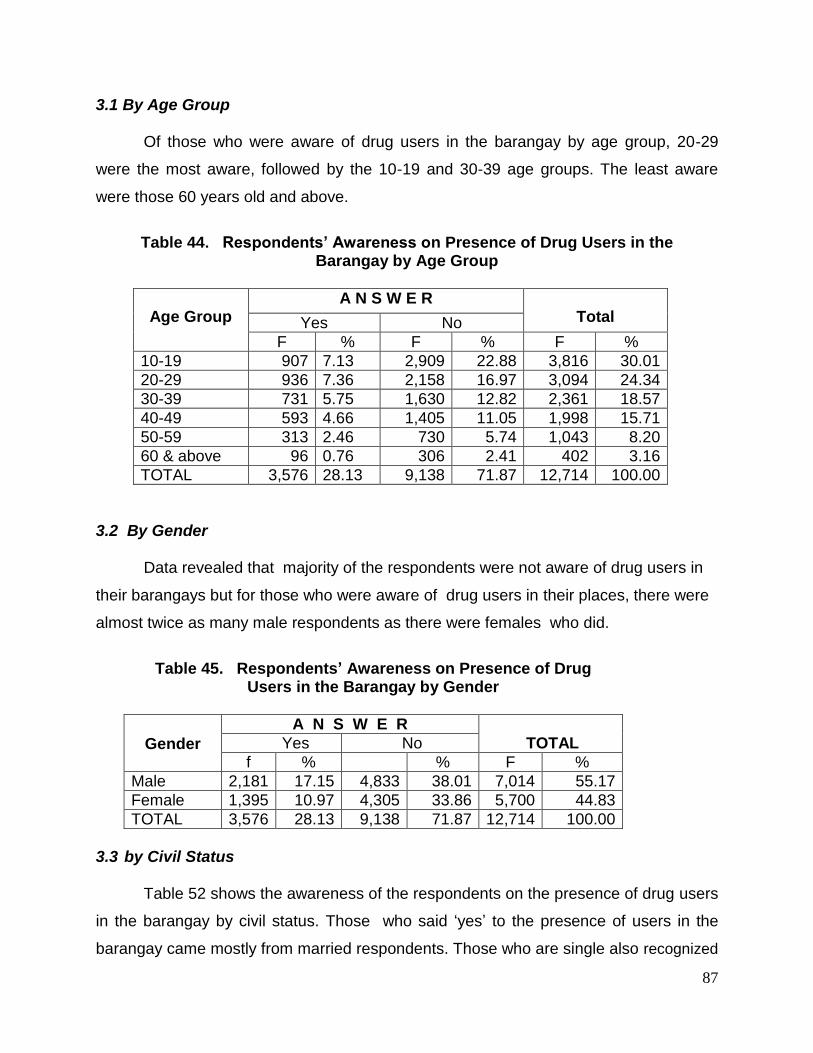
87
3.1 By Age Group Of those who were aware of drug users in the barangay by age group, 20-29
were the most aware, followed by the 10-19 and 30-39 age groups. The least aware
were those 60 years old and above.
Table 44. Respondents’ Awareness on Presence of Drug Users in the
Barangay by Age Group
Age Group
A N S W E R Total Yes No
F % F % F %
10-19 907 7.13 2,909 22.88 3,816 30.01
20-29 936 7.36 2,158 16.97 3,094 24.34
30-39 731 5.75 1,630 12.82 2,361 18.57
40-49 593 4.66 1,405 11.05 1,998 15.71
50-59 313 2.46 730 5.74 1,043 8.20
60 & above 96 0.76 306 2.41 402 3.16
TOTAL 3,576 28.13 9,138 71.87 12,714 100.00
3.2 By Gender
Data revealed that majority of the respondents were not aware of drug users in
their barangays but for those who were aware of drug users in their places, there were
almost twice as many male respondents as there were females who did.
Table 45. Respondents’ Awareness on Presence of Drug
Users in the Barangay by Gender
Gender
A N S W E R TOTAL Yes No
f % % F %
Male 2,181 17.15 4,833 38.01 7,014 55.17
Female 1,395 10.97 4,305 33.86 5,700 44.83
TOTAL 3,576 28.13 9,138 71.87 12,714 100.00
3.3 by Civil Status
Table 52 shows the awareness of the respondents on the presence of drug users
in the barangay by civil status. Those who said „yes‟ to the presence of users in the
barangay came mostly from married respondents. Those who are single also recognized
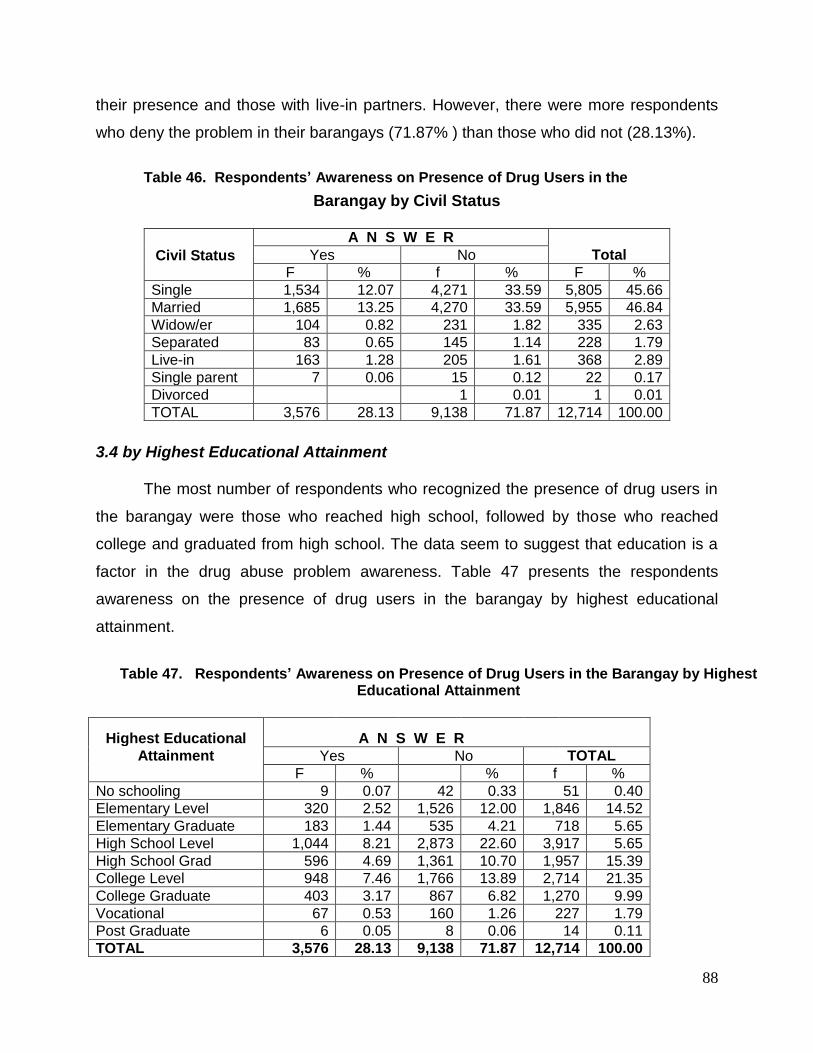
88
their presence and those with live-in partners. However, there were more respondents
who deny the problem in their barangays (71.87% ) than those who did not (28.13%).
Table 46. Respondents’ Awareness on Presence of Drug Users in the
3.4 by Highest Educational Attainment
The most number of respondents who recognized the presence of drug users in
the barangay were those who reached high school, followed by those who reached
college and graduated from high school. The data seem to suggest that education is a
factor in the drug abuse problem awareness. Table 47 presents the respondents
awareness on the presence of drug users in the barangay by highest educational
attainment.
Barangay by Civil Status
Civil Status
A N S W E R Total Yes No
F % f % F %
Single 1,534 12.07 4,271 33.59 5,805 45.66
Married 1,685 13.25 4,270 33.59 5,955 46.84
Widow/er 104 0.82 231 1.82 335 2.63
Separated 83 0.65 145 1.14 228 1.79
Live-in 163 1.28 205 1.61 368 2.89
Single parent 7 0.06 15 0.12 22 0.17
Divorced 1 0.01 1 0.01
TOTAL 3,576 28.13 9,138 71.87 12,714 100.00
Table 47. Respondents’ Awareness on Presence of Drug Users in the Barangay by Highest Educational Attainment
Highest Educational A N S W E R
Attainment Yes No TOTAL
F % % f %
No schooling 9 0.07 42 0.33 51 0.40
Elementary Level 320 2.52 1,526 12.00 1,846 14.52
Elementary Graduate 183 1.44 535 4.21 718 5.65
High School Level 1,044 8.21 2,873 22.60 3,917 5.65
High School Grad 596 4.69 1,361 10.70 1,957 15.39
College Level 948 7.46 1,766 13.89 2,714 21.35
College Graduate 403 3.17 867 6.82 1,270 9.99
Vocational 67 0.53 160 1.26 227 1.79
Post Graduate 6 0.05 8 0.06 14 0.11
TOTAL 3,576 28.13 9,138 71.87 12,714 100.00
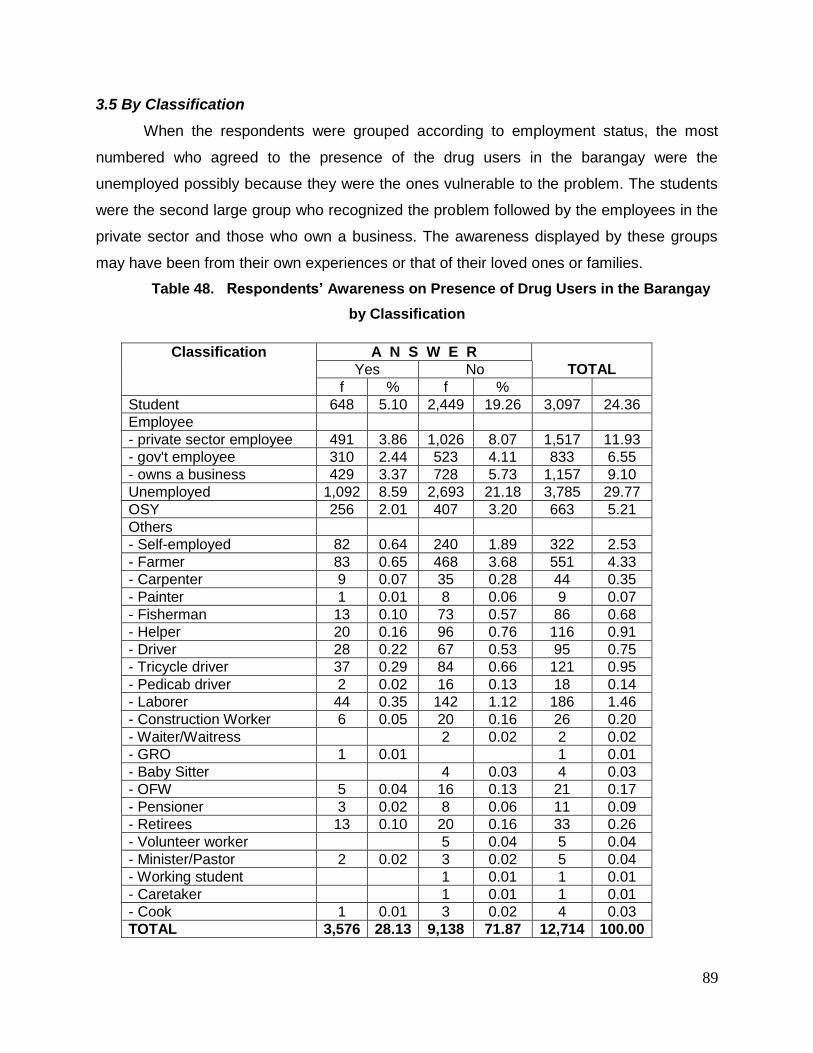
89
3.5 By Classification
When the respondents were grouped according to employment status, the most
numbered who agreed to the presence of the drug users in the barangay were the
unemployed possibly because they were the ones vulnerable to the problem. The students
were the second large group who recognized the problem followed by the employees in the
private sector and those who own a business. The awareness displayed by these groups
may have been from their own experiences or that of their loved ones or families.
Table 48. Respondents’ Awareness on Presence of Drug Users in the Barangay
by Classification
Classification A N S W E R
Yes No TOTAL
f % f %
Student 648 5.10 2,449 19.26 3,097 24.36
Employee
- private sector employee 491 3.86 1,026 8.07 1,517 11.93
- gov't employee 310 2.44 523 4.11 833 6.55
- owns a business 429 3.37 728 5.73 1,157 9.10
Unemployed 1,092 8.59 2,693 21.18 3,785 29.77
OSY 256 2.01 407 3.20 663 5.21
Others
- Self-employed 82 0.64 240 1.89 322 2.53
- Farmer 83 0.65 468 3.68 551 4.33
- Carpenter 9 0.07 35 0.28 44 0.35
- Painter 1 0.01 8 0.06 9 0.07
- Fisherman 13 0.10 73 0.57 86 0.68
- Helper 20 0.16 96 0.76 116 0.91
- Driver 28 0.22 67 0.53 95 0.75
- Tricycle driver 37 0.29 84 0.66 121 0.95
- Pedicab driver 2 0.02 16 0.13 18 0.14
- Laborer 44 0.35 142 1.12 186 1.46
- Construction Worker 6 0.05 20 0.16 26 0.20
- Waiter/Waitress 2 0.02 2 0.02
- GRO 1 0.01 1 0.01
- Baby Sitter 4 0.03 4 0.03
- OFW 5 0.04 16 0.13 21 0.17
- Pensioner 3 0.02 8 0.06 11 0.09
- Retirees 13 0.10 20 0.16 33 0.26
- Volunteer worker 5 0.04 5 0.04
- Minister/Pastor 2 0.02 3 0.02 5 0.04
- Working student 1 0.01 1 0.01
- Caretaker 1 0.01 1 0.01
- Cook 1 0.01 3 0.02 4 0.03
TOTAL 3,576 28.13 9,138 71.87 12,714 100.00
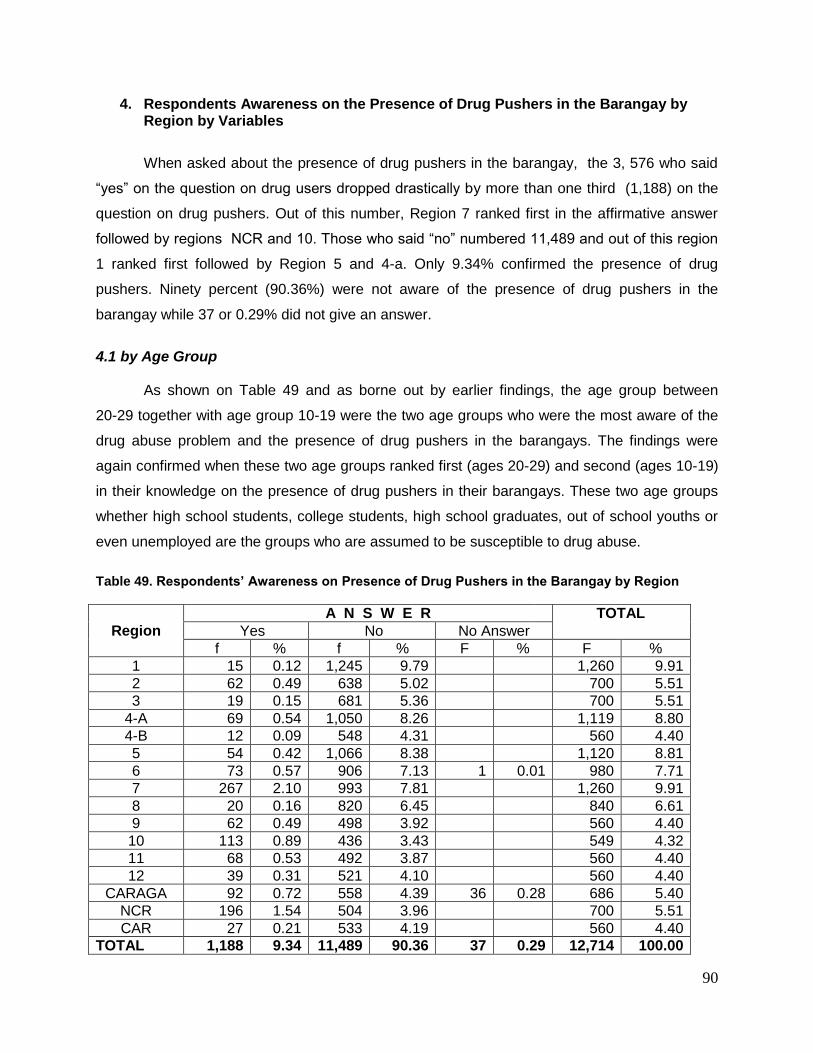
90
4. Respondents Awareness on the Presence of Drug Pushers in the Barangay by Region by Variables
When asked about the presence of drug pushers in the barangay, the 3, 576 who said
“yes” on the question on drug users dropped drastically by more than one third (1,188) on the
question on drug pushers. Out of this number, Region 7 ranked first in the affirmative answer
followed by regions NCR and 10. Those who said “no” numbered 11,489 and out of this region
1 ranked first followed by Region 5 and 4-a. Only 9.34% confirmed the presence of drug
pushers. Ninety percent (90.36%) were not aware of the presence of drug pushers in the
barangay while 37 or 0.29% did not give an answer.
4.1 by Age Group
As shown on Table 49 and as borne out by earlier findings, the age group between
20-29 together with age group 10-19 were the two age groups who were the most aware of the
drug abuse problem and the presence of drug pushers in the barangays. The findings were
again confirmed when these two age groups ranked first (ages 20-29) and second (ages 10-19)
in their knowledge on the presence of drug pushers in their barangays. These two age groups
whether high school students, college students, high school graduates, out of school youths or
even unemployed are the groups who are assumed to be susceptible to drug abuse.
Table 49. Respondents’ Awareness on Presence of Drug Pushers in the Barangay by Region
A N S W E R TOTAL
Region Yes No No Answer
f % f % F % F %
1 15 0.12 1,245 9.79 1,260 9.91
2 62 0.49 638 5.02 700 5.51
3 19 0.15 681 5.36 700 5.51
4-A 69 0.54 1,050 8.26 1,119 8.80
4-B 12 0.09 548 4.31 560 4.40
5 54 0.42 1,066 8.38 1,120 8.81
6 73 0.57 906 7.13 1 0.01 980 7.71
7 267 2.10 993 7.81 1,260 9.91
8 20 0.16 820 6.45 840 6.61
9 62 0.49 498 3.92 560 4.40
10 113 0.89 436 3.43 549 4.32
11 68 0.53 492 3.87 560 4.40
12 39 0.31 521 4.10 560 4.40
CARAGA 92 0.72 558 4.39 36 0.28 686 5.40
NCR 196 1.54 504 3.96 700 5.51
CAR 27 0.21 533 4.19 560 4.40
TOTAL 1,188 9.34 11,489 90.36 37 0.29 12,714 100.00
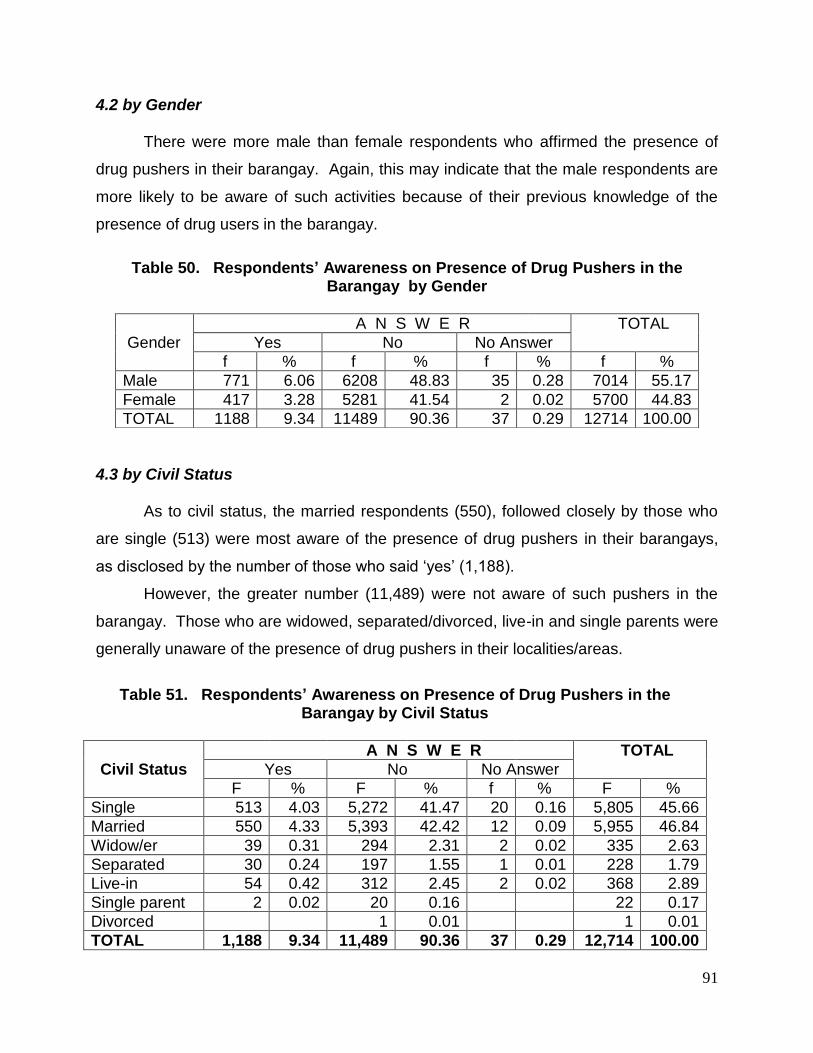
91
4.2 by Gender
There were more male than female respondents who affirmed the presence of
drug pushers in their barangay. Again, this may indicate that the male respondents are
more likely to be aware of such activities because of their previous knowledge of the
presence of drug users in the barangay.
4.3 by Civil Status As to civil status, the married respondents (550), followed closely by those who
are single (513) were most aware of the presence of drug pushers in their barangays,
as disclosed by the number of those who said „yes‟ (1,188).
However, the greater number (11,489) were not aware of such pushers in the
barangay. Those who are widowed, separated/divorced, live-in and single parents were
generally unaware of the presence of drug pushers in their localities/areas.
Table 51. Respondents’ Awareness on Presence of Drug Pushers in the
Barangay by Civil Status
A N S W E R TOTAL
Civil Status Yes No No Answer
F % F % f % F %
Single 513 4.03 5,272 41.47 20 0.16 5,805 45.66
Married 550 4.33 5,393 42.42 12 0.09 5,955 46.84
Widow/er 39 0.31 294 2.31 2 0.02 335 2.63
Separated 30 0.24 197 1.55 1 0.01 228 1.79
Live-in 54 0.42 312 2.45 2 0.02 368 2.89
Single parent 2 0.02 20 0.16 22 0.17
Divorced 1 0.01 1 0.01
TOTAL 1,188 9.34 11,489 90.36 37 0.29 12,714 100.00
Table 50. Respondents’ Awareness on Presence of Drug Pushers in the Barangay by Gender
A N S W E R TOTAL
Gender Yes No No Answer
f % f % f % f %
Male 771 6.06 6208 48.83 35 0.28 7014 55.17
Female 417 3.28 5281 41.54 2 0.02 5700 44.83
TOTAL 1188 9.34 11489 90.36 37 0.29 12714 100.00
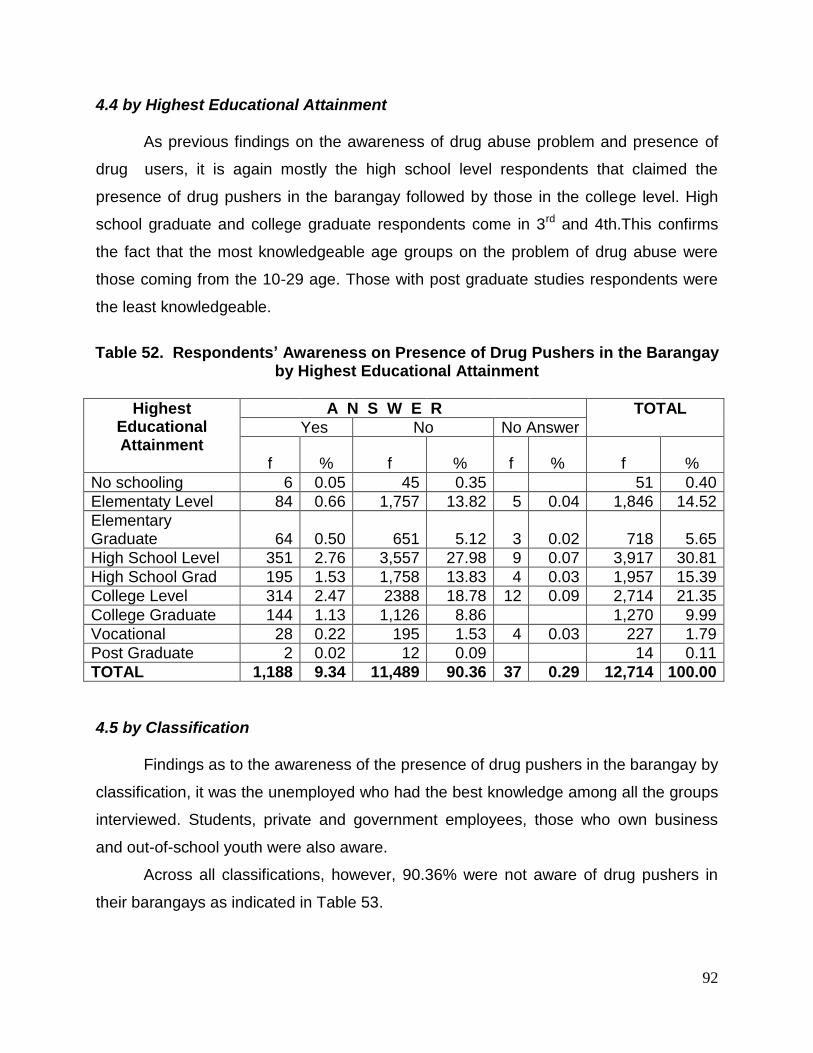
92
4.4 by Highest Educational Attainment
As previous findings on the awareness of drug abuse problem and presence of
drug users, it is again mostly the high school level respondents that claimed the
presence of drug pushers in the barangay followed by those in the college level. High
school graduate and college graduate respondents come in 3rd and 4th.This confirms
the fact that the most knowledgeable age groups on the problem of drug abuse were
those coming from the 10-29 age. Those with post graduate studies respondents were
the least knowledgeable.
Table 52. Respondents’ Awareness on Presence of Drug Pushers in the Barangay
by Highest Educational Attainment
Highest Educational Attainment
A N S W E R TOTAL
Yes No No Answer
f % f % f % f %
No schooling 6 0.05 45 0.35 51 0.40
Elementaty Level 84 0.66 1,757 13.82 5 0.04 1,846 14.52
Elementary Graduate 64 0.50 651 5.12 3 0.02 718 5.65
High School Level 351 2.76 3,557 27.98 9 0.07 3,917 30.81
High School Grad 195 1.53 1,758 13.83 4 0.03 1,957 15.39
College Level 314 2.47 2388 18.78 12 0.09 2,714 21.35
College Graduate 144 1.13 1,126 8.86 1,270 9.99
Vocational 28 0.22 195 1.53 4 0.03 227 1.79
Post Graduate 2 0.02 12 0.09 14 0.11
TOTAL 1,188 9.34 11,489 90.36 37 0.29 12,714 100.00
4.5 by Classification
Findings as to the awareness of the presence of drug pushers in the barangay by
classification, it was the unemployed who had the best knowledge among all the groups
interviewed. Students, private and government employees, those who own business
and out-of-school youth were also aware.
Across all classifications, however, 90.36% were not aware of drug pushers in
their barangays as indicated in Table 53.
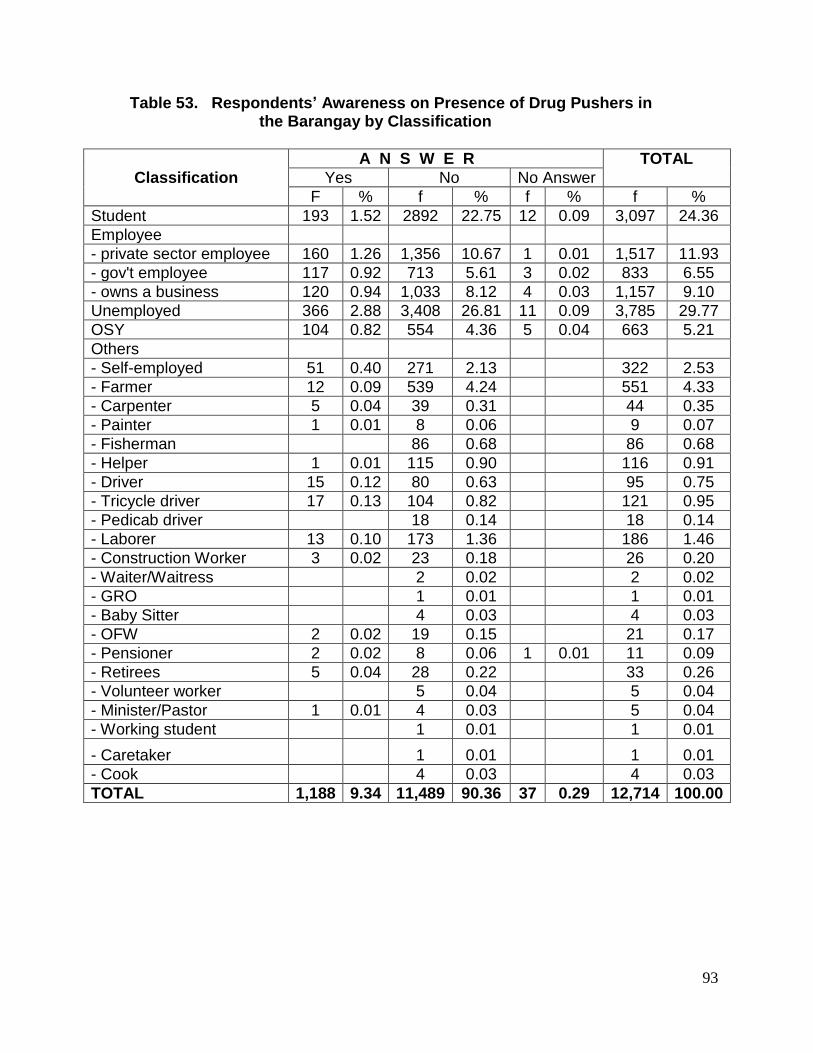
93
Table 53. Respondents’ Awareness on Presence of Drug Pushers in the Barangay by Classification
A N S W E R TOTAL
Classification Yes No No Answer
F % f % f % f %
Student 193 1.52 2892 22.75 12 0.09 3,097 24.36
Employee
- private sector employee 160 1.26 1,356 10.67 1 0.01 1,517 11.93
- gov't employee 117 0.92 713 5.61 3 0.02 833 6.55
- owns a business 120 0.94 1,033 8.12 4 0.03 1,157 9.10
Unemployed 366 2.88 3,408 26.81 11 0.09 3,785 29.77
OSY 104 0.82 554 4.36 5 0.04 663 5.21
Others
- Self-employed 51 0.40 271 2.13 322 2.53
- Farmer 12 0.09 539 4.24 551 4.33
- Carpenter 5 0.04 39 0.31 44 0.35
- Painter 1 0.01 8 0.06 9 0.07
- Fisherman 86 0.68 86 0.68
- Helper 1 0.01 115 0.90 116 0.91
- Driver 15 0.12 80 0.63 95 0.75
- Tricycle driver 17 0.13 104 0.82 121 0.95
- Pedicab driver 18 0.14 18 0.14
- Laborer 13 0.10 173 1.36 186 1.46
- Construction Worker 3 0.02 23 0.18 26 0.20
- Waiter/Waitress 2 0.02 2 0.02
- GRO 1 0.01 1 0.01
- Baby Sitter 4 0.03 4 0.03
- OFW 2 0.02 19 0.15 21 0.17
- Pensioner 2 0.02 8 0.06 1 0.01 11 0.09
- Retirees 5 0.04 28 0.22 33 0.26
- Volunteer worker 5 0.04 5 0.04
- Minister/Pastor 1 0.01 4 0.03 5 0.04
- Working student 1 0.01 1 0.01
- Caretaker 1 0.01 1 0.01
- Cook 4 0.03 4 0.03
TOTAL 1,188 9.34 11,489 90.36 37 0.29 12,714 100.00
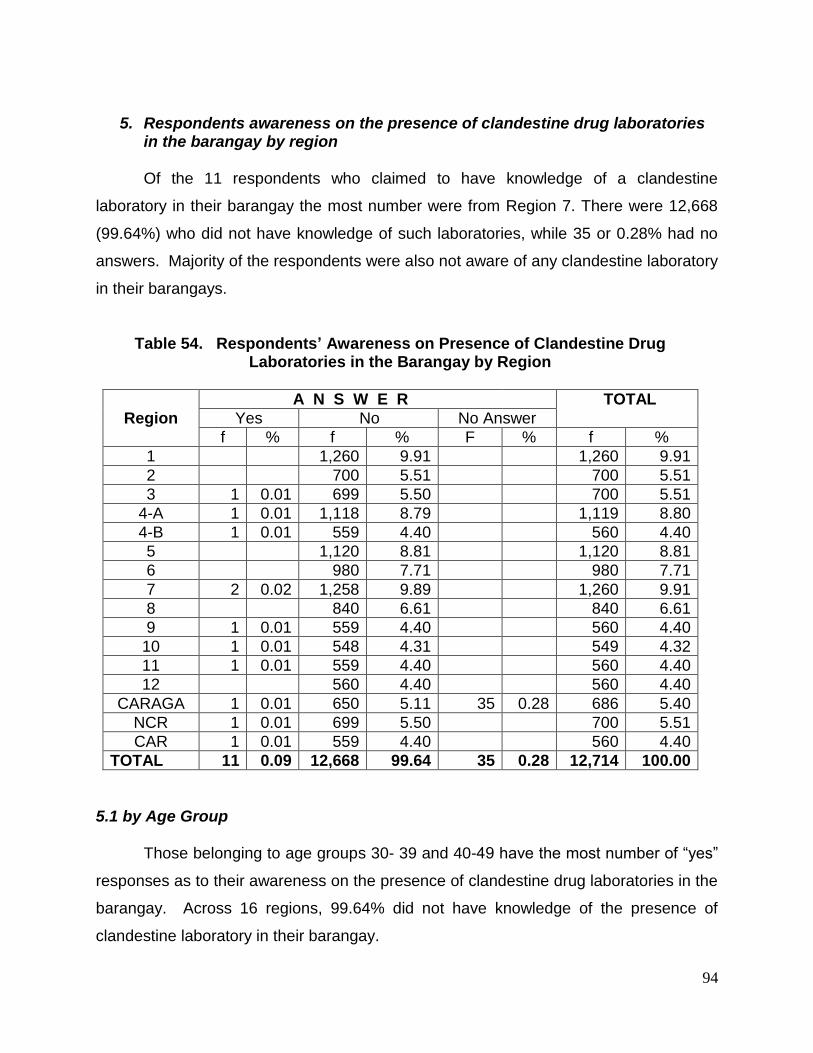
94
5. Respondents awareness on the presence of clandestine drug laboratories
in the barangay by region
Of the 11 respondents who claimed to have knowledge of a clandestine
laboratory in their barangay the most number were from Region 7. There were 12,668
(99.64%) who did not have knowledge of such laboratories, while 35 or 0.28% had no
answers. Majority of the respondents were also not aware of any clandestine laboratory
in their barangays.
Table 54. Respondents’ Awareness on Presence of Clandestine Drug Laboratories in the Barangay by Region
A N S W E R TOTAL
Region Yes No No Answer
f % f % F % f %
1 1,260 9.91 1,260 9.91
2 700 5.51 700 5.51
3 1 0.01 699 5.50 700 5.51
4-A 1 0.01 1,118 8.79 1,119 8.80
4-B 1 0.01 559 4.40 560 4.40
5 1,120 8.81 1,120 8.81
6 980 7.71 980 7.71
7 2 0.02 1,258 9.89 1,260 9.91
8 840 6.61 840 6.61
9 1 0.01 559 4.40 560 4.40
10 1 0.01 548 4.31 549 4.32
11 1 0.01 559 4.40 560 4.40
12 560 4.40 560 4.40
CARAGA 1 0.01 650 5.11 35 0.28 686 5.40
NCR 1 0.01 699 5.50 700 5.51
CAR 1 0.01 559 4.40 560 4.40
TOTAL 11 0.09 12,668 99.64 35 0.28 12,714 100.00
5.1 by Age Group
Those belonging to age groups 30- 39 and 40-49 have the most number of “yes”
responses as to their awareness on the presence of clandestine drug laboratories in the
barangay. Across 16 regions, 99.64% did not have knowledge of the presence of
clandestine laboratory in their barangay.
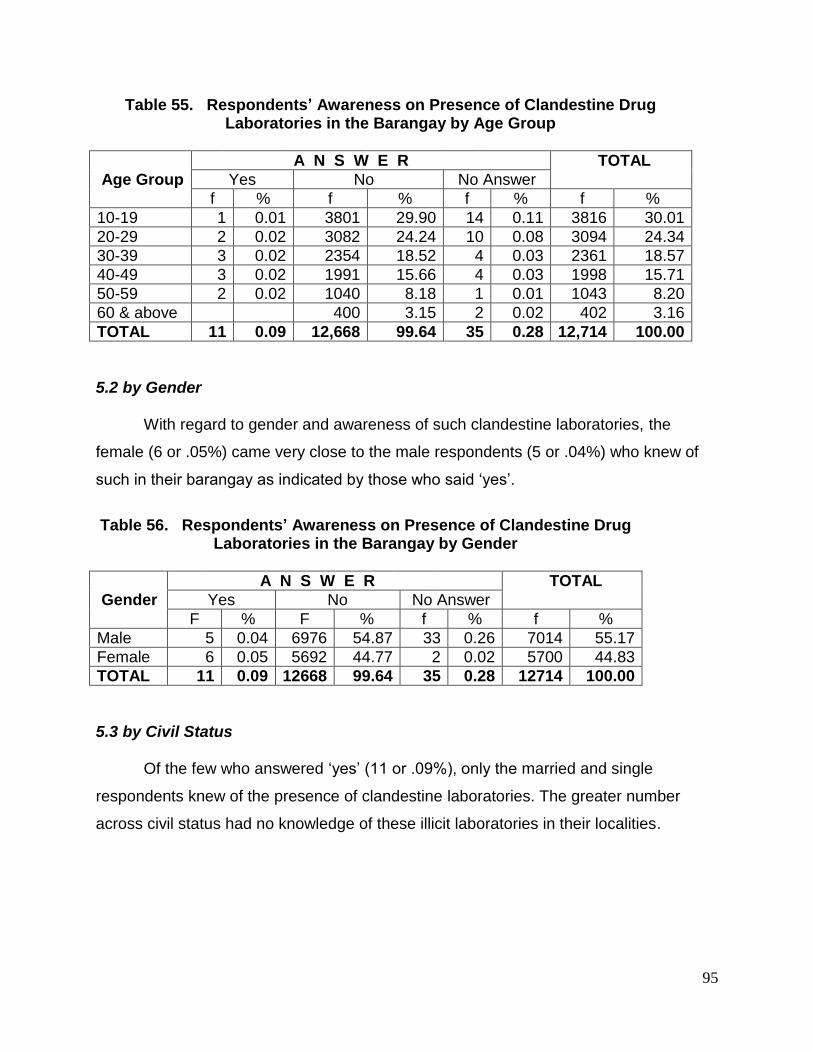
95
Table 55. Respondents’ Awareness on Presence of Clandestine Drug Laboratories in the Barangay by Age Group
A N S W E R TOTAL
Age Group Yes No No Answer
f % f % f % f %
10-19 1 0.01 3801 29.90 14 0.11 3816 30.01
20-29 2 0.02 3082 24.24 10 0.08 3094 24.34
30-39 3 0.02 2354 18.52 4 0.03 2361 18.57
40-49 3 0.02 1991 15.66 4 0.03 1998 15.71
50-59 2 0.02 1040 8.18 1 0.01 1043 8.20
60 & above 400 3.15 2 0.02 402 3.16
TOTAL 11 0.09 12,668 99.64 35 0.28 12,714 100.00
5.2 by Gender
With regard to gender and awareness of such clandestine laboratories, the
female (6 or .05%) came very close to the male respondents (5 or .04%) who knew of
such in their barangay as indicated by those who said „yes‟.
Table 56. Respondents’ Awareness on Presence of Clandestine Drug
Laboratories in the Barangay by Gender
A N S W E R TOTAL
Gender Yes No No Answer
F % F % f % f %
Male 5 0.04 6976 54.87 33 0.26 7014 55.17
Female 6 0.05 5692 44.77 2 0.02 5700 44.83
TOTAL 11 0.09 12668 99.64 35 0.28 12714 100.00
5.3 by Civil Status
Of the few who answered „yes‟ (11 or .09%), only the married and single
respondents knew of the presence of clandestine laboratories. The greater number
across civil status had no knowledge of these illicit laboratories in their localities.
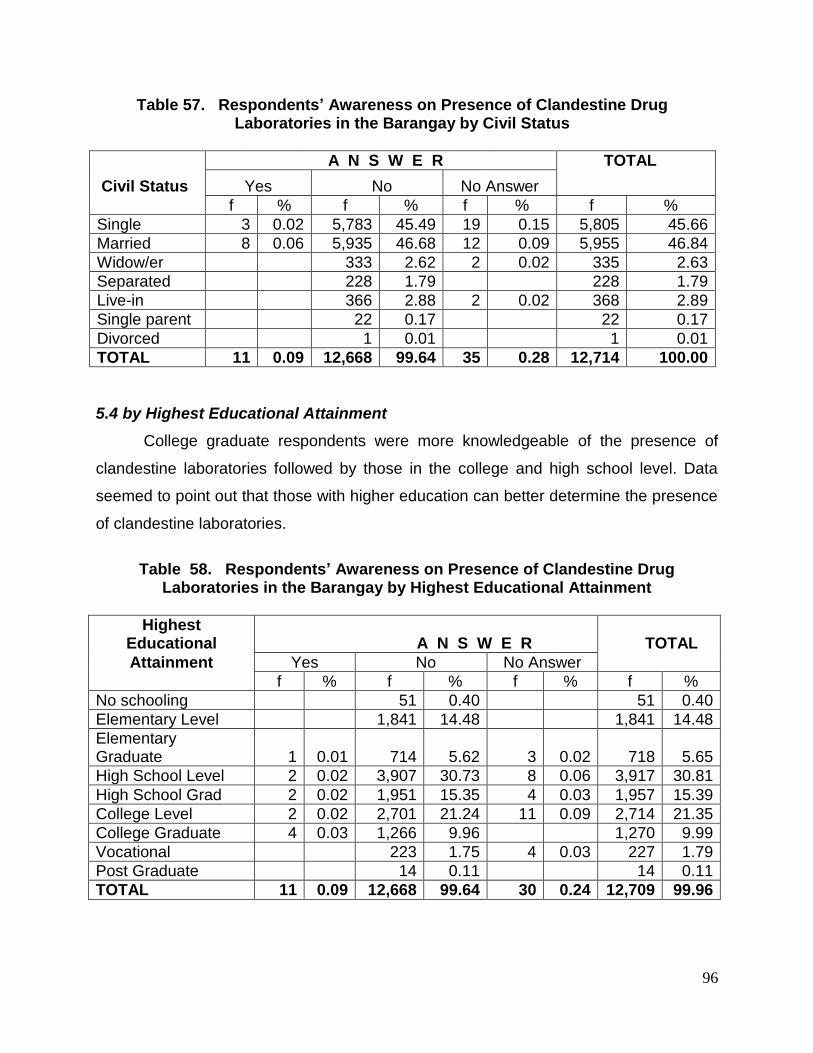
96
Table 57. Respondents’ Awareness on Presence of Clandestine Drug Laboratories in the Barangay by Civil Status
A N S W E R TOTAL
Civil Status Yes No No Answer
f % f % f % f %
Single 3 0.02 5,783 45.49 19 0.15 5,805 45.66
Married 8 0.06 5,935 46.68 12 0.09 5,955 46.84
Widow/er 333 2.62 2 0.02 335 2.63
Separated 228 1.79 228 1.79
Live-in 366 2.88 2 0.02 368 2.89
Single parent 22 0.17 22 0.17
Divorced 1 0.01 1 0.01
TOTAL 11 0.09 12,668 99.64 35 0.28 12,714 100.00
5.4 by Highest Educational Attainment
College graduate respondents were more knowledgeable of the presence of
clandestine laboratories followed by those in the college and high school level. Data
seemed to point out that those with higher education can better determine the presence
of clandestine laboratories.
Table 58. Respondents’ Awareness on Presence of Clandestine Drug
Laboratories in the Barangay by Highest Educational Attainment
Highest Educational A N S W E R TOTAL
Attainment Yes No No Answer
f % f % f % f %
No schooling 51 0.40 51 0.40
Elementary Level 1,841 14.48 1,841 14.48
Elementary Graduate 1 0.01 714 5.62 3 0.02 718 5.65
High School Level 2 0.02 3,907 30.73 8 0.06 3,917 30.81
High School Grad 2 0.02 1,951 15.35 4 0.03 1,957 15.39
College Level 2 0.02 2,701 21.24 11 0.09 2,714 21.35
College Graduate 4 0.03 1,266 9.96 1,270 9.99
Vocational 223 1.75 4 0.03 227 1.79
Post Graduate 14 0.11 14 0.11
TOTAL 11 0.09 12,668 99.64 30 0.24 12,709 99.96
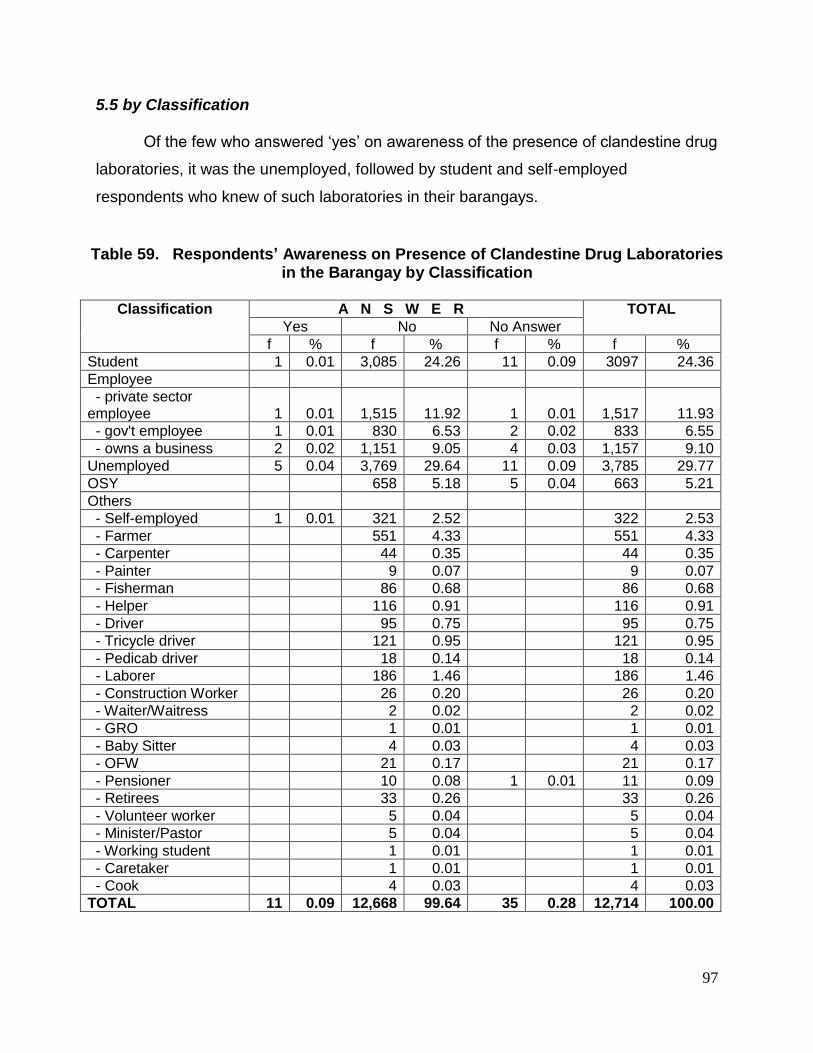
97
5.5 by Classification
Of the few who answered „yes‟ on awareness of the presence of clandestine drug
laboratories, it was the unemployed, followed by student and self-employed
respondents who knew of such laboratories in their barangays.
Table 59. Respondents’ Awareness on Presence of Clandestine Drug Laboratories in the Barangay by Classification
Classification A N S W E R TOTAL
Yes No No Answer
f % f % f % f %
Student 1 0.01 3,085 24.26 11 0.09 3097 24.36
Employee
- private sector employee 1 0.01 1,515 11.92 1 0.01 1,517 11.93
- gov't employee 1 0.01 830 6.53 2 0.02 833 6.55
- owns a business 2 0.02 1,151 9.05 4 0.03 1,157 9.10
Unemployed 5 0.04 3,769 29.64 11 0.09 3,785 29.77
OSY 658 5.18 5 0.04 663 5.21
Others
- Self-employed 1 0.01 321 2.52 322 2.53
- Farmer 551 4.33 551 4.33
- Carpenter 44 0.35 44 0.35
- Painter 9 0.07 9 0.07
- Fisherman 86 0.68 86 0.68
- Helper 116 0.91 116 0.91
- Driver 95 0.75 95 0.75
- Tricycle driver 121 0.95 121 0.95
- Pedicab driver 18 0.14 18 0.14
- Laborer 186 1.46 186 1.46
- Construction Worker 26 0.20 26 0.20
- Waiter/Waitress 2 0.02 2 0.02
- GRO 1 0.01 1 0.01
- Baby Sitter 4 0.03 4 0.03
- OFW 21 0.17 21 0.17
- Pensioner 10 0.08 1 0.01 11 0.09
- Retirees 33 0.26 33 0.26
- Volunteer worker 5 0.04 5 0.04
- Minister/Pastor 5 0.04 5 0.04
- Working student 1 0.01 1 0.01
- Caretaker 1 0.01 1 0.01
- Cook 4 0.03 4 0.03
TOTAL 11 0.09 12,668 99.64 35 0.28 12,714 100.00
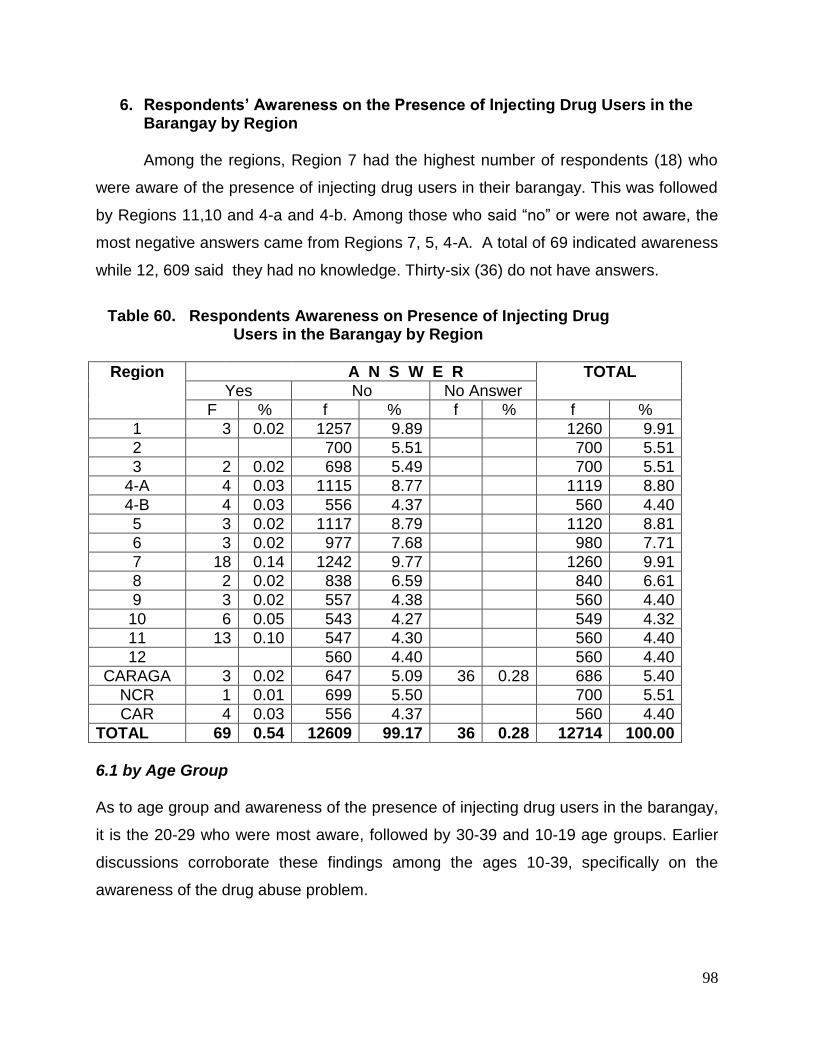
98
6. Respondents’ Awareness on the Presence of Injecting Drug Users in the Barangay by Region
Among the regions, Region 7 had the highest number of respondents (18) who
were aware of the presence of injecting drug users in their barangay. This was followed
by Regions 11,10 and 4-a and 4-b. Among those who said “no” or were not aware, the
most negative answers came from Regions 7, 5, 4-A. A total of 69 indicated awareness
while 12, 609 said they had no knowledge. Thirty-six (36) do not have answers.
Table 60. Respondents Awareness on Presence of Injecting Drug
Users in the Barangay by Region
Region A N S W E R TOTAL
Yes No No Answer
F % f % f % f %
1 3 0.02 1257 9.89 1260 9.91
2 700 5.51 700 5.51
3 2 0.02 698 5.49 700 5.51
4-A 4 0.03 1115 8.77 1119 8.80
4-B 4 0.03 556 4.37 560 4.40
5 3 0.02 1117 8.79 1120 8.81
6 3 0.02 977 7.68 980 7.71
7 18 0.14 1242 9.77 1260 9.91
8 2 0.02 838 6.59 840 6.61
9 3 0.02 557 4.38 560 4.40
10 6 0.05 543 4.27 549 4.32
11 13 0.10 547 4.30 560 4.40
12 560 4.40 560 4.40
CARAGA 3 0.02 647 5.09 36 0.28 686 5.40
NCR 1 0.01 699 5.50 700 5.51
CAR 4 0.03 556 4.37 560 4.40
TOTAL 69 0.54 12609 99.17 36 0.28 12714 100.00
6.1 by Age Group As to age group and awareness of the presence of injecting drug users in the barangay,
it is the 20-29 who were most aware, followed by 30-39 and 10-19 age groups. Earlier
discussions corroborate these findings among the ages 10-39, specifically on the
awareness of the drug abuse problem.
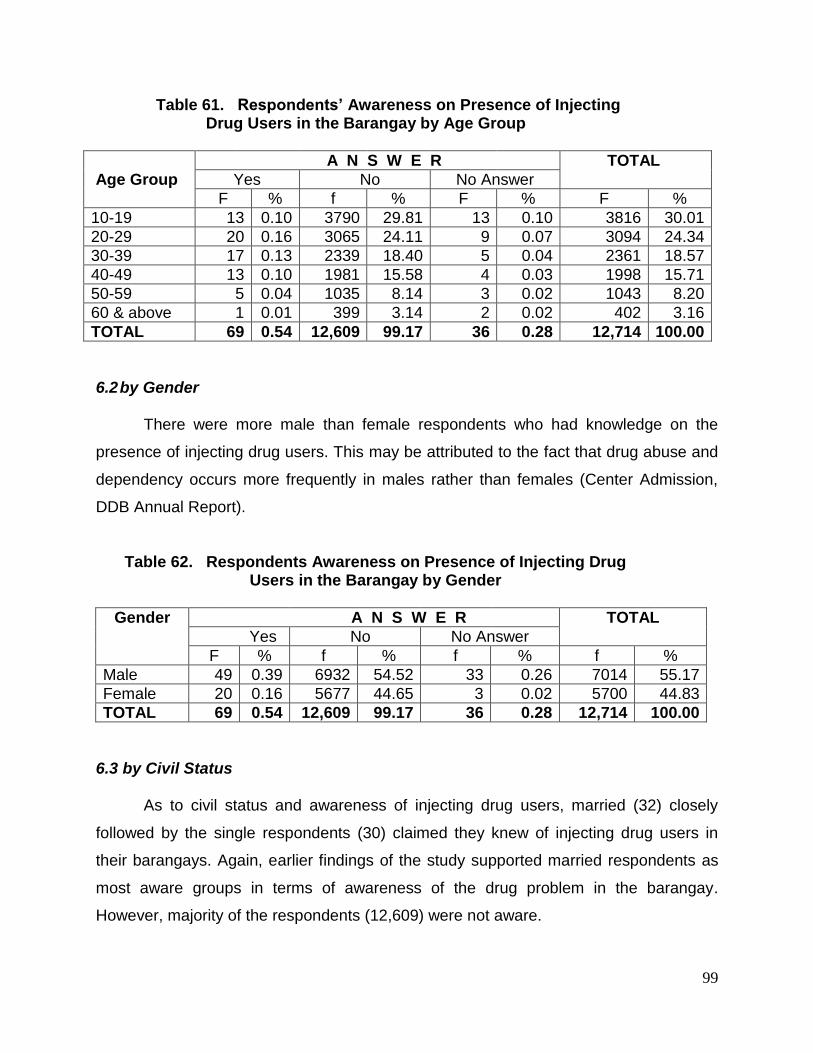
99
Table 61. Respondents’ Awareness on Presence of Injecting Drug Users in the Barangay by Age Group
A N S W E R TOTAL
Age Group Yes No No Answer
F % f % F % F %
10-19 13 0.10 3790 29.81 13 0.10 3816 30.01
20-29 20 0.16 3065 24.11 9 0.07 3094 24.34
30-39 17 0.13 2339 18.40 5 0.04 2361 18.57
40-49 13 0.10 1981 15.58 4 0.03 1998 15.71
50-59 5 0.04 1035 8.14 3 0.02 1043 8.20
60 & above 1 0.01 399 3.14 2 0.02 402 3.16
TOTAL 69 0.54 12,609 99.17 36 0.28 12,714 100.00
6.2 by Gender
There were more male than female respondents who had knowledge on the
presence of injecting drug users. This may be attributed to the fact that drug abuse and
dependency occurs more frequently in males rather than females (Center Admission,
DDB Annual Report).
Table 62. Respondents Awareness on Presence of Injecting Drug Users in the Barangay by Gender
Gender A N S W E R TOTAL
Yes No No Answer
F % f % f % f %
Male 49 0.39 6932 54.52 33 0.26 7014 55.17
Female 20 0.16 5677 44.65 3 0.02 5700 44.83
TOTAL 69 0.54 12,609 99.17 36 0.28 12,714 100.00
6.3 by Civil Status
As to civil status and awareness of injecting drug users, married (32) closely
followed by the single respondents (30) claimed they knew of injecting drug users in
their barangays. Again, earlier findings of the study supported married respondents as
most aware groups in terms of awareness of the drug problem in the barangay.
However, majority of the respondents (12,609) were not aware.
100
6.4 by Highest Educational Attainment
The assumption that those with high levels of education are the most aware of
the drug abuse problem was explicit in the findings earlier mentioned. Again, the same
has been observed on the awareness of injecting drug use. Most of the respondents
who said „yes‟ were those who reached college. Those who reached high school and
were college graduates come second and third.
Table 64. Respondents Awareness on Presence of Injecting Drug Users in the Barangay by Highest Educational Attainment
Highest Educational A N S W E R TOTAL
Attainment Yes No No Answer
f % F % f % F %
No schooling 51 0.40 51 0.40
Elementary Level 4 0.03 1,838 14.46 4 0.03 1,846 14.52
Elementary Graduate 4 0.03 711 5.59 3 0.02 718 5.65
High School Level 18 0.14 3,890 30.60 9 0.07 3,917 30.81
High School Grad 6 0.05 1,947 15.31 4 0.03 1,957 15.39
College Level 25 0.20 2,678 21.06 11 0.09 2,714 21.35
College Graduate 11 0.09 1,258 9.89 1 0.01 1,270 9.99
Vocational 1 0.01 222 1.75 4 0.03 227 1.79
Post Graduate 14 0.11 14 0.11
TOTAL 69 0.54 12,609 99.17 36 0.28 12,714 100.00
Table 63. Respondents Awareness on Presence of Injecting Drug Users in the Barangay by Civil Status
A N S W E R TOTAL
Civil Status Yes No
No Answer
f % f % F % F %
Single 30 0.24 5,758 45.29 17 0.13 5,805 45.66
Married 32 0.25 5,909 46.48 14 0.11 5,955 46.84
Widow/er 1 0.01 332 2.61 2 0.02 335 2.63
Separated 2 0.02 225 1.77 1 0.01 228 1.79
Live-in 4 0.03 362 2.85 2 0.02 368 2.89
Single parent 22 0.17 22 0.17
Divorced 1 0.01 1 0.01
TOTAL 69 0.54 12,609 99.17 36 0.28 12,714 100.00
101
6.5 by Classification
There were sixty-nine (69) respondents who were aware of the presence of
injecting drug users in their barangay. Among them were the unemployed (23), those
who own a business (13), and students (11).
Across all classifications, awareness of injecting drug use is nil.
Table 65. Respondents Awareness on Presence of Injecting Drug Users in the Barangay by Classification
Classification A N S W E R TOTAL
Yes No No Answer
f % f % f % f %
Student 12 0.09 3,076 24.19 9 0.07 3,097 24.36
Employee
- private sector employee 11 0.09 1,505 11.84 1 0.01 1,517 11.93
- gov't employee 5 0.04 824 6.48 4 0.03 833 6.55
- owns a business 13 0.10 1,140 8.97 4 0.03 1,157 9.10
Unemployed 23 0.18 3,750 29.50 12 0.09 3,785 29.77
OSY 2 0.02 656 5.16 5 0.04 663 5.21
Others
- Self-employed 2 0.02 320 2.52 322 2.53
- Farmer 1 0.01 550 4.33 551 4.33
- Carpenter 44 0.35 44 0.35
- Painter 9 0.07 9 0.07
- Fisherman 86 0.68 86 0.68
- Helper 116 0.91 116 0.91
- Driver 95 0.75 95 0.75
- Tricycle driver 121 0.95 121 0.95
- Pedicab driver 18 0.14 18 0.14
- Laborer 186 1.46 186 1.46
- Construction Worker 26 0.20 26 0.20
- Waiter/Waitress 2 0.02 2 0.02
- GRO 1 0.01 1 0.01
- Baby Sitter 4 0.03 4 0.03
- OFW 21 0.17 21 0.17
- Pensioner 10 0.08 1 0.01 11 0.09
- Retirees 33 0.26 33 0.26
- Volunteer worker 5 0.04 5 0.04
- Minister/Pastor 5 0.04 5 0.04
- Working student 1 0.01 1 0.01
- Caretaker 1 0.01 1 0.01
- Cook 4 0.03 4 0.03
TOTAL 69 0.54 12,609 99.17 36 0.28 12,714 100.00
102
7. Perception on the Number of Users, Pushers, Clandestine Laboratories & Injecting Drug Users in the Barangay
Table 66. Respondents’ Awareness of the Number of Drug Users, Pushers, Clandestine Laboratories and Injecting Drug Users in the Barangay
The minimum and highest number of pushers, users, injecting drug users, and
clandestine laboratory based on the responses of those who were aware of the drug
problem in their barangays is as follows: drug user – minimum, 1, highest 10; pusher –
minimum 1 – highest – 10; minimum; injecting drug users – 1, highest 2; and for
clandestine laboratory – minimum of 1 and highest was 2.
8. Respondents’ Awareness of Drug Prevention Programs Implemented in the Barangay
Of the 12,714 respondents, 1,041 or 21% admitted that drug abuse programs
were implemented in their barangay as reflected by those who said “yes”. Nine
thousand seven hundred seventy-three (9,773) or 76.87% of the respondents were not
aware of such programs in the barangay.
7.1 by Age Group
Across all age groups, those belonging to the 10-19, followed by those of 20-29
and 30-39 age brackets, were aware of the drug abuse preventive programs being
implemented in their localities. Respondents with ages 60 and above were the least
aware among the age groups.
Awareness
Number
Minimum Maximum
Drug User 1 10
Drug Pusher
1 10
Injecting Drug Users
1 2
Clandestine Laboratories
1 2
103
Table 67. Respondents’ Awareness on Drug Abuse Program in the Barangay by Age Group
Age Group
Awareness on the Drug Abuse Program TOTAL
Yes No No Answer
F % F % F % F %
10-19 785 6.17 2,948 23.19 83 0.65 3,816 30.01
20-29 661 5.20 2,371 18.65 62 0.49 3,094 24.34
30-39 489 3.85 1,823 14.34 49 0.39 2,361 18.57
40-49 422 3.32 1,537 12.09 39 0.31 1,998 15.71
50-59 233 1.83 788 6.20 22 0.17 1,043 8.20
60 & above 89 0.70 306 2.41 7 0.06 402 3.16
TOTAL 2,679 21 9,773 76.87 262 2.06 12,714 100.00
7.2 by Gender
There were more male (1,475) who were aware of the drug abuse prevention
programs being implemented in their barangays than female respondents (1,204).
However, majority of the respondents in both gender had no knowledge of drug abuse
programs in their barangays.
Table 68. Respondents’ Awareness on Drug Abuse Program in the Barangay
by Gender
Gender
Awareness on the Drug Abuse Program TOTAL
Yes No No Answer
f % f % F % F %
Male 1,475 11.60 5,394 42.43 145 1.14 7,014 55.17
Female 1,204 9.47 4,379 34.44 117 0.92 5,700 44.83
TOTAL 2,679 21.07 9,773 76.87 262 2.06 12,714 100.00
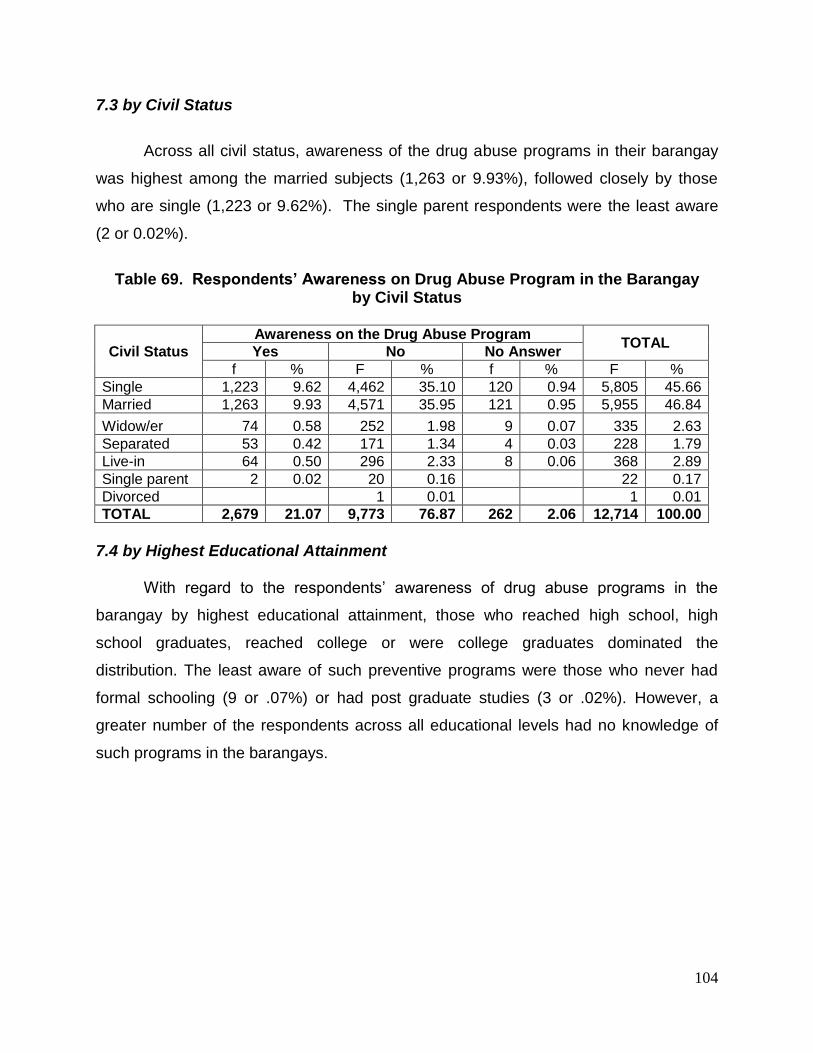
104
7.3 by Civil Status
Across all civil status, awareness of the drug abuse programs in their barangay
was highest among the married subjects (1,263 or 9.93%), followed closely by those
who are single (1,223 or 9.62%). The single parent respondents were the least aware
(2 or 0.02%).
Table 69. Respondents’ Awareness on Drug Abuse Program in the Barangay
by Civil Status
Civil Status
Awareness on the Drug Abuse Program TOTAL
Yes No No Answer
f % F % f % F %
Single 1,223 9.62 4,462 35.10 120 0.94 5,805 45.66
Married 1,263 9.93 4,571 35.95 121 0.95 5,955 46.84
Widow/er 74 0.58 252 1.98 9 0.07 335 2.63
Separated 53 0.42 171 1.34 4 0.03 228 1.79
Live-in 64 0.50 296 2.33 8 0.06 368 2.89
Single parent 2 0.02 20 0.16 22 0.17
Divorced 1 0.01 1 0.01
TOTAL 2,679 21.07 9,773 76.87 262 2.06 12,714 100.00
7.4 by Highest Educational Attainment
With regard to the respondents‟ awareness of drug abuse programs in the
barangay by highest educational attainment, those who reached high school, high
school graduates, reached college or were college graduates dominated the
distribution. The least aware of such preventive programs were those who never had
formal schooling (9 or .07%) or had post graduate studies (3 or .02%). However, a
greater number of the respondents across all educational levels had no knowledge of
such programs in the barangays.
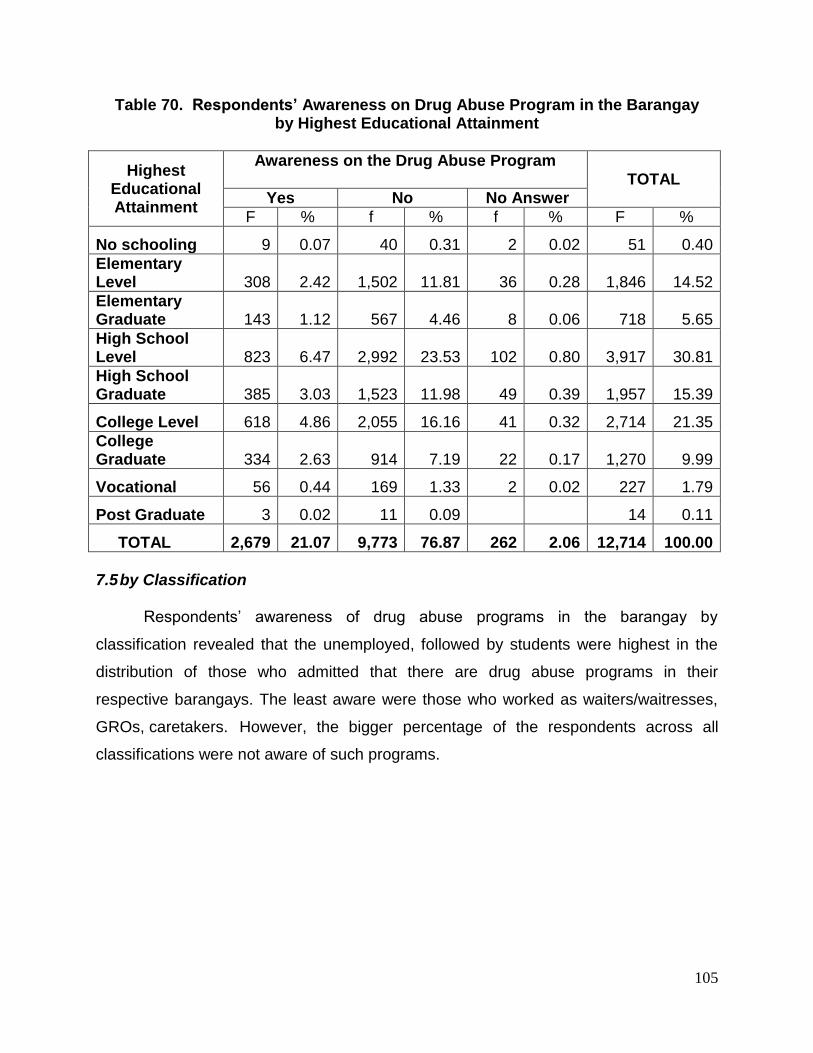
105
Table 70. Respondents’ Awareness on Drug Abuse Program in the Barangay by Highest Educational Attainment
Highest Educational Attainment
Awareness on the Drug Abuse Program TOTAL
Yes No No Answer
F % f % f % F %
No schooling 9 0.07 40 0.31 2 0.02 51 0.40
Elementary Level 308 2.42 1,502 11.81 36 0.28 1,846 14.52
Elementary Graduate 143 1.12 567 4.46 8 0.06 718 5.65
High School Level 823 6.47 2,992 23.53 102 0.80 3,917 30.81
High School Graduate 385 3.03 1,523 11.98 49 0.39 1,957 15.39
College Level 618 4.86 2,055 16.16 41 0.32 2,714 21.35
College Graduate 334 2.63 914 7.19 22 0.17 1,270 9.99
Vocational 56 0.44 169 1.33 2 0.02 227 1.79
Post Graduate 3 0.02 11 0.09 14 0.11
TOTAL 2,679 21.07 9,773 76.87 262 2.06 12,714 100.00
7.5 by Classification
Respondents‟ awareness of drug abuse programs in the barangay by
classification revealed that the unemployed, followed by students were highest in the
distribution of those who admitted that there are drug abuse programs in their
respective barangays. The least aware were those who worked as waiters/waitresses,
GROs, caretakers. However, the bigger percentage of the respondents across all
classifications were not aware of such programs.
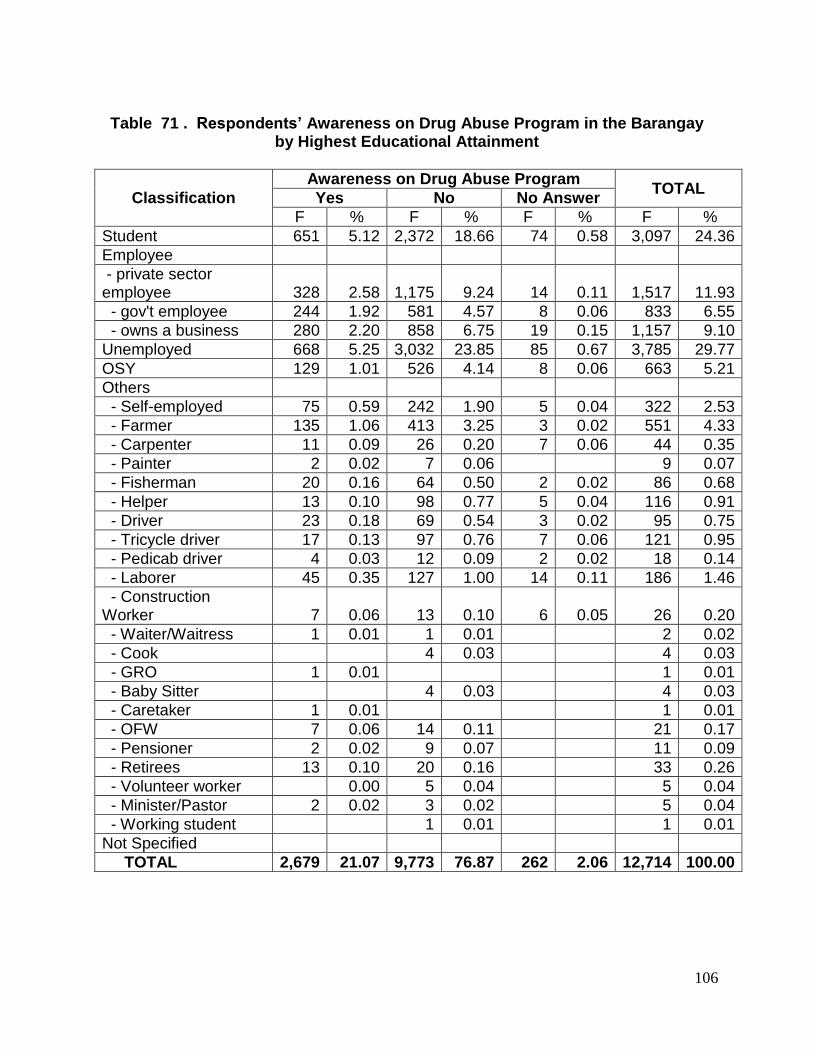
106
Table 71 . Respondents’ Awareness on Drug Abuse Program in the Barangay
by Highest Educational Attainment
Classification
Awareness on Drug Abuse Program TOTAL
Yes No No Answer
F % F % F % F %
Student 651 5.12 2,372 18.66 74 0.58 3,097 24.36
Employee
- private sector employee 328 2.58 1,175 9.24 14 0.11 1,517 11.93
- gov't employee 244 1.92 581 4.57 8 0.06 833 6.55
- owns a business 280 2.20 858 6.75 19 0.15 1,157 9.10
Unemployed 668 5.25 3,032 23.85 85 0.67 3,785 29.77
OSY 129 1.01 526 4.14 8 0.06 663 5.21
Others
- Self-employed 75 0.59 242 1.90 5 0.04 322 2.53
- Farmer 135 1.06 413 3.25 3 0.02 551 4.33
- Carpenter 11 0.09 26 0.20 7 0.06 44 0.35
- Painter 2 0.02 7 0.06 9 0.07
- Fisherman 20 0.16 64 0.50 2 0.02 86 0.68
- Helper 13 0.10 98 0.77 5 0.04 116 0.91
- Driver 23 0.18 69 0.54 3 0.02 95 0.75
- Tricycle driver 17 0.13 97 0.76 7 0.06 121 0.95
- Pedicab driver 4 0.03 12 0.09 2 0.02 18 0.14
- Laborer 45 0.35 127 1.00 14 0.11 186 1.46
- Construction Worker 7 0.06 13 0.10 6 0.05 26 0.20
- Waiter/Waitress 1 0.01 1 0.01 2 0.02
- Cook 4 0.03 4 0.03
- GRO 1 0.01 1 0.01
- Baby Sitter 4 0.03 4 0.03
- Caretaker 1 0.01 1 0.01
- OFW 7 0.06 14 0.11 21 0.17
- Pensioner 2 0.02 9 0.07 11 0.09
- Retirees 13 0.10 20 0.16 33 0.26
- Volunteer worker 0.00 5 0.04 5 0.04
- Minister/Pastor 2 0.02 3 0.02 5 0.04
- Working student 1 0.01 1 0.01
Not Specified
TOTAL 2,679 21.07 9,773 76.87 262 2.06 12,714 100.00
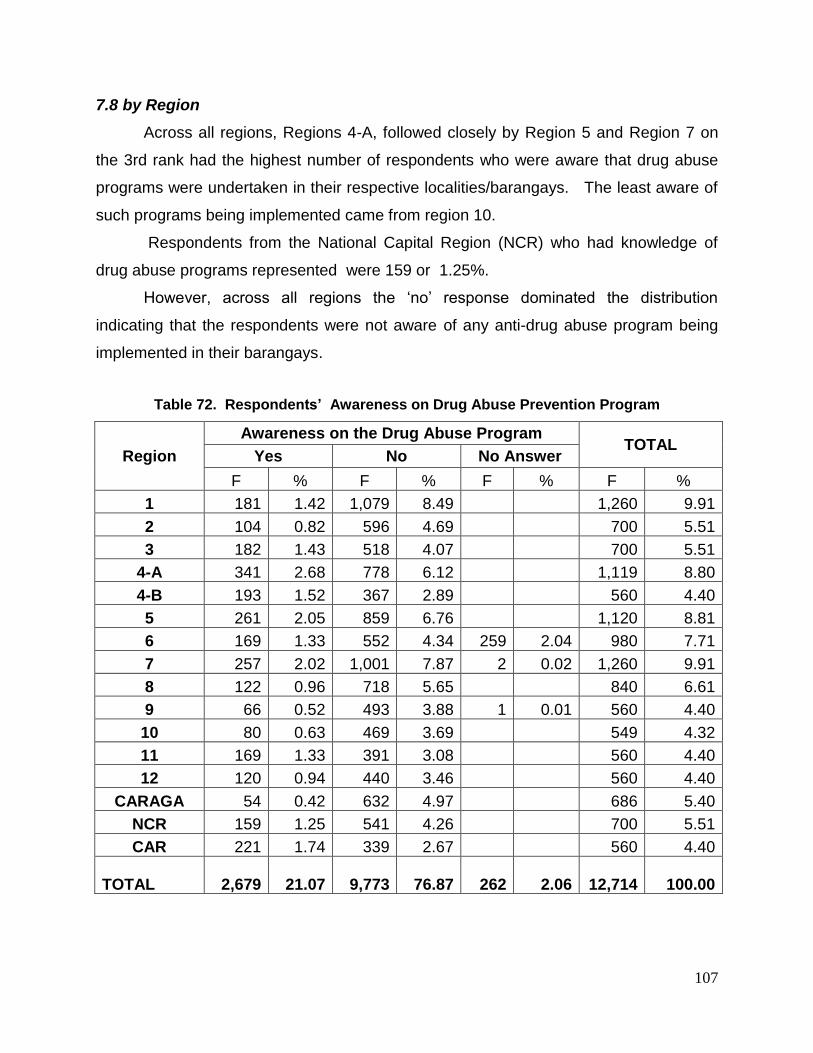
107
7.8 by Region
Across all regions, Regions 4-A, followed closely by Region 5 and Region 7 on
the 3rd rank had the highest number of respondents who were aware that drug abuse
programs were undertaken in their respective localities/barangays. The least aware of
such programs being implemented came from region 10.
Respondents from the National Capital Region (NCR) who had knowledge of
drug abuse programs represented were 159 or 1.25%.
However, across all regions the „no‟ response dominated the distribution
indicating that the respondents were not aware of any anti-drug abuse program being
implemented in their barangays.
Table 72. Respondents’ Awareness on Drug Abuse Prevention Program
Region
Awareness on the Drug Abuse Program TOTAL
Yes No No Answer
F % F % F % F %
1 181 1.42 1,079 8.49 1,260 9.91
2 104 0.82 596 4.69 700 5.51
3 182 1.43 518 4.07 700 5.51
4-A 341 2.68 778 6.12 1,119 8.80
4-B 193 1.52 367 2.89 560 4.40
5 261 2.05 859 6.76 1,120 8.81
6 169 1.33 552 4.34 259 2.04 980 7.71
7 257 2.02 1,001 7.87 2 0.02 1,260 9.91
8 122 0.96 718 5.65 840 6.61
9 66 0.52 493 3.88 1 0.01 560 4.40
10 80 0.63 469 3.69 549 4.32
11 169 1.33 391 3.08 560 4.40
12 120 0.94 440 3.46 560 4.40
CARAGA 54 0.42 632 4.97 686 5.40
NCR 159 1.25 541 4.26 700 5.51
CAR 221 1.74 339 2.67 560 4.40
TOTAL 2,679 21.07 9,773 76.87 262 2.06 12,714 100.00
108
Respondents’ Awareness on Drug Abuse Programs Implemented in the Barangay by Region & Gender
In terms of their knowledge of such programs conducted in their barangays for
both gender, Regions 4-A, 5 and 7 reflected the highest across all regions. Generally, it
was observed that across all regions for both male and female respondents were not
aware of drug prevention programs in the barangay.
Respondents’ Awareness on Drug Abuse Programs Implemented in the Barangay by Region & Age Group
Knowledge of drug prevention programs conducted in the barangays across all
regions (including NCR) by age groups indicated that those belonging to the 10-19
were the most aware among the age groups and the least aware were those 60 years
and above.
Among those who affirmed that such programs were undertaken in their
localities/barangays according to age groups (2,679) and across all regions, those
belonging to the 10-19, 20-29 and 30-39 were highest in Regions 4-A, 5 and 7.
Across 16 regions and in all age groups, those who were not aware of such
programs being implemented was highest in Region 1. Both regions 7 and 5 come 2nd
and 3rd, respectively.
Respondents’ Awareness on Drug Abuse Programs Implemented in the Barangay by Region & Highest Educational Attainment
Out of the subjects who had awareness of programs being implemented in the
barangay (2,679) across all regions and educational attainment, respondents who
reached high school (823 or 6.47%), followed by those who reached college
(618 or 4.85%) and were high school graduates (385 or 3.02%) topped the distribution
of age groups most aware of such programs, specifically in Regions 4-A, 5 and 7.
109
Respondents’ Awareness on Drug Abuse Programs Implemented in the Barangay by Region & Civil Status
Among the respondents who had knowledge of preventive programs across all
regions and by civil status, married and single respondents were the groups most aware
of such programs conducted in their respective barangays, specifically in Regions 4-A,
5 and 7. The least aware were the single parents (2 or .02%).
In the NCR, there were more single than married respondents who were aware
of such programs in their barangays. The same was observed with live-in partners in
NCR.
However, those who were not aware still dominated the distribution across all
regions and by civil status specifically in Regions 1, 7 and 5.
Respondents’ Awareness on Drug Abuse Programs Implemented in the Barangay by Region & Classification Drug prevention programs in the barangay across region and by classification of
respondents revealed that the unemployed, followed by the students and those
employed in the private sector in that order were highest in awareness of such
programs being undertaken in their respective localities, specifically, Regions 4-A, 5 and
7, in that order. The least aware of such programs were those employed as service
workers such as waiters/waitresses, GROs and caretakers.
On the other hand, those who were not aware of preventive programs in their
barangay ( 9,773 ), it was observed that the unemployed, followed by the students and
those working in the private companies/establishments were the same group who were
not aware of such programs. However, it is highest in Regions 1, 7 and 5.
In general, across all regions and classification of respondents, those who were
not aware dominated the distribution as revealed by the „no‟ responses.
110
9. Programs Being Implemented in the Barangay
Of the 12,714 respondents, 2,679 or 21% were aware of the implementation of
drug abuse program within their barangays, the following programs and projects were
mentioned:
The conduct of anti-drug abuse advocacy seminars, symposia, forums and
trainings, conduct of alternatives programs like sports activities for the youth and people
in the barangays (1,522 or 56.81%), conduct of various drug abuse prevention activities
by the barangays and local anti-drug abuse councils (565 or 21.09%), dissemination of
posters, leaflets and slogans (114 or 4.26%) were those highest mentioned.
Other programs were the implementation of curfew hours for minors (78 or
2.91%), provision of livelihood and vocational programs for the youth and people of
their barangays and those other programs as indicated on Table 73.
Table 73. Drug Abuse Prevention Programs Implemented in the Barangays
Programs Implemented f %
Barangay and Police Mobilization 29 1.08
Barangay Roving and Surveillance 49 1.83
Conduct of Anti-Drug Abuse Advocacy, Seminars, Symposia, Forums and Trainings 1,522 56.81
Conduct of Buy-bust Operations 72 2.69
Conduct of Checkpoints 1 .04
Conduct of Religious Activities 3 0.11
Conduct of Sports Activities for the Youth and People in the Barangay 565 21.09
Dissemination of Anti-Drug Campaign Posters, Leaflets and Slogans 114 4.26
Drug Testing Program 3 0.11
Implement Curfew Hours 78 2.91
Livelihood and Vocational Programs for the Youth and People in the Barangay 32 1.19
Marijuana Eradication 4 0.15
Programs for Drug Treatment and Rehabilitation 7 0.26
Various Activities conducted by the Barangay, Municipal and City Drug Abuse Councils, etc. 200 7.47
TOTAL 2,679 100.00
111
10. Agencies Implementing the Drug Abuse Prevention Programs and Projects in the Barangay
Of those who were aware of drug abuse prevention programs being implemented
in the barangay (2,697 out of 12,714), the following were the agencies as indicated by
the respondents. The respondents gave more than one agency implementing such
programs:
Table 74. Agencies Implementing Drug Prevention Programs in the Barangay
Agencies (n=3,020)
Frequency
Percent
Local Government Units/Barangays 1,042 34.50
PDEA & Other Law Enforcement Agencies
946 31.32
Other Government Agencies 492 16.29
Sangguniang Kabataan 226 7.48
NGOs 128 4.23
Schools/Educational Institutions 111 3.67
Dangerous Drugs Board 75 2.51
Note: Percentage based on frequency of response
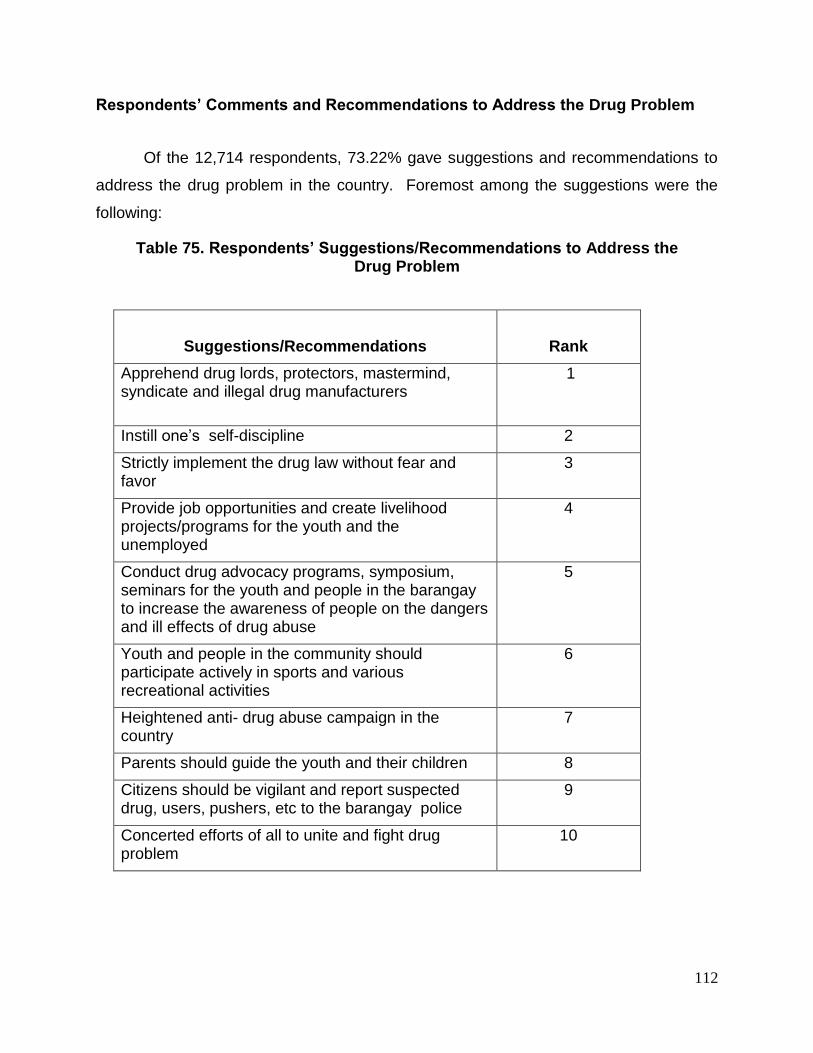
112
Respondents’ Comments and Recommendations to Address the Drug Problem
Of the 12,714 respondents, 73.22% gave suggestions and recommendations to
address the drug problem in the country. Foremost among the suggestions were the
following:
Table 75. Respondents’ Suggestions/Recommendations to Address the Drug Problem
Suggestions/Recommendations
Rank
Apprehend drug lords, protectors, mastermind, syndicate and illegal drug manufacturers
1
Instill one‟s self-discipline 2
Strictly implement the drug law without fear and favor
3
Provide job opportunities and create livelihood projects/programs for the youth and the unemployed
4
Conduct drug advocacy programs, symposium, seminars for the youth and people in the barangay to increase the awareness of people on the dangers and ill effects of drug abuse
5
Youth and people in the community should participate actively in sports and various recreational activities
6
Heightened anti- drug abuse campaign in the country
7
Parents should guide the youth and their children 8
Citizens should be vigilant and report suspected drug, users, pushers, etc to the barangay police
9
Concerted efforts of all to unite and fight drug problem
10
113
NATIONAL ESTIMATES
WHO TRIED DRUGS
CURRENT DRUG USERS
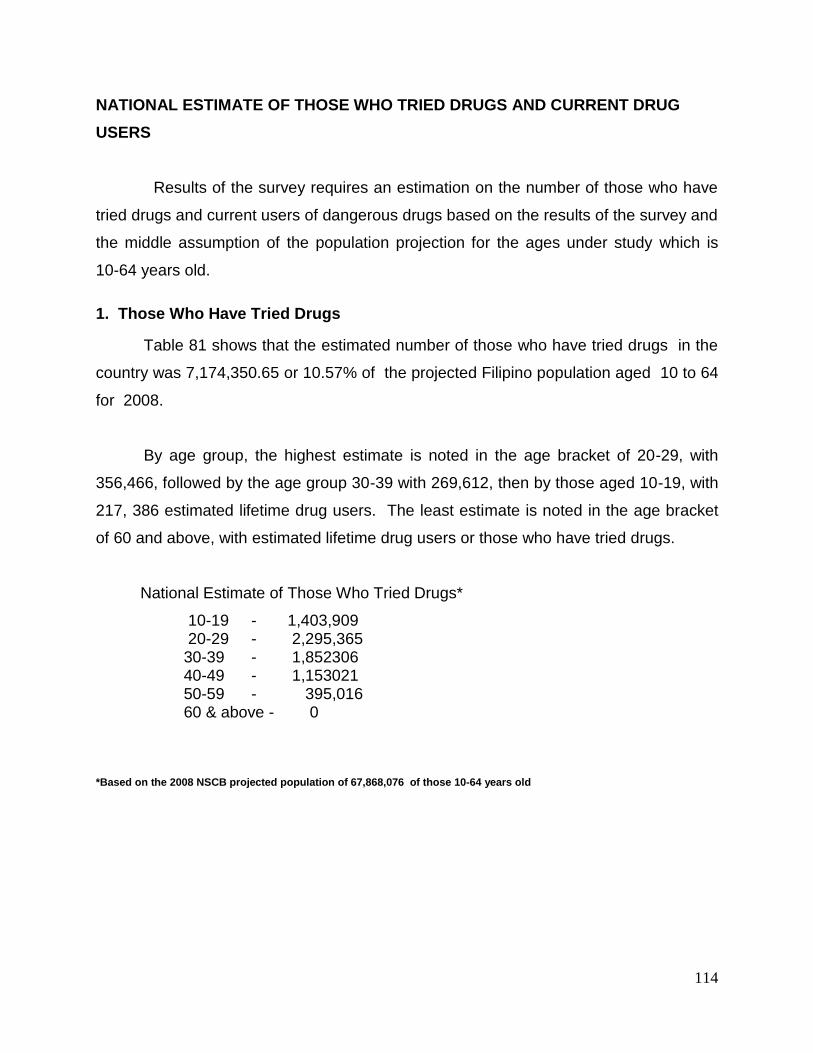
114
NATIONAL ESTIMATE OF THOSE WHO TRIED DRUGS AND CURRENT DRUG
USERS
Results of the survey requires an estimation on the number of those who have
tried drugs and current users of dangerous drugs based on the results of the survey and
the middle assumption of the population projection for the ages under study which is
10-64 years old.
1. Those Who Have Tried Drugs
Table 81 shows that the estimated number of those who have tried drugs in the
country was 7,174,350.65 or 10.57% of the projected Filipino population aged 10 to 64
for 2008.
By age group, the highest estimate is noted in the age bracket of 20-29, with
356,466, followed by the age group 30-39 with 269,612, then by those aged 10-19, with
217, 386 estimated lifetime drug users. The least estimate is noted in the age bracket
of 60 and above, with estimated lifetime drug users or those who have tried drugs.
National Estimate of Those Who Tried Drugs*
10-19 - 1,403,909 20-29 - 2,295,365 30-39 - 1,852306 40-49 - 1,153021 50-59 - 395,016 60 & above - 0
*Based on the 2008 NSCB projected population of 67,868,076 of those 10-64 years old
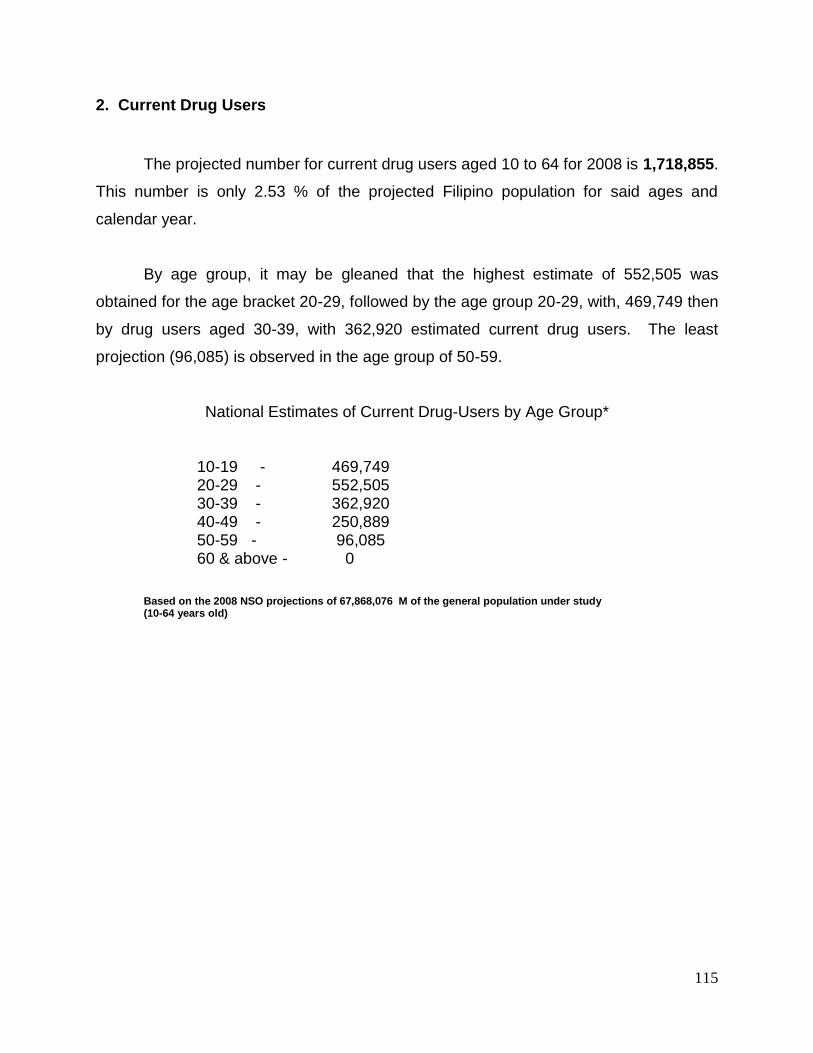
115
2. Current Drug Users
The projected number for current drug users aged 10 to 64 for 2008 is 1,718,855.
This number is only 2.53 % of the projected Filipino population for said ages and
calendar year.
By age group, it may be gleaned that the highest estimate of 552,505 was
obtained for the age bracket 20-29, followed by the age group 20-29, with, 469,749 then
by drug users aged 30-39, with 362,920 estimated current drug users. The least
projection (96,085) is observed in the age group of 50-59.
National Estimates of Current Drug-Users by Age Group*
10-19 - 469,749 20-29 - 552,505 30-39 - 362,920 40-49 - 250,889 50-59 - 96,085 60 & above - 0
Based on the 2008 NSO projections of 67,868,076 M of the general population under study (10-64 years old)
116
Implications and Recommendations
1. In terms of current drug users and those who have tried drugs, among the regions, Region VII and X topped the list which implies that programs of the government (educational, prevention, treatment and rehabilitation and others) should be strengthened in these regions while remaining vigilant in other regions.
2. In terms of age group and educational qualification, current drug users were concentrated on age brackets 10-19 and 20-29. This could be taken to mean that these age groups (elementary, high school and college students) were the most vulnerable to drug abuse. Hence, it is recommended that programs/lessons on drug prevention and control be integrated in the basic education curriculum as well as in the tertiary education curriculum. In basic education, it could be in the Social Studies of the Makabayan strand; in the tertiary, in any appropriate Social Science course.
3. Likewise, the availability of contact cement and solvent should be looked into. Imposing regulations in selling these items to minors by hardware/store is also recommended, as it was found out that those aged 10-19 buy primarily from them.
4. In terms of gender and educational attainment in all regions, the male high school students topped the list of respondents who continue to abuse drugs. It is thus recommended that DDB anti-drugs campaign be intensified among high school students
5. The unemployed topped the list of current users at the time of the interview/survey. This was probably the reason why the respondents themselves recommended job opportunities and livelihood programs for the youth and the unemployed as a means of addressing the drug problem. This study recommends that while the DDB cannot provide jobs to the unemployed, its programs and activities should include this sector, particularly in activities/programs which provide opportunities to learn better coping skills, develop self-esteem, and spiritual enhancement.
6. Continuing to use drugs is blamed on the influence of friends who themselves are using drugs. This was reported by the respondents from 11 out of 13 regions with current users. Peer influence as reason for drug abuse is a manifestation of a deep rooted problem in the family and need to be addressed. It is recommended that the programs and activities of the Dangerous Drugs Board focus on family-oriented activities that would develop/ strengthen family relationships, and coping mechanism to face personal, marital, school, work-related problems. A strong
117
family foundation is a tool against drug abuse and the youth or individual will not seek the company of peers if he/she is happy at home.
7. Evaluation of the programs/projects implemented from 2005-2008 should be undertaken to determine its outcome/impact and that information materials being used/disseminated for public awareness be assessed to determine its applicability to the present drug situation or influence to target beneficiaries. Conduct of regular surveys on the general population, students, workers, special studies on focus groups, and ethnographic studies on high risk-groups such as transportation workers, call center agents, street families, urban yuppies are recommended to come up with evidence-based programs and projects to address the drug problem in the country.
8. Based on the results of the survey it was estimated that there could be 1,718,854 current drug users and pointed to a downward trend in the abuse of dangerous drugs as compared to past years. While the study cannot answer what causes the decline in drug abuse the following reasons maybe considered: the intensive and heightened supply reduction efforts conducted by Philippine Drug Enforcement Agency (PDEA) and other law enforcement agencies, strict implementation of DDB policies like the mandatory drug testing for the applicants of driver‟s license, the military, firearms holders, random drug test among students, and the realization of DDB‟s programs and projects in collaboration with its partner agencies, the local government units and other non-government organizations since 2005 up to present. These efforts, policies, programs and endeavors are possibly reaping positive results in curbing the drug problem in the country, and the vision to become a drug-resistant country in 2010 is a realistic goal to pursue.