PROJECT COMPLETION WA E ER - KB Home
30
WATER WATER WA E \ ER WATER W AT E R WATER WATER , Wti 11. - • • PROJECT COMPLETION REPORT NO. 367X Survey of SrVSr 86 Ratios in Stream and Ground Waters of Ohio By Paul Pushkar 4 John Steele Alan Stueber Dwight Baldwin and Nicholas Beskid 1971 United States Department of the Interior CONTRACT NO. A 020-OHIO AA-14-01-0001-1855 State of Ohio Water Resources Center Ohio State University v
Transcript of PROJECT COMPLETION WA E ER - KB Home

WATERWATERW A E\ ERWATERW ATERWATERWATER,
Wti 11.
- • •
PROJECT COMPLETION
REPORT NO. 367X
Survey of
SrVSr86
Ratios in
Stream and
Ground Waters
of Ohio
By
Paul Pushkar4
John Steele
Alan Stueber
Dwight Baldwin
and
Nicholas Beskid
1971
United States Department
of the Interior
CONTRACT NO.
A 020-OHIO
AA-14-01-0001-1855
State of Ohio Water Resources Center
Ohio State University
v

SURVEY OF Sr87/Sr86 RATIOS
IN STREAM AND GROUND WATERS OF OHIO
Paul Pushkar and John Steele
Department of GeologyWright State University
Dayton, Ohio
Alan Stueber, Dwight Baldwin and Nicholas Beskid
Department of GeologyMiami University
Oxford9 Ohio
Final Report
Submitted to: Water Resources Center The Ohio State University
Office of Water Resources Research The United States Department of Interior
Project No. 14-01-0001-0hio
June, 1971

TABLE OF CONTENTS
Page
LIST OF TABLES iii
LIST OF FIGURES iv
ACKNOWLEDGMENTS v
ABSTRACT v i
INTRODUCTION 1
SAMPLE COLLECTION 5
ANALYTICAL METHODS 6
Specific Conductance 6Strontium Concentrations 6Sodium Concentrations . 11Strontium Isotopic Analyses 11
INTERPRETATION OF RESULTS 14
SUMMARY AND CONCLUSIONS 21
REFERENCES CITED 23

LIST OF TABLES
Table Page
1. SAMPLE LOCATIONS AND LITHOLOGIC DESCRIPTIONS, Sr ANDNa CONCENTRATIONS, AND SPECIFIC CONDUCTANCE MEASUREMENTS 7
2. STRONTIUM AND SODIUM ANALYSES OF THE UNITED STATESGEOLOGICAL SURVEY STANDARD WATER REFERENCE SAMPLE
NO. 26 12
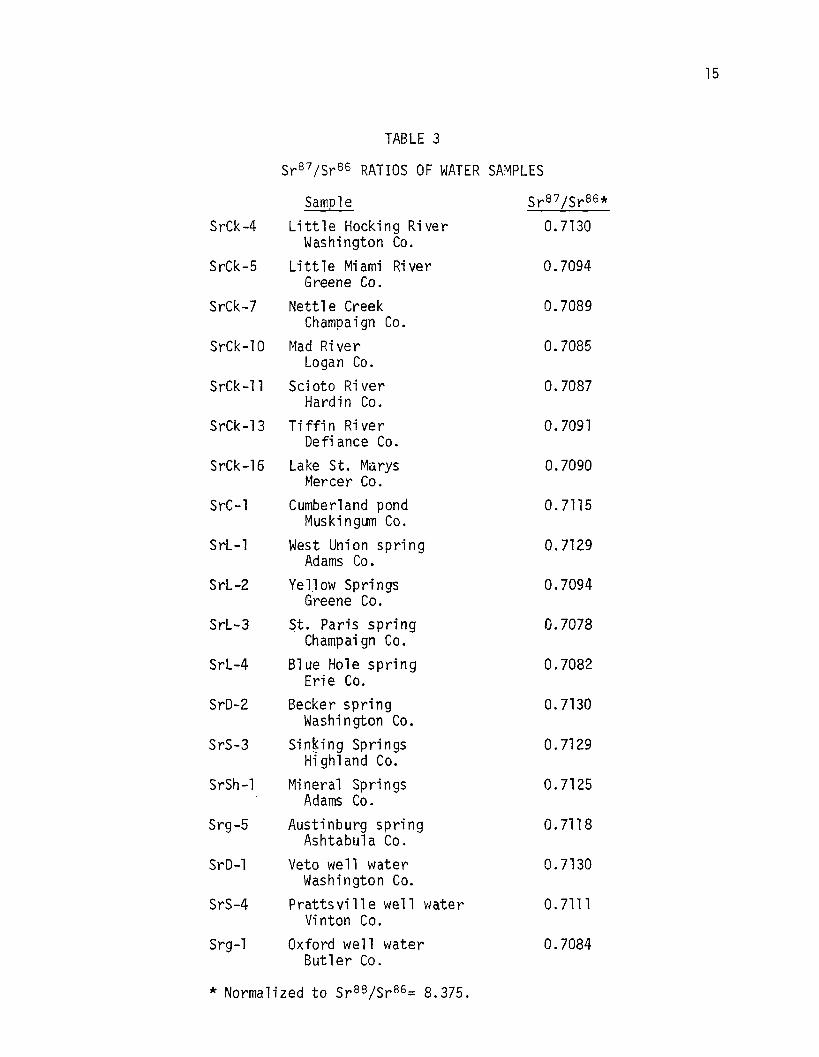
3. Sr87/Sr86RATI0S OF WATER SAMPLES 15
4. ANALYSES OF EIMER & AMEND SrC03 STANDARD andDUPLICATE ANALYSES OF WATER SAMPLES 16

LIST OF FIGURES
Figure Page
1. GROWTH OF Sr87 IN SEDIMENTARY ROCKS 2
2. GEOLOGIC MAP OF OHIO 18
3. MAP OF OHIO SHOWING WATER SAMPLE LOCATIONS, MODE OFOCCURRENCE, AND Sr87/Sr86 RATIOS 20
IV

ACKNOWLEDGMENTS
We wish to acknowledge the assistance of the Departments of Geology at
Miami University and Wright State University for providing equipment and lab
oratory facilities necessary for the completion of this project. Professor
Gunter Faure, The Ohio State University, permitted the use of his laboratory
for the calibration of chromatography columns with a Sr89 radioactive tracer.
We also acknowledge his helpful advice on many aspects of this project. We
wish to thank Mrs. Ruth E. McLeod of Miami University for typing the final
manuscript.

ABSTRACT
A total of 19 Ohio stream and ground waters have been sampled and ana
lyzed for total Sr and Sr87/Sr86 isotopic ratios in an attempt to evaluate the
potential usefulness of the Sr87/Sr86 ratio as a tracer of water provenance.
Samples were collected in order to provide a wide geographic distribution and
a variety of contacted lithologies. The measured Sr87/Sr86ratios range from
about 0.708 to 0.713, with the higher ratios occurring in eastern Ohio and the
lower ratios in the west. We believe that this trend reflects the change in
the dominant lithology of the Paleozoic sediments across Ohio. In the east
clastic sediments predominate, whereas in the west limestone becomes a more
important component of the sedimentary sequence. Most limestones of Paleozoic
age or younger are known to have Sr87/Sr86 ratios of approximately 0.708, where
as shales have a wide range of higher values. Thus the Sr87/Sr86 ratios in
western Ohio may reflect the greater proportion of limestone in the sedimentary
column in this area. We feel that the demonstrated variability of the Sr87/Sr86
ratio in Ohio waters, and its apparent dependence on lithology in the sampling
areas, are sufficiently encouraging to warrant further study of the applica
tion of this parameter as a tracer in water studies.
VI

INTRODUCTION
Natural var iat ions in the isotopic r a t i o Sr8 7 /Sr8 6 have been i n v e s t i
gated by geochemists for approximately the past ten years. Such var iat ions
arise because of the production of Sr87 due to the radioact ive decay of Rb87.
Natural ly-occurr ing strontium has four isotopes, but only Sr87 can be produced
through radioact ive decay and thus vary in i t s re la t i ve abundance. The abun
dance of Sr87 is conveniently expressed as the r a t i o S r 8 7 / S r 8 6 , the value of
which in any material depends upon two fac tors :
(1) The Rb/Sr elemental r a t i o in the mater ia l . Materials which contain
large amounts of Rb, and therefore of Rb87, re la t i ve to strontium w i l l
generate larger amounts of Sr87 over a given period of time than
materials with low Rb/Sr-rat ios. The Sr8 7 /Sr8 6 r a t i o , therefore, is
expected to be higher in materials w i th high Rb/Sr ra t i os .
(2) The geologic age of the mater ia l . The older a ma te r ia l , the more time
has been avai lable for Rb87 t o decay in to Sr8 7 , so tha t the Sr8 7 /Sr8 6
r a t i o w i l l be higher than tha t in a comparable younger mater ia l .
In general, Rb-rich rocks such as shales have r e l a t i v e l y high present
Sr8 7 /Sr8 6 ra t ios whereas Rb-poor rocks such as carbonates have low Sr 8 7 /Sr8 6
ra t ios today. These general izations are i l l u s t r a t e d by the typ ica l growth
curves for shales and carbonates presented in Figure 1. Once such d i f f e ren t
Sr8 7 /Sr8 6 ra t ios are produced in natural mater ia ls , they are unaffected by
chemical and physical processes. Thus they d i f f e r from isotop ic rat ios o f
l i gh te r elements such as carbon or sulphur, which can be i so top ica l l y f r ac
t ionated by such processes. The Sr 8 7 /Sr 8 6 r a t i o in any natural system today

Fi gure 1
GROWTH OF Sr87 IN SEDIMENTARY ROCKS
<Sr87/Sr8% = Xt 87 Sr
S r 8 6 720
•710- LIMESTONE (Rb/Sr « 0 )
• I 1 I I f
600 500 400 300 200 100 0
TIME (m.y.)
I -e I 0 I S I D I M t P I P I H I Jt I K lR«c«fril
GROWTH OF Sr IN SEDIMENTARY ROCKS

can change only by the addition of strontium having a different Sr87/Sr86 rat io
or by the decay of Rb87 with the passage of time. In the lat ter case, the
ha l f - l i f e of Rb87 is so great (50 x 109 years) that the additional accumulation
of radiogenic Sr87 is inconsequential over time spans of interest to man. Re
cent reviews of strontium isotope geochemistry have been presented by Hamilton
(1965, 1968).
Because present Sr87/Sr86 ratios are not subject to measurable change
except by mixing, they can be used as a "label11 to trace the origin of certain
materials. For example, al l modern oceans contain dissolved strontium with a
Sr87/Sr86 rat io very close to 0.7090. Thus a l l materials formed today solely
by precipitation from sea water, such as evaporites, biologic calci te* and
most carbonate rocks, also have Sr87/Sr86 ratios of 0-7090. Continental rocks,
on the other hand, have a wide range of Sr87/Sr86 rat ios. The average value
for the s ia l ic crust today is probably close to 0.725. Therefore, i f an
oceanic sediment consists of a detr i ta l component formed from the weathering
of the continental crust and a calcium carbonate component formed by biologi
cal precipitation from sea water, i ts Sr87/Sr88 rat io should be intermediate
between 0.709 and 0.725. I f the sediment could be physically separated into
i ts two components and each component analyzed for i t s Sr87/Sr86 ra t io , these
dif ferent sources could be demonstrated. Such studies have been carried out
successfully (Dasch, H i l l s , and Turekian, 1966).
The labeling of a natural material by means of i t s Sr87/Sr86 rat io
should be applicable to a study of surface and ground waters. In this case *
the rat io may indicate the areas where the waters had the i r origin or through
which they subsequently migrated. For example, consider a rain fa l l ing upon a
watershed. A portion of i t enters the soi l or bedrock, in f i l t ra tes to the
zone of saturation, and becomes ground water. As this water moves through

permeable and porous aquifers, it commonly acquires a high concentration of
total dissolved solids. Suppose that bedrock underlying the watershed consists
of two distinct lithologies typical in the state of 0hio5 a shale and a lime
stone. Sr87/Sr86 ratios in these two lithologies today may be 0.725 for the
shale and 0.708 for the limestone. The rain water, after entering both rock
types, will leach strontium from them; the ground water in the shale will
leach strontium with a Sr87/Sr86 ratio of 0.725, and the ground water in the
limestone will leach strontium with a Sr87/Sr86 ratio of 0.708. After subse
quent vertical and/or horizontal movement of these ground waters, sampling and
Sr87/Sr86 analysis might be used to trace the history of this movement and
possibly identify the ultimate provenance. For example, if water from a well
within the shale has a Sr87/Sr86 ratio of 0.709, this would indicate that the
water had either originated in or had previously flowed through the limestone
before entering the shale. On the other hand, if a stream draining both the
shale and limestone has a Sr87/Sr86 ratio of 0.720, this would indicate that
most of the stream water is derived from the shale.
We have attempted to evaluate the potential usefulness of the Sr87/Sr86
ratio as a tracer in the study of stream and ground waters in the state of
Ohio. In order to make practical application of this concept, it is necessary
first to demonstrate that the Sr87/Sr86 ratios in such waters within a given
area are sufficiently variable, and that such variations can be related to
lithologic type of bedrock and overburden. This aspect of the overall concept
has been evaluated in the present report by making a reconnaissance study of
stream and ground waters throughout Ohio.

SAMPLE COLLECTION
Collection stations for sampling both surface and ground waters were
chosen in order to provide water from as many lithologies and hydroiogic en
vironments as exist in Ohio. A suite of samples was collected extending from
the Upper Ordovician through the Pennsylvanian-Permian Systems, south of the
southern l imi t of Pleistocene glaciat ion, in order to determine total Sr con
centrations and Sr isotope ratios in areas not covered by glacial t i l l . Sur
face and ground water samples were also obtained from similar lithologies north
of the glacial boundary.
Water samples were collected at 40 stations across the state. Thirty-
one of these were collected during July and August, 1970. Four were obtained
in February and five in May, 1971. The majority were collected during the dry
summer months in order to maximize the contribution of ground water to total
stream discharge. Eastin and Faure (1970) report that strontium isotopic
ratios of waters of the Olentangy River, Ohio, decrease with increasing r iver
discharge. This decrease is interpreted as a di lut ion of the ground water
component of the r iver discharge by rain water having a low isotopic ra t io .
In order to obtain a close approximation of the strontium isotopic composition
of ground water within a given basin,, low-flow samples were therefore collec
ted.
All samples were collected in polyethylene bottles. Each bottle was
washed three times with the water to be collected before f ina l ly being f i l l e d .
Waters for isotopic analysis were collected in 9 .5- l i te r containers, whereas
those for strontium, sodium, and specific conductance determinations were col
lected in one-l i ter containers. After obtaining specific conductance values
in the laboratory, the water intended for strontium and sodium determinations
was acidified with glacial acetic acid in order to prevent possible precipita
tion of strontium.
ANALYTICAL METHODS
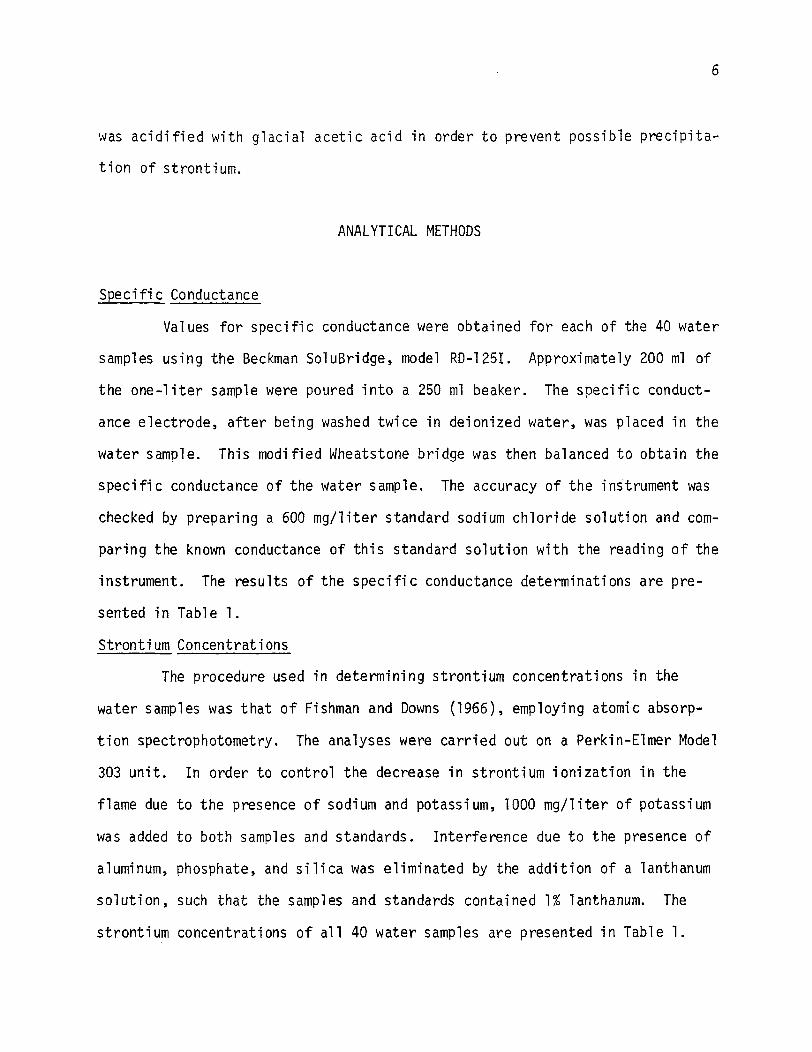
Specific Conductance
Values for specific conductance were obtained for each of the 40 water
samples using the Beckman SoluBridge, model RD-125I. Approximately 200 ml of
the one-liter sample were poured into a 250 ml beaker. The specific conduct
ance electrode, after being washed twice in deionized water, was placed in the
water sample. This modified Wheatstone bridge was then balanced to obtain the
specific conductance of the water sample. The accuracy of the instrument was
checked by preparing a 600 mg/liter standard sodium chloride solution and com
paring the known conductance of this standard solution with the reading of the
instrument. The results of the specific conductance determinations are pre
sented in Table 1.
Strontium Concentrations
The procedure used in determining strontium concentrations in the
water samples was that of Fishman and Downs (1966), employing atomic absorp
tion spectrophotometry. The analyses were carried out on a Perkin-Elmer Model
303 unit. In order to control the decrease in strontium ionization in the
flame due to the presence of sodium and potassium, 1000 mg/liter of potassium
was added to both samples and standards. Interference due to the presence of
aluminum, phosphate, and silica was eliminated by the addition of a lanthanum
solution, such that the samples and standards contained 1% lanthanum. The
strontium concentrations of all 40 water samples are presented in Table 1.
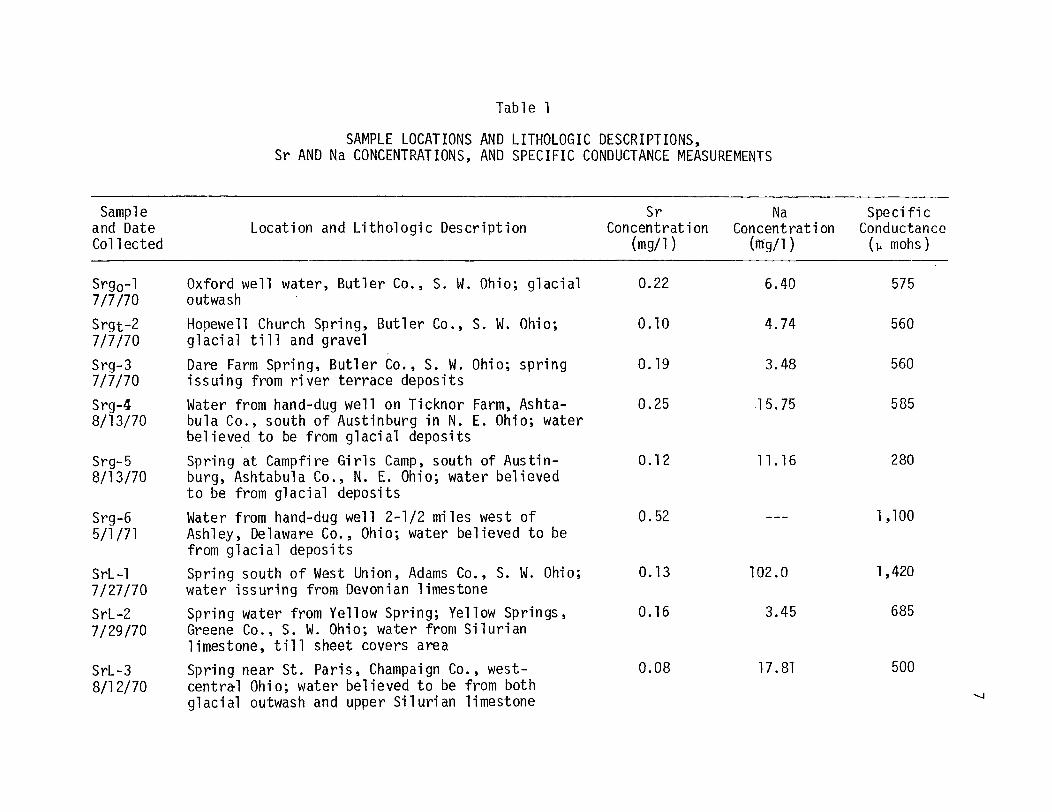
Table 1
SAMPLE LOCATIONS AND LITHOLOGIC DESCRIPTIONS,Sr AND Na CONCENTRATIONS, AND SPECIFIC CONDUCTANCE MEASUREMENTS
Sample and Date Collected
Location and Lithologic Description
Srgo-1 Oxford well water, Butler Co., S. W. Ohio; glacial 7/7/70 outwash
Srgt-2 Hopewell Church Spring, Butler Co,, S. W. Ohio; 7/7/70 glacial t i l l and gravel
Srg-3 Dare Farm Spring, Butler Co., S. W. Ohio; spring 7/7/70 issuing from r iver terrace deposits
Srg-4 Water from hand-dug well on Ticknor Farm, Ashta8/13/70 bula Co., south of Austinburg in N. E. Ohio; water
believed to be from glacial deposits
Srg-5 Spring at Campfire Girls Camp, south of Austin8/13/70 burg, Ashtabula Co., N. E. Ohio; water believed
to be from glacial deposits
Srg-6 Water from hand-dug well 2-1/2 miles west of 5/1/71 Ashley, Delaware Co., Ohio; water believed to be
from glacial deposits
SrL-1 Spring south of West Union, Adams Co., S. W. Ohio; 7/27/70 water issuring from Devonian limestone
SrL-2 Spring water from Yellow Spring; Yellow Springs, 7/29/70 Greene Co., S. W. Ohio; water from Silurian
limestone, t i l l sheet covers area
SrL-3 Spring near St. Paris, Champaign Co., west8/12/70 central Ohio; water believed to be from both
glacial outwash and upper Silurian limestone
Sr Concentration
(mg/1)
0.22
0.10
0.19
0.25
0.12
0.52
0.13
0.16
0.08
NaConcentration
6.40
4.74
3.48
15.75
11.16
102.0
3.45
17.81
Specific Conductance
(u mohs)
575
560
560
585
280
1,100
1,420
685
500

Table 1 (cont.)
Sampleand Date Location and Lithologic DescriptionCollected
SrL-4 Blue Hole Spring, C a s t i l i a , Erie Co., north-central 8/12/70 Ohio; Devonian limestone, t i l l sheet blankets area
SrD-1 Water from well in Veto, Washington Co., S. E. Ohio; 7/29/70 water from Penn.-Permian Dunkard Group e last ics
SrD-2 Spring on Becker Farm, N. E. Washington Co., S. E. 7/29/70 Ohio; Penn.-Permian Dunkard Group elast ics
SrD-3 Spring on Hamilton Farm, S. of Bloomfield, N. E. 7/29/70 Washington Co., S. E. Ohio; Penn.-Permian Dunkard
Group e last ics
SrSh-1 Spring 1/2 mile W. of Mineral Springs, Adams Co., 7/27/70 S. W. Ohio; water issuing from Devonian Ohio Black
Shale
SrSh-2 Well water col lected 1-1/2 miles E. o f Rarden on 7/27/70 Ohio Rt. 73, Scioto Co., south-central Ohio; water
from Devonian Ohio Black Shale
SrSh-3 Well water, approximately 3 miles west of Ashley, 5/1/71 Delaware Co., Ohio; water from Devonian Ohio Black
Shale
SrS-1 Spring, approximately 5 miles N. E. of West Union, 7/27/70 Adams Co., S. W. Ohio; water from calcareous sand
stone, upper S i lu r ian
SrS-2 Spring located approximately 2 miles S. E. of 7/27/70 Fawcett, N. E. Adams Co., S. W. Ohio; water from
calcareous sandstone, upper S i lu r ian
SrS-3 Spring at Sinking Springs, Ohio, Highland Co., 7/28/70 S. W. Ohio; water from upper S i lur ian
Sr Concentration
(mg/1)
8.37
0.31
0.04
0.13
0.20
0.24
9.84
0.06
0.07
0.07
Na Concentration
(mg/1)
14.75
16.75
16.62
3.31
6.68
17.31
2.56
2.65
17.81
Specif ic Conductance
(\i mohs)
1,750
320
140
255
570
445
1,450
630
750
690 CO

Table 1 (cont.)
Sampleand Date Location and Lithologic DescriptionCollected
SrS-4 Well water approximately 2-1/2 miles E. of Pratts 7/28/70 v i l l e , Vinton Co., east-central Ohio; P o t t s v i l i e -
Allegheny Formations
SrCk-1 Ohio Brush Creek at gaging s ta t ion on State Rt. 7/27/70 348, Adams Co., S. W. Ohio
SrCk-2 Tr ibutary to Turkey Creek, 1/2 mile E. of Mineral 7/27/70 Springs, Scioto Co., S. W. Ohio
SrCk-3 Scioto-Brush Creek on Rt. 73, Adams Co., south7/28/70 central Ohio
SrCk-4 L i t t l e Hocking River at crossing Rt. 76 N. of 7/29/70 Por te r f ie ld in S. E. Washington Co.
SrCk-5 L i t t l e Miami River, S. of C l i f t on on Rt. 72, 7/29/70 Greene Co., S. W. Ohio
SrCk-6 Mad River at Dal1 us Road, approximately 4 miles 8/12/70 S. W. of Urbana, Champaign Co., west-central Ohio
SrCk-7 Nett le Creek, approximately 3 miles S. W. of 8/12/70 Urbana, Champaign Co., west-central Ohio
SrCk-8 Mad River at gaging s ta t ion on U. S. Rt. 36, ap8/12/70 proximately 1 mile W. of Urbana on Rt. 36, Cham
paign Co., west-central Ohio
SrCk-9 Kings Creek on Rt. 296 near confluence with Mad 8/12/70 River, approximately 2 miles N. of Urbana, Cham
paign Co., west-central Ohio
SrCk-10 Mad River on Rt. 68, S. of L ibe r t y , Logan Co., 8/12/70 west-central Ohio
Sr Concentration
(mg/1)
0.51
0.08
0.06
0.13
0.17
1.37
0.76
1.70
0.43
0.35
0.52
Na Concentration
(mg/1)
25.63
4.52
2.71
5.88
16.44
5.85
7.20
6.00
3.82
3.58
3.54
Speci f i c Conductance
(y mohs)
400
400
155
755
285
635
685
500
650
600
640

Table 1 (cont.)
Sample Sr Na Specific and Date Location and Lithologic Description Concentration Concentration Conductance Collected (mg/1) (mg/1) (y mohs)
SrCk-11 8/12/70
SciotoOhio
River at Kenton, Hardin Co., north-central 12.35 31.13 880
SrCk-12 8/13/70
Grand River,N. E. Ohio
S. of Austinburg, Ashtabula Co., 0.13 20.69 370
SrC-1 7/29/70
Water from pond at base ofcoal mining, 5 miles W. ofCo., central Ohio
cut made for open-pit Cumberland, Muskingum
1.92 15.05 2,900
SrCk-13 2/15/71
T i f f i n River,N. W. Ohio
E. of Defiance, Defiance Co., 0.40 — 300
SrCk-14 2/15/71
Maumee River,N. W. Ohio
E. of Defiance, Defiance Co., 0.40 — 410
SrCk-15 2/21/71
Great Miami, Mi ami town, Hamilton Co., S. W. Ohio 0.27 — 300
SrCk-16 2/15/71
Lake St . Mary's, Celina, Mercer Co., N. W. Ohio 0.41 — 445
SrCk-17 5/1/71
WhetstoneOhio
Creek, W. of Ashley, Delaware Co., central 1.46 — 805
SrCk-18 5/1/71 Kill buck Creek, Wooster, Wayne Co., N. E. Ohio
0.21 — 585
SrCk-19 5/1/71 Sippo Creek, Massi l ion, Stark Co., N. E. Ohio
0.10 640
11
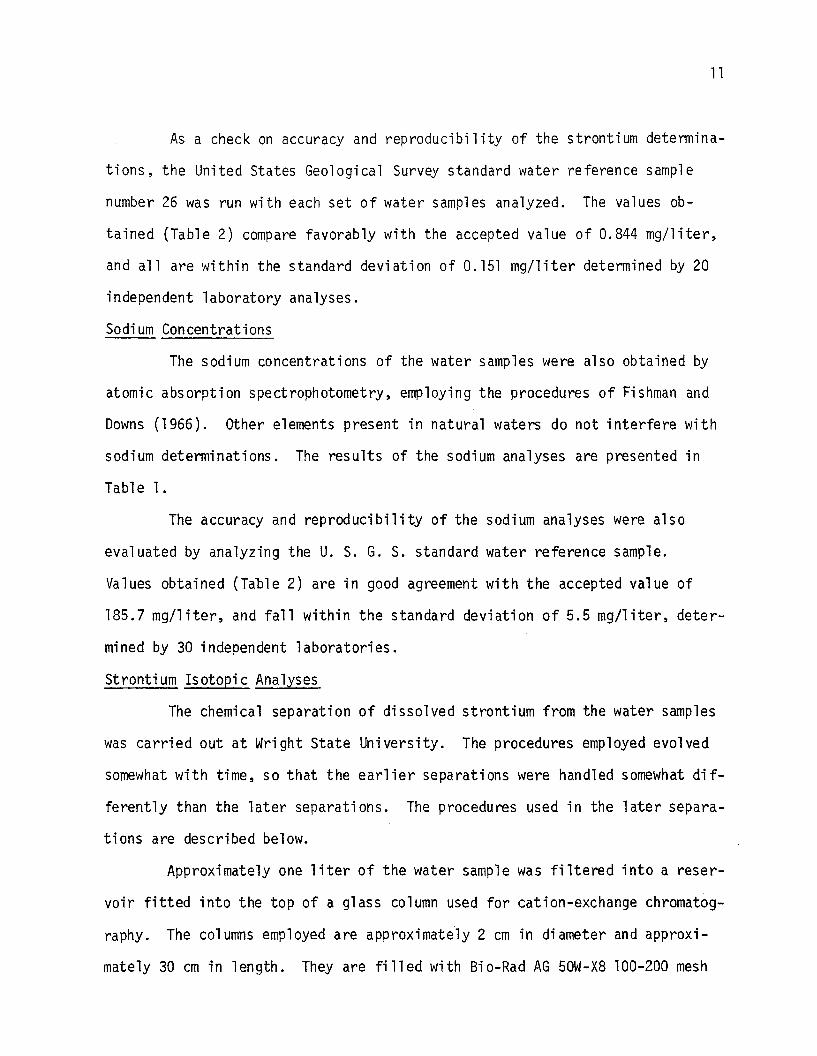
As a check on accuracy and reproducibility of the strontium determina
t ions, the United States Geological Survey standard water reference sample
number 26 was run with each set of water samples analyzed. The values ob
tained (Table 2) compare favorably with the accepted value of 0.844 mg/l i ter,
and a l l are within the standard deviation of 0.151 mg/l i ter determined by 20
independent laboratory analyses.
Sodium Concentrations
The sodium concentrations of the water samples were also obtained by
atomic absorption spectrophotometry, employing the procedures of Fishman and
Downs (1966). Other elements present in natural waters do not interfere with
sodium determinations. The results of the sodium analyses are presented in
Table 1.
The accuracy and reproducibil ity of the sodium analyses were also
evaluated by analyzing the U. S. G. S. standard water reference sample.
Values obtained (Table 2) are in good agreement with the accepted value of
185.7 mg/ l i ter , and fa l l within the standard deviation of 5.5 mg/l i ter, deter
mined by 30 independent laboratories.
Strontium Isotopic Analyses
The chemical separation of dissolved strontium from the water samples
was carried out at Wright State University. The procedures employed evolved
somewhat with time, so that the ear l ier separations were handled somewhat d i f
ferently than the later separations. The procedures used in the later separa
tions are described below.
Approximately one l i t e r of the water sample was f i l te red into a reser
voir f i t t ed into the top of a glass column used for cation-exchange chromatog
raphy. The columns employed are approximately 2 cm in diameter and approxi
mately 30 cm in length. They are f i l l e d with Bio-Rad AG 50W-X8 100-200 mesh

12
TABLE 2
STRONTIUM AND SODIUM ANALYSES OF THEUNITED STATES GEOLOGICAL SURVEYSTANDARD WATER REFERENCE SAMPLE
NUMBER 26
Date Sr (mg/1) Na (mg/1)
8/5/70 0.820
8/20/70 0.868
8/21/70 0.868
8/25/70 0.890
9/28/70 191
9/28/70 186
2/27/71 0.862

13
analytical grade cation exchange resin. The f i l te red water was allowed to
drain through the column. Tests using small amounts of a Sr89 radioactive
tracer indicate that a l l the dissolved strontium was sorbed within the top few
cm of the resin column. I f the strontium concentration in the water was very
low, additional water was f i l te red into the reservoir and allowed to drain
through the column. The column was then eluted with 2.00 N HC1, prepared by
bubbling analytical grade hydrogen chloride gas through t r i p l e -d i s t i l l ed water,
obtained from the McPherson Laboratories at the Ohio State University. Previ
ous calibrations have determined that 500 ml of acid are required to elute the
strontium through the resin and to begin to elute i t from the bottom of the
column. At this point a vycor beaker was placed beneath the column and the
next 400 ml of acid was collected. Tests with the Sr89 tracer showed that
most of the strontium in the sample was contained within this fraction. The
acid was then evaporated to dryness within a pyrex hood. The residue was of
ten yellowish in color, probably because of resin washed from the column.
This was oxidized by adding a few ml of high purity n i t r i c and perchloric
acids and again evaporating to dryness within a pyrex hood. The residue was
then dissolved in n i t r i c acid, transferred to a 10 ml pyrex beaker, evaporated
to dryness, covered, labeled, and stored for isotopic analysis.
Water samples from carbonate terrains often give an abundant hygro
scopic white residue which causes considerable outgassing during mass spec
trometry. I t was found that passing such samples through the chromatography
column a second time essentially eliminates this problem.
The strontium isotopic compositions were determined on a 12-inch radius
of curvature, 90° sector, solid-source mass spectrometer, using double rhenium
filaments. The instrument is located at Miami University. The strontium frac
tion separated from the water sample was dissolved in a few drops of di lute

14
NH03 and was evaporated onto one of the two rhenium filaments, both of which
had been pre-cleaned by heating in the mass spectrometer. After inserting the
double-filament source into the mass spectrometer and obtaining a suitable
vacuum, a stable strontium ion beam was produced by evaporation and ionization
of the strontium sa l t . After acceleration by an e lect r ic f i e ld of 3000 vo l ts ,
the ion beam was resolved into i t s characteristic mass components by magnetic
scanning. A typical analysis consisted of three charts, each representing 20
scans across the mass range 86 to 88. Peak heights were read from the charts,
and the average Sr87/Sr86 and Sr88/Sr86 ratios were calculated for each chart.
Mass fractionation corrections were applied by normalizing the average Sr87/
Sr86 ratios to a Sr88/Sr86 ra t io of 8.375. The normalized Sr87/Sr86 ratios
for the three charts were averaged and this value is reported for each analyzed
sample in Table 3.
The accuracy of the strontium isotopic analyses was evaluated by run
ning the inter-laboratory Eimer and Amend SrC03 standard. Our results (Table
4) are in good agreement with those reported by other labs, which f a l l in the
range 0.7075 to 0.7085. The reproducibi l i ty of the Sr87/Sr86 ratios is i nd i
cated by duplicate analyses, including chemical processing, of two water
samples (Table 4). I t is clear that measured Sr87/Sr86 ratios which d i f fe r by
one part in 700 or more are certainly s igni f icant beyond the l imits of experi
mental uncertainty.
INTERPRETATION OF RESULTS
This report essential ly represents a reconnaissance study of Sr87/Sr86
ratios in stream and ground waters of Ohio. The study was carried out in order
to ascertain the var iab i l i t y of this parameter in waters throughout the state,
15
TABLE 3
Sr87/Sr86 RATIOS OF WATER SAMPLES
SrCk-4
SrCk-5
SrCk-7
SrCk-10
SrCk-11
SrCk-13
SrCk-16
SrC-1
SrL-1
SrL-2
SrL-3
SrL-4
SrD-2
SrS-3
SrSh-1
Srg-5
SrD-1
SrS-4
Srg-1
Sample
L i t t l e Hocking River Washington Co.
L i t t l e Miami River Greene Co.
Nettle Creek Champaign Co.
Mad River Logan Co.
Scioto River Hardin Co.
T i f f i n River Defiance Co.
Lake St. Marys Mercer Co.
Cumberland pond Muskingum Co.
West Union spring Adams Co.
Yellow Springs Greene Co.
St. Paris spring Champaign Co.
Blue Hole spring Erie Co.
Becker spring Washington Co.
Sinking Springs Highland Co.
Mineral Springs Adams Co.
Austinburg spring Ashtabula Co.
Veto well water Washington Co.
Prattsvi l i e well water Vinton Co.
Oxford well water Butler Co.
Sr8 7/Sr8 6*
0.7130
0.7094
0.7089
0.7085
0.7087
0.7091
0.7090
0.7115
0.7129
0.7094
0.7078
0.7082
0.7130
0.7129
0.7125
0.7118
0.7130
0.7111
0.7084
* Normalized to Sr88/Sr86= 8.375.

16
TABLE 4
ANALYSES OF EIMER & AMEND SrC03 STANDARD
Date Sr87/Sr86
11/25/70 0.7082
12/5/70 0.7081
1/7/71 0.7085
3/8/71 0.7080
DUPLICATE ANALYSES OF WATER SAMPLES
Sample Sr 8 7 /Sr 8 6
SrSh-1 0.7125 0.7121
SrL-4 0.7084 0.7080

and possibly to relate any observed variations to the l i thologic type of the
bedrock and overburden in the sampling areas.
The common surface lithologies in Ohio are Paleozoic marine carbonates
and shales, as well as glacial t i l l which consists primarily of pulverized
local bedrock. Our general knowledge of the strontium isotopic compositions
of carbonates and shales is suff ic ient to allow us to predict that signif icant
differences in Sr87/Sr86 ratios exist in these l i thologies in Ohio today.
Marine carbonate rocks have very low Rb/Sr rat ios, so that their Sr87/Sr86
ratios have changed imperceptibly since deposition, and w i l l reflect the
strontium isotopic composition of the ocean at the time of their deposition.
For Paleozoic carbonates, the Sr87/Sr86 ratio w i l l be in the range 0-708 to
0.709. Shales, on the other hand, consist of detr i ta l Rb-bearing minerals,
and hence w i l l be enriched today in radiogenic Sr87. Composites of Paleo
zoic shales have yielded Sr87/Sr85 values of about 0.718. Thus the potential
exists for signif icant differences in the Sr87/Sr86 ratios of Ohio waters.
Sr76/Sr86 ratios have been determined for a total of 8 surface waters,
8 spring waters, and 3 well-water samples (Table 3), The measured Sr87/Sr86
ratios range from about 0.708 to 0.713, a difference which is signif icant far
beyond the l imits of experimental error. Many of the samples contain Sr87
which is more radiogenic than that which would be contributed by marine car
bonate rocks alone. We must now investigate whether these differences can be
related to the bedrock and overburden in the sampling areas.
A geologic map of Ohio is shown in Figure 2. The Paleozoic sedimentary
rocks exposed at the surface dip to the southeast, and increase in age from
east to west. In the east clast ic sediments predominate. The Pennsylvanian
and Permian formations are si l tstones, sandstones, and conglomerates. The
Mississippi an formations are sandstones and shales. Toward the west carbonate
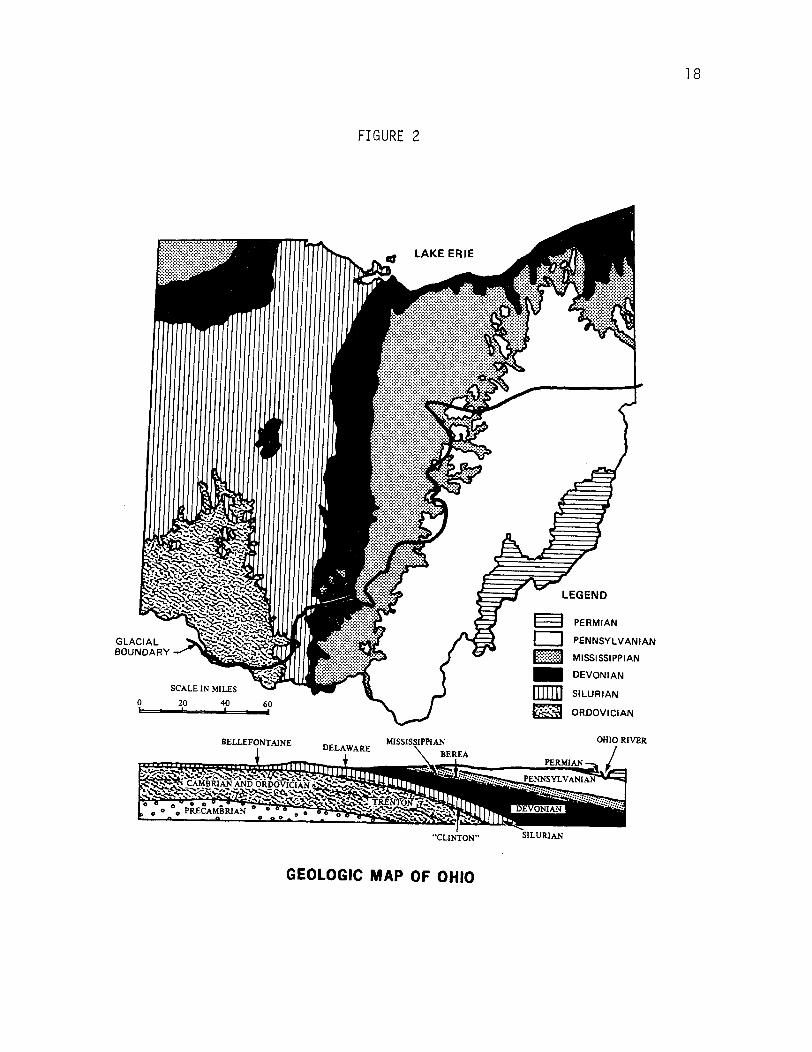
FIGURE 2
GLACIAL BOUNDARY
1 |
PERMIAN
PENNSYLVANIAN
MISSISSIPPIAN
DEVONIAN
SILURIAN
ORDOVICIAN
BELLEFONTAINE DELAWARE
MISSISSIPPIAN BEREA
OHIO RIVER
1
"CLINTON" SILURIAN
GEOLOGIC MAP OF OHIO

19
becomes a more important component. The Devonian consists of shale grading
into dolomite near the base. The Silurian is nearly all carbonate material,
and the Ordovician consists of interbedded carbonates and shales.
The Sr87/Sr87 ratios have been plotted on a map of Ohio in Figure 3.
It is clear that the high Sr87/Sr86 ratios occur in the east, where the clas
tic sediments predominate, whereas the low Sr87/Sr86 ratios are found in the
west, especially where the Silurian carbonate rocks are exposed. The rela
tively high Sr87/Sr86 ratios of water samples from the central and eastern
areas are probably not as high as the Sr87/Sr86 ratios in the Paleozoic shales
found in these areas, but leaching of these shales by the waters certainly
must contribute significantly to the Sr87/Sr86 ratios observed in the waters,
since these ratios are considerably higher than those which would be observed
if the waters had acquired their strontium from carbonate material alone. The
Late Silurian rocks and glacial deposits of western Ohio are known to contain
important amounts of the mineral celestite (strontium sulfate), described by
Feulner and Hubble (1960). Leaching of this mineral by the waters undoubtedly
contributes a major portion of the strontium dissolved in the waters. The
celestite is associated with limestone and with evaporite deposits of gypsum
and rock salt, so that its Sr87/Sr86 ratio was inherited from the Paleozoic
oceans and should therefore be about 0.708.
It is important to note the consistency of the Sr87/Sr86 ratios in
three water samples from Washington County near the eastern Ohio border, each
of which has a different mode of occurrence (Figure 3). Water samples ob
tained from a stream, from a spring, and from a well all yield Sr87/Sr86 ratios
of 0.7130, which would seem to indicate an isotopically similar provenance for
all waters of this county. Three spring waters from an area in south-central

20
FIGURE 3
MAP OF OHIO SHOWING WATER SAMPLE LOCATIONS,MODE OF OCCURRENCE, AND Sr87/Sr86 RATIOS
W SURFACE WATERS
A SPRING WATERS
• WELL WATERS
^ r EASTIN AND FAURE (1970)

Ohio also y i e l d Sr8 7 /Sr8 6 rat ios which are ind is t inguishable wi th in the l im i t s
of experimental er ror (Figure 3) .
There may be some re la t ionship between the Sr 8 7 /Sr 8 6 rat ios observed
in the water samples and the g lac ia l boundary, since only one of the r e l a t i v e
ly high ra t ios occurs to the north of the boundary (Figure 3) . North and west
of the bondary the glaciers pulverized the carbonate bedrock, probably render
ing i t more susceptible to solut ion by ground waters. In Ashtabula County to
the northeast, where the observed Sr 8 7 /Sr8 6 r a t i o is r e l a t i v e l y h igh, there is
no carbonate bedrock readi ly avai lab le .
The weathering of more radiogenic Precambrian material in the t i l l ,
presumably transported into the state from the north by the g lac ie rs , has had
no apparent e f fec t on the Sr8 7 /Sr8 6 ra t ios o f the water samples.
SUMMARY AND CONCLUSIONS
This study has demonstrated tha t the Sr 8 7 /Sr 8 6 ra t ios in surface and
ground waters throughout the state of Ohio show a s i g n i f i c a n t v a r i a b i l i t y .
Samples were col lected and analyzed in order to provide a wide geographic d i s
t r i b u t i o n and a var iety of contacted l i t h o l o g i e s . The measured Sr8 7 /Sr8 6 ra t ios
range from about 0.708 to 0.713, w i th the higher rat ios occurring in eastern
Ohio and the lower ra t ios in the west. We believe that t h i s trend re f lec ts
the change in the dominant l i t ho logy of the Paleozoic sediments across Ohio,
where c l a s t i c sediments predominate in the east and carbonates are more im
portant in the west.
The study represents the i n i t i a l ) phase o f an attempt to use the Sr 8 7 /Sr 8 6
r a t i o as a t racer of stream and ground water provenance. We feel that the
demonstrated v a r i a b i l i t y of t h i s parameter, and i t s apparent dependence on

22
l i thology in the sampling areas, are suf f ic ient ly encouraging to warrant fur
ther study of the application of the overall concept. The next phase of the
overall study is to examine the strontium isotopic compositions of water
samples from a single drainage basin within Ohio, which is underlain in d i f
ferent areas by carbonate and shale bedrock. We are currently pursuing such a
project in the Scioto River basin, even though further support from OWRR could
not be obtained.

23
REFERENCES CITED
Dasch, E. J . , F. A. H i l l s , and K. K. Turekian, 1966, Strontium isotopes in deep-sea sediments: Science, v. 153, pp. 295-297.
East in, R., and G. Faure, 1970, Seasonal var iat ion of the solute content and the Sr8 7 /Sr8 6 ra t io of the Olentangy and Scioto Rivers at Columbus, Ohio: Ohio J . S c i . , v. 70, pp. 170-179.
Feulner, A. J . , and J . H. Hubble, 1960, Occurrence of stront ium in the surface and ground waters of Champaign County, Ohio: Econ. Geol. , v. 55, pp. 176-186.
Fishman, M, J . , and S. C. Downs, 1966, Methods for analysis of selected metals in water by atomic absorpt ion: U. S. Geol. Survey Water-Supply Paper 1540-C, pp. 42-43.
Hamilton, E. I . , 1965, Applied Geochronology: Academic Press, 267 pp.
Hamilton, E. I . , 1968, The iso top ic composition of stront ium applied to problems of the or ig in of the a lka l ine rocks: Radiometric Dating for Geologists (Hamilton and Farquhar, eds , ) , In tersc ience, pp. 437-465.