Project Completion Report: Mindanao Basic Urban … Report Project Number: PHI 30551 Loan Number:...
67
Completion Report Project Number: PHI 30551 Loan Number: 1843-PHI November 2010 Philippines: Mindanao Basic Urban Services Sector Project
Transcript of Project Completion Report: Mindanao Basic Urban … Report Project Number: PHI 30551 Loan Number:...

Completion Report
Project Number: PHI 30551 Loan Number: 1843-PHI November 2010
Philippines: Mindanao Basic Urban Services Sector Project

CURRENCY EQUIVALENTS
Currency Unit – Philippine peso (P)
At Appraisal At Project Completion (17 August 2001) (30 June 2009)
P1.00 = $0.0195 $0.020744 $1.00 = P51.20 P48.20
ABBREVIATIONS
ADB – Asian Development Bank ARMM – Autonomous Region of Muslim Mindanao CDP – comprehensive development plan CEO – chief executive officer DILG – Department of Interior and Local Government DOF – Department of Finance EIRR – economic internal rate of return FIRR – financial internal rate of return JFPR – Japan Fund for Poverty Reduction LBP – Land Bank of the Philippines LGPMS – local government performance monitoring system LGRC – local government resource center LGU – local government unit MBUSSP – Mindanao Basic Urban Services Sector Project NDF – Nordic Development Fund NPV – net present value PCR – project completion report PDO – Project Development Office PIU – project implementation unit PMD – program management department PPMS – project performance monitoring system PSC – project steering committee RRP – report and recommendation of the president SPCR – subproject completion report SPAR – subproject appraisal report TA – technical assistance WRC – women’s resource center

NOTES
(i) The fiscal year of the Government ends on 31 December.
(ii) In this report, "$" refers to US dollars.
Vice-President C. Lawrence Greenwood, Jr. Operations 2 Director General K. Senga, Southeast Asia Department (SERD) Director J. Lynch, Transport and Urban Development Division, SERD Team leader F. Steinberg, Transport and Urban Development Division, SERD Team members M. Ortega, Assistant Project Analyst, SERD P. Villanueva, Administrative Assistant, SERD
In preparing any country program or strategy, financing any project, or by making any designation of or reference to a particular territory or geographic area in this document, the Asian Development Bank does not intend to make any judgments as to the legal or other status of any territory or area.

CONTENTS Page
BASIC DATA i MAP vii
I. PROJECT DESCRIPTION 1
II. EVALUATION OF DESIGN AND IMPLEMENTATION 2 A. Relevance of Design and Formulation 2 B. Project Outputs 2 C. Project Costs 5 D. Disbursements 6 E. Project Schedule 6 F. Implementation Arrangements 6 G. Conditions and Covenants 7 H. Related Technical Assistance 7 I. Consultant Recruitment and Procurement 7 J. Performance of Consultants, Contractors, and Suppliers 8 K. Performance of the Borrower and the Executing Agency 8 L. Performance of the Asian Development Bank 9
III. EVALUATION OF PERFORMANCE 9 A. Relevance 9 B. Effectiveness in Achieving Outcome 9 C. Efficiency in Achieving Outcome and Outputs 9 D. Preliminary Assessment of Sustainability 10 E. Impact 11
IV. OVERALL ASSESSMENT AND RECOMMENDATIONS 12 A. Overall Assessment 12 B. Lessons 12 C. Recommendations 14

APPENDIXES 1. Design and Monitoring Framework 16 2. Data on Subprojects under Part A 21 3. List of Local Government Units and Subprojects Withdrawn from Project 23 4. List of Capacity Building Initiatives under Part B 25 5. Estimated and Actual Project Costs by Component and Funding Source 27 6. Breakdown of Quarterly Disbursements of ADB Loan Funds 28 7. Timeline Chart and Critical Path Diagram of Subproject Processing 29 and Implementation 8. Implementation Schedule 31 9. Organizational Structure 32 10. Status of Compliance with Loan Conditions and Covenants 33 11. Project Profile: Social Protection for Poor Women Vendors in Mindanao 35 12. Economic and Financial Reevaluation 38
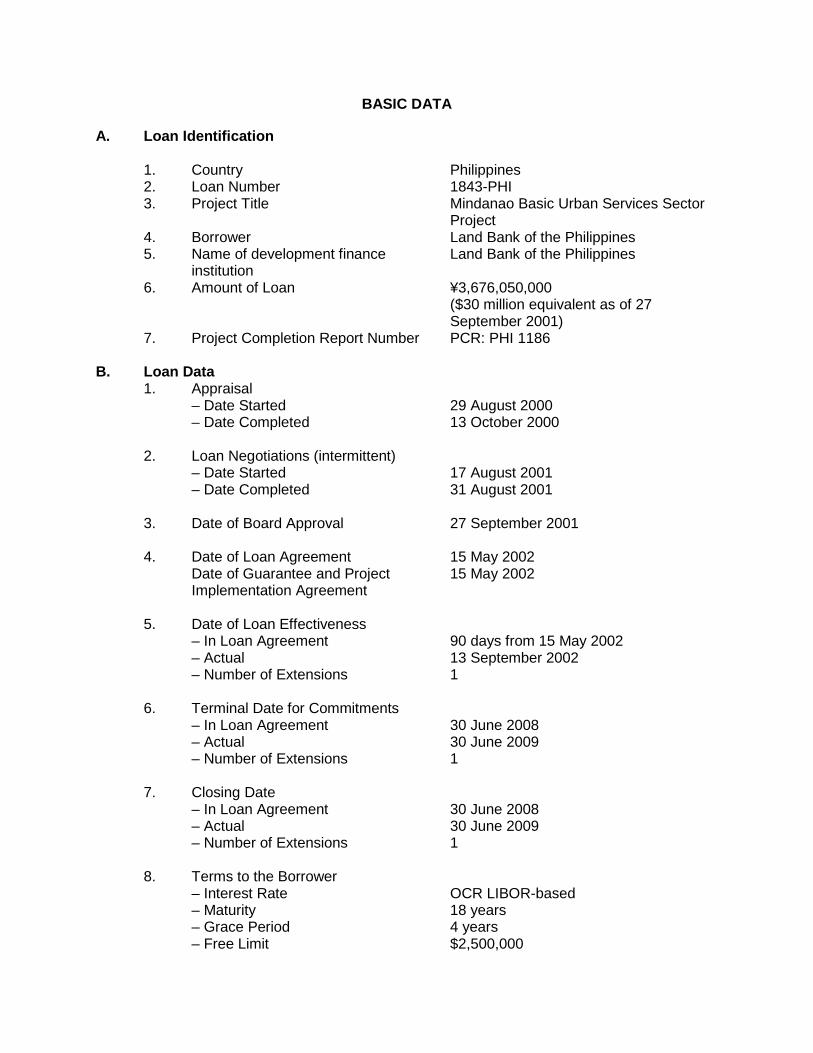
BASIC DATA A. Loan Identification 1. Country 2. Loan Number 3. Project Title 4. Borrower 5. Name of development finance
institution 6. Amount of Loan 7. Project Completion Report Number
Philippines 1843-PHI Mindanao Basic Urban Services Sector Project Land Bank of the Philippines Land Bank of the Philippines ¥3,676,050,000 ($30 million equivalent as of 27 September 2001) PCR: PHI 1186
B. Loan Data 1. Appraisal – Date Started – Date Completed
29 August 2000 13 October 2000
2. Loan Negotiations (intermittent) – Date Started – Date Completed
17 August 2001 31 August 2001
3. Date of Board Approval
27 September 2001
4. Date of Loan Agreement Date of Guarantee and Project Implementation Agreement
15 May 2002 15 May 2002
5. Date of Loan Effectiveness – In Loan Agreement – Actual – Number of Extensions
90 days from 15 May 2002 13 September 2002 1
6. Terminal Date for Commitments – In Loan Agreement – Actual – Number of Extensions
30 June 2008 30 June 2009 1
7. Closing Date – In Loan Agreement – Actual – Number of Extensions
30 June 2008 30 June 2009 1
8. Terms to the Borrower – Interest Rate – Maturity – Grace Period
– Free Limit
OCR LIBOR-based 18 years 4 years $2,500,000

ii
9. Terms of Relending
– Interest Rate – Maturity
– Grace Period
9% to 11% 7 to 15 years 1 to 3 years
10. Interest Rate for Subloans – Original – Revised
14% 9%–11%
11. Disbursements
a. Dates Initial Disbursement
2 October 2003
Final Disbursement 18 November 2009
Time Interval 75 months
Effective Date
13 September 2002
Original Closing Date 30 June 2008
Time Interval 71 months
Actual Closing Date 18 November 2009
Time Interval 87 months
b. Amount ¥2,184,809,766.00 $19,531,691.85 (loan currency) (US$ equivalent as of 18 November 2009)
Cate-gory No.
Category or Subloan
Original Allocation
Partial Cancellations
Last Revised
Allocation Amount
Disbursed Undisbursed
Balance1 (1) (2) (3) (4 = 3-5) (5) (6) (7 = 5-6)
Civil Works 005 Parang,
Maguindanao 1,470,111 (15,017) 1,485,128 462,916 1,022,212
006 Siocon, Zamboanga del Norte
643,933 (10,832) 654,765 385,363 269,402
007 Mahayag, Zamboanga del Sur
263,555 (2,894) 266,449 163,170 103,279
010 Roseller T. Lim, Zamboanga Sibugay
301,764 (6,584) 308,348 170,914 137,434
011 Buluan, Maguindanao
667,059 (11,380) 678,439 464,910 213,529
012 Dumalinao, Zamboanga del Sur
265,583 (4,935) 270,518 167,467 103,051
013 Naawan, Misamis Oriental
280,160 (4,780) 284,940 165,147 119,793
015 Kapatagan, Lanao del Norte
286,795 (25,630) 312,425 312,425 0

iii
Cate-gory No.
Category or Subloan
Original Allocation
Partial Cancellations
Last Revised
Allocation Amount
Disbursed Undisbursed
Balance1 (1) (2) (3) (4 = 3-5) (5) (6) (7 = 5-6) 016 San Isidro,
Surigao del Norte 139,495 (19,362) 158,857 150,532 8,325
017 Isulan, Sultan Kudarat
453,996 (19,698) 473,694 473,694 0
018 Mati, Davao Oriental
1,321,840 (102,754) 1,424,594 1,424,594 0
019 Datu Odin Sinsuat, Maguindanao
1,086,401 0 1,086,401 1,086,401 0
020 Sibuco, Zamboanga del Norte
539,514 (21,176) 560,690 498,441 62,249
021 Ozamis, Misamis Occidental
1,708,462 (784,858) 2,493,320 2,493,320 0
022 Guipos, Zamboanga del Sur
323,591 0 323,591 323,591 0
023 Kolambugan, Lanao del Norte
351,283 (35,111) 386,394 325,991 60,403
025 Jasaan, Misamis Oriental
448,007 0 448,007 448,007 0
026 Tago, Surigao del Sur
469,893 0 469,893 469,893 0
027 Pilar, Surigao del Norte
306,873 (231,51) 330,024 330,011 13
028 Barabo, Surigao del Sur
132,395 (252,900) 385,295 385,295 0
029 Datu Paglas, Maguindanao
142,879 (264,152) 407,031 374,500 32,531
031 Maluso, Basilan 704,961 21,982 682,979 88,537 594,442 032 Impasugong,
Bukidnon 500,624 (9,501) 510,125 507,448 2,677
033 Jasaan, Misamis Oriental
597,182 25,726 571,456 45,541 525,915
A02 Jabonga, Agusan del Norte
133,276 0 133,276 133,276 0
A03 Alicia. Zamboanga Sibugay
140,792 0 140,792 140,792 0
A04 Cabadbaran, Agusan del Norte
200,222 (31,795) 232,017 232,017 0
A05 Kidapawan, North Cotabato
669,629 0 669,629 669,629 0
A07 Makilala, North Cotabato
389,370 (29,408) 418,778 418,778 0
A09 Panabo, Davao del Norte
610,332 0 610,332 610,332 0
A11 Tangub, Misamis Occidental
1,754,095 (157,850) 1,911,945 1,737,362 174,583
A13 Alamada, North Cotabato
247,332 (451,559) 689,891 648,786 50,105
A15 Hagonoy, Davao del Sur
134,862 (1,974) 136,836 121,858 14,978
A17 Claveria, Misamis Oriental
1,406,812 35,327 1,371,485 850,123 521,362
A19 Alubijid, Misamis Oriental
445,747 (99,446) 545,193 397,039 148,154

iv
Cate-gory No.
Category or Subloan
Original Allocation
Partial Cancellations
Last Revised
Allocation Amount
Disbursed Undisbursed
Balance1 (1) (2) (3) (4 = 3-5) (5) (6) (7 = 5-6)
Equipment 008 Norala, South
Cotabato 97,489 (2,459) 99,948 58,597 41,351
024 Hagonoy 241,780 (8,600) 250,380 246,487 3,893 030 Tukuran,
Zamboanga del Sur
66,278 (123,623) 189,901 128,352 61,549
A10 Lugait, Misamis Oriental
82,972 (3,175) 86,147 86,147 0
Land Acquisition 0 0 0 0 0 Design and Supervision 0 0 0 0 0 Project Management and Implementation Support
0 0 0 0 0
Institutional Capacity Building
0 0 0 0 0
Interest During Construction
1,300,000 0 0 1,334,010 0
Total (¥, loan currency) 3,676,050,000 2,184,809,766 388,425,234 Total (US$ equivalent) 30,000,000 19,531,691 a b c d e
1 For final cancellation a = US$ equivalent as per report and recommendation of the President b = US$ equivalent as of date of approval of cancellation c = Total of (d + e) d = Actual US dollar equivalent e = US$ equivalent as of report preparation
C. Implementation Data
1. Number of Subloans 39 2. Sectoral Distribution of Subloans 5
Sector (specify) Projected Actual Water Supply – 8 Bus Terminal and Public Market Bus Terminal Public Market
–
3
13 Flood Control and Drainage – – Solid Waste Management – – Urban Roads and Bridges – – Road Maintenance Equipment – 4 Other Public Facilities – 11 Total 30–40 39
3. Size of Subloans (actual) ($‘000)
Range Number of Subloans Aggregate Amount Up to $500,000 30 8,169,688 From $500,001 to $1,000,000 5 3,286,318 From $1,000,001 to $1,500,000 2,510,995 Over $1,500,000 2 4,230,682
v
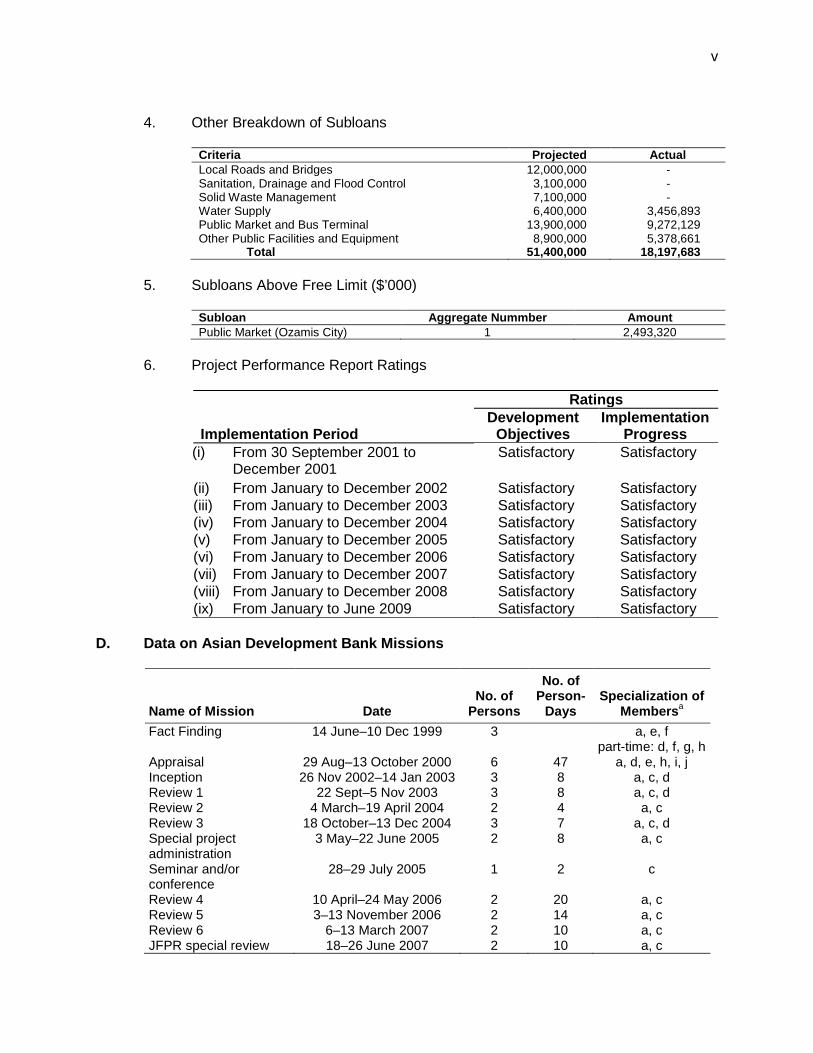
4. Other Breakdown of Subloans
Criteria Projected Actual Local Roads and Bridges 12,000,000 - Sanitation, Drainage and Flood Control 3,100,000 - Solid Waste Management 7,100,000 - Water Supply 6,400,000 3,456,893 Public Market and Bus Terminal 13,900,000 9,272,129 Other Public Facilities and Equipment 8,900,000 5,378,661 Total 51,400,000 18,197,683
5. Subloans Above Free Limit ($’000)
Subloan Aggregate Nummber Amount Public Market (Ozamis City) 1 2,493,320
6. Project Performance Report Ratings
Implementation Period
Ratings Development
Objectives Implementation
Progress (i) From 30 September 2001 to
December 2001 Satisfactory Satisfactory
(ii) From January to December 2002 Satisfactory Satisfactory (iii) From January to December 2003 Satisfactory Satisfactory (iv) From January to December 2004 Satisfactory Satisfactory (v) From January to December 2005 Satisfactory Satisfactory (vi) From January to December 2006 Satisfactory Satisfactory (vii) From January to December 2007 Satisfactory Satisfactory (viii) From January to December 2008 Satisfactory Satisfactory (ix) From January to June 2009 Satisfactory Satisfactory
D. Data on Asian Development Bank Missions
Name of Mission Date No. of
Persons
No. of Person-
Days Specialization of
Membersa Fact Finding 14 June–10 Dec 1999 3 a, e, f
part-time: d, f, g, h Appraisal 29 Aug–13 October 2000 6 47 a, d, e, h, i, j Inception 26 Nov 2002–14 Jan 2003 3 8 a, c, d Review 1 22 Sept–5 Nov 2003 3 8 a, c, d Review 2 4 March–19 April 2004 2 4 a, c Review 3 18 October–13 Dec 2004 3 7 a, c, d Special project administration
3 May–22 June 2005 2 8 a, c
Seminar and/or conference
28–29 July 2005 1 2 c
Review 4 10 April–24 May 2006 2 20 a, c Review 5 3–13 November 2006 2 14 a, c Review 6 6–13 March 2007 2 10 a, c JFPR special review 18–26 June 2007 2 10 a, c

vi
Name of Mission Date No. of
Persons
No. of Person-
Days Specialization of
Membersa Review 7 9–24 October 2007 2 14 a, c Special exploratory mission with AusAID
18–19 May 2008 1 2 a
Review 8 3–6 June 2008 2 20 a, c Review 9 19–26 November 2008 1 38 a Review 10 5 June–2 July 2009 2 12 a, c Project completion reviewb
9 July–26 July 2010 3 20 a, c, d
AusAID = Australian Agency for International Development, JFPR = Japan Fund for Poverty Reduction. a a = mission leader, b = project economist, c = assistant project analyst, d = consultant, e = programs
officer, f = urban specialist, g = environment specialist, h = social development specialist, i = counsel, j = control officer.
b The project completion report was prepared by F. Steinberg (urban development specialist/mission leader), M. Ortega (assistant project analyst), and A. Palacio (financial and economic analyst/staff consultant).

vii

I. PROJECT DESCRIPTION 1. The high rate of urbanization in the Philippines, combined with insufficient local investment, has led to serious deficiencies in the provision of basic urban infrastructure and municipal services in Mindanao. Despite Mindanao's abundant natural resources and fertile soil, it is home to some of the poorest regions in the country. The incidence of urban poverty in Mindanao is nearly twice the national average, and local government units (LGUs) can barely meet the requirements for basic urban infrastructure and municipal services, which are poor compared with the rest of the country. At the time of project design, there was an urgent need to improve urban service delivery by (i) upgrading and expanding infrastructure, and (ii) improving the capability of LGUs to provide and manage services. Improved basic urban services (water, sanitation, drainage, and solid waste management) supposedly help reduce environmental poverty, raise living standards, strengthen links between urban and rural areas, and support the peace process.1
2. The project's long-term impact was improved quality of life for urban residents in Mindanao. Specifically, the project objectives were to: (i) improve Mindanao residents’ access to basic urban services by providing, upgrading, and rehabilitating infrastructure and improving service delivery; (ii) increase urban poor communities’ access to basic municipal services; and (iii) improve the institutional capacity of LGUs to provide and manage municipal services and basic urban infrastructure. 3. The project had two parts, which covered infrastructure investment (Part A) and institutional capacity building (Part B). Part A was partly financed through a loan from the Asian Development Bank (ADB), and Part B was financed through a loan from the Nordic Development Fund (NDF). 4. Part A was designed to finance urban infrastructure and/or municipal service subprojects initiated by 30 to 40 target LGUs. Part A included both non-revenue and revenue-generating subprojects. Non-revenue subprojects included roads and bridges, sanitation, drainage, flood protection, and solid waste.2
Revenue-generating subprojects included water supply systems, bus terminals, and public markets.
5. Under Part B, the following components were implemented: project management support to the Department of Interior and Local Government (DILG) (component A)3; subproject preparation and implementation support (component B)4; LGU capacity building (component C);5 and institutional strengthening of DILG (component D).6
1 ADB. 2001. Report and Recommendation of the President to the Board of Directors: Proposed Loan to the
Republic of the Philippines for the Mindanao Basic Urban Services Sector Project. Manila. 2 In October 2003, the Land Bank of the Philippines (LBP) requested an expansion of subproject coverage to
include public hospitals and public school buildings as eligible subprojects. This was approved by ADB but in the end, no LGUs submitted application for these subprojects.
3 Including support for start-up activities, implementation schedules, budgets, reporting format, establishment of project implementation units (PIUs), procurement packages, progress reports, completion reports, overall project performance monitoring systems, and resolution of issues.
4 Including assistance to participating LGUs in preparation of feasibility study reports, subproject appraisal and completion reports, and bid documents; procurement of contractors, consultants, and suppliers; detailed engineering review; construction supervision and contract administration; and operations and maintenance.
5 Capacity building in development planning; land use planning; and financial management. 6 Assistance to the DILG in developing a self-assessment tool for measuring LGUs’ administrative capacity and
their performance in delivering services and managing municipal infrastructure.

2
II. IMPLEMENTATION A. Relevance of Design and Formulation 6. Part A of the project supported the priorities in the Medium-Term Philippine Development Plan, 2004–20107 and the National Urban Development and Housing Framework, 2004–2009.8 The poverty reduction program complemented the peace process in Mindanao. The project was also consistent with ADB’s overarching goal of reducing poverty by improving social services delivery, protect the environment, and promoting good governance.9
The goal of attaining improved living conditions in urban and peri-urban areas—particularly in Mindanao—and the objective of providing infrastructure and other essential services were in line with the government's development thrusts.
7. The project design was relevant, as it recognized that infrastructure investments alone do not guarantee the success of a project, and therefore provided complementary capacity building support. The concepts of building capacity throughout the project cycle, and holding process-related seminar–workshops supported by customized coaching sessions, suited the project. By involving beneficiary communities through a participatory approach in project preparation, the project fostered LGU ownership. 8. Under Part B of the project, several minor changes were implemented: Under component A, a results monitoring and evaluation system was adopted by the DILG in lieu of the original project performance monitoring system. Under component C, the original intention of assisting LGUs in land-use planning was changed to improving the development planning capacity of LGUs. This was in line with the Local Government Code that called for the DILG to roll out an improved development planning system. This required LGUs to prepare two plans—a comprehensive development plan and a comprehensive land use plan, as mandated by the 2006 Local Government Code. For component D, the original design called for developing a project performance management system—a self-assessment tool for LGUs—through technical assistance (TA) to the DILG. However, the DILG developed its own local government performance management system (LGPMS) during the project start-up period. 10
After discussions with ADB, it was agreed that component D would implement the LGPMS. Component B remained unchanged.
B. Project Outputs 9. Under Part A (infrastructure investment), 30 to 40 LGUs were targeted in the project’s report and recommendation of the president (RRP). A total of 39 subprojects were approved and implemented, with 36 subprojects completed as of November 2010.11
A list of subprojects and details are provided in Appendix 2.
7 National and Economic Development Authority. 2004. Medium-Term Philippines Development Plan, 2004–2010.
Manila. 8 Housing and Urban Developmnet Coordinating Council. 2004. National urban Development and Housing
Framework, 2004–2009. Manila. 9 ADB. Country Strategy and Program, 2002–2004. para. 8. 10 Funding assistance for the preparation of the local government performance management system was provided
by several development partners, including the Canadian International Development Agency, United Nations Development Programme, and ADB.
11 Two subprojects in the Autonomous Region of Muslim Mindanao (Parang water supply and Maluso public market) and one in Region 10 (Jasaan water supply) were not completed because of peace and order problems and, in some cases, political issues (Parang and Maluso) or technical problems (Jasaan).
3
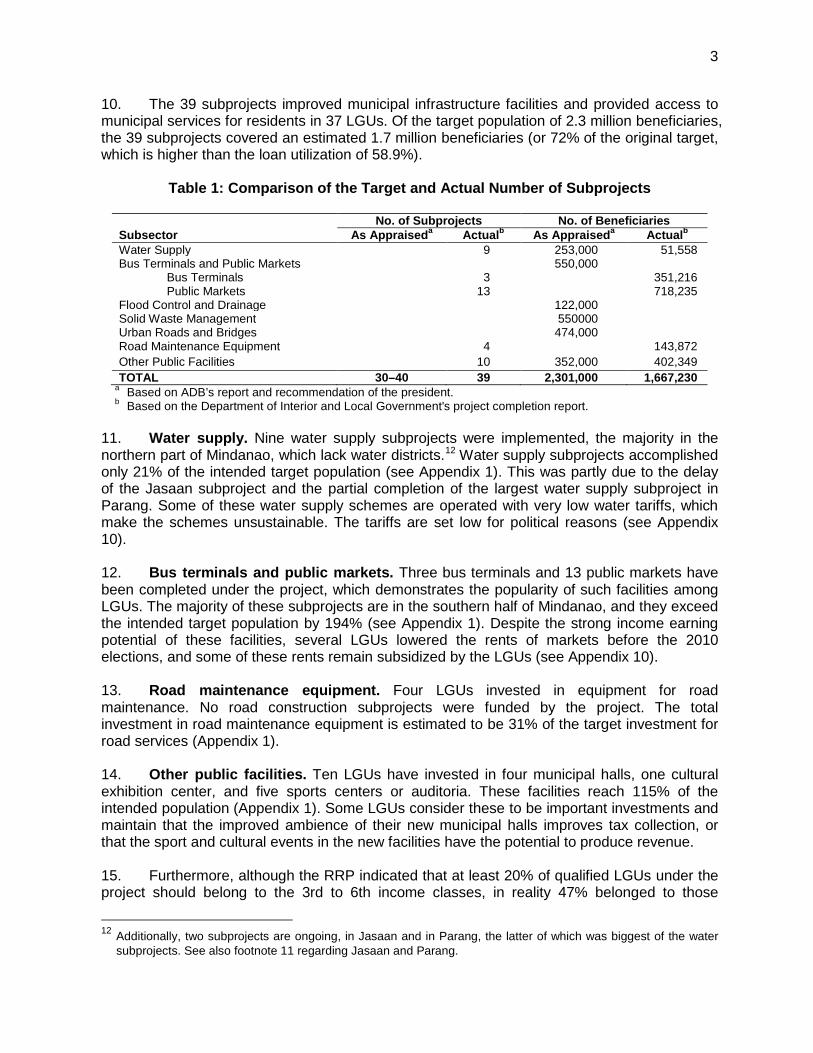
10. The 39 subprojects improved municipal infrastructure facilities and provided access to municipal services for residents in 37 LGUs. Of the target population of 2.3 million beneficiaries, the 39 subprojects covered an estimated 1.7 million beneficiaries (or 72% of the original target, which is higher than the loan utilization of 58.9%).
Table 1: Comparison of the Target and Actual Number of Subprojects
No. of Subprojects No. of Beneficiaries Subsector As Appraiseda Actualb As Appraiseda Actualb Water Supply 9 253,000 51,558 Bus Terminals and Public Markets 550,000 Bus Terminals 3 351,216 Public Markets 13 718,235 Flood Control and Drainage 122,000 Solid Waste Management 550000 Urban Roads and Bridges 474,000 Road Maintenance Equipment 4 143,872 Other Public Facilities 10 352,000 402,349 TOTAL 30–40 39 2,301,000 1,667,230
a Based on ADB’s report and recommendation of the president. b Based on the Department of Interior and Local Government's project completion report.
11. Water supply. Nine water supply subprojects were implemented, the majority in the northern part of Mindanao, which lack water districts.12
Water supply subprojects accomplished only 21% of the intended target population (see Appendix 1). This was partly due to the delay of the Jasaan subproject and the partial completion of the largest water supply subproject in Parang. Some of these water supply schemes are operated with very low water tariffs, which make the schemes unsustainable. The tariffs are set low for political reasons (see Appendix 10).
12. Bus terminals and public markets. Three bus terminals and 13 public markets have been completed under the project, which demonstrates the popularity of such facilities among LGUs. The majority of these subprojects are in the southern half of Mindanao, and they exceed the intended target population by 194% (see Appendix 1). Despite the strong income earning potential of these facilities, several LGUs lowered the rents of markets before the 2010 elections, and some of these rents remain subsidized by the LGUs (see Appendix 10). 13. Road maintenance equipment. Four LGUs invested in equipment for road maintenance. No road construction subprojects were funded by the project. The total investment in road maintenance equipment is estimated to be 31% of the target investment for road services (Appendix 1). 14. Other public facilities. Ten LGUs have invested in four municipal halls, one cultural exhibition center, and five sports centers or auditoria. These facilities reach 115% of the intended population (Appendix 1). Some LGUs consider these to be important investments and maintain that the improved ambience of their new municipal halls improves tax collection, or that the sport and cultural events in the new facilities have the potential to produce revenue. 15. Furthermore, although the RRP indicated that at least 20% of qualified LGUs under the project should belong to the 3rd to 6th income classes, in reality 47% belonged to those
12 Additionally, two subprojects are ongoing, in Jasaan and in Parang, the latter of which was biggest of the water
subprojects. See also footnote 11 regarding Jasaan and Parang.

4
classes.13
16. About 39 other subprojects were proposed for funding at various stages during project implementation. These were not implemented because of various reasons, including: (i) changes in local development priorities; (ii) internal political conflicts between the local executive and the legislative council; (iii) cancellation of the capital grant from the national government in 2005; (iv) ineligibility to meet the required net borrowing capacity; and (v) in the case of water supply subprojects, a lack of water sources. A list of these subprojects and the reasons for their withdrawal are in Appendix 3. 17. Under the institutional capacity building program (Part B), the project supported about 68 LGUs through various training modules, depending on the needs and requirements of the LGU.14
Each LGU was able to avail of technical skills training or attend workshops, coaching sessions, and other training in many modules.
18. Part B comprised four components: component A provided project management support;15 component B provided assistance to LGUs in subproject implementation;16 component C provided assistance to LGUs in development planning, land use planning, and financial management;17 and component D provided institutional strengthening assistance to the DILG.18
The outputs for each component are summarized in Table 2, and details are provided in Appendix 4.
Table 2: Technical Assistance and Training Implemented Under Institutional Capacity Building Program
Component Description No. of LGUsa No. of Participantsb Component A – Project Management Support 140 952 Component B – Subproject Implementation Support 206 1,965 Component C – LGU Capacity Building Program 166 2,397 Component D – DILG Institutional Strengthening 46 1,770 TOTAL 558 7,084 DILG = Department of Interior and Local Government, LGU = local government unit. a LGUs were able to attend more than one training or coaching session in each component, depending on their
identified needs and absorptive capacities. b Includes DILG, Land Bank of the Philippines, and LGU participants. Source: DILG
13 LGUs are divided into income classes: 3rd class—P30 million or more but less than P40 million; 4th class—P20
million or more but less than P30 million; 5th class—P10 million or more but less than P20 million; and 6th class—below P10 million.
14 Mindanao Basic Urban Services Sector Project Baseline Study, 2005. 15 Support for project management, advocacy for environmental investments and sustainability of services, and
project reporting systems were provided. Operations manuals (in 16 volumes) were prepared to serve as guides for the DILG, LBP, and the LGU-PIU in the preparation, implementation, and operation and maintenance of subprojects.
16 Training was conducted to enhance the skills of PIUs and local staff in subproject preparation, implementation, and operation and maintenance.
17 Five training modules for LGUs were developed and implemented: harmonized planning and financial management; rationalized planning system; real property tax administration; business tax administration; and economic enterprise management. LGUs were allowed to receive technical assistance for two modules.
18 The following key tasks were undertaken: review of the DILG’s systems used in LGU performance measurement; international comparative studies and project visits for DILG officials; developing a database of LGUs’ best practices, including an Information-technology-based system for accessing and managing database; and establishing a local governance resource center in each DILG region to serve as a venue for sharing knowledge and experiences in management innovation and best practices of governance.

5
C. Project Costs 19. At appraisal, the project cost was estimated at $60 million, comprising $27.6 million foreign exchange costs and $32.4 million local currency costs. The original ADB loan amount of ¥3,676 million ($30 million equivalent at appraisal) was to finance the foreign exchange costs of $24.6 million equivalent, which included interest and other charges during construction of $1.3 million equivalent and local costs of $5.4 million equivalent. Additional credit financing was to be provided by the NDF in the amount of $6.0 million for the implementation of Part B. LBP, as the borrower, was to finance $9.4 million. The government and the LGUs were to put up $14.6 million in counterpart funds. The government (through the DILG) intended to provide capital grants to LGUs amounting to $7.3 million; however, because of budget constraints, these capital grants were not provided. 20. At completion, the actual total cost of the project was $40.2 million equivalent, comprising $15.6 million equivalent in foreign exchange and $24.6 million equivalent in local currency. ADB financed $12.6 million equivalent in foreign exchange, including interest during construction of $1.3 million equivalent, and $5.8 million equivalent in local currency cost. The NDF financed $6.0 million equivalent, the LBP financed $6.6 million equivalent, and the government and LGUs financed $8.1 million equivalent. 21. In November 2005, LBP requested a partial loan cancellation of $9.27 million equivalent because of slow disbursements brought about by delays in subproject implementation.19 The main reason for the low utilization of the infrastructure investment loan (Part A) was weak commitment by many LGUs as expressed in dropouts from the project, even after preparation of subprojects. During the middle years of project implementation, the government’s inability to provide capital grant funds contributed to the low utilization of the infrastructure investment. ADB addressed this problem by approving a new financing mix in July 2005.20
However, the disbursement projections in the RRP (disbursement of 15% in year 1, 30% in year 2, etc.) were unrealistic since no disbursements occurred during the first two quarters, when the project was in development.
22. As of the project's closing date (June 2009), another $4.33 million equivalent of the ADB loan for Part A remained unutilized. LGU subprojects that had not been completed by the closing date have since been completed using complementary funds derived from LBP's internal funds or from the Department of Finance’s (DOF) municipal development fund office.21
19 It should be noted that the projected original targets were relatively high considering the expectations that the six
pilot projects would give a strong head start in subproject implementation. The long time lag (four years) between (pilot) project preparation in 1998 and project start-up in 2002), along with changes in the leadership of LGUs, may have contributed to the deferment and eventual cancellation of three of the six pilot projects.
The estimated and actual project costs by component and by funding sources are in Appendix 5.
20 The new financing mix was 90% loan financing and 10% LGU equity, against the planned financing mix outlined in the RRP of 70% loan financing and 30% LGU equity which included a government grant component for qualified LGUs.
21 After loan closing, LBP utilized its internal fund to complete the remaining six subprojects (water supply systems in Alubijid, Claveria, Jasaan, and Parang; Ozamis public market; and Tangub gymnasium), while the DILG passed on to the Municipal Development Fund Office the financing of 11 subprojects: equipment in New Corella, Davao del Norte; water supply system in Mahayag, Zamboanga del Sur; water supply system in Upi, Maguindanao; transport terminal in Kumalarang, Zamboanga del Sur; transport terminal in Kapatagan, Lanao del Norte; transport terminal in Kabacan, North Cotabato; transport terminal in Alegria, Surigao del Norte; public market in Tudela, Misamis Occidental; public market in Kapatagan, Lanao del Norte; public market in Libungan, North Cotabato; and public market in Lianga, Surigao del Sur.

6
D. Disbursements 23. The loan proceeds available at completion were $22.5 million equivalent, against the total disbursements of ¥2,184,809,766.00 ($19.5 million equivalent at project completion), which included interest charges of $1.3 million equivalent. Hence, ¥388,425,234.00 ($4.33 million equivalent) was cancelled upon the closing of the loan account on 30 June 2009. Loan proceeds were disbursed in accordance with ADB’s Loan Disbursement Handbook (2007, as amended from time to time). Disbursements were slow during the 1st year of implementation but significantly improved once consultants were fielded in September 2003 to assist with project implementation. No reallocation or supplementary loan was necessary. The imprest account established by LBP was maintained and operated satisfactorily. Statement of Expenditure procedures were used to reimburse eligible expenditures. Actual quarterly disbursements are in Appendix 6. 24. The government, LBP, and the LGUs provided the local counterpart funds to implement the project. However, in early 2005 the government had to cancel its grant funding for LGU subprojects because of budgetary constraints and its introduction of a “no grant policy” for certain types of subprojects. This resulted in a lack of demand for subprojects by LGUs. The total of government/DILG capital amounted to $3.2 million. E. Project Schedule 25. The loan agreement between ADB and LBP was signed on 15 May 2002 and was declared effective on 13 September 2002. Based on project design, the project implementation period was six years. 26. The original loan closing date of the project was 30 June 2008. The government requested an extension to 30 June 2009. The extension was justified by the slow start-up activities of the subprojects, the effects of local elections, the late procurement of the project management consultant and the late creation of the project development office (PDO). Appendix 7 shows the timeline chart and critical path diagram of subproject processing and implementation; the projected and actual implementation schedules are compared in Appendix 8. F. Implementation Arrangements 27. As designed, LBP was the executing agency for Part A, and the DILG was the executing agency for Part B. To undertake its responsibilities, LBP designated its program management department to administer the project lending facility, while the DILG established the PDO to provide capacity building support to the LGUs. 28. At the national level, the project established a project steering committee (PSC) for the project as a whole, chaired by the DILG secretary. Its membership comprised representatives of, the Department of Budget and Management, the Department of Environment and Natural Resources (DENR) DOF, the Department of Public Works and Highways, the Housing and Urban Development Coordinating Council, LBP, and the National Economic and Development Authority. At the regional level, the project required the creation of a technical review and coordinating committee, the chairmanship of which was held by LBP's executive vice-president for Mindanao. The committee's membership was drawn from the representative of the DILG and other government agencies. Neither the PSC nor the Technical Review Coordination Committee met frequently.

7
29. The LGUs were the implementing agencies and were required to create project implementation units (PIUs) for the coordination, preparation, and implementation of the infrastructure investments and capacity building activities. The PIUs coordinated with local bids and awards committees on procurement matters, and with the specific LGU departments for the specific responsibilities or functions required. The performance of LGUs varied considerably depending on local leadership and motivation. All LGUs have prior experience in procurement and were assisted by the DILG in procurement matters; only one case of misprocurement occurred in Tangub. However, implementation of most subprojects took longer than planned. The organizational structure for the project is in Appendix 9. G. Conditions and Covenants 30. The 15 key covenants specified in the loan agreement were largely complied with. However, in hindsight, the covenant that required the borrower to maintain a program management department and assign a team of qualified staff from the borrower’s head office (Schedule 4, para. 5), was only partly complied with. LBP assigned only two staff members to administer the project, asserting that the personnel of its local lending centers also supported the project. In 2003, LBP claimed that these two employees were not able to assist, as required, with the preparation of subproject appraisal reports (SPARs). In effect, this assertion of LBP’s staff commitment prompted the PDO of the DILG to play a stronger role by developing subprojects for Part A, as suggested by the RRP (para. 58). 31. Meanwhile, because of budgetary constraints and the government's “no-grant policy” introduced in 2005, the DILG, as the executing agency for Part B, was not able to fully meet its intention to provide capital grant funds to the LGUs. 32. A summary of the executing agencies’ compliance with conditions and covenants is in Appendix 10. H. Related Technical Assistance 33. ADB, through the Japan Fund for Poverty Reduction (JFPR), provided a parallel technical assistance and investment grant in the form of the $1 million for the Social Protection for Poor Women Vendors in Mindanao project. 22 This JFPR project was a 3-year poverty reduction initiative for poor women vendors, pilot tested in eight LGUs distributed among all six administrative regions of Mindanao.23
The grant was designed to complement the Mindanao Basic Urban Services Sector Project's public markets program (which accounted for 34% of the project investment) by helping poor women vendors participate in market business, at the same time fulfilling their economic, social, and cultural roles. The JFPR grant provided services that were highly appreciated by beneficiaries and that enhanced the gender benefits of the project. Summary information is provided in Appendix 11.
I. Consultant Recruitment and Procurement 34. Consultant recruitment and procurement procedures followed the required guidelines.
22 ADB. 2002. Proposed Grant Assistance to the Philippines for the Social Protection of Poor Women Vendors in
Mindanao. Manila. 23 The LGUs included the cities of Kidapawan, Ozamis, Panabo, and Surigao; and the municipalities of Buluan,
Maguindanao; Cabadbaran, Agusan del Norte; Mahayag, Zamboanga del Sur; and Parang, Maguindanao.

8
The loan agreement stipulated that procurement for Part A was to be carried out as follows: (i) selection of consultants for detailed engineering and construction works financed by the LGUs was to be carried out in accordance with procedures acceptable to ADB; (ii) for subprojects that cost more than $2.0 million equivalent, ADB was to review the terms of reference, evaluation criteria, service contracts, and evaluation results; (iii) the Guidelines for Procurement, dated February 1999 were to be followed in procuring civil works and goods funded partly or wholly by the ADB loan proceeds; civil works contracts of more than $2.0 million and equipment contracts of more than $0.5 million were to be awarded based on international competitive bidding procedures. 35. For Part B, the procurement of services of consultants funded by the NDF was to be approved by ADB and carried out through arrangements satisfactory to ADB. The appraisal estimated 644 person-months of consulting inputs (130 for international and 514 for national consultants). The consultants were mobilized in September 2003 for components A and B and in October 2006 for components C and D. All four components were completed in December 2008. At project completion, the consultants had provided 353.21 person-months of consulting inputs (0.49 person-months international and 352.72 person-months national staff). The significant reduction in consultant inputs was due to the delay in the implementation period for components C and D, which resulted in reduced scope of work; and a DILG request to convert international consultant inputs to national consultant inputs. 36. The original project design required that the DILG contract different consulting firms for components A and B, and C and D. However, when the scope of services and subcomponent activities for components C and D were revised, the DILG invited the same consortium of consultants implementing components A and B to implement components C and D as well, as the work under components C and D complemented the activities under components A and B.24
J. Performance of Consultants, Contractors, and Suppliers 37. The NDF-funded capacity-building consultant performed satisfactorily and in accordance with the terms of reference and subsequent amendments to the contract. LBP felt that the consultants could have been at their disposal as well, instead of working exclusively for the DILG. K. Performance of the Borrower and the Executing Agency 38. The overall performance of LBP and the DILG is rated satisfactory, since both executing agencies did their best to complete this complex project. However, the borrower and the DILG had a difficult and strained relationship. The tensions between DILG and LBP affected the outputs. A better working relationship between the two could have ensured full fund utilization and the completion of more subprojects. ADB found several additional limitations. The LBP's program management department failed to assign sufficient staff to manage the project, as agreed to in the loan agreement.25
24 The consortium of consulting firms for components A and B included Norconsult, Sinclair Knight Merz, and Urban
Integrated Consultants, Inc.
LBP’s claim that its lending center staff supported the project is correct, but the actual role of the lending centers was limited to review of loan applications. The PDO of the DILG was supposed to establish a project performance monitoring system (PPMS) for the project. However, on the initiative of the DILG,
25 LBP initially declared that it was not prepared to help prepare SPARs.

9
the PPMS was modified to become a results monitoring and evaluation system, which turned out to be ineffective and did not produce a functioning PPMS. Both LBP and the DILG maintained simple data systems that were difficult to maintain and update. Thus, the project was implemented without an adequate data management system. Had the DILG paid more attention to the operational aspects of subprojects, the reductions in rents of public market stalls, fees in transport terminals, and user fees of water supply systems (see para. 44, below) could have been averted. L. Performance of the Asian Development Bank 39. The performance of ADB was satisfactory. ADB fielded project review missions twice per year, which facilitated the resolution of numerous project issues. The designated ADB project officers actively participated in the PSC and technical meetings. Furthermore, ADB actions (such as loan withdrawal and application approvals, subproject appraisal reports, bid evaluations reports, contract variations orders, and time extensions) occurred without delays. ADB acted as an intermediary between the program management department and the PDO when relations were strained.
III. EVALUATION OF PERFORMANCE A. Relevance 40. By directly supporting the priorities of the Medium Term Philippine Development Plan, 2004–2010, the project remains relevant. The sector loan modality, which represented an important lesson from previous urban infrastructure projects, was relevant because such a modality accommodated the changing demands of the LGUs and enabled the replacement of LGUs that opted for other financing mechanisms. The design of parts A and B was an innovative feature of the project. The synergy of the two parts, as defined in the project design, improved the LGUs' access to urban infrastructure and services and strengthened their capacity to deliver services. The government investment in capacity development through the NDF loan was unprecedented. However, the project's failure to deliver on drainage, flood control, and solid waste management reduced its relevance. B. Effectiveness in Achieving Outcome 41. The 39 subprojects improved the access of services and facilities to residents of the 37 LGUs involved in the project. Of the targeted population coverage of 2 million to 2.3 million, the 39 subprojects covered an estimated 1.67 million people.26
The RRP indicated that of the qualified LGUs, 20% should be 3rd to 6th class LGUs; in reality, 47% were 3rd to 6th class LGUs.
42. Because many short-listed subprojects dropped out, and because fund utilization was lower than expected at 63.8%, the project’s targets set during appraisal were only partially met. Thus, it is rated less effective. C. Efficiency in Achieving Outcome and Outputs 43. Overall, the project was less efficient in achieving its expected outcome and outputs. Financial and economic reevaluation was done only for income-generating subprojects such as 26 Based on National Statistics Office, Census of Population, 2007.

10
public markets, transport terminals, and water supply systems. Reevaluation was not carried out for non-revenue subprojects such as equipment, gymnasiums and sports centers, and municipal halls. These were designed as social projects in the SPARs. The reevaluation of completed revenue-generating subprojects showed that of the 14 reevaluated subprojects, only five remained financially and economically viable, while three were marginal, and the rest had negative results. The high cost of capacity building (e.g., Part B) made the project less efficient in achieving its outputs and outcomes. The impact of two local elections (in 2004 and 2007) caused substantial project delays. 44. The public markets in Alicia, Dumalinao, Guipos, Mati, and Roseller T. Lim and the terminal in Kidapawan registered negative financial internal rates of return (FIRRs). Meanwhile, the Barobo public market and the water supply systems in Alubijid and Naawan had marginal FIRRs. For the economic evaluation, the similar results were derived, as the economic internal rates of return (EIRRs) for the above-mentioned subprojects were either negative or marginal. Recomputed FIRRs and EIRRs were compared with the weighted average cost of capital and the economic opportunity cost of capital. The reduced financial viability of these subprojects is due to the decision by elected officials to adopt tariffs or fees that were much lower than those proposed in the feasibility studies. Other reasons for the reduced financial viability included low occupancy rates in the markets of Dumalinao, Guipos, and Mati and in the transport terminal of Kidapawan City; and the unmet number of household connections for the water supply system of Alubijid. Results of the evaluation are shown in Appendix 12 and summarized in Table 4. Given these results, the project’s performance is rated as less efficient.
Table 4: Results of Financial and Economic Reevaluation
Type of Subproject/Name of LGU
Financial Evaluation (FIRR)
Economic Evaluation (EIRR)
As Appraiseda
After Completionb
As Appraiseda
After Completionb
Water Supply System 1. Naawan, Misamis Oriental 14.1% 6.1% 17.1% 8.8% 2. Impasugong, Bukidnon 23.2% 14.6% 27.1% 17.2% 3. Alubijid, Misamis Oriental 20.9% 5.3% 24.6% 7.5% Public Market 4. Roseller T. Lim, Zamboanga del Norte 12.7% negative 17.5% negative 5. Alicia, Zamboanga Sibugay 11.1% negative 17.9% 4.6% 6. Dumalinao, Zamboanga del Sur 15.7% negative 20.1% negative 7. Guipos, Zamboanga del Sur 14.6% negative 19.8% 2.9% 8. Barobo, Surigao del Sur 13.4% 5.7% 17.5% 7.8% 9. Hagonoy, Davao del Sur 18.1% 8.5% 25.8% 16.1% 10. Makilala, North Cotabato 13.1% 12.8% 25.9% 16.5% 11. Mati, Davao Oriental 14.7% negative 18.7% negative 12. Ozamis City, Misamis Occidental 18.0% 10.9% 22.0% 13.6% Transport Terminal 13. Kidapawan City, North Cotabato 14.0% negative 16.0% 1.4% 14. Panabo City, Davao del Norte 14.4% 13.3% 18.7% 17.3%
EIRR = economic internal rate of return, FIRR = financial internal rate of return. a FIRR and EIRR were based on subproject appraisal report. b FIRR and EIRR were based on updated actual data as of project completion review mission.
D. Preliminary Assessment of Sustainability 45. If data of the FIRR are used as stand-alone criteria, the sustainability of the facilities is questionable. However, the sustainability of the subprojects still seems likely, since LGUs are ready to subsidize shortfalls in subproject revenues from other sources. In August 2010, LBP
11
and the DILG jointly organized workshops on subproject operations and maintenance, and sustainability management. Sustainability measures identified and adopted by the LGUs were:
• Twenty-two LGUs legislated economic enterprise codes and prepared customized operations manuals for the completed markets, terminals, and water supply systems. The documents contain information on the procedures and organizational structures required to operate the facilities, audit the infrastructure, set cost-recovery charges, and institute environmental monitoring plans.
• Twenty-four LGUs established city or municipal economic and enterprise
development offices.
• Thirty-seven LGUs prepared subproject operation and maintenance plans. The documents contain time-bound action plans and summarize commitments related to policy reforms, manpower requirements, and capacity building interventions.
• Thirty-seven LGUs have allocated funds for operations and maintenance of facilities and amortization payments for the subloan. At the outset, it was recognized that most income-generating projects would need to be subsidized for the first three years of operation. Thus far, only a few subprojects have recovered costs partly or in full.
• The project's capacity building components resulted in the sustainable transfer
of knowledge and skills to local governments. Targeted local government staff now have the capability to prepare feasibility studies, review engineering designs, handle procurement, supervise construction, and oversee land use planning, real property, and business tax administration.
• Transfer of technology to DILG regional staff was realized and they now serve
as resource persons for project implementation. The local government resource centers in the DILG regional offices in Mindanao, established under component D, are sustainable.
E. Impact 46. Environmental impacts. The DILG and LBP ensured that all subprojects were carried out in accordance with environmental laws and policies. Each LGU prepared an initial environmental examination for the issuance of a Certificate of Non-Coverage (i.e. an exemption) by DENR. Mitigating measures to negate or minimize negative environmental impacts were incorporated into the feasibility studies. 47. Temporary noise pollution and traffic congestion occurring as a result of project-related construction were mitigated by the Contractor’s Safety Program as per DENR standards. More permanent project impacts were generally positive—reduced traffic congestion in central business districts, employment generation, improved sanitation, and enhanced mobility of goods and services. 48. Economic impacts. Though the project's contributions to poverty reduction and quality-of-life cannot be directly quantified, trading activities were generally enhanced, particularly in

12
areas around the transport terminals and public markets. At project completion, it was estimated that the subprojects generated on an average 2,000–2,500 temporary jobs and 4,000–4,500 permanent jobs. The temporary jobs mainly consisted of workers hired during construction; permanent jobs include stall owners, public transport drivers and operators, ambulant vendors, individuals who establish businesses within or around the new facilities, and LGU employees hired to operate and maintain the facilities. None of the subprojects negatively affected the culture and beliefs of indigenous peoples and/or Mindanao's Muslim population. 49. Gender impacts. Project activities supplied women and men with equal opportunities for employment. It is expected that public markets, transport terminals, and water supply systems benefit women more than men. In the case of public markets, more women work as vendors than men. In the case of transport terminals, the increased movement around urban areas that such facilities bring about also tends to yield more benefits for women, who usually bear primary responsibility for food shopping and delivering goods to market areas. In the case of water supply systems, time is saved in accessing potable water—a task usually undertaken by mother and children. The JFPR project provided additional benefits to women vendors.
IV. OVERALL ASSESSMENT AND RECOMMENDATIONS A. Overall Assessment 50. Referring to the project framework in the RRP, the project achieved target impacts and outcomes and implemented the desired components and outputs. It directly and indirectly improved the quality of life of urban residents of Mindanao, and it supported balanced and equitable regional development. Of a target of 2 million beneficiaries, the project benefited about 1.67 million people (80% of the target) by improving access to municipal services and raising environmental standards. The project's institutional capability interventions enhanced the managerial and technical skills of the LGU staff to plan, implement, and operate the subprojects. Of participating LGUs, 47% were in the third to sixth income class, exceeding the target of 20%. 51. An alternative financing from DOF's Municipal Development Fund Office (MDFO) benefited 16 LGUs, allowing the project to exceed the target number of LGUs benefiting from the project. The likelihood is high that operation and/or maintenance of the completed economic enterprise subprojects (eight water supply systems, three transport terminals, and 12 public markets) will be sustainable. 52. The capacity development activities were satisfactorily implemented, although design modifications occurred after project formulation in some cases. The participating LGUs appreciated the trainings, seminars, workshops, and coaching sessions. The sustainability of the capacity building interventions is high as the skills gained by the participants are relevant for future development activities. 53. Overall, the project is evaluated as partly successful. In summary, it is rated relevant (para. 40), less effective (para. 42), less efficient (para. 43), and likely sustainable (para. 45). B. Lessons 54. Participating LGUs obtained several benefits. The project generated strong interest among LGUs. Most LGUs appreciated the loan terms (particularly the fixed long-term nature of ADB funds) and the assistance and services provided by LBP and the DILG. LGUs also

13
appreciated receiving assistance in modernized governance systems, including assistance in rationalized planning (comprehensive development plans), property tax administration, and revenue enhancement. The assistance was transforming for some LGUs as it allowed them to handle big projects involving loan financing for the first time. The project also increased LGU awareness of urban development priorities and opportunities for future investments. 55. Revenue-earning subprojects were favored. Many of the implemented subprojects —e.g. public markets, public transport terminals, and water supply schemes—are good revenue earners or have the potential to be good revenue earners. These subprojects provide essential economic and environmental benefits that will have long-lasting positive impacts. It is expected that most of these investments will be sustainable and will lead to further related investments to expand infrastructure networks. Notably, public markets and transport terminals were the most popular choices of subprojects, while water supply systems were the third most popular. Sanitation, flood control, and solid waste management subprojects, perceived by LGUs as low revenue earners, were not implemented. This indicates that LGUs fail to understand or appreciate the benefits of improving the local environment, and that incentives (like capital grants from the DILG) have not been effectively used to direct LGU investment choices. Building town or municipal halls or gymnasiums are of questionable relevance compared with water supply, sanitation, and solid waste management. Municipal buildings may not generate large revenues, but data suggest that they can contribute to improved revenue collection since tax payers appreciate improved quality of town halls and demonstrate more aptitude to pay their taxes there. 56. More strategic and participatory planning is desirable. LGU chief executive officers (CEOs) often selected subprojects and made investment decisions on their own rather than on the basis of strategic local development plans. Although the project assisted some LGUs in formulating comprehensive land use plans, it did not succeed in ensuring that such plans are standard tools for investment planning—despite an LBP requirement mandating that LGUs possess annual development plans to qualify for loan approval. The absence of participatory strategic development plans could result in future LGU administrations backtracking on established development priorities and arbitrarily choosing new priorities. Allowing CEOs to choose subprojects creates a risk that cost recovery mechanisms will not be implemented, as political expedience may lead future CEOs to provide services at below-cost levels. 57. Decentralized projects call for a better PPMS. The scattered nature of investments throughout Mindanao created substantial management challenges of reporting and data management. The disparity and decentralized nature of the subprojects should have made it imperative that the project implement a web-based PPMS instead of employing traditional narrative reporting methods. A web-based PPMS would have facilitated management and supervision. It proved advantageous that LBP had offices in many LGUs or in their subregions, and that the DILG had local officers in all LGUs and was thus able to offer hands-on support for subproject implementation, but did little to support central data management. Collaboration between local DILG officers and LBP lending center staff varied. 58. Capital grants are attractive, but should only be given as a reward for good performance. In the first years of the project the DILG offered capital grants for eligible subprojects. These were discontinued in 2005 after the cancellation of the DILG's grant source. After that, many LGUs stopped subproject preparation work because of the (perceived high) costs of ADB loans. The commitment and buy-in of LGUs was weak at times. Many LGUs were more oriented toward grants than the lending facility. It raises the question of whether the mixed grant–loan scheme was a good concept to start with, considering that it tried to compete

14
with operations of the MDFO of DOF. The concept of capital grants, also part of the national government–local government cost sharing policy, might require some reformulation. Ex-post performance-based grants might have been more appropriate than upfront capital grants, which often distorted LGU perceptions of the project as a lending facility. 59. LGUs see banking requirements as too tedious. Despite various introductory workshops, some LGUs kept complaining about the documentation requirements. The assistance of DILG and its consultants has helped ease their concerns, but LGUs reported that at times they felt like they were being forced into compliance with procedures that other official development assistance (ODA) providers (like Japan Bank for International Cooperation) had already relaxed. Both ADB and LBP procedures could have been simplified to better bond LGU customers with the project. 60. The value of capacity development. Although not easily measurable in terms of monetary impacts and outcomes, capacity development support made an important contribution to the project. The investment of $6 million through an NDF loan to the DILG was an unprecedented engagement in favor of LGUs; this amount was augmented with a substantial in-kind operational counterpart contribution by the DILG. However, the true value of the NDF-funded capacity development program can only be assessed in terms of the sustainability of the urban services financed under the project. LGUs reported that without the capacity building they would not have been able to effectively implement the infrastructure investments. Several LGUs stated that cost-free capacity building for their staff was the most attractive aspect of the project—even more attractive than the loans—especially as it prepared their staff to possibly participate in future ODA projects. 61. A single executing agency could have simplified implementation. The RRP and the loan agreement both established an unnecessary overlap of functions between LBP and the DILG. This could have been avoided through a more straightforward and functional separation of roles: LBP to implement Part A, and the DILG to limit its role to Part B. The existence of two executing agencies under the project should have been avoided. C. Recommendations 62. Multiple executing agencies working on the same project should be avoided. Instead of two executing agencies with overlapping functions and roles, projects should appoint a single executing agency overseeing other partners working in clearly defined areas. Similar decentralized projects working in many subproject locations should make the introduction of a web-based PPMS compulsory in order to save on management and supervision costs. 63. Projects should focus on economically relevant regions. Future projects in the Philippines should require LGUs to have economic development plans, comprehensive development plans, and comprehensive land use plans in place as a prerequisite for subproject approval. Projects should establish strategic development planning as the basis for selection and prioritization of subprojects. The choice of subprojects should have an economic and financial rationale. 64. Projects should provide incentives to better LGU performance in project operation through an ex-post approach to capital grants (in case that these are available). This approach should replace the current practice of unconditional up-front capital grants.
15
65. Performance-based allocation of government assistance should take into account whether local governments revert back to full cost recovery of services. This is important since a large number of LGUs have failed to achieve cost recovery. As the government is preparing to introduce new criteria for allocating assistance, it is suggested to track future performance of MBUSSP LGUs regarding MBUSSP-financed water, market, and transport terminal facilities. This shall provide the necessary incentives to achieve higher levels of sustainability. 66. Procedures for subproject appraisal and approvals should be simplified through the use of “project plan” proposals (i.e. concept papers), which are approved on the basis of pre-feasibility studies, as practiced by LBP. These proposals would eliminate the need for LGU to prepare costly and time-consuming full feasibility studies and detailed engineering designs after (conditional) project approval. The costs of feasibility studies and detailed engineering designs should be built into investment loans instead of being left to be funded by LGU budget. 67. Institutional and capacity development components should be included in project design. To the extent possible, these should initially be supported on a grant basis. Capacity development should gradually shift to being demand-based and financed as part of investment projects, through loans or LGU contributions. 68. LGUs appreciate added value of complementary grant projects. The implementation of piggy-back JFPR projects is recommended.

16 Appendix 1
Appendix 2 21
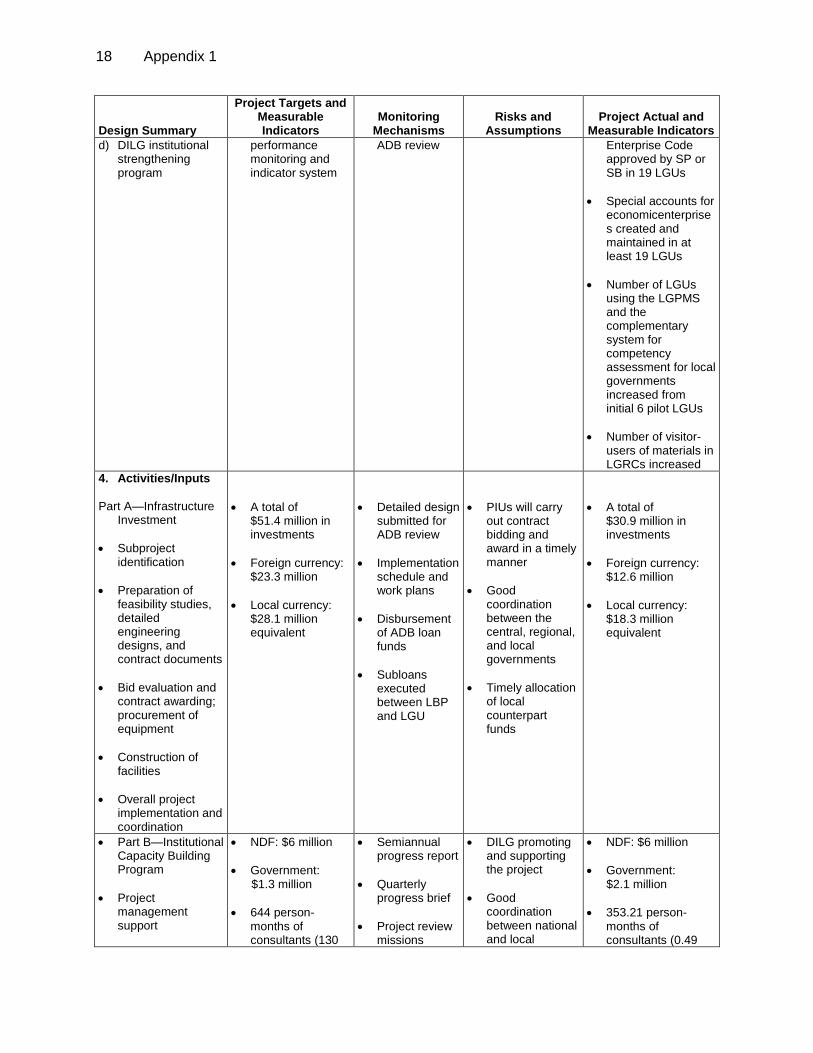
DESIGN and MONITORING FRAMEWORK
Design Summary
Project Targets and Measurable Indicators
Monitoring Mechanisms
Risks and Assumptions
Project Actual and Measurable Indicators
1. Goal • Improve the quality
of life of urban residents in Mindanao
• Support balanced
and equitable regional urban development
• The project will
benefit more than 1 million urban residents by improving access to municipal services and supporting higher environmental standards. About one-third of the beneficiaries are poor residents.
• Socioeconomic
analysis
• Government
commitment to sustain the peace initiative in Mindanao and raise living standards
• Good
coordination and harmony between central, regional, and local governments
• 1.667 million people
(2007, NSO) had improved access to better municipal services and facilities.
• About 48%
(806,894) of the population covered are poor (based on 2006 provincial poverty threshold, NSCB)1
• Out of the 37 LGUs that directly benefited from the 39 subprojects, 18 (47%) were low-income LGUs (3rd to 6th income class)
2. Objective/Purpose • To improve
Mindanao residents’ access to basic urban services through upgrading and rehabilitating infrastructure and improving service delivery
• To increase urban
poor communities’ access to basic municipal services
• To improve the
institutional capacity and capability of LGUs to provide, manage and maintain adequate municipal services and basic urban infrastructure
• Project to directly
benefit the following urban population, by component:
a) Water—250,000
persons b) Drainage and
flood control—120,000 persons
c) Bus Terminals and public markets—550,000 persons
d) Solid Waste Management—280,000 persons
e) Urban roads & bridges—470,000 persons
f) Other public facilities—350,000 persons
• PCR • SPCR from
LGUs • Provincial and
municipal statistics
• PPMS • Project survey
• LGUs committed
to capacity building and institutional development program
• Urban poor
communities’ needs considered in prioritizing investment
• Counterpart
funds available to implement the project
• The project directly
benefited the following urban population, by component:
Total—1,667,230 (73% of planned total coverage) a. Water—51,558
people (21% of target)
b. Drainage and flood control—0
c. Bus terminals and public markets—1,069,452 (194% of target; bus terminals benefited 351,216 and public markets 718,236)
d. Solid Waste Management—0
e. Urban roads and bridges—143,872 (actual population served by LGUs with road
1 The actual coverage of poor residents exceeded the target (333,000) by almost 500,000.

Appendix 1 17
Design Summary
Project Targets and Measurable Indicators
Monitoring Mechanisms
Risks and Assumptions
Project Actual and Measurable Indicators
maintenance equipment; 31% of target)
f. Other public facilities—402,349 (115% of target) consisting of municipal malls and gymnasiums & sports complexes
2. Components/ Outputs
Part A—Infrastructure
Investment • Water Supply
Systems • Drainage and
Flood Control • Bus Terminals • Solid Waste
Management • Urban roads and
bridges • Public markets • Other public
facilities
• Implementation of
about 39 subprojects by 30 to 40 LGUs throughout Mindanao
• Some residents
will benefit from several components, while others may benefit from only one
• PCR • Submittal of
selected subproject appraisals for ADB review
• Review
missions • Midterm
reviews • SPCR from
LGUs • Semi-annual
Report • PPMS • Disbursements
of loan funds • Subloan
approved by LBP
• Good
preparation and appraisal of the subprojects
• LGUs have
adequate capacity to prepare and implement the subprojects
• Project is
implemented as scheduled
• Timely provision
of counterpart funds
• Number of
households with new water connections increased by 13,326 in 8 LGUs with new and expanded water supply systems
• Volume (kg) of
goods entering the public market (as proxy indicator for volume of goods sold) increased in 13 LGUs with new or rehabilitated public markets.
• Number of vehicle-
trips in the central business district increased in 3 LGUs with transport terminal subprojects
Part B—Institutional Capacity Building Program
a) Project
management and implementation support
b) Subproject
preparation and implementation support
c) LGU capacity
building program
• Implementation of institutional capacity building program for about 40 LGUs
• Complete and
update comprehensive land use plans
• Complete strategic financial plans
• Improvement and
refinement of LGU
• Semiannual progress reports
• Quarterly
progress reports
• Project review
missions • PCR • Consulting
services proposal submitted for
• Timely recruitment of consulting services
• Timely
establishment of PDO, PMD, and PIUs
• LGUs remain
committed to mobilizing revenues and improving cost recovery
• CDP approved and legislated by SB in 2 LGUs with draft CDPs
• CDP prepared in
another 10 LGUs • Number of real
property units with updated assessed and appraised values increased in 9 LGUs
• Ordinance on
Economic
18 Appendix 1
Design Summary
Project Targets and Measurable Indicators
Monitoring Mechanisms
Risks and Assumptions
Project Actual and Measurable Indicators
d) DILG institutional strengthening program
performance monitoring and indicator system
ADB review Enterprise Code approved by SP or SB in 19 LGUs
• Special accounts for
economicenterprises created and maintained in at least 19 LGUs
• Number of LGUs
using the LGPMS and the complementary system for competency assessment for local governments increased from initial 6 pilot LGUs
• Number of visitor-
users of materials in LGRCs increased
4. Activities/Inputs Part A—Infrastructure
Investment • Subproject
identification • Preparation of
feasibility studies, detailed engineering designs, and contract documents
• Bid evaluation and
contract awarding; procurement of equipment
• Construction of
facilities • Overall project
implementation and coordination
• A total of
$51.4 million in investments
• Foreign currency:
$23.3 million • Local currency:
$28.1 million equivalent
• Detailed design
submitted for ADB review
• Implementation
schedule and work plans
• Disbursement
of ADB loan funds
• Subloans
executed between LBP and LGU
• PIUs will carry
out contract bidding and award in a timely manner
• Good
coordination between the central, regional, and local governments
• Timely allocation
of local counterpart funds
• A total of
$30.9 million in investments
• Foreign currency:
$12.6 million • Local currency:
$18.3 million equivalent
• Part B—Institutional Capacity Building Program
• Project
management support
• NDF: $6 million • Government: $1.3 million • 644 person-
months of consultants (130
• Semiannual progress report
• Quarterly
progress brief • Project review
missions
• DILG promoting and supporting the project
• Good
coordination between national and local
• NDF: $6 million • Government: $2.1 million • 353.21 person-
months of consultants (0.49
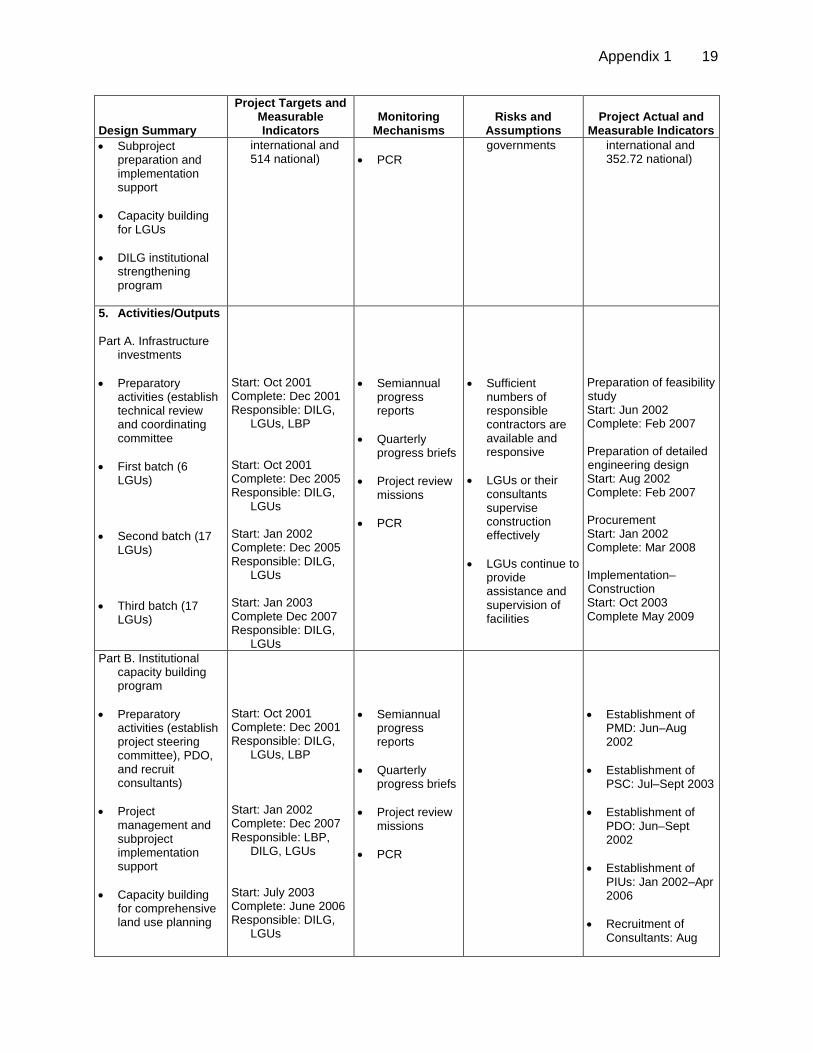
Appendix 1 19
Design Summary
Project Targets and Measurable Indicators
Monitoring Mechanisms
Risks and Assumptions
Project Actual and Measurable Indicators
• Subproject preparation and implementation support
• Capacity building
for LGUs • DILG institutional
strengthening program
international and 514 national)
• PCR
governments international and 352.72 national)
5. Activities/Outputs Part A. Infrastructure
investments • Preparatory
activities (establish technical review and coordinating committee
• First batch (6
LGUs) • Second batch (17
LGUs) • Third batch (17
LGUs)
Start: Oct 2001 Complete: Dec 2001 Responsible: DILG,
LGUs, LBP Start: Oct 2001 Complete: Dec 2005 Responsible: DILG,
LGUs Start: Jan 2002 Complete: Dec 2005 Responsible: DILG,
LGUs Start: Jan 2003 Complete Dec 2007 Responsible: DILG,
LGUs
• Semiannual
progress reports
• Quarterly
progress briefs • Project review
missions • PCR
• Sufficient
numbers of responsible contractors are available and responsive
• LGUs or their
consultants supervise construction effectively
• LGUs continue to
provide assistance and supervision of facilities
Preparation of feasibility study Start: Jun 2002 Complete: Feb 2007 Preparation of detailed engineering design Start: Aug 2002 Complete: Feb 2007 Procurement Start: Jan 2002 Complete: Mar 2008 Implementation– Construction Start: Oct 2003 Complete May 2009
Part B. Institutional capacity building program
• Preparatory
activities (establish project steering committee), PDO, and recruit consultants)
• Project
management and subproject implementation support
• Capacity building
for comprehensive land use planning
Start: Oct 2001 Complete: Dec 2001 Responsible: DILG,
LGUs, LBP Start: Jan 2002 Complete: Dec 2007 Responsible: LBP,
DILG, LGUs Start: July 2003 Complete: June 2006 Responsible: DILG,
LGUs
• Semiannual
progress reports
• Quarterly
progress briefs • Project review
missions • PCR
• Establishment of
PMD: Jun–Aug 2002
• Establishment of
PSC: Jul–Sept 2003 • Establishment of
PDO: Jun–Sept 2002
• Establishment of
PIUs: Jan 2002–Apr 2006
• Recruitment of
Consultants: Aug
20 Appendix 1
Design Summary
Project Targets and Measurable Indicators
Monitoring Mechanisms
Risks and Assumptions
Project Actual and Measurable Indicators
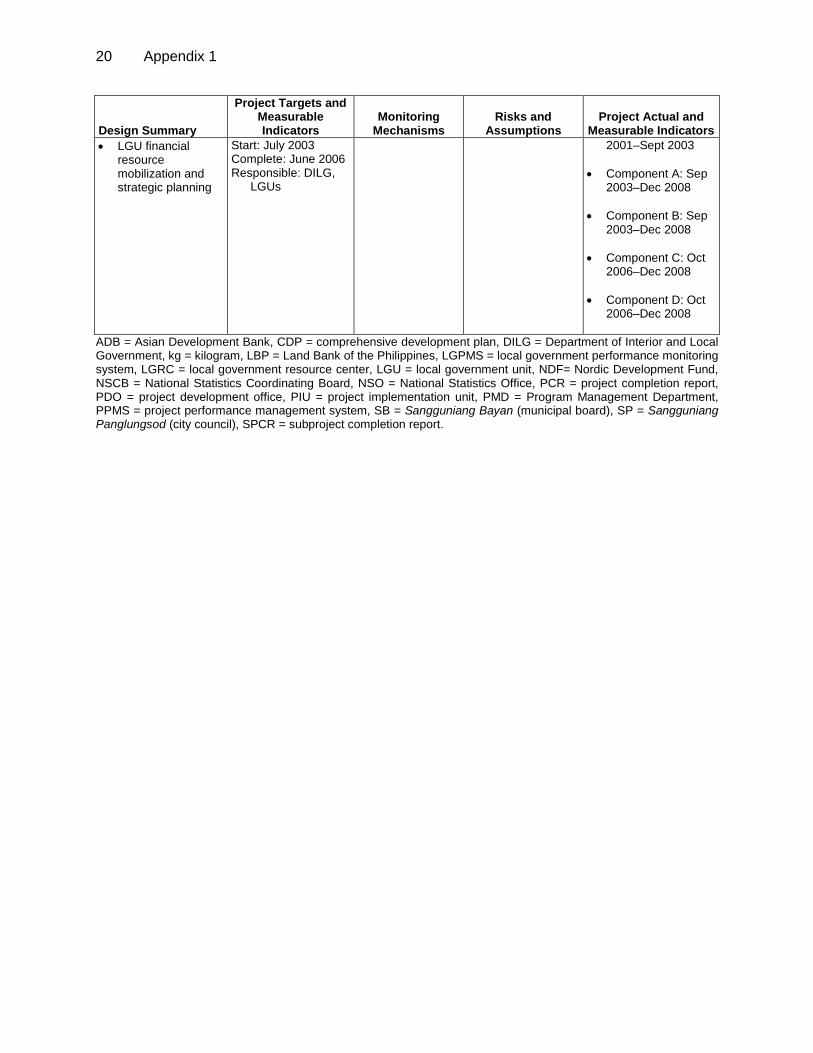
• LGU financial resource mobilization and strategic planning
Start: July 2003 Complete: June 2006 Responsible: DILG,
LGUs
2001–Sept 2003 • Component A: Sep
2003–Dec 2008 • Component B: Sep
2003–Dec 2008 • Component C: Oct
2006–Dec 2008 • Component D: Oct
2006–Dec 2008
ADB = Asian Development Bank, CDP = comprehensive development plan, DILG = Department of Interior and Local Government, kg = kilogram, LBP = Land Bank of the Philippines, LGPMS = local government performance monitoring system, LGRC = local government resource center, LGU = local government unit, NDF= Nordic Development Fund, NSCB = National Statistics Coordinating Board, NSO = National Statistics Office, PCR = project completion report, PDO = project development office, PIU = project implementation unit, PMD = Program Management Department, PPMS = project performance management system, SB = Sangguniang Bayan (municipal board), SP = Sangguniang Panglungsod (city council), SPCR = subproject completion report.

Appendix 2 21
Status of Subprojects for Part A of the Mindanao Basic Urban Services Sector Project
(as of May 2010)
Region LGU/Subproject Income Class
Project Costs
Other Charges DECS
Total Project
Cost Construction
Start Date
Completion/ Delivery
Date ADB
Subloan LBP Loan
DILG Grant
LGU Cash
Equity Project
Cost A. Completed Subprojects 1 ARMM Buluan, Maguindanao Public Market 3rd 24.990 10.010 5.356 40.356 4.077 3.043 47.476 3-Jul-04 10-Oct-05 2 ARMM Datu Odin Sinsuat, Maguindanao Public
Market 2nd 54.000 6.000 60.000 0.947 1.298 62.245 7-Feb-06 15-Dec-06
3 ARMM Datu Paglas, Maguindanao Municipal Hall 4th 16.185 3.457 19.642 0.285 1.760 21.687 27-Feb-07 30-Nov-07 4 IX Roseller T. Lim, Zamboanga Sibugay
Public Market 2nd 9.425 3.775 3.407 0.678 17.285 0.313 2.140 19.738 1-Jun-04 30-Nov-04
5 IX Siocon, Zamboanga del Norte Cultural–Exhibition Center
2nd 21.150 12.850 1.795 0.695 36.490 9.199 45.689 4-Oct-03 16-Dec-04
6 IX Mahayag, Zamboanga del Sur Municipal Hall
2nd 80915 2.678 3.675 0.592 15.860 0.311 1.400 17.582 6-Jan-04 9-Mar-05
7 IX Dumalinao, Zamboanga del Sur Public Market
3rd 9.194 2.762 2.999 14.954 1.913 1.913 18.780 3-Jul-04 2-Jul-05
8 IX Alicia, Zamboanga Sibugay Public Market 3rd 7.342 2.941 2.450 0.216 12.950 0.203 1.380 14.533 1-Apr-05 28-Feb-06 9 IX Tukuran, Zamboanga del Sur Road
Equipment 3rd 5.710 0.634 6.345 0.325 6.670 20-Mar-07
10 IX Guipos, Zamboanga del Sur Public Market
4th 15.294 1.699 16.993 0.425 1.700 19.118 9-Jun-06 8-Jun-07
11 IX Sibuco, Zamboanga del Norte Municipal Gymnasium
5th 24.144 5.822 29.967 2.175 1.500 33.642 10-Mar-06 1-Jul-07
12 X Naawan, Misamis Oriental Water Supply 4th 8.888 3.560 3.163 15.611 0.956 1.119 17.686 6-Aug-04 21-Jun-05 13 X Kapatagan, Lanao del Norte Municipal
Hall 2nd 16.073 4.828 5.000 5.811 31.745 4.090 1.500 37.335 23-Mar-05 28-Jun-06
14 X Lugait, Misamis Oriental Equipment 2nd 4.139 0.460 1.750 6.349 0.028 6.377 29-Mar-07 15 X Jasaan, Misamis Oriental Municipal Hall 2nd 20.430 2.270 0.801 23.501 1.400 24.901 1-Sep-06 30-Aug-07 16 X Impasugong, Bukidnon Water Supply 2nd 21.927 2.573 24.500 0.550 3.994 29.044 25-Jun-07 18-Feb-08 17 X Kolambugan, Lanao del Norte New
Auditorium 4th 14.751 4.649 0.069 18.469 0.519 0.135 20.123 27-Nov-06 30-Mar-08
18 XI Mati, Davao Oriental Public Market 1st 71.415 7.935 79.350 1.462 4.864 85.676 18-Sep-05 19-Nov-06 19 XI Panabo City Transport Terminal 1st 29.520 3.280 5.000 0.448 38.248 0.636 3.129 42.013 19-Mar-06 31-Mar-07

22 Appendix 2
Region LGU/Subproject Income Class
Project Costs
Other Charges DECS
Total Project
Cost Construction
Start Date
Completion/ Delivery
Date ADB
Subloan LBP Loan
DILG Grant
LGU Cash
Equity Project
Cost 20 XI Hagonoy, Davao del Sur Equipment 2nd 12.060 1.340 13.400 0.225 13.625 20-Mar-07 21 XI Hagonoy, Davao del Sur Public Market 2nd 5.074 0.974 6.048 0.364 1.180 7.592 9-Jul-07 9-Jan-08 22 XII Norala, Cotabato Equipment 3rd 3.135 0.942 1.359 5.435 0.051 5.486 22-Dec-03 18-Feb-04 23 XII Isulan, Sultan Kudarat Bus Terminal 2nd 24.639 2.744 27.436 2.782 30.218 16-Jul-05 15-Apr-06 24 XII Kidapawan City Transport Terminal 4th 33.844 13.556 9.218 8.749 65.367 3.397 68.764 23-Oct-05 5-Oct-06 25 XII Makilala, North Cotabato Public Market 1st 19.751 2.195 0.789 22.735 0.624 0.472 23.831 19-Mar-06 31-Mar-07 26 XII Alamada, North Cotabato Water Supply 2nd 28.301 3.145 0.801 32.247 1.400 33.647 18-Jan-07 17-Jan-08 27 XIII San Isidro, Surigao del Norte Municipal
Gymnasium 5th 7.553 2.269 2.329 12.150 0.350 0.300 12.800 9-Mar-05 21-Mar-06
28 XIII Jabonga, Agusan del Norte Municipal Hall 3rd 6.921 2.079 2.929 11.929 0.848 12.777 3-Dec-04 23-Mar-06 29 XIII Cabadbaran, Agusan del Norte Public
Market 2nd 11.700 1.300 13.000 0.098 1.525 14.623 22-Jun-05 3-Apr-06
30 XIII Pilar, Surigao del Norte Municipal Gymnasium
5th 14.800 1.644 16.444 0.900 17.344 21-Oct-06 23-Oct-07
31 XIII Tago, Surigao del Norte Water Supply 3rd 20.700 2.300 0.086 23.086 3.671 26.757 24-Oct-06 15-Jul-08 32 XIII Barobo, Surigao del Sur Public Market 3rd 16.380 1.820 0.078 18.278 0.557 1.446 20.281 15-Jan-07 30-Jan-09 B. Completed Subprojects after Loan Closing 33 X Alubijid, Misamis Oriental Water Supply 4th 14.113 9.119 15.038 38.270 3.303 41.573 18-Dec-09 16-Sep-09 34 X Claveria, Misamis Oriental Water Supply
System 1st 37.733 26.768 7.562 72.062 8.532 80.594 11-Aug-08 1-Mar-10
35 X Ozamis City Public Market 1st 113.783 39.817 12.752 166.352 2.678 8.806 177.836 14-Sep-06 28-May-09 36 X Tangub City Sports Complex 3rd 76.591 18.409 12.927 107.927 21.16 129.083 23-Sep-06 7-Oct-09 C. Ongoing Projects (Delayed) 37 X Jasaan, Misamis Oriental Water Supply 2nd 2.044 24.693 26.737 2.342 29.079 3-Feb-09 D. Suspended Subprojects 38 ARMM Maluso, Basilan Public Market 4th 3.780 24.220 2.369 30.369 3.400 33.769 1-Feb-09 39 ARMM Parang, Maguindanao Water Supply 1st 24.139 48.447 9.370 81.956 18.146 100.102 2-Sep-03 ADB = Asian Development Bank, ARMM = Autonomous Region of Muslim Mindanao, DILG = Department of Interior and Local Government, DECS = Department of Education, Culture and Sports, LBP = Land Bank of the Philippines, LGU = local government unit.

Appendix 3 23
List of Local Government Units and Subprojects Withdrawn from the Mindanao Basic Urban Services Sector Project (Part A)
Region LGU Subproject Reason for Dropping out of Project 1 ARMM Balabagan, Lanao del
Sur Water Supply Change in local leadership, change in project
priorities 2 ARMM Wao, Lanao del Sur Terminal Explored other funding sources 3 ARMM Guidulingan,
Maguindanao Market Limited borrowing capacity; political conflict
(differences between mayor and LGU) 4 ARMM Jolo, Sulu Market Political differences between the acting city
mayor and Sangguniang Panglungsod (city council)
5 ARMM Kapatagan, Lanao del Sur
Market Limited borrowing capacity. The mayor is not certain if the market vendors will pay their market fees.
6 ARMM Lutayan, Maguindanao
Fish Landing Change in local leadership
7 ARMM Marawi City Terminal Change in project priorities 8 ARMM Bongao, Tawi-Tawi Market Limited borrowing capacity 9 9 Dipolog City Diversion Road Problem with ADB requirements on
resettlement and issues related to the road right of way
10 9 Dipolog City Equipment Change in project priorities 11 9 San Miguel,
Zamboanga del Sur Terminal Explored other funding sources within LBP
12 9 Tungawan, Zamboanga Sibugay
Water Supply Technical problem with water source; limited borrowing capacity
13 9 Zamboanga City Terminal Tedious bank requirements, explored other funding sources
14 10 Bonifacio, Misamis Occidental
Equipment/ Water Supply
Change in project priorities; explored other funding sources
15 10 Catarman, Camiguin Market Change in local leadership; tedious bank requirements and lengthy loan processing
16 10 Kapatagan, Lanao del Norte
Market Change in project priorities; explored other funding sources
17 10 Laguindingan, Misamis Oriental
Market Cancellation of national counterpart grant
18 10 Lala, Misamis Oriental Market Cancellation of national counterpart grant 19 10 Libertad, Misamis
Oriental Cancellation of national counterpart grant
20 10 Mahinog, Camiguin Water Supply Explored other funding sources 21 10 Misamis Occidental Equipment Explored other funding sources 22 10 Misamis Occidental Hospital Cancellation of national counterpart grant;
explored other funding sources 23 11 Baganga, Davao
Oriental Market Political conflict (differences between the
mayor and Sangguniang Bayan (municipal board)
24 11 Gov. Generoso, Davao Oriental
Equipment Change in local leadership, tedious loan processing requirements
25 11 Carmen, Davao del Norte
Terminal Explored other funding sources
26 11 Maragusan, Compostela Valley
Market Limited borrowing capacity
27 11 Tagum City City Hall LGU wants to implement the project through
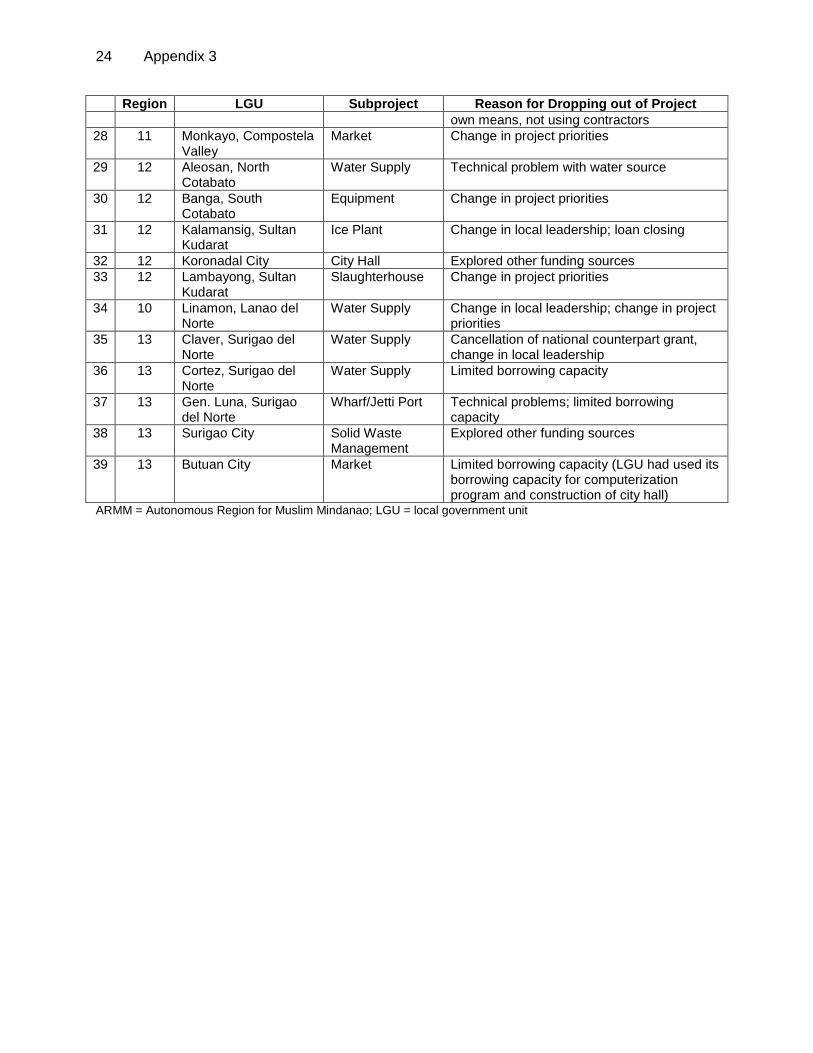
24 Appendix 3
Region LGU Subproject Reason for Dropping out of Project own means, not using contractors
28 11 Monkayo, Compostela Valley
Market Change in project priorities
29 12 Aleosan, North Cotabato
Water Supply Technical problem with water source
30 12 Banga, South Cotabato
Equipment Change in project priorities
31 12 Kalamansig, Sultan Kudarat
Ice Plant Change in local leadership; loan closing
32 12 Koronadal City City Hall Explored other funding sources 33 12 Lambayong, Sultan
Kudarat Slaughterhouse Change in project priorities
34 10 Linamon, Lanao del Norte
Water Supply Change in local leadership; change in project priorities
35 13 Claver, Surigao del Norte
Water Supply Cancellation of national counterpart grant, change in local leadership
36 13 Cortez, Surigao del Norte
Water Supply Limited borrowing capacity
37 13 Gen. Luna, Surigao del Norte
Wharf/Jetti Port Technical problems; limited borrowing capacity
38 13 Surigao City Solid Waste Management
Explored other funding sources
39 13 Butuan City Market Limited borrowing capacity (LGU had used its borrowing capacity for computerization program and construction of city hall)
ARMM = Autonomous Region for Muslim Mindanao; LGU = local government unit
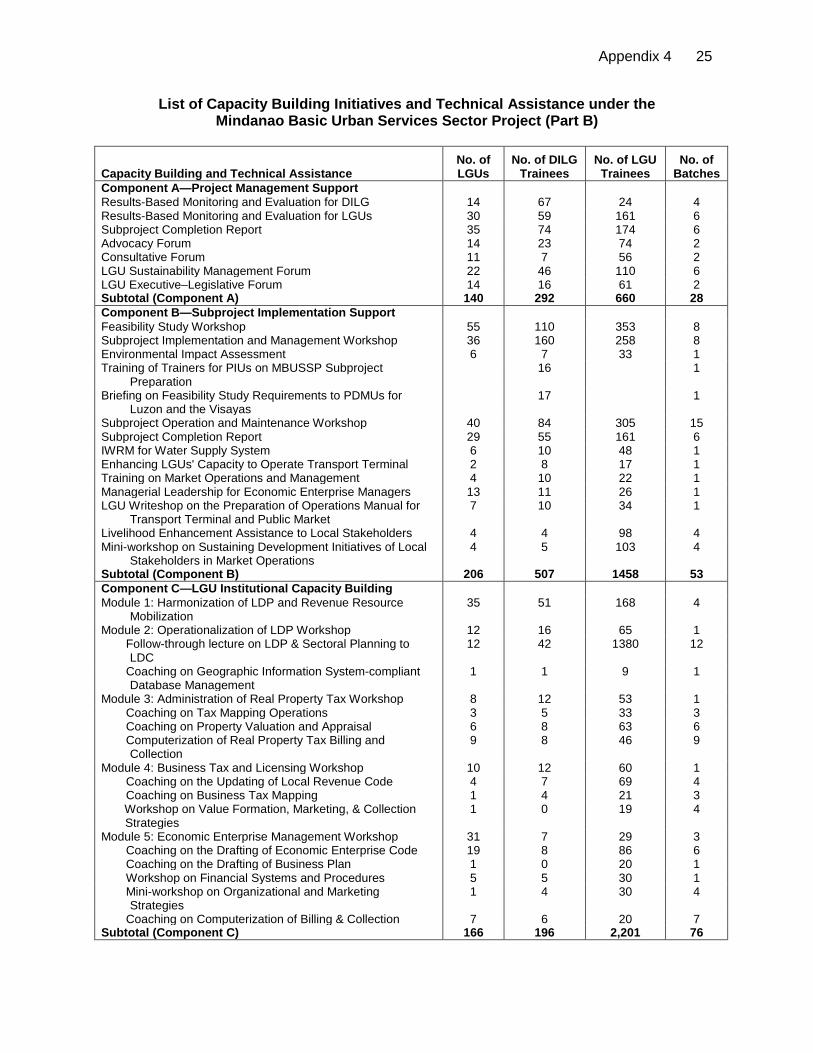
Appendix 4 25
List of Capacity Building Initiatives and Technical Assistance under the Mindanao Basic Urban Services Sector Project (Part B)
Capacity Building and Technical Assistance No. of LGUs
No. of DILG Trainees
No. of LGU Trainees
No. of Batches
Component A—Project Management Support Results-Based Monitoring and Evaluation for DILG 14 67 24 4 Results-Based Monitoring and Evaluation for LGUs 30 59 161 6 Subproject Completion Report 35 74 174 6 Advocacy Forum 14 23 74 2 Consultative Forum 11 7 56 2 LGU Sustainability Management Forum 22 46 110 6 LGU Executive–Legislative Forum 14 16 61 2 Subtotal (Component A) 140 292 660 28 Component B—Subproject Implementation Support Feasibility Study Workshop 55 110 353 8 Subproject Implementation and Management Workshop 36 160 258 8 Environmental Impact Assessment 6 7 33 1 Training of Trainers for PIUs on MBUSSP Subproject
Preparation 16 1
Briefing on Feasibility Study Requirements to PDMUs for Luzon and the Visayas
17 1
Subproject Operation and Maintenance Workshop 40 84 305 15 Subproject Completion Report 29 55 161 6 IWRM for Water Supply System 6 10 48 1 Enhancing LGUs' Capacity to Operate Transport Terminal 2 8 17 1 Training on Market Operations and Management 4 10 22 1 Managerial Leadership for Economic Enterprise Managers 13 11 26 1 LGU Writeshop on the Preparation of Operations Manual for
Transport Terminal and Public Market 7 10 34 1
Livelihood Enhancement Assistance to Local Stakeholders 4 4 98 4 Mini-workshop on Sustaining Development Initiatives of Local
Stakeholders in Market Operations 4 5 103 4
Subtotal (Component B) 206 507 1458 53 Component C—LGU Institutional Capacity Building Module 1: Harmonization of LDP and Revenue Resource
Mobilization 35 51 168 4
Module 2: Operationalization of LDP Workshop 12 16 65 1 Follow-through lecture on LDP & Sectoral Planning to
LDC 12 42 1380 12
Coaching on Geographic Information System-compliant Database Management
1 1 9 1
Module 3: Administration of Real Property Tax Workshop 8 12 53 1 Coaching on Tax Mapping Operations 3 5 33 3 Coaching on Property Valuation and Appraisal 6 8 63 6 Computerization of Real Property Tax Billing and
Collection 9 8 46 9
Module 4: Business Tax and Licensing Workshop 10 12 60 1 Coaching on the Updating of Local Revenue Code 4 7 69 4 Coaching on Business Tax Mapping 1 4 21 3 Workshop on Value Formation, Marketing, & Collection
Strategies 1 0 19 4
Module 5: Economic Enterprise Management Workshop 31 7 29 3 Coaching on the Drafting of Economic Enterprise Code 19 8 86 6 Coaching on the Drafting of Business Plan 1 0 20 1 Workshop on Financial Systems and Procedures 5 5 30 1 Mini-workshop on Organizational and Marketing
Strategies 1 4 30 4
Coaching on Computerization of Billing & Collection 7 6 20 7 Subtotal (Component C) 166 196 2,201 76

26 Appendix 4
Capacity Building and Technical Assistance No. of LGUs
No. of DILG Trainees
No. of LGU Trainees
No. of Batches
Component D—DILG Institutional Strengthening Regional Scoping Sessions for 6 Regions 60 Module1: Administration of LGPMS–SCALOG 6 18 18 Coaching on SCALOG—focus group discussions for DILG
Regional Offices 6 157
Workshop on the LGPMS–SCALOG Complementation Process
12
LGPMS–SCALOG Midterm Assessment 6 50 Module 2: Cross-Learning and Exposure Program Domestic Cross-Learning and Exposure Program 10 International Cross-Learning and Exposure Program 12 Module 3: Establishment of the LGRCs Knowledge Management & LGRC 30 Regional Knowledge Management/LGRC Sharing
Sessions 90
Regional Knowledge Management Audit 30 Presentation of Results of the Regional Knowledge
Management Audit 60
Preparation of the LGRC Launching Activities 60 MSAC Orientation 60 Regional Strategic Plan 30 Component D: Module 3 Regional Assessment 30 Formulation of the LGRC Manual of Operations 150 Finalization of the Customized LGRC Manual of
Operations 30
MSAC Reorientation and Strengthening 90 LGRC Assessment and Road-Mapping 53 Appreciation of ICT and Introduction to Internet
Technology 60
Website Development Using HTML 60 Website Design and Layout using Adobe Photoshop 60 Website Development Tools Using Dreamweaver 60 Databanking and Datapopulation 36 LGRC Database Management and Administration 36 Basic System and Local Area Network 15 Orientation and Appreciation Using Content Management
System 75
Web Development Using Content Management System 75 ICT on LGRC Towards Sustainability 60 Communication Strategies for LGPMS–SCALOG 6 45 Identification, Selection, & Documentation of LGU Best
Practices 0 18
Canned Audio Visual Documentation, Editing, and Packaging
6 24
Validation of LGU Best Practices for Documentation 12 12 Preparation of Governance and Social Marketing Plan 0 12 Preparation of Key Messages & Sample IEC Materials for
LGRC 0 36
Generation Analysis of Regional LGPMS Reports 6 Complementation of LGPMS–SCALOG 4 30 Subtotal 46 1,356 414 T O T A L 558 2,351 4,733 157
DILG = Department of Interior and Local Government; ICT = information and communication technology; IEC = information, education, and communication; IWRM = Integrated Water Resource Management; LDC = local development committee; LDP = local development plan; LGPMS = local government performance monitoring system; LGRC = local government resource center; LGU = local government unit; MBUSSP = Mindanao Basic Urban Services Sector Project; MSAC = management services advisory committee; PDMU = project development management unit; SCALOG = system for competency assessment for local governments

Appendix 5 27
Project Cost by Component ($ million)
Appraisal Estimates Actual Foreign Local Total Foreign Local Total Part A Civil Works 19.3 20.5 39.8 12.2 15.4 27.5 Equipment 3.2 0.9 4.1 0.4 0.3 0.7 Land Acquisition 3.4 3.4 Design & Supervision 0.8 3.3 4.1 2.7 2.7 Subtotal 23.3 28.1 51.4 12.6 18.3 30.9 Part B Components A & B 1.2 1.6 2.8 1.7 2.8 4.5 Components C & D 1.8 2.7 4.5 1.5 1.5 Project Development Office Operations 2.1 2.1 Subtotal 3.0 4.3 7.3 1.7 6.4 8.1 Interest During Construction 1.3 1.3 1.3 1.3 TOTAL 27.6 32.4 60.0 15.6 24.6 40.2
Project Cost by Financing Plan
($ million)
Appraisal Estimates Actual Foreign Local Total Foreign Local Total Part A Asian Development Bank 23.3 5.4 28.7 12.6 5.8 18.2 Government 6.0 6.0 1.1 1.1 Local Government Units 7.3 7.3 4.9 4.9 Land Bank of the Philippines 9.4 9.4 6.6 6.6 Subtotal 23.3 28.1 51.4 12.6 18.3 30.9 Part B Nordic Development Fund 3.0 3.0 6.0 1.7 4.3 6.0 Government 1.3 1.3 2.1 2.1 Subtotal 3.0 4.3 7.3 1.7 6.4 8.1 Interest During Construction 1.3 1.3 1.3 1.3 TOTAL 27.6 32.4 60.0 15.6 24.6 40.2
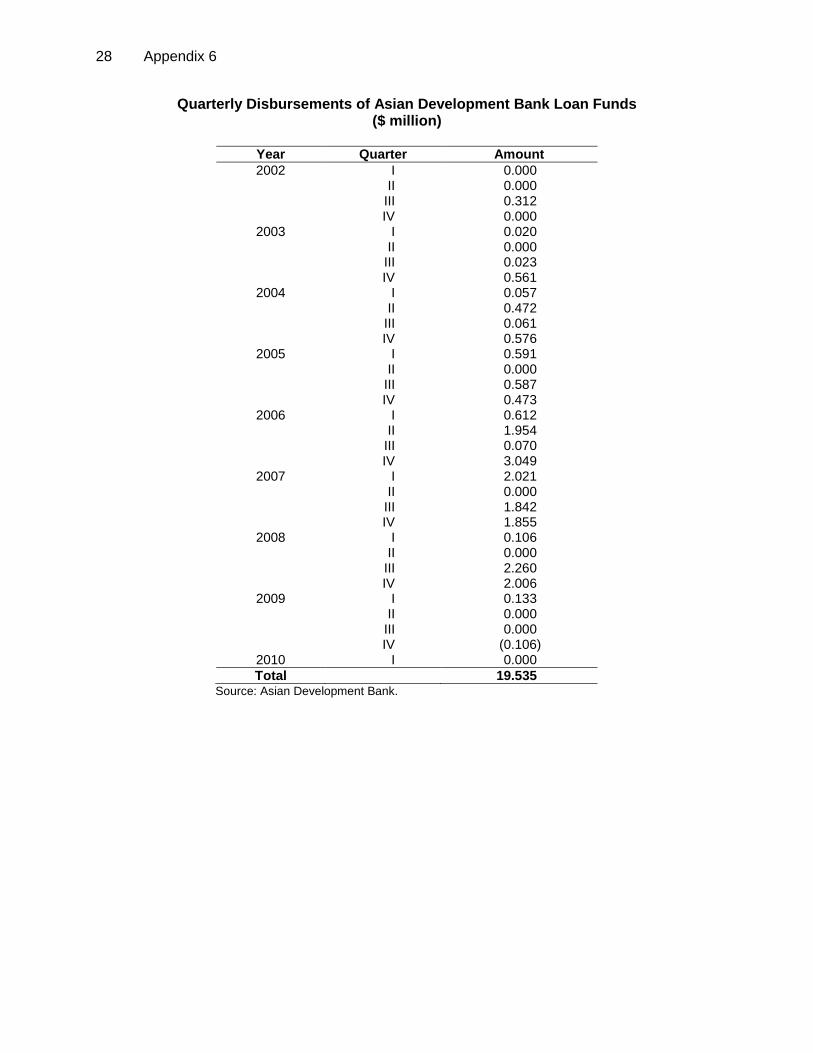
28 Appendix 6
Quarterly Disbursements of Asian Development Bank Loan Funds ($ million)
Year Quarter Amount 2002 I 0.000
II 0.000 III 0.312 IV 0.000
2003 I 0.020 II 0.000 III 0.023 IV 0.561
2004 I 0.057 II 0.472 III 0.061 IV 0.576
2005 I 0.591 II 0.000 III 0.587 IV 0.473
2006 I 0.612 II 1.954 III 0.070 IV 3.049
2007 I 2.021 II 0.000 III 1.842 IV 1.855
2008 I 0.106 II 0.000 III 2.260 IV 2.006
2009 I 0.133 II 0.000 III 0.000 IV (0.106)
2010 I 0.000 Total 19.535
Source: Asian Development Bank.

Appendix 7 29
Timeline Chart of Subproject Processing and Implementation (Based on Actual Data)
Code Activities Duration
(days) A LGU submits letter of intent before subproject agreement signing 145 B Feasibility Study preparation by LGU and submission to DILG PDO 100 C SPAR preparation by DILG PDO and submission to LBP 7 D SPAR endorsement by LBP and approval by ADB 15 E Hiring of national consultants for detailed engineering design and construction
supervision 124
F Detailed engineering design preparation by LGU and consultant, and submission to PDO
108
G LGU preparation of bid documents and submission to PDO. PDO reviews bid documents and submits to ADB for approval
21
H Loan application and detailed engineering design submission to LBP with other documents
62
I Loan application processing and approval by LBP 45 J Prequalification documents preparation and submission to ADB 14 K Prequalification publication and submission of prequalified documents 30 L Review and submission of prequalification results by LGU to PDO 18 M PDO reviews and recommends prequalification results to ADB 10 N ADB reviews and approves prequalification results 8 O Issuance of bid documents by LGUs and submission of prequalified firms 30 P Supplier’s submission of bid evaluated by LGU bids and awards committees and
technical working groups, and submission to PDO 12
Q PDO reviews and recommends to ADB the bid evaluation report 7 R ADB reviews and approves bid evaluation report 12 S Issuance of notice of loan approval and loan signing 5 T LGU issuance of notice of award, contract signing, and issuance of notice to
proceed 22
U LGU requests 15% mobilization fee from PDO and PDO endorses to LBP for the initial loan release
5
V Processing and release of 15% mobilization fee 42 W Actual subproject construction X Processing and release of succeeding progress billings 6
ADB = Asian Development Bank, LBP = Land Bank of the Philippines, LGU = local government unit, PDO = project development office, SPAR = subproject appraisal report.
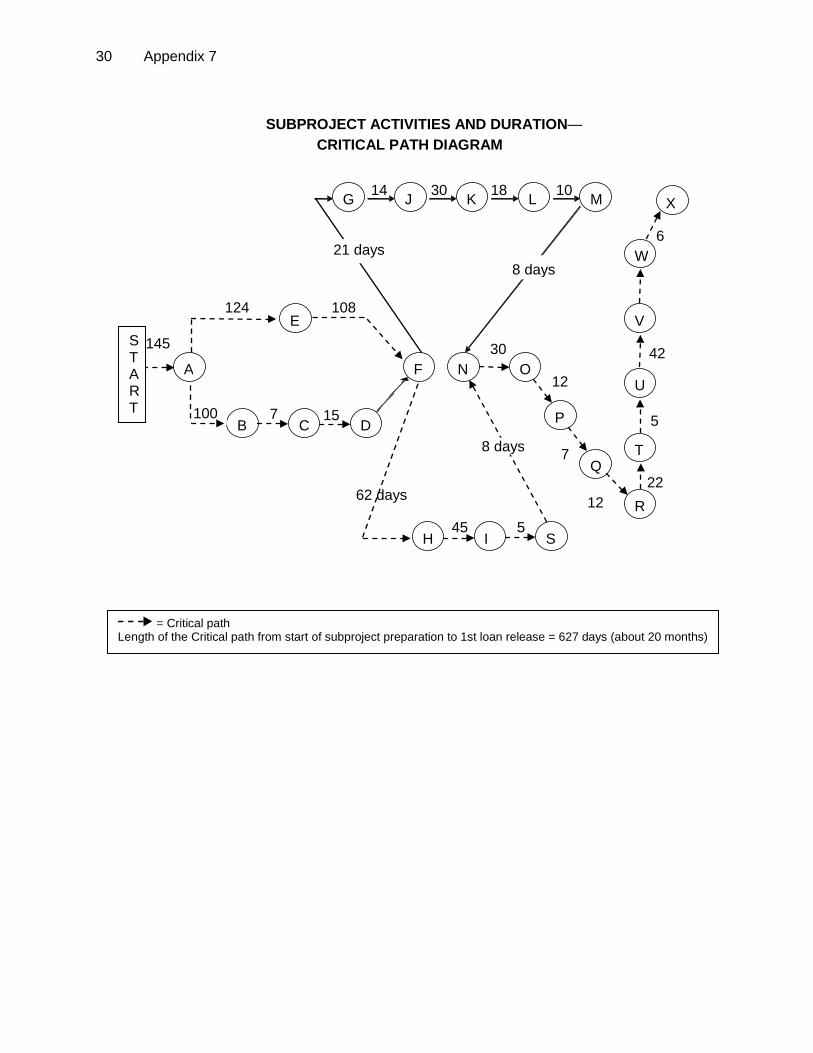
30 Appendix 7
A
145 E
B C D
G
F
H
J
I
124
15 7
K
S
L
T
R
Q
P
O N
M
108
21 days
62 days
45 5
14 30 18 10
8 days
U
V
W
X
30
12
7
12 22
5
42
6
SUBPROJECT ACTIVITIES AND DURATION— CRITICAL PATH DIAGRAM
START
8 days
100
= Critical path Length of the Critical path from start of subproject preparation to 1st loan release = 627 days (about 20 months)

Appendix 8 31
IMPLEMENTATION SCHEDULE
CLUP = comprehensive land use planning, DILG = Department of Interior and Local Government, LGU = local government unit, PDO = project development office; PIU = project implementing unit, PMD = project management department, PSC = project steering committee, TRCC = technical review and coordinating committee.

32 Appendix 9
Organizational Structure
ADB = Asian Development Bank, DILG = Department of Interior and Local Government, LBP = Land Bank of the Philippines, NDF = Nordic Development Fund

Appendix 10 33
STATUS OF COMPLIANCE WITH LOAN CONDITIONS AND COVENANTS
Covenant Reference in
Loan Agreement Status of Compliance Financial 1 LGU shall maintain separate project
accounts and records to document the source and expenditure of funds for goods and services under the Project.
Schedule 4, para. 17
Complied with for all 39 completed subprojects. The LGUs submitted statements of receipts and disbursements and annual statements of sources and application of funds.
2 Ensure that all necessary counterpart funds for project implementation are provided in a timely manner.
Schedule 4, para. 18
Partly complied with. DILG grants for 12 subprojects were fully disbursed. However, when the government introduced its "no-grant policy" in 2005, the government stopped providing grant assistance to the LGUs. All of the 38 LGUs provided the required amount of counterpart funds for the detailed engineering design, construction supervision, land acquisition, and administration costs.
Environmental 3 Detailed and summary environmental
impact assessment report or an initial environment examination will be prepared for subprojects as applicable.
Schedule 4, para. 22
Complied with. No subproject required an environmental impact assessment report
4 Disbursements for subloan agreements will be subject to obtaining environmental compliance certificate from the Government and clearance from ADB.
Schedule 4, para. 22
Complied with. Certificates of Non-Coverage, i.e. exemption to obtain environmental compliance certificates, for 39 subprojects were issued by the Department of Environment and Natural Resources before the release of the subloans.
Social 5 Qualified LGU shall consult with
community leaders and involve community based organizations and informal groups, including representatives from poor communities.
Schedule 4, para. 21
Complied with. Focus group discussions and interviews with key community association members were undertaken with the help of project consultants.
6 Public information and education campaign shall be developed to publicize the investment program by the Qualified LGUs and to encourage the participation of community based organizations and informal groups.
Schedule 4, para. 21
Complied with. Public information campaign was carried out through a quarterly project newsletter (Dateline MBUSSP), presentations to the LGUs were held, and a website was set up.
7 IPDP acceptable to ADB must be prepared for subprojects that have adverse and significant effect on ethnic minority or indigenous people.
Schedule 4, para. 21
Complied with. No subproject required an IPDP.
Resettlement and Land Acquisition 8 Qualified LGUs (i) shall prepare and
submit a resettlement plan; (ii) shall conduct a community awareness program for affected people in relation to land and house acquisition, resettlement, compensation levels and assistance with displacement; and (iii) shall be responsible for timely acquisition or availability of land or
Schedule 4, para. 20
Not applicable. No subproject required a resettlement plan. One subproject in Dipolog City had resettlement issues, but it was withdrawn by the LGU.

34 Appendix 10
Covenant Reference in
Loan Agreement Status of Compliance rights-of-way.
9 PDO Consultant shall monitor and report to ADB on land acquisition, resettlement and socioeconomic rehabilitation.
Schedule 4, para. 20
Not applicable. No resettlement activity was required since the subprojects were generally constructed on vacant public land.
Others 10 LBP to maintain PMD and DILG to
maintain PDO. Schedule 4,
paras. 3 and 5 Partly complied with. The PMD and PDO were established, but the PMD was not adequately staffed to conduct appraisal of subprojects.
11 Part A: Consultant for DED and construction supervision of subprojects.
Schedule 3 Amended and complied with. As per amendment on 15 September 2003, LGUs may carry out DED and construction supervision using their own personnel for subprojects that cost less than $500,000 equivalent. The cost of local consultants was included as part of the LGU contribution to total subproject cost.
12 Implement a PPMS for each completed subproject.
Schedule 4, para. 19
Amended and complied with. A results-based monitoring and evaluation system was adopted, which also tracked PPMS information. Results-based monitoring and evaluation system was introduced in the 39 completed subprojects.
13 PMD to Prepare SPAR
Schedule 4, para. 11
Amended and complied with. As agreed, the PDO prepared the SPARs, while the PMD conducted financial appraisal and approval of the SPARs.
14 Part B: Consultant for institutional capacity building.
Schedule 3, para. 3 and Schedule 4,
para. 14
Complied with. Norconsult, Sinclair Knight Merz, and Urban Integrated Consultants, Inc., the consortium of consulting firms for components A and B, was mobilized in August 2003. Consultants for components C and D were not recruited separately; the contract of Norconsult was amended in August 2005 to include components C and D
15 Create PSC and TRCC.
Schedule 4, paras. 1 and 2
Complied with. The PSC met biannually, the TRCC met quarterly, and an additional technical coordination group was created to ensure monthly coordination between the executing agencies. PSC meetings were held in June 2004; January 2005; September 2005; and on September 2006. Technical coordination group meetings usually comprised representatives of PDO regional offices and LBP lending centers; the PDO met more frequently.
ADB = Asian Development Bank, DED = detailed engineering design, DILG = Department of Interior and Local Government, IPDP = indigenous people development plan, LGU = local government unit, PDO = project development office, PMD = project management department, MBUSSP = Mindanao Basic Urban Services Sector Project, PPMS = project performance monitoring system, PSC = project steering committee, SPAR = subproject appraisal report, TRCC = technical review and coordinating committee.

Appendix 11 35
Project Profile: Social Protection for Poor Women Vendors in Mindanao 1. The Asian Development Bank (ADB), through the Japan Fund for Poverty Reduction (JFPR), provided a parallel $1 million grant for Social Protection for Poor Women Vendors in Mindanao1
. The grant was a 3-year gender-related poverty reduction initiative for poor women vendors that was pilot tested in eight cities and municipalities distributed among all six administrative regions of Mindanao. The local government units (LGUs) of the eight cities and municipalities were all participating in the Mindanao Basic Urban Services Sector Project (MBUSSP). These were the cities of Kidapawan, Ozamis, Panabo, and Surigao; and the municipalities of Buluan, Maguindanao; Cabadbaran, Agusan del Norte; Mahayag, Zamboanga del Sur; and Parang, Maguindanao. About 1,800 women vendors benefited from the grant.
Project Goal and Objectives 2. The goal of the grant was to reduce gender-related poverty among poor women vendors in selected public markets in Mindanao by: Providing sustainable gender-sensitive social safety nets for the poor women vendors; Improving the quality of the working environment of the poor women vendors; and Establishing a framework for gender-sensitive urban services through public markets.
Project Components 3. The grant had four components:
• Component 1: Social Safety Nets for the Women Vendors included the following activities: (i) establishing training center facilities with audio-visual equipment; (ii) institutional building and livelihood training for the market vendors; (iii) networking with microcredit institutions; (iv) conferences, workshops, and meetings; (v) procuring equipment and office supplies; and (vi) hiring implementation coordinators.
Component 2: Improvement of the Working Environment included the following
activities: (i) establishing day-care/drop-in centers for vendors' children; (ii) establishing storage and washing facilities; (iii) procuring equipment and supplies; and (iv) hiring child-care facilitators.
Component 3: Framework for Gender Urban Services included the following activities: (i) documenting best practices; and (ii) disseminating information.
Component 4: Project Management included support for the executing agency and a poverty impact assessment.
Implementation Arrangements 4. The Department of Interior and Local Government (DILG) designated its MBUSSP team to oversee the JFPR grant and recruited the Notre Dame Foundation for Charitable Activities Inc–Women in Enterprise Development to be the implementing agency. The DILG organized a grant project steering committee (PSC) comprising the DILG secretary and representatives of 1 ADB. 2002. Proposed Grant Assistance to the Philippines for the Social Protection of Poor Women Vendors in
Mindanao. Manila.

36 Appendix 11
the National Economic and Development Authority, the Department of Health, the Department of Social Welfare and Development, the National Anti-Poverty Commission, the National Council on the Role of Filipino Women, and the Notre Dame foundation.
5. Each LGU organized a local PSC composed of the mayor and representatives of the Philippine National Police, the Department of Education, the DILG, and city or municipal social welfare and development offices, health offices, planning and development offices, engineering offices, Sangguniang Bayan (municipal board), etc.
6. The project implementation units were the market vendors' associations. Outputs and Results 7. Organization of the women vendors. The market vendors' associations established their own organization and management structures, formulated constitutional by-laws, and enhanced their financial management systems. The associations were registered with the Security and Exchange Commission and local agencies. Of the 3,942 vendors, 2,118, or 56.33%, are members of these associations. 8. Institutional capacity building and livelihood skills development training. Fourteen institutional workshops on leadership and management were conducted to enhance the capabilities of the associations. Participants gained self-confidence and became active members of their communities. More than 300 training events of varying length were offered in entrepreneurial skills, personal development and growth, environmental protection, hygiene and nutrition, maternal and child care, and legal rights. The workshops and multi-day seminars were attended by about 1,800 women vendors. 9. Construction and operation of women’s resource centers. Each women's resource center (WRC) included a training resource center, a medical clinic, a day-care center, cold storage and washing facilities, and an administration office complete with office furniture and equipment. Achievements of Objectives 10. Overall, the grant was rated successful. 2
The grant achieved its objectives with the following results:
11. Impact on vendors' income and assets. There was a reported increase in income among the vendors, particularly those who were able to access credit assistance initiated by the market vendors' associations. Others were able to generate new employment opportunities.3
2 ADB, Philippines: Social Protection for Poor Women Vendors in Mindanao Cities, Implementation Completion
Memorandum, June 2008, page 9.
In addition, the status of women who were involved in the vendors' associations improved.
3 Women vendors of the Mega Market of Kidapawan Multi-purpose Cooperative are now engaged in corn husk making, products of which are now sold in neighboring towns and even exported abroad. An increase in physical asset is evident among the members of the Panabo Federation of Public Market Vendors, Inc. Through that association's effective networking with UN-HABITAT, 180 members were awarded with low-cost housing. The Bayanihan Saving’s Fund initiated by the vendors' association in Panabo is another indicator of success. In Mahayag, Ozamis City, Panabo City, Kidapawan City, and Surigao City, association members contributed to a savings fund that is used for loans to cover family or domestic emergencies.

Appendix 11 37
12. Female members were reported to have gained access to credit facilities.4
13. Widening of women's social networks. One significant impact was the creation of opportunities for women to meet regularly, build solidarity, share ideas, interface with local officials, travel to other sites, and learn from and talk with other women. The various leadership training, team building exercises, exposure trips have encouraged and motivated them to express themselves. Beneficial psychological and social effects have been observed, as women in the program gained confidence and developed an improved sense of self worth and self-esteem. 14. Community impacts. The grant gave rise to women’s groups that assumed leadership in diverse community activities, thereby strengthening communities.5
15. Impacts on LGUs. The grant strengthened the LGUs’ commitment to women vendor projects. The Department of Social Welfare and Development, through its self-employment assistance–Kaunlaran (progress) program, expanded its services to include helping women vendors gain access to credit. Since the completion of the WRCs, the LGUs have continued to provide counterpart funds for operation of WRCs. Major Lessons Learned 16. The JFPR Implementation Completion Memorandum (June 2008) 6
• Establish local project steering committees for grants that are implemented at the local level. This applies particularly to countries that have undergone significant administrative decentralization. A national or regional steering committee will be too far removed from the local situation.
identified the following five major lessons:
• Procure appropriate equipment. Some of the WRC equipment procured was too complex.
• Tailor the resource centers’ design to each LGU. A one-size-fits-all approach to the WRCs did not work. For example, it did not take into consideration that the Buluan resource center is steps from the Rural Health Unit, obviating the need for a clinic. A menu approach might have been more successful, borrowing from the community-driven development approach.
• Hire independent auditors early and often. There were issues of funds misuse in the implementation of this grant that may have been detected earlier had the auditors been hired sooner.
• Replicate successful WRC initiatives. The Kidapawan City WRC program for market children is one example.
4 The acquisition of housing by women vendors in Panabo City has definitely increased their status as conjugal
owners of property. This has contributed to enhanced quality of life, security of tenure status and improved self-confidence. The women vendors have shown strong participation in local governance activities. For example, the Mahayag Women Market Vendors Association Inc. was recently given an award as the “Best Women’s Organization in Region 9.” They are now active partners of the local government.
5 For example, in Parang, a Muslim community where the leadership is traditionally male, the grant offered women a rare opportunity to lead the vendors' association.
6 ADB. 2008. JFPR 9018-PHI: Social Protection for Poor Women Vendors in Mindanao – Implementation Completion Memorandum. Manila.

38 Appendix 12
ECONOMIC AND FINANCIAL REEVALUATION
A. Financial Analysis
1. At appraisal, financial evaluation of all revenue-generating subprojects1
2. For the purpose of the reevaluation, subproject cash flows were prepared by the project completion review mission based on actual revenues and expenses. These data were gathered from the local government units (LGUs). However, since in most cases LGUs did not maintain separate accounts for subproject financial operations, realistic approximations were worked out with the local staff.
was undertaken and documented in a subproject appraisal report. After subproject completion, the project implementation units again reevaluated all revenue-generating subprojects. A validation of these appraisal reports was carried out by the project completion report mission for selected subprojects during the project completion review mission.
2
1. Financial Costs
3. Investment costs related to construction of facilities under the subproject included costs incurred for civil works, equipment, detailed engineering design, construction supervision, and land acquisition. Following Asian Development Bank (ADB) procedures, the year of project completion is taken as the starting point for ex-post financial analysis.3
4. Actual operational costs such as personnel services and maintenance and other operating expenses are also included as financial costs.
All local and foreign costs are expressed in constant 2010 prices using a domestic deflator for domestic costs and a dollar deflator for costs expressed in foreign exchange.
2. Financial Revenues
5. For water supply subprojects, the number of connections and the volume of water sold were validated by the LGUs. These were correlated with water tariffs and collection efficiency rates to calculate the revenue derived from water usage. Other income is derived from connection fees, penalty charge payments, and reconnection fees.
6. For public market subprojects, the number of stalls, rentable area, and occupancy rates were confirmed by the LGU. These were correlated with stall rental rates and the collection efficiency rates to calculate the revenue derived from stall rentals. Other income is derived from one-time occupancy fees, fees for entrance of goods (i.e. fees paid for good brought into the public market), cash tickets for transient vendors, parking fees, public toilet fees, and fines and penalties.
7. For transport terminal subprojects, the number of vehicles (buses and utility vehicles) entering the terminal—broken down according to vehicle type (buses, vans, jeepneys, tricyles, and others)—trip frequencies, and terminal usage fees were taken into account in determining revenues. For the Panabo and Kidapawan transport terminal subprojects, stall rentals inside the
1 Revenue-generating subprojects included eight water supply systems, 12 public markets, and three transport
terminals. 2 Of the LGUs visited during the project completion review mission, the following LGUs presented financial
statements (separate from the General Fund) for their subprojects: Alubijid water supply system, Makilala public market, and Panabo transport terminal.
3 ADB. 2006. Guidelines for Preparing Performance Evaluation Reports for Public Sector Operations. Manila.
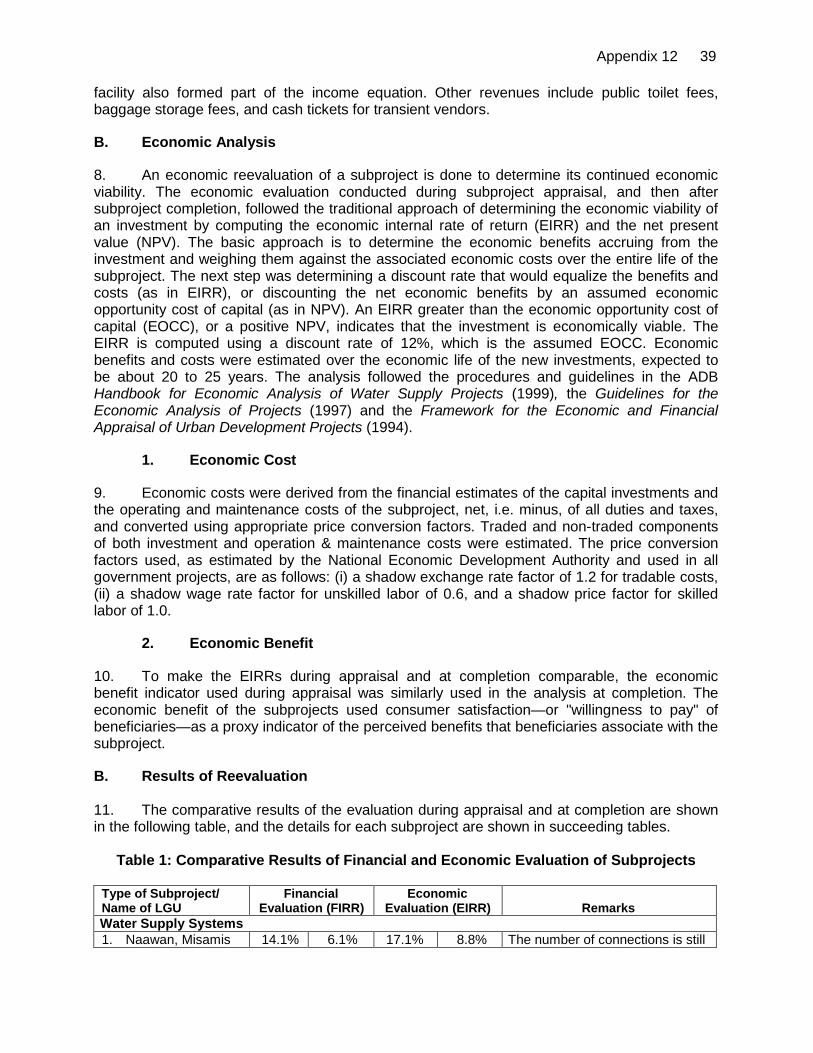
Appendix 12 39
facility also formed part of the income equation. Other revenues include public toilet fees, baggage storage fees, and cash tickets for transient vendors.
B. Economic Analysis
8. An economic reevaluation of a subproject is done to determine its continued economic viability. The economic evaluation conducted during subproject appraisal, and then after subproject completion, followed the traditional approach of determining the economic viability of an investment by computing the economic internal rate of return (EIRR) and the net present value (NPV). The basic approach is to determine the economic benefits accruing from the investment and weighing them against the associated economic costs over the entire life of the subproject. The next step was determining a discount rate that would equalize the benefits and costs (as in EIRR), or discounting the net economic benefits by an assumed economic opportunity cost of capital (as in NPV). An EIRR greater than the economic opportunity cost of capital (EOCC), or a positive NPV, indicates that the investment is economically viable. The EIRR is computed using a discount rate of 12%, which is the assumed EOCC. Economic benefits and costs were estimated over the economic life of the new investments, expected to be about 20 to 25 years. The analysis followed the procedures and guidelines in the ADB Handbook for Economic Analysis of Water Supply Projects (1999), the Guidelines for the Economic Analysis of Projects (1997) and the Framework for the Economic and Financial Appraisal of Urban Development Projects (1994).
1. Economic Cost
9. Economic costs were derived from the financial estimates of the capital investments and the operating and maintenance costs of the subproject, net, i.e. minus, of all duties and taxes, and converted using appropriate price conversion factors. Traded and non-traded components of both investment and operation & maintenance costs were estimated. The price conversion factors used, as estimated by the National Economic Development Authority and used in all government projects, are as follows: (i) a shadow exchange rate factor of 1.2 for tradable costs, (ii) a shadow wage rate factor for unskilled labor of 0.6, and a shadow price factor for skilled labor of 1.0.
2. Economic Benefit
10. To make the EIRRs during appraisal and at completion comparable, the economic benefit indicator used during appraisal was similarly used in the analysis at completion. The economic benefit of the subprojects used consumer satisfaction—or "willingness to pay" of beneficiaries—as a proxy indicator of the perceived benefits that beneficiaries associate with the subproject.
B. Results of Reevaluation 11. The comparative results of the evaluation during appraisal and at completion are shown in the following table, and the details for each subproject are shown in succeeding tables.
Table 1: Comparative Results of Financial and Economic Evaluation of Subprojects
Type of Subproject/ Name of LGU
Financial Evaluation (FIRR)
Economic Evaluation (EIRR) Remarks
Water Supply Systems 1. Naawan, Misamis 14.1% 6.1% 17.1% 8.8% The number of connections is still
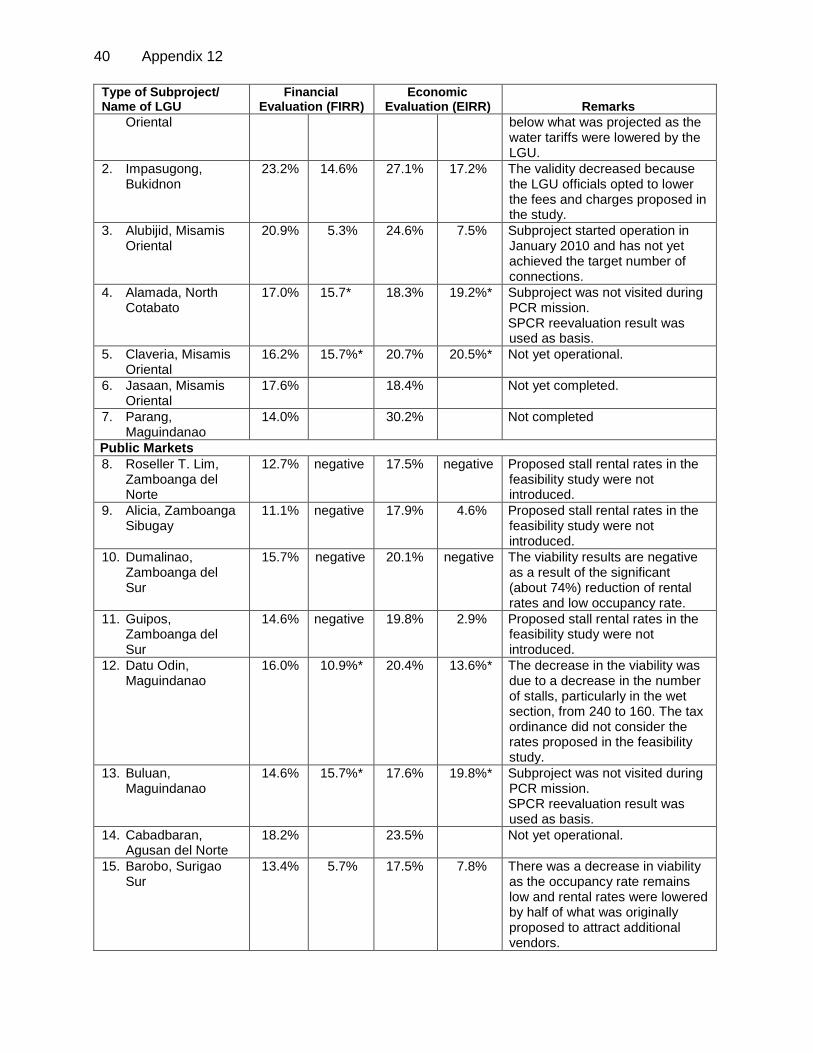
40 Appendix 12
Type of Subproject/ Name of LGU
Financial Evaluation (FIRR)
Economic Evaluation (EIRR) Remarks
Oriental below what was projected as the water tariffs were lowered by the LGU.
2. Impasugong, Bukidnon
23.2% 14.6% 27.1% 17.2% The validity decreased because the LGU officials opted to lower the fees and charges proposed in the study.
3. Alubijid, Misamis Oriental
20.9% 5.3% 24.6% 7.5% Subproject started operation in January 2010 and has not yet achieved the target number of connections.
4. Alamada, North Cotabato
17.0% 15.7* 18.3% 19.2%* Subproject was not visited during PCR mission. SPCR reevaluation result was used as basis.
5. Claveria, Misamis Oriental
16.2% 15.7%* 20.7% 20.5%* Not yet operational.
6. Jasaan, Misamis Oriental
17.6% 18.4% Not yet completed.
7. Parang, Maguindanao
14.0% 30.2% Not completed
Public Markets 8. Roseller T. Lim,
Zamboanga del Norte
12.7% negative 17.5% negative Proposed stall rental rates in the feasibility study were not introduced.
9. Alicia, Zamboanga Sibugay
11.1% negative 17.9% 4.6% Proposed stall rental rates in the feasibility study were not introduced.
10. Dumalinao, Zamboanga del Sur
15.7% negative 20.1% negative The viability results are negative as a result of the significant (about 74%) reduction of rental rates and low occupancy rate.
11. Guipos, Zamboanga del Sur
14.6% negative 19.8% 2.9% Proposed stall rental rates in the feasibility study were not introduced.
12. Datu Odin, Maguindanao
16.0% 10.9%* 20.4% 13.6%* The decrease in the viability was due to a decrease in the number of stalls, particularly in the wet section, from 240 to 160. The tax ordinance did not consider the rates proposed in the feasibility study.
13. Buluan, Maguindanao
14.6% 15.7%* 17.6% 19.8%* Subproject was not visited during PCR mission. SPCR reevaluation result was used as basis.
14. Cabadbaran, Agusan del Norte
18.2% 23.5% Not yet operational.
15. Barobo, Surigao Sur
13.4% 5.7%
17.5% 7.8% There was a decrease in viability as the occupancy rate remains low and rental rates were lowered by half of what was originally proposed to attract additional vendors.

Appendix 12 41
Type of Subproject/ Name of LGU
Financial Evaluation (FIRR)
Economic Evaluation (EIRR) Remarks
16. Hagonoy, Davao del Sur
18.1% 8.5% 25.8% 16.1% Incremental development in the vicinity of the market area—a direct result of the new market building—is evident
17. Makilala, North Cotabato
13.1% 12.8% 25.9% 16.5% The positive viability is the result of an increase in activity in other parts of the market—a direct result of the new market building.
18. Mati, Davao Oriental
14.7% negative 18.7% negative A high capital cost and a low occupancy rate contributed to the loss in the operation of the public market.
19. Ozamis City 18.0% 10.9% 22.0% 13.6% Decrease in viability was due to lower occupancy rate.
Transport Terminals 20. Kidapawan City 14.0% negative 16.0% 1.4% There was a decrease in viability
because most of the fruit stalls remained unoccupied, which affected the total income of the terminal.
21. Panabo City 14.36% 13.3% 18.7% 17.3% Despite the dramatic increase in income, there was a slight decrease in viability because the personnel cost were substantially higher than assumed, and because of low occupancy rates of rentable areas.
22. Isulan, Sultan Kudarat
14.9% 20.8%* 18.9% 25.4%* Subproject was not visited during PCR mission. SPCR reevaluation result was used as basis.
LGU = local government unit, PCR = project completion review, SPCR = subproject completion report. *Reevaluation result based on submitted SPCR.

42 Appendix 12
Naawan, Misamis Oriental Water Supply Subproject Financial Analysis (P ‘000) Constant 2010 prices
Year
Water Sold Financial Revenues Financial Costs Net
Financial Benefits
No. of Connections
Sales Volume (‘000 m3)
Non-incremental Incremental Total Investment
Incremental O&M Total
2004 680 975 975 14,011 14,011 (13,036) 2005 833 975 25 1,000 12,288 12,288 (11,288) 2006 1,052 975 731 1,706 2,110 2,110 (404) 2007 1,269 351 975 1,582 2,557 2,091 2,091 466 2008 1,391 384 975 1,951 2,926 2,342 2,342 584 2009 1,528 407 975 2,554 3,529 1,659 1,659 1,870 2010 1,647 529 975 3,569 4,544 1,525 1,525 3,019 2011 1,647 529 975 3,569 4,544 1,525 1,525 3,019 2012 1,647 529 975 3,569 4,544 1,525 1,525 3,019 2013 1,647 529 975 3,569 4,544 1,525 1,525 3,019 2014 1,647 529 975 3,569 4,544 1,525 1,525 3,019 2015 1,647 529 975 3,569 4,544 1,525 1,525 3,019 2016 1,647 529 975 3,569 4,544 1,525 1,525 3,019 2017 1,647 529 975 3,569 4,544 1,525 1,525 3,019 2018 1,647 529 975 3,569 4,544 1,525 1,525 3,019 2019 1,647 529 975 3,569 4,544 1,525 1,525 3,019 2020 1,647 529 975 3,569 4,544 1,525 1,525 3,019 2021 1,647 529 975 3,569 4,544 1,525 1,525 3,019 2022 1,647 529 975 3,569 4,544 1,525 1,525 3,019 2023 1,647 529 975 3,569 4,544 1,525 1,525 3,019 2024 1,647 529 975 3,569 4,544 1,525 1,525 3,019
NPV@8% 13,905 3,626 9,766 23,953 33,719 23,508 14,074 37,582 (3,863) Per m3 sold 9.30 6.48 3.88 10.36 (1.07) WACC = 8% AIFC FIRR 6.05%
Economic Analysis (P ‘000) Constant 2010 prices
Year
Volume of Water Sold (‘000 m3) Economic Benefits Economic Costs Net Economic Benefits
Non-incremental Incremental Total
Consumer Satisfaction Others Total Investment O&M Total
2004 680 680 975 975 11,735 11,735 (10,760) 2005 833 833 1,000 1,000 10,348 10,348 (9,348) 2006 1,052 1,052 1,706 1,706 1,884 1,884 (178) 2007 1,269 351 1,620 2,557 2,557 1,867 1,867 690 2008 1,391 384 1,775 2,926 2,926 2,091 2,091 835 2009 1,528 407 1,935 3,529 3,529 1,481 1,481 2,048 2010 1,647 529 2,176 4,544 4,544 1,361 1,361 3,183 2011 1,647 529 2,176 4,544 4,544 1,361 1,361 3,183 2012 1,647 529 2,176 4,544 4,544 1,361 1,361 3,183 2013 1,647 529 2,176 4,544 4,544 1,361 1,361 3,183 2014 1,647 529 2,176 4,544 4,544 1,361 1,361 3,183 2015 1,647 529 2,176 4,544 4,544 1,361 1,361 3,183 2016 1,647 529 2,176 4,544 4,544 1,361 1,361 3,183 2017 1,647 529 2,176 4,544 4,544 1,361 1,361 3,183 2018 1,647 529 2,176 4,544 4,544 1,361 1,361 3,183 2019 1,647 529 2,176 4,544 4,544 1,361 1,361 3,183 2020 1,647 529 2,176 4,544 4,544 1,361 1,361 3,183 2021 1,647 529 2,176 4,544 4,544 1,361 1,361 3,183 2022 1,647 529 2,176 4,544 4,544 1,361 1,361 3,183 2023 1,647 529 2,176 4,544 4,544 1,361 1,361 3,183 2024 1,647 529 2,176 4,544 4,544 1,361 1,361 3,183
NPV@12% 10,073 2,471 12,544 23,635 23,635 18,727 9,161 27,888 (4,253) Per m3 sold 1.88 1.49 0.73 2.22 (0.34) AIEC EIRR 8.80%
AIEC = average incremental economic cost, AIFC = average incremental financial cost, EIRR = economic internal rate of return, FIRR = financial internal rate of return, m3 = cubic meters, NPV = net present value, O&M = operation and maintenance, WACC = weighted average cost of capital.

Appendix 12 43
Impasugong, Bukidnon Water Supply Subproject Financial Analysis (P ‘000) Constant 2010 prices
Year
Volume of Water Sold (‘000 m3) Financial Revenues Financial Costs Net Financial Benefits
Non-incremental Incremental Total
Non-incremental Incremental Total Investment O&M Total
2007 21,510 21,510 (21,510) 2008 2,421 2,421 7,526 497 8,023 (5,602) 2009 255 255 3,506 3,506 601 601 2,905 2010 282 282 3,588 3,588 600 600 2,988 2011 310 310 3,722 3,722 660 660 3,062 2012 341 341 4,095 4,095 726 726 3,369 2013 375 374 4,504 4,504 799 799 3,706 2014 413 413 4,955 4,955 878 878 4,076 2015 454 454 5,450 5,450 966 966 4,484 2016 500 500 5,995 5,995 1,063 1,063 4,932 2017 550 550 6,594 6,594 1,169 1,169 5,425 2018 604 604 7,254 7,254 1,286 1,286 5,968 2019 665 665 7,979 7,979 1,415 1,415 6,565 2020 731 731 8,777 8,777 1,556 1,556 7,221 2021 805 805 9,655 9,655 1,712 1,712 7,943 2022 885 885 10,620 10,620 1,883 1,883 8,737 2023 974 974 11,682 11,682 2,071 2,071 9,611 2024 1,071 1,071 12,851 12,851 2,278 2,278 10,572 2025 1,178 1,178 14,136 14,136 2,506 2,506 11,629 2026 1,296 1,296 15,549 15,549 2,757 2,757 12,792 2027 1,425 1,425 17,104 17,104 3,033 3,033 14,072
NPV@12% 4,583 4,583 57,575 57,575 26,369 10,223 36,592 20,983 Per m3 sold 12.56 5.75 2.23 7.98 4.58 WACC = 8% AIFC FIRR 14.59%
Economic Analysis (P ‘000) Constant 2010 prices
Year
Volume of Water Sold (‘000 m3) Economic Benefits Economic Costs Net Economic Benefits
Non-incremental Incremental Total
Consumer Satisfaction Others Total Investment O&M Total
2007 18,151 18,151 (18,151) 2008 2,421 2,421 6,391 444 6,834 (4,413) 2009 255 255 3,506 3,506 536 536 2,970 2010 282 282 3,588 3,588 536 536 3,052 2011 310 310 3,722 3,722 589 589 3,133 2012 341 341 4,095 4,095 648 648 3,446 2013 375 374 4,504 4,504 713 713 3,791 2014 413 413 4,955 4,955 784 784 4,170 2015 454 454 5,450 5,450 863 863 4,587 2016 500 500 5,995 5,995 949 949 5,046 2017 550 550 6,594 6,594 1,044 1,044 5,551 2018 604 604 7,254 7,254 1,148 1,148 6,106 2019 665 665 7,979 7,979 1,263 1,263 6,716 2020 731 731 8,777 8,777 1,390 1,390 7,388 2021 805 805 9,655 9,655 1,528 1,528 8,126 2022 885 885 10,620 10,620 1,681 1,681 8,939 2023 974 974 11,682 11,682 1,849 1,849 9,833 2024 1,071 1,071 12,851 12,851 2,034 2,034 10,816 2025 1,178 1,178 14,136 14,136 2,238 2,238 11,898 2026 1,296 1,296 15,549 15,549 2,462 2,462 13,088 2027 1,425 1,425 17,104 17,104 2,708 2,708 14,397
NPV@12% 2,961 2,961 37,914 37,914 21,301 6,016 27,317 10,597 Per m3 sold 12.80 7.19 2.03 9.22 3.58 AIFC EIRR 14.59% AIEC = average incremental economic cost, AIFC = average incremental financial cost, EIRR = economic internal rate of return, FIRR = financial internal rate of return, m3 = cubic meters, NPV = net present value, O&M = operation and maintenance, WACC = weighted average cost of capital
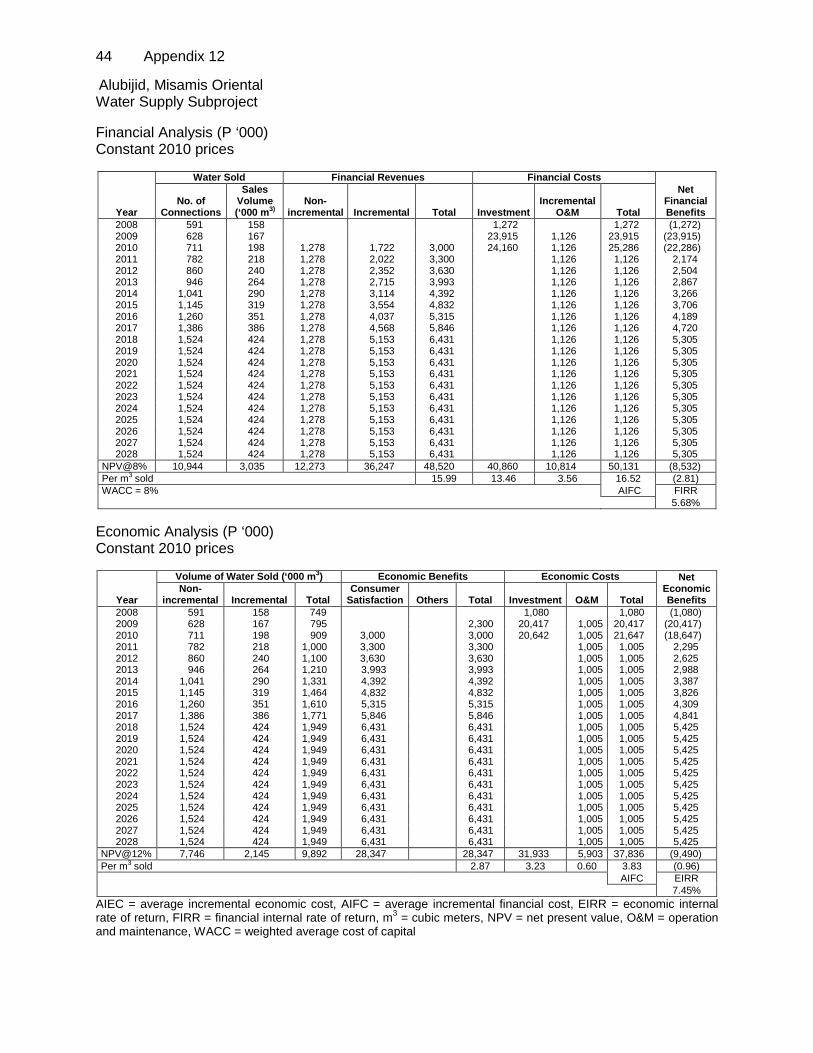
44 Appendix 12
Alubijid, Misamis Oriental Water Supply Subproject Financial Analysis (P ‘000) Constant 2010 prices
Year
Water Sold Financial Revenues Financial Costs Net
Financial Benefits
No. of Connections
Sales Volume (‘000 m3)
Non-incremental Incremental Total Investment
Incremental O&M Total
2008 591 158 1,272 1,272 (1,272) 2009 628 167 23,915 1,126 23,915 (23,915) 2010 711 198 1,278 1,722 3,000 24,160 1,126 25,286 (22,286) 2011 782 218 1,278 2,022 3,300 1,126 1,126 2,174 2012 860 240 1,278 2,352 3,630 1,126 1,126 2,504 2013 946 264 1,278 2,715 3,993 1,126 1,126 2,867 2014 1,041 290 1,278 3,114 4,392 1,126 1,126 3,266 2015 1,145 319 1,278 3,554 4,832 1,126 1,126 3,706 2016 1,260 351 1,278 4,037 5,315 1,126 1,126 4,189 2017 1,386 386 1,278 4,568 5,846 1,126 1,126 4,720 2018 1,524 424 1,278 5,153 6,431 1,126 1,126 5,305 2019 1,524 424 1,278 5,153 6,431 1,126 1,126 5,305 2020 1,524 424 1,278 5,153 6,431 1,126 1,126 5,305 2021 1,524 424 1,278 5,153 6,431 1,126 1,126 5,305 2022 1,524 424 1,278 5,153 6,431 1,126 1,126 5,305 2023 1,524 424 1,278 5,153 6,431 1,126 1,126 5,305 2024 1,524 424 1,278 5,153 6,431 1,126 1,126 5,305 2025 1,524 424 1,278 5,153 6,431 1,126 1,126 5,305 2026 1,524 424 1,278 5,153 6,431 1,126 1,126 5,305 2027 1,524 424 1,278 5,153 6,431 1,126 1,126 5,305 2028 1,524 424 1,278 5,153 6,431 1,126 1,126 5,305
NPV@8% 10,944 3,035 12,273 36,247 48,520 40,860 10,814 50,131 (8,532) Per m3 sold 15.99 13.46 3.56 16.52 (2.81) WACC = 8% AIFC FIRR 5.68%
Economic Analysis (P ‘000) Constant 2010 prices
Year
Volume of Water Sold (‘000 m3) Economic Benefits Economic Costs Net Economic Benefits
Non-incremental Incremental Total
Consumer Satisfaction Others Total Investment O&M Total
2008 591 158 749 1,080 1,080 (1,080) 2009 628 167 795 2,300 20,417 1,005 20,417 (20,417) 2010 711 198 909 3,000 3,000 20,642 1,005 21,647 (18,647) 2011 782 218 1,000 3,300 3,300 1,005 1,005 2,295 2012 860 240 1,100 3,630 3,630 1,005 1,005 2,625 2013 946 264 1,210 3,993 3,993 1,005 1,005 2,988 2014 1,041 290 1,331 4,392 4,392 1,005 1,005 3,387 2015 1,145 319 1,464 4,832 4,832 1,005 1,005 3,826 2016 1,260 351 1,610 5,315 5,315 1,005 1,005 4,309 2017 1,386 386 1,771 5,846 5,846 1,005 1,005 4,841 2018 1,524 424 1,949 6,431 6,431 1,005 1,005 5,425 2019 1,524 424 1,949 6,431 6,431 1,005 1,005 5,425 2020 1,524 424 1,949 6,431 6,431 1,005 1,005 5,425 2021 1,524 424 1,949 6,431 6,431 1,005 1,005 5,425 2022 1,524 424 1,949 6,431 6,431 1,005 1,005 5,425 2023 1,524 424 1,949 6,431 6,431 1,005 1,005 5,425 2024 1,524 424 1,949 6,431 6,431 1,005 1,005 5,425 2025 1,524 424 1,949 6,431 6,431 1,005 1,005 5,425 2026 1,524 424 1,949 6,431 6,431 1,005 1,005 5,425 2027 1,524 424 1,949 6,431 6,431 1,005 1,005 5,425 2028 1,524 424 1,949 6,431 6,431 1,005 1,005 5,425
NPV@12% 7,746 2,145 9,892 28,347 28,347 31,933 5,903 37,836 (9,490) Per m3 sold 2.87 3.23 0.60 3.83 (0.96) AIFC EIRR 7.45%
AIEC = average incremental economic cost, AIFC = average incremental financial cost, EIRR = economic internal rate of return, FIRR = financial internal rate of return, m3 = cubic meters, NPV = net present value, O&M = operation and maintenance, WACC = weighted average cost of capital

Appendix 12 45
Roseller T. Lim, Zamboanga Sibugay Public Market Subproject Financial Analysis (P ‘000) Constant 2010 prices
Year
Stall Rental Financial Revenues Financial Costs Net Financial Benefits No. of Stalls
Rentable Area (m2) Stall Rental
Other Revenues Total Investment
Incremental O&M Total
2004 15,852 15,852 (15,852) 2005 13,945 13,945 (13,945) 2006 45 540 770 832 1,602 479 479 1,123 2007 45 540 770 832 1,602 668 668 934 2008 45 540 770 832 1,602 1,324 1,324 278 2009 45 540 770 832 1,602 1,236 1,236 316 2010 45 540 770 832 1,602 1,236 1,236 366 2011 45 540 770 832 1,602 1,236 1,236 366 2012 45 540 770 832 1,602 1,236 1,236 366 2013 45 540 770 832 1,602 1,236 1,236 366 2014 45 540 770 832 1,602 1,236 1,236 366 2015 45 540 770 832 1,602 1,236 1,236 366 2016 45 540 770 832 1,602 1,236 1,236 366 2017 45 540 770 832 1,602 1,236 1,236 366 2018 45 540 770 832 1,602 1,236 1,236 366 2019 45 540 770 832 1,602 1,236 1,236 366 2020 45 540 770 832 1,602 1,236 1,236 366 2021 45 540 770 832 1,602 1,236 1,236 366 2022 45 540 770 832 1,602 1,236 1,236 366 2023 45 540 770 832 1,602 1,236 1,236 366 2024 45 540 770 832 1,602 1,236 1,236 366
NPV@8% 400 4,802 6,847 7,398 14,245 26,634 9,250 35,883 (22,693) Per m2 rented 2.97 5.55 1.93 7.47 (4.73) WACC = 8% AIFC FIRR Negative
Economic Analysis (P ‘000) Constant 2010 prices
Year
Stall Rental Economic Benefits Economic Costs Net Economic Benefits
No. of Stalls
Rentable Area (m2)
Consumer Satisfaction Others Total Investment O&M Total
2004 13,524 13,524 (13,524) 2005 11,966 11,966 (11,996) 2006 45 540 1,602 1,602 428 428 1,174 2007 45 540 1,602 1,602 596 596 1,006 2008 45 540 1,602 500 2,102 1,182 1,182 920 2009 45 540 1,602 500 2,102 1,148 1,148 954 2010 45 540 1,602 500 2,102 1,104 1,104 998 2011 45 540 1,602 500 2,102 1,104 1,104 998 2012 45 540 1,602 500 2,102 1,104 1,104 998 2013 45 540 1,602 500 2,102 1,104 1,104 998 2014 45 540 1,602 500 2,102 1,104 1,104 998 2015 45 540 1,602 500 2,102 1,104 1,104 998 2016 45 540 1,602 500 2,102 1,104 1,104 998 2017 45 540 1,602 500 2,102 1,104 1,104 998 2018 45 540 1,602 500 2,102 1,104 1,104 998 2019 45 540 1,602 500 2,102 1,104 1,104 998 2020 45 540 1,602 500 2,102 1,104 1,104 998 2021 45 540 1,602 500 2,102 1,104 1,104 998 2022 45 540 1,602 500 2,102 1,104 1,104 998 2023 45 540 1,602 500 2,102 1,104 1,104 998 2024 45 540 1,602 500 2,102 1,104 1,104 998
NPV@12% 264 3,171 9,407 3,560 11,669 21,614 5,744 27,358 (15,689) Per m2 rented 3.68 6.82 1.81 8.63 (4.95) AIEC EIRR (2.65%)
AIEC = average incremental economic cost, AIFC = average incremental financial cost, EIRR = economic internal rate of return, FIRR = financial internal rate of return, m2 = square meters, NPV = net present value, O&M = operation and maintenance, WACC = weighted average cost of capital.
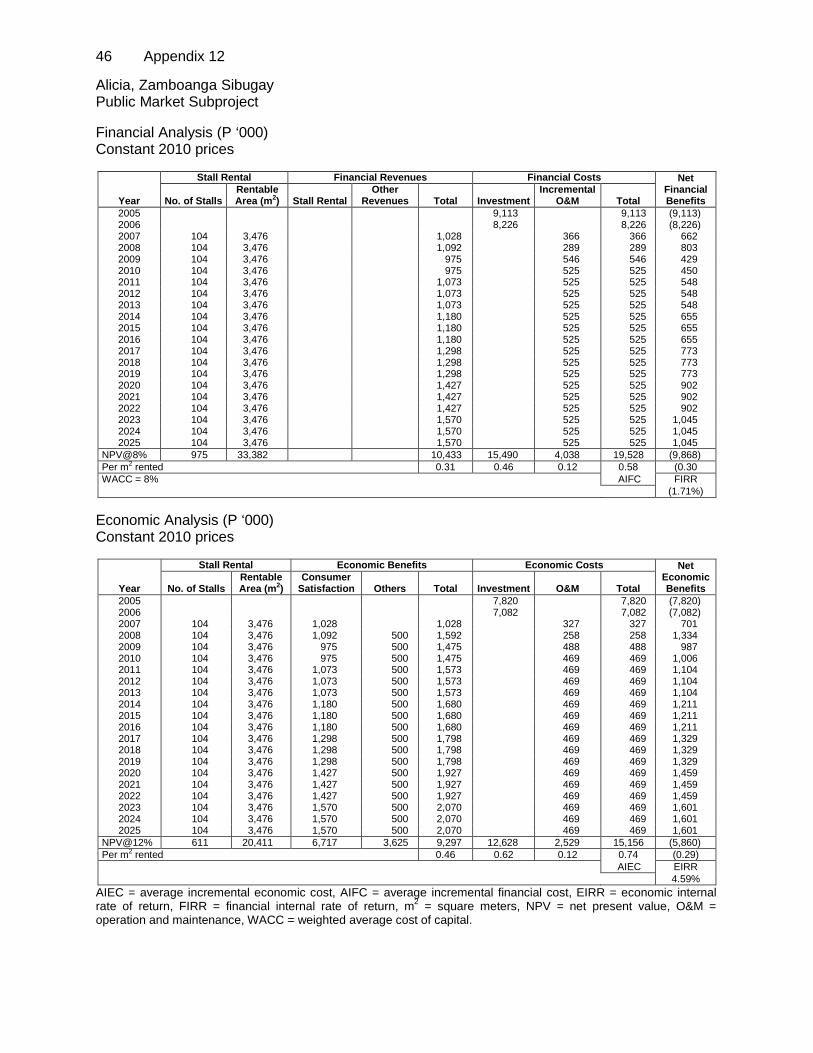
46 Appendix 12
Alicia, Zamboanga Sibugay Public Market Subproject Financial Analysis (P ‘000) Constant 2010 prices
Year
Stall Rental Financial Revenues Financial Costs Net Financial Benefits No. of Stalls
Rentable Area (m2) Stall Rental
Other Revenues Total Investment
Incremental O&M Total
2005 9,113 9,113 (9,113) 2006 8,226 8,226 (8,226) 2007 104 3,476 1,028 366 366 662 2008 104 3,476 1,092 289 289 803 2009 104 3,476 975 546 546 429 2010 104 3,476 975 525 525 450 2011 104 3,476 1,073 525 525 548 2012 104 3,476 1,073 525 525 548 2013 104 3,476 1,073 525 525 548 2014 104 3,476 1,180 525 525 655 2015 104 3,476 1,180 525 525 655 2016 104 3,476 1,180 525 525 655 2017 104 3,476 1,298 525 525 773 2018 104 3,476 1,298 525 525 773 2019 104 3,476 1,298 525 525 773 2020 104 3,476 1,427 525 525 902 2021 104 3,476 1,427 525 525 902 2022 104 3,476 1,427 525 525 902 2023 104 3,476 1,570 525 525 1,045 2024 104 3,476 1,570 525 525 1,045 2025 104 3,476 1,570 525 525 1,045
NPV@8% 975 33,382 10,433 15,490 4,038 19,528 (9,868) Per m2 rented 0.31 0.46 0.12 0.58 (0.30 WACC = 8% AIFC FIRR (1.71%)
Economic Analysis (P ‘000) Constant 2010 prices
Year
Stall Rental Economic Benefits Economic Costs Net Economic Benefits No. of Stalls
Rentable Area (m2)
Consumer Satisfaction Others Total Investment O&M Total
2005 7,820 7,820 (7,820) 2006 7,082 7,082 (7,082) 2007 104 3,476 1,028 1,028 327 327 701 2008 104 3,476 1,092 500 1,592 258 258 1,334 2009 104 3,476 975 500 1,475 488 488 987 2010 104 3,476 975 500 1,475 469 469 1,006 2011 104 3,476 1,073 500 1,573 469 469 1,104 2012 104 3,476 1,073 500 1,573 469 469 1,104 2013 104 3,476 1,073 500 1,573 469 469 1,104 2014 104 3,476 1,180 500 1,680 469 469 1,211 2015 104 3,476 1,180 500 1,680 469 469 1,211 2016 104 3,476 1,180 500 1,680 469 469 1,211 2017 104 3,476 1,298 500 1,798 469 469 1,329 2018 104 3,476 1,298 500 1,798 469 469 1,329 2019 104 3,476 1,298 500 1,798 469 469 1,329 2020 104 3,476 1,427 500 1,927 469 469 1,459 2021 104 3,476 1,427 500 1,927 469 469 1,459 2022 104 3,476 1,427 500 1,927 469 469 1,459 2023 104 3,476 1,570 500 2,070 469 469 1,601 2024 104 3,476 1,570 500 2,070 469 469 1,601 2025 104 3,476 1,570 500 2,070 469 469 1,601
NPV@12% 611 20,411 6,717 3,625 9,297 12,628 2,529 15,156 (5,860) Per m2 rented 0.46 0.62 0.12 0.74 (0.29) AIEC EIRR 4.59%
AIEC = average incremental economic cost, AIFC = average incremental financial cost, EIRR = economic internal rate of return, FIRR = financial internal rate of return, m2 = square meters, NPV = net present value, O&M = operation and maintenance, WACC = weighted average cost of capital.

Appendix 12 47
Dumalinao, Zamboanga del Sur Public Market Subproject Financial Analysis (P ‘000) Constant 2010 prices
Year
Stall Rental Financial Revenues Financial Costs Net Financial Benefits No. of Stalls
Rentable Area (m2) Stall Rental
Other Revenues Total Investment
Incremental O&M Total
2004 3,659 3,659 (3,659) 2005 15,022 15,022 (15,022) 2006 117 2,222 202 2,905 780 3,686 (3,484) 2007 117 2,222 202 737 737 (535) 2008 117 2,222 202 647 647 (445) 2009 117 2,222 142 628 628 (486) 2010 117 2,222 450 604 604 (154) 2011 117 2,222 450 604 604 (154) 2012 117 2,222 450 604 604 (154) 2013 117 2,222 450 604 604 (154) 2014 117 2,222 450 604 604 (154) 2015 117 2,222 450 604 604 (154) 2016 117 2,222 450 604 604 (154) 2017 117 2,222 450 604 604 (154) 2018 117 2,222 450 604 604 (154) 2019 117 2,222 450 604 604 (154) 2020 117 2,222 450 604 604 (154) 2021 117 2,222 450 604 604 (154) 2022 117 2,222 450 604 604 (154) 2023 117 2,222 450 604 604 (154) 2024 117 2,222 450 604 604 (154)
NPV@8% 1,040 19,759 3,200 18,574 5,256 23,829 (20,866) Per m2 rented 0.16 0.94 0.27 1.21 (1.06) WACC = 8% AIFC FIRR Negative
Economic Analysis (P ‘000) Constant 2010 prices
Year
Stall Rental Economic Benefits Economic Costs Net Economic Benefits
No. of Stalls
Rentable Area (m2)
Consumer Satisfaction Others Total Investment O&M Total
2004 3,122 3,122 (3,122) 2005 12,890 12,890 (12,890) 2006 117 2,222 202 202 2,502 697 3,198 (2,996) 2007 117 2,222 202 202 658 658 (456) 2008 117 2,222 202 500 202 578 578 124 2009 117 2,222 142 500 142 561 561 81 2010 117 2,222 450 500 450 539 539 411 2011 117 2,222 450 500 450 539 539 411 2012 117 2,222 450 500 450 539 539 411 2013 117 2,222 450 500 450 539 539 411 2014 117 2,222 450 500 450 539 539 411 2015 117 2,222 450 500 450 539 539 411 2016 117 2,222 450 500 450 539 539 411 2017 117 2,222 450 500 450 539 539 411 2018 117 2,222 450 500 450 539 539 411 2019 117 2,222 450 500 450 539 539 411 2020 117 2,222 450 500 450 539 539 411 2021 117 2,222 450 500 450 539 539 411 2022 117 2,222 450 500 450 539 539 411 2023 117 2,222 450 500 450 539 539 411 2024 117 2,222 450 500 450 539 539 411
NPV@12% 687 13,047 2,011 3,560 4,274 14,844 3,387 18,231 (13,957) Per m2 rented 0.33 1.14 0.26 1.40 (1.07) AIEC EIRR Negative
AIEC = average incremental economic cost, AIFC = average incremental financial cost, EIRR = economic internal rate of return, FIRR = financial internal rate of return, m2 = square meters, NPV = net present value, O&M = operation and maintenance, WACC = weighted average cost of capital
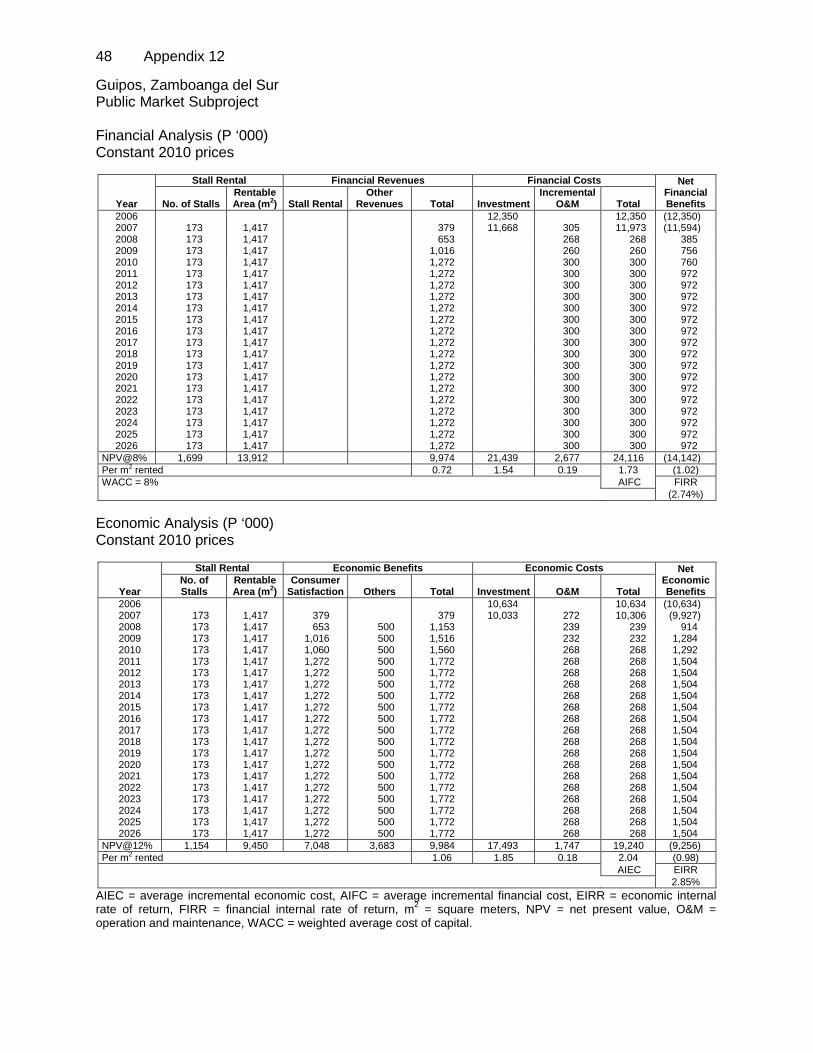
48 Appendix 12
Guipos, Zamboanga del Sur Public Market Subproject Financial Analysis (P ‘000) Constant 2010 prices
Year
Stall Rental Financial Revenues Financial Costs Net Financial Benefits No. of Stalls
Rentable Area (m2) Stall Rental
Other Revenues Total Investment
Incremental O&M Total
2006 12,350 12,350 (12,350) 2007 173 1,417 379 11,668 305 11,973 (11,594) 2008 173 1,417 653 268 268 385 2009 173 1,417 1,016 260 260 756 2010 173 1,417 1,272 300 300 760 2011 173 1,417 1,272 300 300 972 2012 173 1,417 1,272 300 300 972 2013 173 1,417 1,272 300 300 972 2014 173 1,417 1,272 300 300 972 2015 173 1,417 1,272 300 300 972 2016 173 1,417 1,272 300 300 972 2017 173 1,417 1,272 300 300 972 2018 173 1,417 1,272 300 300 972 2019 173 1,417 1,272 300 300 972 2020 173 1,417 1,272 300 300 972 2021 173 1,417 1,272 300 300 972 2022 173 1,417 1,272 300 300 972 2023 173 1,417 1,272 300 300 972 2024 173 1,417 1,272 300 300 972 2025 173 1,417 1,272 300 300 972 2026 173 1,417 1,272 300 300 972
NPV@8% 1,699 13,912 9,974 21,439 2,677 24,116 (14,142) Per m2 rented 0.72 1.54 0.19 1.73 (1.02) WACC = 8% AIFC FIRR (2.74%)
Economic Analysis (P ‘000) Constant 2010 prices
Year
Stall Rental Economic Benefits Economic Costs Net Economic Benefits
No. of Stalls
Rentable Area (m2)
Consumer Satisfaction Others Total Investment O&M Total
2006 10,634 10,634 (10,634) 2007 173 1,417 379 379 10,033 272 10,306 (9,927) 2008 173 1,417 653 500 1,153 239 239 914 2009 173 1,417 1,016 500 1,516 232 232 1,284 2010 173 1,417 1,060 500 1,560 268 268 1,292 2011 173 1,417 1,272 500 1,772 268 268 1,504 2012 173 1,417 1,272 500 1,772 268 268 1,504 2013 173 1,417 1,272 500 1,772 268 268 1,504 2014 173 1,417 1,272 500 1,772 268 268 1,504 2015 173 1,417 1,272 500 1,772 268 268 1,504 2016 173 1,417 1,272 500 1,772 268 268 1,504 2017 173 1,417 1,272 500 1,772 268 268 1,504 2018 173 1,417 1,272 500 1,772 268 268 1,504 2019 173 1,417 1,272 500 1,772 268 268 1,504 2020 173 1,417 1,272 500 1,772 268 268 1,504 2021 173 1,417 1,272 500 1,772 268 268 1,504 2022 173 1,417 1,272 500 1,772 268 268 1,504 2023 173 1,417 1,272 500 1,772 268 268 1,504 2024 173 1,417 1,272 500 1,772 268 268 1,504 2025 173 1,417 1,272 500 1,772 268 268 1,504 2026 173 1,417 1,272 500 1,772 268 268 1,504
NPV@12% 1,154 9,450 7,048 3,683 9,984 17,493 1,747 19,240 (9,256) Per m2 rented 1.06 1.85 0.18 2.04 (0.98) AIEC EIRR 2.85%
AIEC = average incremental economic cost, AIFC = average incremental financial cost, EIRR = economic internal rate of return, FIRR = financial internal rate of return, m2 = square meters, NPV = net present value, O&M = operation and maintenance, WACC = weighted average cost of capital.

Appendix 12 49
Barobo, Surigao del Sur Public Market Subproject Financial Analysis (P ‘000) Constant 2010 prices
Year
Stall Rental Financial Revenues Financial Costs Net Financial Benefits No. of Stalls
Rentable Area (m2) Stall Rental
Other Revenues Total Investment
Incremental O&M Total
2007 13,019 13,019 (13,019) 2008 10,070 10,070 (10,070) 2009 79 335 337 1,069 1,406 2,262 1,021 3,282 (1,876) 2010 102 435 108 337 445 981 981 (536) 2011 157 669 3,083 617 3,699 981 981 2,718 2012 157 669 3,083 617 3,699 981 981 2,718 2013 157 669 3,083 617 3,699 981 981 2,718 2014 157 669 3,083 617 3,699 981 981 2,718 2015 157 669 3,083 617 3,699 981 981 2,718 2016 157 669 3,083 617 3,699 981 981 2,718 2017 157 669 3,083 617 3,699 981 981 2,718 2018 157 669 3,083 617 3,699 981 981 2,718 2019 157 669 3,083 617 3,699 981 981 2,718 2020 157 669 3,083 617 3,699 981 981 2,718 2021 157 669 3,083 617 3,699 981 981 2,718 2022 157 669 3,083 617 3,699 981 981 2,718 2023 157 669 3,083 617 3,699 981 981 2,718 2024 157 669 3,083 617 3,699 981 981 2,718 2025 157 669 3,083 617 3,699 981 981 2,718 2026 157 669 3,083 617 3,699 981 981 2,718 2027 157 669 3,083 617 3,699 981 981 2,718
NPV@8% 1,285 5,476 21,016 5,230 26,246 22,483 9,458 30,592 (4,346) Per m2 rented 4.79 4.11 1.73 5.59 (0.79) WACC = 8% AIFC FIRR 5.69%
Economic Analysis (P ‘000) Constant 2010 prices
Year
Stall Rental Economic Benefits Economic Costs Net Economic Benefits No. of Stalls
Rentable Area (m2)
Consumer Satisfaction Others Total Investment O&M Total
2007 11,195 11,195 (11,195) 2008 8,715 8,715 (8,715) 2009 79 335 1,406 1,406 1,969 911 2,880 (1,474) 2010 102 435 445 445 876 876 (431) 2011 157 669 3,699 3,699 876 876 2,823 2012 157 669 3,699 3,699 876 876 2,823 2013 157 669 3,699 3,699 876 876 2,823 2014 157 669 3,699 3,699 876 876 2,823 2015 157 669 3,699 3,699 876 876 2,823 2016 157 669 3,699 3,699 876 876 2,823 2017 157 669 3,699 3,699 876 876 2,823 2018 157 669 3,699 3,699 876 876 2,823 2019 157 669 3,699 3,699 876 876 2,823 2020 157 669 3,699 3,699 876 876 2,823 2021 157 669 3,699 3,699 876 876 2,823 2022 157 669 3,699 3,699 876 876 2,823 2023 157 669 3,699 3,699 876 876 2,823 2024 157 669 3,699 3,699 876 876 2,823 2025 157 669 3,699 3,699 876 876 2,823 2026 157 669 3,699 3,699 876 876 2,823 2027 157 669 3,699 3,699 876 876 2,823
NPV@12%
831 3,541 18,022 18,022 18,345 5,168 23,513 (5,491)
Per m2 rented 5.09 5.18 1.46 6.64 (9.55) AIEC EIRR 7.77% AIEC = average incremental economic cost, AIFC = average incremental financial cost, EIRR = economic internal rate of return, FIRR = financial internal rate of return, m2 = square meters, NPV = net present value, O&M = operation and maintenance, WACC = weighted average cost of capital.
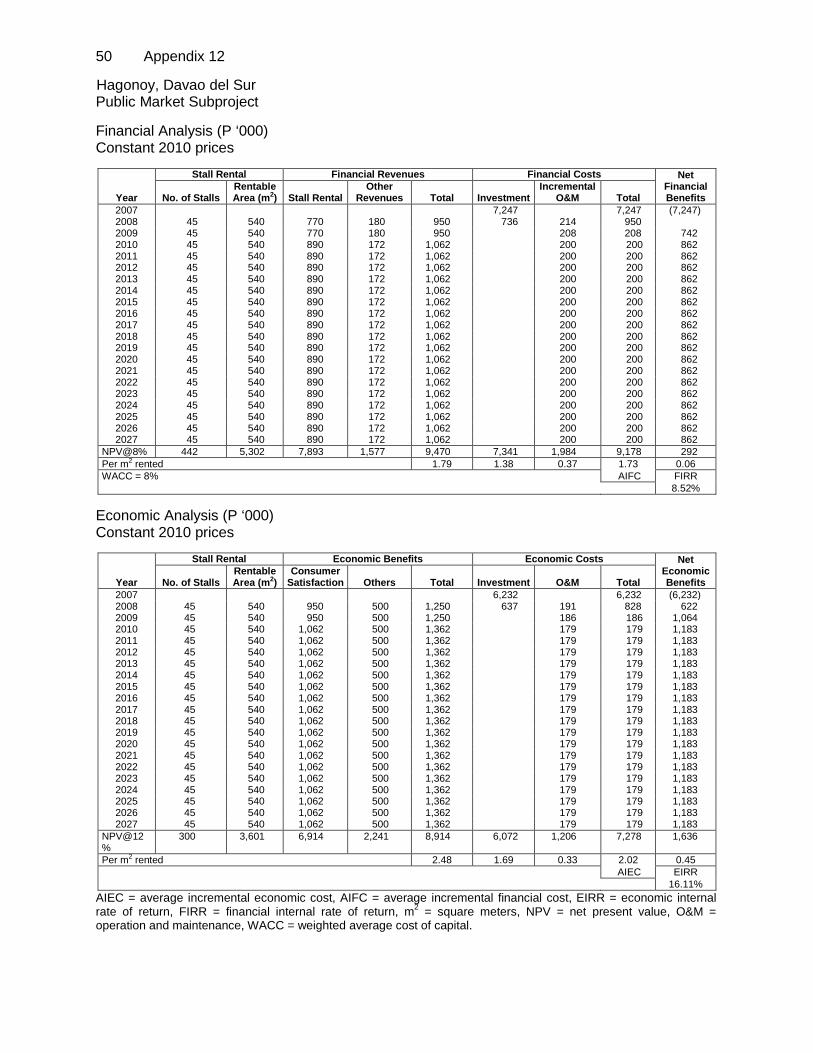
50 Appendix 12
Hagonoy, Davao del Sur Public Market Subproject Financial Analysis (P ‘000) Constant 2010 prices
Year
Stall Rental Financial Revenues Financial Costs Net Financial Benefits No. of Stalls
Rentable Area (m2) Stall Rental
Other Revenues Total Investment
Incremental O&M Total
2007 7,247 7,247 (7,247) 2008 45 540 770 180 950 736 214 950 2009 45 540 770 180 950 208 208 742 2010 45 540 890 172 1,062 200 200 862 2011 45 540 890 172 1,062 200 200 862 2012 45 540 890 172 1,062 200 200 862 2013 45 540 890 172 1,062 200 200 862 2014 45 540 890 172 1,062 200 200 862 2015 45 540 890 172 1,062 200 200 862 2016 45 540 890 172 1,062 200 200 862 2017 45 540 890 172 1,062 200 200 862 2018 45 540 890 172 1,062 200 200 862 2019 45 540 890 172 1,062 200 200 862 2020 45 540 890 172 1,062 200 200 862 2021 45 540 890 172 1,062 200 200 862 2022 45 540 890 172 1,062 200 200 862 2023 45 540 890 172 1,062 200 200 862 2024 45 540 890 172 1,062 200 200 862 2025 45 540 890 172 1,062 200 200 862 2026 45 540 890 172 1,062 200 200 862 2027 45 540 890 172 1,062 200 200 862
NPV@8% 442 5,302 7,893 1,577 9,470 7,341 1,984 9,178 292 Per m2 rented 1.79 1.38 0.37 1.73 0.06 WACC = 8% AIFC FIRR 8.52%
Economic Analysis (P ‘000) Constant 2010 prices
Year
Stall Rental Economic Benefits Economic Costs Net Economic Benefits No. of Stalls
Rentable Area (m2)
Consumer Satisfaction Others Total Investment O&M Total
2007 6,232 6,232 (6,232) 2008 45 540 950 500 1,250 637 191 828 622 2009 45 540 950 500 1,250 186 186 1,064 2010 45 540 1,062 500 1,362 179 179 1,183 2011 45 540 1,062 500 1,362 179 179 1,183 2012 45 540 1,062 500 1,362 179 179 1,183 2013 45 540 1,062 500 1,362 179 179 1,183 2014 45 540 1,062 500 1,362 179 179 1,183 2015 45 540 1,062 500 1,362 179 179 1,183 2016 45 540 1,062 500 1,362 179 179 1,183 2017 45 540 1,062 500 1,362 179 179 1,183 2018 45 540 1,062 500 1,362 179 179 1,183 2019 45 540 1,062 500 1,362 179 179 1,183 2020 45 540 1,062 500 1,362 179 179 1,183 2021 45 540 1,062 500 1,362 179 179 1,183 2022 45 540 1,062 500 1,362 179 179 1,183 2023 45 540 1,062 500 1,362 179 179 1,183 2024 45 540 1,062 500 1,362 179 179 1,183 2025 45 540 1,062 500 1,362 179 179 1,183 2026 45 540 1,062 500 1,362 179 179 1,183 2027 45 540 1,062 500 1,362 179 179 1,183
NPV@12%
300 3,601 6,914 2,241 8,914 6,072 1,206 7,278 1,636
Per m2 rented 2.48 1.69 0.33 2.02 0.45 AIEC EIRR 16.11%
AIEC = average incremental economic cost, AIFC = average incremental financial cost, EIRR = economic internal rate of return, FIRR = financial internal rate of return, m2 = square meters, NPV = net present value, O&M = operation and maintenance, WACC = weighted average cost of capital.

Appendix 12 51
Makilala, North Cotabato Public Market Subproject Financial Analysis (P ‘000) Constant 2010 prices
Year
Stall Rental Financial Revenues Financial Costs Net Financial Benefits
No. of Stalls
Rentable Area (m2)
Stall Rental
Other Revenues Total Investment
Incremental O&M Total
2006 15,655 15,655 (15,665) 2007 11,998 11,998 (11,998) 2008 68 1,700 3,723 3,657 7,380 3,352 3,352 4,028 2009 68 1,700 3,723 3,657 7,380 3,254 3,254 4,126 2010 68 1,700 3,723 3,657 7,380 3,128 3,128 4,252 2011 68 1,700 3,723 3,657 7,380 3,128 3,128 4,252 2012 68 1,700 3,723 3,657 7,380 3,128 3,128 4,252 2013 68 1,700 3,723 3,657 7,380 3,128 3,128 4,252 2014 68 1,700 3,723 3,657 7,380 3,128 3,128 4,252 2015 68 1,700 3,723 3,657 7,380 3,128 3,128 4,252 2016 68 1,700 3,723 3,657 7,380 3,128 3,128 4,252 2017 68 1,700 3,723 3,657 7,380 3,128 3,128 4,252 2018 68 1,700 3,723 3,657 7,380 3,128 3,128 4,252 2019 68 1,700 3,723 3,657 7,380 3,128 3,128 4,252 2020 68 1,700 3,723 3,657 7,380 3,128 3,128 4,252 2021 68 1,700 3,723 3,657 7,380 3,128 3,128 4,252 2022 68 1,700 3,723 3,657 7,380 3,128 3,128 4,252 2023 68 1,700 3,723 3,657 7,380 3,128 3,128 4,252 2024 68 1,700 3,723 3,657 7,380 3,128 3,128 4,252 2025 68 1,700 3,723 3,657 7,380 3,128 3,128 4,252 2026 68 1,700 3,723 3,657 7,380 3,128 3,128 4,252
NPV@8% 653 16,326 30,652 30,110 60,764 24,782 28,107 50,806 9,957 Per m2 rented 3.72 1.52 1.72 3.11 0.61 WACC = 8% AIFC FIRR 12.75%
Economic Analysis (P ‘000) Constant 2010 prices
Year
Stall Rental Economic Benefits Economic Costs Net Economic Benefits
No. of Stalls
Rentable Area (m2)
Consumer Satisfaction Others Total Investment O&M Total
2006 13,479 13,479 (13,479) 2007 10,317 10,317 (10,317) 2008 68 1,700 7,380 7,380 2,992 2,992 4,388 2009 68 1,700 7,380 7,380 2,906 2,906 4,474 2010 68 1,700 7,380 7,380 2,793 2,793 4,587 2011 68 1,700 7,380 7,380 2,793 2,793 4,587 2012 68 1,700 7,380 7,380 2,793 2,793 4,587 2013 68 1,700 7,380 7,380 2,793 2,793 4,587 2014 68 1,700 7,380 7,380 2,793 2,793 4,587 2015 68 1,700 7,380 7,380 2,793 2,793 4,587 2016 68 1,700 7,380 7,380 2,793 2,793 4,587 2017 68 1,700 7,380 7,380 2,793 2,793 4,587 2018 68 1,700 7,380 7,380 2,793 2,793 4,587 2019 68 1,700 7,380 7,380 2,793 2,793 4,587 2020 68 1,700 7,380 7,380 2,793 2,793 4,587 2021 68 1,700 7,380 7,380 2,793 2,793 4,587 2022 68 1,700 7,380 7,380 2,793 2,793 4,587 2023 68 1,700 7,380 7,380 2,793 2,793 4,587 2024 68 1,700 7,380 7,380 2,793 2,793 4,587 2025 68 1,700 7,380 7,380 2,793 2,793 4,587 2026 68 1,700 7,380 7,380 2,793 2,793 4,587
NPV@12% 399 9,982 43,335 43,335 20,260 16,613 36,873 6,462 Per m2 rented 4.34 2.03 1.66 3.69 0.65 AIEC EIRR 16.50%
AIEC = average incremental economic cost, AIFC = average incremental financial cost, EIRR = economic internal rate of return, FIRR = financial internal rate of return, m2 = square meters, NPV = net present value, O&M = operation and maintenance, WACC = weighted average cost of capital.

52 Appendix 12
Mati, Davao Oriental Public Market Subproject Financial Analysis (P ‘000) Constant 2010 prices
Year
Stall Rental Financial Revenues Financial Costs Net Financial Benefits
No. of Stalls
Rentable Area (m2)
Stall Rental
Other Revenues Total Investment
Incremental O&M Total
2005 27,950 27,950 (27,950) 2006 86,302 86,302 (86,302) 2007 200 1,982 3,893 634 4,527 6,103 6,103 (1,576) 2008 320 3,172 6,228 1,668 7,896 9,147 9,147 (1,251) 2009 315 3,122 6,131 1,261 7,392 8,753 8,753 (1,361) 2010 492 4,876 6,703 1,463 8,166 8,413 8,413 (247) 2011 520 5,154 7,085 2,125 9,210 8,413 8,413 797 2012 588 5,828 8,011 2,403 10,414 8,413 8,413 2,001 2013 588 5,828 8,011 2,403 10,414 8,413 8,413 2,001 2014 588 5,828 8,011 2,403 10,414 8,413 8,413 2,001 2015 588 5,828 10,414 2,403 12,818 8,413 8,413 4,405 2016 588 5,828 10,414 2,403 12,818 8,413 8,413 4,405 2017 588 5,828 10,414 2,403 12,818 8,413 8,413 4,405 2018 588 5,828 10,414 2,403 12,818 8,413 8,413 4,405 2019 588 5,828 10,414 2,403 12,818 8,413 8,413 4,405 2020 588 5,828 10,414 2,403 12,818 8,413 8,413 4,405 2021 588 5,828 10,414 2,403 12,818 8,413 8,413 4,405 2022 588 5,828 10,414 2,403 12,818 8,413 8,413 4,405 2023 588 5,828 10,414 2,403 12,818 8,413 8,413 4,405 2024 588 5,828 10,414 2,403 12,818 8,413 8,413 4,405 2025 588 5,828 10,414 2,403 12,818 8,413 8,413 4,405
NPV@8% 4,724 46,826 72,017 17,616 89,633 99,870 68,206 168,076 (85,083) Per m2 rented 1.91 2.13 1.46 3.59 (1.82) WACC = 8% AIFC FIRR Negative
Economic Analysis (P ‘000) Constant 2010 prices
Year
Stall Rental Economic Benefits Economic Costs Net Economic Benefits
No. of Stalls
Rentable Area (m2)
Consumer Satisfaction Others Total Investment O&M Total
2005 23,983 23,983 (23,983) 2006 74,308 74,308 (74,308) 2007 200 1,982 4,527 4,527 5,449 5,449 (922) 2008 320 3,172 7,896 500 8,396 8,167 8,167 229 2009 315 3,122 7,392 500 7,892 7,815 7,815 77 2010 492 4,876 8,166 500 8,666 7,512 7,512 1,154 2011 520 5,154 9,210 500 9,710 7,512 7,512 2,198 2012 588 5,828 10,414 500 10,914 7,512 7,512 3,403 2013 588 5,828 10,414 500 10,914 7,512 7,512 3,403 2014 588 5,828 10,414 500 10,914 7,512 7,512 3,403 2015 588 5,828 12,818 500 13,318 7,512 7,512 5,806 2016 588 5,828 12,818 500 13,318 7,512 7,512 5,806 2017 588 5,828 12,818 500 13,318 7,512 7,512 5,806 2018 588 5,828 12,818 500 13,318 7,512 7,512 5,806 2019 588 5,828 12,818 500 13,318 7,512 7,512 5,806 2020 588 5,828 12,818 500 13,318 7,512 7,512 5,806 2021 588 5,828 12,818 500 13,318 7,512 7,512 5,806 2022 588 5,828 12,818 500 13,318 7,512 7,512 5,806 2023 588 5,828 12,818 500 13,318 7,512 7,512 5,806 2024 588 5,828 12,818 500 13,318 7,512 7,512 5,806 2025 588 5,828 12,818 500 13,318 7,512 7,512 5,806
NPV@12% 2,772 27,474 56,558 3,625 59,138 80,651 43,229 123,879 (64,742) Per m2 rented 2.15 2.94 1.57 4.51 (2.36) AIEC EIRR (1.86%)
AIEC = average incremental economic cost, AIFC = average incremental financial cost, EIRR = economic internal rate of return, FIRR = financial internal rate of return, m2 = square meters, NPV = net present value, O&M = operation and maintenance, WACC = weighted average cost of capital.

Appendix 12 53
Ozamis City Public Market Subproject Financial Analysis (P ‘000) Constant 2010 prices
Year
Stall Rental Financial Revenues Financial Costs Net Financial Benefits
No. of Stalls
Rentable Area (m2)
Stall Rental
Other Revenues Total Investment
Incremental O&M Total
2006 3,697 3,697 75,006 75,006 (71,039) 2007 4,052 4,052 99,923 99,923 (95,871) 2008 4,372 4,372 50,600 50,600 (46,228) 2009 846 5,643 22,882 15,468 38,350 2,405 2,405 35,945 2010 846 5,643 22,882 15,468 38,350 6,857 6,857 31,493 2011 1,015 6,771 27,459 15,468 42,927 6,857 6,857 36,070 2012 1,032 6,883 27,913 8,374 36,287 6,857 6,857 29,430 2013 1,032 6,883 27,913 8,374 36,287 6,857 6,857 29,430 2014 1,032 6,883 27,913 8,374 36,287 6,857 6,857 29,430 2015 1,032 6,883 27,913 8,374 36,287 6,857 6,857 29,430 2016 1,032 6,883 27,913 8,374 36,287 6,857 6,857 29,430 2017 1,032 6,883 27,913 8,374 36,287 6,857 6,857 29,430 2018 1,032 6,883 27,913 8,374 36,287 6,857 6,857 29,430 2019 1,032 6,883 27,913 8,374 36,287 6,857 6,857 29,430 2020 1,032 6,883 27,913 8,374 36,287 6,857 6,857 29,430 2021 1,032 6,883 27,913 8,374 36,287 6,857 6,857 29,430 2022 1,032 6,883 27,913 8,374 36,287 6,857 6,857 29,430 2023 1,032 6,883 27,913 8,374 36,287 6,857 6,857 29,430 2024 1,032 6,883 27,913 8,374 36,287 6,857 6,857 29,430 2025 1,032 6,883 27,913 8,374 36,287 6,857 6,857 29,430 2026 1,032 6,883 27,913 8,374 36,287 6,857 6,857 29,430
NPV@8% 8,636 57,601 210,876 76,813 287,689 195,286 51,564 243,030 44,659 Per m2 rented 4.99 3.39 0.90 4.22 0.78 WACC = 8% AIFC FIRR 10.93%
Economic Analysis (P ‘000) Constant 2010 prices
Year
Stall Rental Economic Benefits Economic Costs Net Economic Benefits
No. of Stalls
Rentable Area (m2)
Consumer Satisfaction Others Total Investment O&M Total
2006 3,697 3,697 64,582 64,582 (60,615) 2007 4,052 4,052 85,924 85,924 (81,872) 2008 4,372 4,372 43,794 43,794 (39,422) 2009 846 5,643 38,350 38,350 2,148 2,148 36,203 2010 846 5,643 38,350 38,350 6,123 6,123 32,228 2011 1,015 6,771 42,927 42,927 6,123 6,123 36,804 2012 1,032 6,883 36,287 36,287 6,123 6,123 30,165 2013 1,032 6,883 36,287 36,287 6,123 6,123 30,165 2014 1,032 6,883 36,287 36,287 6,123 6,123 30,165 2015 1,032 6,883 36,287 36,287 6,123 6,123 30,165 2016 1,032 6,883 36,287 36,287 6,123 6,123 30,165 2017 1,032 6,883 36,287 36,287 6,123 6,123 30,165 2018 1,032 6,883 36,287 36,287 6,123 6,123 30,165 2019 1,032 6,883 36,287 36,287 6,123 6,123 30,165 2020 1,032 6,883 36,287 36,287 6,123 6,123 30,165 2021 1,032 6,883 36,287 36,287 6,123 6,123 30,165 2022 1,032 6,883 36,287 36,287 6,123 6,123 30,165 2023 1,032 6,883 36,287 36,287 6,123 6,123 30,165 2024 1,032 6,883 36,287 36,287 6,123 6,123 30,165 2025 1,032 6,883 36,287 36,287 6,123 6,123 30,165 2026 1,032 6,883 36,287 36,287 6,123 6,123 30,165
NPV@12% 5,093 33,971 202,978 202,978 157,332 29,068 186,399 16,579 Per m2 rented 5.98 4.63 0.86 5.49 0.49 AIEC EIRR 13.62%
AIEC = average incremental economic cost, AIFC = average incremental financial cost, EIRR = economic internal rate of return, FIRR = financial internal rate of return, m2 = square meters, NPV = net present value, O&M = operation and maintenance, WACC = weighted average cost of capital.

54 Appendix 12
Kidapawan City Transport Terminal Subproject Financial Analysis (P ‘000) Constant 2010 prices
Year
Financial Revenues Financial Costs Net Financial Benefits
Terminal Fees Stall Rental
Other Revenues Total Investment
Incremental O&M Total
2006 76,983 76,983 (76,983) 2007 571 323 517 1,411 13,555 13,555 (12,144) 2008 4,641 747 1,168 6,556 5,606 5,606 950 2009 5,175 922 1,220 7,317 5,621 5,621 1,696 2010 5,796 1,033 1,366 8,195 5,565 5,565 2,630 2011 5,796 1,033 1,366 8,195 5,565 5,565 2,630 2012 5,796 1,033 1,366 8,195 5,565 5,565 2,630 2013 5,796 1,033 1,366 8,195 5,565 5,565 2,630 2014 6,376 1,136 1,503 9,015 5,565 5,565 3,449 2015 6,376 1,136 1,503 9,015 5,565 5,565 3,449 2016 6,376 1,136 1,503 9,015 5,565 5,565 3,449 2017 7,013 1,249 1,653 9,916 5,565 5,565 4,351 2018 7,013 1,249 1,653 9,916 5,565 5,565 4,351 2019 7,013 1,249 1,653 9,916 5,565 5,565 4,351 2020 7,714 1,374 1,819 10,908 5,565 5,565 5,343 2021 7,714 1,374 1,819 10,908 5,565 5,565 5,343 2022 7,714 1,374 1,819 10,908 5,565 5,565 5,343 2023 8,846 1,512 2,001 11,998 5,565 5,565 6,433 2024 8,846 1,512 2,001 11,998 5,565 5,565 6,433 2025 8,846 1,512 2,001 11,998 5,565 5,565 6,433 2026 9,335 1,663 2,201 13,198 5,565 5,565 7,633
NPV@8% 57,510 10,383 13,975 75,803 82,902 49,566 128,796 (53,992) WACC = 8% FIRR (0.86%) Economic Analysis (P ‘000) Constant 2010 prices
Year
Economic Benefits—Consumer Satisfaction Economic Costs Net Economic Benefits
Terminal Users Stall Vendors Others Total Investment O&M Total
2006 66,284 66,284 (66,284) 2007 571 323 517 1,411 11,656 11,656 (10,245) 2008 4,641 747 1,168 6,556 5,005 5,005 1,551 2009 5,175 922 1,220 7,317 5,019 5,019 2,298 2010 5,796 1,033 1,366 8,195 4,969 4,969 3,226 2011 5,796 1,033 1,366 8,195 4,969 4,969 3,226 2012 5,796 1,033 1,366 8,195 4,969 4,969 3,226 2013 5,796 1,033 1,366 8,195 4,969 4,969 3,226 2014 6,376 1,136 1,503 9,015 4,969 4,969 4,046 2015 6,376 1,136 1,503 9,015 4,969 4,969 4,046 2016 6,376 1,136 1,503 9,015 4,969 4,969 4,046 2017 7,013 1,249 1,653 9,916 4,969 4,969 4,947 2018 7,013 1,249 1,653 9,916 4,969 4,969 4,947 2019 7,013 1,249 1,653 9,916 4,969 4,969 4,947 2020 7,714 1,374 1,819 10,908 4,969 4,969 5,939 2021 7,714 1,374 1,819 10,908 4,969 4,969 5,939 2022 7,714 1,374 1,819 10,908 4,969 4,969 5,939 2023 8,846 1,512 2,001 11,998 4,969 4,969 7,030 2024 8,846 1,512 2,001 11,998 4,969 4,969 7,030 2025 8,846 1,512 2,001 11,998 4,969 4,969 7,030 2026 9,335 1,663 2,201 13,198 4,969 4,969 8,229
NPV@12% 36,886 6,691 9,053 52,631 68,474 29,235 97,708 (45,077) EIRR 1.36% EIRR = economic internal rate of return, FIRR = financial internal rate of return, NPV = net present value, O&M = operation and maintenance, WACC = weighted average cost of capital.

Appendix 12 55
Panabo City Transport Terminal Subproject Financial Analysis (P ‘000) Constant 2010 prices
Year
Financial Revenues Financial Costs Net Financial Benefits
Terminal Fees Stall Rental
Other Revenues Total Investment
Incremental O&M Total
2006 28,444 28,444 (28,444) 2007 7,579 80 118 7,777 24,471 24,471 (16,694) 2008 8,930 129 728 9,787 3,020 3,020 6,767 2009 10,351 469 997 11,817 4,348 4,348 7,469 2010 9,964 448 1,052 11,464 4,251 4,251 7,213 2011 9,964 448 1,052 11,464 4,251 4,251 7,213 2012 9,964 448 1,052 11,464 4,251 4,251 7,213 2013 9,964 448 1,052 11,464 4,251 4,251 7,213 2014 9,964 448 1,052 11,464 4,251 4,251 7,213 2015 9,964 448 1,052 11,464 4,251 4,251 7,213 2016 9,964 448 1,052 11,464 4,251 4,251 7,213 2017 9,964 448 1,052 11,464 4,251 4,251 7,213 2018 9,964 448 1,052 11,464 4,251 4,251 7,213 2019 9,964 448 1,052 11,464 4,251 4,251 7,213 2020 9,964 448 1,052 11,464 4,251 4,251 7,213 2021 9,964 448 1,052 11,464 4,251 4,251 7,213 2022 9,964 448 1,052 11,464 4,251 4,251 7,213 2023 9,964 448 1,052 11,464 4,251 4,251 7,213 2024 9,964 448 1,052 11,464 4,251 4,251 7,213 2025 9,964 448 1,052 11,464 4,251 4,251 7,213 2026 9,964 448 1,052 11,464 4,251 4,251 7,213
NPV@8% 95,040 3,801 9,142 99,985 47,317 36,823 81,412 18,573 WACC = 8% FIRR 13.32% Economic Analysis (P ‘000) Constant 2010 prices
Year
Economic Benefits—Consumer Satisfaction Economic Costs Net Economic Benefits
Terminal Users
Stall Vendors Others Total Investment O&M Total
2006 24,490 24,490 (24,490) 2007 7,579 80 118 7,777 21,043 21,043 (13,266) 2008 8,930 129 728 9,787 2,697 2,697 7,090 2009 10,351 469 997 11,817 3,882 3,882 7,935 2010 9,964 448 1,052 11,464 3,796 3,796 7,668 2011 9,964 448 1,052 11,464 3,796 3,796 7,668 2012 9,964 448 1,052 11,464 3,796 3,796 7,668 2013 9,964 448 1,052 11,464 3,796 3,796 7,668 2014 9,964 448 1,052 11,464 3,796 3,796 7,668 2015 9,964 448 1,052 11,464 3,796 3,796 7,668 2016 9,964 448 1,052 11,464 3,796 3,796 7,668 2017 9,964 448 1,052 11,464 3,796 3,796 7,668 2018 9,964 448 1,052 11,464 3,796 3,796 7,668 2019 9,964 448 1,052 11,464 3,796 3,796 7,668 2020 9,964 448 1,052 11,464 3,796 3,796 7,668 2021 9,964 448 1,052 11,464 3,796 3,796 7,668 2022 9,964 448 1,052 11,464 3,796 3,796 7,668 2023 9,964 448 1,052 11,464 3,796 3,796 7,668 2024 9,964 448 1,052 11,464 3,796 3,796 7,668 2025 9,964 448 1,052 11,464 3,796 3,796 7,668 2026 9,964 448 1,052 11,464 3,796 3,796 7,668
NPV@12% 64,060 2,481 6,006 72,547 38,642 21,560 60,202 12,345 FIRR 17.26% EIRR = economic internal rate of return, FIRR = financial internal rate of return, NPV = net present value, O&M = operation and maintenance, WACC = weighted average cost of capital.