PROJECT 4-11 FINAL REPORT
29
PROJECT 4-11 FINAL REPORT TENSILE STRENGTH OF EMBEDDED ANCHOR GROUPS DAVID A. GRILLI, AND AMIT M. KANVINDE DEPARTMENT OF CIVIL AND ENVIRONMENTAL ENGINEERING UNIVERSITY OF CALIFORNIA, DAVIS, CA 95616 JUNE 1, 2015
Transcript of PROJECT 4-11 FINAL REPORT

PROJECT 4-11 FINAL REPORT
TENSILE STRENGTH OF EMBEDDED ANCHOR GROUPS
DAVID A. GRILLI, AND AMIT M. KANVINDE
DEPARTMENT OF CIVIL AND ENVIRONMENTAL ENGINEERING
UNIVERSITY OF CALIFORNIA, DAVIS, CA 95616
JUNE 1, 2015

EXECUTIVE SUMMARY
Steel column bases in seismically braced frames and other similar structures must be designed
for high uplift or tensile forces. A common detail for this connection involves anchors embedded
in the footing with a plate at their lower end, also embedded in the footing. This detail is
increasingly prevalent in construction practice, since it is exempt from the strength calculations
of ACI 318 Appendix D. However, no experimental data or validated design guidelines are
available to support the design of this detail. As a consequence, approaches from other similar
situations (such as punching shear of slabs) are adapted for this purpose. To address this practical
need, this report presents tension tests on two full-scale specimens featuring this anchorage
detail. The main variable examined in the experiments is the embedment depth, such that two
depths – 12 inches and 18 inches, are tested. The test specimens exhibit a classic concrete failure
cone extending upwards from the edges of the embedded base plate. The experimental data
provides evidence that the anchorage detail provides an effective means to carry high tensile
loads. The data is evaluated against three strength models, including the ACI-318 Appendix D
method, the ACI 318 punching shear equation, and the Concrete Capacity Design (CCD)
method. It is determined that the Appendix D method is significantly conservative (average test-
predicted ratio 1.34), because it does not consider the beneficial effects of the embedded plate.
On the other hand, the punching shear method is unconservative (average test-predicted ratio
0.62) because it does not explicitly incorporate the size effect in concrete. The CCD method
shows most promise, with an average test-predicted ratio of 0.99. Limitations of the study
include the small size of the test set, and the absence of reinforcement in the specimens.
2

ACKNOWLEDGMENTS
The authors are grateful to the Charles Pankow Foundation and the American Institute of Steel
Construction for providing major Funding for this project. Supplementary funding was provided
by graduate fellowships at the University of California, Davis. The Structural Engineers
Association of California (SEAOC) supported the proposal to the major funding sponsors. The
authors also thank Bill Sluis and Daret Kehlet, technical personnel at UC Davis for contributing
to this project. The authors acknowledge their contributions, as well as those of the Industry
Advisory Committee of the project, including Geoff Bomba of Forell Elsesser Engineers, Ryan
Kersting of Buehler and Buehler Structural Engineers, Paul Cordova of Simpson, Gumpertz and
Heger. The findings and opinions presented in this report are solely those of the authors and not
of the sponsors or those acknowledged above.
3

INTRODUCTION
Column bases in steel frames (particularly braced frames) must often be designed for
high tensile (i.e., uplift) forces. These forces may be a result of overturning moments induced by
high-seismic or wind events, or in the case of concentrically braced frames, for the development
of the tensile capacity of diagonal braces as required by current design provisions (AISC-341,
2010). Various detailing alternatives are available for transferring this tensile force from the steel
column into the concrete footing below. Figures 1a and b show two such details that are used in
current construction practice.
Figure 1a shows a detail that uses individual standard headed anchors or anchor rods with
nuts at the embedded ends. While convenient to fabricate, these details are problematic if large
tensile loads (i.e., greater than 50 kips or so) must be resisted. This is because: (1) the strength is
calculated as per ACI 318-14 (ACI, 2014) Appendix D as the group capacity based on
individual, standard headed anchor bolts or nutted anchor rods. In many cases, the embedment
Figure 1 – (a) Base connection with individual anchors, (b) base connection with anchors connected to an embedded plate
(a) (b)
dembed
4
depth or number of anchor rods required by this provision becomes impractical, and (2) there is
an apparent dichotomy wherein the strength calculation of a similar detail for reinforced concrete
columns with hooked reinforcement bars extending into the footing is not subject to ACI 318
Appendix D requirements; only the rebar tensile strength is checked. This results in strength
estimates that are significantly higher than those determined as per ACI 318 Appendix D.
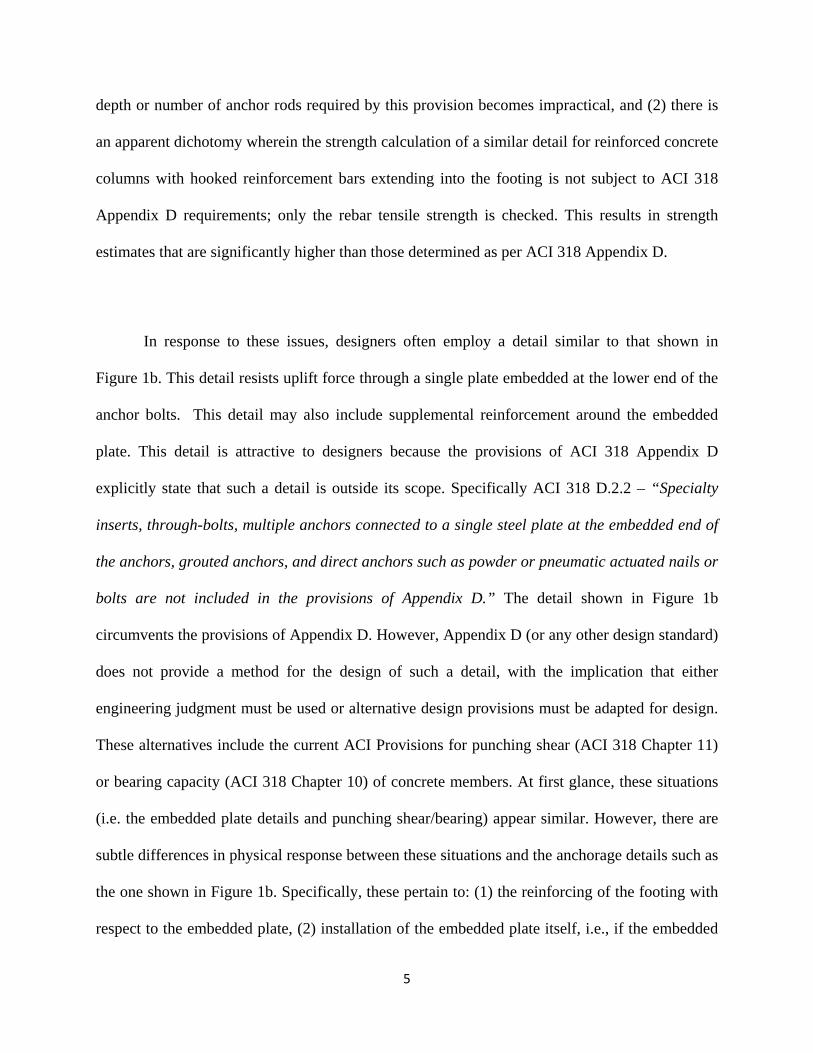
In response to these issues, designers often employ a detail similar to that shown in
Figure 1b. This detail resists uplift force through a single plate embedded at the lower end of the
anchor bolts. This detail may also include supplemental reinforcement around the embedded
plate. This detail is attractive to designers because the provisions of ACI 318 Appendix D
explicitly state that such a detail is outside its scope. Specifically ACI 318 D.2.2 – “Specialty
inserts, through-bolts, multiple anchors connected to a single steel plate at the embedded end of
the anchors, grouted anchors, and direct anchors such as powder or pneumatic actuated nails or
bolts are not included in the provisions of Appendix D.” The detail shown in Figure 1b
circumvents the provisions of Appendix D. However, Appendix D (or any other design standard)
does not provide a method for the design of such a detail, with the implication that either
engineering judgment must be used or alternative design provisions must be adapted for design.
These alternatives include the current ACI Provisions for punching shear (ACI 318 Chapter 11)
or bearing capacity (ACI 318 Chapter 10) of concrete members. At first glance, these situations
(i.e. the embedded plate details and punching shear/bearing) appear similar. However, there are
subtle differences in physical response between these situations and the anchorage details such as
the one shown in Figure 1b. Specifically, these pertain to: (1) the reinforcing of the footing with
respect to the embedded plate, (2) installation of the embedded plate itself, i.e., if the embedded
5

plate needs to be cast in a protective lean mix below the bottom of the footing prior to the footing
pour, such that the plate is actually bearing against a cast surface rather than cast within the
footing, and (3) size effects in concrete, i.e., the embedment of these connections is often larger
than seen in slab/punching shear situations, and thus these may be weaker on a unit basis as
compared to situations for which the punching shear approaches have been developed. In the
absence of guidance for the design of these anchorages in ACI 318 or any other design codes,
and the absence of test data that demonstrate their strength and response, engineers and review
agencies are often required to make design choices that are expensive and possibly conservative,
e.g., requiring the plate to be positioned such that it bears on the bottom of the concrete podium.
Motivated by these problems, this report presents results on two full-scale tests on anchorage
details similar to the ones shown in Figure 1b. The primary objectives of this study are –
1. To develop fundamental understanding of the failure modes and force transfer mechanisms in
anchor group details subjected to tension uplift, based on large/full scale experimental data.
2. To develop, validate and establish design provisions for these details that are otherwise
specifically excluded from ACI 318 Appendix D.
3. To demonstrate details that can economically achieve design strength for high uplift forces.
The next section describes the experiments, and the subsequent section evaluates their results
relative to commonly used strength prediction models. The report concludes by summarizing
possible approaches for design.
6

EXPERIMENTAL PROGRAM
Two large-scale experiments were conducted to realize the objectives of the study. The
primary variable considered was the embedment depth embedd indicated schematically in Figure
1b. In this study, two embedment depths were considered, i.e., embedd = 12 inches, 18 inches.
Figure 2 shows a photograph of the test setup and specimen prior to testing, whereas Figure 3
schematically shows various detailing/reinforcement aspects of the specimens. The photograph
in Figure 2 shows Test #1; the test specimen for Test #2 appears identical, since the only
difference is in the embedment depth that is not visible.
Specimen
Loading frame
Loading beam
Actuator
Spacer block
Anchors extending into specimen
Strong floor
Figure 2 – Photograph of Test Setup
7

Test setup
Referring to Figures 2 and 3, the key aspects of the test setup are as follows –
1. Both specimens featured blocks that measured 40 (height) x 140 x 116 inches. The large size
of the block was necessitated by the following considerations –
a. In plan, the large dimension was necessary to ensure that the failure cone was fully
accommodated within the footing, thereby avoiding edge effects. In fact, the size of
the block was large enough such that the zones of compressive stress induced by the
tie-down rods (shown in Figure 3b) had minimal effect on the possible failure cone.
b. In elevation, a key consideration was to ensure that the underside of the specimen (i.e.
below the applied load) was anchored to the strong floor, such that failure of the
footing did not occur due to bending. This is an especially important consideration, to
ensure that measured experimental strength corresponds to pure tensile breakout
failure that is (to the extent possible) unaffected by boundary conditions.
(a)
(b)
Figure 3 – Specimen details (a) plan and (b) two elevations
3 x 28 x 28 inch embedded plate
40
140
#5 top rebar mat
8 tie downs, embedded 18 inches from base (central tie down in the row not shown in Fig 3b, since section is taken through center of specimen)
116
Test floor
(a) (b)
8

2. Following from the point above, the anchor system was elaborately designed with
consideration of two competing effects: (1) spacing the outside anchors as far out as possible
to minimize interaction with the failure cone, and (2) including anchors close to line of action
of the loads to minimize bending of the block. These considerations were realized by
installing tie-downs projecting upwards from the strong floor (but not extending all the way
up to the top of the block) over which the specimen was cast in place. These tie downs
(whose locations are shown in Figure 3) had an embedded plate attached to their top surface
to enable engagement with the specimen. In this way, the failure cone remained above the
compression field induced below the tie downs.
3. The loading apparatus, as shown in Figure 2 included a cross beam and a frame, between
which a hydraulic cylinder actuator (with 1000 kip capacity) was inserted such that the
loading frame could be lifted up. A 3-inch plate was attached to the lower surface of the
loading frame. Six anchor rods attached to this plate were embedded in the concrete, and
attached to the embedded plate, which in turn exerted the uplift forces on the concrete. The
embedded plates were identical in both test specimens, and measured 3 x 28 x 28 inches. The
anchor rods were A722 Grade 150 rods of 1-3/8 inch diameter and designed to remain elastic
during the loading.
4. Reinforcement was provided in the top layer. This consisted of a light rebar mat, which is
reflective of current detailing practice for concrete footings. The reinforcement was used to
provide minor resistance against uplift, as well as to mitigate surface cracking. No vertical
reinforcement was provided in the breakout zone. The main purpose of this was to isolate the
effect of the concrete resistance in a clean way, such that it would be transferable to design
situations with varying reinforcement wherein the contribution of reinforcement is addressed
9

separately. A similar rebar mat was provided in the bottom layer, along with an additional
middle layer mat beneath the embedded plate. Vertical stirrups connected the middle and
bottom layers to provide additional strength to avoid breakout on the bottom side of the
concrete blocks.
5. Both specimens were cast on the same day, although tested on different days. Test #1 was
tested on day 28 with respect to the pour, whereas Test #2 was tested on day 31. Standard test
cylinders were taken from each of these pours to measure the compressive strength of
concrete 'cf ; results from these ancillary tests are presented in a subsequent section.
6. The specimens were all loaded monotonically, with an approximate rate of 1 kip per second.
Test Instrumentation
The load in the specimens was monitored using a pressure gage. As a secondary
measurement of load, a linear strain gage was attached to the top surface of the loading beam,
which remained elastic throughout the loading. Displacement transducers were affixed to 3
locations on the top surface of the concrete, as well as to the top plate to measure upward
displacement of the loading frame. A camera was suspended directly above the test setup to
capture crack formation in the entire block. Another camera captured an elevation (profile) view
of the test to observe vertical displacements of the test equipment and concrete failure cone.
Based on these instruments, a load deformation curve was generated, results from which are
discussed in a subsequent section.
10

Ancillary Tests
Six standard, 6 x 12 inch concrete cylinder samples were collected and tested at the 28-
day cure mark. For the construction of the specimen blocks, a total of 3 trucks were required, and
2 samples from each truck were tested. The analysis of test data relative to the models
(discussed in a subsequent section) is based on the average value of 'cf = 4,336 psi (standard
deviation of 282 psi) for the cylinder samples for each test. The low standard deviation suggests
a relatively uniform strength throughout the specimen block. The weight density of the various
samples was (on average) 145 lb/ft3, which is consistent with plain structural concrete used in
practice.
Test Results
Load-displacement curves for both experiments are shown in Figure 4, whereas peak
loads (denoted maxtestP - also shown on the Figure) are summarized in Table 1. Both tests showed
similar response, wherein little physical damage was observable in the initial elastic region of
loading. Failure was observed in the form of (1) a sudden drop in load (2) appearance of a crack
on the top surface of the concrete (3) a lifting of the “failure cone” by approximately 2 inches.
The failure of Test #2, with embedd = 18 inches, was somewhat more sudden as compared to that
of Test #1. Other than the concrete failure, all components in the setup (i.e., anchors, embedded
plate, loading beam) remained elastic by design.
11

0
100
200
300
400
500
600
0 0.1 0.2 0.3 0.4 0.5
Loa
d (k
ips)
Frame Displacement (inches)
dembed = 18”
dembed = 12”
Figure 4 – Load deformation curves of the two specimens
12

Figures 5a and b show post-test photographs of Test #1 and #2 taken from a high angle
above the specimens, illustrating the entire failure surface after the loading beam had been
removed. Figures 6a and b show similar profile photographs illustrating the uplift of the concrete
cone. Based on post-test surface mapping, profiles of each failure cone are illustrated in Figures
7a and b. Referring to the Figures and physical measurements of the failure cone, the
approximate angle of the failure cone surface with respect to the horizontal is 27 degrees for Test
#1 and 36 degrees for Test #2.
Figure 5 – Overhead view of breakout surface for (a) 12-inch embedment and (b) 18-inch embedment
Figure 6 – Profile view of breakout surface for (a) 12-inch embedment and (b) 18-inch embedment
(a)
(b)
(a)
(b)
13

STRENGTH MODELS
Referring to the introductory discussion, a major objective of this report is to provide
support for the development of strength characterization approaches for these anchorages.
Accordingly, three strength characterization approaches are evaluated against the test data. These
are (1) The ACI 318 Appendix D approach for the breakout strength of anchor groups, (2) The
ACI 318 Chapter 11 punching shear equation, and (3) The Concrete Capacity Design (CCD)
approach proposed by Fuchs et al., (1995). The former two are selected based on their prevalence
in design practice, whereas the third is selected based on its promise in characterizing the
strength of a large variety of concrete embedments and fastenings, as shown by previous studies
(e.g., Gomez et al., 2009). Each of these methods is now briefly described, and the resulting
strength estimates are compared to test data.
27.2º
`
36.4º
`
Figure 7 – Map of breakout cone for (a) 12-inch embedment and (b) 18-inch embedment
(a)
(b)
14

Method 1: ACI 318 Appendix D provides the following equation (which has been adapted
below to the current test parameters), to predict the breakout strength of an anchor group in
concrete (loaded concentrically, cast-in anchors, no edge effects) –
bNcNco
NcDACIn N
AAP ××=−
,318 ψ (1)
where, for 11 inches < embedd < 23 inches,
( ) 3/5'16 embedcb dfN ××= (2)
In the above equation,
NcA : Projected concrete failure area of a group of anchors
NcoA : Projected concrete failure area of a single anchor
Nc,ψ : 1.25 for cast-in anchors without cracking at service loads
This method was derived based on both the tensile capacity of concrete and fracture
mechanics concepts. The projected area is defined by projecting planes from the anchorage depth
to the free surface at 35° angles. Modification factors are used when the planes intersect free side
surfaces. This method is based on experimental data on embedded single anchors and anchor
groups (Klingner 1982, Cook et al. 1992, Fuchs et al. 1995, Farrow et al. 1995, Zhang et al.
2001, Anderson et al. 2005, Eligehausen et al. 2006, Lee et al. 2007, Ozbolt et al. 2007) and as a
result, is accurate for deeply embedded single anchors and anchor groups. For the same reason,
this approach cannot account for the favorable effects of connecting the embedded anchors to a
common plate. In fact, the strength estimate implied by Equation (1) above is identical to the
calculations that would result from considering the anchor group without a plate present. It may
15

be argued that this is conservative, since it does not account for (1) the larger bearing area of the
concrete that may delay fracture initiation and (2) a greater degree of confinement in the concrete
above the plate. While the method does not explicitly account for the plate as a bearing surface,
the plate may be considered effective as a washer, to determine the location from which the
failure surface originates (as per provision D.5.2.8 of the Appendix). As per this provision, the
effective dimension of this plate or washer may be considered equal to the thickness of the
attached plate (3” in this case).
Method 2: ACI 318 Chapter 11 provides provisions for punching shear, to be used in the case
where a column exerts a vertical load on a reinforced concrete slab. As discussed in the
introductory remarks, this method is sometimes used for anchorage design, since the modes of
failure appear to be similar. As per this approach, the applicable equation is –
embedcPS
n dbfP ×××= 0'4
(3)
The equations have been greatly simplified for ease of design, and are based on fitting to
experimental data (ACI-ASCE 326, 1962). Strength predictions are based on the depth of the
slab, concrete material properties, and a “critical section” based on the loading area and depth of
the slab. The formulation is intended to reduce the dependency of strength on ratio of column
size to slab depth. The critical section is defined as the area that minimizes the perimeter ,
while maintaining a distance of 2/embedd to the edges or corners of the column or loading area.
This may be interpreted to imply that failure occurs when a tensile stress of '4 cf× is reached
over the projected area of a 045 failure cone emanating from the edges of the embedded plate.
ob
16

For the particular geometry of the specimens used in this study, 0b may be calculated as per the
following equation –
)"28(40 embeddb +×= (4)
However, a closer inspection of the sources (ACI-ASCE 326, 1962) used to formulate
this approach reveal two interesting factors. First, it does not explicitly incorporate fracture
mechanics or the “size effect” in concrete (Bažant, 1984) which implies that the unit strength (or
failure stress) of geometrically self-similar concrete components varies inversely with their size,
because failure is controlled by localized fracture, rather than large-scale yielding. The presence
of reinforcement mitigates this effect by distributing deformations. Second, this equation is based
on 198 tests on concrete slabs which were reinforced and included a large set of data on slabs
thinner than 10-12 inches. When considered together, the above two points present an obvious
challenge in extrapolating the equation to the anchorages, which have significantly deeper
embedment, and are therefore likely to be weaker on a unit basis.
Method 3: Another approach, which explicitly considers the size effect is based on a method
originally proposed Fuchs et al. (1995). This method, referred to as Concrete Capacity Design
(CCD) method has been demonstrated to characterize concrete failure strength for a wide variety
of fastenings, including shear lugs (Gomez et al., 2009). In fact, the method used in ACI-318
Appendix D is partially based on the CCD method. The nominal breakout capacity of concrete
for cast-in anchors as derived in the CCD method, adapted to the conditions of the tests, can be
reduced to the following equation,
17
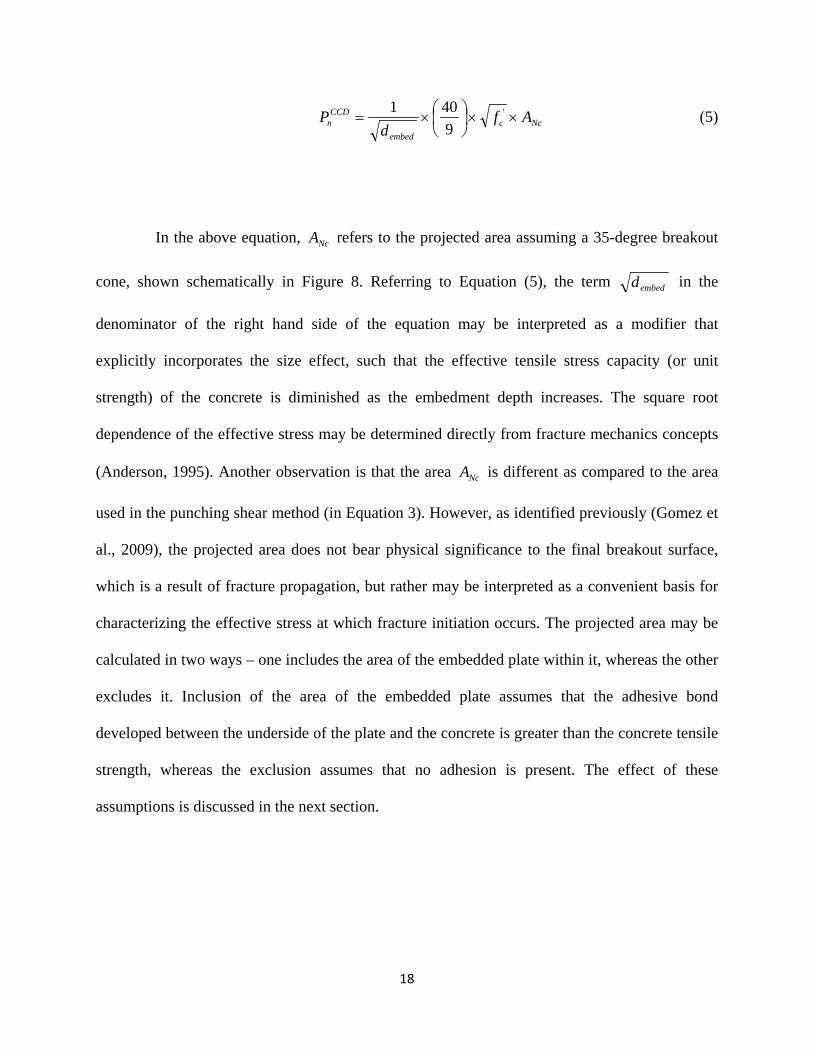
Nccembed
CCDn Af
dP ××
×= '
9401 (5)
In the above equation, NcA refers to the projected area assuming a 35-degree breakout
cone, shown schematically in Figure 8. Referring to Equation (5), the term embedd in the
denominator of the right hand side of the equation may be interpreted as a modifier that
explicitly incorporates the size effect, such that the effective tensile stress capacity (or unit
strength) of the concrete is diminished as the embedment depth increases. The square root
dependence of the effective stress may be determined directly from fracture mechanics concepts
(Anderson, 1995). Another observation is that the area NcA is different as compared to the area
used in the punching shear method (in Equation 3). However, as identified previously (Gomez et
al., 2009), the projected area does not bear physical significance to the final breakout surface,
which is a result of fracture propagation, but rather may be interpreted as a convenient basis for
characterizing the effective stress at which fracture initiation occurs. The projected area may be
calculated in two ways – one includes the area of the embedded plate within it, whereas the other
excludes it. Inclusion of the area of the embedded plate assumes that the adhesive bond
developed between the underside of the plate and the concrete is greater than the concrete tensile
strength, whereas the exclusion assumes that no adhesion is present. The effect of these
assumptions is discussed in the next section.
18

`
Elevation
Plan
Force 35o
Embedded plate
Projected area Anc
Figure 8 – Effective projected area for CCD method (may or may not include area of plate)
dembed
19

DISCUSSION
Test-predicted ratios for the three models are presented in Table 1.
Table 1 – Test results and comparison with strength prediction methods
embedd (in)
maxtestP
(kips)
Test-Predicted Ratios
DACIntest PP −318max / PS
ntest PP /max CCDntest PP /max
12 317 1.29(1.58)* 0.63 0.92 (1.13)#
18 495 1.39(1.61)* 0.57 1.07 (1.21)#
Mean 1.34(1.60)* 0.60 0.99(1.17)#
Coefficient of Variation 0.05(0.01)* 0.05 0.11(0.05)# *Value in parentheses calculated without considering increase in perimeter of projected area due to plate thickness as allowed by (ACI 318 D.5.2.8). #Value in parentheses calculated by excluding area of plate from projected area.
Referring to these, the following observations may be made –
1. The ACI-318 Appendix D method is quite conservative, such that the test-predicted ratios
DACIntest PP −318max / are determined to be 1.29 and 1.39 for Test #1 and #2 respectively
(average of 1.34). This is an important observation, confirming the concerns about the
Appendix D method raised in the introduction, because it provides empirical evidence
that the method may not be economical for designing connections with an embedded
plate. It is important to note here, that the attached plate in these tests is fairly thick (3”).
As a result, the use of provision D.5.2.8, which allows the consideration of the plate
thickness as an effective washer dimension, significantly adds to the strength. If the
strength is calculated without considering this increase in perimeter (i.e., projecting the
20

failure area from the anchor rods), then the conservatism of the ACI method is increased,
such that the average test-predicted ratio is 1.60, as indicated in Table 1.
2. The ACI punching shear method on the other hand, is significantly unconservative, such
that the test-predicted ratios PSntest PP /max are 0.63 and 0.57 for Test #1 and #2 respectively.
This suggests that the method is inappropriate for designing these connections. A closer
inspection of the scientific basis for the punching shear method indicates that it is based
on 198 tests of slabs, of which many are thin as compared to the embedment depth of the
anchorages. Moreover, it fails to incorporate the size effect such that it cannot be
extrapolated to thicker slabs or embedments. Thus, the unconservatism of the method is
not surprising.
3. The CCD method appears to be the most accurate of the three methods considered, such
that the test-predicted ratio CCDntest PP /max are 0.92 and 1.07 for Test #1 and #2 respectively,
resulting in an average CCDntest PP /max value of 0.995. If the area of the plate is excluded
from the projected area, the average test-predicted is 1.17, suggesting that significant
adhesion may be present between the steel and the concrete. This is consistent with
similar results on concrete-steel adhesion by FHWA (2000), through the use of “pull-off”
tests that indicate adhesion stresses in the range of 100-150 psi, which are greater than the
effective tensile stress used in the CCD method.
4. For each of the models, the test-predicted ratios are similar for both tests, indicating that
the epistemic error introduced due to any of the models is not significantly impacted by
the embedment depth.
21

It is informative to compare the assumptions underlying the punching shear method and the
CCD method, since they provide insight into the physical processes controlling failure.
Specifically, the punching shear method assumes that the concrete failure strength is directly
proportional to the projected area of the 45-degree cone, with the implication that a uniform
tensile stress is mobilized over the failure surface. Research (Bažant, 1984) has shown that this
assumption is realistic only when the characteristic specimen dimension (embedment depth in
this case) is within 10-20 times the aggregate size, i.e. approximately 6-8 inches. As a point of
interest, the test data used to develop the punching shear method includes a large number of
components or slabs thinner than 8 inches. For larger components, failure is controlled by
fracture mechanics wherein failure initiates over a smaller area and then propagates as the failure
cone. As a result, the effective failure stress (when considered over a projected area) is lower.
The CCD method explicitly captures this effect.
SUMMARY AND CONCLUSIONS
Two full scale experiments were conducted to examine the tensile capacity of anchorage
details with anchor bolt groups connected by a plate embedded within a concrete footing. The
anchorage type examined in this study is commonly used at the base of columns in braced frames
where large uplift forces must be resisted. The tests were motivated by the lack of guidance in
design standards for such a detail and by the challenges in adapting design methods originally
developed for other types of details.
22

The main variable interrogated in the experiments was the embedment depth, such that
two values 12 inches, and 18 inches were investigated. The specimens were composed of 6
anchor rods (1-3/8” diameter, 150 grade) connected to a 3” X 28” X 28” plate embedded within
the concrete. The specimens were designed with minimal reinforcement (to isolate the concrete
strength), and were sized to minimize the effect of boundary conditions or specimen bending on
the pullout strength. Both tests showed a similar mode of failure with a concrete failure cone
emanating at approximately 30 degrees from the edges of the embedded plate.
The specimen strengths were evaluated against three strength characterization
approaches. It was determined that the Concrete Capacity Design (CCD) method developed by
Fuchs et al., (1995) provides excellent agreement with test data. On the other hand, the ACI 318-
Appendix D method is significantly conservative, presumably because it does not consider the
beneficial effects of the embedded plate. Both these methods consider the size effect in concrete,
which recognizes that larger components exhibit lower unit strength. The punching shear
equation provided in ACI 318 Chapter 11 is unconservative, and is not appropriate for design,
since it does not explicitly incorporate the size effect.
The unconservatism of the punching shear equation has implications beyond the
anchorages, because these equations are routinely used in reinforced concrete slab design. While
most reinforced concrete slabs are relatively thin (less than 8 inches thick), the application of
these equations to thicker slabs or conditions must be carefully considered. For example, two-
way joist slabs (also known as coffered slabs or “waffle-slabs”) are often constructed with solid
23

heads (or drop panels) at the top of the column. At this location, the depth of the slab is
significantly greater than 8 inches, suggesting that the punching shear equations may
unconservative for these situations.
Finally, it is important to recognize the limitations of this study in interpreting its results.
The most obvious limitation is the size of the test sample (i.e., two tests), which was controlled
by the physical size and expense of these specimens relative to the budgetary constraints. A
consequence of this small sample size is that other variables such are plate shapes and sizes,
anchor rod layouts, edge distances, or the use of other embedments instead of a plate (e.g.,
interconnected channels) were not examined. Another consequence is that it in the absence of
replicate tests, it is difficult to isolate the inherent variability in experimental data from epistemic
bias in the models evaluated against the data. As a result, the test data, in itself, cannot be used to
calibrate resistance (i.e., −φ ) factors. Moreover, the test specimens did not contain vertical
reinforcement. This was a deliberate decision, considering that these experiments are the some of
the first of their kind, and intended to establish fundamental, baseline response of the concrete
itself. It is anticipated that the presence of reinforcement will increase the strength through two
mechanisms (1) the additional yielding strength provided by the rebar, and (2) the mitigation of
the size effect in concrete. An explicit incorporation of these effects will require additional
testing, as well as finite element simulation to generalize the results. These are recommended
areas for future work.
24

NOTATION
NcA : Projected concrete failure area of a group of anchors for ACI 318
Appendix D and CCD methods (in2)
NcoA : Projected concrete failure area of a single anchor for ACI 318 Appendix D
Method (in2)
0b : Effective perimeter for the punching shear approach (in.)
embedd : Embedement depth; distance from the concrete surface to top surface of
the embedded plate (in.)
'cf : Compressive strength of concrete (psi)
N : Length dimension of base plate (in.)
maxtestP : Maximum load determined from experiment (kips)
DACInP −318 : Strength estimated as per ACI 318 Appendix D (kips)
CCDnP : Strength estimated as per the CCD approach (kips)
PSnP : Punching shear strength estimated as per ACI 318 Chapter 11 (kips)
Nc,ψ : 1.25 for cast-in anchors without cracking at service loads for ACI 318
Appendix D method
25

REFERENCES
ACI Committee 318 (2014). Building Code Requirements for Structural Concrete (ACI 318-14)
and Commentary (ACI 318R-14), American Concrete Institute, Farmington Hills, MI.
ACI Committee 349 (2013). Building Code Requirements for Structural Concrete (ACI 349-13)
and Commentary (ACI 349R-13), American Concrete Institute, Farmington Hills, MI.
ACI-ASCE Committee 326 (now 426), “Shear and Diagonal Tension,” ACI Journal,
Proceedings V. 59, No. 1, Jan. 1962, pp. 1-30; No. 2, Feb. 1962, pp. 277-334; and No. 3,
Mar. 1962, pp352-396.
AISC (2010). Seismic Provisions for Structural Steel Buildings – AISC 341, American Institute
of Steel Construction, Chicago, IL.
Anderson, N. S., and Meinheit, D. F., “Pryout Capacity of Cast-In Headed Stud Anchors,” PCI
Journal, V. 50, No. 2, Mar.-Apr. 2005, pp. 90-112.
Anderson, T. L., Fracture Mechanics: Fundamentals and Applications. Boca Raton : CRC Press
1995. 2nd ed.
Bažant, Z.P. (1984), “Size Effect in Blunt Fracture: Concrete, Rock, Metal,” Journal of
Engineering Mechanics, ASCE, 110(4), 518–535.
Cook, R. A., and Klingner, R. E., “Behavior of Ductile Multiple-Anchor Steel-to-Concrete
Connections with Surface-Mounted Baseplates,” Anchors in Concrete: Design and
Behavior, SP-130, American Concrete Institute, Farmington Hills, MI, 1992, pp. 61-122.
Eligehausen, R.; Mallée, R.; and Silva, J., Anchorage in Concrete Construction, Ernst & Sohn (J.
T. Wiley), Berlin, May 2006, 380 pp.
26
Farrow, C. B., and Klingner, R. E., “Tensile Capacity of Anchors with Partial or Overlapping
Failure Surfaces: Evaluation of Existing Formulas on an LRFD Basis,” ACI Structural
Journal, V. 92, No. 6, Nov.-Dec. 1995, pp. 698-710.
Federal Highway Administration (2000). “Tensile Bond Strength of a High Performance
Concrete Bridge Deck Overlay,” United States Department of Transportation, FHWA
Project #9904, Project Report.
Fuchs, W., Eligehausen, R. and Breen, J.E. (1995), “Concrete Capacity Design (CCD) Approach
for Fastening to Concrete,” ACI Structural Journal, Vol. 92, No. 1, pp. 73–94.
Gomez, I.R., Kanvinde, A.M., Smith, C., and Deierlein, G.G. (2009), “Shear Transfer in
Exposed Column Base Plates,” Technical Report submitted to the American Institute of
Steel Construction, AISC, Chicago, IL.
Klingner, R.E., Mendonca, J.A., and Malik, J.B. (1982), “Effect of Reinforcing Details on the
Shear Resistance of Anchor Bolts Under Reversed Cyclic Loading,” Journal of American
Concrete Institute, Vol. 79, No. 1 (January-February 1982), pp. 3-12.
Lee, N. H.; Kim, K. S.; Bang, C. J.; and Park, K. R., “Tensile-Headed Anchors with Large
Diameter and Deep Embedment in Concrete,” ACI Structural Journal, V. 104, No. 4,
July-Aug. 2007, pp. 479-486.
Ožbolt, J., Eligehausen, R., Periškić, G., and Mayer, U. (2007), “3D FE Analysis of Anchor
Bolts with Large Embedment Depths,” Engineering Fracture Mechanics, 74, 168-178.
Zhang, Y.G., Klingner, R.E., and Graves, H.L. (2001), “Seismic Response of Multiple-Anchor
Connections to Concrete,” ACI Structural Journal, Volume 98, Issue 6, pp. 811-822.
27

APPENDIX A – STRENGTH CALCULATIONS
Method 1: ACI 318 Appendix D
bNcNco
NcDACIn N
AAP ××=−
,318 ψ
, 1.25c Nψ =
29Nco embedA d= ×
2(( 2 ) 2 2 1.5 )Nc p embedA N edge t d= − × + × + × ×
* 2(( 2 ) 2 1.5 )Nc embedA N edge d= − × + × ×
' 5/316 ( )b c embedN f d= × ×
2,12 (20" 2 3" 2 1.5 12") 3,844NcA = + × + × × = in2
* 2,12 (20" 2 1.5 12") 3,136NcA = + × × = in2
2,18 (20" 2 3" 2 1.5 18") 6,400NcA = + × + × × = in2
* 2,18 (20" 2 1.5 18") 5,476NcA = + × × = in2
318 5/3
,123,844 1.25 (16 4,336 1000 12 ) 2461,296
ACI DnP k− = × × × ÷ × =
318 * 5/3
,123,136 1.25 (16 4,336 1000 12 ) 2001,296
ACI DnP k− = × × × ÷ × =
318 5/3
,186, 400 1.25 (16 4,336 1000 18 ) 3572,916
ACI DnP k− = × × × ÷ × =
318 * 5/3
,185, 476 1.25 (16 4,336 1000 18 ) 3062,916
ACI DnP k− = × × × ÷ × =

Method 2: ACI 318 Chapter 11 – Punching Shear
embedcPS
n dbfP ×××= 0'4
)"28(40 embeddb +×=
,12 4 4,336 1000 4 (28 12) 12 506PSnP k= × ÷ × × + × =
,18 4 4,336 1000 4 (28 18) 18 872PSnP k= × ÷ × × + × =
Method 3: CCD Method (Fuchs et al., 1995)
Nccembed
CCDn Af
dP ××
×= '
9401
2( 2 1.5 )Nc embedA N d= + × ×
# 2 2( 2 1.5 )Nc embedA N d N= + × × −
2,12
1 40 4,336 1000 (28 2 1.5 12) 346912
CCDnP k = × × ÷ × + × × =
# 2 2,12
1 40 4,336 1000 (28 2 1.5 12) 28 280912
CCDnP k = × × ÷ × + × × − =
2,18
1 40 4,336 1000 (28 2 1.5 18) 464918
CCDnP k = × × ÷ × + × × =
# 2 2,18
1 40 4,336 1000 (28 2 1.5 18) 28 410918
CCDnP k = × × ÷ × + × × − =