ROCIO CABRERA GUILLAUME LEMAITRE MOJDEH RASTGOO CT and MR Imaging of Abdominal Aortic Aneurysm.
date post
21-Dec-2015Category
view
218download
2
PROJECT 1:
Voronoi Probability Maps for Seed Region Detection in Abdominal CT Images
PROJECT 2:
Kidney Seed Region Detection in Abdominal CT Images

By: Nicholas Cooper, Northern Kentucky University Maureen Kelly, Loyola University Chicago Jacob Furst, DePaul University Daniela Raicu, DePaul University
REU Medical Informatics eXpericence (MedIX) 2008 DePaul UniversityNorthwestern UniversityUniversity of Chicago
Thursday, August 22, 2008
Voronoi Probability Maps for Seed Region Detection in Abdominal CT Images
PROJECT 1

Topics of Discussion1. Project Goals
2. Why Multiple Organs?
3. Purpose for Radiologists
4. Why Segment the Liver and Spleen Together?
5. Challenging Aspects of Multi-Organ Segmentation
6. Overcoming Challenges
7. Methodology
8. Results

Project Goals
To create a robust method that identifies liver and spleen seed regions that can be used for multi-organ segmentation Voronoi Probability Maps (VPM) Largest Probable Connected Components (LPCC)

Why Multiple Organs?
Liver
Spleen
Propose an increased accuracy with multi-organ segmentation using seed regions Two weak individual segmentations
could potentially result in an even more exact combination segmentation
Allow for radiologists to examine several organs at once instead of just one at a time Better diagnosis of pathologies Treatment planning Anatomical structures study

Purpose for Radiologists Check for diseases
Liver Hepatitis (inflammation) Cirrhosis (nodules formation) Cancer
Spleen Splenomegaly (enlargement) Asplenia (abnormal function)
Spread of a known disease/pathology Is a particular treatment is working for a patient? Show condition after a abdominal injury
Benefits of Segmenting the Spleen and Liver Together
Share similarities that would allow for more accurate and repeatable segmentation Texture features Gray-level intensity values
Practicality in the technical setting

Challenges
Spleen share similar texture features/properties to that of the liver
Gray-level similarity of adjacent organs
Variations in spleen and liver margins/shape
Absence of the spleen
Hey, where
did the
spleen go?!
Nick

Overcoming Challenges Create a method that is not based on a common set of
parameters organ location patient position
Create a method that relies on specific texture or intensity
Patient at a 45° angle
Typical spleen location
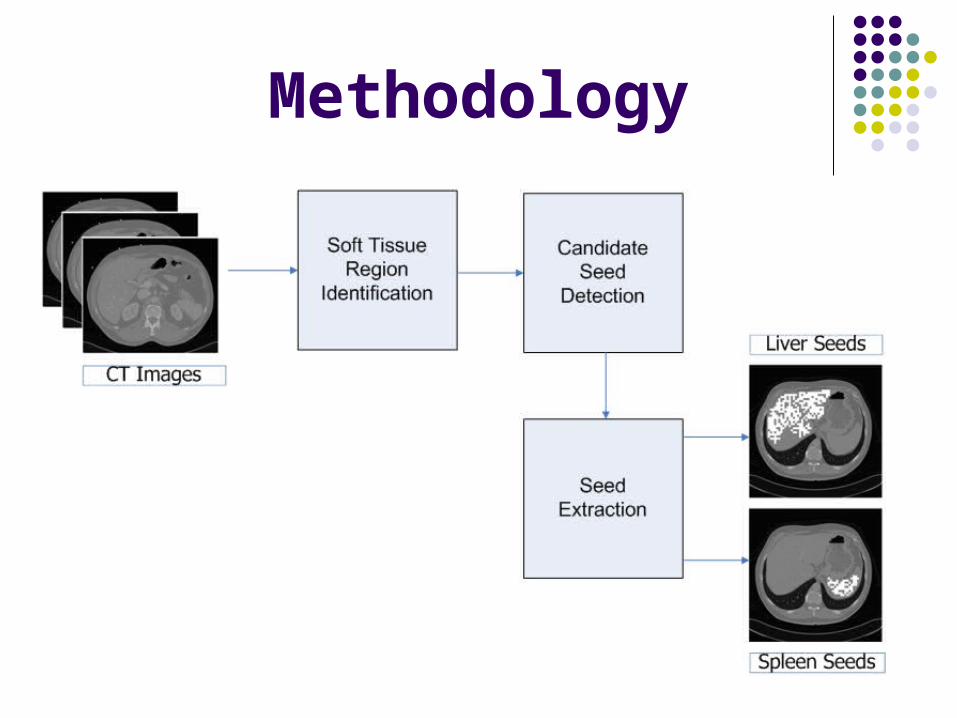
Methodology
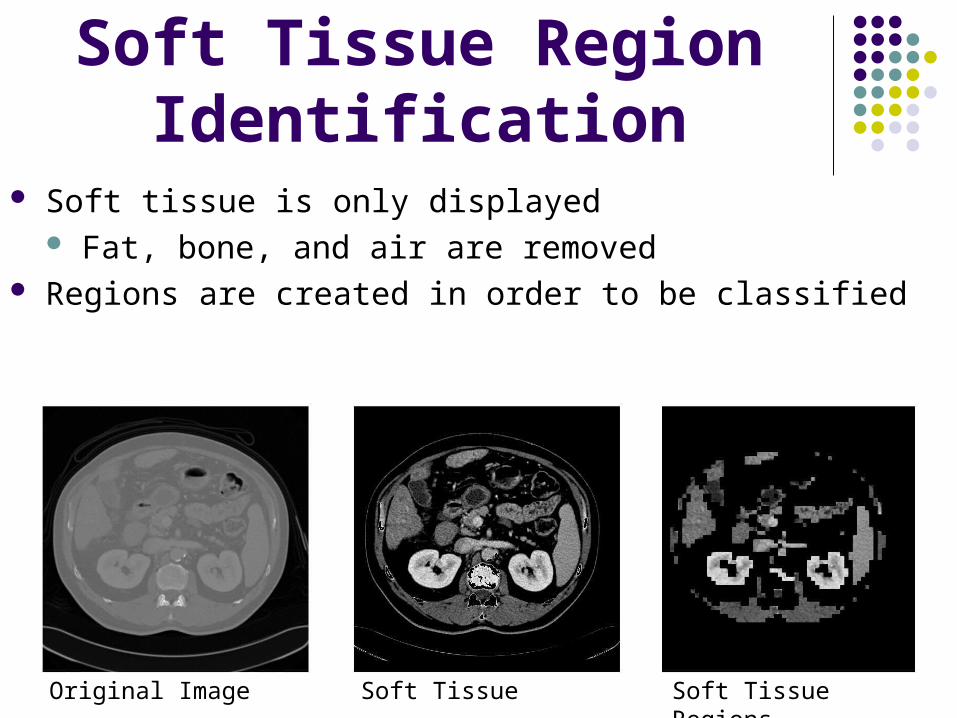
Soft Tissue Region Identification
Soft tissue is only displayed Fat, bone, and air are removed
Regions are created in order to be classified
Original Image Soft Tissue RegionsSoft Tissue
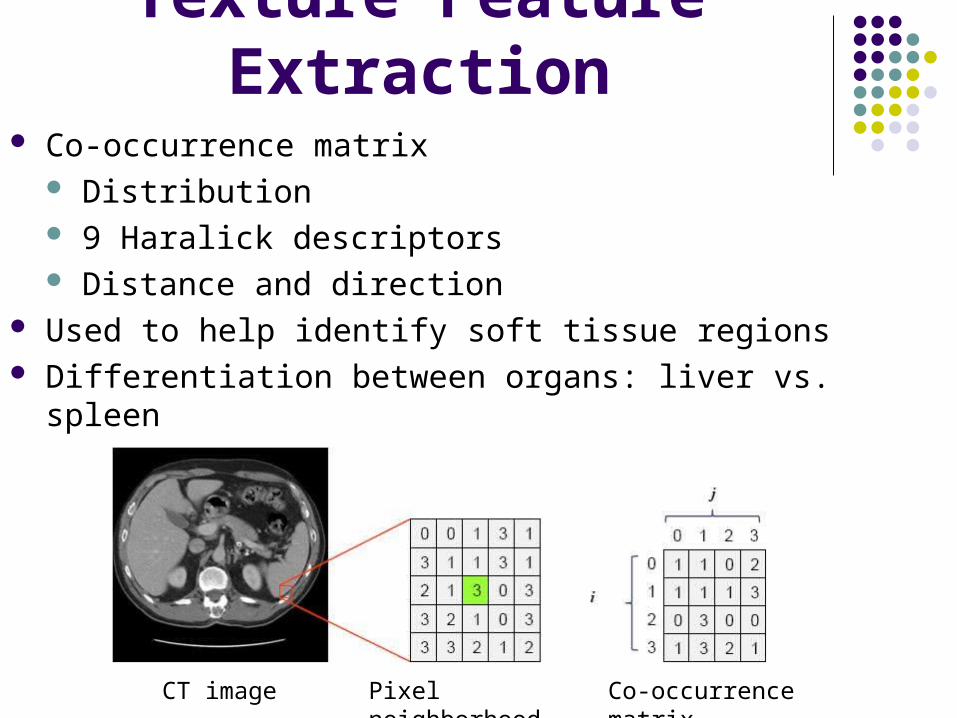
Texture Feature Extraction Co-occurrence matrix
Distribution 9 Haralick descriptors Distance and direction
Used to help identify soft tissue regions Differentiation between organs: liver vs. spleen
Co-occurrence matrixPixel neighborhoodCT image

Created liver and spleen classifiers Manually draw a polygon around the spleen/liver
Creates positive (spleen/liver) and negative (non-spleen/non-liver) regions
Result: displays the regions in which the classifier declares to be spleen or liver Includes misclassified regions
Candidate Seed
positivenegative
Spleen Candidate Seed Detection
Detection

Seed Extraction
Get specific organ regions Spleen seed points are regions that ONLY contain the
spleen, and same for liver. Eliminate the misclassified regions
Seeds that are extracted are used as initial points for expanding the spleen/liver regions to achieve the completely segmented organ

Seed Extraction

Calculation of Average Seed Region Location
Liver Candidate Seeds Spleen Candidate SeedsAverage Seed Region Location
Finding average seed region location for both the liver and spleen
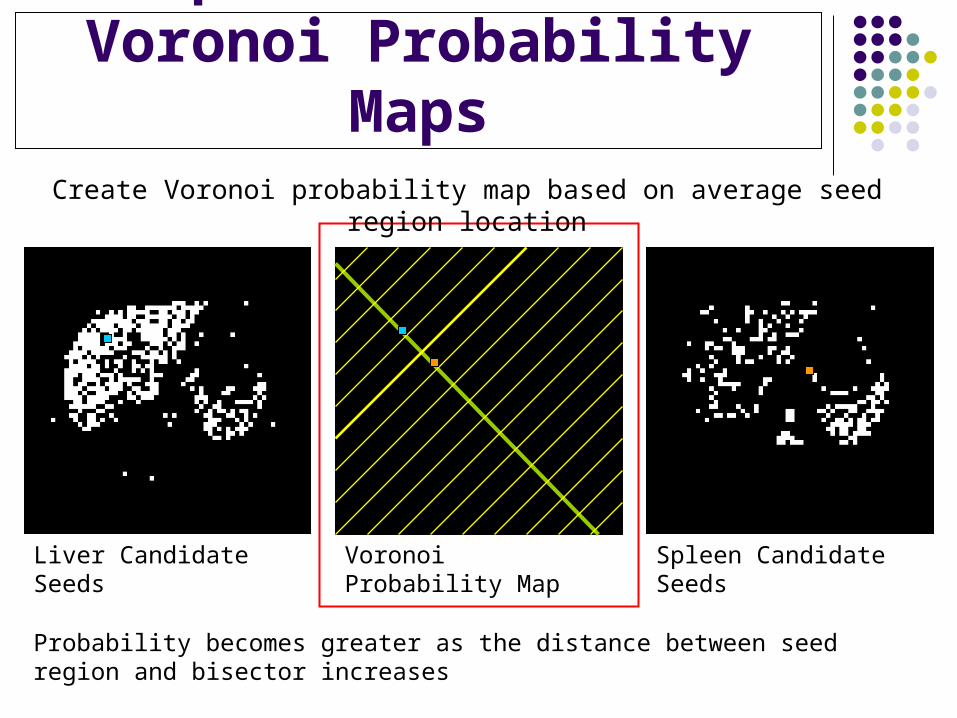
Liver Candidate Seeds Spleen Candidate SeedsVoronoi Probability Map
Create Voronoi probability map based on average seed region location
Implementation of Voronoi Probability Maps
Probability becomes greater as the distance between seed region and bisector increases
Implementation of Voronoi Probability Maps
22
||),(
ba
cbyaxyxd
),(max
),(),(
yxd
yxdyxp
xy
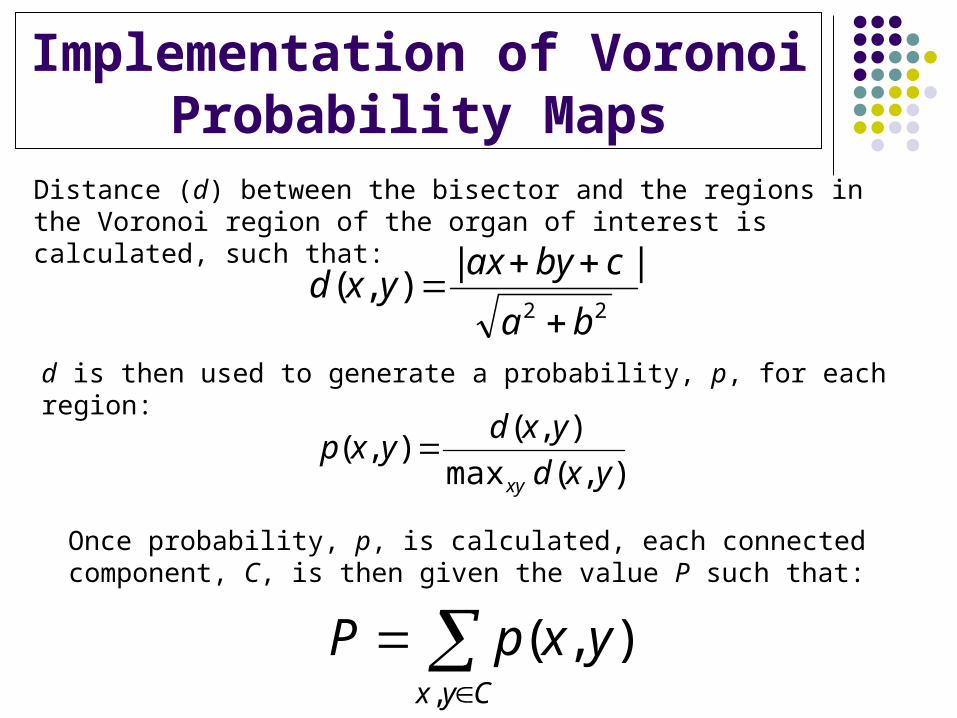
Distance (d) between the bisector and the regions in the Voronoi region of the organ of interest is calculated, such that:
d is then used to generate a probability, p, for each region:
Once probability, p, is calculated, each connected component, C, is then given the value P such that:
Cyx
yxpP,
),(
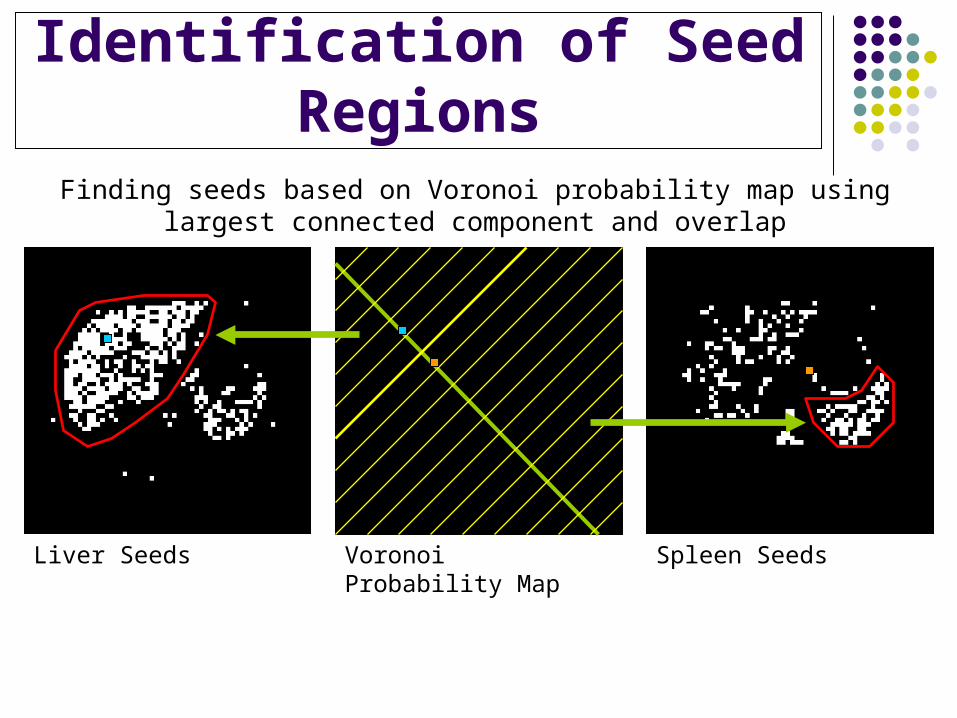
Liver Seeds Spleen SeedsVoronoi Probability Map
Finding seeds based on Voronoi probability map using largest connected component and overlap
Identification of Seed Regions
Identification of Seed Regions
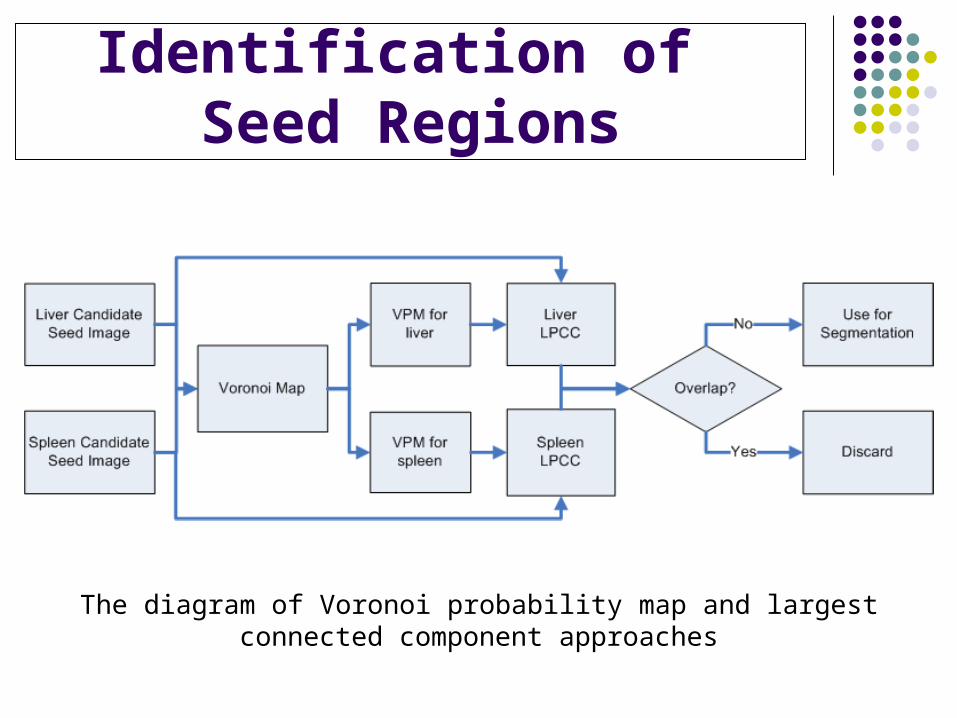
The diagram of Voronoi probability map and largest connected component approaches
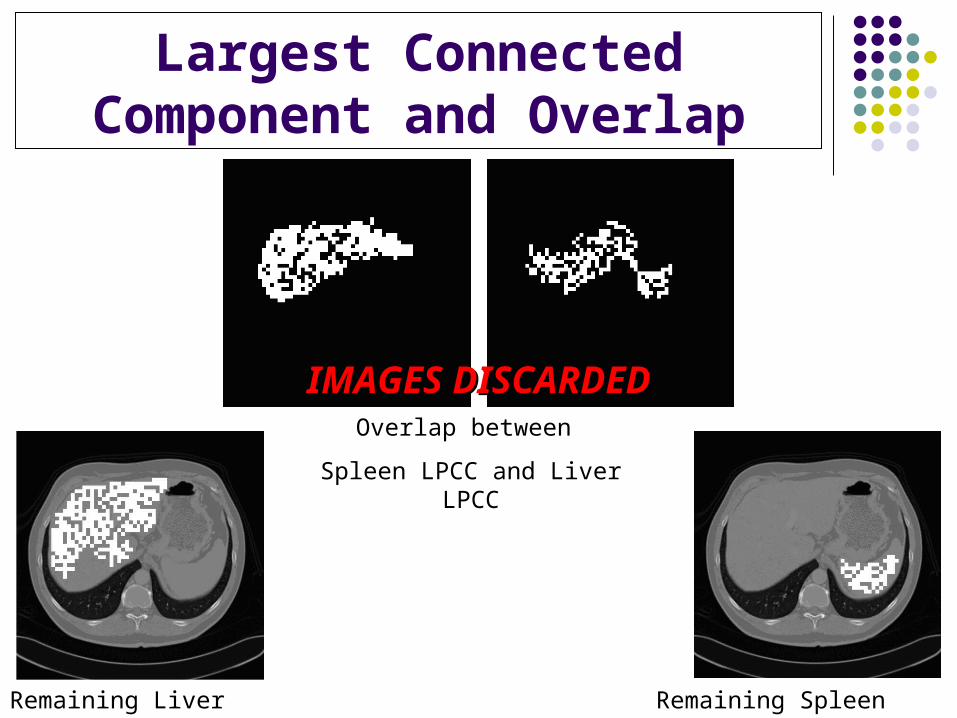
Largest Connected Component and Overlap
Remaining Liver Seeds Remaining Spleen Seeds
Overlap between
Spleen LPCC and Liver LPCC
IMAGES DISCARDEDIMAGES DISCARDED

Results 19 patients
10-125 images per patient containing liver and spleen
TOTAL: 1,125 imagesSeed region overlap: 176 imagesNo Seed region overlap: 979 images
Of the 979, 85% of all the images contained all seed regions within the organ of interest

Conclusion Results show that VPMs and LPCC was
successful Succeeded in circumstances in which other
methods failed varying organ size texture similarities patient rotation
Thanks to Reed’s mother!

By: Nicholas Cooper, Northern Kentucky University Maureen Kelly, Loyola University Chicago Jacob Furst, DePaul University Daniela Raicu, DePaul University
REU Medical Informatics eXpericence (MedIX) 2008DePaul UniversityNorthwestern UniversityUniversity of Chicago
Thursday, August 22, 2008
Kidney Seed Region Detection in Abdominal CT
ImagesPROJECT 2

Topics of Discussion1. Project Goals
2. Why Kidneys?
3. Challenge: Why Not Use Previous Method?
4. Overcoming Challenges
5. Methodology
6. Results
7. Conclusion
8. Future Work

Project Goals To create a robust, accurate method that identifies
kidney seed regions that can be used for organ segmentation
Right KidneyLeft Kidney
View from behind

Why Kidneys? Detection, prevention, treatment
disease One in nine Americans have chronic kidney disease (National
Kidney Disease Foundation) Nephritis (inflammation)
abdominal injury

Challenge: Why Not Use Previous Method?
Liver, spleen and kidneys do not exist within many of the same images
Difficulties in distinguishing liver/right kidney and spleen/left kidney 2 of the same organ (right and left kidney) VPMs are based off of distance
between regions
and bisector Mis-identification Poor kidney
candidate seed
images
Liver and SpleenLiver, Spleen and Kidneys

Overcoming Challenges
Use kidney’s high Hounsfield unit (HU) value to our advantage
Use spine Kidneys are located on either side of the spine
Use revised probability map approach Elliptical-shaped probability map (ESPM)
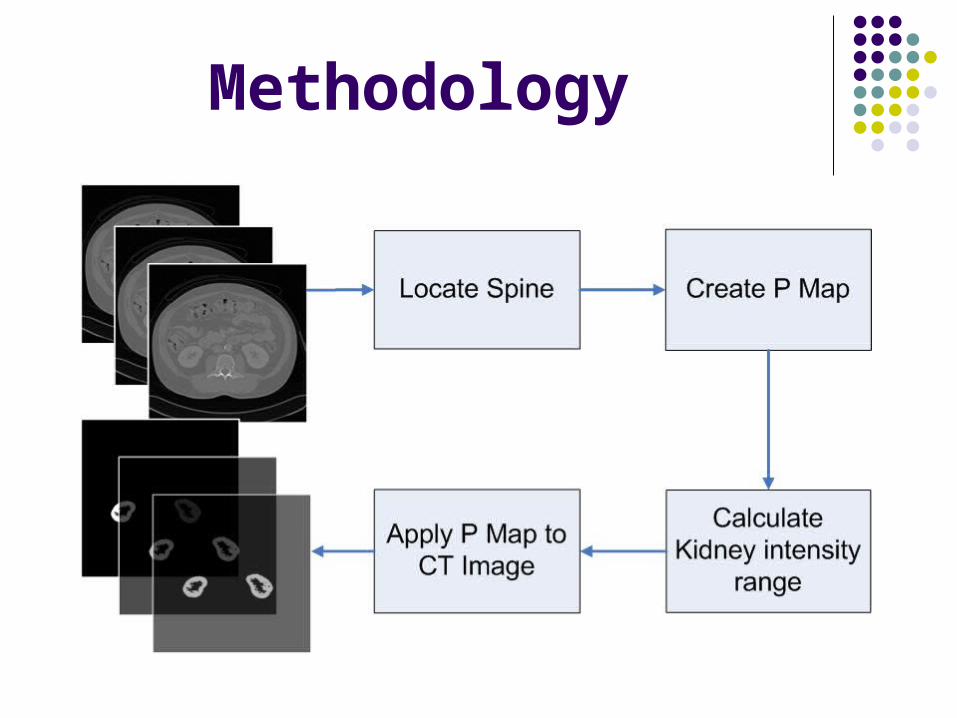
Methodology

Spine Extraction
Located once for each patient using: Many consecutive images Highest intensity values

Probability Map Construction
distance (d1) between the center of the spine and outside edge
distance (d2) between the center of the spine at x1, y1 and any pixel outside of the spine at x2, y2
d1 and d2 are then used to generate a probability, p, for each pixel
2 21 ( cos ) ( sin )d A B
212
2122 )()( yyxxd
21
1
dd p=

Probability Map Construction
Elliptical-shaped probability map (ESPM)
Extended major axis of the spine ellipse separates the right and left kidney ESPM
major axis
spine
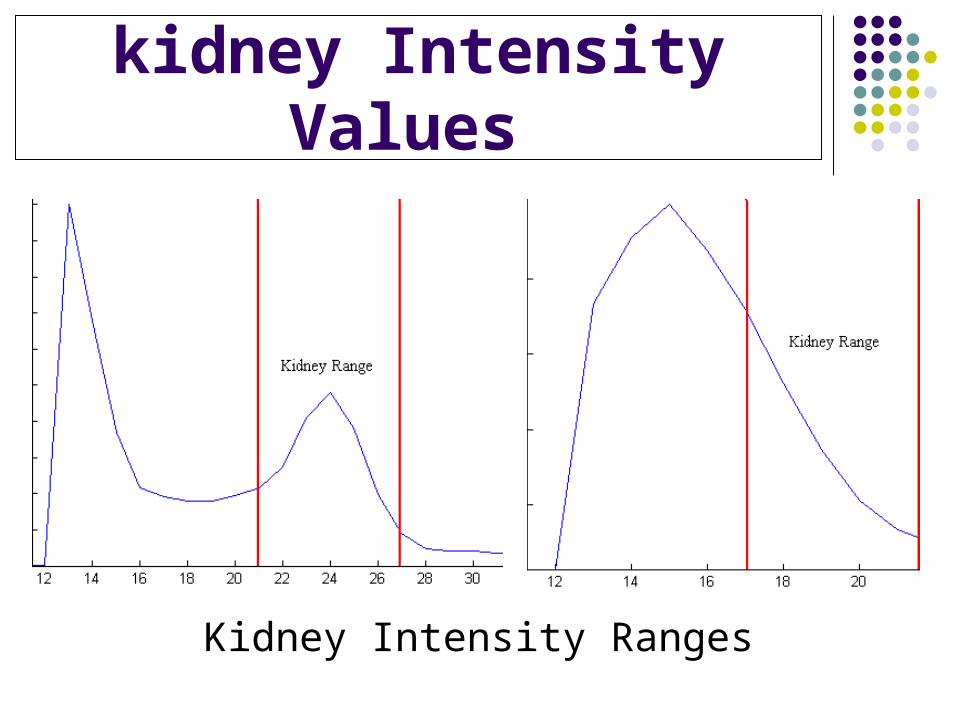
Elimination of Non-kidney Intensity Values
Kidney Intensity Ranges

Kidney Seed Extraction Apply elliptical-shaped probability map (ESPM) to each kidney
image Check for overlap
Right Kidney Left Kidney
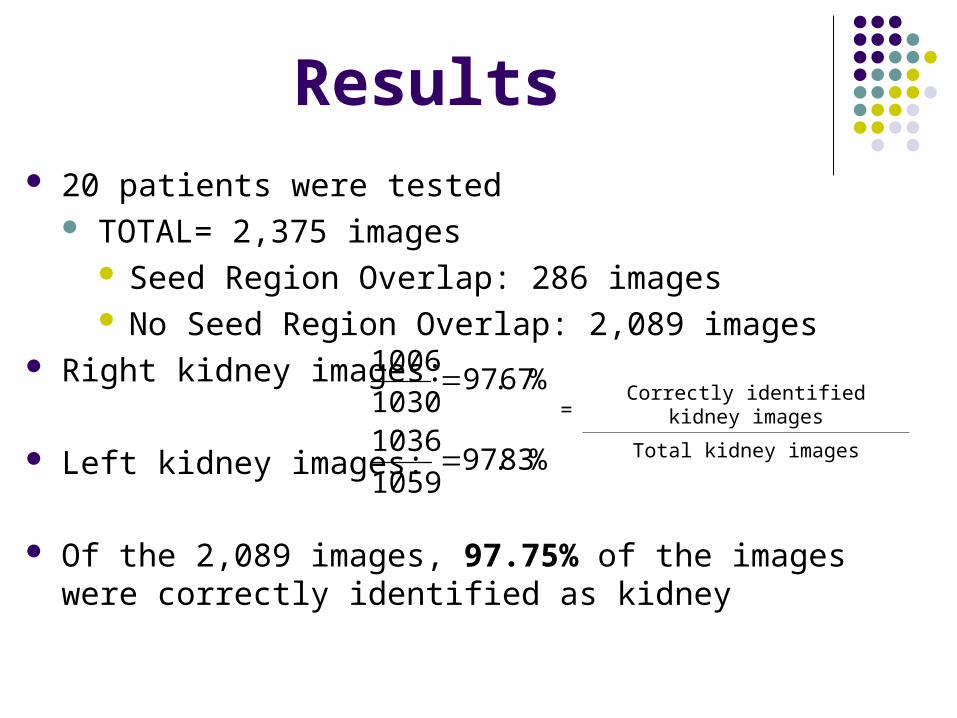
Results 20 patients were tested
TOTAL= 2,375 images Seed Region Overlap: 286 images No Seed Region Overlap: 2,089 images
Right kidney images:
Left kidney images:
Of the 2,089 images, 97.75% of the images were correctly identified as kidney
%83.971059
1036
%67.971030
1006 Correctly identified kidney images
Total kidney images=
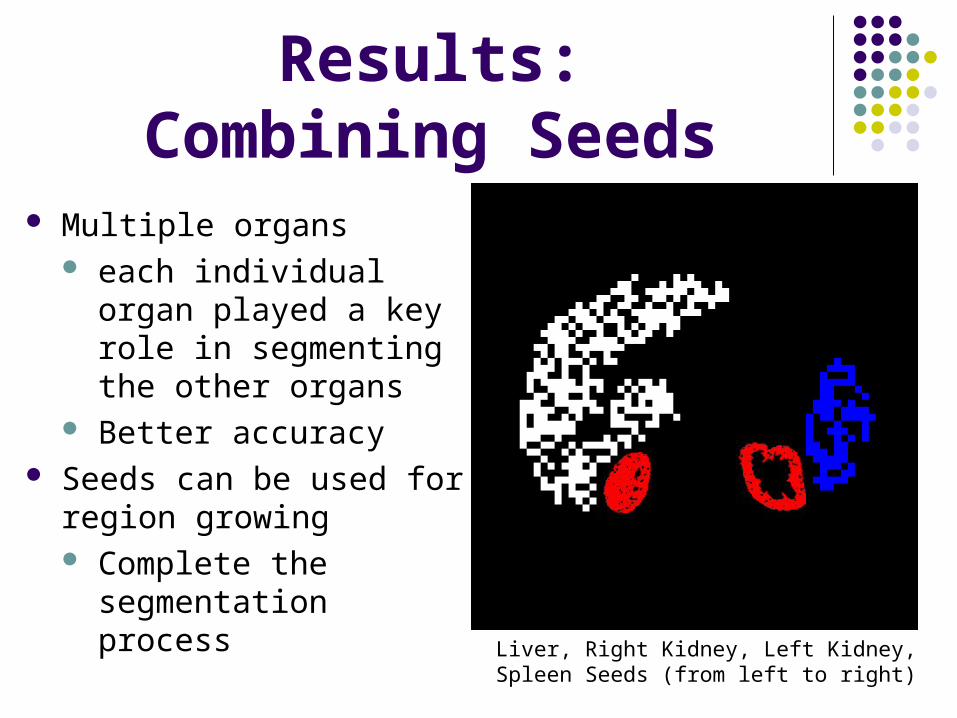
Results:Combining Seeds
Liver, Right Kidney, Left Kidney, Spleen Seeds (from left to right)
Multiple organs each individual organ
played a key role in segmenting the other organs
Better accuracy Seeds can be used for
region growing Complete the
segmentation process

Conclusion Results prove that this method is very successful
Accurate Reliable Time-efficient
Comparable results on other patient data sets?

Future Work
Region growing Extend to other organs
Liver (blue), Kidneys (green), Spleen (red)

The End
Thanks to Reed’s Mom again!
Any Questions??