Progressivity and Determinants of Out-of-Pocket Health ...
136
Progressivity and Determinants of Out-of-Pocket Health Care Financing in Zambia By Felix Mwenge A dissertation submitted to the Health Economics Unit, School of Public Health and Family Medicine of the University of Cape Town, in partial fulfilment of the requirements for the degree of Master of Public Health In Health Economics University of Cape Town, South Africa November 2010
Transcript of Progressivity and Determinants of Out-of-Pocket Health ...
Progressivity and Determinants of
Out-of-Pocket Health Care Financing
in Zambia
By
Felix Mwenge
A dissertation submitted to the Health Economics Unit, School of Public Health and Family
Medicine of the University of Cape Town, in partial fulfilment of the requirements for the degree
of
Master of Public Health
In
Health Economics
University of Cape Town, South Africa
November 2010
Declaration
No portion of the work referred to in the dissertation has been submitted in support of an
application for another degree or qualification of this or any other university or other institute of
learning. It is a product of my original work and it is based on Zambian data for 1998, 2004 and
2006. Other sources of information are fully acknowledged and referenced.
Mwenge Felix
Signature:.........................................................
Date: 25th
November 2010

Map of Zambia

Dedication
To my siblings Teba, Musenge, Bwalya, Kansoko and Mubanga, and to my mother Chilufya
Ngowani, who made me a „coat of many colours‟, thank you for believing in me and for realising
and making me aware that I was a unique child early in my upbringing.
To my fellow youths in Zambia with whom I share the belief that the transformation of Zambia
and most of Africa will only be realised upon change of individual attitudes towards issues such
as work, money, knowledge, education and spirituality, I urge you not to ever give up believing
in change no matter how far fetched it may appear.

Any culture, group of people, or civilization that forbids intellectual, as well as a psychological
study of its challenges, has in itself forbidden the ability to find help, healing, and progress for
the future.
Pastor Matthew Ashimolowo
Acknowledgements
I am grateful to my supervisor, John E. Ataguba for introducing me to the Tobit model, for the
help, discussions and comments rendered throughout the study and for helping me gain
confidence in the use of STATA. My data analysis skills have greatly improved. My heartfelt
appreciation also goes to Di McIntyre, the South African „Health and Wealth‟ research chair and
to the Health Economics Unit for sponsoring my programme. Di McIntyre also inspired me to
undertake a study related to health care financing which I have come to greatly enjoy. I also wish
to acknowledge all my health economics lecturers for teaching me to apply my knowledge of
economics to health care, particularly, my Economic Evaluation lecturers, Dr Susan Clearly and
Dr Edina Sinanovic for making me understand, among many other things, that gut feeling and
educated guesses are not the best in making decisions in health care; Sheetal Shilal and Okore
Okorafor, for presenting health econometrics in such a simplified and understandable way; and
Prof Lucy Gilson, for introducing me to the policy triangle and its application in health policy
processes. I also thank the other lecturers who have imparted the knowledge that I have gained.
These include my Quantitative Research Methods lecturer, Prof Rodney Erlich, My Qualitative
Research Methods lecturer Dr. Chris Colvin and my Epidemiology lecturer, Dr Taryn Young.
Furthermore, I would like to acknowledge the University of Zambia, department of economics
for furnishing me with relevant information on current issues in health care financing in the
Zambian health sector, particularly, Mr Caesar Cheelo, Dr Felix Masiye, Chitalu Chama, Mr
Dale Mudenda and Prof Manenga Ndulo. I also acknowledge the occasional guidance that I have
personally received from my first year undergraduate economics lecturer, Mr Mulenga Wake.
His help has been instrumental to the direction of my career. Similarly, I acknowledge the help
and support of my former lecturer and friend Mr Christopher Mapoma, who always involved me
in a number of health research projects that helped me to develop interest in health research.
I also express my warm gratitude to my best friend Ng‟andwe Kambafwile, who was actually the
first person to hint to me that it was not too early for me to pursue a postgraduate qualification
while I was still in my final year of undergraduate. I owe her many thanks. Not forgetting the
help and support of Dr Henry Kambafwile, and his wife Judith, and children, Kalaba, Chabu and
Songwe for helping me settle quickly in Cape Town. This was not easy being my first time living
outside Zambia. This helped me concentrate fully on my studies.

Lastly but not least, I greatly appreciate a brother of mine, Kizito Mbepa, who from my early
childhood helped me develop a reading culture. I have come to discover that reading is the
cheapest way of interacting with greater minds.
Above all, I thank the Almighty God who gave all of us the breath to do what we could.

Part A
Study Protocol
Table of Contents
Part A: Study Protocol
1.0 Introduction ............................................................................................................................. 13
1.1 Problem Statement .................................................................................................................. 14
1.2 Study Rationale ....................................................................................................................... 17
1.3 Objectives of the Study ........................................................................................................... 17
1.3.1 Specific Objectives .......................................................................................................... 18
1.4 Literature Review ................................................................................................................... 18
1.4.1 Progressivity of OOP payments ....................................................................................... 18
1.4.2 Regressivity of OOP payments ........................................................................................ 20
1.4.3 Determinants of OOP payments ...................................................................................... 21
1.5 Methods .................................................................................................................................. 22
1.5.1 Data Sources ........................................................................................................................ 22
1.6 Ethics ...................................................................................................................................... 27
1.7 Logistics .................................................................................................................................. 27
1.8 Dissemination ......................................................................................................................... 28
1.9 Budget ..................................................................................................................................... 28
Part B: Structured Literature Review
OVERVIEW ................................................................................................................................. 35
Section ONE: Theoretical Review ................................................................................................ 36
1.1 Introduction ......................................................................................................................... 36
1.2 Distribution of Health Care ................................................................................................. 37
1.2.1 The market as a guide in the distribution of health care ............................................... 37
1.2.2Theories of distributive justice as a guide in the distribution of health care ................. 39

a. Utilitarianism .................................................................................................................. 39
c. Libertarianism ................................................................................................................ 40
d. Maximin (John Rawls) ................................................................................................... 42
1.3 The Meaning of Equity in Health Care Financing .............................................................. 43
1.3.1Horizontal vs. Vertical equity ........................................................................................ 45
1.3.2 Implementing Equity in Health Care Financing ........................................................... 45
1.4 Methods of Assessing Progressivity in Health Care Financing .......................................... 46
1.4.1 Direct Method ............................................................................................................... 46
1.4.2 Health Payments Concentration Curves ....................................................................... 47
1.4.3 The Kakwani Index ...................................................................................................... 47
SECTION TWO: EMPIRICAL REVIEW ................................................................................... 48
2.1Introduction .......................................................................................................................... 48
2.2 Review Objectives .............................................................................................................. 48
2.3 Methods .............................................................................................................................. 49
2.4 Results ................................................................................................................................. 49
2.3.1 Composition of Out of Pocket Payments ..................................................................... 49
2.3.2 Measure of Ability to Pay (ATP) ................................................................................. 50
2.3.3 Data and Sources of Data ............................................................................................. 50
2.3.4 Method of Assessing Progressivity .............................................................................. 51
3.0 Discussion ........................................................................................................................... 52
4.0 Conclusion .......................................................................................................................... 54
SECTION THREE: DETERMINANTS OF OUT OF POCKET PAYMENTS .......................... 56
3.1 Determinants of Out of Pocket Payments ........................................................................... 56
Table 1: Progressivity of out of pocket payments: Domestic Countries ...................................... 59
Table 2: Progressivity of out of pocket payments, International Countries ................................. 60
Table 3: Progressivity and Basis for Progressivity for All Studies .............................................. 68
Table 4: Determinants of Out of Pocket Payments ....................................................................... 75
5.0 References ............................................................................................................................... 75
Part C: Journal Article
1.1 Introduction ......................................................................................................................... 85
1.2 Overview of Progressivity of OOP payments ..................................................................... 88
2.0 Methodology ........................................................................................................................... 90
2.1 Data Sources ....................................................................................................................... 90
2.2 Statistical Methods .............................................................................................................. 91
a. Estimating Out of Pocket payments ................................................................................... 91
b. Measuring Socio-economic Status .................................................................................... 91
c. Estimating Progressivity of Out of Pocket Payments. ....................................................... 92
d.Factors determining Out of Pocket payments..................................................................... 93
e. Factors determining size of Out of Pocket payments ........................................................ 94
3.0 Results ..................................................................................................................................... 96
4.0 Discussion ............................................................................................................................. 100
5.0 Conclusion ............................................................................................................................ 104
Part D: Appendices
Appendix 3a: Logistic regression for the determinants of incidence of out of pocket payments in
Zambia-1998 ............................................................................................................................... 117
Appendix 3b: Tobit regression for the determinants of size of out of pocket payments in Zambia-
1998 ............................................................................................................................................ 117
Appendix 4a: Logistic regression for the determinants of incidence of out of pocket payments in
Zambia-2004 ............................................................................................................................... 118
Appendix 4b: Tobit regression for the determinants of size of out of pocket payments in Zambia-
2004 ............................................................................................................................................ 118
Appendix 5a: Logistic regression for the determinants of incidence of out of pocket payments in
Zambia-2006 ............................................................................................................................... 119

Appendix 5b: Tobit regression for the determinants of size of out of pocket payments in Zambia-
2006 ............................................................................................................................................ 119
Appendix 6: Construction of household expenditure variables .................................................. 120
Appendix 7: Household socio-demographic variables ............................................................... 120
Appendix 8: Estimating mean household equivalent OOP payments per household characteristic
.................................................................................................................................................... 121
Appendix 9: Estimating mean equivalent household expenditure and mean equivalent OOP
expenditure proportion of mean equivalent household expenditure per quintile ....................... 121
Appendix 10: Estimating Lorenz and OOP concentration curves .............................................. 121
Appendix 11: Estimating OOP concentration index ................................................................... 122
Appendix 12: estimating Gini coefficient ................................................................................... 122
Appendix 13: testing for dominance of Lorenz and OOP concentration index .......................... 122
Appendix 14: estimating determinants of incidence and size of OOP payments ....................... 122
Appendix 15: Background and Sample design methodology of the Living Conditions
Monitoring Survey (Central Statistical Office, 2006) ......................................................... 123
Part E: Policy Brief
Introduction ................................................................................................................................. 132
Results ......................................................................................................................................... 132
Conclusion .................................................................................................................................. 134
List of Tables and Figures
Table 1: Survey Sample Sizes and Data Collection Periods......................................................... 22
Table 2: Variables used in regression analysis ............................................................................. 27
Table 3: Study Time Line ............................................................................................................. 28
Table 4 Study Budget.................................................................................................................... 28
Figure 1: Gini Coefficient (Index) ........................................................................................... 24
1.0 INTRODUCTION
Out of pocket (OOP) payments is one of the single largest sources of health care financing in
Sub-Saharan Africa (McIntyre et al. 2006). In 2002, OOP expenditures constituted 51% to 90%
of the private health expenditure in 14 countries and 91% to 100% in 24 African countries
(Kirigia et al. 2006). In the same year, OOP constituted over 50% of the private health

expenditure in 38 countries. This clearly indicates that households make a significant
contribution to health expenditure in the majority of the countries of the Region. OOP payments
are in form of direct payments, which households pay at the point of use of health services. It
includes spending on such things as consultation fees, investigatory tests, hospitalization and
pharmaceuticals but excludes expenditure on transportation to obtain care and special nutrition
(Castano et al. 2002). OOP payments are net of any insurance reimbursement. They may include
co-payments for used public health services but also many other formal and informal payments,
such as non-prescription drugs, private medical care payments, or ”under-the-table payments”
for gifts and gratitude money for health care providers (Mastilica, Bozikov 1999).
In Zambia, OOP payments are substantial, accounting for approximately 29 percent of total
health expenditure in 2004 (Ministry of Health Zambia 2006). In the same year, compared to
other financing sources, OOP was second only to donor funding which accounted for 38 percent,
followed by Ministry of Finance with 24 percent, employers with 6 percent and other sources
with 3 percent. In a multi-country analysis undertaken by Leive and Xu ( 2008) to assess how
households cope with OOP payments in 15 countries, Zambia was one of the countries with the
highest prevalence of OOP payments, ranking higher than some African countries such as
Swaziland, Namibia, Mauritania and Malawi.
1.1 PROBLEM STATEMENT
From the time Zambia got its independence from Britain, the government had been providing
free health care services for all (Ministry of Health/Republic of Zambia. 2004). However, it
became increasingly difficult to sustain this system especially when in the mid 1970s the country
started experiencing macroeconomic challenges. This resulted in adverse effects on health and
was compounded by increased poverty, inequality and unemployment and contractions in per
capita household incomes and GDP. Ultimately, the public sector‟s ability to finance the
provision of health care services diminished over time. In the wake of these challenges, there
was an emergence of liberal economic reforms in many parts of Africa, popularly known as
„Structural Adjustment Programmes‟ (SAPs). The main theme of these reforms among others
was the removal of public subsidies and withdrawal of direct government provision of many
social services including health care (McPherson 1995). Under the circumstances, the newly
elected government, supported by donors, also referred to as cooperating partners in the Zambian
health literature (Ministry of Health 2005, Republic of Zambia 2006), began in the early 1990s to
rationalize that, if rich countries could not afford to provide free services to their populations,
poor countries like Zambia could similarly not afford to sustain their “free-for-all” health
policies. Thus, in 1992, far-reaching national health reforms were initiated. A major tenet of the
reforms was the cost-sharing health policy (introduced in 1993), which saw Zambia introducing
user fees in all public facilities at all levels of care. Patients were now required to pay at the point
of use of health services.
These health reforms were initially greeted with enthusiasm, and some positive changes were
recorded in the early years of the reform implementation (Gilson et al. 2003). In years that
followed however there has been a reversal of the situation causing a waning of interest in the
health reforms and increased skepticism. This generated intense (and on-going) debate about the
ability of the reforms to foster a number of things including better coverage, equity and ease of
access to health care (Blas, Limbambala 2001, Malama et al. 2002, van der Geest et al. 2000).
The subject of user fees is at the center of the health reforms and health policy debate as a key
policy instrument for health care financing. A key anxiety in this regard concerns the health and
socio-economic implications of user fees as a financing option, particularly given the poverty
context of health in Zambia. (Masiye et al. 2008) observe that implementing user fees in a health
setting with widespread poverty and poor key health indicators has been very challenging.
Contrary to expectations, user fees resulted in lower utilization rates and denied more people,
especially the poor, access to health care. During the same period about 22% of urban and 30%
of rural patients were turned away from health facilities because they could not pay for services
upfront (Kondo, McPake 2007). User fees were later abolished in April 2006.
The abolition of user fees however only covers primary health care in rural areas. Urban dwellers
as well as rural people who need health care not available at primary level still have to pay OOP.
Because the cost of provision of services at the higher levels is higher, OOP has remained
considerably high despite the policy of user fees removal. OOP payments (World Health
Organisation 2010) accounted for 71.4% of total private health expenditure in 2004. This was
higher than in similar countries in the region such as Zimbabwe with 50.7%, Malawi, 35.2%,
Botswana 27.8% as well as Uganda with 51%. The magnitude of OOP as a share of private

expenditure in Zambia also suggests that the level of prepayments in form of private health
insurance is very low. For example, between 2002 and 2006 private prepayment plans as a
percentage of private health expenditure ranged from 0.9% to 3.7% (ibid). In fact, in the 1995-98
National Health Accounts there was no component of prepayments because it was non-existent
at the time (Ministry of Health/ Central Board of Health 1998). On the other hand, tax funding
has remained a key health financing mechanism in the country. However, the health sector
experienced shrinking budgetary allocations after the adoption of SAPs as earlier mentioned.
Given this lack of general health insurance and reduced budgets to the health sector most
households, rural and urban have remained relying on out of pocket payments to finance health
care. However, out of pocket payments may not be a good way of paying for care because it has
never been possible for health systems around the world to demand that out of pocket are made
according to ability to pay. This is because payments are mostly made at the point of use of
health services without considering the payers initial income. This tend to be inequitable in the
sense that both poor and rich are made to face similar health costs. But equity of financing
requires that payments are made according to one‟s ability to pay. This is a desirable policy
objective in most of the countries today. Given the nature of out of pocket payments this may be
hard to achieve especially in Zambia where the majority of the population is poor. . For this
reason health systems seek to reduce out of pocket payments as much as possible.
The inequitable nature of OOP payments especially in poor countries is one of the main reasons
leading to user fee removal for health care in many African countries. For example the
inequitable nature of OOP payments led to the abolition of user fees for health care in Uganda in
2001 (Xu et al. 2006). . Thereafter the South African, , Government in an effort to reduce the
inequity of out of pocket payments and other effects introduced a policy of universal access to
free primary health care by removing user fees for everyone (Wilkinson et al. 2001). This is an
indication that OOP payments are inequitable and with them it may be difficult to achieve
universal coverage. Countries where out of pocket payments have remained predominant tend to
introduce user fee exemptions as a measure of equity. However, research has shown that user fee
exemptions have not rightly beed implemented and targeted. For example,. Exemptions were
implemented soon after the introduction of user fees in Zambia. However, it has been reported
that like in many other countries, exemptions in Zambia were very ineffective in reaching the

target population (Masiye, Chitah & McIntyre 2010). Hence the equity objectives they were
meant to achieve were not successful. In other countries out of pocket payments are replaced
with alternative sources of financing such as prepayment schemes which do not require people to
pay at the point of use of health services. However, prepayment schemes in Zambia are almost
insignificant and where they are found they are only accessible by people of high socio-
economic status who happens to be a minute proportion of the Zambian population.
1.2 STUDY RATIONALE
The need for health care financing mechanisms that are progressive in Zambia cannot be over-
emphasized. It is necessary that health care financing mechanisms are in such a way that they are
related to ability to pay. this is an equity objective.. This is the main motivation for this study. It
is envisaged that this study will provide empirical evidence on the progressivity and
determinants of OOP payments. This information is important for policy making regarding
health care financing.
The starting point in considering equity in financing health care is the requirement that health
care ought to be financed according to the ability to pay (O'Donnell et al. 2008). This is the
principle of vertical equity, which requires that individuals with unequal ability to pay should
pay disproportionately unequally. An equitable health care system would be one in which
payments for health care are positively related to the ability to pay. It is not still clear whether
out of pocket payments are progressive and can foster equity in the financing of health care in
Zambia. This study will provide an empirical assessment of OOP financing in Zambia and its
equity implications. Such evidence is important in formulating policies that will provide for an
equitable health financing system in the country.
1.3 OBJECTIVES OF THE STUDY
The main objective of the study is to assess the progressivity and determinants of OOP health
care payments in Zambia.

1.3.1 Specific Objectives
More specifically the study will seek to;
Measure OOP health expenditure as a share of total household expenditure and compare
across different socio-economic groups between 1998 and 2006.
Determine the characteristics of households who make OOP health care payments
Assess factors associated with the amount of OOP health care payments.
Compare the progressivity of OOP payments in 1998, 2004 and 2006
1.4 Literature Review
Out-of-pocket (OOP) health care payments refer to payments made by households at the point of
receiving health services. It includes spending on alternative and/or traditional medicine but may
exclude expenditure on transportation to obtain care and special nutrition as these are related to
different policy levers than payments for health services (World Health Organisation 2005).
OOP is usually contrasted with other forms of paying for health care such as social health
insurance and general tax funding which are in form of prepayments. Health care financing in
Zambia is a combination of all of these payment mechanisms.
There are important issues raised against the use of OOP payments as a means of financing
health care in many countries. Major among these is that of equity. That is, whether paying OOP
is progressive or not. The other important issue is that of financial risk protection. Usually it is
not enough for a financing mechanism to be equitable; it should also offer financial risk
protection to those using it to pay for health care. That is to say, people‟s living standards should
not fall considerably after incurring health expenditures.
1.4.1 Progressivity of OOP payments
A financing mechanism is progressive if high-income groups contribute a higher percentage of
their income than do low income groups (McIntyre et al. 2008). In other words, progressivity
measures the deviation from proportionality in the relationship between health payment and
ability to pay (ATP) (Yu, Whynes & Sach 2008). It reveals the extent of inequality in paying for
health care services between households of unequal ATP. A health payment is progressive if it
accounts for an increasing proportion of ATP as ATP rises. A progressive system means that the
individuals or households with greater ATP are paying more proportionally in financing health
care. Progressivity of OOP payments can easily be determined by comparing ones level of OOP
payments with their total income over a given period of time and then compare this across
different socio-economic classes. It can also be measured in different other ways such as using
the Kakwani index. The Kakwani index (Kakwani 1977) is one of the most common summary
measures of progressivity. It is defined as twice the area between a payment concentration curve
and the Lorenz curve and is calculated by taking the difference between the health payments
concentration curve and the gini coefficient of ATP. A negative Kakwani index indicates
regressivity; while a positive Kakwani index indicates progressivity. In the case of
proportionality the index is zero.
OOP payments have been found to be progressive in some African countries. For example, in
Tanzania, between 1992 and 2002 Manzi et al (2005) found that OOP increased with the level of
socio-economic status, with the least poor paying 2.5 times more than the poorest. This result
was attributed to the presence of user fees and incomplete implementation of exemption and
waiver mechanisms. Hence making everyone to face the same health costs regardless of their
ability to pay which consequently makes the system appear progressive when more payments are
made by those in high socio-economic status compared to those in low socio-economic status. In
1997, O‟Donnell et al (2008) also found that OOP payment was progressive in Egypt. While
assessing various sources of health financing, the authors point out that OOP payment was one of
the sources that contributed to the overall progressivity of the entire health financing system in
Egypt. OOP was progressive compared to other sources of financing such as cigarette tax, social
insurance contributions as well as private insurance premiums which had Kakwani indices of –
0.0061, –0.0532 and –0.0011 respectively while OOP had a Kakwani index of 0.0644. This
progressivity has been associated with the presence of out of pocket payments. However, the
author argues that in as much as OOP was found progressive in Egypt, it was the least
progressive of all the financing sources under investigation. Compared with other sources, direct
personal taxes were the most progressive followed by indirect taxes with Kakwani indices of
0.2501 and 0.1435 respectively.
Outside of Africa, especially in some developing countries, OOP payments have been
progressive. For example in India, Gag and Karan observe that between 1999 and 2000 poorer
quintiles of the population spent a relatively lower proportion of their expenditure OOP than
their rich counterparts. Reasons given are that OOP constituted the largest share of health
expenditure and varied between 80-70% of health expenditure and 95% of private at the
moment. There was also a weak insurance and community financing emerging at the time. The
apparent progressivity was at the expense of the poor households who could not afford to pay out
of pocket as much as the rich households. A similar observation was made in Malaysia by Yu et
al (2008) between 1989 and 1999. The progressivity of OOP observed was as a result of the
switch by the rich to private health services and the predominant reliance on subsidized public
health services by the poor. Implying that, most out of pocket payments were made by those
belonging to high socio-economic status. Other developing countries with progressive OOP
payments for health care include Nepal and Bangladesh in 1996 and 2000 respectively. In Nepal
the reasons for progressivity are that while both the rich and poor use public facilities, the rich
are prescribed expensive medicines while the poor are prescribed cheap medicines. Even then,
the poor cannot afford to buy the prescribed medicines. Hence most of the out of pocket
payments were incurred by the rich. In Bangladesh health was financed almost exclusively from
OOP and tax revenues.
1.4.2 Regressivity of OOP payments
Regressivity is the exact opposite of progressivity and can be measured and determined in a
similar way. In this case, the Kakwani index will be negative.
In Africa a clear demonstration of the regressivity of OOP payments is given in Cisśe et al
(2007). In a study of four francophone West African countries (Ivory Coast, Guinea, Senegal and
Mali) between 1998 and 1999 the authors observe that OOP payments were regressive in all of
the four countries. The authors claim that this regressivity is due to the presence of user fees and
cost recovery policies implemented in the early years before the study was done , making
households to face similar health costs regardless of variations in their ability to pay. Similarly,
Perkins et al (2009) found regressive OOP payments in Burkina Faso, Kenya and Tanzania.

Investigating OOP costs for facility-based maternity care between 2003 and 2006, the authors
conclude that women in the poorest wealth quintile did not pay significantly less for maternity
costs than the wealthiest women. Like in Cisse et al (2007) this regressivity of maternity costs
was attributed to the presence of user fees in health facilities for each of the countries.
Regressive OOP payments were also found in Ghana and South Africa between 2005 and 2006
(Ataguba et al, 2009). In Ghana, the regressivity observed was attributed to the cost-sharing
policies obtaining at the time which lead to high incidence of OOP payments. Additionally,
social health insurance was in its developing stages and could not provide comprehensive cover
for the entire population. In South Africa regressivity of OOP payments was due to the presence
of private financing which exposed poor households to the same health costs as the rich
households.
In other low income countries outside of Africa evidence show that OOP is a regressive way of
paying for health care. For example, in Vietnam, Thuan et al (2006) found that between 2001
and 2002 poorer households paid a larger share of their curative health expenditure compared to
the rich. Reasons being that in earlier decades the government had introduced economic policies
that led to increases in OOP health expenditures. This was despite varying levels of socio-
economic status in the country. In Thailand, Pannarunothai and Mills (1997) observe that under-
privileged families spent OOP as much as 5-6% of their household income on health care
whereas other groups spent 1-2%. Reasons for the regressive OOP payments are that most low
income families lacked health benefit or were without the low income card which would allow
them to access subsidized health care. There was also an increase in the prevalence of user fees
for the uninsured.
1.4.3 Determinants of OOP payments
In conclusion, Rubin and Koellin (1993) identify several factors or characteristics of households
in the United States of America that are likely to incur OOP health care payments. Among them
is household income, age and education of household head, size of the household as well as
health insurance status of the household. Others are housing tenure, household assets, race and
welfare status of a household. The study results showed that single headed households had the
lowest OOP spending while white and high income households including those with higher
education incurred higher levels of medical expenses than lower income and non-white
households. The same was true for the less educated. On the other hand, housing tenure and
household welfare status were negatively related to OOP expenditure. Contrary to the
expectations of the authors that ownership of insurance will lead to low OOP, the insurance
parameter was positive.
1.5 Methods
1.5.1 Data Sources
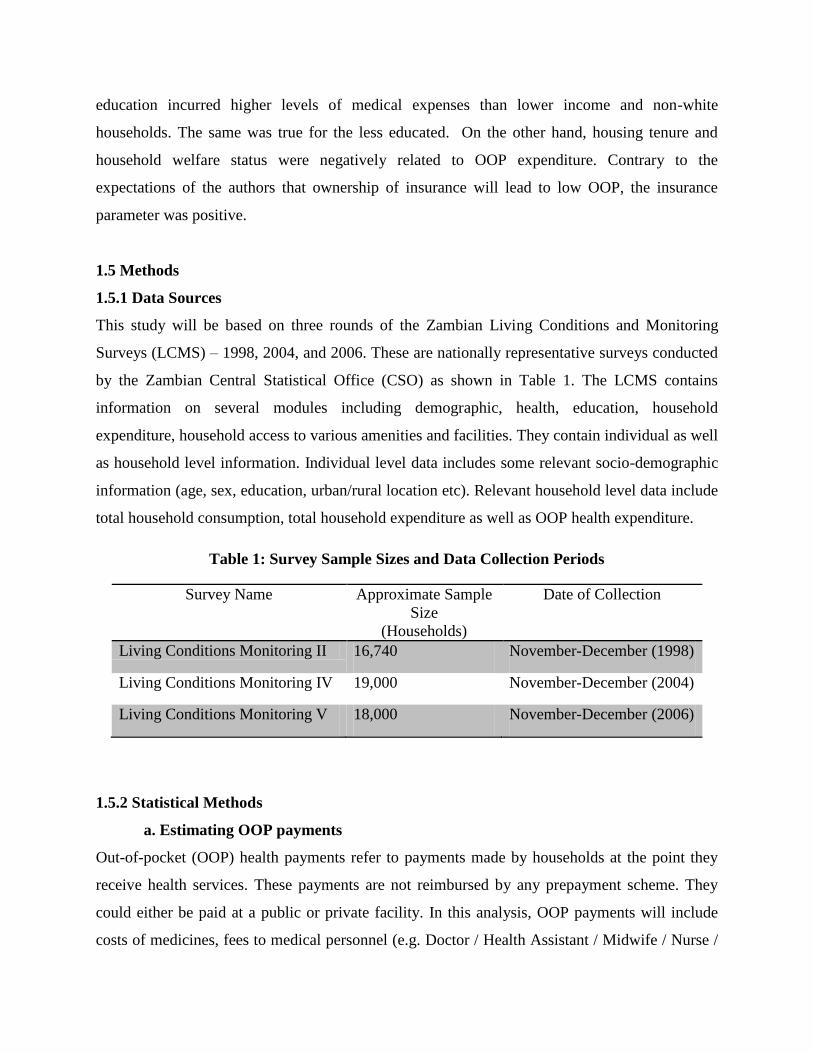
This study will be based on three rounds of the Zambian Living Conditions and Monitoring
Surveys (LCMS) – 1998, 2004, and 2006. These are nationally representative surveys conducted
by the Zambian Central Statistical Office (CSO) as shown in Table 1. The LCMS contains
information on several modules including demographic, health, education, household
expenditure, household access to various amenities and facilities. They contain individual as well
as household level information. Individual level data includes some relevant socio-demographic
information (age, sex, education, urban/rural location etc). Relevant household level data include
total household consumption, total household expenditure as well as OOP health expenditure.
Table 1: Survey Sample Sizes and Data Collection Periods
Survey Name Approximate Sample
Size
(Households)
Date of Collection
Living Conditions Monitoring II 16,740 November-December (1998)
Living Conditions Monitoring IV 19,000 November-December (2004)
Living Conditions Monitoring V 18,000 November-December (2006)
1.5.2 Statistical Methods
a. Estimating OOP payments
Out-of-pocket (OOP) health payments refer to payments made by households at the point they
receive health services. These payments are not reimbursed by any prepayment scheme. They
could either be paid at a public or private facility. In this analysis, OOP payments will include
costs of medicines, fees to medical personnel (e.g. Doctor / Health Assistant / Midwife / Nurse /

Dentist, etc), payments to hospital/health centre/surgery as well as fees to traditional healer.
However, expenditure on health-related transportation will be excluded. This avoids imputation
of transport costs for households using private means of transportation. Total OOP expenditures
for each household will be adjusted by adult-equivalent household size to reflect each household
member‟s OOP payment experience.
b. Measuring Socio-economic Status
Total household expenditure will be used to estimate household socio-economic status in all the
three periods considered. This is in line with the World Bank‟s recommendations for developing
countries (Grosh, Glewwe 2000). Compared to income, there is less variability in household
expenditure. Furthermore, total household expenditure will be adjusted for household size and
composition using equivalised household size to obtain equivalent household expenditure.
Equivalised household size will be obtained as follows:
Where eqsize represents the number of consumption equivalents in the household
and hhsize is the actual size. The value of β is estimated at 0.56 from data from 59 countries
using fixed effects regression (Xu et al. 2003). This value is now being used as representative
value in empirical studies of this nature Households will further be categorized into five quintiles
of socio-economic status using the equivalent household expenditure. In all analyses, sample
weights will be applied and the unit of analysis is the household. All analyses will be carried out
using STATATM
10 software.
c. Estimating Progressivity of OOP Payments.
To estimate the progressivity of OOP payments the study will first estimate OOP payment as a
percentage of total household expenditure. Progressivity of OOP payments will be assessed
using the Kakwani Index of progressivity (Kakwani 1977). This is defined as the difference
between the Gini coefficient for income (or expenditure) distribution (G) and the concentration
index for the distribution of OOP payments (C). The Gini index follows a univariate distribution
(i.e. solely measures income distribution (ability to pay) while the concentration index follows a
bivariate distribution. For example, in this case comparing the distribution of out of pocket

payments to household ability to pay variable e.g. total household expenditure. The Gini index is
the ellipse-shaped area between the Lorenz Curve (Figure 1) as a proportion of the total area
under the diagonal. It is therefore equal to one minus the area under the Lorenz Curve and ranges
from zero (when there is complete equality and the Lorenz Curve coincides with the diagonal) to
1 (when all income is concentrated in the hands of one person). The concentration index (C) on
the other hand is defined in exactly the same way except that the concentration curve L(s) is used
instead of the Lorenz curve. Both the Concentration and Gini index can be calculated by;
Where C is the concentration or Gini index, yi is the health payments (for C) or the measure of
living standards (for G) and Ri is the fractional rank of the living standards measure (i.e.
expenditure.)
Figure 1: Gini Coefficient (Index)
Kakwani index of progressivity is then derived from these two indices and is twice the area
between the concentration curve for OOP payments and the Lorenz curve. This is defined as:
Kπ = C– G

Where C is the concentration index for health payments and G is the Gini coefficient of the
ability to pay (ATP) variable (i.e. equivalent expenditure). If OOP expenses are a progressive
(regressive) source of financing, the concentration curve will lie below (above) the Lorenz curve,
and Kπ will be positive (negative). If OOP payments are perfectly correlated with income, Kπ will
be zero and the financing source will be proportional. Proportionality could also arise when these
curves cross each other. However, while visual inspection of concentration curves, Lorenz Curve
and the line of equality may give an impression of whether there is dominance, this may not be
sufficient to conclude whether or not dominance is statistically significant. It is also true to say
that concentration curves are estimated from survey data, and so may display sampling
variability. Therefore, it is important to provide statistical tests of dominance between the curves.
To confirm dominance of concentration curves, dominance tests to see if the concentration curve
dominate the Lorenz curve in each year will be carried out for all the three years under analysis
using the multiple comparison approach (MCA) decision rule, with comparisons at 19 equally
spaced quintile points and a 5 percent significance level (O‟Donnell et al. 2008).
d. Factors determining OOP payments
Model specification
A logistic regression will be used to assess the factors determining OOP payments. The model is
thus specified in general as:
iXyi
Where, OOP payments (a binary outcome) is the dependent variable (y*). It is 1 if household
OOP payments is greater than 0 (oop > 0) and a value of 0 otherwise. Independent variables (Xi)
are defined in table 1.5.2. Additionally, α is the constant and βi the coefficients being estimated.
e. Factors determining size of OOP payments
Tobit model will be used to assess the factors determining the magnitude of OOP payments. This
is because the dependent variable (oop) is limited or censored. There is a sufficiently large
number of OOP expenditures reported as zero. For example, only about 38% of households in all
three surveys reported positive OOP payments, the rest of the observations are zeros. For such
limited dependent variables the Tobit model (Tobin 1958) or sample selection models are usually

a preferred model of analysis compared to the usual OLS. The Tobit model like other sample
selection models assumes a truncated or censored dependent variable and uses all observations,
both those at the lower limit and those above it, to estimate independent effects.
The intuition behind a Tobit model is such that first, we have a latent model where the dependent
variable, say, yi*, which has some independent variables and coefficients and a disturbance term
that is normally distributed with a mean of zero. However, we have censoring at zero. Thus we
have an observed yi that equals yi* if the value of yi* is greater than zero, but equals zero if the
value of the unobserved yi* is less than or equal to zero.
The Tobit model is thus represented by:
Where, yi* is the latent dependent variable, in this case OOP payments equal to or below zero
(oop ≤ 0), yi is the observed dependent variable, i.e. positive OOP payments (oop > 0). Xi is the
vector of the independent variables, same as those in table 1.5.2. β is the vector of coefficients,
and the εi‟s are assumed to be independently normally distributed: εi ~N(0; σ) (and therefore yi
~N(xi β, σ).
The Tobit model has been applied in many similar studies. For example, in Mugisha et al. (2002)
in Burkina Faso to estimate OOP expenditure on health care where information was available for
independent variables (age, sex and income) but limited for the dependent variable (OOP
expenditure) . The Tobit model has also been applied in Taiwan to assess health expenditure for
the elderly where a good number of health expenditures were unreported (Chi, Hsin 1999).
Stoddard and Gray (1997) also used the Tobit model to estimate maternal smoking and medical
expenditures for childhood respiratory illness where the analysis included a large number of
children with no respiratory-related medical expenditures.
In this paper, the variables used in the regression analyses are presented and described in table 2
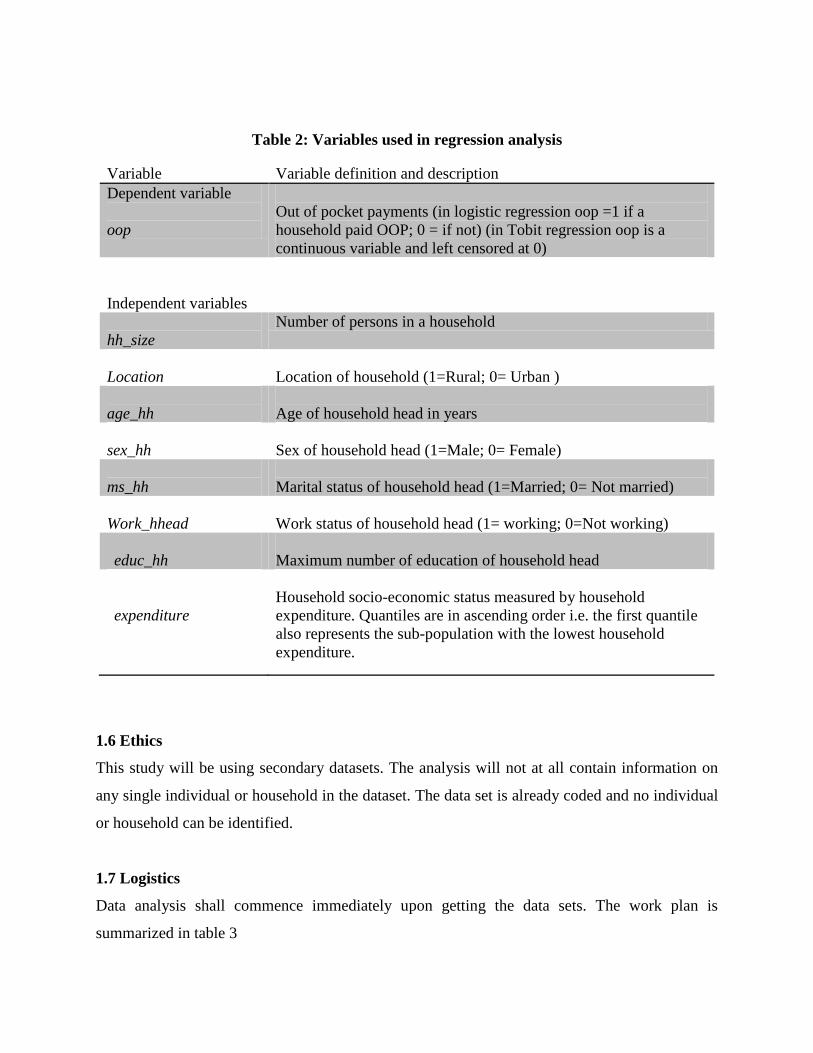
Table 2: Variables used in regression analysis
Variable Variable definition and description
Dependent variable
oop
Out of pocket payments (in logistic regression oop =1 if a
household paid OOP; 0 = if not) (in Tobit regression oop is a
continuous variable and left censored at 0)
Independent variables
hh_size
Number of persons in a household
Location
Location of household (1=Rural; 0= Urban )
age_hh
Age of household head in years
sex_hh
Sex of household head (1=Male; 0= Female)
ms_hh
Marital status of household head (1=Married; 0= Not married)
Work_hhead
Work status of household head (1= working; 0=Not working)
educ_hh
Maximum number of education of household head
expenditure
Household socio-economic status measured by household
expenditure. Quantiles are in ascending order i.e. the first quantile
also represents the sub-population with the lowest household
expenditure.
1.6 Ethics
This study will be using secondary datasets. The analysis will not at all contain information on
any single individual or household in the dataset. The data set is already coded and no individual
or household can be identified.
1.7 Logistics
Data analysis shall commence immediately upon getting the data sets. The work plan is
summarized in table 3
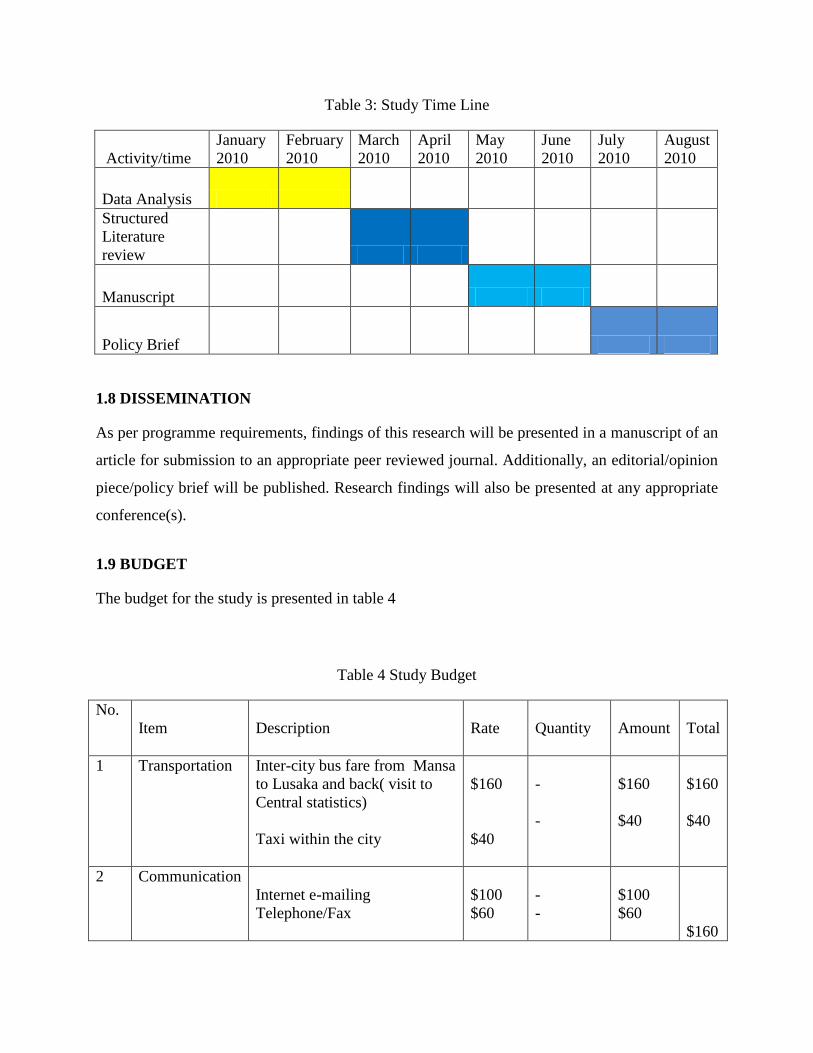
Table 3: Study Time Line
Activity/time
January
2010
February
2010
March
2010
April
2010
May
2010
June
2010
July
2010
August
2010
Data Analysis
Structured
Literature
review
Manuscript
Policy Brief
1.8 DISSEMINATION
As per programme requirements, findings of this research will be presented in a manuscript of an
article for submission to an appropriate peer reviewed journal. Additionally, an editorial/opinion
piece/policy brief will be published. Research findings will also be presented at any appropriate
conference(s).
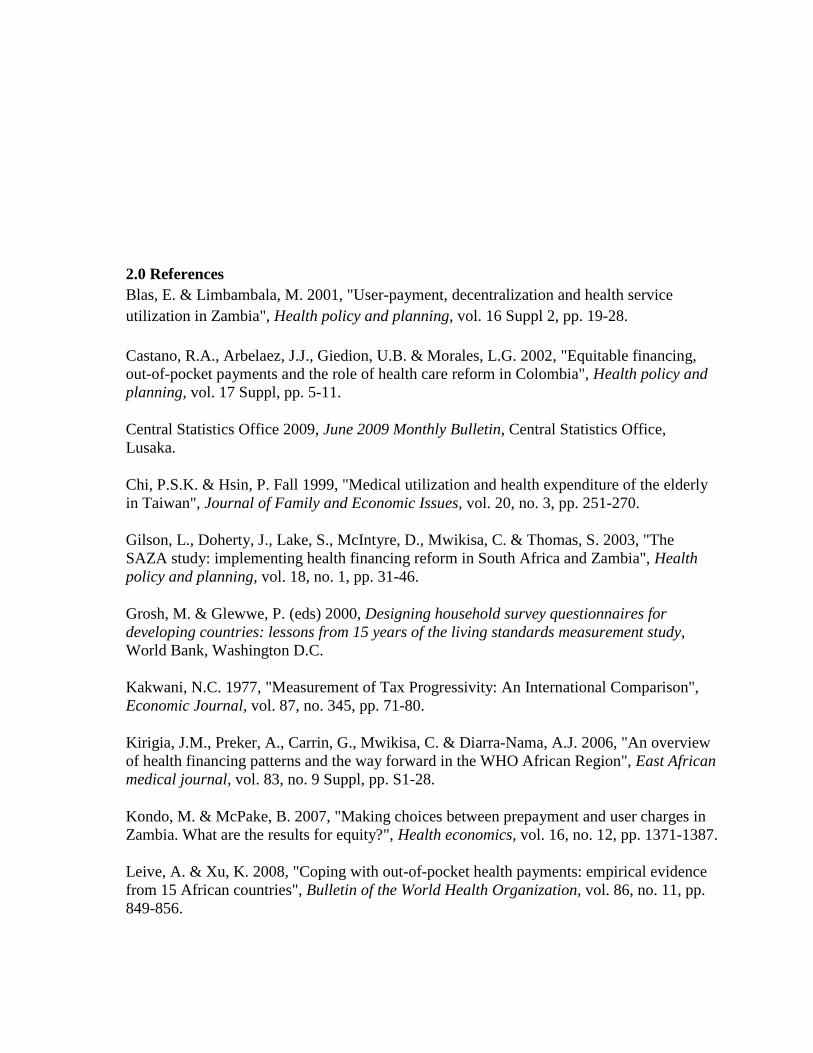
1.9 BUDGET
The budget for the study is presented in table 4
Table 4 Study Budget
No.
Item
Description
Rate
Quantity
Amount
Total
1 Transportation Inter-city bus fare from Mansa
to Lusaka and back( visit to
Central statistics)
Taxi within the city
$160
$40
-
-
$160
$40
$160
$40
2 Communication
Internet e-mailing
Telephone/Fax
$100
$60
-
-
$100
$60
$160

4 Stationery Protocol $0.1/page x 25pages
Structured Lit Review
$0.1/page x 35pages
Manuscript $0.1/page x
35pages
Policy Brief $0.1/page x
25pages
Binding of each
Data storage device
Pens
Pencils
Writing pad
Small Bag (safe keeping of all
paper work etc)
$2.5
$3.5
$3.5
$2.5
$6
$70
$3
$3
$3
$15
10 copies
10 copies
10 copies
10 copies
4 copies
8 gigs
1 packet
1 packet
2
1
$25
$35
$35
$25
$24
$70
$3
$3
$6
$15
$241
5 Other Costs miscellaneous $60 - $60 $60
6 Grand Total $661
2.0 References
Blas, E. & Limbambala, M. 2001, "User-payment, decentralization and health service
utilization in Zambia", Health policy and planning, vol. 16 Suppl 2, pp. 19-28.
Castano, R.A., Arbelaez, J.J., Giedion, U.B. & Morales, L.G. 2002, "Equitable financing,
out-of-pocket payments and the role of health care reform in Colombia", Health policy and
planning, vol. 17 Suppl, pp. 5-11.
Central Statistics Office 2009, June 2009 Monthly Bulletin, Central Statistics Office,
Lusaka.
Chi, P.S.K. & Hsin, P. Fall 1999, "Medical utilization and health expenditure of the elderly
in Taiwan", Journal of Family and Economic Issues, vol. 20, no. 3, pp. 251-270.
Gilson, L., Doherty, J., Lake, S., McIntyre, D., Mwikisa, C. & Thomas, S. 2003, "The
SAZA study: implementing health financing reform in South Africa and Zambia", Health
policy and planning, vol. 18, no. 1, pp. 31-46.
Grosh, M. & Glewwe, P. (eds) 2000, Designing household survey questionnaires for
developing countries: lessons from 15 years of the living standards measurement study,
World Bank, Washington D.C.
Kakwani, N.C. 1977, "Measurement of Tax Progressivity: An International Comparison",
Economic Journal, vol. 87, no. 345, pp. 71-80.
Kirigia, J.M., Preker, A., Carrin, G., Mwikisa, C. & Diarra-Nama, A.J. 2006, "An overview
of health financing patterns and the way forward in the WHO African Region", East African
medical journal, vol. 83, no. 9 Suppl, pp. S1-28.
Kondo, M. & McPake, B. 2007, "Making choices between prepayment and user charges in
Zambia. What are the results for equity?", Health economics, vol. 16, no. 12, pp. 1371-1387.
Leive, A. & Xu, K. 2008, "Coping with out-of-pocket health payments: empirical evidence
from 15 African countries", Bulletin of the World Health Organization, vol. 86, no. 11, pp.
849-856.

Malama, C., Chen, Q., De Vogli, R. & Birbeck, G.L. 2002, "User fees impact access to
healthcare for female children in rural Zambia", Journal of tropical pediatrics, vol. 48, no.
6, pp. 371-372.
Masiye, F., Chitah, B., Chanda, P. & Simeo, F. 2008, Removal of User fees at primary
health care facilities in Zambia: A study of the effects on utilisation and quality of care,
EQUINET Discussion paper series 57, EQUINET, UCT HEU:Harare.
Masiye, F., Chitah, B.M. & McIntyre, D. 2010, "From targeted exemptions to user fee
abolition in health care: Experience from rural Zambia", Social science & medicine (1982), .
Mastilica, M. & Bozikov, J. 1999, "Out-of-pocket payments for health care in Croatia:
implications for equity", Croatian medical journal, vol. 40, no. 2, pp. 152-159.
McIntyre, D., Gilson, L. & Mutyambizi, V. 2005, Promoting equitable health care
financing in the African context: current challenges and future prospects. Equinet
Discussion paper 27, EQUINET, Sweeden.
McIntyre, D., Garshong, B., Mtei, G., Meheus, F., Thiede, M., Akazili, J., Ally, M., Aikins,
M., Mulligan, J.A. & Goudge, J. 2008, "Beyond fragmentation and towards universal
coverage: insights from Ghana, South Africa and the United Republic of Tanzania", Bulletin
of the World Health Organization, vol. 86, no. 11, pp. 871-876.
McIntyre, D., Thiede, M., Dahlgren, G. & Whitehead, M. 2006, "What are the economic
consequences for households of illness and of paying for health care in low- and middle-
income country contexts?", Social science & medicine (1982), vol. 62, no. 4, pp. 858-865.
McPherson, M.F. 1995, The Senquencing of Economic Reforms: Lessons from Zambia,
Netherlands.
Ministry of Health 2005,National Health Strategic Plan2006-2010 ' Towards Attainment of
the Millennium Development Goals and National Health Priorities', Ministry of Health,
Lusaka.
Ministry of Health Zambia 2006, National Health Accounts for Zambia 2002 - 2004,
Ministry of Health, Lusaka.
Ministry of Health/ Central Board of Health 1998, National Health Acconts 1995-1998,
Ministry of Health, Lusaka.
Ministry of Health/Republic of Zambia. 2004, National health care financing policy,
Ministry of Health, Lusaka.
Mugisha, F., Kouyate, B., Gbangou, A. & Sauerborn, R. 2002, "Examining out-of-pocket
expenditure on health care in Nouna, Burkina Faso: implications for health policy", Tropical
medicine & international health : TM & IH, vol. 7, no. 2, pp. 187-196.
Musgrove, P., Zeramdini, R. & Carrin, G. 2002, "Basic patterns in national health
expenditure", Bulletin of the World Health Organization, vol. 80, no. 2, pp. 134-142.
O‟Donnell, O., van Doorslaer, E., Wagstaff, A. & and Lindelow, M. 2008, Analyzing health
equity using household survey data. A guide to techniques and their implementation, The
World Bank, Washington, D.C.
O'Donnell, O., van Doorslaer, E., Rannan-Eliya, R.P., Somanathan, A., Adhikari, S.R.,
Akkazieva, B., Harbianto, D., Garg, C.C., Hanvoravongchai, P., Herrin, A.N., Huq, M.N.,
Ibragimova, S., Karan, A., Kwon, S.M., Leung, G.M., Lu, J.F., Ohkusa, Y., Pande, B.R.,
Racelis, R., Tin, K., Tisayaticom, K., Trisnantoro, L., Wan, Q., Yang, B.M. & Zhao, Y.
2008, "Who pays for health care in Asia?", Journal of health economics, vol. 27, no. 2, pp.
460-475.
Pannarunothai, S. & Mills, A. 1997, "The poor pay more: health-related inequality in
Thailand", Social science & medicine (1982), vol. 44, no. 12, pp. 1781-1790.
Perez-Rico, R., Sesma-Vazquez, S. & Puentes-Rosas, E. 2005, "Catastrophic health
expenditures in Mexico: comparative study by social exclusion level", Salud publica de
Mexico, vol. 47 Suppl 1, pp. S47-53.
Rasell, E., Bernstein, J. & Tang, K. 1994, "The impact of health care financing on family
budgets", International journal of health services : planning, administration, evaluation,
vol. 24, no. 4, pp. 691-714.
Republic of Zambia 2006, Vision 2030. "A prosperous middle-income country by 2030",
Republic of Zambia, Lusaka.
Ridde, V. & Haddad, S. 2009, "Abolishing user fees in Africa", PLoS medicine, vol. 6, no.
1, pp. e1000008.
Rubin, M.R. & Koelln, K. 1993, "Determinants of household out of pocket health
expenditures", SOCIAL SCIENCE QAURTERLY, vol. 74, no. 4, pp. 721.
Stoddard, J.J. & Gray, B. 1997, "Maternal smoking and medical expenditures for childhood
respiratory illness", American Journal of Public Health, vol. 87, no. 2, pp. 205-209.
Tobin, J. 1958, "Estimation of Relationships for Limited Dependent Variables.",
Econometrica, vol. 26, no. 1, pp. 24-36.
van der Geest, S., Macwan'gi, M., Kamwanga, J., Mulikelela, D., Mazimba, A. &
Mwangelwa, M. 2000, "User fees and drugs: what did the health reforms in Zambia
achieve?", Health policy and planning, vol. 15, no. 1, pp. 59-65.

Wagstaff, A. & van Doorslaer, E. 2003, "Catastrophe and impoverishment in paying for
health care: with applications to Vietnam 1993-1998", Health economics, vol. 12, no. 11,
pp. 921-934.
Wilkinson, D., Gouws, E., Sach, M. & Karim, S.S. 2001, "Effect of removing user fees on
attendance for curative and preventive primary health care services in rural South Africa",
Bulletin of the World Health Organization, vol. 79, no. 7, pp. 665-671.
World Health Organisation 2010, , World Health Statistics [Homepage of World Health
Organisation], [Online]. Available:
http://apps.who.int/whosis/data/Search.jsp?countries=[Location].Members [2010, March] .
World Health Organisation 2005, Elimination of user fees in Uganda: impact on utilisation
and catastrophic health expenditures. Discussion paper Number 4, World Health
Organisation;, Geneva.
Xu, K., Evans, D.B., Kadama, P., Nabyonga, J., Ogwal, P.O., Nabukhonzo, P. & Aguilar,
A.M. 2006, "Understanding the impact of eliminating user fees: utilization and catastrophic
health expenditures in Uganda", Social science & medicine (1982), vol. 62, no. 4, pp. 866-
876.
Xu, K., Evans, D.B., Kawabata, K., Zeramdini, R., Klavus, J. & Murray, C.J. 2003,
"Household catastrophic health expenditure: a multicountry analysis", Lancet, vol. 362, no.
9378, pp. 111-117.
Yu, C.P., Whynes, D.K. & Sach, T.H. 2008, "Equity in health care financing: The case of
Malaysia", International journal for equity in health, vol. 7, pp. 15.

Part B
Structured Literature Review
OVERVIEW
Low and middle income countries account for about 5.6 billion people. In these countries, more
than 50% of all health-care is financed directly out of pocket (World Health Organisation 2008).
This creates barriers to accessing needed health care for families that cannot afford to pay. It
also exposes them to catastrophic health expenditures. Globally, out of pocket payments are
responsible for pushing more than 100 million people annually into poverty. This also results in
catastrophic health expenditures (Xu et al. 2007). In Sub-Saharan Africa, out of pocket (OOP)
payments is one of the single largest sources of health financing, forcing households to borrow or
sell their assets in their efforts to meet health care costs thereby restricting long-term economic
survival (McIntyre et al. 2006, Leive, Xu 2008). With the poor and marginalized segments of
society having a greater need for health care than their rich counterparts in most cases (CSDH
2008, Zere et al. 2007, Pannarunothai, Mills 1997), it means the poor will continue to bear the
greatest burden of health financing especially where out of pocket payments are predominant.
This may greatly restrict the poor from accessing health care.
This paper presents a detailed review of the international literature on the assessment of the
progressivity and determinants of out of pocket payments and brings to light methodological
differences that exist in different studies. The review identifies some important methodological
limitations from various studies and how these may affect study results especially in the
assessment of progressivity of out of pocket payments. The review is divided into three sections.
Section one provides the detailed theoretical framework regarding health care distribution. It
explores the meanings of equity (vertical and horizontal), background theories of equity in health
and health care financing, and theories of distributive justice. This section also discusses the
methodologies used in assessing progressivity in health care financing. Section two presents
empirical studies noting the search methodology and inclusion/exclusion criteria and the results.
This is followed by a conclusion and explanation of the limitations of the studies. Section three is
a summary of the determinants of out of pocket payments drawn from various studies.
SECTION ONE: THEORETICAL REVIEW
1.1 Introduction
Hurley notes that among the various “goods” that contribute to the ultimate end (happiness,
capabilities and functions, fulfilment of a rational life plan etc), health is often accorded special
ethical significance. This is because it is necessary to achieving most intermediate and ultimate
ends (Hurley 2001). Grossman (1972) made this notion clearer in his famous model. In its
simplest form, the model postulates health as an economic commodity which consumers demand
for two reasons; firstly, as a consumption commodity which directly enters an individual‟s
preference functions, i.e. as an end in itself because human beings enjoy being in a state of good
health. Ill-health is a source of disutility. Secondly, as an investment commodity that determines
the total amount of time available for market and nonmarket activities. Therefore, if an
individual is sick they are deprived of the time to involve in activities that will enhance their
lives such as going to work, going to school, visiting friends, doing physical exercises, and so on.
Grossman‟s model further points out that every individual is initially born with a stock of health
which depreciates with time, and this stock of health can be affected by consuming market goods
such as health care, housing, diet, recreation, cigarette smoking, and alcohol consumption.
Although the model does not restrict the goods that enhance health to health care alone, health
care has remained the main subject of focus in health economics. This is so because of the
important role it plays in enhancing health even though it is not the sole determinant of health
outcomes of populations. Health care is generally defined to include those goods, services and
activities that the primary purpose is the maintenance or improvement of health (Hurley 2001).
Because of this, Grossman described the nature of demand for health care as a „derived demand‟,
in the sense that it is not demanded and purchased for its own sake per se, but for the good health
that can be derived from its consumption.

1.2 Distribution of Health Care
1.2.1 The market as a guide in the distribution of health care
Grossman‟s work is a great contribution to our understanding of a significant end (individual‟s
health) that health care serves. This link between health care and health is important in health
economics. The Commission on the Social Determinants of Health of the World Health
Organization adds that, without health care, many of the opportunities for fundamental health
improvement are lost (CSDH 2008). Implying that, health care presents its consumers with
opportunities to improve their health and lives without which they will not be able to function
properly. Reinhardt (1989) adds that health care actually represents a very broad set of goods and
services that spans the entire spectrum from a purely private consumption goods (say, face
surgery), to purely social goods such as immunisation that the society wishes to make available
to all citizens regardless of peoples‟ ability to pay. Similarly, it has been pointed out that health
care, whether curative or preventive, is regarded as a merit good - a commodity that ought to be
available for use by everyone irrespective of ability to pay (Mwabu 1997).
However, as important as health care is, the question of how it should be distributed to afford all
members of society a sufficient share to enhance their health is a subject of debate among
researchers and policy makers. It is often argued that, since health care can be purchased in a
market, its distribution should be left to market forces. On the contrary, while traditional
microeconomic theory believes that under ideal conditions competitive markets will provide
optimal allocative outcomes (Jan 1999), it has not been the case for health care. The assumption
of conventional economic theory is that all things being equal, demand for goods and services
will equalize with the supply of such services at a given time. When this is fulfilled economists
claim that the market for such goods and services has cleared or is in equilibrium. In other
words, all needs are met; everyone has gotten exactly what they needed, there is neither a
shortfall nor a surplus. In terms of health care, this may mean that the amount of health care
services that any given individual or group of people may require will be provided in the exact
proportions as they are needed. But this is not what is usually observed in most situations
regarding health care. Rather, what is usually observed is a situation where health care needs far
more out-weigh health care resources. In other words, the allocation of health care resources
does not seem to comply with conventional economic theory. This is because unlike ordinary
market goods, health care goods are said to have attributes that defeat the assumptions of
competitive market equilibrium under which the market forces of demand and supply can
flourish. There are many reasons for the failure of economic assumptions. Some of them include;
information asymmetry between producers (medical professionals) and consumers (patients);
imperfect agency relationships between patients and physicians; incomplete markets especially
those for risk; existence of monopolies in the pharmaceutical industry as well as local
monopolies held by hospitals. Also that much of health care has characteristics of a public good
(Culyer 2005). These assumptions have been widely explored in most of health economics
literature (Hurley 2001, Rice 2003). Because of this, it is often thought that public intervention
is necessary in the distribution of health care. In line with this, if the allocation of health care was
left to market forces of demand and supply, those sections of society with no effective demand
due to inadequate purchasing power may be left out no matter their need for it. This may result
in undesirable consequences because of the link between health care and health. Hurley (2001)
argues that it is therefore a matter of justice that those in ill health receive treatment based on
their need for health care, not based on market attributes such as ability-to-pay.
However, the distribution of health care cannot be said to have been just as Hurley argues. There
is overwhelming evidence of health inequalities at both international and country level which
result partly from unfair distribution of health care. For example, within countries there are
dramatic differences in health, with the poorest having high levels of illness and premature
mortality compared to their richer counterparts (CSDH 2008). These inequalities are attributed to
a large extent to differences in access to and availability of health care. Reducing these
inequalities and achieving justice in the distribution of health care is an important issue of health
policy in many countries. However, while countries strive to do so, many of them are confronted
with the question of what is actually meant by a just distribution. Many researchers have tried to
provide answers to this question but it still remains a subject of debate among different scholars.
Some of these debates are discussed below. They are discussed in relation to financing and
distribution of health care.
1.2.2Theories of distributive justice as a guide in the distribution of health care
Theories of distributive justice can serve as a guide in the distribution of various goods and
services including health care. The most common of these theories, discussed in detail in the
following sections, include utilitarianism, egalitarianism, libertarianism and the maximin.
a. Utilitarianism
According to utilitarianism, utility is at the center of every society (Rabinowciz 2000, Metz
2003, Barry 1989, Schroth 2008). Its focus is the maximization of happiness or well-being and
the minimization of unhappiness or pain. Utilitarianism in broad terms may include such things
as pleasure, satisfaction, good health and being able to achieve one‟s goals in life
(Hoedemaekers, Dekkers 2003). A just distribution is one that maximizes the aggregate utility,
seen as the sum total of individual utilities (Schroth 2008). Therefore, in terms of health care
financing, the need is for financing those interventions or a set of policies that will achieve the
greatest health coverage and subsequent health outcomes for the greatest number of people. In
this case, health care financing policies are only good so long as they maximize the total number
of people to be covered in the population. However, it is important to understand whose utility is
to be maximized here. For example, if it is the utility of an individual, he or she would spend all
her or his money or resources on health care until they get maximum health (if this can be
determined) i.e. until their marginal utility from each unit of money spent equals zero. On the
other hand, if it is the government (depending on its utility function) it will spend all available
resources until this is fulfilled. The bottom line is maximization of utility.
Nonetheless, utilitarianism has been criticized in many ways, including the fact that its exclusive
emphasis is on maximizing the total amount of utility at the expense of any concern, including
how the utility is distributed among individuals (Barry 1989, Schroth 2008). For example, take
countries where private financing (private health insurance and OOP payments) is predominant.
As wide as the coverage for private insurance may be, the system may care less about the initial
income of payers. This is important because if low-income households pay proportionally the
same as high-income earners then the system becomes inequitable. The same applies for OOP
payments. Utilitarians are often criticized for ignoring individual freedom (Olsen 1997). This is
because only consequences matter.
b. Egalitarianism
Egalitarianism is in two forms namely, strong egalitarianism and Rawlsian type egalitarianism
(Olsen 1997). In Rawlsian egalitarianism inequalities are accepted as long as they benefit the
worst-off (or there is no way of further securing the worst-off). This is the type that is widely
applied in health care distribution. The basic belief is that of equality of human beings and the
creation of possibilities for people to become as equal to others as possible (Veatch 1998,
Tsuchiya, Dolan 2009, Rawls 1971, Williams 1988). In terms of health care financing, this may
mean equality of payments or contributions based on one‟s resources. This is also referred to as
the egalitarian principle (Wagstaff et al. 1992). Egalitarianism therefore aims at distributing
access to health care according to need (Veatch 1998). Williams points out that in the egalitarian
system of health care provision, equal opportunity of access for those in equal need should be the
dominant ethic, and that there should be establishment of the social hierarchy of need which
should not be linked to who is paying for the care. As such „it dictates public provision‟ of health
care (Williams 1988). Public provision may mean financing health care by taxation and/or social
health insurance to cover even non-payers.
However, financing health care the egalitarian way has a number of policy implications. To
begin with, tax funding and social health insurance are the most appropriate financing
mechanisms under which the egalitarian ethic of contributing according to ability to pay but
benefiting according to need can be applicable. It follows that those who cannot afford to pay for
health care will shift their burden of financing to those who can afford it. In the case of tax
funding, a country needs to have a sufficient tax base for it to generate sufficient resources to go
round. This is possible if the formal sector is large enough. Because of this, financing health care
the egalitarian way has been a major challenge in poor regions of the world, such as sub-Saharan
Africa, with a large informal sector.
c. Libertarianism
According to this ethic, individual liberty is the fundamental and only concern of any just society
(Narveson 1988). In this model, nothing is as important as the right to personal freedom and
private property (Barry 1989, Rawls 1971, Narveson 1988). Proponents argue that the state
should not interfere when citizens claim and exert these rights. If anything, its intervention
should be minimal, limited to the narrow functions of protection against force, fraud,
enforcement of contracts, and so on (Nozick 1974). It follows from this that the libertarian would
support a health care financing system based on the free-market principle, that is, allocation of
health care should be left to the market forces of demand and supply-without state intervention.
That said, willingness and ability to pay should be the dominant ethic in the liberal system of
health care provision. Hoedemaekers and Dekkers (2003) add that in this society, every
individual pays for his/her own individual needs, including medical needs. These are paid for
directly or indirectly through private health insurance and/or OOP payments. Some view access
to health care as part of the society‟s reward system, and, at the margin at least, people should be
able to use their income and wealth to get more or better health care than their fellow citizens
should they so wish (Williams 1988).
However, libertarianism has a number of inconsistencies which may raise important concerns as
a way of financing health care. Since market allocation is determined by prices, private sector
financing would deny health care to those without ability to pay. This is common in low and
middle income countries for example where members of private insurance schemes tend to be
small groups of people who belong to high socio-economic groups (Ataguba et al. 2009). For the
same reason there could be a great concern for market failure which the government may need to
correct for. In Africa the liberal theories became rampant in the early 1980s which revolutionized
many health systems in a number of countries such as Ghana, Tanzania and Zambia to mention a
few (Kondo, McPake 2007, Masiye et al. 2008, Nyonator, Kutzin 1999, McIntyre et al. 2008).
The main themes of the reforms were market liberalization and privatization of economies which
led to major changes in the way health care was financed. In the three countries mentioned above
the reforms took the form of the involvement of the private sector in the provision and financing
of health services, the removal of subsidies in health care, the introduction of cost sharing to pay
for health care as well as the introduction of user fees in public health facilities. This resulted in
reduced health care utilization due to lack of financial access to health care services. In Zambia,

in some instances, patients were turned away from health facilities because they could not pay
for services (Kondo, McPake 2007). User fees have since been abolished in Zambia in 2006 in
order to pursue more equity-oriented health financing mechanisms (Masiye et al. 2008). In other
countries around the world health systems are now being called upon to adopt health financing
mechanisms that do not discriminate against users of health services based on their ability to pay.
d. Maximin (John Rawls)
In his book, A theory of Justice Rawls (Rawls 1971) proposes two principles of justice. The first
principle emphasizes equality of basic or primary rights. The second is that social and economic
inequalities, if they exist, be (a) to the benefit of the least advantaged and (b) attached to
positions and offices open to all. The first principle should be fulfilled if the second is to be
realized. All people should have a fair share of primary goods. Hence, the maximin is about a
distribution principle which maximizes well-
being for those with the least. Rawls then proposes that if people were to enter into a social
contract behind the veil of ignorance, that is a situation in which they were unaware of the social
contingencies and the accidents of natural endowment, then they would unanimously choose to
maximize the primary goods for the worst off, the reason being that each individual would not
want to be the one to end up in this position.
Harsanyi (1975) is one of the many critics of Rawls‟ theory. He criticizes Rawls‟ idea of giving
priority to the worst-off, noting that the difference principle requires that absolute priority is
given to the interests of the worst-off individual, even under the most extreme conditions. He
further observes that under this ethic, even if the individual‟s interests were affected only in a
very minor way, and all other people in society had opposite interests of the greatest importance,
his or her interests would always override anybody else's. This may find problems of
applicability in health care financing, because by implication resource allocation or priority
setting in terms of administering health interventions may focus on who is least advantaged or
has the worst health status. However, current health policies are guided partly by cost-
effectiveness assessments to determine the worth of certain health projects, and health status
alone is not enough in determining health expenditure. Rawls has also been criticized for
operating with a vague distribuendum (the object to distribute). According to Olsen, it is not

solely income, or welfare or utility, but a composition of so-called 'primary goods'; rights and
justice, power and opportunities, income and welfare. In addition, he argues that health is not
included as a primary good (Olsen, 1997).
In response to some of the criticisms, Rawls states that the maximin criterion is not meant to be
applied to small-scale situations, such as say, how a doctor should treat his patients. He further
argues that the Maximin is a macro not a micro principle (Rawls 1974). Regarding health care
financing, the maximin principle would be difficult to apply especially in health systems where
private financing is predominant. In this case the worst-off may actually not receive any health
care especially if they cannot afford it. This principle can however be applicable in a progressive
tax funded system.
In summary, this section has reviewed the market as well as theories of distributive justice as
means by which health care goods and services may be distributed. The review has also taken
time to highlight the failed assumptions of traditional economic theory in relation to health care
distribution. The pros and cons of the theories of justice under discussion have also been
highlighted. Despite the highlighted shortcomings of each of the theories of distributive justice,
this study still favors the Egalitarian theory. This is because in egalitarianism the main principle
guiding resource distribution is equality of human beings. In terms of financing health care
egalitarianism argues that an equitable health care financing system is one in which payments for
health care are positively related to ability to pay (Wagstaff et al. 1992). In this theory, it is
regarded as right and proper that persons who are able to pay more towards health care should do
so. Progressivity studies are based on this. Progressivity studies tend to investigate how health
care payments are related to ability to pay. It is desirable in most health systems that health care
payments are progressive, that is, let those who have more pay more and those who have less pay
less. This is what is referred to as equitable financing of health care.
1.3 The Meaning of Equity in Health Care Financing
The theories of justice are no doubt instrumental in guiding the way health care resources may be
distributed. Though different, each approach seems to justify what is defined as „equitable‟. In
health care financing the concept of equity is widely acknowledged to be an important policy

objective (Wagstaff, van Doorslaer & Paq 1989), but it is at the same time a much-debated
subject (Olsen 1997). Culyer and Wagstaff (1993) observe that while equity is accorded a
relatively high profile by policy-makers, and though there is a relatively large academic literature
on the subject in health care, there appears to be considerable confusion over what its meaning is
(Wagstaff, van Doorslaer & Paq 1989, Wagstaff, van Doorslaer & Paq 1989, Culyer 2001,
Chang 2002, Braveman, Gruskin 2003). Mooney (1983) suggests seven possible definitions of
equity in the context of health care provision. These are briefly explained below:
Equality of expenditure per capita; this suggests that if budgets for health care are to be
allocated to different regions, they should be done pro rata with the size of each region‟s
population.
Equality of inputs or resources per capita; this implies that in allocating resources to
different regions, allowance should be made for differential prices so that the resources
which can be purchased with the allocated expenditure are the same per capita.
Equality of input for equal need; this implies that greater resources should be allocated to
populations with seemingly more health needs. This can be established by examining the
population structure. For example children, elderly and pregnant women may need more
health resources.
Equality of access for equal need; this in allocating resources allowance should be made
for the differential costs (as opposed to price) of accessing health services. For example,
patients in rural areas normally have higher costs to bear in seeking health care (e.g.
travelling costs) compared to those in urban areas.
Equality of utilization for equal need; this argues that if individuals are facing the same
level of supply of health care, their use should be the same for equal need.
Equality of marginal met need; this given different regions with varying health needs,
equity is reached if each region would stop treating the same specific need when each of
their budgets are cut by the same amount.
Equality of health; this argues that the level of health should be the same in all regions
and/or social classes.

1.3.1Horizontal vs. Vertical equity
The different understandings of equity in health and health care can be classified under either
horizontal equity or vertical equity. Generally, speaking horizontal equity refers to the „equal
treatment of equals‟ (Fleurbaey, and Maniquet 1997). In terms of health care utilization,
horizontal equity is concerned with the extent to which, on average, persons in equal need of
medical health services receive similar health services regardless of their income, wealth or any
other consideration (Cisse, Luchini & Moatti 2007). In health care financing, households with
the same ability to pay contribute the same amounts towards health financing to the extent. On
the other hand, vertical equity is the “unequal treatment of unequals” (Langørgen 2008). When
health care is the subject of discussion, vertical equity is concerned with the extent to which
persons with greater medical needs are treated more favorably (Wagstaff, van Doorslaer 2000)
while in health care financing it refers to the extent to which households of unequal ability to pay
make appropriately dissimilar payments for health care (Cisse, Luchini & Moatti 2007). The
latter is also referred to as the Rawlsian egalitarian principle in some health economics literature
(Wagstaff, van Doorslaer 2001).
1.3.2 Implementing Equity in Health Care Financing
The subject of equity (vertical or horizontal) and its implementation in health care financing is
central to most health policy objectives around the world. McIntyre and others have suggested
that if we are to adopt a human rights perspective, a key equity principle should be that people
should contribute to the funding of health services according to their ability to pay (McIntyre et
al. 2007). Following this assertion, a number of policy options in health care financing have been
suggested. These include that financing mechanisms should be progressive (i.e. those with
greater ability to pay should contribute a higher proportion of their income than those with lesser
ability to pay). In addition, they suggest that financing mechanisms should provide financial
protection. That is, households should not be pushed into poverty after making health payments.
In conclusion, this section has explored the various meanings of equity in health care financing.
The section has also given an explanation of the two streams or types of equity, namely;
horizontal and vertical equity. This study is based on the later. In terms of health care financing
vertical equity is the requirement that payments are made according to one‟s ability to pay. This

is the egalitarian principle on which this study is based. As is stated in the previous section,
progressivity measurement investigates how health payments are related to ability to pay.
Payments are progressive if those who have a greater ability to pay contribute more while those
with lesser ability to pay contribute less to health financing. This is vertical equity in terms of
health care financing and it is a desirable policy objective in many countries around the world.
1.4 Methods of Assessing Progressivity in Health Care Financing
It has been mentioned in the previous section that for purposes of equity, health payments should
be related to ability to pay. By implication, rich people should pay more as a proportion of their
total income towards health care than the poor should. Smith observes that progressivity assesses
how much more the rich are (or could be) paying (Smith 2010). In health care financing,
progressivity measurement investigates the extent to which payments toward health care are
related to ability to pay. O‟Donnell et al (2008) outline two common ways of assessing whether
health payments are progressive or not. This can be done by either taking the ratio of health
payments to ability to pay and comparing these across varying socio-economic statuses (i.e. the
direct method), or by using formal indices such as the concentration and Kakwani indices.
1.4.1 Direct Method
The progressivity of health care payments can be assessed directly by examining their share to
ability to pay (ATP). The population is, for example, divided into different quintiles of socio-
economic status, (usually from poorest to the richest) of a chosen living standards measure, and
health payments are inspected in each quintile and comparisons are made (see figure 1 below). If
health payments increase with ATP, they are progressive but regressive if health payments
decrease as income increases. If health payments are proportional, the ratio will remain the same
for all income quintiles. Figure 1 below shows the case of progressive OOP payments for health
care in Egypt in 1997. It can be observed that OOP share in expenditure rises with the quintiles
of expenditure.
Figure 1 : Assessment of the Progressivity of Out of Pocket Payments Using the Direct Method,
Egypt, 1997.

Source: O‟Donnell et al 2008.
1.4.2 Health Payments Concentration Curves
Progressivity can also be assessed graphically through comparison of the concentration curve of
health payments with the Lorenz curve of the ATP. This has been used in a number of studies
(Cisse et al 2007, Mastilica & Bozikov 1999, Smith S 2009).
1.4.3 The Kakwani Index
The use of summary indices such as the Kakwani to measure progressivity is derived from public
finance economics, where the focus is on the relationship between various forms of taxes and
income. A progressive tax schedule is one for which the average rate of taxation increases with
pre-tax income (Lambert, and Hutton 1979). In health care financing, the focus is on the
relationship between pre-payment income (the analogue of pre-tax income in the tax literature)
and health care payments (the analogue of taxes). While there are many summary measures for
progressivity, the Kakwani index (Kakwani 1977) has found wide application in health care
financing. Similar to the Kakwani index is Suits index (Suits 1977) which is also based on
Lorenz curve and relative concentration curve. The Kakwani index is defined as twice the area
between any health care payments‟ concentration curve and the Lorenz curve of ATP. This can
also be obtained as the difference between the concentration index of health payments and the
Gini coefficient of pre-payment income. The values of the Kakwani index range from –2 to 1. A
negative number means that health payments are regressive while a positive number indicates
that payments are progressive. If health payments are proportional, the Kakwani index will be
zero. The index could also be zero if the curves were to cross and positive and negative
differences between them cancel.
While this review has identified more than one method for assessing progressivity of health care
payments, the use of summary indexes such as the Kakwani and Suits index is considered as the
most appropriate method where this review is concerned. The same method is applied in this
study. However, like in other similar studies, the Kakwani index has been used as a supplement
to, and not a replacement of the more general graphical analysis (i.e. concentration curves). This
is because there are some instances in which the index could be zero without necessarily
implying proportionality. For example, if the curves were to cross, positive and negative
differences between them will cancel giving the index a value of zero. This may make
interpretations somewhat misleading. On the other hand, Graphical analysis (i.e Lorenz
dominance analysis) alone fails to provide a measure of the magnitude of progressivity, which
may be useful when making comparisons across time or countries. Summary indices of
progressivity meet this deficiency.
SECTION TWO: EMPIRICAL REVIEW
2.1 Introduction
This section reviews empirical literature on progressivity and determinants of out of pocket
payments from various countries. The section opens with a statement of the objectives, followed
by the methods section. Results are presented in the section after the methods after which comes
the discussion.
2.2 Review Objectives
The purpose of this empirical review is to summarize the evidence available from the literature
with regard to out of pocket payments as a means of financing health care both globally and in
Africa. The main focus will be assessing the progressivity of out of pocket payments as a means

of health care financing. The review will highlight any existing gaps and make recommendation
that future studies address these kinds of limitations.
2.3 Methods
This review is based on a literature search for papers and abstracts providing information, on the
assessment of progressivity of out of pocket payments around the world. Databases used include
PubMed, Medline, Ebscohost, and sources found using Google Scholar. The search terms
included the combination of the words Out of Pocket payments, health care financing, equity in
health care financing, progressivity, and regressivity. While many studies involving out of
pocket payments were found, only those primarily investigating the relationship between out of
pocket payments and household income or a proxy of ability-to-pay (ATP) were retained. Non-
English studies were excluded. The discussion within this review focuses on five aspects of
progressivity measurement considered important. These are: the definition of out of pocket
payments (i.e. what constitutes OOP payments), the measure of ability to pay, the type of data
used and its sources, the methods used in assessing progressivity, results and implications.
2.4 Results
The results of the review are presented in this section. A total of 49 studies were analyzed.
These were grouped as either domestic or international. Domestic studies are defined to include
all those studies conducted within Sub-Saharan Africa (Table 1) while international studies
include all those conducted elsewhere (Table 2). Progressivity assessment results of the studies
are presented in table 3
2.3.1 Composition of Out of Pocket Payments
The definition of OOP payments varied across studies. For example, two studies in Africa -
Manzi et al (2005) and Cisse, Luchini & Moatti (2007) used health related expenses such as
transport while others did not. Different compositions of OOP payments could result in different
incidence patterns. Another important aspect of OOP payments is expenses on traditional
medicine. For countries in Sub-Saharan Africa and other developing countries, it has become
common for households to opt for traditional medicine as a source of medical consultation. This
too should be included in the estimation of OOP payments. For domestic studies, only the South

African and Ghanaian study included this form of expenditure (Ataguba et al. 2009). On the
international front, composition of OOP payments depended on the level of development of the
country. For developing countries, and countries in transition, some studies included expenditure
on traditional medicine while others did not. Those that included traditional medicine include
Mastilica & Bozikov (1999) for Croatia, O‟Donnell et al (2008) for Hong Kong, Nepal, the
Philippines, Sri Lanka, Taiwan and Thailand. There was no such expenditure for all developed
countries. Some international countries also included health related expenditures such as
transport and food expenses in their definitions of OOP payments. These include Arredondo&
Najera (2008) in Mexico, Abu-Zaineh et al (2008) from Palestine, Thuan et al (2006) for
Vietnam as well as O‟Donnell et al (2008) for Nepal and Bangladesh.
2.3.2 Measure of Ability to Pay (ATP)
Household expenditure was the commonest measure of ability to pay for most domestic
countries except in Manzi et al (2005) where asset index was used. Internationally, nearly all
developed countries used household income to measure ATP, while most developing and
countries in transition used household consumption and expenditure. Studies using income
include Lairson,Hindson & Hauquitz (1995) for Australia, O'Donnell et al (2008) for Japan,
Wagstaff et al (1992) for Britain, Denmark, Spain, France, Portugal, Switzerland, Italy, Ireland
and the United States of America. In Ireland, Smith (2010) used both income and expenditure.
Some studies from countries in transition such as Mexico (Arredondo, Najera 2008) , Colombia
(Castano et al. 2002), Croatia, South Korea and Thailand (O‟Donnell et al 2008) also used
income. A study in Thailand (Pannarunothai, Mills 1997) used level of education of household
head as a proxy for ATP besides income. The rest of the international studies used household
consumption and expenditure, with the exception of the Vietnam study (Thuan et al, 2006) that
used local leaders‟ classification besides expenditure.
2.3.3 Data and Sources of Data
The data used and its sources are important in the assessment of progressivity of OOP payments
as different sources of data are prone to different biases. Tables 1 and 2 show that, as expected,
nearly all data was obtained from household surveys. The data used in most studies come from
household health expenditure surveys, household living standards surveys or household income
and expenditure surveys. These surveys collect information with some variations in the
questions including the recall periods, and composition of expenditures and direct payments for
health care. This may result in varying results obtained. Evidence from 43 countries show that
fewer items in the questionnaire give a lower estimate for average health spending compared to a
questionnaire with more items (Lu et al. 2009). The same study also found that usually, a shorter
recall period (one-month) appears to lead to a higher mean estimate of health spending compared
to a longer recall period (11-month)
In this review, different recall periods were recorded for different studies. Perkins and others
(2009) used a 24-month compared to a 1-month recall period used in Cisse et al (2007). Other
domestic studies did not clearly indicate the recall period over which data was collected. For
international studies, the recall periods ranged from two weeks in Mexico (Arredondo, Najera
2008) to two years in Kenya and Burkina Faso (Perkins et al 2009).While studies have different
objectives which may serve as justification for the use of different recall periods, comparison of
OOP payments may become difficult in this case.
2.3.4 Method of Assessing Progressivity
In assessing progressivity, majority of the studies used the Kakwani index. Others used a
combination of the Kakwani index and health payments concentration curves. Others used the
direct method. Based on the summary presented in tables 1 and 2, seven (7) studies used the
direct method (Pannarunothai, Mills 1997, Arredondo, Najera 2008, Ruger, Kim 2007, Galbraith
et al. 2005, Falkingham 2004, Hotchkiss et al. 1998, Thuan et al. 2006), five (5) used the
Kakwani index of progressivity (Smith 2010, Castano et al. 2002, Yu, Whynes & Sach 2008,
Abu-Zaineh et al. 2008, Lairson, Hindson & Hauquitz 1995, Mastilica, Bozikov 1999), twelve
(12) mainly from Asia used both Kakwani and concentration index (O'Donnell 2008). Seven (7)
studies used Kakwani index with concentration curves (Wagstaff, van Doorslaer & Paq 1989,
Cisse, Luchini & Moatti 2007, Smith 2010) and eight (8), mainly from developed countries used
a combination of Kakwani and Suits index (Wagstaff et al. 1992). Only 1 study from India used
only concentration curves (Garg, Karan 2009). For those studies that used concentration curves
to reach their conclusions, none performed dominance tests of the Lorenz and health payments
concentration curves.
Table 3 shows the results, a brief conclusion and the basis for the progressivity or regressivity
found in each study. OOP payments were progressive in sixteen (16) countries. Majority of these
are from Asia with only one (1) country each from Europe and Africa. These are Spain and
Tanzania respectively. However, the results for Tanzania changed afterwards and became
regressive as shown by Ataguba et al (2009) in a later study. Furthermore, results for the
Colombian study produced a mixed picture of progressive and regressive trends in OOP
payments. When income was used as a measure of ATP, Kakwani indices showed a constant
trend of regressive payments (–0.126 in 1984, to –0.3498 in 1997), but the trend moved towards
progressivity (–0.0092 in 1984, to 0.0026 in 1997) when expenses were used. In the remaining
29 countries, OOP payments were regressive. This include eight (8) countries from sub-Saharan
Africa, eleven (12) from Europe, 6 from Asia, and 2 from North America (Mexico and USA).
OOP payments were also regressive in Australia.
3.0 Discussion
Out of pocket (OOP) payments still remain one of the single largest sources of health care
financing in Sub-Saharan Africa. This review has demonstrated that this form of health financing
is regressive in most countries around the world. There are various reasons for the results
obtained in each country.
The review showed that results from 29 countries were regressive. These include 10 countries
from sub-Saharan Africa. They are Tanzania, South Africa, Burkina Faso, Ivory Coast, Ghana,
Kenya, Senegal, Guinea and Mali. All these countries have a similar health care financing
background which contributed to the overall results. In all of these countries, some forms of cost
sharing policies are present ((Ataguba et al. 2009, Cisse, Luchini & Moatti 2007, Perkins et al.
2009). At public facilities, user fees tended to increase the incidence of OOP payments. Where
user fees were implemented side by side with fee exemptions and waiver mechanisms, most
studies show that these were usually ineffective leaving the poor to face the same health
payments as the rich. Some countries such as Tanzania and Ghana had some form of social
health insurance but these were just in the early stages and could not cover provide
comprehensive cover. OOP payments were also regressive in many international countries for

various reasons. For example, in Ireland and the Netherlands in 1987 co-payments were required
because the cover was not comprehensive (Wagstaff et al. 1992). In Ireland, persons in the top
62% of the income distribution were required to pay for GP visits and prescription drugs in full,
while in the Netherlands much of the expenditures associated with OOP payments were incurred
by the privately insured in the upper half of the income distribution having insurance policies
with substantial deductibles or excluding primary care (ibid). In Switzerland and the U.S.A
(ibid), regressive payments stemmed from the fact that - with the exception of Medicaid enrolees
and some privately insured in the U.S.A – co-payments are made by all irrespective of their
income. In Australia, OOP payments were regressive because besides a national insurance
scheme, OOP are still found in Medicare systems and these tend to be regressive (Lairson,
Hindson & Hauquitz 1995). In Korea Republic, payments were not related to ability to pay for
services not covered by social health insurance. Further, co-payments exist in the National
Health Insurance (NHI) (Ruger, Kim 2007). In Palestine (Abu-Zaineh et al. 2008), regressive
OOP payments can be attributed to the presence of government health insurance scheme
covering only 30% of the population and private health insurance covering a tiny proportion of
the population. OOP accounted for the largest share of health expenditure (40.5%). This implies
that the larger population not covered by either form of health insurance paid OOP leading to
uniform health payments across the board irrespective of differences in income of the population.
Spain, Malaysia, Nepal and Punjab are some of the countries in which OOP payments were
progressive (Wagstaff et al. 1992, Yu, Whynes & Sach 2008, O'Donnell 2008). In Spain, the
reasons are that the health system is largely financed by social insurance with some significant
OOP and general taxes. In Malaysia, there was a switch to private health services by the rich and
a predominant reliance on subsidized public health services by the poor. Hence, the poor made
fewer OOP payments compared to the rich. In Nepal, both the poor and the rich use public
facilities. However, public facilities tend to prescribe expensive medicines not found at public
health facilities for the rich and cheap ones for the poor. But even when prescriptions are made
for the poor they usually do not buy due to issues of affordability. This makes OOP payments
appear progressive. In Hong Kong, the government had adopted a tax, rather than a social
insurance financing mechanism. Hence, there was a substantial positive discrimination in favor
of the worse-off who could not pay for health care as much as the better-off (O'Donnell et al.
2008).
In India OOP constituted the largest share of health expenditure and varied between 70-80% of
health expenditure and 95% of private health expenditure. Insurance and community financing
emerging at the time were weak. The pattern of OOP payments across quintile groups was
examined only in the four states of Haryana, Punjab, Uttar Pradesh and Kerala, which have very
high levels of OOP expenditure (Garg, Karan 2009). OOP payments were progressive in these
states. The reason given is that public spending on health is generally very low while private
spending is high leaving all households, poor and rich to face similar health costs. For example,
per capita private spending on health in Kerala, Haryana and Punjab was four times higher than
that in Rajasthan and three times that in Bihar. OOP expenditure in Kerala was high and
progressive because of higher expenditure on institutional care (mostly accessible by richer
households) and on lifestyle diseases such as heart conditions (ibid).
4.0 Conclusion
This review has identified very important limitations in the assessment of progressivity of OOP
payments. Firstly, the comparability of studies done in different countries is made difficult by a
lack of uniformity in the definition of what should constitute OOP payments. The major issue is
whether OOP payments should include health related expenses such as transport, nutrition and
patient care. While these are part of the cost of illness, their computation is always a challenge
given the diverse approaches households may employ to meet such needs. In terms of transport
for example, it can be argued that for places where transport is readily available as may be the
case for many developed countries computations can be easier. A good number of studies
reviewed included such costs while others did not. In the same way it has become common for
populations in developing and countries in transition to use traditional medicine as another
option when seeking care. Hence, it is expected that countries of this type include health
expenditures on traditional medicine. A good number of studies from developing and transition
countries did not include this type of OOP expenditures making conclusions and comparisons
again difficult.
Secondly, while it is recommended by the World Bank (Grosh, Glewwe 2000) for developing
countries and countries in transition to use consumption and expenditure in measuring household
ATP instead of income, some countries belonging to this category still used income. There are a
number of reasons for this recommendation. According to the World Bank (ibid), compared to
consumption and expenditure, income is a much more sensitive topic to ask people about.
Respondents may have an incentive to understate their income in a survey interview, especially
if they fear that the information may be used for tax purposes despite assurances to the contrary.
This is due to the significant importance of self-employment income (which is easier to
understate than wage income) in developing and transition countries. Secondly, respondents may
genuinely not know how much income they make, especially in their self-employment activities
which are common for households in developing and transition countries. There is also a general
absence of written accounts for household production activities. Another reason is that
respondents may not feel the need to report their most casual or infrequent income earning
activities. This is worsened if certain income earning activities are dubious or illegal such as sale
of prohibited drugs. It is also true that respondents do not easily reveal their receipt of transfers
and other non-labor income. Only one study by Manzi et al (2005) used asset index as a proxy
for ATP. This has its own advantages and disadvantages. O‟Donnell et al (2008) observe that
this approach has the considerable merit of requiring only data that can be easily and quickly
collected in a single household interview and, although lacking somewhat in theoretical
foundations, can provide a convenient way to summarize the living standards of a household.
Nevertheless, the use of asset index may either over-estimate or under-estimate the living
standards of a household. In the first instance, households may own the same assets over a
number of years and may appear to be wealthy even when they no longer have the purchasing
power to acquire the same assets in the present. In the second instance some people may not even
own a single asset but may have greater purchasing power than those who have assets even if the
value of those assets cannot measure to the value of the real income owned by others. Following
this, it should be mentioned here that these measures of ability to pay should measure a distinct
but related latent variable, that is, a long-term command over resources (O‟Donnell et al, 2008).
Thirdly, most studies relied on household survey data to collect information. While this is
common, some recall periods where rather too long for respondents to give accurate estimates of
OOP payments. With evidence that shorter recall period such as 1 month produce higher
estimates of health spending compared to longer recall periods (Lu et al. 2009), future studies
and surveys should seek to use shorter recall periods. This is better as respondents can easily
remember health payments that took place in the near past; say 1 month rather than 2 years. In
terms of international best practices Deaton and Zaidi (1999) state that data on
purchases/expenditures of non food items are often collected for different recall periods, for
example over the past 30 days, the past 3 months, or the past 12 months, depending on how
frequently the items concerned are typically purchased. Following this, O‟Donnell et al (2008)
observes that health services that have a higher frequency of utilization, such as ambulatory care,
use the recall period in the range of 2 to 4 weeks while those with a lower frequency of
utilisation such as inpatient care, the recall period is typically 12 months. This is has been
applied in a number of studies (Arredondo, Najera 2008, Falkingham 2004, Garg, Karan 2009)
Fourthly, the choice of method for assessing progressivity of health payments differed from
country to country. This can be another cause for difficulties in making conclusions. Studies
using direct methods and concentration curves alone to assess progressivity of health payments
should employ summary indices to provide the extent of progressivity and regressivity. The use
of concentration curves should also be accompanied with dominance tests. No single study of
those using concentration curves provided for this.
In summary, this review has found that OOP payments are regressive in most of the countries
reviewed. The review has also highlighted the limitations encountered in assessing progressivity
of OOP payments and how this may affect comparability of findings of different studies. Future
studies should take these limitations into consideration to make local and international
comparisons of findings easier.
SECTION THREE: DETERMINANTS OF OUT OF POCKET PAYMENTS
3.1 Determinants of Out of Pocket Payments
The previous sections have demonstrated that out of pocket is a significant source of health care
financing in Africa. However, not all households and indeed individuals in this part of the world
may make this form of payments for health care. Research has shown that there are various
characteristics associated with households or individuals who make out of pocket payments. This
is the purpose of this section. In other words, this section will analyze the characteristics of
individuals or households who make out of pocket payments for health care. This information is
drawn from various studies and countries including those outside of Africa and is important for
policy making.
Feldstein (1988) suggests that expenditures for health care are determined by three factors: price
(e.g. cost of medicines, consultation etc.), household income (i.e. ability to pay), and preference
shifters, such as age and education. Main of the determinants of out of pocket payments
reviewed under this section fall under these three categories. In Rubin and Koellin (1993),
several factors or characteristics of households likely to incur OOP health care payments have
been identified. Among them are household income, age and education of household head, size
of the household as well as health insurance status of the household. Others are housing tenure,
household assets, race and welfare status of a household. Most of these factors apply in most of
African countries. The results for the same study also showed that single headed households had
the lowest OOP spending while white and high income households including those with higher
education incurred higher levels of medical expenses than lower income and non-white
households. The same was true for the less educated. On the other hand, housing tenure and
household welfare status were negatively related to OOP expenditure. Contrary to the
expectations of the authors that ownership of insurance will lead to low OOP, the insurance
parameter was positive. In another study, Hong and Kim (2000) add that the rate of increase of
out of pocket health care expenses varies across demographic groups. They further note that
households headed by individuals under age 25 spent less on health care, as a percentage of all
expenses. On the contrary elderly households spent a higher proportion of their income for health
care than the non-elderly. Rural families also devoted a larger share of their budgets to health
care than did urban households. Ruger and Kim (2007) further suggest that the number of
chronic conditions, insurance type, health care use, and health care facility type are also
associated with out-of-pocket spending. Particularly, presence of chronic conditions, high
frequent health care use, lack of insurance and use of private facility were associated with
increased out of pocket spending. In Tajikistan, Habibov (2009) also note that an increase in
ability to pay, being female and using specialized healthcare facilities increases the amount of
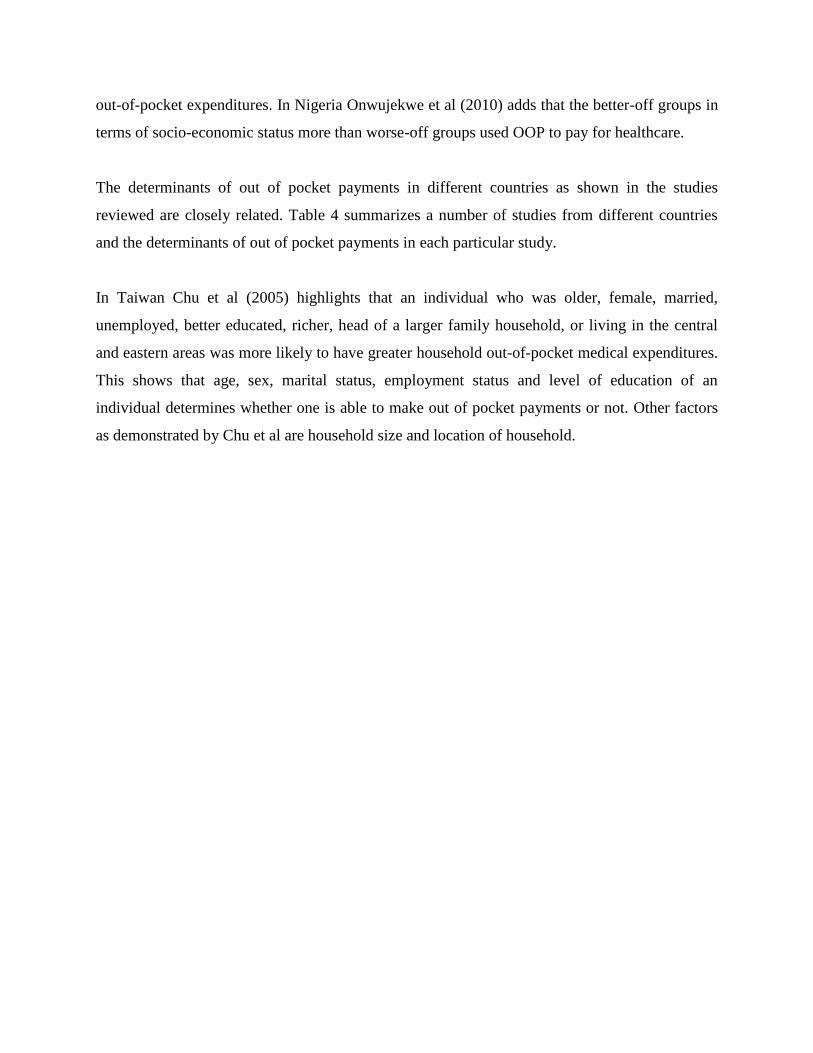
out-of-pocket expenditures. In Nigeria Onwujekwe et al (2010) adds that the better-off groups in
terms of socio-economic status more than worse-off groups used OOP to pay for healthcare.
The determinants of out of pocket payments in different countries as shown in the studies
reviewed are closely related. Table 4 summarizes a number of studies from different countries
and the determinants of out of pocket payments in each particular study.
In Taiwan Chu et al (2005) highlights that an individual who was older, female, married,
unemployed, better educated, richer, head of a larger family household, or living in the central
and eastern areas was more likely to have greater household out-of-pocket medical expenditures.
This shows that age, sex, marital status, employment status and level of education of an
individual determines whether one is able to make out of pocket payments or not. Other factors
as demonstrated by Chu et al are household size and location of household.

Table 1: Progressivity of out of pocket payments: Domestic Countries
Study, Country &
year published
Country OOP composition ATP measure Data sources Recall
period
Method
Manzi et al 2005 Tanzania -Consultation fees, cost of
drugs, & health related
expenses (travel & supplies)
Asset index,
education/occupation
1999 & 2002
household surveys
Not stated
Direct
Akazili et al 2009 Tanzania All medical expenditure Consumption
expenditure
Tanzania Household
Budget Survey,
2000/01)
Not stated Direct
Akazili et al 2009 Ghana All medical expenses and
traditional healers, but no
health related expenses
Consumption
expenditure
Ghana Living
Standards Survey,
2005/06),
Not stated Direct
Akazili et al 2009 South
Africa
All medical expenses and
traditional healers, but no
health related expense
Consumption
expenditure
Income and
Expenditure Survey,
2005/06)
Not stated
Direct
Perkins et al 2009 Burkina
Faso
Costs of drugs and supplies,
fees (bed, lab, professional
fees, etc)
household
expenditure/income
Population based
surveys 2003/6
24 months
for all
delivery
costs
Direct
Perkins et al 2009 Kenya Costs of drugs and supplies,
fees (bed, lab, professional
fees, etc)
household
expenditure/income
Population based
surveys 2003 & 2006
24 months
for all
delivery
costs
Direct
Perkins et al 2009 Tanzania Costs of drugs and supplies,
fees (bed, lab, professional
fees, etc)
household
expenditure/income
Population based
surveys 2003 & 2006
24 months
for all
delivery
costs
Direct
Ciss´e et al 2007 Ivory
Coast
Consultations fees,
medicines
(including self-medication)
and laboratory tests
expenditures. Including
Household
consumption
expenditure
Primary Sampling
Unit household
survey
1 month
for both
inpatient
and out
patient
Kakwani
index &
concentration
curves
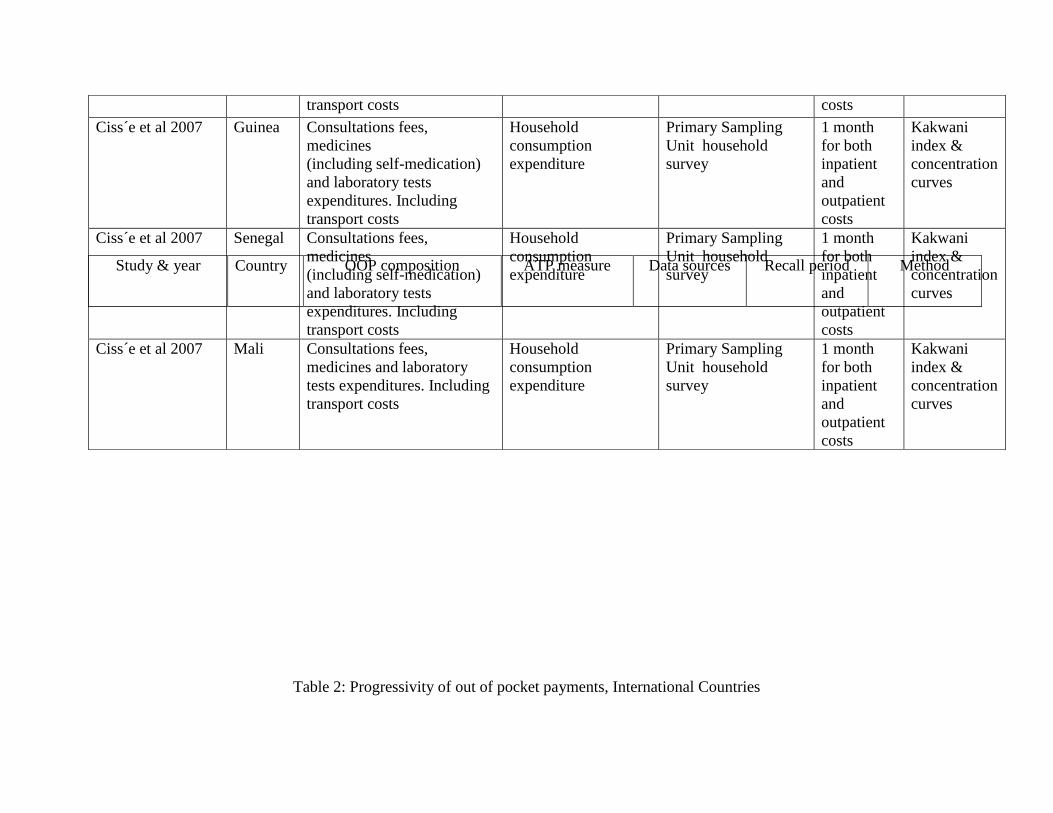
Table 2: Progressivity of out of pocket payments, International Countries
transport costs costs
Ciss´e et al 2007 Guinea Consultations fees,
medicines
(including self-medication)
and laboratory tests
expenditures. Including
transport costs
Household
consumption
expenditure
Primary Sampling
Unit household
survey
1 month
for both
inpatient
and
outpatient
costs
Kakwani
index &
concentration
curves
Ciss´e et al 2007 Senegal Consultations fees,
medicines
(including self-medication)
and laboratory tests
expenditures. Including
transport costs
Household
consumption
expenditure
Primary Sampling
Unit household
survey
1 month
for both
inpatient
and
outpatient
costs
Kakwani
index &
concentration
curves
Ciss´e et al 2007 Mali Consultations fees,
medicines and laboratory
tests expenditures. Including
transport costs
Household
consumption
expenditure
Primary Sampling
Unit household
survey
1 month
for both
inpatient
and
outpatient
costs
Kakwani
index &
concentration
curves
Study & year
Country
OOP composition
ATP measure
Data sources Recall period
Method
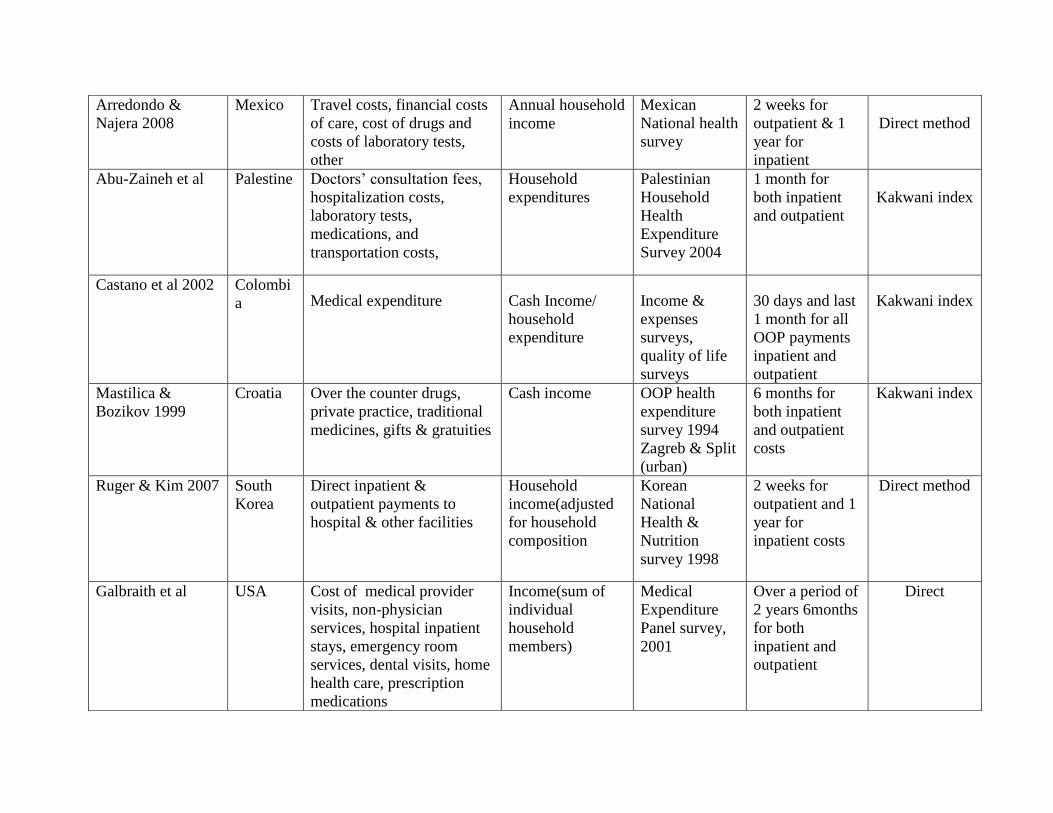
Arredondo &
Najera 2008
Mexico Travel costs, financial costs
of care, cost of drugs and
costs of laboratory tests,
other
Annual household
income
Mexican
National health
survey
2 weeks for
outpatient & 1
year for
inpatient
Direct method
Abu-Zaineh et al Palestine Doctors‟ consultation fees,
hospitalization costs,
laboratory tests,
medications, and
transportation costs,
Household
expenditures
Palestinian
Household
Health
Expenditure
Survey 2004
1 month for
both inpatient
and outpatient
Kakwani index
Castano et al 2002 Colombi
a Medical expenditure Cash Income/
household
expenditure
Income &
expenses
surveys,
quality of life
surveys
30 days and last
1 month for all
OOP payments
inpatient and
outpatient
Kakwani index
Mastilica &
Bozikov 1999
Croatia Over the counter drugs,
private practice, traditional
medicines, gifts & gratuities
Cash income OOP health
expenditure
survey 1994
Zagreb & Split
(urban)
6 months for
both inpatient
and outpatient
costs
Kakwani index
Ruger & Kim 2007 South
Korea
Direct inpatient &
outpatient payments to
hospital & other facilities
Household
income(adjusted
for household
composition
Korean
National
Health &
Nutrition
survey 1998
2 weeks for
outpatient and 1
year for
inpatient costs
Direct method
Galbraith et al USA Cost of medical provider
visits, non-physician
services, hospital inpatient
stays, emergency room
services, dental visits, home
health care, prescription
medications
Income(sum of
individual
household
members)
Medical
Expenditure
Panel survey,
2001
Over a period of
2 years 6months
for both
inpatient and
outpatient
Direct
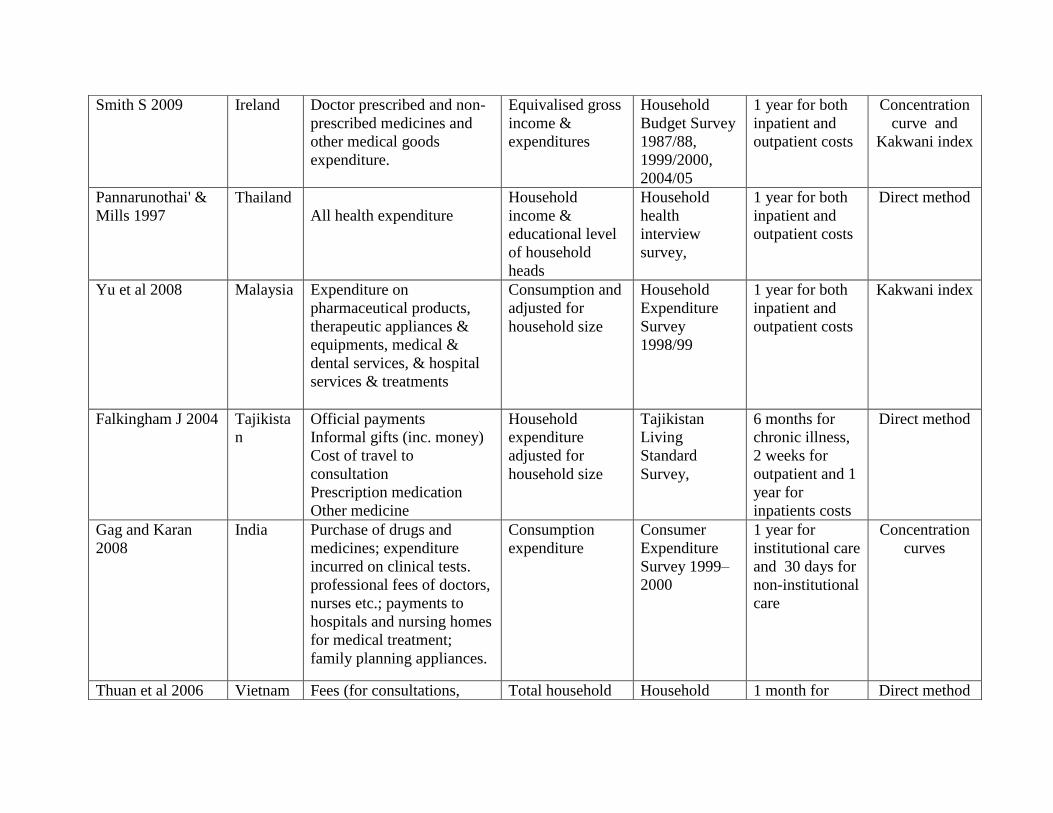
Smith S 2009 Ireland Doctor prescribed and non-
prescribed medicines and
other medical goods
expenditure.
Equivalised gross
income &
expenditures
Household
Budget Survey
1987/88,
1999/2000,
2004/05
1 year for both
inpatient and
outpatient costs
Concentration
curve and
Kakwani index
Pannarunothai' &
Mills 1997
Thailand
All health expenditure
Household
income &
educational level
of household
heads
Household
health
interview
survey,
1 year for both
inpatient and
outpatient costs
Direct method
Yu et al 2008 Malaysia Expenditure on
pharmaceutical products,
therapeutic appliances &
equipments, medical &
dental services, & hospital
services & treatments
Consumption and
adjusted for
household size
Household
Expenditure
Survey
1998/99
1 year for both
inpatient and
outpatient costs
Kakwani index
Falkingham J 2004 Tajikista
n
Official payments
Informal gifts (inc. money)
Cost of travel to
consultation
Prescription medication
Other medicine
Household
expenditure
adjusted for
household size
Tajikistan
Living
Standard
Survey,
6 months for
chronic illness,
2 weeks for
outpatient and 1
year for
inpatients costs
Direct method
Gag and Karan
2008
India Purchase of drugs and
medicines; expenditure
incurred on clinical tests.
professional fees of doctors,
nurses etc.; payments to
hospitals and nursing homes
for medical treatment;
family planning appliances.
Consumption
expenditure
Consumer
Expenditure
Survey 1999–
2000
1 year for
institutional care
and 30 days for
non-institutional
care
Concentration
curves
Thuan et al 2006 Vietnam Fees (for consultations, Total household Household 1 month for Direct method
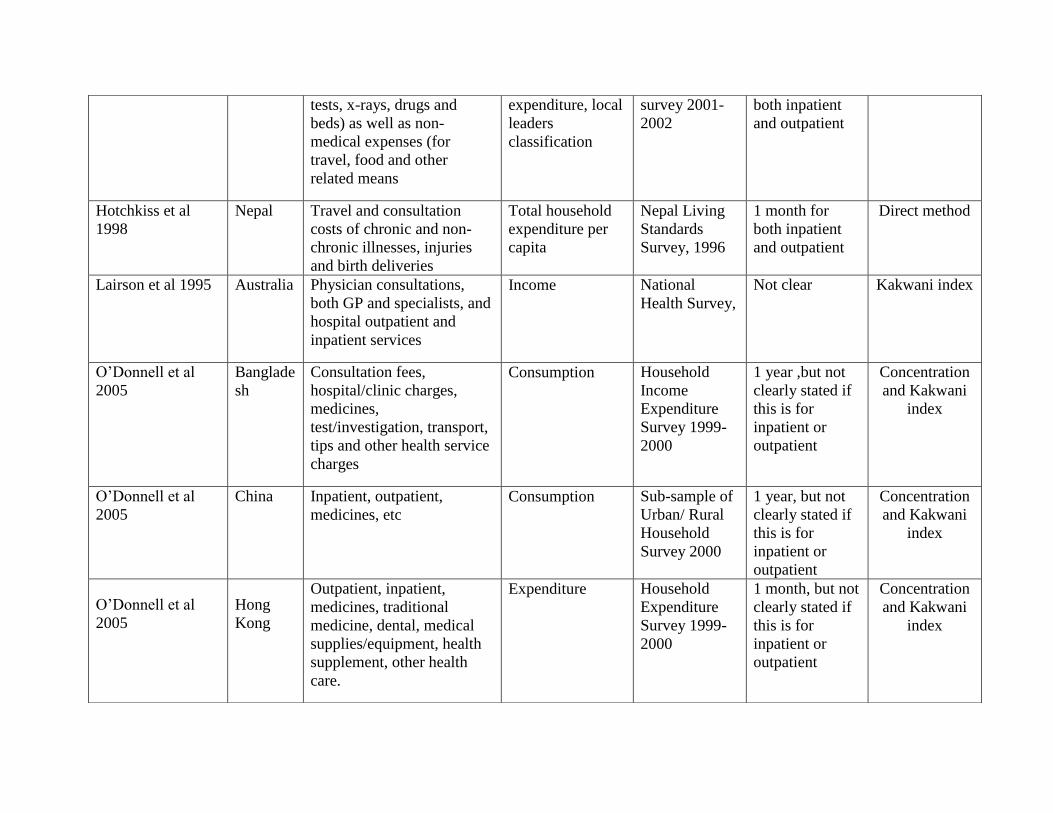
tests, x-rays, drugs and
beds) as well as non-
medical expenses (for
travel, food and other
related means
expenditure, local
leaders
classification
survey 2001-
2002
both inpatient
and outpatient
Hotchkiss et al
1998
Nepal Travel and consultation
costs of chronic and non-
chronic illnesses, injuries
and birth deliveries
Total household
expenditure per
capita
Nepal Living
Standards
Survey, 1996
1 month for
both inpatient
and outpatient
Direct method
Lairson et al 1995 Australia Physician consultations,
both GP and specialists, and
hospital outpatient and
inpatient services
Income National
Health Survey,
Not clear Kakwani index
O‟Donnell et al
2005
Banglade
sh
Consultation fees,
hospital/clinic charges,
medicines,
test/investigation, transport,
tips and other health service
charges
Consumption
Household
Income
Expenditure
Survey 1999-
2000
1 year ,but not
clearly stated if
this is for
inpatient or
outpatient
Concentration
and Kakwani
index
O‟Donnell et al
2005
China Inpatient, outpatient,
medicines, etc
Consumption
Sub-sample of
Urban/ Rural
Household
Survey 2000
1 year, but not
clearly stated if
this is for
inpatient or
outpatient
Concentration
and Kakwani
index
O‟Donnell et al
2005
Hong
Kong
Outpatient, inpatient,
medicines, traditional
medicine, dental, medical
supplies/equipment, health
supplement, other health
care.
Expenditure
Household
Expenditure
Survey 1999-
2000
1 month, but not
clearly stated if
this is for
inpatient or
outpatient
Concentration
and Kakwani
index

O‟Donnell et al
2005
Japan Outpatient, inpatient,
medicines and any co-
payments.
Income Comprehensiv
e survey of
living
conditions
1998, Health
care survey,
2000
1 year, but not
clearly stated if
this is for
inpatient or
outpatient
Concentration
and Kakwani
index
O‟Donnell et al
2005
Korea
Republic
Inpatient, outpatient,
medicines, dental, medical
supplies, tests.
Expenditure
Urban
Household
Survey, 2000
1 month, but not
clearly stated if
this is for
inpatient or
outpatient
Concentration
and Kakwani
index
O‟Donnell et al
2005
Kyrgyz
Republic
Inpatient, outpatient,
medicines, dental, acute
care.
Expenditure
Household
Budget Survey
, 2000/01
1 year, but not
clearly stated if
this is for
inpatient or
outpatient
Concentration
and Kakwani
index
O‟Donnell et al
2005
Nepal Consultation fees (modern
& traditional), medicines
(modern & traditional),
hospital expenses, tests.
Consumption Living
Standards
Survey , 1995-
96
1 year, but not
clearly stated if
this is for
inpatient or
outpatient
Concentration
and Kakwani
index
O‟Donnell et al
2005
Philippin
es
Fees, hospital charges and
medicines (modern &
traditional )
Consumption
Poverty
Indicator
Survey , 1999,
Family Income
& Expenditure
Survey, 1994
1 year, but not
clearly stated if
this is for
inpatient or
outpatient
Concentration
and Kakwani
index
O‟Donnell et al
2005
Punjab Outpatient, inpatient and
medicines
Consumption
Consumer
expenditure
survey 1999-
1 month, but not
clearly stated if
this is for
Concentration
and Kakwani
index

2000 inpatient or
outpatient
O‟Donnell et al
2005
Sri
Lanka
Fees, hospital charges,
medicines, tests, spectacles,
dental, homeopathy and
acupuncture, charms and
others
Consumption
Consumer
Finance
Survey 1996-
97
1 year, but not
clearly stated if
this is for
inpatient or
outpatient
Concentration
and Kakwani
index
O‟Donnell et al
2005
Taiwan Inpatient, outpatient,
medicines, medical
equipment, dental, nursing
home, tests, traditional
medicines, medical supplies
Expenditure
Survey of
Family Income
and
Expenditure
2000
1 year, but not
clearly stated if
this is for
inpatient or
outpatient
Concentration
and Kakwani
index
O‟Donnell et al
2005
Indonesi
a
Outpatient, inpatient & self-
treatment medicines
Consumption
Socioeconomic
Survey ,2001
1 month, but not
clearly stated if
this is for
inpatient or
outpatient
Concentration
and Kakwani
index
O‟Donnell et al
2005
Thailand Inpatient, outpatient,
medicines, self-medication,
traditional medicine
Consumption
Socio-
economic
Survey 2002
1 month, but not
clearly stated if
this is for
inpatient or
outpatient
Concentration
and Kakwani
index
Wagstatf, van
Doorslaer, & Paci
1989
Britain Costs of general practitioner
consultations, days in
hospital, and visits to
hospital as an outpatient
Equivalised Pre-
tax income
National
Household
Survey, 1981
Not stated Concentration
curve and
Kakwani index
Wagstatf, van
Doorslaer, & Paci
1989
Netherla
nds
Costs of the number of
general practitioner
consultations, number of
specialist consultations, and
Pre-tax income Household
Expenditure
Survey, 1984
Not stated Concentration
curve and
Kakwani index

number of days in hospital
Wagstatf, van
Doorslaer 1992,
Denmark Co-payments for
prescription drugs, dental
care, physiotherapy
Pre-tax income Household
Expenditure
Survey, 1981
Not stated Kakwani &
Suits index
Wagstaff & van
Doorslaer 1992
Spain Prescription medicines,
Payments to private sector
for some services available
in public sector and for
other services
Pre-tax income Family budget
survey 1980
Not stated Kakwani &
Suits index
Wagstaff & van
Doorslaer 1992
France Cost of physician visits,
medicines and inpatient care
Pre-tax income Family
expenditure
survey 1984
Not stated Kakwani &
Suits index
Wagstaff & van
Doorslaer 1992
Ireland Co-payments for inpatient
and outpatient treatment,
payment for GP visits &
prescription medicines. co-
payment for inpatient hotel
facilities, and payment in
full for consultant services,
outpatient and primary care,
and prescription medicines
Pre-tax income Household
budget survey
1987
Not stated Kakwani &
Suits index
Wagstaff & van
Doorslaer 1992
Portugal Co-payments to public
sector for consultations,
diagnostic tests and
medicines. Direct payments
to private sector by those
with and without
private/occupational
insurance
Pre-tax income Family income
and
expenditure
survey 1981
Not stated Kakwani &
Suits index
Wagstaff & van
Doorslaer 1992
Switzerla
nd
Persons with basic sick fund
cover face 10% coinsurance
for ambulatory care and
Pre-tax income socio-medical
indicators for
the population
Not stated Kakwani &
Suits index

95% of dental care of Switzerland,
1982
Wagstaff & van
Doorslaer 1992
Italy Prescription drugs, Direct
payments to private sector
by persons with and without
private insurance
Pre-tax income Family
consumption
survey 1987
Not stated
Kakwani &
Suits index
Wagstaff & van
Doorslaer 1992
USA Co-payments for inpatient
and primary care payable
by the privately insured and
Medicare enrollees
Pre-tax income National
medical care
utilization and
expenditure
survey
Not stated
Kakwani &
Suits index
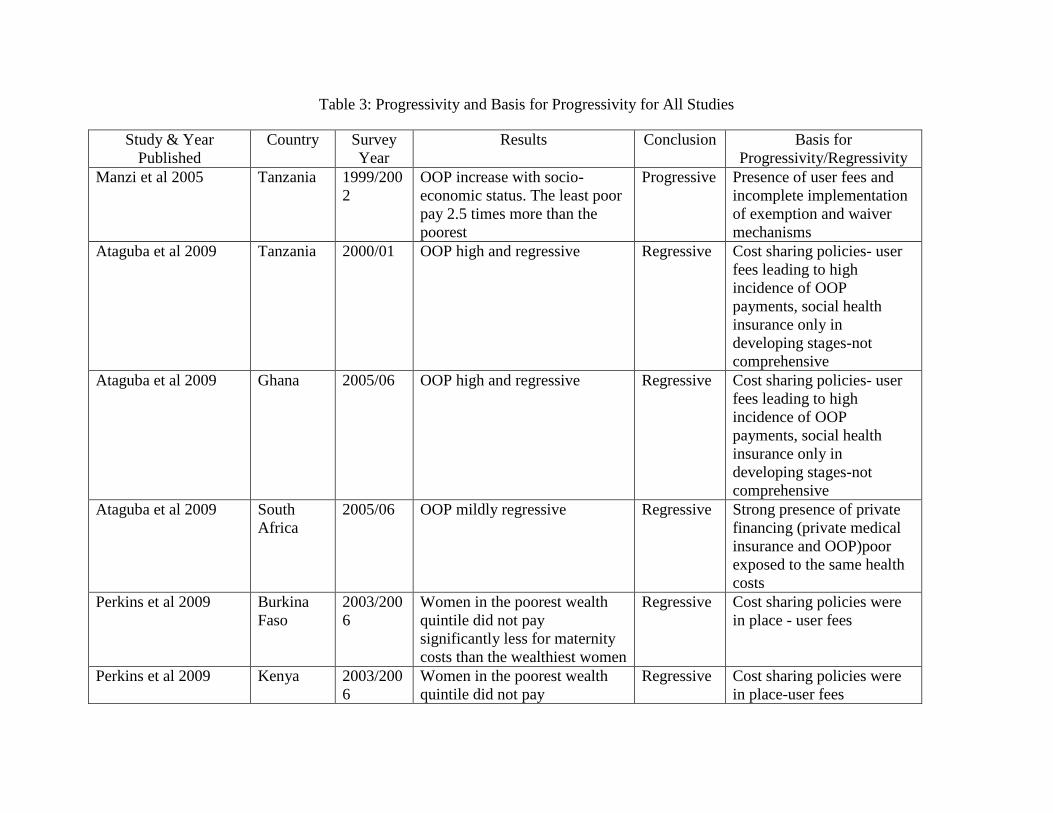
Table 3: Progressivity and Basis for Progressivity for All Studies
Study & Year
Published
Country Survey
Year
Results Conclusion Basis for
Progressivity/Regressivity
Manzi et al 2005 Tanzania 1999/200
2
OOP increase with socio-
economic status. The least poor
pay 2.5 times more than the
poorest
Progressive Presence of user fees and
incomplete implementation
of exemption and waiver
mechanisms
Ataguba et al 2009 Tanzania 2000/01 OOP high and regressive Regressive Cost sharing policies- user
fees leading to high
incidence of OOP
payments, social health
insurance only in
developing stages-not
comprehensive
Ataguba et al 2009 Ghana 2005/06 OOP high and regressive Regressive Cost sharing policies- user
fees leading to high
incidence of OOP
payments, social health
insurance only in
developing stages-not
comprehensive
Ataguba et al 2009 South
Africa
2005/06 OOP mildly regressive Regressive Strong presence of private
financing (private medical
insurance and OOP)poor
exposed to the same health
costs
Perkins et al 2009 Burkina
Faso
2003/200
6
Women in the poorest wealth
quintile did not pay
significantly less for maternity
costs than the wealthiest women
Regressive Cost sharing policies were
in place - user fees
Perkins et al 2009 Kenya 2003/200
6
Women in the poorest wealth
quintile did not pay
Regressive Cost sharing policies were
in place-user fees
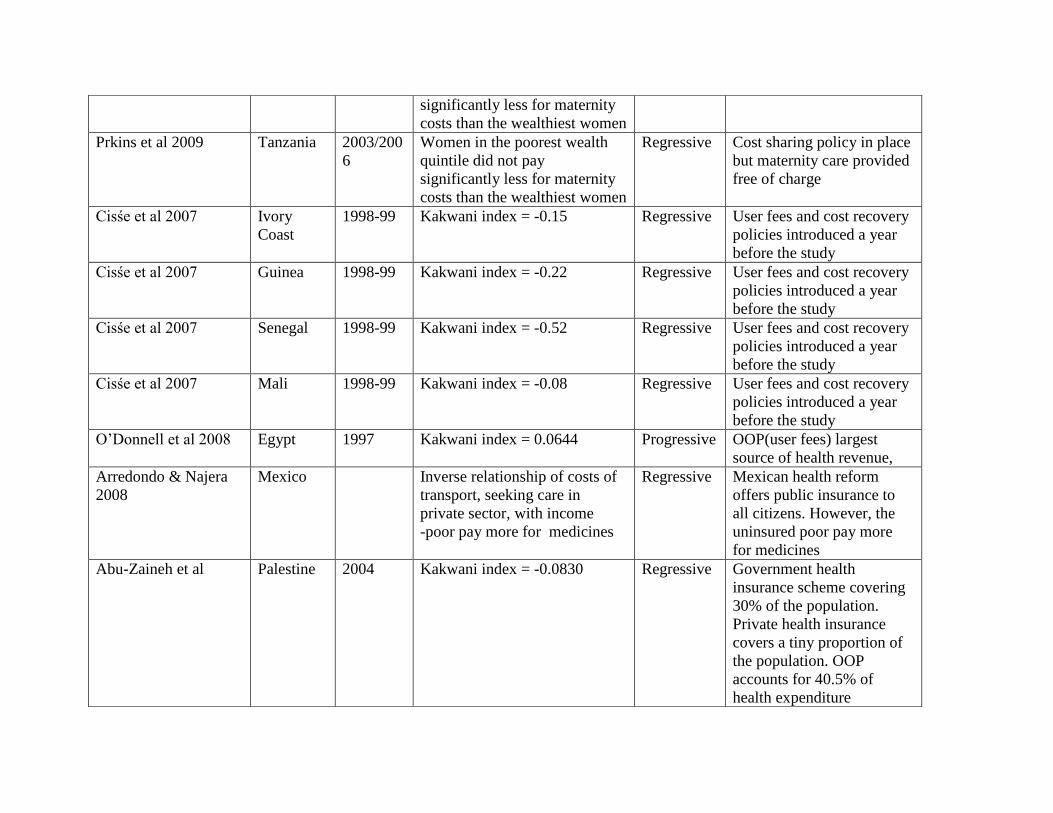
significantly less for maternity
costs than the wealthiest women
Prkins et al 2009 Tanzania 2003/200
6
Women in the poorest wealth
quintile did not pay
significantly less for maternity
costs than the wealthiest women
Regressive Cost sharing policy in place
but maternity care provided
free of charge
Cisśe et al 2007 Ivory
Coast
1998-99 Kakwani index = -0.15 Regressive User fees and cost recovery
policies introduced a year
before the study
Cisśe et al 2007 Guinea 1998-99 Kakwani index = -0.22 Regressive User fees and cost recovery
policies introduced a year
before the study
Cisśe et al 2007 Senegal 1998-99 Kakwani index = -0.52 Regressive User fees and cost recovery
policies introduced a year
before the study
Cisśe et al 2007 Mali 1998-99 Kakwani index = -0.08 Regressive User fees and cost recovery
policies introduced a year
before the study
O‟Donnell et al 2008 Egypt 1997 Kakwani index = 0.0644 Progressive OOP(user fees) largest
source of health revenue,
Arredondo & Najera
2008
Mexico Inverse relationship of costs of
transport, seeking care in
private sector, with income
-poor pay more for medicines
Regressive Mexican health reform
offers public insurance to
all citizens. However, the
uninsured poor pay more
for medicines
Abu-Zaineh et al Palestine 2004 Kakwani index = -0.0830 Regressive Government health
insurance scheme covering
30% of the population.
Private health insurance
covers a tiny proportion of
the population. OOP
accounts for 40.5% of
health expenditure
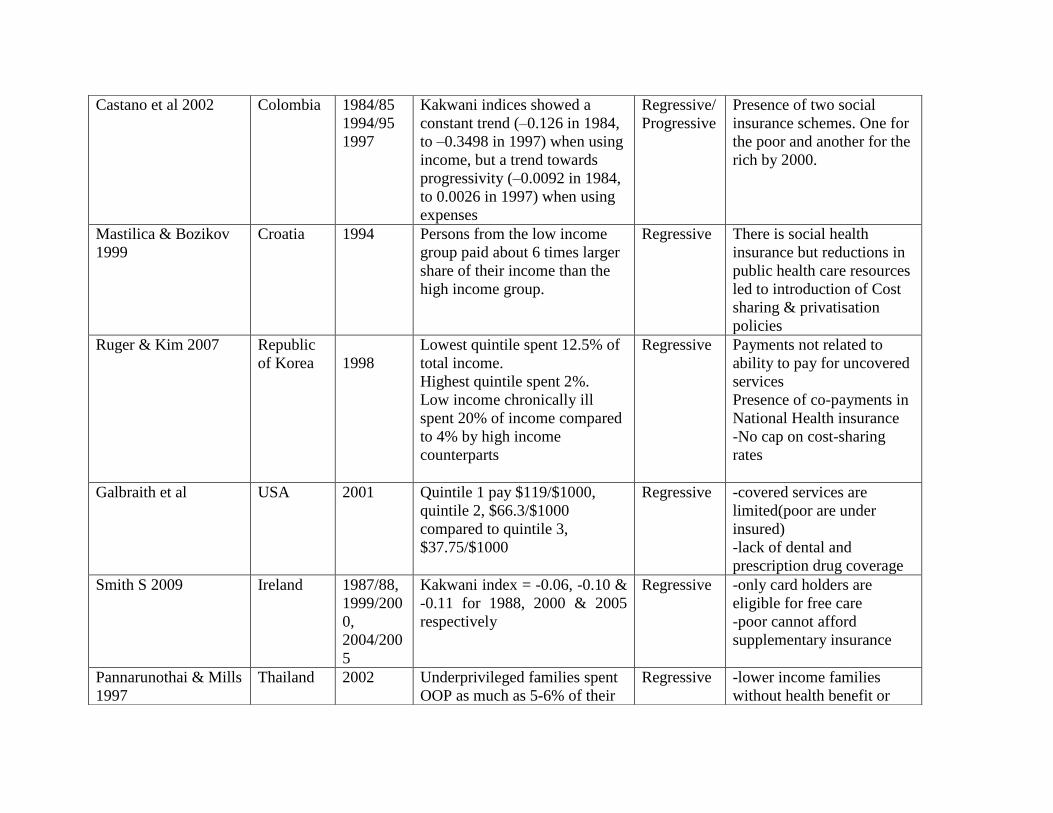
Castano et al 2002 Colombia 1984/85
1994/95
1997
Kakwani indices showed a
constant trend (–0.126 in 1984,
to –0.3498 in 1997) when using
income, but a trend towards
progressivity (–0.0092 in 1984,
to 0.0026 in 1997) when using
expenses
Regressive/
Progressive
Presence of two social
insurance schemes. One for
the poor and another for the
rich by 2000.
Mastilica & Bozikov
1999
Croatia 1994 Persons from the low income
group paid about 6 times larger
share of their income than the
high income group.
Regressive There is social health
insurance but reductions in
public health care resources
led to introduction of Cost
sharing & privatisation
policies
Ruger & Kim 2007 Republic
of Korea
1998
Lowest quintile spent 12.5% of
total income.
Highest quintile spent 2%.
Low income chronically ill
spent 20% of income compared
to 4% by high income
counterparts
Regressive Payments not related to
ability to pay for uncovered
services
Presence of co-payments in
National Health insurance
-No cap on cost-sharing
rates
Galbraith et al USA 2001 Quintile 1 pay $119/$1000,
quintile 2, $66.3/$1000
compared to quintile 3,
$37.75/$1000
Regressive -covered services are
limited(poor are under
insured)
-lack of dental and
prescription drug coverage
Smith S 2009 Ireland 1987/88,
1999/200
0,
2004/200
5
Kakwani index = -0.06, -0.10 &
-0.11 for 1988, 2000 & 2005
respectively
Regressive -only card holders are
eligible for free care
-poor cannot afford
supplementary insurance
Pannarunothai & Mills
1997
Thailand 2002 Underprivileged families spent
OOP as much as 5-6% of their
Regressive -lower income families
without health benefit or

household income on health
care whereas other groups spent
1-2%
low income card
-user fees for uninsured
Yu et al 2008 Malaysia 1989/99 Kakwani index = 0.1043 Progressive switch to private health
services by the rich
& predominant reliance on
subsidized public health
services by the poor
Falkingham J 2004 Tajikistan 1999 As percentage of income,
poorer patients paid relatively
more for all services
Regressive Burden of financing health
care shifted from public to
individuals. 60% of health
expenditure is from private
sources
Gag and Karan 2008 India 1999/200
0
Poor quintiles spend a relatively
lower proportion of their
expenditure OOP than rich
Progressive OOP constitute the largest
share of health expenditure
vary between 80-70% of
health expenditure and 95%
of private.
There is a weak insurance
and community financing
emerging. The poor spend
more on drugs than
inpatient compared to the
rich
Thuan et al 2006 Vietnam 2001/200
2
The poor pay a larger share of
their curative health expenditure
compared to the rich
Regressive The new economic policies
implemented in 1986 has
led to increase in OOP
health expenditures (user
fees)
Hotchkiss et al 1998 Nepal 1996 OOP proportion of ATP from
first to last quartile is 3.2%,
4.6%, 6.7%, and 7.8%
Progressive Both poor and rich use
public facilities
-public facilities prescribe
expensive medicines for the
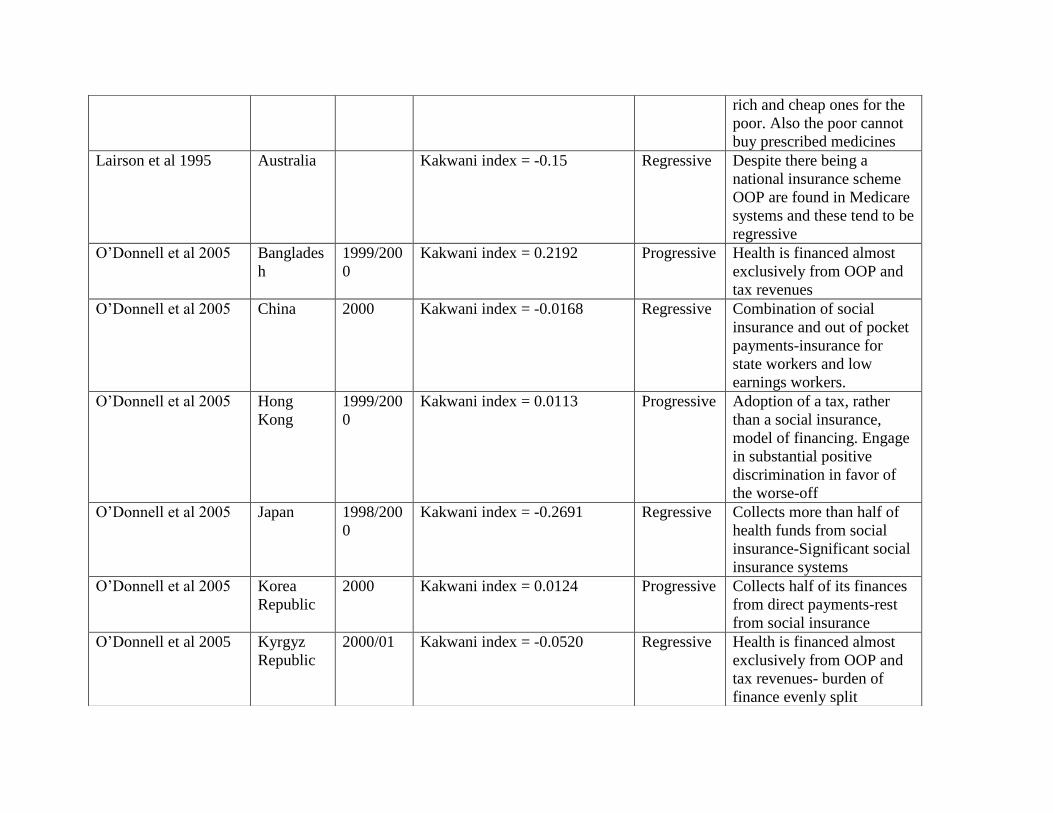
rich and cheap ones for the
poor. Also the poor cannot
buy prescribed medicines
Lairson et al 1995 Australia Kakwani index = -0.15 Regressive Despite there being a
national insurance scheme
OOP are found in Medicare
systems and these tend to be
regressive
O‟Donnell et al 2005 Banglades
h
1999/200
0
Kakwani index = 0.2192 Progressive Health is financed almost
exclusively from OOP and
tax revenues
O‟Donnell et al 2005 China 2000 Kakwani index = -0.0168 Regressive Combination of social
insurance and out of pocket
payments-insurance for
state workers and low
earnings workers.
O‟Donnell et al 2005 Hong
Kong
1999/200
0
Kakwani index = 0.0113 Progressive Adoption of a tax, rather
than a social insurance,
model of financing. Engage
in substantial positive
discrimination in favor of
the worse-off
O‟Donnell et al 2005 Japan 1998/200
0
Kakwani index = -0.2691 Regressive Collects more than half of
health funds from social
insurance-Significant social
insurance systems
O‟Donnell et al 2005 Korea
Republic
2000 Kakwani index = 0.0124 Progressive Collects half of its finances
from direct payments-rest
from social insurance
O‟Donnell et al 2005 Kyrgyz
Republic
2000/01 Kakwani index = -0.0520 Regressive Health is financed almost
exclusively from OOP and
tax revenues- burden of
finance evenly split
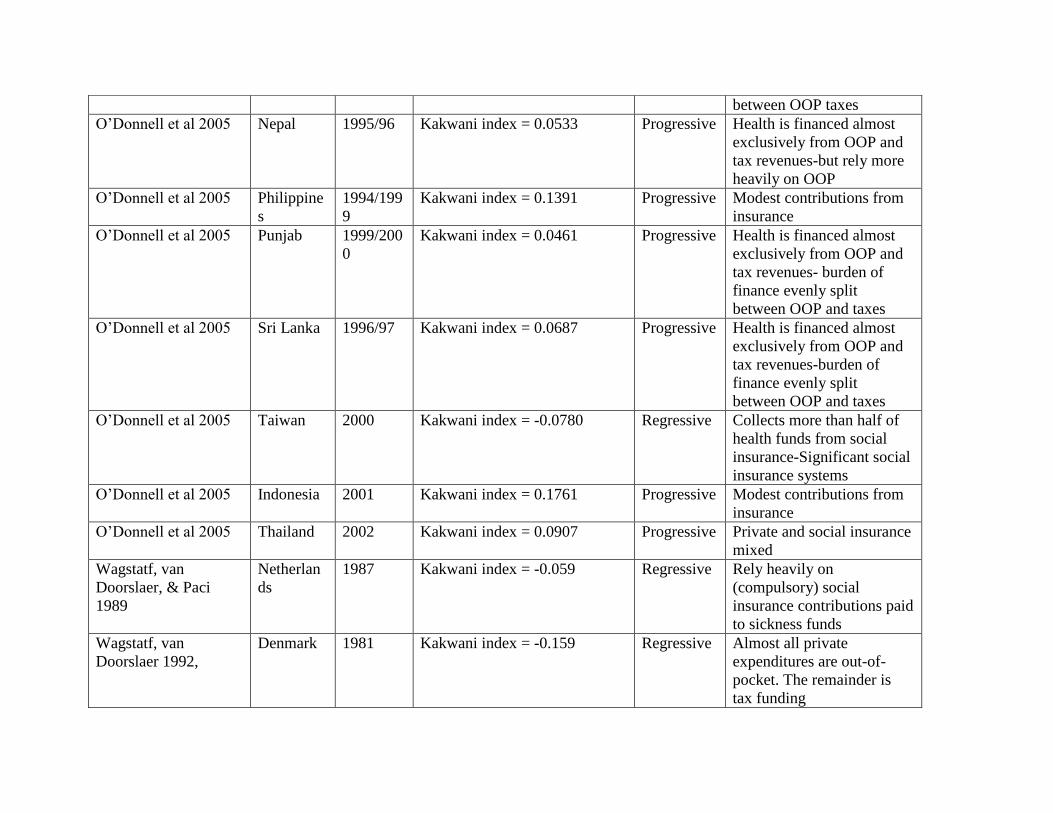
between OOP taxes
O‟Donnell et al 2005 Nepal 1995/96 Kakwani index = 0.0533 Progressive Health is financed almost
exclusively from OOP and
tax revenues-but rely more
heavily on OOP
O‟Donnell et al 2005 Philippine
s
1994/199
9
Kakwani index = 0.1391 Progressive Modest contributions from
insurance
O‟Donnell et al 2005 Punjab 1999/200
0
Kakwani index = 0.0461 Progressive Health is financed almost
exclusively from OOP and
tax revenues- burden of
finance evenly split
between OOP and taxes
O‟Donnell et al 2005 Sri Lanka 1996/97 Kakwani index = 0.0687 Progressive Health is financed almost
exclusively from OOP and
tax revenues-burden of
finance evenly split
between OOP and taxes
O‟Donnell et al 2005 Taiwan 2000 Kakwani index = -0.0780 Regressive Collects more than half of
health funds from social
insurance-Significant social
insurance systems
O‟Donnell et al 2005 Indonesia 2001 Kakwani index = 0.1761 Progressive Modest contributions from
insurance
O‟Donnell et al 2005 Thailand 2002 Kakwani index = 0.0907 Progressive Private and social insurance
mixed
Wagstatf, van
Doorslaer, & Paci
1989
Netherlan
ds
1987 Kakwani index = -0.059 Regressive Rely heavily on
(compulsory) social
insurance contributions paid
to sickness funds
Wagstatf, van
Doorslaer 1992,
Denmark 1981 Kakwani index = -0.159 Regressive Almost all private
expenditures are out-of-
pocket. The remainder is
tax funding
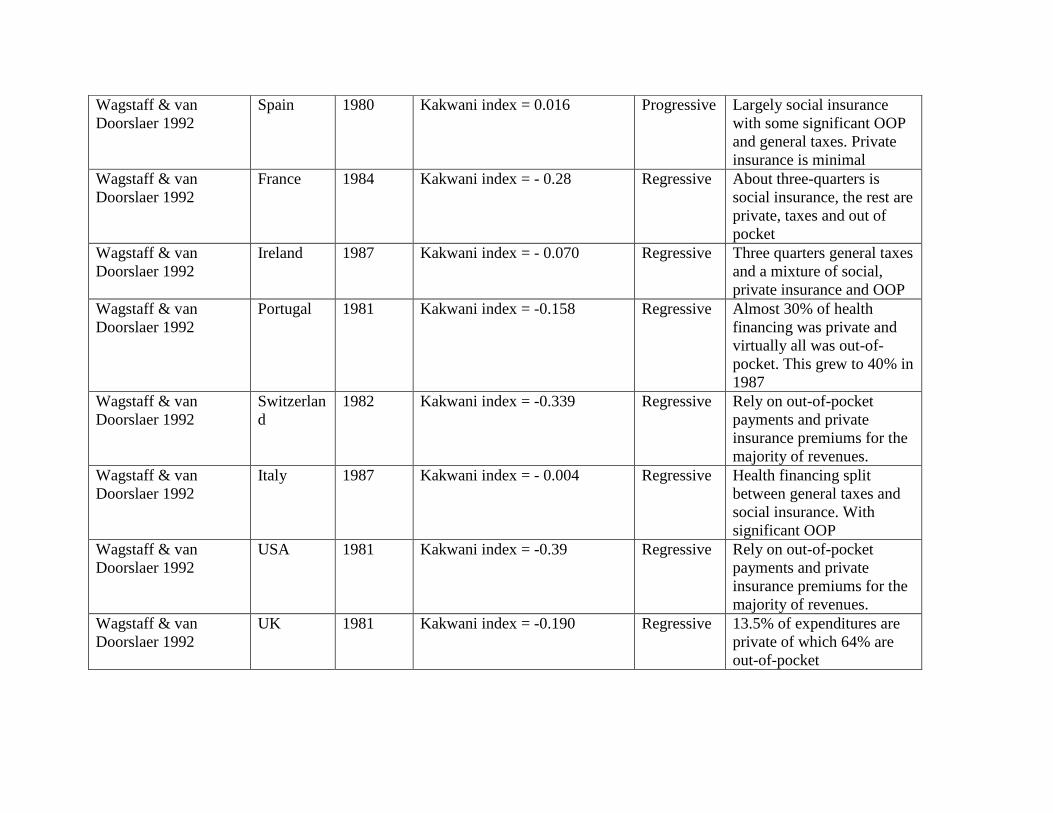
Wagstaff & van
Doorslaer 1992
Spain 1980 Kakwani index = 0.016 Progressive Largely social insurance
with some significant OOP
and general taxes. Private
insurance is minimal
Wagstaff & van
Doorslaer 1992
France 1984 Kakwani index = - 0.28 Regressive About three-quarters is
social insurance, the rest are
private, taxes and out of
Wagstaff & van
Doorslaer 1992
Ireland 1987 Kakwani index = - 0.070 Regressive Three quarters general taxes
and a mixture of social,
private insurance and OOP
Wagstaff & van
Doorslaer 1992
Portugal 1981 Kakwani index = -0.158 Regressive Almost 30% of health
financing was private and
virtually all was out-of-
pocket. This grew to 40% in
1987
Wagstaff & van
Doorslaer 1992
Switzerlan
d
1982 Kakwani index = -0.339 Regressive Rely on out-of-pocket
payments and private
insurance premiums for the
majority of revenues.
Wagstaff & van
Doorslaer 1992
Italy 1987 Kakwani index = - 0.004 Regressive Health financing split
between general taxes and
social insurance. With
significant OOP
Wagstaff & van
Doorslaer 1992
USA 1981 Kakwani index = -0.39 Regressive Rely on out-of-pocket
payments and private
insurance premiums for the
majority of revenues.
Wagstaff & van
Doorslaer 1992
UK 1981 Kakwani index = -0.190 Regressive 13.5% of expenditures are
private of which 64% are
out-of-pocket

Table 4: Determinants of Out of Pocket Payments
Study and Year Country Determinants of Out of Pocket Payments
Habibov N (2009) Tajikistan Ability to pay, gender, using specialized care
Onwujekwe et al
(2010) Nigeria Socio-economic status,
Ruger and Kim (2007)
Republic of
Korea
Presence of illness/chronic condition, type of
insurance, health care use, health facility type
Hong and Kim (2000) U.S.A
Age of household head, location of household(
rural/urban)
Rubin and Koellin
(1993) U.S.A
Insurance status, age of household head,
education of household head, household size,
race, welfare status of the household
Chu et al (2005) Taiwan
Sex, sex of head, marital status, employment
status, education, socio-economic status,
location, household size
Hwang et al (2001) U.S.A
Number of chronic conditions, race, sex, age,
ethnicity, insurance status, poverty status
Mastilica and Chen
(1998) Croatia Age, sex, socio-economic status
Hotchkiss et al(2005) Albania
Insurance status, socio-economic status, type of
service, type of facility
Mugisha et al (2002) Burkina Faso
Where care was sought,
5.0 References
Abu-Zaineh, M., Mataria, A., Luchini, S. & Moatti, J.P. 2008, "Equity in health care
financing in Palestine: the value-added of the disaggregate approach", Social science &
medicine (1982), vol. 66, no. 11, pp. 2308-2320.
Arredondo, A. & Najera, P. 2008, "Equity and accessibility in health? Out-of-pocket
expenditures on health care in middle income countries: evidence from Mexico",
Cadernos de saude publica / Ministerio da Saude, Fundacao Oswaldo Cruz, Escola
Nacional de Saude Publica, vol. 24, no. 12, pp. 2819-2826.
Ataguba, J., Akazili, J., Mtei, G., Goudge, J. & Meheus, F. 2009, "Implications of the
analysis of financing and benefit incidence in Ghana, South Africa and Tanzania for
health insurance policy debates", iHEA 7th World Congress. Beijing.Health Economics
Unit, University of Cape Town.
Barry, B. 1989, Theories of justice, Harvester Wheatsheaf, University of California.
Braveman, P. & Gruskin, S. 2003, "Defining equity in health", Journal of epidemiology
and community health, vol. 57, no. 4, pp. 254-258.
Castano, R.A., Arbelaez, J.J., Giedion, U.B. & Morales, L.G. 2002, "Equitable
financing, out-of-pocket payments and the role of health care reform in Colombia",
Health policy and planning, vol. 17 Suppl, pp. 5-11.
Chang, W.C. 2002, "The meaning and goals of equity in health", Journal of
epidemiology and community health, vol. 56, no. 7, pp. 488-491.
Chu, T.B.; Liu, T.C.; Chen, C.S.; Tsai, Y.W.; Chiu, W.T. 2005, " Household out-of-
pocket medical expenditures and National Health Insurance in Taiwan: income and
regional inequality", BMC health services research, vol 5, pp.60
Cisse, B., Luchini, S. & Moatti, J.P. 2007, "Progressivity and horizontal equity in health
care finance and delivery: what about Africa?", Health policy (Amsterdam, Netherlands),
vol. 80, no. 1, pp. 51-68.
CSDH 2008, Closing the gap in a generation: health equity through action on the social
determinants of health. Final Report of the Commission on the Social Determinants of
Health, World Health Organisation, Geneva.
Culyer, A.J. 2005, The dictionary of health economics, Edward Elgar Publishing
Limited, United Kingdom.
Culyer, A.J. 2001, "Equity - some theory and its policy implications", Journal of medical
ethics, vol. 27, no. 4, pp. 275-283.
Deaton, A. & Zaidi, S. 1999, Guidelines for Constructing Consumption Aggregates for
Welfare Analysis, 217 Working Papers edn, Woodrow Wilson School of Public and
International Affairs, Princeton University.
Falkingham, J. 2004, "Poverty, out-of-pocket payments and access to health care:
evidence from Tajikistan", Social science & medicine (1982), vol. 58, no. 2, pp. 247-
258.
Feldstein, Paul J. 1988. Health care economics. Third edition, 1988. EconLit,
EBSCOhost (accessed November 6, 2010).
Fleurbaey, M. & and Maniquet, F. 1997, "Implementability and horizontal equity imply
no-envy", Econometrica, vol. 65, no. 5, pp. 1215-1219.
Galbraith, A.A., Wong, S.T., Kim, S.E. & Newacheck, P.W. 2005, "Out-of-pocket
financial burden for low-income families with children: socioeconomic disparities and
effects of insurance", Health services research, vol. 40, no. 6 Pt 1, pp. 1722-1736.
Garg, C.C. & Karan, A.K. 2009, "Reducing out-of-pocket expenditures to reduce
poverty: a disaggregated analysis at rural-urban and state level in India", Health policy
and planning, vol. 24, no. 2, pp. 116-128.
Grosh, M. & Glewwe, P. (eds) 2000, Designing household survey questionnaires for
developing countries: lessons from 15 years of the living standards measurement study,
World Bank, Washington D.C.
Habibov, N. 2009, " What determines healthcare utilization and related out-of-pocket
expenditures in Tajikistan? Lessons from a national survey", international journal of
public health, vol 54, no 4,pp. 260-266
Hoedemaekers, R. & Dekkers, W. 2003, "Justice and solidarity in priority setting in
health care", Health care analysis : HCA : journal of health philosophy and policy, vol.
11, no. 4, pp. 325-343.
Hong, Gong-Soog, and Soo Yeon Kim. 2000. "Out-of-Pocket Health Care Expenditure
Patterns and Financial Burden across the Life Cycle Stages." Journal of Consumer
Affairs 34, no. 2: 291-313.
Hotchkiss, D.R., Rous, J.J., Karmacharya, K. & Sangraula, P. 1998, "Household health
expenditures in Nepal: implications for health care financing reform", Health policy and
planning, vol. 13, no. 4, pp. 371-383.
Hurley, J. 2001, "Ethics, economics, and public financing of health care", Journal of
Medical Ethics, vol. 27, pp. 234-239.
Hwang, W.; Weller, W.;Ireys, H.;Anderson, G. 2001, "Out of pocket medical spending
for care of chronic conditions", Health affairs(Project Hope), vol. 20, no.6, pp.267-278

Jan, S. 1999, "A new perspective on economic analysis in health care? A critical review
of 'The Economics of Health Reconsidered' by Tom Rice", Health care analysis : HCA :
journal of health philosophy and policy, vol. 7, no. 1, pp. 99-106.
Kakwani, N.C. 1977, "Measurement of Tax Progressivity: An International
Comparison", Economic Journal, vol. 87, no. 345, pp. 71-80.
Kondo, M. & McPake, B. 2007, "Making choices between prepayment and user charges
in Zambia. What are the results for equity?", Health economics, vol. 16, no. 12, pp.
1371-1387.
Lairson, D.R., Hindson, P. & Hauquitz, A. 1995, "Equity of health care in Australia",
Social science & medicine, vol. 41, no. 4, pp. 475-482.
Lambert, P.J. & and Hutton, P.J. 1979, "Income tax progressivity and revenue growth",
Economics Letters, vol. 3, pp. 377-380.
Langørgen, A. 2008, Targeting public services through unequal treatment of unequals ,
Statistics Norway, Research Department, Norway.
Leive, A. & Xu, K. 2008, "Coping with out-of-pocket health payments: empirical
evidence from 15 African countries", Bulletin of the World Health Organization, vol. 86,
no. 11, pp. 849-856.
Lu, C., Chin, B., Li, G. & Murray, C.J. 2009, "Limitations of methods for measuring
out-of-pocket and catastrophic private health expenditures", Bulletin of the World Health
Organization, vol. 87, no. 3, pp. 238-44, 244A-244D.
Masiye, F., Chitah, B., Chanda, P. & Simeo, F. 2008, Removal of User fees at primary
health care facilities in Zambia: A study of the effects on utilisation and quality of care,
EQUINET Discussion paper series 57, EQUINET, UCT HEU:Harare.
Mastilica, M. & Bozikov, J. 1999, "Out-of-pocket payments for health care in Croatia:
implications for equity", Croatian medical journal, vol. 40, no. 2, pp. 152-159.
McIntyre, D., Whitehead, M., Gilson, L., Dahlgren, G. & Tang, S. 2007, "Equity impacts
of neoliberal reforms: what should the policy responses be?", International journal of
health services : planning, administration, evaluation, vol. 37, no. 4, pp. 693-709.
McIntyre, D., Garshong, B., Mtei, G., Meheus, F., Thiede, M., Akazili, J., Ally, M.,
Aikins, M., Mulligan, J.A. & Goudge, J. 2008, "Beyond fragmentation and towards
universal coverage: insights from Ghana, South Africa and the United Republic of
Tanzania", Bulletin of the World Health Organization, vol. 86, no. 11, pp. 871-876.
McIntyre, D., Thiede, M., Dahlgren, G. & Whitehead, M. 2006, "What are the economic
consequences for households of illness and of paying for health care in low- and middle-
income country contexts?", Social science & medicine (1982), vol. 62, no. 4, pp. 858-
865.
Metz, T. 2003, "Utilitarianism and the meaning of life", utilitas, vol. 15, no. 1, pp. 50-70.
Mooney, G.H. 1983, "Equity in health care: confronting the confusion", Effective health
care, vol. 1, no. 4, pp. 179-185.
Mwabu, G. 1997, User charges for health care: A review of the underlying theory and
assumptions, World Institute for Development Economics Research, United Nations
University.
Narveson, J. 1988, The libertarian idea, Temple University, Philadelphia.
Nozick, R. 1974, Anarch, state, and utopia, Basic Books, New York.
Nyonator, F. & Kutzin, J. 1999, "Health for some? The effects of user fees in the Volta
Region of Ghana", Health policy and planning, vol. 14, no. 4, pp. 329-341.
O'Donnell, O. 2008, "Who Pays for Health Care in Asia?", Journal of health economics,
vol. 27, no. 2, pp. 460-475.
O'Donnell, O., van Doorslaer, E., Rannan-Eliya, R.P., Somanathan, A., Adhikari, S.R.,
Akkazieva, B., Harbianto, D., Garg, C.C., Hanvoravongchai, P., Herrin, A.N., Huq,
M.N., Ibragimova, S., Karan, A., Kwon, S.M., Leung, G.M., Lu, J.F., Ohkusa, Y.,
Pande, B.R., Racelis, R., Tin, K., Tisayaticom, K., Trisnantoro, L., Wan, Q., Yang, B.M.
& Zhao, Y. 2008, "Who pays for health care in Asia?", Journal of health economics, vol.
27, no. 2, pp. 460-475.
Olsen, J.A. 1997, "Theories of justice and their implications for priority setting in health
care", Journal of health economics, vol. 16, no. 6, pp. 625-639.
Onwujekwe, O.E.; Uzochukwu, B.S.; Obikeze, E.N.;Okoronkwo, I.;Ochonma,
O.G.;Onoka,C.A.;Madubuko,G.;Okoli,C. 2010, " Investigating determinants of out-of-
pocket spending and strategies for coping with payments for healthcare in southeast
Nigeria", BMC health services research, vol.10 pp.67
Pannarunothai, S. & Mills, A. 1997, "The poor pay more: health-related inequality in
Thailand", Social science & medicine (1982), vol. 44, no. 12, pp. 1781-1790.
Perkins, M., Brazier, E., Themmen, E., Bassane, B., Diallo, D., Mutunga, A.,
Mwakajonga, T. & Ngobola, O. 2009, "Out-of-pocket costs for facility-based maternity
care in three African countries", Health policy and planning, vol. 24, no. 4, pp. 289-300.
Rabinowciz, W. 2000, "Kotarbisnki's early criticism of utilitarianism", utilitas, vol. 12,
no. 1, pp. 79-84.
Rawls, J. 1974, "Some reasons for the Maximin criterion", American Journal of
Economic Association, vol. 64, no. 2, pp. 141-146.

Rawls, J. 1971, A theory of justice, Revised Edition edn, Havard University Press, USA.
Rice, H.T. 2003, The economics of health reconsidered, Second Edition edn, Foundation
of the American College of Health Executives, USA.
Rubin, Rose M., and Kenneth Koelln. 1993. "Determinants of Household Out-of-Pocket
Health Expenditures." Social Science Quarterly 74, no. 4: 721-735. EconLit,
EBSCOhost (accessed November 6, 2010).
Ruger, J.P. & Kim, H.J. 2007, "Out-of-pocket healthcare spending by the poor and
chronically ill in the Republic of Korea", American Journal of Public Health, vol. 97,
no. 5, pp. 804-811.
Schroth, J. 2008, "Distributive Justice and Welfarism in Utilitarianism", Routledge, vol.
51, no. 2, pp. 123-146.
Smith, S. 2010, "Equity in Irish health care financing: measurement issues", Health
economics, policy, and law, vol. 5, no. 2, pp. 149-169.
Suits, D.B. 1977, "Measurement of Tax Progressivity.", American Economic Review, ,
pp. 747-748.
Thuan, N.T., Lofgren, C., Chuc, N.T., Janlert, U. & Lindholm, L. 2006, "Household out-
of-pocket payments for illness: evidence from Vietnam", BMC public health, vol. 6, pp.
283.
Tsuchiya, A. & Dolan, P. 2009, "Equality of what in health? Distinguishing between
outcome egalitarianism and gain egalitarianism", Health economics, vol. 18, no. 2, pp.
147-159.
Veatch, R.M. 1998, "Egalitarian and maximin theories of justice: directed donation of
organs for transplant", The Journal of medicine and philosophy, vol. 23, no. 5, pp. 456-
476.
Wagstaff, A. & van Doorslaer, E. 2001, Paying for Health Care: Quantifying Fairness,
Catastrophe, and Impoverishment, with Applications to Vietnam, 1993–98, Development
Research Group, World Bank, USA.
Wagstaff, A. & van Doorslaer, E. 2000, "Measuring and Testing for Inequity in the
Delivery of Health Care", Journal of Human Resources, vol. 35, no. 4, pp. 716-733.
Wagstaff, A., van Doorslaer, E. & Paq, P. 1989, "Equity in the finance and delivery of
health care: some tentative cross-country comparisons", OXFORD REVIEW OF
ECONOMIC POLICY, vol. 5, no. 1, pp. 89-112.
Wagstaff, A., van Doorslaer, E., Calonge, S., Christiansen, T., Gerfin, M., Gottschalk,
P., Janssen, R., Lachaud, C., Leu, R.E. & Nolan, B. 1992, "Equity in the finance of
health care: some international comparisons", Journal of health economics, vol. 11, no.
4, pp. 361-387.
Williams, A. 1988, "Priority setting in public and private health care. A guide through
the ideological jungle", Journal of health economics, vol. 7, no. 2, pp. 173-183.
World Health Organisation 2008, World Health Report 2008. Primary Health Care. Now
More than Ever, World Health Organisation, Geneva.
Xu, K., Evans, D.B., Carrin, G., Aguilar-Rivera, A.M., Musgrove, P. & Evans, T. 2007,
"Protecting households from catastrophic health spending", Health affairs (Project
Hope), vol. 26, no. 4, pp. 972-983.
Yu, C.P., Whynes, D.K. & Sach, T.H. 2008, "Equity in health care financing: The case
of Malaysia", International journal for equity in health, vol. 7, pp. 15.
Zere, E., Moeti, M., Kirigia, J., Mwase, T. & Kataika, E. 2007, "Equity in health and
healthcare in Malawi: analysis of trends", BMC public health, vol. 7, pp. 78.
Part C

Journal Article
Instructions to Authors: Journal of Health Policy and Planning
FORMAT OF CONTRIBUTIONS
Only articles in English are considered for publication.
Prepare your manuscript, including tables, using a word processing program and save it as a
.doc, .rtf or .ps file. Use a minimum font size of 11, double-spaced and paginated throughout
including references and tables, with margins of at least 2.5 cm. The text should be left
justified and not hyphenated. Number pages consecutively.
Manuscripts should preferably be a maximum of 5000 words, excluding tables,
figures/diagrams and references (review papers can be longer).
The title page should contain:
Title - please keep as concise as possible and ensure it reflects the subject matter;
Corresponding author's name, address, telephone/fax numbers and e-mail
address;
Each author's affiliation and qualifications;
Keywords and an abbreviated running title;
2-4 Key Messages, detailing concisely the main points made in the paper;
A word count of the full article.
The manuscript will generally follow through sections: Abstract (no more than 300 words),
Introduction, Methods, Results, Discussion, Conclusion, References. However, it may be
appropriate to combine the results and discussion sections in some papers. Tables and Figures
should not be placed within the text, rather provided at the end of the paper or in separate
file/s.
In the acknowledgements, all sources of funding for research must be explicitly stated,
including grant numbers if appropriate. Other financial and material support, specifying the
nature of the support, should be acknowledged as well.
Figures should be designed using a well-known software package for standard personal
computers. If a figure has been published earlier, acknowledge the original source and submit
written pemission from the copyright holder to reproduce the material. Colour figures are
permitted but authors will be required to pay the cost of reproduction.
All measures should be reported in SI units, followed (where necessary) by the traditional
units in parentheses. There are two exceptions: blood pressure should be expressed in mmHg
and haemoglobin in g/dl. For general guidance on the International System of Units, and
some useful conversion factors, see 'The SI for the Health Professions' (WHO 1977).
References must follow the Harvard system

Progressivity and determinants of out-of-pocket
health care financing in Zambia Felix Mwenge
Health Economics Unit
University of Cape Town.
Objective To assess the progressivity and determinants of out of pocket
health care payments in Zambia
Methods Based on data from the Living Conditions Monitoring Survey
(LCMS), conducted in 1998, 2004 and 2006 Kakwani index of
progressivity were estimated with Lorenz and concentration
curves. Dominance tests were also done to establish the
statistical significance of dominance. The same data was also
used to estimate factors determining incidence and magnitude
of out of pocket payments using logistic and Tobit regressions
respectively.
Findings Results show that out of pocket payments were progressive in
1998 and 2006, Kπ= 0.0366 and 0.0171 respectively while they
were regressive in 2004(Kπ= -0.0799). Living in rural area was
associated with less likelihood of incurring out of pocket
payments but only in 2006. Households with more members
and belonging to high socio-economic categories were more
likely to incur out of pocket payments and consequently larger
amounts out of pocket compared to smaller households and
belonging to lower socio-economic categories respectively.
Key Words Out of Pocket payments, Progressive, Regressive, Zambia,
Health care financing.
Word Count 8 230 including title and in-text references
Key Messages
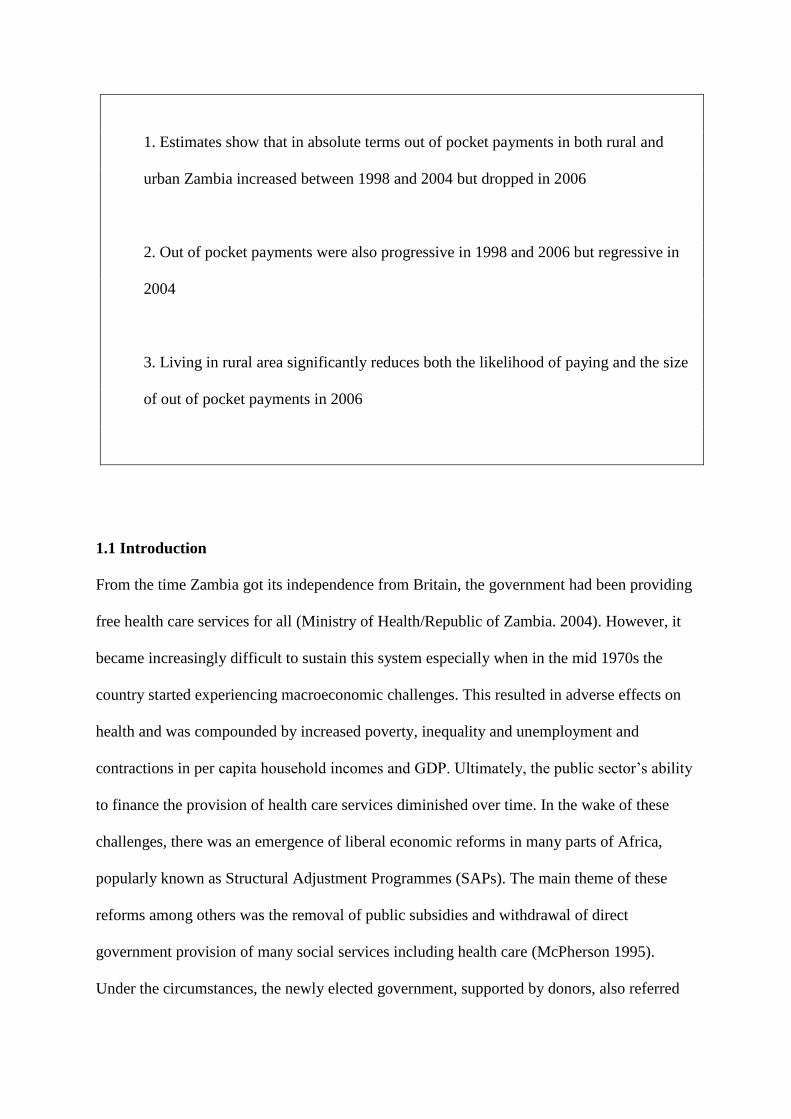
1. Estimates show that in absolute terms out of pocket payments in both rural and
urban Zambia increased between 1998 and 2004 but dropped in 2006
2. Out of pocket payments were also progressive in 1998 and 2006 but regressive in
2004
3. Living in rural area significantly reduces both the likelihood of paying and the size
of out of pocket payments in 2006
1.1 Introduction
From the time Zambia got its independence from Britain, the government had been providing
free health care services for all (Ministry of Health/Republic of Zambia. 2004). However, it
became increasingly difficult to sustain this system especially when in the mid 1970s the
country started experiencing macroeconomic challenges. This resulted in adverse effects on
health and was compounded by increased poverty, inequality and unemployment and
contractions in per capita household incomes and GDP. Ultimately, the public sector‟s ability
to finance the provision of health care services diminished over time. In the wake of these
challenges, there was an emergence of liberal economic reforms in many parts of Africa,
popularly known as Structural Adjustment Programmes (SAPs). The main theme of these
reforms among others was the removal of public subsidies and withdrawal of direct
government provision of many social services including health care (McPherson 1995).
Under the circumstances, the newly elected government, supported by donors, also referred
to as cooperating partners in the Zambian health literature (Ministry of Health 2005, Ministry
of Health Zambia 2006), began in the early 1990s to rationalize that if rich countries could
not afford to provide free services to their populations, poor countries like Zambia could
similarly not afford to sustain their “free-for-all” health policies. Thus in 1992, far-reaching
national health reforms were initiated. A major tenet of the reforms was the cost-sharing
health policy (introduced in 1993), which saw Zambia introducing user fees in all public
facilities at all levels of care. Patients were now required to pay at the point of use of health
services.
These health reforms were initially greeted with enthusiasm, and some positive changes were
recorded in the early years of the reform implementation (Gilson et al. 2003). In years that
followed however there has been a reversal of the situation causing a waning of interest in the
health reforms and increased skepticism. This generated intense (and on-going) debate about
the ability of the reforms to foster a number of things including better coverage, equity and
ease of access to health care (Blas, Limbambala 2001, Malama et al. 2002, van der Geest et
al. 2000). The subject of user fees is at the center of the health reforms and health policy
debate as a key policy instrument for health care financing. A key anxiety in this regard
concerns the health and socio-economic implications of user fees as a financing option,
particularly given the poverty context of health in Zambia. Masiye et al (2008) observe that
implementing user fees in a health setting with widespread poverty and poor key health
indicators has been very challenging. Contrary to expectations, user fees resulted in lower
utilization rates and denied more people, especially the poor, access to health care. During the
same period about 22% of urban and 30% of rural patients were turned away from health
facilities because they could not pay for services upfront (Kondo, McPake 2007). User fees
were later abolished in April 2006 but this was only for primary health care in rural areas.
This implies that urban residents, as well as rural residents needing care beyond the primary
level need to make direct payments.
Despite these challenges Zambia‟s vision still remains to provide its people with equity of
access to cost-effective, quality healthcare as close to the family as possible (Ministry of
Health 2005). However, achieving this vision in a country where the majority people are poor
as earlier pointed out is challenging especially if healthcare use is linked to one‟s demand
instead of need. Health economists usually draw a difference between need and demand for
health care (Asian Development Bank 2000). A person's need in this context is linked to a
person's ability to benefit from health care, regardless of whether they are able to pay for it or
not, whereas demand is specifically linked to the ability to pay, which for a poor person often
is substantially less than his/her need. Because of this, it is generally accepted that for reasons
of equity, individuals should contribute to health care according to their ability to pay but
benefit according to their healthcare need (McIntyre 2009). In other words, those who have
more resources should contribute more proportionally in paying for healthcare compared to
those with fewer resources. At the same time, those with more health needs should benefit
more from health services than those with fewer needs. Contributing to health care according
to ability to pay is a vertical equity concept and is a major subject in many health policies. In
health care financing vertical equity refers to the extent to which households of unequal
ability to pay make appropriately dissimilar payments for health care (Cisse, Luchini &
Moatti 2007a). If contributions to health care are proportionally related to one‟s ability to
pay, they are said to be progressive. Hence, a progressive health care financing mechanism is
one for which health payments increase proportionally with ones resources or income. This is
desirable for achieving equity in the financing of health care.
The main objective of this study is to assess the progressivity and determinants of OOP
health care payments in Zambia. Specifically the study seeks to measure OOP health
expenditure as a share of total household expenditure and compare this across different socio-
economic groups. It also attempts to determine the characteristics of households who make
OOP health care payments as well as assess factors that influence the incidence and size of
OOP health care payments. It also compares trends in the progressivity of OOP health care
payments for the three years (1998-2006)
The rest of this paper is organized as follows. The next section presents a brief overview of
progressivity of OOP payments. A section on data and methods follow thereafter. This is
followed by the findings and discussion. The paper ends with conclusions and
recommendations for policy interventions.
1.2 Overview of Progressivity of OOP payments
In Zambia, no specific study has been done to investigate the progressivity and determinants
of OOP payments. A related study by Cheelo et al (2009) to measure out of pocket health
expenditures and distribution of catastrophic payments in Zambia only estimated the
relationship between OOP payments and household income. In most of the studies done in
Africa, OOP payments are a regressive source of financing. In sub-Saharan Africa, McIntyre
et al (2005) note that health systems where a relatively large share of health care financing is
attributable to OOP payments will always be regressive unless the majority of low-income
people simply do not use health services when needed. They further stress that from the
perspective of health service benefits, OOP payments are also inimical to equity, as benefits
are distributed solely based on ability to pay rather than based on need for health care.
Building on this argument, evidence from four francophone West African capitals (Abidjan,
Bamako, Conakry and Dakar) strongly suggests a regressive pattern of OOP payments for
health care, with lower income groups bearing a higher burden (Cisse, Luchini & Moatti
2007b). Results also show that regressivity varies substantially across cities: It was a lot more
regressive in Bamako and Conakry, with Kakwani indices of −0.22 and −0.52, respectively
than in Dakar (−0.08). In a similar analysis of OOP costs for facility based maternity care in
three other African countries, Perkins et al (2009) found that the fees paid for all deliveries
(normal and complicated) by women for maternity care were regressive in all three countries
(Burkina Faso, Kenya and Tanzania). For example, in Tanzania, the average cost to the
poorest women for all types of deliveries was US$4.6, compared with US$5.1 for all women.
In Burkina Faso, the average cost to women in the poorest quintile was US$7.6 compared
with US$7.9 for all women. In Kenya, women in the poorest quintile paid on average,
US$20.3 which is more than the mean cost to all women (US$18.4).
Internationally, the progressivity of OOP payments is mixed. Rasell et al. (1994) found in the
United States that out-of-pocket spending was particularly regressive with low-income
families‟ expenditures, as a share of income, nearly 9 times the level of those of high-income
families. In Thailand, Pannarunothai et al (1997) observe that underprivileged families spent
about 5–6% of their incomes OOP for health care, whereas other groups spent only 1–2%. In
Asia, O‟Donnell (O'Donnell 2008) found that OOP payments where regressive in Taiwan and
notes that the rich paid more OOP in absolute terms but less as a proportion of incomes.
Similar results were obtained in Australia in a study by Lairson et al (1995). They point out
that though the entire health financing system is progressive, OOP payments were regressive
with a Kakwani index of -0.15 compared to that of General tax (0.07) and Medicare levy
(0.09). The progressivity of OOP payments have been recorded in some countries. For
example, Yu et al (2008) report the progressivity of OOP expenditures in Malaysia in the
period 1998/9 with a Kakwani index of approximately 0.1043. Authors note that the slight
progressivity observed could have resulted from the switch to private health services by the
rich and the predominant reliance on subsidized public health services by the poor. In
Colombia, Castano et al (2002) observed that OOP expenditures behaved differently
depending on the type of survey used. They highlight that when Kakwani indices were
estimated using a survey that used household cash income, the burden appeared increasingly
regressive, but when a survey that used total expenses was used, the burden became slightly
progressive. They further explain that this lack of a clear evolution towards a less regressive
burden can be plausibly explained by arguing that OOP payments increased for all
households, but their rates of increase were larger for households in the middle deciles of
expenses and lower for the better off and the worse off, at least for urban households
(Castano et al, 2002)
2.0 METHODOLOGY
2.1 Data Sources
This paper is based on three rounds of the Zambian Living Conditions and Monitoring
Surveys (LCMS) – 1998, 2004, and 2006. These are nationally representative surveys
conducted by the Zambian Central Statistical Office (CSO) as shown in Table 1. The LCMS
contains information on several modules including demographic, health, education,
household expenditure, household access to various amenities and facilities. They contain
individual as well as household level information. Individual level data includes some
relevant socio-demographic information (age, sex, education, urban/rural location etc).
Relevant household level data include total household consumption, total household
expenditure as well as out-of-pocket health expenditure. Other important details on the
survey methodology are presented in appendix 15.
2.2 Statistical Methods
a. Estimating Out of Pocket payments
Out-of-pocket (OOP) health payments refer to payments made by households at the point
they receive health services. These payments are not reimbursed by any prepayment scheme.
They could either be paid at a public or private facility. In this analysis, OOP payments
included costs of medicines, fees to medical personnel (e.g. Doctor / Health Assistant /
Midwife / Nurse / Dentist, etc), payments to hospital/health centre/surgery as well as fees to
traditional healer. However, expenditure on health-related transportation is excluded. This
avoids imputation of transport costs for households using private means of transportation.
Total OOP expenditures for each household were adjusted by adult-equivalent household size
to reflect each household member‟s OOP payment experience.
b. Measuring Socio-economic Status
Total household expenditure was used to estimate household socio-economic status in all the
three periods considered. This is in line with the World Bank‟s recommendations for
developing countries (Grosh, Glewwe 2000). Compared to income, there is less variability in
household expenditure. Furthermore, total household expenditure was adjusted for household
size and composition using equivalised household size to obtain equivalent household
expenditure. Equivalised household size was obtained as follows:
Where eqsize represents the number of consumption equivalents in the household
and hhsize is the actual size. The value of β is estimated at 0.56 from data from 59 countries
using fixed effects regression (Xu et al. 2003). This value is now being used as representative
value in empirical studies of this nature. Households were further categorized into five
quintiles of socio-economic status using the equivalent household expenditure. In all
analyses, sample weights (aweights) were applied and the unit of analysis is the household.
All analyses were carried out using STATATM
10 software.
c. Estimating Progressivity of Out of Pocket Payments.
To estimate the progressivity of OOP payments the study first estimated OOP payment as a
percentage of total household expenditure. Progressivity of OOP payments was assessed
using the Kakwani Index of progressivity (Kakwani 1977). This is defined as the difference
between the Gini coefficient for income (or expenditure) distribution (G) and the
concentration index for the distribution of OOP payments (C). The Gini index follows a
univariate distribution (i.e. solely measures income distribution (ability to pay) while the
concentration index follows a bivariate distribution. For example, in this case comparing the
distribution of out of pocket payments to household ability to pay variable e.g. total
household expenditure. The Gin index is the ellipse-shaped area between the Lorenz Curve
(Figure 1) as a proportion of the total area under the diagonal. It is therefore equal to one
minus the area under the Lorenz Curve and ranges from zero (when there is complete
equality and the Lorenz Curve coincides with the diagonal) to 1 (when all income is
concentrated in the hands of one person). The concentration index (C) on the other hand is
defined in exactly the same way except that the concentration curve L(s) is used instead of the
Lorenz curve. Both the Concentration and Gini index can be calculated by;

Where C is the concentration or Gini index, yi is the health payments (for C) or the measure
of living standards (for G) and Ri is the fractional rank of the living standards measure (i.e.
expenditure.)
Kakwani index of progressivity is then derived from these two indices and is twice the area
between the concentration curve for OOP payments and the Lorenz curve. This is defined as:
Kπ = C– G
Where C is the concentration index for health payments and G is the Gini coefficient of the
ability to pay (ATP) variable (i.e. equivalent expenditure). If OOP expenses are a progressive
(regressive) source of financing, the concentration curve will lie below (above) the Lorenz
curve, and Kπ will be positive (negative). If OOP payments are perfectly correlated with
income, Kπ will be zero and the financing source will be proportional. Proportionality could
also arise when these curves cross each other. However, while visual inspection of
concentration curves, Lorenz Curve and the line of equality may give an impression of
whether there is dominance, this may not be sufficient to conclude whether or not dominance
is statistically significant. It is also true to say that Concentration curves are estimated from
survey data and so may display sampling variability. Therefore, it is important to provide
statistical tests of dominance between the curves. To confirm dominance of concentration
curves, dominance tests to see if the concentration curve dominated the Lorenz curve in each
year were carried out for all the three years under analysis using the multiple comparison
approach (MCA) decision rule, with comparisons at 19 equally spaced quintile points and a 5
percent significance level (O‟Donnell and others, 2008).
d.Factors determining Out of Pocket payments
Model specification

A logistic regression was used to assess the factors determining OOP payments. The model is
thus specified in general as:
iXyi
Where out of pocket payments (a binary outcome) is the dependent variable (y*). It is 1 if
household out of pocket payments is greater than 0 (oop > 0) and a value of 0 otherwise.
Independent variables (Xi) are defined in table 3. Also α is the constant and βi the coefficients
being estimated. The β coefficients have been interpreted in terms of log-odds ratios, a
concept that is commonly used in biostatistics and epidemiology. Because of the particular
functional form of the standard logistic distribution the odds ratio simplifies to
P(y*=1)/P(y
*=0) = exp (xβi) and therefore the coefficients can be interpreted in terms of
changes in the log-odds-ratio log (P(y*=1)/P(y
*=0)) (Jones, 2006).
e. Factors determining size of Out of Pocket payments
Tobit model is used to assess the factors determining the magnitude of OOP payments. This
is because the dependent variable (oop) is limited or censored. There is sufficiently large
number of OOP expenditures reported as zero. For example, only about 40% of households in
all three surveys reported positive OOP payments, the rest of the observations are zeros. For
such limited dependent variables the Tobit model (Tobin 1958) or sample selection models
are usually a preferred model of analysis compared to the usual OLS. The Tobit model like
other sample selection models assumes a truncated or censored dependent variable and uses
all observations, both those at the lower limit and those above it, to estimate independent
effects.

The intuition behind a Tobit model is such that first, we have a latent model where the
dependent variable, say, yi*, which has some independent variables and coefficients and a
disturbance term that is normally distributed with a mean of zero. However, we have
censoring at zero. Thus we have an observed yi that equals yi* if the value of yi* is greater
than zero, but equals zero if the value of the unobserved yi* is less than or equal to zero.
The Tobit model is thus represented by:
Where yi* is the latent dependent variable-in this case out of pocket payments equal to or
below zero (oop ≤ 0), yi is the observed dependent variable, i.e. positive out of pocket
payments (oop > 0), xi is the vector of the independent variables, same as those in table 3. β
is the vector of coefficients, and the εi‟s are assumed to be independently normally
distributed: εi ~N(0; σ) (and therefore yi ~N(xi β, σ).
The Tobit model has been applied in many similar studies. For example, in Mugisha et al
(Mugisha et al. 2002) in Burkina Faso to estimate OOP expenditure on health care where
information was only available for independent variables (age, sex and income) but limited
for the dependent variable (OOP expenditure) . The Tobit model has also been applied in
Taiwan to assess health expenditure for the elderly where a good number of health
expenditures were unreported (Chi, Hsin Fall 1999). Stoddard and Gray (Stoddard, Gray
1997) also used the Tobit model to estimate maternal smoking and medical expenditures for
childhood respiratory illness where the analysis included a large number of children with no
respiratory-related medical expenditures.
In this paper, the variables used in the regression analyses are presented and described in
table 3.
3.0 RESULTS
Results are presented in this section. Generally, there were a lot of unreported OOP
expenditures especially for poorer households in all the three data sets. This should be borne
in mind when interpreting results especially concerning progressivity. As shown in table 2
only about 11, 15 and 13 percent of households in the first quintile (poorest) reported paying
OOP in the previous two weeks compared to 25, 23 and 24 percent of households in quintile
5 (richest) for 1998, 2004 and 2006 respectively. Table 2 also shows that on average,
households in the lowest socio-economic group spent the least OOP.
Table 4 shows the mean OOP payments per adult equivalents by household characteristics in
each year. Mean OOP per adult equivalent refers to the amount of OOP payments that each
person in a given household spent on average after adjusting for household size and
composition. The amount of OOP payments reported per household characteristic is in
absolute terms and reported in Zambian Kwacha1. From table 4 it can be seen that on
average, households in rural areas spent less OOP compared to households in urban areas for
all three analyses. This was expected as households in rural areas may not afford to pay OOP.
Absolute amount spent OOP was however largest in 2004 compared to the other two years
for both rural and urban areas. This increase in OOP especially between 2004 and 2006 can
be attributed to the abolition of user fees by government in early 2006. Similarly, households
1 exchange rates for 1998, 2004 and 2006 are K2388, K4772 and 3602 per US$1 respectively
with married and male heads spent more OOP compared to households with unmarried and
female heads respectively. When the age of the household head is considered, households
headed by individuals who are younger than 25 years spent the least OOP in all three years.
The largest OOP expenditure was spent by households whose head is aged between 34 and
45 years in 1998 and 54-65 years in 2004 while households headed by an individual aged
above 64 years spent the largest amount OOP in 2006. Households headed by a working head
(wage employment or doing some business/self-employed) spent more OOP than households
headed by a non-working household head. This is normal as non-working heads may not be
able to afford random OOP payments. This distribution was consistent for all the three
analyses. OOP expenditures also varied according to levels of education of household heads.
There was an increasing trend in OOP expenditures as the level of education increased for all
years under analysis. This is expected as the level of education is attributed to ones earning
capacity, all things being equal. Usually more years of education are attributed to higher
income earnings. Households where the head had primary education spent the least OOP
while households where the head had higher education i.e. post secondary education had the
largest OOP expenditure. There was no household head without any formal education. In
terms of socio-economic status, as expected, quintile 1 (i.e. the poorest) spent the least OOP
compared to all other quintiles in all the years while households in quintile 5 spent the most.
The analysis also estimated the amount of equivalent OOP payments made in each category
of socio-economic status as a proportion of equivalent household expenditure. From table 5 it
can be seen that OOP payments as a proportion of total household expenditure increased with
household expenditure consistently for the 1998 analysis.
Intuitively, it can be observed that OOP payments were progressive in 1998. However, it is
difficult to draw a similar conclusion for the 2004 and 2006 analyses given the inconsistent

relationship between equivalent OOP payments and equivalent household expenditure
observed for the two years. Whereas OOP payments as a proportion of household expenditure
increased consistently with income in 1998, the picture is different for the other two years
making it difficult to conclude on the progressivity of payments. In such cases, the Kakwani
index is used to draw a conclusion.
The results presented in table 5 confirm that OOP payments were generally progressive in
1998 (Kπ= 0.03656) and in 2006 (Kπ= 0.0171) while they were regressive in 2004 (Kπ=
0.0799). A visual sense of the progressiveness and regressiveness of OOP payments for all
analyses can further be seen in figures 2, 3 and 4. In figure 2 and 4 the concentration curve -
L(s) lies below or outside Lorenz curve - L(x) suggesting that OOP payments were
progressive in 1998 and 2006. On the contrary, the L(s) for 2004 lies above or inside the L(x)
especially for the lower levels of socio-economic status implying that OOP payment were
regressive in 2004.
Dominance test results presented in table 6 compare the cumulative shares of equivalent
expenditure with the cumulative shares of equivalent OOP payments. It can be observed that
the Lorenz curve significantly dominates the OOP payments concentration curve at all
quintile points presented in the 1998 and 2006 analyses. However, in 2004 the Lorenz curve
is significantly dominated for the first and second 20% of the population. As can be seen
from table 6 the difference between the Lorenz curve and concentration curve for the last two
quintiles of 2004 is not significant at the 10% level of significance.
The results of the Logistic and Tobit regression presented in table 7 shows that the overall
models are highly significant as well as most of the variables. Larger households were
significantly more likely to incur OOP expenditure in all three analyses. On the other hand,
rural households are less likely to incur OOP payments compared to urban households in all
the years but this is only significant in 2006. This implies that the location of a household was
not associated with OOP spending in 1998 and 2004. Households headed by older heads were
less likely to incur OOP payments but this is not significant in 2006. The odds of OOP
spending also tend to reduce significantly for households headed by males compared to
households headed by females. In all analyses, households with a married head were more
likely to spend OOP compared to households headed by unmarried heads. Increasing the
number of years of education of the household head significantly reduces the odds of
spending OOP in all the years. This is despite the belief that households headed by more
educated heads may also earn higher incomes given the positive relationship between income
and education and hence be in a better position to meet OOP payments. All results were not
significant for work status of the household head. Lastly as expected, belonging to a higher
socio-economic group significantly increases the odds of OOP spending. This was significant
at 1% level of significance for all three years.
Comparing results of logistic and Tobit regressions it can be seen that increasing the number
of people in a household does not only increase the likelihood of spending OOP but also
significantly increases the magnitude spent OOP. This is consistent for all analyses.
Similarly, households headed by a male spend less OOP compared to households headed by a
female head for all years under analysis. Location of a household had no effect on the size of
household OOP in 2004 and 2006 except in 1998. In 1998 rural households were likely to
spend less OOP compared to urban households at a significant level of 5%. Age of a
household head had no effect on the size of OOP payments by a household. Furthermore,
belonging to a higher socio-economic status does not only increase the likelihood of spending
OOP as observed by significant results in table 7 but also increases the magnitude households
spent OOP. This can be seen by significant results (1% level of significance) obtained in the
Tobit regression. Results are not significant in 1998 and 2004 on the effect of different levels
of education on household OOP payments. However, taking primary education as a reference
category, households headed by a head with secondary and higher education were likely to
spend less OOP. This is contrary to expectations and descriptive statistics. Work status of the
household head was significantly associated with lower amounts of household OOP
payments in 2006. Results were not significant for the other years.
4.0 Discussion
Out of pocket payments remain one of the single largest sources of health care financing in
Zambia and the rest of sub-Saharan Africa. This paper examines the progressivity and
determinants of OOP payments in Zambia. The Kakwani index of progressivity was used to
assess progressivity on data drawn from the 1998, 2004 and 2006 living conditions
monitoring survey. These data were also used to assess factors affecting OOP payments using
regression based analysis.
The empirical results reveal many important things. Notably, in absolute terms, OOP
payments generally increased from 1998 to 2004 and dropped in 2006. Dwelling in a rural
area compared to an urban area was significantly associated with a lower likelihood of
spending OOP but only in 2006 and not in the other two years. Results were significant for
2006 at the 1% level of significance and not significant for the other two years. These
findings are not mere coincidence but seem to point to one thing and it seems safe to make
the following conclusion. In April 2006, about 8 months prior to the 2006 survey the
government of Zambia, after much debate and deliberations abolished user fees for primary
health care in all public facilities in rural areas. Households in rural areas were to obtain
primary health care services without paying. This may offer an explanation for the observed
results. It could be true that after user fees were abolished paying OOP reduced in rural areas
compared to urban areas. What makes this explanation even more valid are the results of the
study by Masiye et al (2010) undertaken 15 months after the user fee abolition policy was
implemented. The findings in this study are that user fee removal was accompanied by
increased utilisation of health care services. Based on this, it is likely that removal of user
fees for primary health care in rural areas reduced the payment of OOP payments allowing
more people to access health care services especially in rural Zambia.
Evidence on the role of OOP payments in creating barriers to access to health care has been
documented in a number of countries. In Tanzania, Manzi et al (2005) found that OOP
payments did not only place an inequitable financial burden on poor families but also
negatively affected utilisation. In Mexico Arredondo and Najera pointed out that high OOP
payments in Mexico tended to create a barrier to access to health care. This clearly indicates
that OOP payments actually hinder health care use and that user fee removal is one way they
can be reduced.
The study also found progressive out of pocket payments in 1998 and 2006. However, it
should be mentioned in the strongest of terms that this result should be treated cautiously.
The reason for this is that there were so many unreported OOP payments especially by the
poor households as earlier demonstrated. It has also been observed from descriptive statistics
that more OOP payments were made by households of high socio-economic status compared
to households of low socio-economic status. Low OOP payments among the poorest are due
to the fact that they do not use health care services because they cannot afford to pay. To this
effect, it could be true that the apparent progressivity observed in the two years is at the
expense of the poor households who did not make as much OOP payments as the richer
households. McIntyre et al (2005) have also observed this phenomenon for many sub-
Saharan African countries where OOP payments are predominant.
Overall, descriptive statistics also show more OOP payments in urban areas compared to
rural areas. This may be because the urban population are more educated and have more
income and economic power and are hence more able to spend OOP than the rural
population. Results also show that the likelihood of spending OOP rises with household size.
This also applies to the size of OOP payments. This finding is consistent with similar studies.
For example, O‟Donnell (2008) found that larger households in Bangladesh and Thailand
were more likely to spend OOP and thus were more susceptible to catastrophic health
expenditures. It has also empirically been established that generally the likelihood of
households spending OOP as well as the size of payments significantly increased with
household income. Naturally, richer households may be more able to afford OOP payments
compared to poorer households who usually have to choose between making health payments
and spending on other household basic needs. This finding is also consistent with other
international studies (Leive & Xu, 2008). Results further show that the likelihood of spending
OOP reduced significantly if the household head was male and older. However, it increased
for households with a married head. The same effect was observed in terms of the size of
OOP payments, except for the actor of age which was not significant for all the analyses,
implying that age of a household head did not affect the amount spent OOP. These results are
also consistent with those found by Chu et al (2005) in Taiwan.
However, the study was not without limitations. To begin with, the living conditions
monitoring survey, like all household surveys, is prone to respondent errors and recall biases.
This may affect the findings by either over-estimating or under-estimating of some important
variables. For example, survey data on OOP payments are potentially subject to both recall
bias and small sample bias due to the infrequency with which some health care payments are
made. This problem is compounded by the fact that the survey only collects health
expenditures made in the month prior to the survey. Given the seasonality of illness and
consequential health payments, a one month recall period may lead to eventual biases. The
study used the household as a unit of analysis. This is a limitation in the sense that creation of
household-level variables does not account for some of the complexities of the diversity in
families. However, this was important to create a clearer analysis.
Secondly, the use of the summary index to determine progressivity of health payments also
tends to be problematic and un-interpretable in situations where curves cross. However, this
has been checked by testing for the dominance of Lorenz and concentration curves.
Thirdly, the operational definition of OOP payments did not include transport costs and other
health related expenditures such as food and patient care. While it is understood that the
computation of these aspects of costs is challenging due to lack of uniformity in transport
forms and forms of patient care, it is also possible that if these components were included
either the progressivity or regressivity observed may be more pronounced or be offset. For
example, take two patients, one poor and the other rich (in terms of their income) who visit a
health facility. If they each pay the same amount i.e. a fixed sum for a health service, we say
this is regressive because their initial incomes are not related to the payments made.
Nevertheless, if the poorer patient did not incur any transport costs while the richer patient
did, the regressivity observed may be offset by the additional cost of transport spent by the
richer patient. On the other hand, if on top of this regressive payment the poorer patient spent
more money on transport while the richer patient did not, the regressivity will even be more
pronounced. In this regard, future studies should find ways of computing transport costs and
include them in the analysis of progressivity of health payments.
Lastly, when interpreting progressivity results for this particular study it should be borne in
mind that in all three analyses there were a sufficiently large number of zero OOP payments.
This imply that payments appear progressive only because a larger portion of households,
especially poor ones, did not use health services and consequently could not make any health
payments at all.
5.0 CONCLUSION
Based on the results of this analysis, OOP was progressive in the two years (1998 and 2006)
and regressive in 2004. However, the apparent progressivity in the two years is due to the fact
that richer households made more out of pocket payments than poor households. This is
evidence from Table 2. It can be concluded that the progressivity of OOP in Zambia is at the
expense of the poor who could not afford to pay for health care. The study also asserts that
the reduction in OOP payments observed between 2004 and 2006 is attributable to the
abolition of user fees for rural primary health care in early 2006. This has been validated by
another study which found increased health care utilization after abolition of user fees at rural
primary health care facilities in the year 2006 (Masiye et al. 2008). In view of the foregoing
findings, there is need to cushion households from making out of pocket payments as this
may be regressive. Additionally, out-of-pocket payments may be progressive when the poor
do not make payments as they cannot afford care. This has been demonstrated in this study.
To mitigate these, alternative health financing mechanisms that are more progressive,
guarantee access to care by all, and do not require health care users to pay at the point of use
of health services should be introduced and promoted. This will reduce the incidence and the
amount spent out of pocket by households. Furthermore, there is a need to pursue more
equitable health care financing mechanisms in Zambia which are truly progressive as
opposed to OOP payments.
Acknowledgements
I would like to acknowledge the contribution of my supervisor, John E. Ataguba who
provided comments and held discussions with me from time to time during the study. My
heartfelt appreciation also goes to Di McIntyre, the South African „Health and Wealth‟
research chair and to the Health Economics Unit for sponsoring my programme. Di McIntyre
also inspired me to undertake a study related to health care financing which I gladly
appreciate.
6.0 References
Asian Development Bank 2000, "Analysis of demand and need" in Handbook for the
economic analysis of health sector projects, First edn, Asian Development Bank,
Manila, Philipines, pp. 27-38.
Blas, E. & Limbambala, M. 2001, "User-payment, decentralization and health service
utilization in Zambia", Health policy and planning, vol. 16 Suppl 2, pp. 19-28.
Cheelo, C., Chama, C., Kansembe, H., Jonsson, D., Xu, K. & Kakungu, F. 2009,
Measuring the distribution of health payments and catastrophic effects of health
spending in Zambia: an analysis of aousehold-level survey data, Report edn.
Chi, P.S.K. & Hsin, P. Fall 1999, "Medical utilization and health expenditure of the
elderly in Taiwan", Journal of Family and Economic Issues, vol. 20, no. 3, pp. 251-270.
Cisse, B., Luchini, S. & Moatti, J.P. 2007a, "Progressivity and horizontal equity in
health care finance and delivery: what about Africa?", Health policy (Amsterdam,
Netherlands), vol. 80, no. 1, pp. 51-68.
Cisse, B., Luchini, S. & Moatti, J.P. 2007b, "Progressivity and horizontal equity in
health care finance and delivery: what about Africa?", Health policy (Amsterdam,
Netherlands), vol. 80, no. 1, pp. 51-68.
Gilson, L., Doherty, J., Lake, S., McIntyre, D., Mwikisa, C. & Thomas, S. 2003, "The
SAZA study: implementing health financing reform in South Africa and Zambia",
Health policy and planning, vol. 18, no. 1, pp. 31-46.
Grosh, M. & Glewwe, P. (eds) 2000, Designing household survey questionnaires for
developing countries: lessons from 15 years of the living standards measurement study,
World Bank, Washington D.C.
Kakwani, N.C. 1977, "Measurement of Tax Progressivity: An International
Comparison", Economic Journal, vol. 87, no. 345, pp. 71-80.
Kondo, M. & McPake, B. 2007, "Making choices between prepayment and user charges
in Zambia. What are the results for equity?", Health economics, vol. 16, no. 12, pp.
1371-1387.
Lairson, D.R., Hindson, P. & Hauquitz, A. 1995, "Equity of health care in Australia",
Social science & medicine, vol. 41, no. 4, pp. 475-482.
Malama, C., Chen, Q., De Vogli, R. & Birbeck, G.L. 2002, "User fees impact access to
healthcare for female children in rural Zambia", Journal of tropical pediatrics, vol. 48,
no. 6, pp. 371-372.
Masiye, F., Chitah, B., Chanda, P. & Simeo, F. 2008, Removal of User fees at primary
health care facilities in Zambia: A study of the effects on utilisation and quality of care,
EQUINET Discussion paper series 57, EQUINET, UCT HEU:Harare.
Masiye, F., Chitah, B.M. & McIntyre, D. 2010, "From targeted exemptions to user fee
abolition in health care: Experience from rural Zambia", Social science & medicine
(1982), .
McIntyre, D. 2009, Learning from Experience:Health care fnancing in low and middle-
income countries, Global Forum for Health Research, Switzerland.

McIntyre, D., Gilson, L. & Mutyambizi, V. 2005, Promoting equitable health care
financing in the African context: current challenges and future prospects. Equinet
Discussion paper 27, EQUINET, Sweeden.
McPherson, M.F. 1995, The Senquencing of Economic Reforms: Lessons from Zambia,
Netherlands.
Ministry of Health 2005, National Health Strategic Plan 2006-2010 “Towards
Attainment of the Millennium Development Goals and National Health Priorities”,
Ministry of Health, Lusaka.
Ministry of Health Zambia 2006, National Health Accounts for Zambia 2002 - 2004,
Ministry of Health, Lusaka.
Ministry of Health/Republic of Zambia. 2004, National health care financing policy,
Ministry of Health, Lusaka.
Mugisha, F., Kouyate, B., Gbangou, A. & Sauerborn, R. 2002, "Examining out-of-
pocket expenditure on health care in Nouna, Burkina Faso: implications for health
policy", Tropical medicine & international health : TM & IH, vol. 7, no. 2, pp. 187-196.
O'Donnell, O. 2008, "Who Pays for Health Care in Asia?", Journal of health economics,
vol. 27, no. 2, pp. 460-475.
Pannarunothai, S. & Mills, A. 1997, "The poor pay more: health-related inequality in
Thailand", Social science & medicine (1982), vol. 44, no. 12, pp. 1781-1790.
Perkins, M., Brazier, E., Themmen, E., Bassane, B., Diallo, D., Mutunga, A.,
Mwakajonga, T. & Ngobola, O. 2009, "Out-of-pocket costs for facility-based maternity
care in three African countries", Health policy and planning, vol. 24, no. 4, pp. 289-300.
Rasell, E., Bernstein, J. & Tang, K. 1994, "The impact of health care financing on family
budgets", International journal of health services : planning, administration, evaluation,
vol. 24, no. 4, pp. 691-714.
Stoddard, J.J. & Gray, B. 1997, "Maternal smoking and medical expenditures for
childhood respiratory illness", American Journal of Public Health, vol. 87, no. 2, pp.
205-209.
Tobin, J. 1958, "Estimation of Relationships for Limited Dependent Variables.",
Econometrica, vol. 26, no. 1, pp. 24-36.
van der Geest, S., Macwan'gi, M., Kamwanga, J., Mulikelela, D., Mazimba, A. &
Mwangelwa, M. 2000, "User fees and drugs: what did the health reforms in Zambia
achieve?", Health policy and planning, vol. 15, no. 1, pp. 59-65.
Xu, K., Evans, D.B., Kawabata, K., Zeramdini, R., Klavus, J. & Murray, C.J. 2003,
"Household catastrophic health expenditure: a multicountry analysis", Lancet, vol. 362,
no. 9378, pp. 111-117.
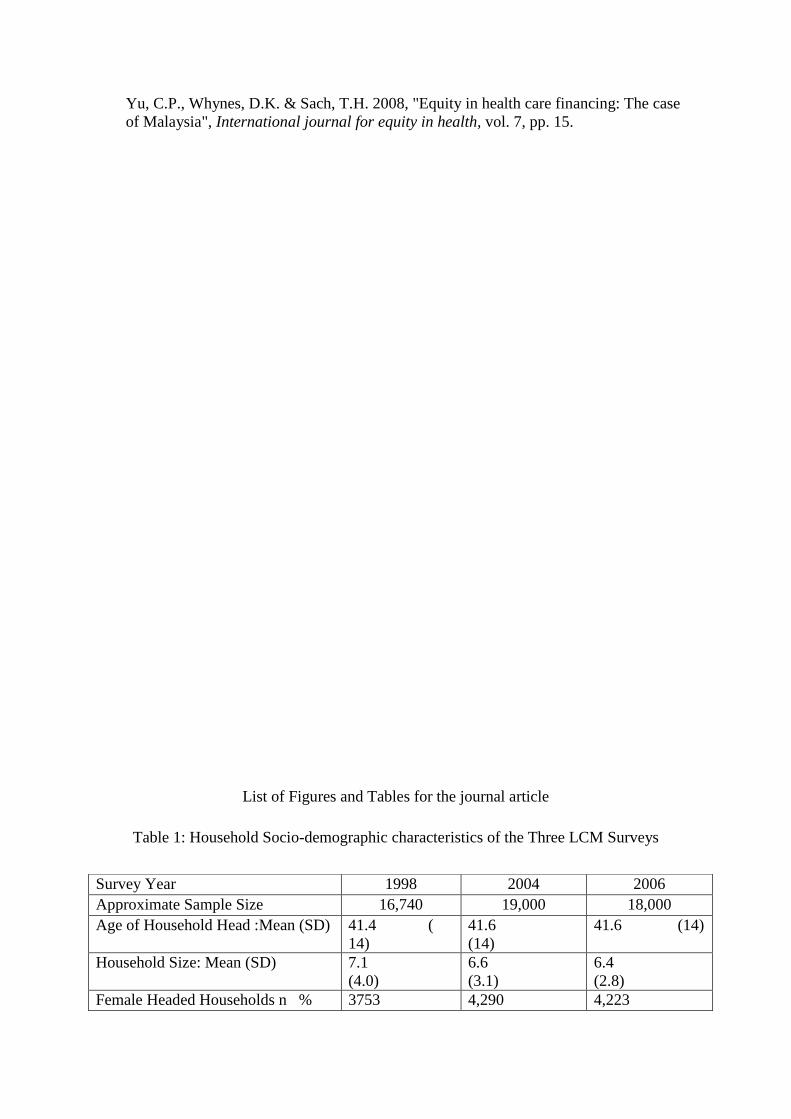
Yu, C.P., Whynes, D.K. & Sach, T.H. 2008, "Equity in health care financing: The case
of Malaysia", International journal for equity in health, vol. 7, pp. 15.
List of Figures and Tables for the journal article
Table 1: Household Socio-demographic characteristics of the Three LCM Surveys
Survey Year 1998 2004 2006
Approximate Sample Size 16,740 19,000 18,000
Age of Household Head :Mean (SD) 41.4 (
14)
41.6
(14)
41.6 (14)
Household Size: Mean (SD) 7.1
(4.0)
6.6
(3.1)
6.4
(2.8)
Female Headed Households n % 3753 4,290 4,223

Table 2 Proportion of Households Reporting Illness, paying OOP and Average OOP paid in
the last 2 weeks by Socio-economic status
% Reporting
illness/injury
% Reporting
Paying OOP
Mean paid
OOP(Kwacha)
199
8
200
4
2006 199
8
2004 200
6
1998 2004 2006
Socio-economic Status
Quintile 1 19 19 22 11 15 13 445 3860 1078
Quintile 2 22 19 20 18 18 20 1165 3959 2989
Quintile 3 20 21 20 21 21 20 2475 4859 4568
Quintile 4 20 21 20 25 22 23 4671 9402 7693
Quintile 5 20 20 18 25 23 24 1235
5
27287 2679
8
Total 100 100 100 100 100 100 4219 9873 8623
Table 3: Variables used in regression analysis
Variable Variable definition and description
Dependent variable
oop
Out of pocket payments (in logistic regression oop =1 if a
household paid OOP; 0 = if not) (in tobit regression oop is a
continuous variable and left censored at 0)
Independent variables
hh_size
Number of persons in a household
Location
Location of household (1=Rural; 0= Urban )
age_hh
Age of household head in years
sex_hh
Sex of household head (1=Male; 0= Female)
ms_hh
Marital status of household head (1=Married; 0= Not married)
22.5 22.1 22.7
Married Household Head n % 12,097
72.4
14,001
72.5
13,275
71.5
Years of Education of Head: Mean
(SD)
8.0
(3.3)
8.1
(3.4)
8.2
(3.4)
Working Household Heads n % 8,125
49.0
10,497
54.8
8,829
47.5
Rural Households n % 8,452
51.0
10,402
53.8
9,122
49.0

Work_hhead
Work status of household head (1= working; 0=Not working)
educ_hh
Maximum number of education of household head
expenditure
Household socio-economic status measured by household
expenditure. Quantiles are in ascending order i.e. the first quantile
also represents the sub-population with the lowest household
expenditure.
Table 4: Mean OOP payments per adult equivalents by household characteristics in Zambian
Kwacha
Household Characteristics 1998
2004
2006
Location of household
Rural 755 1, 842 1, 762
Urban 2, 321 6, 173 5, 763
Marital status of household head
Married 1, 330 3, 582 3, 172
Not married 1, 261 3, 405 3, 136
Sex of household Head
Male 1, 403 3, 617 3, 269
Female 1, 005 3, 233 2, 794
Age of household head
<25 837 1, 796 1, 680
24-35 1, 364 3, 289 3, 082
34-45 1, 464 3, 732 3, 405
44-55 1, 211 4, 180 3, 281
54-65 1, 335 4, 778 3, 074
>64 1, 244 2, 397 3, 624
Occupation of household Head
Working/business 2, 091 5, 450 5, 155
Not working 785 2, 086 1, 958
Education of household Head
Primary 880 2, 079 1, 982
Secondary 1, 809 4, 123 3, 620
Higher 3, 499 11, 963 10, 259
Household expenditure quintiles
Quintile 1 156 1, 393 383
Quintile 2 411 1, 272 964
Quintile 3 794 1, 647 1, 597
Quintile 4 1, 467 3, 287 2, 704
Quintile 5 4, 170 9, 727 9, 915
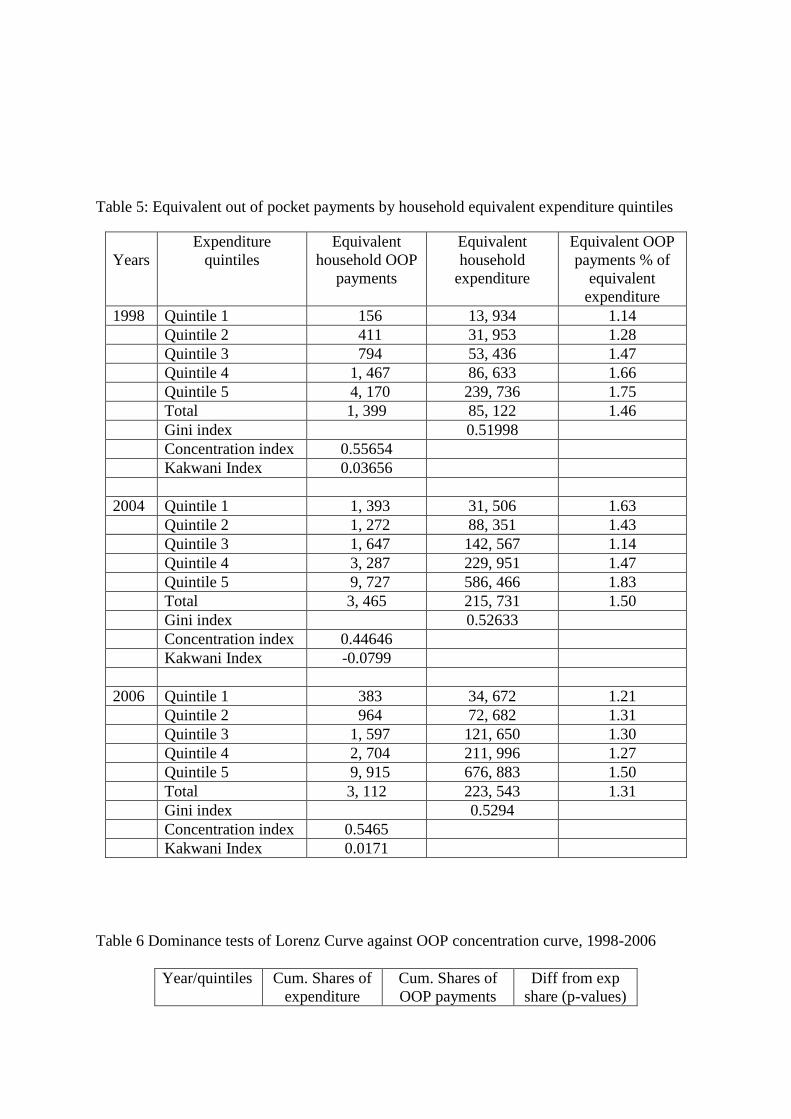
Table 5: Equivalent out of pocket payments by household equivalent expenditure quintiles
Years
Expenditure
quintiles
Equivalent
household OOP
payments
Equivalent
household
expenditure
Equivalent OOP
payments % of
equivalent
expenditure
1998
Quintile 1 156 13, 934 1.14
Quintile 2 411 31, 953 1.28
Quintile 3 794 53, 436 1.47
Quintile 4 1, 467 86, 633 1.66
Quintile 5 4, 170 239, 736 1.75
Total 1, 399 85, 122 1.46
Gini index 0.51998
Concentration index 0.55654
Kakwani Index 0.03656
2004
Quintile 1 1, 393 31, 506 1.63
Quintile 2 1, 272 88, 351 1.43
Quintile 3 1, 647 142, 567 1.14
Quintile 4 3, 287 229, 951 1.47
Quintile 5 9, 727 586, 466 1.83
Total 3, 465 215, 731 1.50
Gini index 0.52633
Concentration index 0.44646
Kakwani Index -0.0799
2006
Quintile 1 383 34, 672 1.21
Quintile 2 964 72, 682 1.31
Quintile 3 1, 597 121, 650 1.30
Quintile 4 2, 704 211, 996 1.27
Quintile 5 9, 915 676, 883 1.50
Total 3, 112 223, 543 1.31
Gini index 0.5294
Concentration index 0.5465
Kakwani Index 0.0171
Table 6 Dominance tests of Lorenz Curve against OOP concentration curve, 1998-2006
Year/quintiles Cum. Shares of
expenditure
Cum. Shares of
OOP payments
Diff from exp
share (p-values)

1998
q20 3.28% 2.24% 0.000
q40 10.82% 8.15% 0.000
q60 23.40% 19.85% 0.000
q80 43.72% 40.43% 0.000
2004
q20 2.92% 8.03% 0.000
q40 11.10% 15.38% 0.000
q60 24.31% 24.89% 0.4601
q80 45.63% 43.56% 0.1749
2006
q20 3.10% 2.46% 0.0000
q40 9.60% 8.66% 0.0033
q60 20.49% 18.92% 0.0083
q80 39.46% 36.30% 0.0022
Table 7: Logistic and Tobit Regression for the determinants and size of OOP
payments1
Variables
Odds of spending OOP/Size of OOP
1998 2004 2006
hhsize
1.07***
1543***
1.08***
4602***
1.08***
6133***
location_hhold
0.96
-1613
0.98
-4440
0.87***
-4668
age_hhead
0.94***
-2
0.96***
415
0.98
1894
sex_hhead
0.80***
-3298**
0.81***
-15715***
0.82***
-16950**
marital
status_hhead
1.35***
4811***
1.35***
20134***
1.44***
32851***
education_hhead
0.98***
-47
0.90***
627
0.95***
-2274***
working_hhead
1.07
470
0.98
655
0.95
-11038**
expenditure
quintiles
1.32***
7642***
1.20***
14129***
1.32***
29228***
constant -58162*** -151248***
-
251830***
n 14 033 16 763 16 331
Prob>F
0.0000
0.0000 0.0000
***Significant at 1%
**Significant at 5%
*Significant at 10%
Dependent variable: OOP (binary for logistic regression and continuous
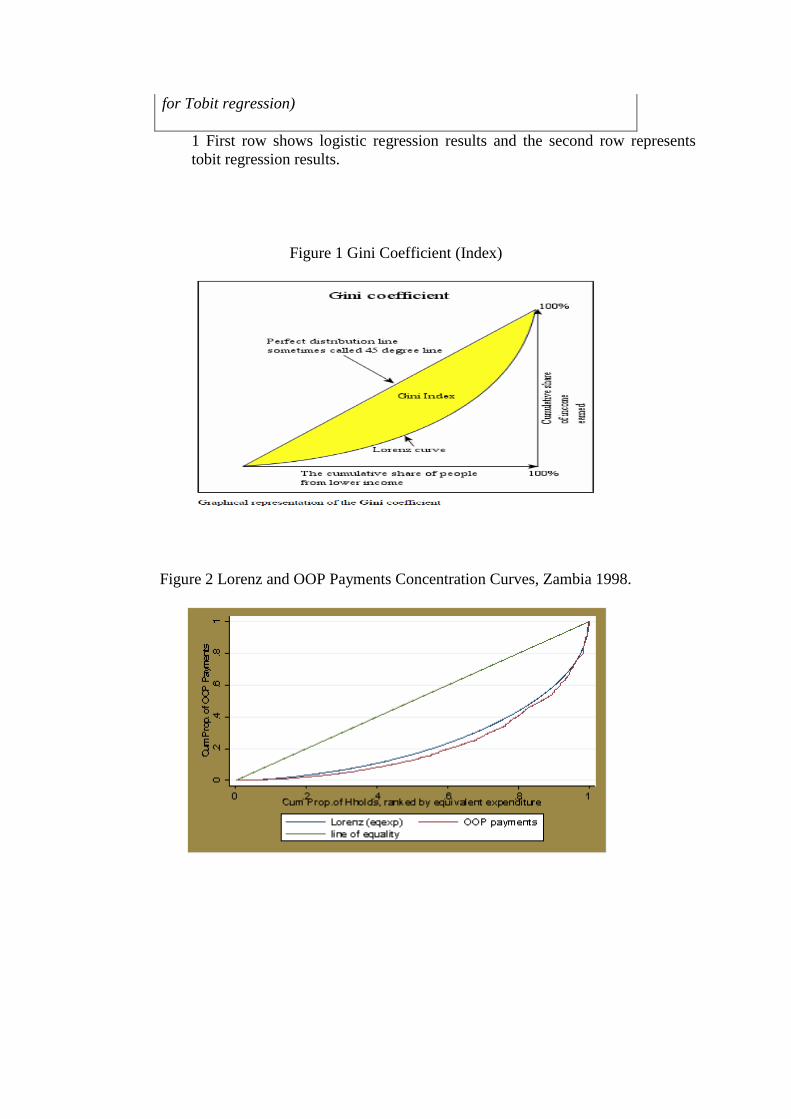
for Tobit regression)
1 First row shows logistic regression results and the second row represents
tobit regression results.
Figure 1 Gini Coefficient (Index)
Figure 2 Lorenz and OOP Payments Concentration Curves, Zambia 1998.

Figure3 Lorenz and OOP payments concentration curves, Zambia 2004
Figure 4 Lorenz and OOP payments concentration curves, Zambia 2006
Part D
Appendices
Appendix 1: Acknowledgements
I am grateful to my supervisor, John E. Ataguba for introducing me to the Tobit model, for
the help, discussions and comments rendered throughout the study and for helping me gain
confidence in the use of STATA. My data analysis skills have greatly improved. My heartfelt
appreciation also goes to Di McIntyre, the South African „Health and Wealth‟ research chair
and to the Health Economics Unit for sponsoring my programme. Di McIntyre also inspired
me to undertake a study related to health care financing which I have come to greatly enjoy. I
also wish to acknowledge all my health economics lecturers for teaching me to apply my
knowledge of economics to health care, particularly, my Economic Evaluation lecturers, Dr
Susan Clearly and Dr Edina Sinanovic for making me understand, among many other things,
that gut feeling and educated guesses are not the best in making decisions in health care;
Sheetal Shilal and Okore Okorafor, for presenting health econometrics in such a simplified
and understandable way; and Prof Lucy Gilson, for introducing me to the policy triangle and
its application in health policy processes. I also thank the other lecturers who have imparted
the knowledge that I have gained.
Furthermore, I would like to acknowledge the University of Zambia, department of
economics for furnishing me with relevant information on current issues in health care
financing in the Zambian health sector, particularly, Mr Caesar Cheelo, Dr Felix Masiye, Mr
Dale Mudenda and Prof Manenga Ndulo. I also acknowledge the occasional guidance that I
have personally received from my first year undergraduate economics lecturer, Mr Mulenga
Wake. His help has been instrumental to the direction of my career. Similarly, I acknowledge
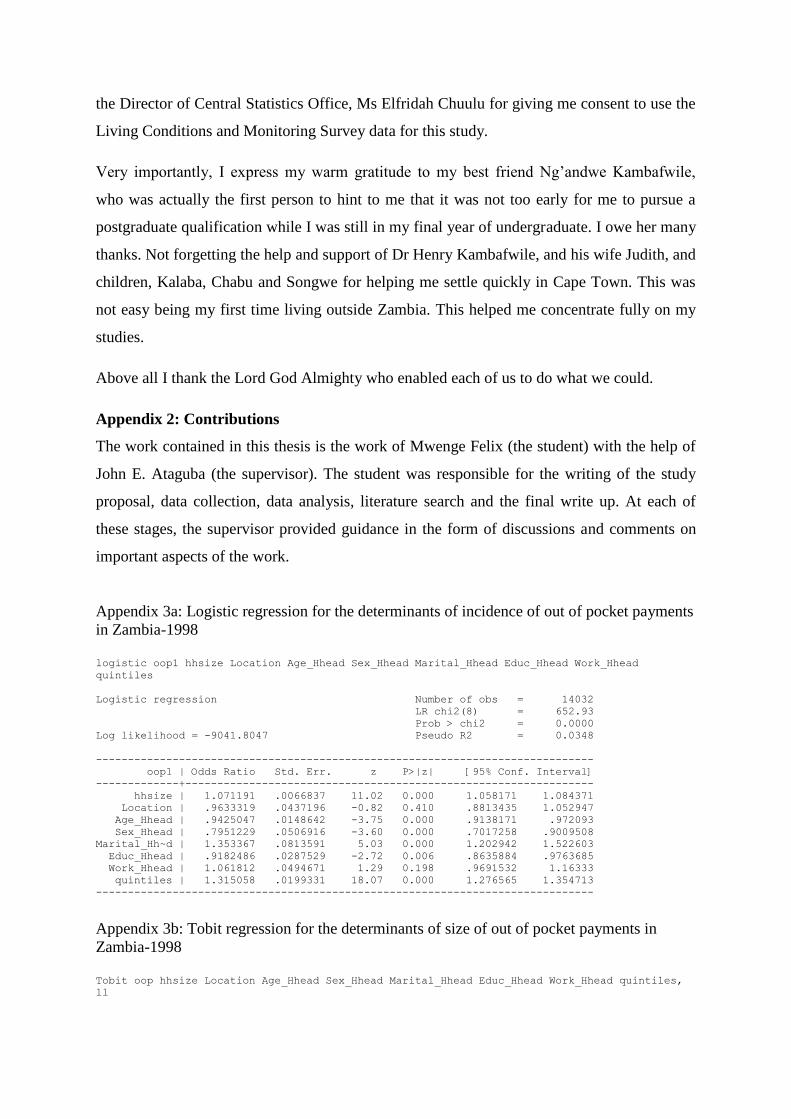
the Director of Central Statistics Office, Ms Elfridah Chuulu for giving me consent to use the
Living Conditions and Monitoring Survey data for this study.
Very importantly, I express my warm gratitude to my best friend Ng‟andwe Kambafwile,
who was actually the first person to hint to me that it was not too early for me to pursue a
postgraduate qualification while I was still in my final year of undergraduate. I owe her many
thanks. Not forgetting the help and support of Dr Henry Kambafwile, and his wife Judith, and
children, Kalaba, Chabu and Songwe for helping me settle quickly in Cape Town. This was
not easy being my first time living outside Zambia. This helped me concentrate fully on my
studies.
Above all I thank the Lord God Almighty who enabled each of us to do what we could.
Appendix 2: Contributions
The work contained in this thesis is the work of Mwenge Felix (the student) with the help of
John E. Ataguba (the supervisor). The student was responsible for the writing of the study
proposal, data collection, data analysis, literature search and the final write up. At each of
these stages, the supervisor provided guidance in the form of discussions and comments on
important aspects of the work.
Appendix 3a: Logistic regression for the determinants of incidence of out of pocket payments
in Zambia-1998
logistic oop1 hhsize Location Age_Hhead Sex_Hhead Marital_Hhead Educ_Hhead Work_Hhead
quintiles
Logistic regression Number of obs = 14032
LR chi2(8) = 652.93
Prob > chi2 = 0.0000
Log likelihood = -9041.8047 Pseudo R2 = 0.0348
------------------------------------------------------------------------------
oop1 | Odds Ratio Std. Err. z P>|z| [95% Conf. Interval]
-------------+----------------------------------------------------------------
hhsize | 1.071191 .0066837 11.02 0.000 1.058171 1.084371
Location | .9633319 .0437196 -0.82 0.410 .8813435 1.052947
Age_Hhead | .9425047 .0148642 -3.75 0.000 .9138171 .972093
Sex_Hhead | .7951229 .0506916 -3.60 0.000 .7017258 .9009508
Marital_Hh~d | 1.353367 .0813591 5.03 0.000 1.202942 1.522603
Educ_Hhead | .9182486 .0287529 -2.72 0.006 .8635884 .9763685
Work_Hhead | 1.061812 .0494671 1.29 0.198 .9691532 1.16333
quintiles | 1.315058 .0199331 18.07 0.000 1.276565 1.354713
------------------------------------------------------------------------------
Appendix 3b: Tobit regression for the determinants of size of out of pocket payments in
Zambia-1998
Tobit oop hhsize Location Age_Hhead Sex_Hhead Marital_Hhead Educ_Hhead Work_Hhead quintiles,
ll
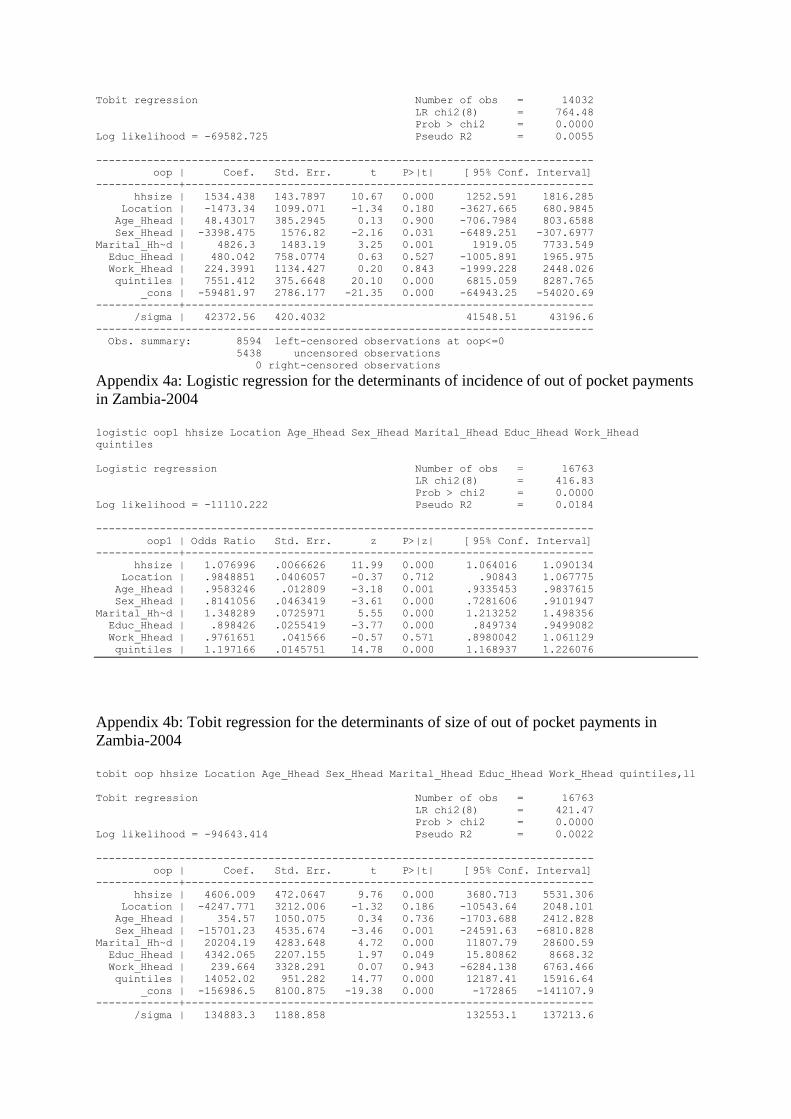
Tobit regression Number of obs = 14032
LR chi2(8) = 764.48
Prob > chi2 = 0.0000
Log likelihood = -69582.725 Pseudo R2 = 0.0055
------------------------------------------------------------------------------
oop | Coef. Std. Err. t P>|t| [95% Conf. Interval]
-------------+----------------------------------------------------------------
hhsize | 1534.438 143.7897 10.67 0.000 1252.591 1816.285
Location | -1473.34 1099.071 -1.34 0.180 -3627.665 680.9845
Age_Hhead | 48.43017 385.2945 0.13 0.900 -706.7984 803.6588
Sex_Hhead | -3398.475 1576.82 -2.16 0.031 -6489.251 -307.6977
Marital_Hh~d | 4826.3 1483.19 3.25 0.001 1919.05 7733.549
Educ_Hhead | 480.042 758.0774 0.63 0.527 -1005.891 1965.975
Work_Hhead | 224.3991 1134.427 0.20 0.843 -1999.228 2448.026
quintiles | 7551.412 375.6648 20.10 0.000 6815.059 8287.765
_cons | -59481.97 2786.177 -21.35 0.000 -64943.25 -54020.69
-------------+----------------------------------------------------------------
/sigma | 42372.56 420.4032 41548.51 43196.6
------------------------------------------------------------------------------
Obs. summary: 8594 left-censored observations at oop<=0
5438 uncensored observations
0 right-censored observations
Appendix 4a: Logistic regression for the determinants of incidence of out of pocket payments
in Zambia-2004
logistic oop1 hhsize Location Age_Hhead Sex_Hhead Marital_Hhead Educ_Hhead Work_Hhead
quintiles
Logistic regression Number of obs = 16763
LR chi2(8) = 416.83
Prob > chi2 = 0.0000
Log likelihood = -11110.222 Pseudo R2 = 0.0184
------------------------------------------------------------------------------
oop1 | Odds Ratio Std. Err. z P>|z| [95% Conf. Interval]
-------------+----------------------------------------------------------------
hhsize | 1.076996 .0066626 11.99 0.000 1.064016 1.090134
Location | .9848851 .0406057 -0.37 0.712 .90843 1.067775
Age_Hhead | .9583246 .012809 -3.18 0.001 .9335453 .9837615
Sex_Hhead | .8141056 .0463419 -3.61 0.000 .7281606 .9101947
Marital_Hh~d | 1.348289 .0725971 5.55 0.000 1.213252 1.498356
Educ_Hhead | .898426 .0255419 -3.77 0.000 .849734 .9499082
Work_Hhead | .9761651 .041566 -0.57 0.571 .8980042 1.061129
quintiles | 1.197166 .0145751 14.78 0.000 1.168937 1.226076
Appendix 4b: Tobit regression for the determinants of size of out of pocket payments in
Zambia-2004
tobit oop hhsize Location Age_Hhead Sex_Hhead Marital_Hhead Educ_Hhead Work_Hhead quintiles,ll
Tobit regression Number of obs = 16763
LR chi2(8) = 421.47
Prob > chi2 = 0.0000
Log likelihood = -94643.414 Pseudo R2 = 0.0022
------------------------------------------------------------------------------
oop | Coef. Std. Err. t P>|t| [95% Conf. Interval]
-------------+----------------------------------------------------------------
hhsize | 4606.009 472.0647 9.76 0.000 3680.713 5531.306
Location | -4247.771 3212.006 -1.32 0.186 -10543.64 2048.101
Age_Hhead | 354.57 1050.075 0.34 0.736 -1703.688 2412.828
Sex_Hhead | -15701.23 4535.674 -3.46 0.001 -24591.63 -6810.828
Marital_Hh~d | 20204.19 4283.648 4.72 0.000 11807.79 28600.59
Educ_Hhead | 4342.065 2207.155 1.97 0.049 15.80862 8668.32
Work_Hhead | 239.664 3328.291 0.07 0.943 -6284.138 6763.466
quintiles | 14052.02 951.282 14.77 0.000 12187.41 15916.64
_cons | -156986.5 8100.875 -19.38 0.000 -172865 -141107.9
-------------+----------------------------------------------------------------
/sigma | 134883.3 1188.858 132553.1 137213.6
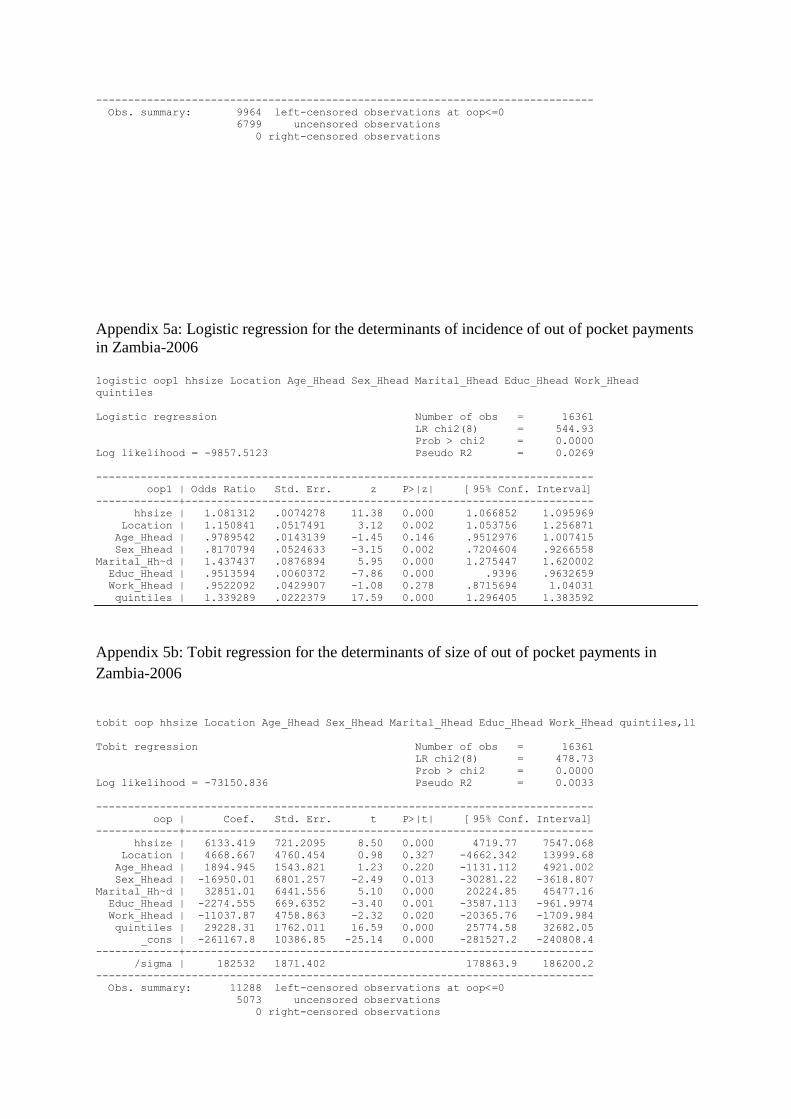
------------------------------------------------------------------------------
Obs. summary: 9964 left-censored observations at oop<=0
6799 uncensored observations
0 right-censored observations
Appendix 5a: Logistic regression for the determinants of incidence of out of pocket payments
in Zambia-2006
logistic oop1 hhsize Location Age_Hhead Sex_Hhead Marital_Hhead Educ_Hhead Work_Hhead
quintiles
Logistic regression Number of obs = 16361
LR chi2(8) = 544.93
Prob > chi2 = 0.0000
Log likelihood = -9857.5123 Pseudo R2 = 0.0269
------------------------------------------------------------------------------
oop1 | Odds Ratio Std. Err. z P>|z| [95% Conf. Interval]
-------------+----------------------------------------------------------------
hhsize | 1.081312 .0074278 11.38 0.000 1.066852 1.095969
Location | 1.150841 .0517491 3.12 0.002 1.053756 1.256871
Age_Hhead | .9789542 .0143139 -1.45 0.146 .9512976 1.007415
Sex_Hhead | .8170794 .0524633 -3.15 0.002 .7204604 .9266558
Marital_Hh~d | 1.437437 .0876894 5.95 0.000 1.275447 1.620002
Educ_Hhead | .9513594 .0060372 -7.86 0.000 .9396 .9632659
Work_Hhead | .9522092 .0429907 -1.08 0.278 .8715694 1.04031
quintiles | 1.339289 .0222379 17.59 0.000 1.296405 1.383592
Appendix 5b: Tobit regression for the determinants of size of out of pocket payments in
Zambia-2006
tobit oop hhsize Location Age_Hhead Sex_Hhead Marital_Hhead Educ_Hhead Work_Hhead quintiles,ll
Tobit regression Number of obs = 16361
LR chi2(8) = 478.73
Prob > chi2 = 0.0000
Log likelihood = -73150.836 Pseudo R2 = 0.0033
------------------------------------------------------------------------------
oop | Coef. Std. Err. t P>|t| [95% Conf. Interval]
-------------+----------------------------------------------------------------
hhsize | 6133.419 721.2095 8.50 0.000 4719.77 7547.068
Location | 4668.667 4760.454 0.98 0.327 -4662.342 13999.68
Age_Hhead | 1894.945 1543.821 1.23 0.220 -1131.112 4921.002
Sex_Hhead | -16950.01 6801.257 -2.49 0.013 -30281.22 -3618.807
Marital_Hh~d | 32851.01 6441.556 5.10 0.000 20224.85 45477.16
Educ_Hhead | -2274.555 669.6352 -3.40 0.001 -3587.113 -961.9974
Work_Hhead | -11037.87 4758.863 -2.32 0.020 -20365.76 -1709.984
quintiles | 29228.31 1762.011 16.59 0.000 25774.58 32682.05
_cons | -261167.8 10386.85 -25.14 0.000 -281527.2 -240808.4
-------------+----------------------------------------------------------------
/sigma | 182532 1871.402 178863.9 186200.2
------------------------------------------------------------------------------
Obs. summary: 11288 left-censored observations at oop<=0
5073 uncensored observations
0 right-censored observations
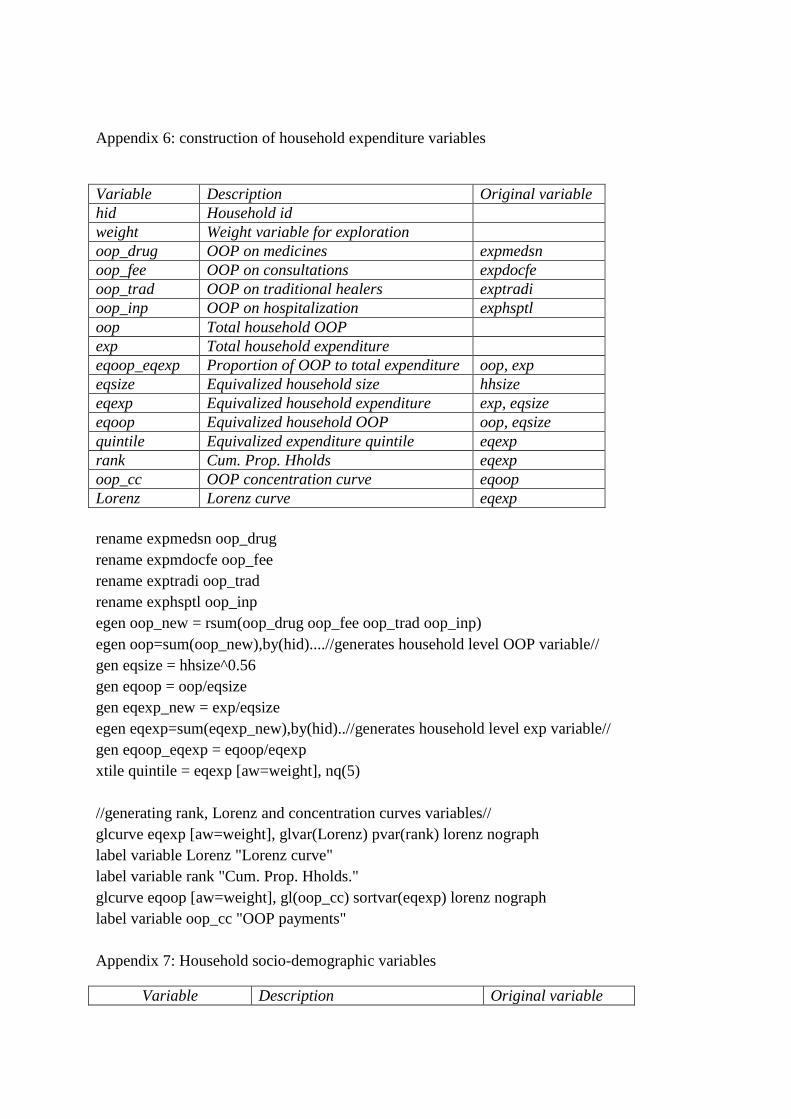
Appendix 6: construction of household expenditure variables
Variable Description Original variable
hid Household id
weight Weight variable for exploration
oop_drug OOP on medicines expmedsn
oop_fee OOP on consultations expdocfe
oop_trad OOP on traditional healers exptradi
oop_inp OOP on hospitalization exphsptl
oop Total household OOP
exp Total household expenditure
eqoop_eqexp Proportion of OOP to total expenditure oop, exp
eqsize Equivalized household size hhsize
eqexp Equivalized household expenditure exp, eqsize
eqoop Equivalized household OOP oop, eqsize
quintile Equivalized expenditure quintile eqexp
rank Cum. Prop. Hholds eqexp
oop_cc OOP concentration curve eqoop
Lorenz Lorenz curve eqexp
rename expmedsn oop_drug
rename expmdocfe oop_fee
rename exptradi oop_trad
rename exphsptl oop_inp
egen oop_new = rsum(oop_drug oop_fee oop_trad oop_inp)
egen oop=sum(oop_new),by(hid)....//generates household level OOP variable//
gen eqsize = hhsize^0.56
gen eqoop = oop/eqsize
gen eqexp_new = exp/eqsize
egen eqexp=sum(eqexp_new),by(hid)..//generates household level exp variable//
gen eqoop_eqexp = eqoop/eqexp
xtile quintile = eqexp [aw=weight], nq(5)
//generating rank, Lorenz and concentration curves variables//
glcurve eqexp [aw=weight], glvar(Lorenz) pvar(rank) lorenz nograph
label variable Lorenz "Lorenz curve"
label variable rank "Cum. Prop. Hholds."
glcurve eqoop [aw=weight], gl(oop_cc) sortvar(eqexp) lorenz nograph
label variable oop_cc "OOP payments"
Appendix 7: Household socio-demographic variables
Variable Description Original variable
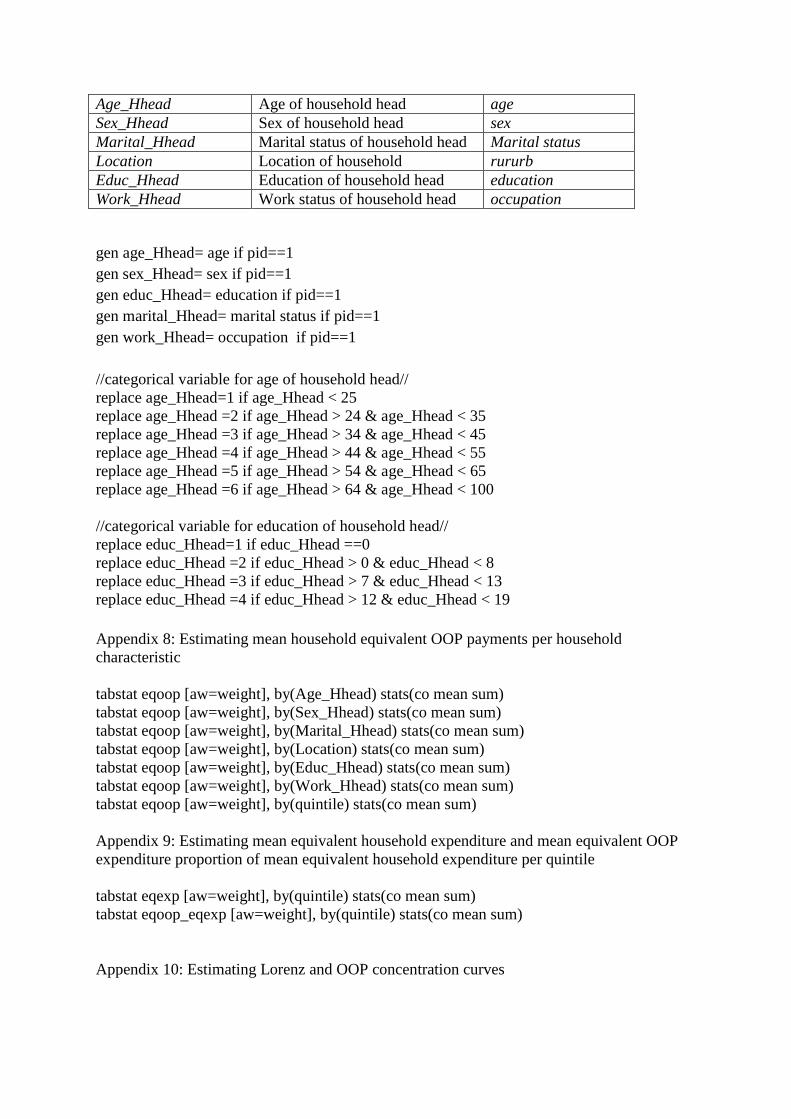
Age_Hhead Age of household head age
Sex_Hhead Sex of household head sex
Marital_Hhead Marital status of household head Marital status
Location Location of household rururb
Educ_Hhead Education of household head education
Work_Hhead Work status of household head occupation
gen age_Hhead= age if pid==1
gen sex_Hhead= sex if pid==1
gen educ_Hhead= education if pid==1
gen marital_Hhead= marital status if pid==1
gen work_Hhead= occupation if pid==1
//categorical variable for age of household head//
replace age_Hhead=1 if age_Hhead < 25
replace age_Hhead =2 if age_Hhead > 24 & age_Hhead < 35
replace age_Hhead =3 if age_Hhead > 34 & age_Hhead < 45
replace age_Hhead =4 if age_Hhead > 44 & age_Hhead < 55
replace age_Hhead =5 if age_Hhead > 54 & age_Hhead < 65
replace age_Hhead =6 if age_Hhead > 64 & age_Hhead < 100
//categorical variable for education of household head//
replace educ_Hhead=1 if educ_Hhead ==0
replace educ_Hhead =2 if educ_Hhead > 0 & educ_Hhead < 8
replace educ_Hhead =3 if educ_Hhead > 7 & educ_Hhead < 13
replace educ_Hhead =4 if educ_Hhead > 12 & educ_Hhead < 19
Appendix 8: Estimating mean household equivalent OOP payments per household
characteristic
tabstat eqoop [aw=weight], by(Age_Hhead) stats(co mean sum)
tabstat eqoop [aw=weight], by(Sex_Hhead) stats(co mean sum)
tabstat eqoop [aw=weight], by(Marital_Hhead) stats(co mean sum)
tabstat eqoop [aw=weight], by(Location) stats(co mean sum)
tabstat eqoop [aw=weight], by(Educ_Hhead) stats(co mean sum)
tabstat eqoop [aw=weight], by(Work_Hhead) stats(co mean sum)
tabstat eqoop [aw=weight], by(quintile) stats(co mean sum)
Appendix 9: Estimating mean equivalent household expenditure and mean equivalent OOP
expenditure proportion of mean equivalent household expenditure per quintile
tabstat eqexp [aw=weight], by(quintile) stats(co mean sum)
tabstat eqoop_eqexp [aw=weight], by(quintile) stats(co mean sum)
Appendix 10: Estimating Lorenz and OOP concentration curves
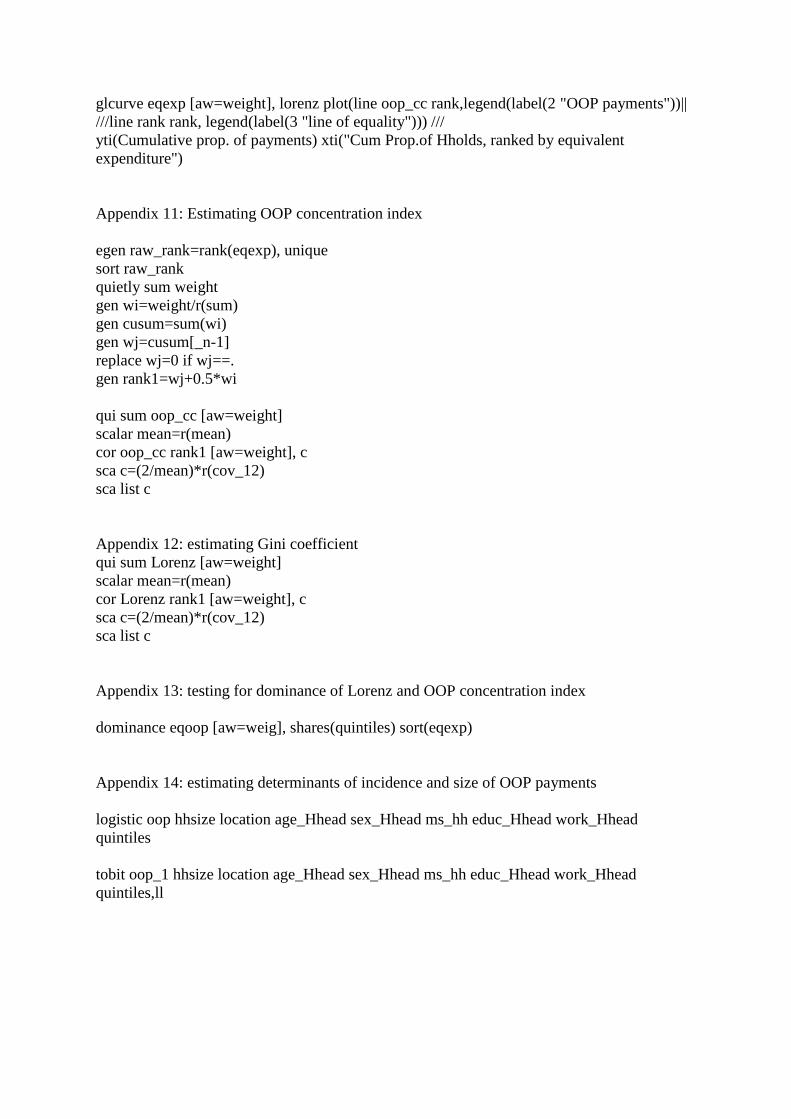
glcurve eqexp [aw=weight], lorenz plot(line oop_cc rank,legend(label(2 "OOP payments"))||
///line rank rank, legend(label(3 "line of equality"))) ///
yti(Cumulative prop. of payments) xti("Cum Prop.of Hholds, ranked by equivalent
expenditure")
Appendix 11: Estimating OOP concentration index
egen raw_rank=rank(eqexp), unique
sort raw_rank
quietly sum weight
gen wi=weight/r(sum)
gen cusum=sum(wi)
gen wj=cusum[_n-1]
replace wj=0 if wj==.
gen rank1=wj+0.5*wi
qui sum oop_cc [aw=weight]
scalar mean=r(mean)
cor oop_cc rank1 [aw=weight], c
sca c=(2/mean)*r(cov_12)
sca list c
Appendix 12: estimating Gini coefficient
qui sum Lorenz [aw=weight]
scalar mean=r(mean)
cor Lorenz rank1 [aw=weight], c
sca c=(2/mean)*r(cov_12)
sca list c
Appendix 13: testing for dominance of Lorenz and OOP concentration index
dominance eqoop [aw=weig], shares(quintiles) sort(eqexp)
Appendix 14: estimating determinants of incidence and size of OOP payments
logistic oop hhsize location age_Hhead sex_Hhead ms_hh educ_Hhead work_Hhead
quintiles
tobit oop_1 hhsize location age_Hhead sex_Hhead ms_hh educ_Hhead work_Hhead
quintiles,ll
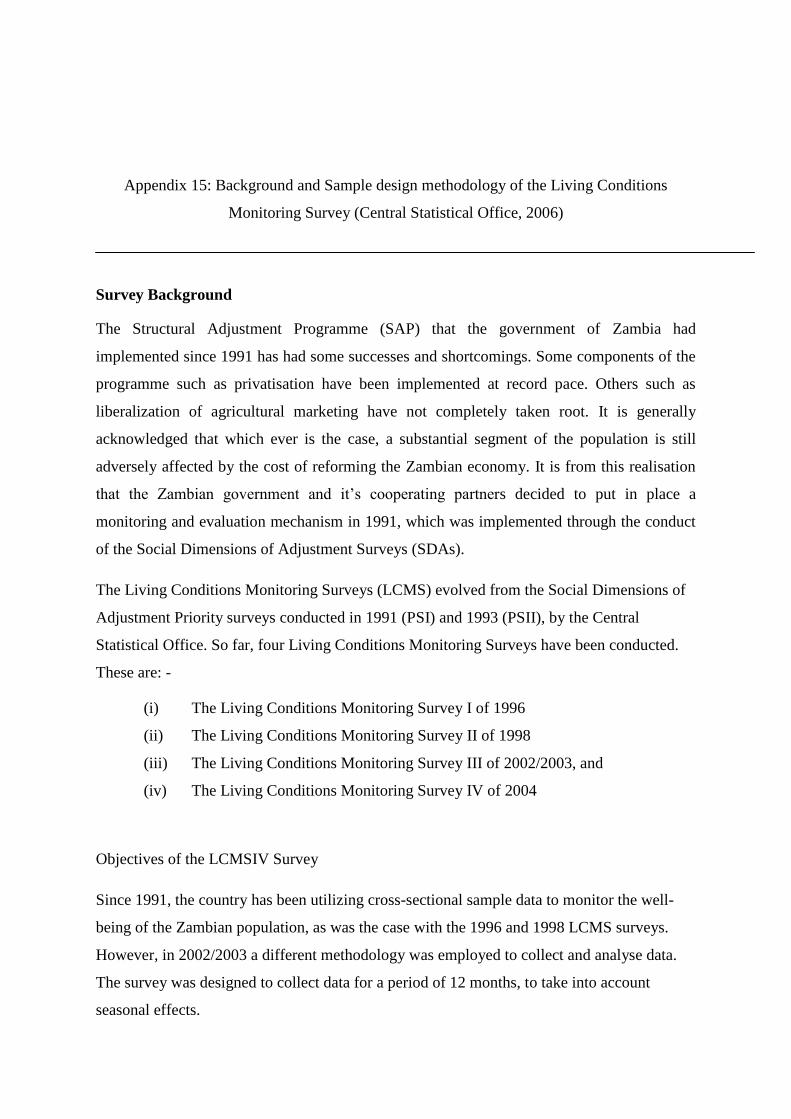
Appendix 15: Background and Sample design methodology of the Living Conditions
Monitoring Survey (Central Statistical Office, 2006)
Survey Background
The Structural Adjustment Programme (SAP) that the government of Zambia had
implemented since 1991 has had some successes and shortcomings. Some components of the
programme such as privatisation have been implemented at record pace. Others such as
liberalization of agricultural marketing have not completely taken root. It is generally
acknowledged that which ever is the case, a substantial segment of the population is still
adversely affected by the cost of reforming the Zambian economy. It is from this realisation
that the Zambian government and it‟s cooperating partners decided to put in place a
monitoring and evaluation mechanism in 1991, which was implemented through the conduct
of the Social Dimensions of Adjustment Surveys (SDAs).
The Living Conditions Monitoring Surveys (LCMS) evolved from the Social Dimensions of
Adjustment Priority surveys conducted in 1991 (PSI) and 1993 (PSII), by the Central
Statistical Office. So far, four Living Conditions Monitoring Surveys have been conducted.
These are: -
(i) The Living Conditions Monitoring Survey I of 1996
(ii) The Living Conditions Monitoring Survey II of 1998
(iii) The Living Conditions Monitoring Survey III of 2002/2003, and
(iv) The Living Conditions Monitoring Survey IV of 2004
Objectives of the LCMSIV Survey
Since 1991, the country has been utilizing cross-sectional sample data to monitor the well-
being of the Zambian population, as was the case with the 1996 and 1998 LCMS surveys.
However, in 2002/2003 a different methodology was employed to collect and analyse data.
The survey was designed to collect data for a period of 12 months, to take into account
seasonal effects.
The Living Conditions Monitoring Survey IV (LCMSIV) was intended to highlight and
monitor the living conditions of the Zambian society. The survey included a set of priority
indicators on poverty and living conditions that could easily be compared to previous surveys
such as the 1998 LCMS(II)
The main objective of the Living Conditions Monitoring Survey IV (LCMSIV) is to provide
the basis for comparison of poverty estimates derived from cross-sectional survey data. In
addition, the survey provides a basis on which to: -
Monitor the impact of government policies and donor support on the well being of the
Zambian population.
Monitor poverty and its distribution in Zambia.
Provide various users with a set of reliable indicators against which to monitor
development.
Identify vulnerable groups in society and enhance targeting in policy implementation.
For the purpose of computing indicators to meet the stated objectives, the LCMSIV
questionnaire included the following topics:-
Demography and migration
Household Amenities and Housing Conditions
Orphan hood
Health
Education
Economic Activities
Income
Household Assets
Household Access to facilities
Self-assessed poverty and household coping strategies, and
Agricultural production
Sample Design and Coverage
The Living Conditions Monitoring Survey IV had a nationwide coverage on a sample basis.
It covered both rural and urban areas in all the nine provinces. The survey was designed to
provide data for each and every district in Zambia. A sample size of about 1048 SEAs and
approximately 20,000 households was drawn.
Sample Stratification and Allocation
The sampling frame used for LCMSIV survey was developed from the 2000 Census of
Population and Housing. The country is administratively demarcated into 9 provinces, which
are further divided into 72 districts. The districts are further subdivided into 155
constituencies, which are also divided into wards. Wards consists of Census Supervisory
Areas (CSA), which are further subdivided into Standard Enumeration areas (SEAs). For the
purposes of this survey, SEAs constituted the ultimate Primary Sampling Units (PSUs).
In order to have equal precision in the estimates in all the districts and at the same time take
into account variation in the sizes of the district, the survey adopted the Square Root sample
allocation method, (Lesli Kish, 1987). This approach offers a better compromise between
equal and proportional allocation methods in terms of reliability of both combined and
separate estimates. The allocation of the sample points (PSUs) to rural and urban strata was
almost proportional.
Sample Selection
The LCMSIV survey employed a two-stage stratified cluster sample design whereby during
the first stage, 1048 SEAs were selected with Probability Proportional to Estimated Size
(PPES). The size measure was taken from the frame developed from the 2000 Census of
Population and Housing. During the second stage, households were systematically selected
from an enumeration area listing. The survey was designed to provide reliable estimates at
district, provincial, rural/urban and national levels.
Selection of Standard Enumeration Areas (SEAs)
The SEAs in each stratum were selected as follows:
(i) Calculating the sampling interval (I) of the stratum.

I = a
iiM
Where:
i
iM = is the total stratum size
a = is the number of SEAs allocated to the stratum
(ii) Calculate the cumulated size of the cluster (SEA)
(i) Calculate the sampling numbers R, R+I, R+2I,…….,R+(A-1)I, where R is the
random start number between 1 and I.
(iv) Comparing each sampling number with the cumulated sizes
The first SEA with a cumulated size that was greater or equal to the random number was
selected. The subsequent selection of SEAs was achieved by comparing the sampling
numbers to the cumulated sizes of SEAs.
Selection of Households
The LCMSIV survey commenced by listing all the households in the selected SEAs. In the
case of rural SEAs, households were stratified and listed according to their agricultural
activity status. Therefore, there were four explicit strata created in each rural SEA namely,
the Small Scale Stratum (SSS), the Medium Scale Stratum (MSS), the Large Scale Stratum
(LSS) and the Non-agricultural Stratum (NAS). For the purposes of the LCMSIV survey,
about 7, 5 and 3 households were supposed to be selected from the SSS, MSS and NAS,
respectively. The large scale households were selected on a 100 percent basis. The urban
SEAs were implicitly stratified into low cost, medium cost and high cost areas according to
CSO‟s and local authority classification of residential areas.

About 15 and 25 households were sampled from rural and urban SEAs, respectively.
However, the number of rural households selected in some cases exceeded the desired sample
size of 15 households depending on the availability of large scale farming households.
The selection of households from various strata was preceded by assigning fully responding
households sampling serial numbers. The circular systematic sampling method was used to
select households. The method assumes that households are arranged in a circle (G. Kalton,
1983) and the following relationship applies:
Let N = nk,
Where:
N = Total number of households assigned sampling serial numbers in a stratum
n = Total desired sample size to be drawn from a stratum in an SEA
k = The sampling interval in a given SEA calculated as k=N/n.
Data Collection
Data collection was done by way of personal interviews using a structured questionnaire. The
questionnaire was designed to collect information on the various aspects of the living
conditions of the households.
Estimation Procedure
Sample weights
Due to the disproportionate allocation of the sample points to various strata, sampling
weights are required to correct for differential representation of the sample at national and
sub-national levels. The weights of the sample are in this case equal to the inverse of the
product of the two selection probabilities employed.

Therefore, the probability of selecting an SEA was calculated as follows:
ihi
hih
hi
MMa
P1
Where:
Phi
1= the first selection probability of SEAs
ah= The number of SEAs selected in stratum h
M hi= The size (in terms of the population count) of the ith SEA in stratum h
ihiM = The total size of the stratum h
The selection probability of the household was calculated as follows:
Nn
Phi
hi
hi
2
Where:
Phi
2= the second selection probability of households
nhi= the number of households selected from the i
th SEA of h stratum
N hi = Total number of households listed in a SEA
Therefore, the SEA specific sample weight was calculated as follows:
PPW
hihi
ix
21
1
Wi is called the PPS sample weight. In the case of rural SEAs which have more than one
stratum, the first selection probability is multiplied with separate stratum specific second

selection probabilities. Therefore, the number of weights in each rural SEA depends on the
number of strata available.
Estimation Process
In order to correct for differential representation, all estimates generated from the LCMSIV
survey data are weighted expressions. Therefore, if yhij is an observation on variable Y for the
jth
household in the ith
SEA of the hth
stratum, then the estimated total for the hth
stratum is
expressed as follows:
a nh h
i jhijhihT ywY
1 1
Where:
YhT = the estimated total for the hth
stratum
i = 1 to ah: the number of selected clusters in the stratum
j = 1 to nh: the number of sample households in the stratum
The national estimate is obtained using the following estimator:
YT = 72
1khTY
Where:
YT = the national total estimate
k = 1 to 72: the total number of strata (i.e. 72 districts).
Data Processing and Analysis
The data from the LCMSIV survey was processed and analysed using the CSPRO and the
Statistical Analysis System (SAS) softwares respectively. Data entry was done from all the
provincial offices with 100 percent verification, whilst data cleaning and analysis was
undertaken at CSO‟s headquarters.

Part E

Policy Brief
Progressivity and determinants of out-of-pocket
health financing in Zambia
By
Felix Mwenge
Executive Summary
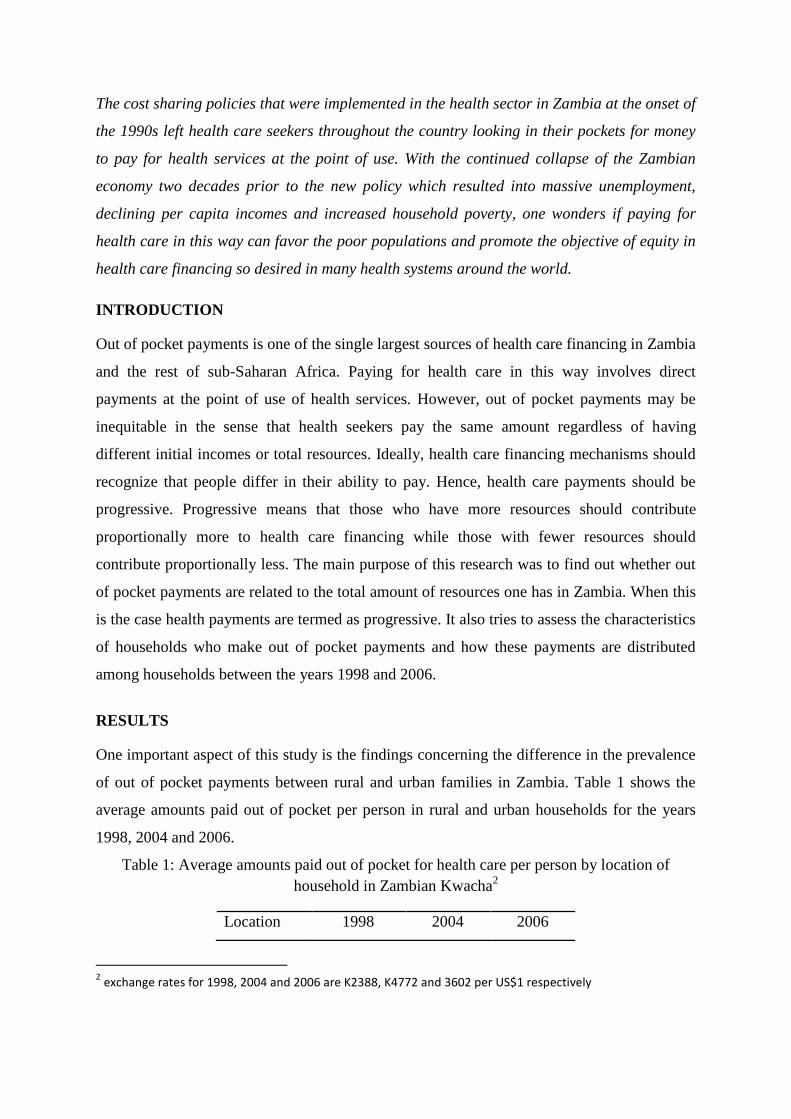
The cost sharing policies that were implemented in the health sector in Zambia at the onset of
the 1990s left health care seekers throughout the country looking in their pockets for money
to pay for health services at the point of use. With the continued collapse of the Zambian
economy two decades prior to the new policy which resulted into massive unemployment,
declining per capita incomes and increased household poverty, one wonders if paying for
health care in this way can favor the poor populations and promote the objective of equity in
health care financing so desired in many health systems around the world.
INTRODUCTION
Out of pocket payments is one of the single largest sources of health care financing in Zambia
and the rest of sub-Saharan Africa. Paying for health care in this way involves direct
payments at the point of use of health services. However, out of pocket payments may be
inequitable in the sense that health seekers pay the same amount regardless of having
different initial incomes or total resources. Ideally, health care financing mechanisms should
recognize that people differ in their ability to pay. Hence, health care payments should be
progressive. Progressive means that those who have more resources should contribute
proportionally more to health care financing while those with fewer resources should
contribute proportionally less. The main purpose of this research was to find out whether out
of pocket payments are related to the total amount of resources one has in Zambia. When this
is the case health payments are termed as progressive. It also tries to assess the characteristics
of households who make out of pocket payments and how these payments are distributed
among households between the years 1998 and 2006.
RESULTS
One important aspect of this study is the findings concerning the difference in the prevalence
of out of pocket payments between rural and urban families in Zambia. Table 1 shows the
average amounts paid out of pocket per person in rural and urban households for the years
1998, 2004 and 2006.
Table 1: Average amounts paid out of pocket for health care per person by location of
household in Zambian Kwacha2
Location 1998 2004 2006
2 exchange rates for 1998, 2004 and 2006 are K2388, K4772 and 3602 per US$1 respectively
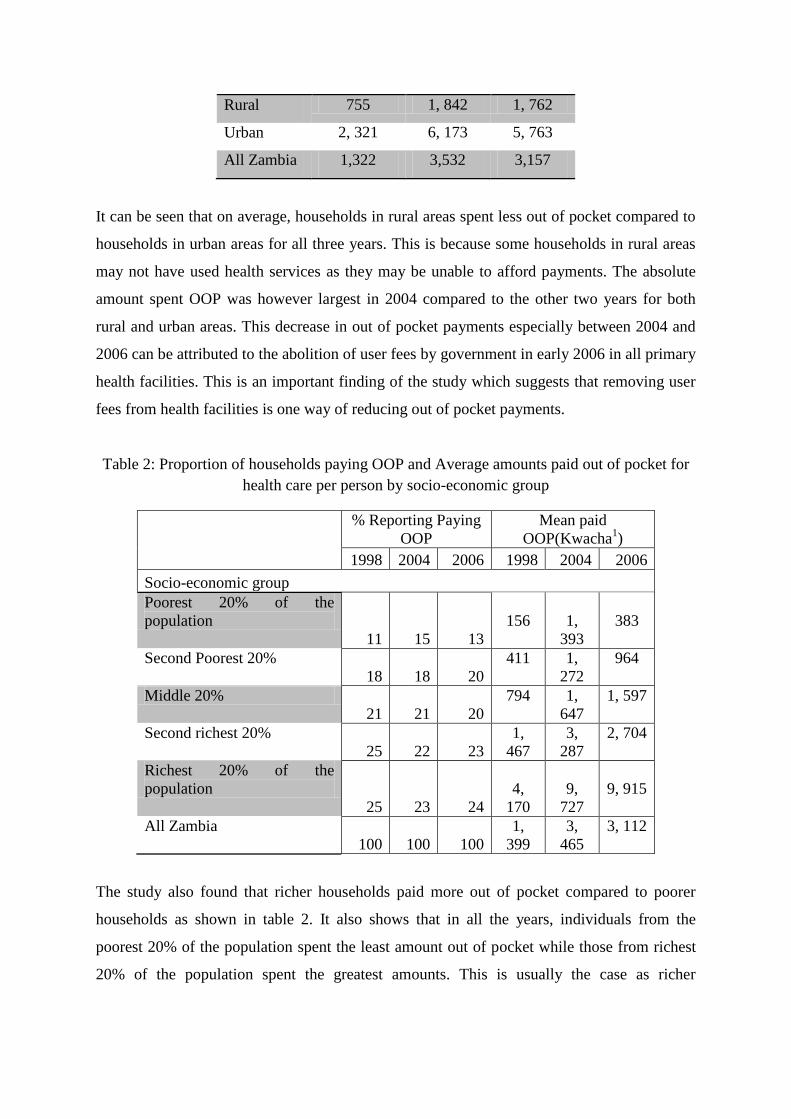
Rural 755 1, 842 1, 762
Urban 2, 321 6, 173 5, 763
All Zambia 1,322 3,532 3,157
It can be seen that on average, households in rural areas spent less out of pocket compared to
households in urban areas for all three years. This is because some households in rural areas
may not have used health services as they may be unable to afford payments. The absolute
amount spent OOP was however largest in 2004 compared to the other two years for both
rural and urban areas. This decrease in out of pocket payments especially between 2004 and
2006 can be attributed to the abolition of user fees by government in early 2006 in all primary
health facilities. This is an important finding of the study which suggests that removing user
fees from health facilities is one way of reducing out of pocket payments.
Table 2: Proportion of households paying OOP and Average amounts paid out of pocket for
health care per person by socio-economic group
% Reporting Paying
OOP
Mean paid
OOP(Kwacha1)
1998 2004 2006 1998 2004 2006
Socio-economic group
Poorest 20% of the
population
11 15 13
156
1,
393
383
Second Poorest 20%
18 18 20
411 1,
272
964
Middle 20%
21 21 20
794 1,
647
1, 597
Second richest 20%
25 22 23
1,
467
3,
287
2, 704
Richest 20% of the
population
25 23 24
4,
170
9,
727
9, 915
All Zambia
100 100 100
1,
399
3,
465
3, 112
The study also found that richer households paid more out of pocket compared to poorer
households as shown in table 2. It also shows that in all the years, individuals from the
poorest 20% of the population spent the least amount out of pocket while those from richest
20% of the population spent the greatest amounts. This is usually the case as richer

households tend to be able to afford to pay out of pocket compared to their poorer
counterparts.
Another important aspect of the findings of this study is the relationship between out of
pocket payments and total household expenditure. It is generally accepted by health
economists that higher income groups pay more of their income than lower income groups. If
health payments are distributed in this way i.e. higher-income groups contribute a larger
percentage of their income to financing health care than lower-income groups, they are said
to be progressive. If the opposite is true, that is, higher-income groups contribute a smaller
percentage of their income than lower-income groups, the system is called regressive. A good
example of progressive contributions in Zambia is „pay as you earn‟ (PAYE) which increases
with the more money an individual earns. OOP payments should ideally follow this pattern
for them to be considered equitable.
The study also identified characteristics of households or individuals in Zambia who are
likely to pay out of pocket payments. Among them is household income (i.e. ability to pay).
In other words, income or the amount of resources a person has determines whether he/she
can afford to pay out of pocket for health care. The study also found that most Zambians with
high income can afford to pay out of pocket compared with those with low income. Those
who lived in rural Zambia in 2006 were less likely to pay out of pocket than those who lived
in urban areas. This is obviously due to the abolition of user fees for primary health care in
rural areas of Zambia in 2006. Additionally, if a family is large such a household is more
likely to spend out of pocket than if the family is small. In 1998 and 2004 households headed
by older persons were less likely to incur OOP payments compared to those headed by
younger persons.
CONCLUSION
In conclusion, out of pocket payments in 1998 and 2004 were apparently related to ones total
resources in Zambia. This is desirable and is required for a health financing system to be
termed as equitable. It implies that well to do families contributed to health care based on
how much they had and the same was true for the poor regardless of how much health care
they each needed. However, this relationship only appears so because well to do families in
Zambia are the ones who made the most out of pocket payments for health care in the two

years. This is demonstrated in Table 2. Meaning that health payments could not be related to
households‟ total resources had the poor households made as much health payments as did
the rich. This happens because the majorities of the people in Zambia are poor and do not use
health services because they cannot afford to pay out of pocket. Hence the observed
relationship can be said to be so at the expense of the poor. The study also observed a
reduction in OOP payments between 2004 and 2006. This was attributed to the abolition of
user fees for rural primary health care in early 2006. At the same rural households were likely
to pay less out of pocket compared to urban households. This is mainly because it is common
in rural areas for people to self treat or seek alternative sources of care because they cannot
afford to pay at health facilities. In view of the foregoing findings, there is need to find
alternative ways of paying for care in Zambia where payments will be truly related to ones
resources whether or not the poor have participated in paying for care. It is also important
that families in Zambia are cushioned from making out of pocket payments as this may not be
related to ones resources which is unfair especially for the poor. Alternative health financing
mechanisms that guarantee access to care by all, and do not require health care users to pay at
the point of use of health services should also be introduced and promoted in Zambia. This
will reduce the total amount of money families spend out of pocket. The study also showed
that out of pocket payments reduced after abolition of user fees in primary facilities in the
rural areas in 2006. This indicates that fee removal can be an effective way of reducing out of
pocket spending for families and hence it should be recommended.