Progressive Taxation and Tax Morale · ualÕs tax morale is higher, the more progressive the tax...
30
Vol 1 | No 6 Progressive Taxation and Tax Morale Philipp Dörrenberg (CGS, University of Cologne) Andreas Peichl (IZA, University of Cologne, ISER and CESifo)
Transcript of Progressive Taxation and Tax Morale · ualÕs tax morale is higher, the more progressive the tax...

Vol 1 | No 6
Progressive Taxation and Tax Morale
Philipp Dörrenberg (CGS, University of Cologne)
Andreas Peichl (IZA, University of Cologne, ISER and CESifo)

Progressive Taxation and Tax Morale∗
Philipp Doerrenberg† Andreas Peichl‡
December 14, 2010
Abstract
As the link between tax compliance and tax morale is found to be robust,finding the determinants of tax morale can help to understand and fight taxevasion. In this paper we analyze the effect of progressive taxation on taxmorale in a cross-country approach - which has not been investigated before.Our theoretical analysis leads to two testable predictions. First, an individ-ual’s tax morale is higher, the more progressive the tax schedule is. Second,the impact of tax progressivity on tax morale is declining in income. In ourempirical analysis, we make use of a unique dataset of tax progressivity mea-sures and follow most of the tax morale literature by employing the WorldValues Survey to measure tax morale. Controlling for a wide range of vari-ables, we confirm both hypotheses in our empirical analysis.
JEL Classification: H26, H24, D7, D31Keywords: Tax Morale, Tax Compliance, Progressivity, Taxation, Redistribution
∗Andreas Peichl is grateful for financial support from the Deutsche ForschungsgemeinschaftDFG. We are grateful to Klara Peter and Denvil Duncan for sharing their data. We would like tothank Clemens Fuest, Judith Niehues and Michael Thoene for helpful suggestions and comments.
† Cologne Graduate School in Management, Economics and Social Sciences at University ofCologne, [email protected].
‡ Institute for the Study of Labor (IZA), University of Cologne, ISER and CESifo. Correspond-ing author: IZA Bonn, P.O. Box 7240, 53072 Bonn, Germany, [email protected].

1 Introduction
The problem of tax evasion has existed ever since taxes themselves came into being.
Evasion has been and still is a considerable problem in almost all societies and
countries. For example, the United States Department of the Treasury and the
Internal Revenue Service have estimated that the overall net tax gap for the USA
in 2001—measuring the difference between tax-paying obligations and voluntarily
paid taxes—was $290 billion. This equates to a share of 13.7% of all taxes that
should have been paid (reported in Slemrod 2007). Based on the economics-of-crime
approach by Becker (1968), the standard approach of modeling tax evasion decisions
assumes a simple expected-utility maximization problem, where tax evasion pays off
but is risky because of penalties when detected (Allingham and Sandmo 1972).
The model, however, does not explain satisfactorily the observed degrees of tax
compliance, as feeding it with actual figures of detection probabilities and penalty
fees yields considerably more evasion than observed in reality (Alm et al. 1992,
Slemrod and Yitzhaki 2002). High levels of risk aversion are not able to explain
high compliance within standard models either (Frey and Feld 2002). Experimental
research also confirms that the standard approach is not appropriate to explain tax
evasion behavior (Torgler 2002).1
Economists have recently started to work on reasons for high compliance and
revealed that tax morale—usually defined as the intrinsic motivation to pay taxes
which arises from the moral obligation to pay taxes as a contribution to society (see,
e.g., Feld and Frey 2007, Torgler 2007, Alm and Gomez 2008, Cummings et al.
2009)—plays a significant role in explaining observed tax evasion behavior. Among
others, cross-country analyses by Richardson (2006) and Torgler et al. (2008) find
strong and significant support for a negative relationship of tax morale and tax
evasion. Other authors investigate the impact of variables on tax evasion, which in
the literature were found to shape tax morale, and also find a close link between
tax morale and tax compliance (Erard and Feinstein 1994, Pommerehne and Weck-
Hannemann 1996, Wu and Teng 2005, Cummings et al. 2009).2 In a cross-country
analysis Alm and Torgler (2006) find statistically significant evidence that higher tax
morale leads to smaller shadow economies. Results pointing in the same direction
have also been found in many other empirical analyses (see, among others, Torgler
2005, Alm et al. 2006, Dell’Anno 2009 and Torgler and Schneider 2009). Based on
his empirical findings, Halla (2010) concludes that 1) economic scholars need to be
1Refer to Andreoni et al. (1998) for a comprehensive overview on tax evasion literature.2Most of the mentioned analyses employ the World Values Survey to measure tax morale. We
use the very same data source for our empirical analysis.
1

interested in the determinants of tax morale because it unambiguously affects actual
tax compliance behavior and 2) policy makers can alter tax evasion by manipulating
tax morale.
As the link between tax evasion and tax morale has been shown to be ro-
bust, finding determinants of tax morale can help to understand and fight actual
tax evasion. In this paper we contribute to the literature by investigating the im-
pact of progressive taxation on individual tax morale which has—to the best of our
knowledge—not been investigated before. Standard economic approaches would pre-
dict that progressive taxes increase the tax morale of those who are financially better
off under such a system, whereas it lowers the tax morale of those not benefiting in
comparison with, say, a linear tax system. However, considering empirical research
results that many individuals seem to be averse to inequality and that redistribution
is predominantly supported across the population, we consider the relation between
tax morale and progressive taxes to be less straight-forward. We set up a theoreti-
cal model of tax progressivity with inequality averse individuals following Fehr and
Schmidt (1999) and derive two testable hypotheses, which we investigate by employ-
ing an empirical approach using micro-level survey data for individual tax morale
from the World Value Survey (WVS) and contextual data for tax progressivity from
Peter et al. (2010).
Our theoretical analysis shows that that all members of the middle-class and
the poor unambiguously benefit from an increase in tax progressivity, whereas for a
rich person her utility might also rise if she is sufficiently averse towards inequality.
This leads to two testable predictions. First, an individual’s tax morale is higher,
the more progressive the tax schedule is. Second, the impact of tax progressivity
on tax morale is declining in income. Controlling for a wide range of variables, we
confirm both hypotheses in our empirical analysis.
The proceeding of the paper is as follows: In section 2 we review related
literature on the determinants of tax morale. In section 3 we examine theoretical
considerations relating to our research question and present our hypothesis. Section
4 describes the empirical. The results are presented in section 5 and section 6
concludes.
2 The Determinants of Tax Morale
The determinants of tax morale have been analyzed by using either experimental
or empirical survey data. We focus on survey based evidence because we employ
2

survey data in our empirical analysis ourselves.3
Socio-demographic Variables Almost all empirical analyses indicate that the
elderly tend to have a higher tax morale and that women have a higher tax morale
than men. These effects seem to be very robust and were found for many countries,
including Western industrialized countries (Slemrod 2003, Alm and Torgler 2006,
Frey and Torgler 2007, Konrad and Qari 2009), Latin American countries (Torgler
2005), Asia (Torgler 2004) and Russia (Alm et al. 2006). Torgler (2006) includes
a very broad range of countries from different cultures in his regressions and also
finds accordant results. Tittle (1980), for example, provides reasons for this by
arguing that old people are more experienced and thus more sensitive to social
sanctions. Considering the historic role of women, Tittle stresses that they are more
compliant and less self-reliant than men. Furthermore, most empirical research on
tax morale finds that married people develop a higher tax morale than singles (Alm
and Torgler 2006, Torgler 2006, Frey and Torgler 2007, Konrad and Qari 2009). The
intuition behind this, however, is ambiguous. Tittle (1980) stresses that it is due
to higher social constraints of married people, whereas Torgler (2007) notes that
the differences might occur due to different treatments of married people in the tax
system.
Socio-economic Variables Intuitively, the impact of income on tax morale is
not clear. On the one hand, evasion yields higher returns for high-income earners—
especially in countries with progressive tax systems. On the other, people earning
high incomes might have higher societal stakes and are more affected by sanctions,
i.e. losing a well-paid job. Accordingly, the empirical picture is ambiguous as well.
Whereas Konrad and Qari (2009) cannot find any significant effects using European
data, a negative relationship is found by Torgler (2004) for Asian countries, Alm
and Torgler (2006) for Europe and the USA, and Torgler (2006) for a large sets
of different countries. When it comes to the occupation status, almost all findings
indicate that the self-employed to have a lower tax morale than other occupation
groups (see Alm and Torgler 2006, Frey and Torgler 2007 or Konrad and Qari
2009 for Europe; Torgler 2004 for Asia; or Alm et al. 2006 for Russia). Theoretical
explanations are very intuitive: taxes are more visible to the self-employed and there
are more opportunities to evade compared to employees. In contrast, the impact
of education on tax morale should be ambiguous: educated people tend to know
better what the state provides and how it spends collected tax revenues. Hence,
tax morale among the educated should vary depending on the state’s spending
3 Refer to Torgler (2002) for a detailed overview of experimental results.
3

efficiency (Torgler 2007). When controlling for state efficiency parameters, however,
a large fraction of the survey literature finds positive impacts in both developing
and industrialized countries (Alm and Gomez 2008 for Spanish data; Konrad and
Qari 2009 for Europe; or Torgler 2005 for Latin America, among others). Other
authors, nevertheless, find non-significant or even negative effects (e.g. Frey and
Torgler 2007 or Alm et al. 2006).
Trust in Government and National Pride A major focus in tax morale re-
search is on perceived trust in state functioning or public finance. The intuition is
obvious: taxpayers who trust their government and believe that tax revenue is spent
properly should be more willing to pay taxes. In contrast, tax morale decreases as
people believe that tax money is spent redundantly—a notion supported by survey
research. For example, Slemrod (2003) and Frey and Torgler (2007) use data for
Europe and find significant and positive effects of different “trust in state” variables
on tax morale. Their results are confirmed for other countries and cultures, such as
Spain (Alm and Gomez 2008), Asia (Torgler 2004), Latin America (Torgler 2005)
and Russia (Alm et al. 2006). Another closely related variable is national pride.
Using a similar intuition, taxpayers who are proud of their country of residence may
well be more willing to pay taxes. Konrad and Qari (2009) employ a cross-country
analysis on several European countries and find strong evidence that patriotism
does indeed have a positive effect on tax morale. Similar results are found for Latin
America (Torgler 2005), Asia (Torgler 2004) and Russia (Alm et al. 2006).
Religion Empirical research on crime behavior by Hull (2000) reveals that delin-
quent behavior and religious beliefs are negatively related. Torgler (2006) conducts
an extensive investigation on this relationship and finds a strong causal relationship
between different variables capturing religiosity and tax morale. The results are
confirmed by Konrad and Qari (2009) for European countries and Torgler (2005)
for Latin America.
Macro-economic Indicators The impact of macro-economic indicators such as
GDP, inflation or unemployment rate on tax morale has so far not been sufficiently
analyzed sufficiently. One exception, however, is Heinemann (2010), who analyzes
whether an economic crisis—measured as a short-run jump in unemployment—has
an impact on tax morale. His results reveal that the crisis variable unfolds a signif-
icant and negative effect on tax morale, indicating that tax morale is lower during
a crisis. A few other authors have included macro-economic indicators as controls
in their regressions. Slemrod (2003), for example, includes the share of government
4

expenditure of GDP in his analysis and finds that tax morale decreases as relative
government expenditures rise. Martinez-Vazquez and Torgler (2009) analyze tax
morale in Spain and find that both the unemployment rate and inflation—measured
on the regional level—are negatively related to tax morale. Interesting for our pur-
poses are the experimental results by Heinemann and Kocher (2010), who observe
that tax compliance is higher in progressive tax systems than in linear ones.
3 Theoretical Considerations
3.1 Attitudes towards Redistribution and Progressive Tax-
ation
Clearly, the impact of progressive taxes on individual tax morale depends on indi-
vidual attitudes towards both redistribution in general and progressive taxation in
particular. Standard economics, emphasizing selfishness only, would predict that
attitudes towards both are supported by those benefiting monetarily and disliked
by those who are net payers. However, although in most democratic countries the
number of net contributers outweighs the number of net recipients, progressive taxes
are usually in force.
Factors shaping attitudes towards redistribution are analyzed by Fong (2001)
using survey data. The results unambiguously suggest that income is a poor pre-
dictor of support for redistribution and that redistribution is not only supported
by those who benefit from such a system. Corneo and Gruener (2002) employ an
empirical cross-country analysis and confirm that the standard economic model is
only partly able to explain individual support for redistribution. These results are
strongly supported by other works in this field. Alesina and Giuliano (2009) pro-
vide an extensive review of existing literature. Their findings clearly indicate that
income is a poor explanation for support of redistribution and that redistribution is
a majority preference.
Literature on attitudes towards progressive taxation in particular contains sim-
ilar results. For Germany, Heinemann and Hennighausen (2010) show that personal
income concerns are only partly able to explain support for progressive taxation.
According to their findings, both the own income situation and fairness aspects
play a role when progressive taxation is evaluated. Ackert et al. (2007) conduct
experiments to examine whether individuals are driven by inequality aversion when
choosing between different taxes. Their results reveal that in most cases the major-
ity votes for the progressive tax and that it is not necessarily a median voter—being
indifferent in monetary terms—who is decisive. A share of the richest players al-
5

ways votes for the progressive tax, although they suffer from it in terms of monetary
after-tax income.
The above results on attitudes towards redistribution and progressive taxation
might indicate that individuals do not only care about their own well-being, but
also about other people’s. The results observed in experimental games such as the
ultimatum game (Gueth et al. 1982) or the dictator game (Kahneman et al. 1986)
support this observation and suggest that most individuals behave less selfishly
and behave more compassionately than widely thought.4 Hence, evidence is strong
that besides their own pay-off, individuals also attach importance to decently fair
distributions.
3.2 A Model of Inequality Aversion
In order to show the effect of tax progressivity on individuals having preferences
of inequality aversion, we make use of a model developed by Fehr and Schmidt
(1999) (henceforth: F&S). F&S set up a model of self-centered inequality aversion,
in which inequality aversion means that individuals dislike inequitable outcomes and
self-centered indicates that this aversion primary stems from a comparison of their
own and other people’s pay-offs. In particular, it is assumed that individuals derive
utility from their own income situation but suffer from inequality in terms of being
either better or worse off in material terms than other individuals. They, however,
dislike being worse off than others more than being better off. Equation 1 shows how
this intuition is translated into a formal model. In an environment with n players
the F&S utility function of individual i ∈ (1, . . . , n) writes as
Ui(x) = xi − αi1
n− 1
�
j �=i
max(xj − xi, 0)− βi1
n− 1
�
j �=i
max(xi − xj, 0). (1)
An individual i’s utility positively depends on her own income xi and is nega-
tively related to the difference between her income and that of other people’s j. The
second term expresses how someone dislikes being worse off than others, while the
third term shows disutility from being better off than others. Based on experimen-
tal observations, the following parameter restrictions apply: αi ≥ βi ≥ 0 indicates
than an individual i’s utility loss from disadvantageous inequality (xi < xj) is larger
than from advantageous inequality (xi > xj). By normalizing terms 2 and 3 with
n−1, it is ensured that the impact of inequality aversion on i’s utility is independent
from the number of players n. In accordance with experimental evidence, Fehr and
4See Konow (2003) and Fehr and Schmidt (2006) for overviews on compassionate behavior.
6
Schmidt (1999) explicitly allow individuals to be heterogeneous, so that some people
are purely selfish (α = β = 0) and others might have strong aversions towards both
advantageous and disadvantageous inequalities. The F&S model is very powerful
insofar as it is able to explain the outcomes of a wide range of experimental results
and hence describe human behavior more appropriately than the standard model of
selfish preferences.5
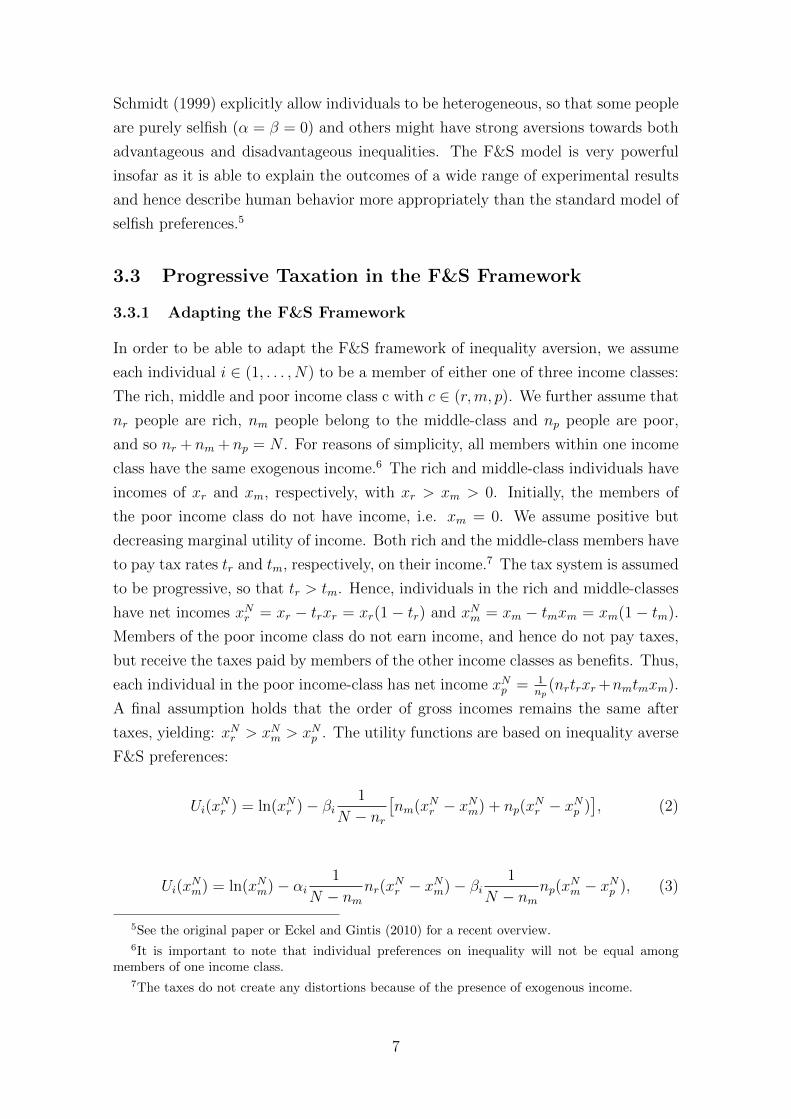
3.3 Progressive Taxation in the F&S Framework
3.3.1 Adapting the F&S Framework
In order to be able to adapt the F&S framework of inequality aversion, we assume
each individual i ∈ (1, . . . , N) to be a member of either one of three income classes:
The rich, middle and poor income class c with c ∈ (r,m, p). We further assume that
nr people are rich, nm people belong to the middle-class and np people are poor,
and so nr + nm + np = N . For reasons of simplicity, all members within one income
class have the same exogenous income.6 The rich and middle-class individuals have
incomes of xr and xm, respectively, with xr > xm > 0. Initially, the members of
the poor income class do not have income, i.e. xm = 0. We assume positive but
decreasing marginal utility of income. Both rich and the middle-class members have
to pay tax rates tr and tm, respectively, on their income.7 The tax system is assumed
to be progressive, so that tr > tm. Hence, individuals in the rich and middle-classes
have net incomes xNr = xr − trxr = xr(1− tr) and xN
m = xm − tmxm = xm(1− tm).
Members of the poor income class do not earn income, and hence do not pay taxes,
but receive the taxes paid by members of the other income classes as benefits. Thus,
each individual in the poor income-class has net income xNp = 1
np(nrtrxr+nmtmxm).
A final assumption holds that the order of gross incomes remains the same after
taxes, yielding: xNr > xN
m > xNp . The utility functions are based on inequality averse
F&S preferences:
Ui(xNr ) = ln(xN
r )− βi1
N − nr
�nm(x
Nr − xN
m) + np(xNr − xN
p )�, (2)
Ui(xNm) = ln(xN
m)− αi1
N − nmnr(x
Nr − xN
m)− βi1
N − nmnp(x
Nm − xN
p ), (3)
5See the original paper or Eckel and Gintis (2010) for a recent overview.6It is important to note that individual preferences on inequality will not be equal among
members of one income class.7The taxes do not create any distortions because of the presence of exogenous income.
7

Ui(xNp ) = ln(xN
p )− αi1
N − np
�nr(x
Nr − xN
p ) + nm(xNm − xN
p )�. (4)
As in F&S, we assume βi ≤ αi and 0 ≤ βi < 1. Since all members within one
income class have the same income, there are no inequalities towards members of
the same income class. ln(xc) accounts for positive but decreasing marginal utility
of income. The rich do not have to face disadvantageous inequalities, whereas each
poor individual is poorer than individuals in each of the other income classes and
hence only faces disadvantageous inequalities. The middle-class individuals, as they
are richer than the members of the poor income class but poorer than individuals
in the rich income class, face both kinds of inequality.
3.3.2 Increase in Progressivity
Considering our research question, we are interested in the effect of progressivity on
people’s utilities. We model an increase in progressivity by a rise in the tax rate
on rich incomes tr, whereas the middle-class tax rate tm remains constant. Using∂xN
r∂tr
= −xr < 0, ∂xNm
∂tr= 0 and
∂xNp
∂tr= nr
npxr > 0 yields for the derivatives of equations
2 - 4:
∂Ui(xNr )
∂tr=
1
xNr
(−xr) + βixrN
N − nr, (5)
∂Ui(xNm)
∂tr=
nr
N − nmxr(αi + βi) > 0, (6)
∂Ui(xNp )
∂tr=
nr
npxr(
1
xNp
+ αiN
N − np) > 0. (7)
The results imply that all members of the middle-class and the poor-class
unambiguously benefit from an increase in tr. The intuition is straight-forward,
which is the middle-class individuals gain utility through two different channels:
1) the disadvantageous utility towards the rich individuals decreases as their own
income remains stable and the rich individuals’ net income becomes smaller, and 2)
as the poor individuals are now richer because of higher benefits, the middle-class’
advantageous inequality reduces as well. The poor benefit from three positive effects:
1) their net-income increases through higher benefits, 2) inequality towards the
middle class decreases because they themselves become richer and the middle-class
keep their income, and 3) inequality towards the rich individuals strongly reduces
as the rich’s higher tax burden solely benefits the poor. However, the impact on a
rich individual’s utility is not clear and depends on βi. Intuitively, there are two
8

countervailing effects in force: 1) their net income decreases, as they have to pay
more taxes, and 2) the degree of advantageous inequality towards both the poor
and the middle-class decreases. Based on equation 5, one can see that the rich
individuals’s utility Ui(xNr ) increases after the increase in progressivity if
βi >N − nr
N
1
xNr
=N − nr
N
1
xr(1− tr). (8)
That is, if a rich person i is sufficiently averse towards advantageous inequality,
her utility might also rise as a result of the increase in the tax schedule’s progres-
sivity. Derived from a wide range of different outcomes in game experiments, Fehr
and Schmidt (1999, page 844, Table III) provide rough numerical estimates for the
parameters in their model. They suggest that 30% of all individuals do not care for
advantageous inequalities at all (β = 0), while another 30% are moderatly averse
to advantageous inequalities. The largest share of the population, at 40%, however,
is believed to to be highly averse to advantageous inequality. Other authors have
also tried to estimate numerical values for the parameters α and β that fit real eco-
nomic behavior (see Eckel and Gintis 2010 for a recent overview). Bellemare et al.
(2008) use a large, representative sample of the Dutch population and find that on
average the population seems to be even more averse towards both advantageous
and disadvantageous inequality than is assumed by Fehr and Schmidt (1999). Those
results—providing evidence that α and β seem to be very high—might indicate that
a very large fraction of the rich individuals in our model is indeed in favor of higher
progressive taxation.
3.4 Hypotheses
Hypothesis 1 An individual’s tax morale is higher, the more progressive the tax
schedule is, ceteris paribus.
Our main hypothesis is primarily based on two arguments we derived in the previous
sections. First, the comprehensive literature on redistribution finds strong empirical
cross-country evidence supporting redistribution and progressive taxation as a ma-
jority preference. Attitudes towards both redistribution and progressive taxation do
not solely depend on whether an individual suffers or benefits in monetary terms.
Often individuals who lose money through redistribution and progressive taxes are
in favor of such mechanisms. Second, we showed formally how progressive taxation
affects inequality averse individuals’ utility. Our theoretical model suggests that
people belonging to the poor and middle income classes unambiguously benefit in
terms of utility. However, although they lose most in monetary terms, even a large
9

share of the rich population is in favor of progressive taxes. Assuming that people
are more willing to pay taxes in systems that provide them with more utility, we
hypothesize that progressive taxes increase tax morale and therefore tax compliance
as well.
Hypothesis 2 The positive impact of progressive taxation on individual tax morale
declines in income, ceteris paribus.
Our second hypothesis builds on our theoretical analysis showing that the rich in-
come class faces two opposing effects caused by higher progressive taxation. They
lose in monetary terms because their tax burden increases, but benefit through less
inequality compared to the other income classes. Furthermore, our theory predicts
that the middle-class benefit through two different channels, whereas the poor-class
increase their utility through even three positive effects. Considering these results,
we expect the impact of progressivity to decline in income.
4 Empirical Approach
4.1 Data Sources
All individual-level variables are derived from the World Values Survey (WVS) and
the European Values Survey (EVS). WVS/EVS is the most common data source in
tax morale research. It is a worldwide survey which collects comparative data on
many different values and attitudes using standardized questionnaires for representa-
tive national samples of at least 1000 respondents per country (Inglehart n.d.). The
surveys are conducted by professional scientific institutions and performed through
face-to-face interviews at the respondents’ home and in their respective national
language.8 We employ an integrated data file provided by the WVS data archive
in collaboration with EVS (EVS/WVS 2006) and make use of all four waves in-
cluded in the data file. Waves 1, 2, 3 and 4 were carried out between 1981-1984,
1989-1993, 1994-1998, 1999-2004, respectively. Our analysis is restricted to relative
homogeneous OECD countries. Due to missing data9 some of the OECD coun-
tries had to be excluded. In the end, 19 countries remain in the analysis: Austria,
Belgium, Canada, Denmark, Finland, France, Germany, Hungary, Iceland, Ireland,
Italy, Japan, Mexico, the Netherlands, Norway, Spain, Sweden, the United Kingdom
8Inglehart (2000) provides more comprehensive information on the WVS.9Missings are due to: 1) a few countries do not have data for the first wave on the country level,
and 2) some countries have been included in only one of the waves. These had to be excluded inorder to obtain sufficient variation within countries and across points of time.
10

and the USA. Not all countries are to be found in each wave, so we do not have
19(countries)∗4(points of time)= 76 observations at the country level, but only 50.
Table 3 in the appendix provides an overview.
The country-level tax measures are derived from the World Tax Indicators
(WTI) (Peter et al. 2010). This large and rather new panel data set covers personal
income tax structures at the country level in 189 countries for the period 1981 to
2005. As it contains the complete national income tax structures, including statu-
tory rates, tax brackets, country-specific tax formulae, basic allowances, standard
deductions and local taxes, among others, the data allow the analysis of various
important variables such as average and marginal tax rates, progressivity or com-
plexity. The data were collected from more than 100 sources including publications
by accounting firms or data sets of international organizations and public policy
research institutions (Peter et al. 2010). In addition to the WTI, we also make
use of the World Bank’s World Development Indicators in order to obtain other
country-level data. The data cover a wide range of macro-economic information for
more than 200 countries for each year since 1960 (World Bank 2010).
4.2 Operationalization
4.2.1 Dependent Variable: Tax Morale
Our dependent variable tax morale is measured on the micro-level and is derived
from the WVS. The respective question covering tax morale is:
Please tell me for the following statement whether you think it can always
be justified, never be justified, or something in between: ’Cheating on
taxes if you have the chance’.
This question has been used very frequently in the literature to capture tax
morale. However, it is of course not free of bias. As for example noted by Andreoni
et al. (1998), people might overstate their degree of morality in self-reports such as
the WVS and those who have evaded might want to excuse their behavior by declar-
ing a high tax morale. Elffers et al. (1987) find that there are significant differences
between actual tax evasion and self-reported tax evasion in surveys. Nevertheless,
asking about tax morale is less blunt than asking about tax evading behavior, and so
the degree of honesty should be higher (Frey and Torgler 2007). Another shortcom-
ing of the question refers to the fact that taxpayers might find tax evasion justifiable
if tax revenue is used for, say, financing a dictator’s war machine (Frey and Torgler
2007). We consider this problem by restricting the analysis to relative homogeneous
and democratic OECD countries and by controlling for individual trust in the state.
11

Previous robust evidence shows that low WVS levels of tax morale are associated
with high tax evasion and vice versa. Hence, we believe that it is appropriate to
measure tax morale with this question.
In the WVS the question is measured on a ten-scale index with “never justified”
and “always justified” at the extremities. In line with other empirical studies on
tax morale, such as Alm and Torgler (2006) and Heinemann (2010), we recode the
variable so that it takes the values 1 for “never justified” and 0 otherwise. This
approach is due to the fact that many respondents assert that cheating on taxes is
“never justified”.
4.2.2 Main Explanatory Variable: Tax Progressivity
As we analyze the impact of progressive taxes on individual-level tax morale, we
require a progressivity measure that is perceivable to most people. Hence, we need
a measure of tax progressivity that is derived from the tax schedule itself. The World
Tax Indicators (Peter et al. 2010) is the first comparable and reliable cross-country
data set that provides a single measure for the overall progressivity of a tax schedule’s
progressivity. In the WTI average rate progression (ARP) is calculated as follows:10
average tax rates for each country and year in the data set are first computed for 100
evenly spread pre-tax incomes. ARP is then constructed by regressing tax rates on
the log of gross income. The tax system is progressive, proportional and regressive
if the resulting slope coefficient of the income variable is positive, zero or negative,
respectively. Hence, the degree of progressivity is higher, the larger the positive
slope coefficient.
4.2.3 Other Explanatory Variables
As section 2 shows, there is a wide range of independent variables found to have
an impact on tax morale. In order to isolate the effect of progressive taxes, these
variables need to be controlled for. As we have already discussed the theoretic and
previously found effects, we do not go into details here but ask the reader to refer to
table 2 in the appendix for details of measurement and operationalization. Following
our theoretical analysis, we transform the WVS income variable so that three income
classes can be distinguished: the poor, middle and rich. We further need to control
for the general tax burden because it is very likely to be positively correlated with tax
progressivity, as welfare states employing much redistribution often have high levels
of taxes. Unfortunately, data on an individual’s income tax rate are not available
in the WVS. Using the WTI, we proxy the overall tax burden by including the
10See Peter et al. (2010, pp. 462-465) for more comprehensive information.
12

tax rate applicable to the highest income bracket in each country in our regression.
We control for culture and country-specific effects by including dummy variables
for every country but one. This is very important in cross-country analyses of
moral standards, as it allows the isolation of the main explanatory variable from the
general level of morale, which might vary across countries. Furthermore, we include
several macro-economic indicators derived from the World Development Indicators:
unemployment rate, GDP per capita, annual consumer price inflation rate, and
government expenditure as a share of GDP. By including these, we are able to
control for the economic environment in each country at each point of time. Table
2 in the appendix summarizes all variables included in the model.
4.3 Estimation strategy
Our data set pools together randomly drawn samples in each country at different
points of time. Generally, we relate country-level progressivity to individual tax
morale. In order to account for unobservable country and time-specific effects, we
include time and country dummies and thus take advantage of cross-country and
time variations in progressivity. We employ a binary logistic regression to account
for the dichotomous character of the dependent variable, tax morale. The model
contains both individual and contextual (country) level variables as regressors. Rec-
ognizing that the inclusion of country level variables might cause error terms not
to be independent and uncorrelated, we report robust standard errors that account
for clustering of individuals within one country at a certain point of time (Moulton
1986). The logit model we estimate to test our first hypothesis takes the form:11
ln
�Pr(TMc,i,t = 1)
Pr(TMc,i,t = 0)
�= int+β1TPc,t+ ICc,i,t+MCc,t+
C�
c=2
CDc+W�
t=2
WDt+ �c,i,t.
(9)
TM stands for the dummy variable tax morale, TP indicates tax progressivity,
IC represents a vector of variables on the individual level and the respective coef-
ficients, MC is a vector of country level variables and their respective coefficients.
CD and WD are country and wave dummy variables. The dependent variable is
the logarithmized odd to have high tax morale. The tax morale of an individual
i in country c at point of time t depends on several individual, time and country
factors. The equation shows that our main explanatory variable, tax progressivity,
differs across countries and points of time but not across individuals who live in
11Alesina et al. (2004), McKinnish (2007) and Heinemann (2010), among others, employ verysimilar empirical approaches and estimation techniques.
13

the same country and participated in the survey at the same point of time. Each
individual in a certain country c at a certain point of time t faces the same degree of
progressive taxes. The same holds for the macro variables, but not for the individual
ones. As mentioned, dummies for all, bar one wave and country, are included to
capture country and time specific effects. Hence, C in the equation is the number
of included countries and W the number of waves, int captures the intercept which
is barely interpretable in logistic regression and �c,i,t is a standard error term. Our
coefficient of interest, β1, measures the impact of tax progressivity on individual tax
morale. The interpretation is as follows: the logarithmized odd to have high tax
morale increases by β1 if the degree of progressivity increases by one unit.
In order to be able to test our second hypothesis, we add interaction terms
between our measure of progressivity and the three income groups to the above
model. The model then transforms to:
ln
�Pr(TMc,i,t = 1)
Pr(TMc,i,t = 0)
�= int+ β1TPc,t + β2(TPc,t ∗MCc,i,t) + β3(TPc,t ∗RCc,i,t)
+ICc,i,t +MCc,t +C�
c=2
CDc +W�
t=2
WDt + �c,i,t,
(10)
where MC and RC stand for the middle-class and the rich-class, β1 now is the
impact of progressive taxation on tax morale among the poor income class, β1 + β2
indicates the impact of individuals in the middle-class, and β1 + β3 represents the
effect of progressivity among the rich.
5 Results
5.1 Regression Results
Our results are presented in table 1. We show the usual coefficients of the logistic
regression, which allows the interpretation of the signs of the coefficients. The actual
sizes of the effects are of minor interest because the unit of the main explanatory
variable “tax progressivity” is barely interpretable.
In specification I we do not include any measure of tax progressivity and ob-
serve that the effects of the micro-level controls are in line with previous empirical
analyses of tax morale (as discussed in section 2). Women and married people have
greater tax morale than men and singles, respectively. Religiosity, patriotism and
confidence in the state also have positive effects. Furthermore, compared to em-
14

ployed individuals, we observe that being self-employed decreases tax morale, while
being retired has a positive impact. When it comes to contextual-level variables,
our analysis indicates that the “negative” variables “unemployment” and “inflation”
have negative impacts on tax morale, whereas both “government expenditure” and
the “top tax rate” have positive signs. The effective of “GDP per capita” is statis-
tically significant as well.
We check the validity of our first hypothesis in specifications II and III.
Independent of whether the top tax rate is included in the estimation (III) or not
(II), the effect of interest—ARP—is positive and highly significant. Controlling for
a wide range of both individual-level and contextual-level variables, we thus reveal
that tax morale is higher in countries with more progressive tax systems and are
able to confirm our first hypothesis.
Table 1: Estimation Results
I II III IV V
ARP (progressivity) 6.129*** 5.590*** 8.474*** 8.205***
(1.503) (2.048) (1.692) (2.168)
Interaction terms
ARP*Middle −2.275* −2.267*
(1.287) (1.288)
ARP*Rich −6.098*** −6.064***
(2.093) (2.048)
Top tax rate 0.010** 0.002 0.001
(0.004) (0.006) (0.005)
Income group (Ref.: poor)
Middle −0.066** −0.067** −0.067** 0.105 0.104
(0.032) (0.032) (0.032) (0.112) (0.113)
Rich −0.192*** −0.190*** −0.190*** 0.286 0.284
(0.048) (0.048) (0.048) (0.179) (0.175)
Unemployment −0.038*** −0.041*** −0.041*** −0.041*** −0.041***
(0.011) (0.012) (0.011) (0.011) (0.011)
GDP per capita −0.000*** −0.000** −0.000** −0.000** −0.000**
(0.000) (0.000) (0.000) (0.000) (0.000)
Inflation −0.024*** −0.031*** −0.030*** −0.031*** −0.031***
(0.006) (0.007) (0.006) (0.006) (0.006)
Government exp 0.087*** 0.054** 0.057** 0.055** 0.056**
(0.025) (0.024) (0.027) (0.024) (0.027)
Age 0.017*** 0.017*** 0.017*** 0.017*** 0.017***
(0.001) (0.001) (0.001) (0.001) (0.001)
Education −0.013*** −0.012** −0.013** −0.013*** −0.013***
(0.005) (0.005) (0.005) (0.005) (0.005)
Gender (Ref.: male)
Female 0.301*** 0.299*** 0.299*** 0.298*** 0.298***
continues on next page
15

continued from previous page
(0.033) (0.033) (0.033) (0.033) (0.033)
Employment Status (Ref.: employed)
Self-employed −0.176*** −0.172*** −0.173*** −0.176*** −0.176***
(0.045) (0.046) (0.045) (0.046) (0.045)
Retired 0.146*** 0.144*** 0.145*** 0.137*** 0.138***
(0.039) (0.038) (0.038) (0.039) (0.038)
Unemployed −0.055 −0.056 −0.056 −0.059 −0.059
(0.053) (0.053) (0.053) (0.053) (0.053)
Other 0.036 0.039 0.039 0.035 0.035
(0.044) (0.044) (0.044) (0.044) (0.044)
Religiosity (Ref.: church attendance less than once a month)
Monthly/>monthly 0.286*** 0.290*** 0.289*** 0.289*** 0.289***
(0.044) (0.044) (0.044) (0.044) (0.044)
Marital Status (Ref.: single/never married)
Divorced/separated 0.023 0.022 0.022 0.024 0.025
(0.050) (0.050) (0.050) (0.050) (0.050)
Married/as married 0.144*** 0.143*** 0.143*** 0.149*** 0.149***
(0.037) (0.037) (0.037) (0.036) (0.036)
Patriotism (Ref.: not at all proud/not proud)
Very/quite proud 0.311*** 0.314*** 0.314*** 0.313*** 0.313***
(0.070) (0.071) (0.071) (0.070) (0.070)
Confidence in the state (Ref.: little/none)
quite a lot/a lot 0.152*** 0.150*** 0.151*** 0.152*** 0.152***
(0.031) (0.031) (0.031) (0.031) (0.031)
constant −2.562*** −1.854*** −1.997*** −2.040*** −2.108***
(0.632) (0.446) (0.626) (0.452) (0.620)
Wave dummies yes yes yes yes yes
Country dummies yes yes yes yes yes
Individual Obs. 50947 50947 50947 50947 50947
Contextual Obs. 50 50 50 50 50
Pseudo R2 0.0737 0.0739 0.0739 0.0742 0.0742
AIC 64686.57 64669.64 64671.23 64655.91 64657.82
BIC 65048.95 65032.02 65042.45 65035.97 65046.71
chi2 70577.015 11447.131 16527.132 14691.549 19901.259
p 0.000 0.000 0.000 0.000 0.000
[1] Dependent Variable: Tax Morale (Dummy with 1 “high”, 0 “otherwise”) [2] Logistic
regression [3] Coefficients reported [4] Cluster adjusted, robust standard errors in parentheses
[5] Ref. =Reference Category [6] ∗ p < 0.10, ∗∗ p < 0.05, ∗ ∗ ∗ p < 0.01
Our second hypothesis is overhauled in specifications IV and V , where we add
interaction terms between ARP and the income groups. As expected, the impact of
progressive taxation is the highest among the poor—indicated by the coefficient on
ARP in IV and V , and the lowest among the richest individuals—measured through
16

the coefficient on ARP plus the negative coefficient on ARP ∗ Rich. Both effects
are highly significant and, once again, do not depend on the inclusion of the top tax
rate. The impact among middle-class individuals lies in between and is significant
at the 10% level.
5.2 Robustness Checks
A bivariate analysis (not reported) finds Japan to have both the highest levels of
progressivity and tax morale. Concerned that Japan might influence our results in
the “right” direction, we remove the outlier from our analysis in a robustness check
to test the validity of our results. Table 6 in the appendix indicates that our results
remain stable through all specifications. Although we have excluded the country
with the highest values for both tax morale and progressivity, progressivity still
has a significant and positive impact on tax morale. In order to further establish
the link between tax morale and progressivity, we ran a probit model instead of
the logistic regression. The results—presented in table 6 the appendix—show that
our original results remain unaffected. Moreover, our results are robust to different
operationalizations of the control variables as well. This is especially true for the
income variable, as it does not change any implications when we use the 10-step
income variable originally provided in the WVS, be it on a continuous scale or using
dummies for each decile.
6 Conclusion
Understanding determinants of tax morale is an important piece of the puzzle in
order to explain why people pay taxes, and it can help to fight tax evasion. In this
study we investigated the impact of progressive taxes on tax morale—a link that
has so far been absent in the literature. Our theoretical analysis shows that an
individual’s tax morale is higher, the more progressive the tax schedule is, and that
the impact of tax progressivity with tax morale is declining in income. Testing these
hypotheses empirically, we do indeed reveal a positive (and declining) association
between progressive taxation and tax morale, suggesting that tax evasion is less in
systems with high degrees of progressivity.
Our analysis has implications for public policy makers. In the public and media
discussion, progressive taxes are often considered to be damaging from an economic
point of view, as they harm incentives and burden a society’s high performers with
too high taxes. We are able to show, however, that tax progressivity might also
yield positive economic outcomes. Even when holding the income constant, it was
17

shown that taxpayers are willing to sacrifice some of their income in order to install
a more equal after-tax distribution. Progressive taxes, therefore, contribute to less
tax evasion and higher perceived fairness and equality. Note, however, that we are
not able to identify a causal relationship. The causality could also go the other
way: because of higher tax morale (and inequality aversion) of their citizens, the
governments can c.p. impose higher taxes with higher degrees of progressivity.
Although shown to have high significance, research on the determinants of
tax morale is as yet insufficient. While individual-level factors explaining different
levels of tax morale have been analyzed quite frequently, literature on contextual-
level factors is not satisfactory. Further research has to investigate the standard
economical determinants of tax evasion, such as tax rates and penalties for evading.
Furthermore, the impacts of different types of income tax systems and of indirect
taxes such as VAT on tax morale have to be considered—ideally in extensive cross-
country approaches. More research also has to devote itself to establish further the
link between tax morale measured in surveys and actual compliance behavior.
18

A Appendix
Table 2: Operationalization of Included Variables
Variable Source Operationalization
Tax Morale WVS Tax evasion justified? Other (Ref.), never
ProgressivityARP
WTI Coefficient from regressing average tax rates fordifferent incomes within one country on income(continuous scale)
Gender WVS Male (Ref.), female
Age WVS Age in years
Marital Status WVS Single/never married (Ref.), divorced/separated,married/living together as married
EmploymentStatus
WVS Employed (Ref.), self-employed, pensioner, unem-ployed, other
Education WVS Education in years
Income groups WVS 3 income groups: poor (Ref.), middle, rich (derivedfrom 10 step income variable)
Patriotism WVS How proud to be [respective nationality]? Not atall/not very proud (Ref.), very/quite proud
Religiosity WVS Frequency of church attendances: Less than oncea month (Ref.), more than once a month
Confidence inthe State
WVS Could you tell me how much confidence you have inthe parliament? Little/none (Ref.), quite a lot/alot
Top Tax Rate WTI Tax rate applicable to the highest income bracketin each country
Unemployment World Bank Total unemployment rate as % of total labor force
Inflation World Bank Annual inflation of consumer prices in %
GDP per capita World Bank GDP per capita in $
Government Ex-penditure
World Bank General government expenditure as % of GDP
Country Dum-mies
/ Dummies for each country but one
Wave Dummies / Dummies for each wave but one
Ref. = Reference category
19

Table 3: Number of Observations by Country and Wave
Wave
Country 1981-1984 1989-1993 1994-1999 1999-2004 Total
Austria 0 1,222 0 1,084 2,306
Belgium 0 1,436 0 1,180 2,616
Canada 939 1,360 0 1,340 3,639
Denmark 0 784 0 817 1,601
Finland 0 479 784 763 2,026
France 735 646 0 1,106 2,487
Germany 0 2,733 0 1,330 4,063
Hungary 0 914 0 853 1,767
Iceland 0 468 0 755 1,223
Ireland 0 856 0 752 1,608
Italy 0 1,320 0 1,387 2,707
Japan 787 591 763 921 3,062
Mexico 0 339 1,509 765 2,613
Netherlands 0 698 0 841 1,539
Norway 900 857 939 0 2,696
Spain 1,826 2,410 660 1,352 6,248
Sweden 697 0 789 701 2,187
United Kingdom 0 1,016 0 522 1,538
United States 1,849 1,443 863 866 5,021
Total 7,733 19,572 6,307 17,335 50,947
20

Table 4: Summary Statistics of Included Continuous and Dummy Variables
Variable Mean Std. Dev. Min Max
Tax morale dummy 0.5657 0.4957 0 1
(1: high tax morale)
Progressivity ARP 0.0780 0.0192 0.0415 0.1445
Gender dummy 0.5069 0.4999 0 1
(1: female)
Education in years 11.7947 4.0396 1 24
Patriotism 0.8641 0.3427 0 1
(1: very/quite proud)
Age 44.3306 16.7017 19 100
Confidence in state 0.4327 0.4955 0 1
(1: quite a lot/a lot)
Unemployment rate 7.9237 4.1858 2 22.7
GDP per capita 20209.14 8766.966 3156.583 41833.96
Inflation 6.1792 7.5177 −0.7122 34.3777
Government expenditure 18.7143 4.1698 8.3840 29.4132
Top tax rate 44.7273 13.0327 12 75
N = 50, 947 individual observations included in analysis
Std. Dev. = Standard Deviation
21

Table 5: Summary Statistics of Included Classified Variables
Income Groups Frequency Percent
Poor 15, 509 30.44
Middle 24, 717 48.52
Rich 10, 721 21.04
Total 50, 947 100.00
Marital Status Frequency Percent
Single 10, 407 20.43
Separated or widowed 6, 893 13.53
Married or as married 33, 647 66.05
Total 50, 947 100.00
Employment Status Frequency Percent
Employed 26, 957 52.91
Self-employed 3, 433 6.56
Retired 8, 753 17.18
Unemployed 2, 552 5.01
Other 9, 342 18.34
Total 50, 947 100.00
22

Table 6: Robustness Check: Probit estimation/excluding Japan
ProbitI ProbitII ExclJapI ExclJapII
(logit) (logit)
ARP (progressivity) 3.458*** 5.068*** 5.461*** 8.031***
(1.262) (1.323) (1.959) (2.103)
Interaction terms
ARP*Middle −1.391* −2.299*
(0.779) (1.307)
ARP*Rich −3.795*** −5.748***
(1.231) (2.115)
Top tax rate 0.001 0.000 0.007 0.005
(0.003) (0.003) (0.006) (0.006)
Income group (Ref.: poor)
Middle −0.041** 0.065 −0.070** 0.104
(0.020) (0.068) (0.033) (0.113)
Rich −0.117*** 0.180* −0.196*** 0.254
(0.029) (0.106) (0.050) (0.182)
Unemployment −0.025*** −0.025*** −0.045*** −0.045***
(0.007) (0.007) (0.010) (0.010)
GDP per capita −0.000** −0.000** −0.000** −0.000***
(0.000) (0.000) (0.000) (0.000)
Inflation −0.019*** −0.019*** −0.033*** −0.033***
(0.004) (0.004) (0.007) (0.006)
Government exp. 0.036** 0.035** 0.050* 0.050*
(0.016) (0.016) (0.026) (0.026)
Age 0.010*** 0.010*** 0.016*** 0.016***
(0.001) (0.001) (0.001) (0.001)
Education −0.008** −0.008*** −0.012** −0.012**
(0.003) (0.003) (0.005) (0.005)
Gender (Ref.: male)
Female 0.183*** 0.183*** 0.303*** 0.303***
(0.020) (0.020) (0.034) (0.034)
Employment Status (Ref.: employed)
Self-employed −0.107*** −0.109*** −0.155*** −0.159***
(0.028) (0.028) (0.047) (0.047)
Retired 0.087*** 0.083*** 0.152*** 0.144***
(0.023) (0.024) (0.039) (0.039)
Unemployed −0.036 −0.038 −0.044 −0.047
(0.033) (0.033) (0.053) (0.053)
Other 0.024 0.022 0.027 0.023
(0.026) (0.027) (0.045) (0.045)
Religiosity (Ref.: church attendance less than once a month)
Monthly/>monthly 0.176*** 0.176*** 0.295*** 0.295***
(0.026) (0.026) (0.045) (0.045)
Marital Status (Ref.: single/never married)
Divorced/separated 0.014 0.016 0.016 0.018
continues on next page
23

continued from previous page
(0.031) (0.030) (0.050) (0.050)
Married/as married 0.089*** 0.093*** 0.136*** 0.142***
(0.023) (0.022) (0.037) (0.036)
Patriotism (Ref.: not at all proud/not proud)
Very/quite proud 0.189*** 0.189*** 0.352*** 0.351***
(0.043) (0.043) (0.074) (0.074)
Confidence in the state (Ref.: little/none)
quite a lot/a lot 0.092*** 0.093*** 0.152*** 0.154***
(0.019) (0.019) (0.032) (0.032)
constant −1.216*** −1.283*** −2.031*** −2.142***
(0.385) (0.380) (0.619) (0.617)
Wave dummies yes yes yes yes
Country dummies yes yes yes yes
Individual Obs. 50947.000 50947.000 47885.000 47885.000
Contextual Obs. 50 50 46 46
Pseudo R2 0.0738 0.0741 0.0626 0.0629
AIC 64680.85 64666.59 61873.82 61862.87
BIC 65052.07 65055.48 62233.66 62240.26
chi2 17412.506 21178.920 45632.296 4.17e+05
p 0.000 0.000 0.000 0.000
[1] Dependent Variable: Tax Morale (Dummy with 1 “high”, 0 “otherwise”)
[2] Coefficients reported [4] Cluster adj, robust standard errors in parentheses
[4] Ref. = Reference [5] ∗ p < 0.10, ∗∗ p < 0.05, ∗ ∗ ∗ p < 0.01
24

References
Ackert, L. F., J. Martinez-Vazquez, and M. Rider (2007). Social preferences and
tax policy design: Some experimental evidence. Economic Inquiry 45 (3), 487
– 501.
Alesina, A., R. Di Tella, and R. MacCulloch (2004). Inequality and happiness: Are
Europeans and Americans different? Journal of Public Economics 88 (9-10),
2009 – 2042.
Alesina, A. F. and P. Giuliano (2009). Preferences for redistribution. NBERWork-
ing paper 14825 and forthcoming in Handbook for Social Economics.
Allingham, M. G. and A. Sandmo (1972). Income tax evasion: A theoretical
analysis. Journal of Public Economics 1 (3-4), 323 – 338.
Alm, J. and J. L. Gomez (2008). Social capital and tax morale in Spain. Economic
Analysis & Policy 38 (1), 73 – 87.
Alm, J., J. Martinez-Vazque, and B. Torgler (2006). Russian attitudes toward
paying taxes - before, during, and after the transition. International Journal
of Social Economics 33 (12), 832 – 857.
Alm, J., G. H. McClelland, and W. D. Schulze (1992). Why do people pay taxes?
Journal of Public Economics 48 (1), 21 – 38.
Alm, J. and B. Torgler (2006). Culture differences and tax morale in the United
States and in Europe. Journal of Economic Psychology 27 (2), 224 – 246.
Andreoni, J., B. Erard, and J. Feinstein (1998). Tax compliance. Journal of Eco-
nomic Literature 36 (2), 818 – 860.
Becker, G. S. (1968). Crime and punishment: An economic approach. The Journal
of Political Economy 76 (2), 169 – 217.
Bellemare, C., S. Kroeger, and A. v. Soest (2008). Measuring inequity aversion
in a heterogeneous population using experimental decisions and subjective
probabilities. Econometrica 76 (4), 815 – 839.
Corneo, G. and H. P. Gruener (2002). Individual preferences for political redistri-
bution. Journal of Public Economics 83 (1), 83 – 107.
Cummings, R. G., J. Martinez-Vazquez, M. McKee, and B. Torgler (2009). Tax
morale affects tax compliance: Evidence from surveys and an artefactual field
experiment. Journal of Economic Behavior & Organization 70 (3), 447 – 457.
Dell’Anno, R. (2009). Tax evasion, tax morale and policy maker’s effectiveness.
The Journal of Socio-Economics 38 (6), 988 – 997.
25

Eckel, C. and H. Gintis (2010). Blaming the messenger: Notes on the current
state of experimental economics. Journal of Economic Behavior & Organiza-
tion 73 (1), 109 – 119.
Elffers, H., R. H. Weigel, and D. J. Hessing (1987). The consequences of different
strategies for measuring tax evasion behavior. Journal of Economic Psychol-
ogy 8 (3), 311 – 337.
Erard, B. and J. S. Feinstein (1994). The role of moral sentiment and audit
perceptions in tax compliance. Public Finance 49 (Supplement), 70 – 89.
EVS/WVS (2006). European andWorld Values Surveys four-wave integrated data
file, 1981-2004. Surveys designed and executed by the European Values Study
Group and World Values Survey Association. http://worldvaluessurvey.
org/ (accessed June 2010).
Fehr, E. and K. M. Schmidt (1999). A theory of fairness, competition, and coop-
eration. The Quarterly Journal of Economics 114 (3), 817 – 868.
Fehr, E. and K. M. Schmidt (2006). The economics of fairness, reciprocity and
altruism – Experimental evidence and new theories. In S.-C. Kolm and J. M.
Ythier (Eds.), Foundations, Volume 1 of Handbook on the Economics of Giv-
ing, Altruism and Reciprocity, pp. 615 – 691. Amsterdam, Netherlands: Else-
vier.
Feld, L. P. and B. S. Frey (2007). Tax compliance as the result of a pychological tax
contract: The role of incentives and responsive regulation. Law & Policy 29 (1),
102 – 120.
Fong, C. (2001). Social preferences, self-interest, and the demand for redistribu-
tion. Journal of Public Economics 82 (2), 225 – 246.
Frey, B. S. and L. P. Feld (2002). Deterrence and morale in taxation. CESifo
Working Paper No. 760.
Frey, B. S. and B. Torgler (2007). Tax morale and conditional cooperation. Journal
of Comparative Economics 35 (1), 136 – 159.
Gueth, W., R. Schmittberger, and B. Schwarze (1982). An experimental analysis
of ultimatum bargaining. Journal of Economic Behavior & Organization 3 (4),
367 – 388.
Halla, M. (2010). Tax morale and compliance behavior: First evidence on a causal
link. Johannes Kepler University of Linz Working Paper No. 1066.
Heinemann, F. (2010). Economic crisis and morale. European Journal of Law and
Economics , 1 – 15.
26

Heinemann, F. and T. Hennighausen (2010). Don’t tax me? Determinants of
individuals towards progressive taxation. ZEW Discussion paper No. 10-017.
Heinemann, F. and M. G. Kocher (2010). Tax compliance under tax regime
changes. Munich Discussion Paper 2010-17.
Hull, B. B. (2000). Religion still matters. The Journal of Economics 26 (2), 35 –
48.
Inglehart, R. (2000). Codebook for World Values Survey. Ann Arbor, USA: Insti-
tute for Social Research.
Inglehart, R. (n.d.). Values change the world. http://worldvaluessurvey.org/
(accessed April 2010).
Kahneman, D., J. Knetsch, and R. H. Thaler (1986). Fairness as a constraint
on profit seeking: Entitlements in the market. The American Economic Re-
view 76 (4), 728 – 741.
Konow, J. (2003). Which is the fairest one of all? A positive analysis of justice
theories. Journal of Economic Literature 41 (4), 1188 – 1239.
Konrad, K. A. and S. Qari (2009). The last refuge of a scoundrel? Patriotism and
tax compliance. IZA Discussion paper Series No. 4121.
Martinez-Vazquez, J. and B. Torgler (2009). The evolution of tax morale in mod-
ern Spain. Journal of Economic Issues 43 (1), 1 – 28.
McKinnish, T. (2007). Welfare-induced migration at state borders: New evidence
from micro-data. Journal of Public Economics 91 (3-4), 437 – 450.
Moulton, B. R. (1986). Random group effects and the precision of regression
estimates. Journal of Econometrics 32 (3), 385 – 397.
Peter, K. S., P. Buttrick, and D. Duncan (2010). Global reform of personal in-
come taxation, 1981-2005: Evidence from 189 countries. National Tax Jour-
nal 63 (3), 447 – 478.
Pommerehne, W. W. and H. Weck-Hannemann (1996). Tax rates, tax adminis-
tration and income tax evasion in Switzerland. Public Choice 88 (1-2), 161 –
170.
Richardson, G. (2006). Determinants of tax evasion: A cross-country investiga-
tion. Journal of International Accounting, Auditing and Taxation 15 (2), 150
– 169.
Slemrod, J. (2003). Trust in public finance. In S. Cnossen and H.-W. Sinn (Eds.),
Public Finance and Public Policy in the New Century, pp. 49 – 88. Cambridge,
USA: The MIT Press.
27

Slemrod, J. (2007). Cheating ourselves: The economics of tax evasion. Journal of
Economic Perspectives 21 (1), 25 – 48.
Slemrod, J. and S. Yitzhaki (2002). Tax avoidance, evasion, and administration.
In A. J. Auerbach and M. Feldstein (Eds.), n.a., Volume 3 of Handbook of
Public Economics, pp. 1423 – 1470. Amsterdam, Netherlands: Elsevier.
Tittle, C. (1980). Sanctions and Social Deviance: The question of deterrence. New
York, USA: Praeger.
Torgler, B. (2002). Speaking to theorists and searching for facts: Tax morale and
tax compliance in experiments. Journal of Economic Surveys 16 (5), 657 –
683.
Torgler, B. (2004). Tax morale in Asian countries. Journal of Asian Eco-
nomics 15 (2), 237 – 266.
Torgler, B. (2005). Tax morale in Latin America. Public Choice 122 (1-2), 133 –
157.
Torgler, B. (2006). The importance of faith: Tax morale and religiosity. Journal
of Economic Behavior & Organization 61 (1), 81 – 109.
Torgler, B. (2007). Tax Compliance and Tax Morale: A Theoretical and Empirical
Analysis. Cheltenham, UK: Edward Elgar.
Torgler, B., I. C. Demir, A. Macintyre, and M. Schaffner (2008). Causes and
consequences of tax morale: An empirical investigation. Economic Analysis
and Policy (EAP) 38 (2), 313 – 339.
Torgler, B. and F. Schneider (2009). The impact of tax morale and institutional
quality on the shadow economy. Journal of Economic Psychology 30 (2), 228
– 245.
World Bank (2010). The Word Development Indicators. http://databank.
worldbank.org/ (accessed June 2010).
Wu, S.-Y. and M.-J. Teng (2005). Determinants of tax compliance. A cross-
country analysis. FinanzArchiv 61 (3), 393 – 417.
28