Progress_for_Children UNICEF Report 2012
56
PROGRESS FOR CHILDREN A report card on adolescents Number 10, April 2012
Transcript of Progress_for_Children UNICEF Report 2012

Progress for Children A report card on adolescentsNumber 10, April 2012

© United Nations Children’s Fund (UNICEF)April 2012
Permission is required to reproduce any part of this publication. Permission will be freely granted to educational or non-profit organizations. Others will be requested to pay a small fee. Please contact:
UNICEFDivision of Communication3 United Nations Plaza, New York, NY 10017, USATel: +1 (212) 326-7434Email: [email protected]
This report and additional online content are available at <www.unicef.org/publications>.
For corrigenda subsequent to printing, please see <www.unicef.org/publications>.
For latest data, please visit <www.childinfo.org>.
ISBN: 978-92-806-4629-0eISBN: 978-92-806-4634-4United Nations publication sales no.: E.12.XX.2

Progress for Children A report card on adolescentsNumber 10, April 2012

2 Progress for Children
ConTenTs
foreWord .....................................................................................................................................................................3
1: Progress for adolescents ...........................................................................................................................................4
2: Socio-demographic profile of adolescents ..............................................................................................................6
3: Education and work .................................................................................................................................................12
4: Adolescent mortality, morbidity and health-related behaviours .........................................................................18
5: Adolescent sexual behaviour, childbearing and maternal health, and HIV ........................................................23
6: Violence ....................................................................................................................................................................31
7: The way forward ......................................................................................................................................................37
referenCes ...............................................................................................................................................................41
sTATisTiCAl TABle
Overview of the statistical table .................................................................................................................................43
Statistical table: Adolescents ......................................................................................................................................44
Regional classification .................................................................................................................................................52
ACKnoWledgeMenTs ........................................................................................................................................53

Foreword 3
foreWord MeAsUring UP
For adolescents around the world, report cards present a measure of their academic progress – and can point the way towards their futures. But how does the global community measure up in our efforts to give those young people the futures they deserve – and the tools and opportunities to make the most of their lives?
As the 10th edition of UNICEF’s Progress for Children shows, this report card is mixed. For while we have made significant progress for millions of children over the last decades – reducing child mortality, increasing the number of children enrolled in primary school, expanding access to health care services – our efforts have left behind far too many adolescents between the ages of 10 and 19.
We must reach them. For adolescence is not only a pivotal time in the life of a child – the gateway to adult-hood. It is also a critical opportunity to make progress for all children. And it is a stage of life in which we must invest more attention, resources and effort today, or suffer tomorrow the social and economic consequences of a generation less equipped to become fully contribut-ing members of society.
Today there are 1.2 billion adolescents, worldwide. Nearly 90 per cent live in developing countries. But we know less about them than other segments of the child population: too little about their situations, habits, hopes and dreams. While household surveys have improved the quality and quantity of information about adolescents, there remains a marked paucity of data, especially about young adolescents between the ages of 10 and 14.
But here is some of what we do know. Some 71 million children of lower secondary school age are not in school, despite the critical importance of education in helping adolescents develop the skills they will need as adults in the work force and in the community. Girls are less likely than boys to attend and complete secondary school – even though educated girls marry later than uneducated girls, bear children later, earn more income for their families, and have healthier, better educated children.
In the least developed countries, a quarter of young men and a third of young women are illiterate. Some 75 million young people between the ages of 15 and 24 are unemployed – a number that has grown, while educational attainment among adolescents has marginally increased.
While adolescents are at a comparatively low risk for diseases that kill the greatest number of young chil-dren – diarrhoea and pneumonia – it is by no means a safe time in their lives. Each year, 1.4 million adolescents die from injuries due to road traffic accidents, violence, and other causes. In 21 developing countries where we have enough data to assess the situation, more than one third of all girls aged 15 to 19 suffer from anaemia.
The onset of puberty and greater personal freedom make adolescents acutely vulnerable, and girls especially so. An estimated 2.2 million adolescents are living with HIV – around 60 per cent of whom are girls. More than one third of young women in the developing world were married before reaching the age of 18, a change in status which can increase the risk of domestic violence. And early marriage frequently leads to early childbirth – the leading killer of adolescent girls in Africa.
But even when excluded from critical services and denied their basic rights, adolescents can be resourceful, courageous, and well aware that their futures depend not only on what we can do for them, but on what they can do for themselves.
Around the developing world, digital technology, mobile communications and social media are connecting young people as never before – not only to one another, but to the world of information and ideas – and inspiring them to find innovative ways to improve their own lives.
I have seen this first hand. In the favelas of Rio de Janeiro, teenagers use cameras tied to the strings of kites to map the risks in their neighbourhoods. In Uganda, and other nations, young people use SMS texting to report on con-ditions in their communities, and to offer their ideas for how to address problems. And in virtually every country and community, adolescents and young people are changing their world – and thus, the world we all share.
Today’s adolescents were born under the auspices and protections of the Convention of the Rights of the Child. They are the children of the Millennium Declaration, reared during a decade of unprecedented global effort to create a more peaceful, prosperous and equitable world. We have promised them much; and we must deliver.
Anthony LakeUNICEF Executive Director

4 Progress for Children
Progress for AdolesCenTs
Millions of children have benefited from the promise of the United Nations Millennium Declaration and the Millennium Development Goals (MDGs). Many adoles-cents are alive today as a result of the significant drop in the child mortality rate since 1990. Globally, more children are enrolled in school today than any generation of children before them.
But the benefits of progress have not been equally shared among all adolescents. Economic growth has not always been equitable, and the benefits have not necessarily accrued to the poorest and the most marginalized.
situation analysisAdolescents – defined by the United Nations as those between the ages of 10 and 19 – number 1.2 billion in the world today. As children up to the age of 18, most adolescents are protected under the Convention on the Rights of the Child. Yet, their vulnerabilities and needs often remain unaddressed.
• Every year, 1.4 million adolescents die from road traffic injuries, complications of childbirth, sui-cide, violence, AIDS and other causes.1 Cause of adolescent death varies by region, and mortality patterns are associated with sex. In Latin America, injuries (including homicide) are the leading cause of death among adolescent boys; in Africa, complications of pregnancy and childbirth are the leading cause among adolescent girls aged 15−19.
• Around 11 per cent of all births worldwide, or an estimated 16 million, are to girls aged 15–19,2 and the youngest mothers are the most likely to experience complications and die of pregnancy-related causes.3 Despite the decline in the overall birth rate in the developing world, adolescent birth rates remain high, especially in some countries
of sub-Saharan Africa and Latin America and the Caribbean.
• Some 71 million children of lower secondary school age are not in school,4 and 127 million youth between the ages of 15 and 24 are illiterate, the vast majority of them in South Asia and sub-Saharan Africa.5 Rates of secondary school enrolment, literacy and employment in most regions are lower among girls and young women than among boys and young men.
• An estimated 2.2 million adolescents, around 60 per cent of them girls, are living with HIV,6 and many do not know they are infected. Overall, the levels of correct knowledge about HIV among older adoles-cents aged 15–19 remain low, with fewer girls having correct knowledge than boys. Many adolescents aged 15–19 know where HIV testing is offered, yet they are unlikely to take advantage of these services.
• Large proportions of adolescent girls aged 15−19 have experienced sexual violence, and domestic violence is common among adolescent girls who are in relationships. Gang violence is common among adolescents, particularly boys. Adolescents with disabilities are at increased risk of violence and sexual abuse.7
Neither young children nor adults, adolescents lack the services that respond to their distinctive needs. Inter-ventions for children very often focus on the younger ages; adolescents ‘age out’ of paediatric health care, for example, and they are often unreached by programmes for adults. Many adolescents are excluded from services that would reduce their risk of HIV and sexually trans-mitted infections, or that would help them prevent preg-nancies, because of laws that limit their access to these services without parental consent. Adolescents who live on their own, either by choice or by circumstance, may no longer have the protection of their families.
In the Millennium Declaration, adopted in 2000, world leaders made a promise to children to help them fulfill their human potential. The children born in that milestone year are now adolescents. It is time to review whether the promise is being kept for these ‘Millennium children’ and for all adolescents. Have the lives of adolescents improved?
1

Progress for adolescents 5
A time of transitionAdolescents experience intense physical, psychologi-cal, emotional and economic changes as they make the transition from childhood to adulthood.8 Risk-taking is part of adolescence, and it is the duty of society both to prevent risk and to mitigate any dangerous conse-quences such risk-taking is bound to have.
At this stage, investment must focus on those ado-lescents who are most at risk of passing the legacy of poverty and discrimination to the next generation: girls at risk of child marriage, girls and boys exposed to violence, younger adolescents out of school and all adolescents who are illiterate, adolescents living with HIV and those without access to knowledge, information and basic services.
Investing in adolescent girls and boys is crucial. In many countries, girls are less likely than boys to obtain a secondary education, more likely to be forced into child marriage and its attendant early sexual activity, less likely to use information and communication technolo-gies and, if they live in sub-Saharan Africa, more likely to contract HIV. Boys are more likely than girls to par-ticipate in gang violence and – at least in some regions – fall victim to homicide.
Many of the development successes over the past decade have been the result of targeted investment in programmes and policies benefiting younger children, and investing in a safe, healthy and productive transi-tion from childhood to adulthood is critical to consoli-dating these successes. Not to invest in adolescence, or to focus on adolescents only when they become
‘problems’, is to squander the investment already made in the early years.
Progress for adolescentsThis edition of Progress for Children sets out who adolescents are, where they live, what they do, what their problems are and how their needs are – or are not – being met. Understanding adolescents in all their diversity is fundamental to improving their lives.
Countries are increasingly adjusting national statisti-cal tools to better capture the dimensions, threats and opportunities that adolescents face in their lives. Much data pertaining to the 15−19-year-old age group now exist, although there are far fewer data pertaining to the 10−14-year-old age group.
Household surveys, especially the Multiple Indicator Cluster Surveys (MICS), have been instru mental in increasing the base of available data on adolescents. Such surveys are being conducted in more countries and on more topics than ever before, and their data can be disaggregated (see panel on page 38). This report is informed by an analysis of these expanded data sets.
The current status and future prospects of the Millennium children in relation to education and labour (MDGs 1, 2 and 3); health (MDG 4); sexual behaviour, childbearing and maternal health, and HIV (MDGs 5 and 6); and violence (Millennium Declaration) are described in the following pages.
“Understanding adolescents in all their diversity is fundamental to improving their lives.”

6 Progress for Children
Sub-Saharan Africa, however, is the region where adolescents make up the greatest proportion of the population, with fully 23 per cent of the region’s popu-lation aged 10–19 (see Figure 2.4). Two of the countries with the highest proportion of adolescents in the world – 26 per cent – are here: Swaziland and Zimbabwe. A third country where adolescents make up an equally
Some 1.2 billion adolescents (10−19 years old) today make up 18 per cent of the world’s population (see Figures 2.1−2.2). More than half of all adolescents live in Asia (see Figure 2.3). In absolute numbers, India is home to more adolescents – around 243 million – than any other country. It is followed by China, with around 200 million adolescents. The adolescent population of either of these countries dwarfs that of any other country.
high proportion of the population is Timor-Leste (see Figure 2.5 on page 8 and statistical table).
In the least developed countries, adolescents comprise 23 per cent of the population. Their share in developing countries is 19 per cent and in industrialized countries, 12 per cent.
6 Progress for Children
Total world population excluding adolescents
Adolescents aged 10–19 as a proportion of the total world population
Adolescent population aged 10–19
2.0 billion
497 million
1950 2010
3.5 billion
5.7 billion
8.0 billion
936 million 1.2 billion 1.3 billion
21%20% 18%
14%
1980 2050
AdolesCenT PoPUlATion: 1950–2050
Adolescents’ share of a growing world population peaked around 1980Population of adolescents 10–19 years old as a proportion of the total population, 1950–2050
The number of adolescents will increase slightly through 2050,
but their share of the population will decrease.
2 soCio-deMogrAPhiC Profile of AdolesCenTsPoPUlATion Trends And Child MArriAge
figUre 2.1
note: United Nations population data have been adjusted to include only those countries and territories in the UNICEF world classification. The 2050 population figures are projections.
source: United Nations, Department of Economic and Social Affairs, Population Division, World Population Prospects: The 2010 revision, CD-ROM edition, 2011.
6 Progress for Children

Socio-demographic profile of adolescents 7
Adolescents account for nearly one fifth of the world’s populationPopulation of adolescents 10–19 years old as a proportion of the total population, by region, 2010
figUre 2.4
0% 5% 10% 15% 20% 25% 30%
South Asia
CEE/CIS
East Asia and the Pacific
Latin America and the Caribbean
Middle East and North Africa
West and Central Africa
Industrialized countries
Eastern and Southern Africa
Least developed countries
Developing countries
World
Sub-Saharan Africa 23
23
23
20
20
19
16
14
23
19
12
18
There are 1.2 billion adolescents 10–19 years old living in the world todayWorld population, by age group and by sex, 2010
More than half of the world’s adolescents live in AsiaPopulation of adolescents 10–19 years old by region, 2010
figUre 2.2 figUre 2.3
0 30 60 90 120 150 180 210 240 270 300 330
80+75–7970–7465–6960–6455–5950–5445–4940–4435–3930–3425–2920–2415–1910–14
5–90–4
Boys and men Girls and women
Population in millions
Age
in y
ears
306090120150180210240270300330
South Asia(excluding India)
90 million
CEE/CIS55 million
East Asia and the Pacific
(excluding China)122 million
Latin Americaand the Caribbean
108 million
Middle East andNorth Africa
82 million
West andCentral Africa
94 million
Industrializedcountries115 million
Eastern and Southern Africa
92 million India243 million
China201 million
note: Because of rounding, the values presented in Figures 2.2 and 2.3 may differ slightly from those in the statistical table on pages 44–51.
sources for all figures on this page: United Nations, Department of Economic and Social Affairs, Population Division, World Population Prospects: The 2010 revision, CD-ROM edition, 2011.

8 Progress for Children
The demographic transition The proportion of adolescents in the global population peaked around 1980 and is now on the decline almost everywhere, a trend expected to continue through 2050. The absolute number of adolescents, however, is expected to rise during that same period (see Figures 2.6−2.8).
The striking differences among regions in the proportion of adolescent populations result from a demographic transition that occurs when declines in mortality rates are later followed by declines in fertility rates; the interim period of lower mortality rates and still-high fertility rates results in a large proportion of youth in a population, sometimes termed a ‘youth bulge’. Yet, at least in some regions, countries have not made sufficient investment in adolescents and youth; they have yet to realize the enormous opportunity that this population dynamic represents.
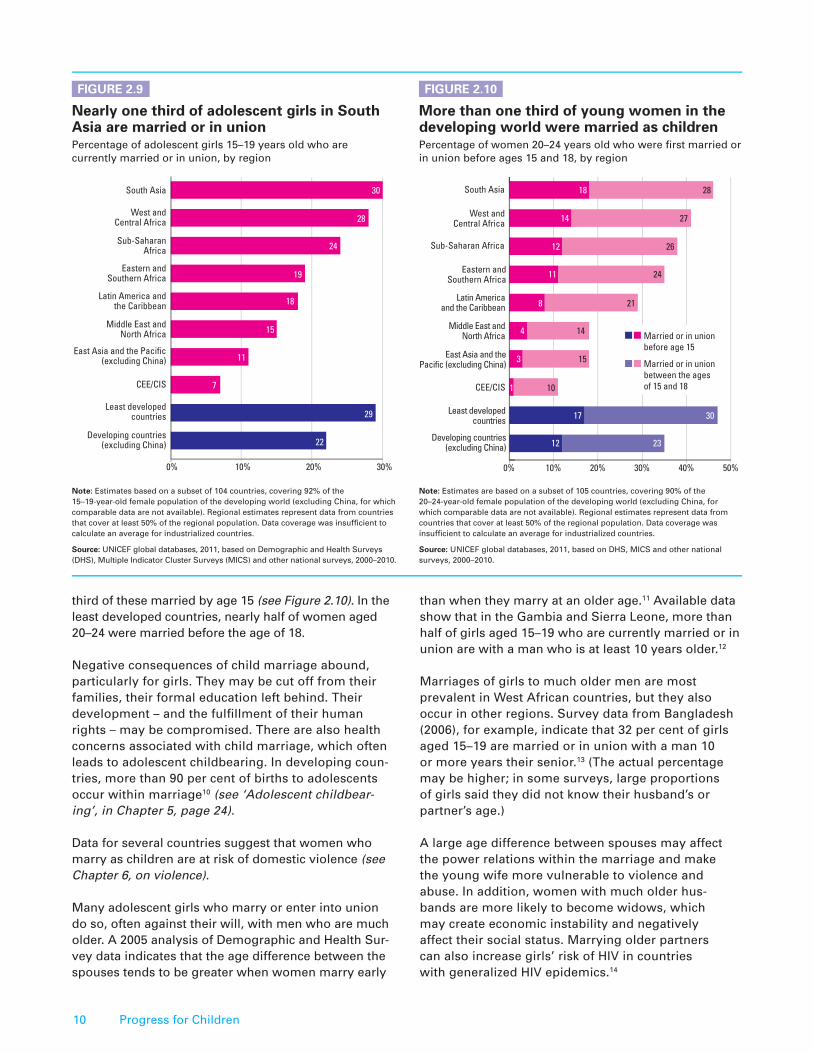
Child marriageNearly one in every four adolescent girls aged 15–19 in the developing world (excluding China) is cur-rently married or in union. In South Asia, nearly one in
every three adolescent girls aged 15–19 is married or in union, compared to 1 in 14 in Central and Eastern Europe and the Commonwealth of Independent States (CEE/CIS) (see Figure 2.9).
The South Asia and sub-Saharan Africa regions have the greatest proportion of girls aged 15–19 married or in union. The percentage of boys the same age who are married or in union is much lower (less than 5 per cent) in these regions.9
The marital status of adolescent girls varies greatly from country to country, even within regions. In Mali, for instance, 40 per cent of girls aged 15–19 are either married or in union, whereas in Cape Verde, this figure drops to 8 per cent. In Nicaragua, 24 per cent of adoles-cent girls aged 15–19 are either married or in union; in Colombia, this figure is 14 per cent.
The real extent of adolescent marriage is known only retrospectively, since adolescent girls who are cur-rently single still face the risk of being married before they finish adolescence. More than one third of women aged 20–24 in the developing world were married by age 18 – while they were still children – with about one
Adolescents account for a large proportion of the population of sub-Saharan African countriesPopulation of adolescents 10–19 years old as a proportion of the total population, by country, 2010
Note: This map is stylized and not to scale. It does not reflect a position by UNICEF on the legal status of any country or territory or the delimitation of any frontiers. The dotted line represents approximately the Line of Control in Jammu and Kashmir agreed upon by India and Pakistan. The final status of Jammu and Kashmir has not yet been agreed upon by the Parties. The final boundary between the Republic of the Sudan and the Republic of South Sudan has not yet been determined. The final status of the Abyei area has not yet been determined.
Source: United Nations, Department of Economic and Social Affairs, Population Division, World Population Prospects: The 2010 revision, CD-ROM edition, 2011.
FIGURE 2.5

Socio-Demographic Profile of Adolescents 9
The number of adolescents in the world will increase slightly through 2050Population of adolescents 10–19 years old in millions, 1950–2050
figUre 2.7
0
200
400
600
800
1,000
1,200
1,400
World
Developing countries
Least developed countries
Industrialized countries
1950 20501960 1970 1980 1990 2000 2010 2020 2030 2040Po
pula
tion
in m
illio
ns
0
5
10
15
20
25
30
World
Developing countries
Least developed countries
Industrialized countries
1950 20501960 1970 1980 1990 2000 2010 2020 2030 2040
Po
pu
lati
on
in m
illio
ns
note: The 2050 population figures are projections.
source: United Nations, Department of Economic and Social Affairs, Population Division, World Population Prospects: The 2010 revision. CD-ROM edition, 2011.
Socio-Demographic Profile of Adolescents 9Socio-Demographic Profile of Adolescents 9
Sub-Saharan Africa is the only region
of the world in which the number of adolescents continues to grow significantly.
Socio-demographic profile of adolescents 9Socio-Demographic Profile of Adolescents 9Socio-Demographic Profile of Adolescents 9Socio-demographic profile of adolescents 9Socio-Demographic Profile of Adolescents 9
By 2050, sub-saharan Africa is projected to have more adolescents than any other regionPopulation of adolescents 10–19 years old in millions, by region, 1950−2050
AdolesCenT PoPUlATion groWTh in deVeloPing regions
0
50
100
150
200
250
300
350
400
450
1950
Sub-Saharan Africa
South Asia
CEE/CIS
East Asia and the Pacific
Latin Americaand the Caribbean
Middle East and North Africa
20501960 1970 1980 1990 2000 2010 2020 2030 2040
Popu
latio
n in
mill
ions
note: The 2050 population figures are projections.
source: United Nations, Department of Economic and Social Affairs, Population Division, World Population Prospects: The 2010 revision, CD-ROM edition, 2011.
figUre 2.8
The adolescent proportion of the world population was greatest around 1980Percentage of the world population, by age group
figUre 2.6
1950 1980
2010 2050
24% 24%
20% 21%
18% 14%
18%14%
56% 55%
64% 73%
Under 10 years old 10–19 years old 20+ years old
note: Values may not add to 100% because of rounding. The 2050 population figures are projections.
source: United Nations, Department of Economic and Social Affairs, Population Division, World Population Prospects: The 2010 revision, CD-ROM edition, 2011.
10 Progress for Children
South Asia
0% 10% 20% 30% 40% 50%
21
24
26
27
28
14
18
12
11
12
3
8
1
4
17
14
10
23
30
Sub-Saharan Africa
West andCentral Africa
Least developedcountries
Developing countries(excluding China)
Eastern andSouthern Africa
Latin Americaand the Caribbean
Middle East andNorth Africa
East Asia and thePacific (excluding China)
CEE/CIS
15 Married or in union between the ages of 15 and 18
Married or in union before age 15
nearly one third of adolescent girls in south Asia are married or in union Percentage of adolescent girls 15–19 years old who are currently married or in union, by region
figUre 2.9
Developing countries(excluding China)
Least developedcountries
CEE/CIS
East Asia and the Pacific(excluding China)
Middle East andNorth Africa
Latin America andthe Caribbean
Eastern andSouthern Africa
Sub-SaharanAfrica
West andCentral Africa
South Asia
0% 10% 20% 30%
30
28
24
19
18
15
11
7
29
22
More than one third of young women in the developing world were married as childrenPercentage of women 20–24 years old who were first married or in union before ages 15 and 18, by region
figUre 2.10
note: Estimates based on a subset of 104 countries, covering 92% of the 15–19-year-old female population of the developing world (excluding China, for which comparable data are not available). Regional estimates represent data from countries that cover at least 50% of the regional population. Data coverage was insufficient to calculate an average for industrialized countries.
source: UNICEF global databases, 2011, based on Demographic and Health Surveys (DHS), Multiple Indicator Cluster Surveys (MICS) and other national surveys, 2000–2010.
note: Estimates are based on a subset of 105 countries, covering 90% of the 20–24-year-old female population of the developing world (excluding China, for which comparable data are not available). Regional estimates represent data from countries that cover at least 50% of the regional population. Data coverage was insufficient to calculate an average for industrialized countries.
source: UNICEF global databases, 2011, based on DHS, MICS and other national surveys, 2000–2010.
third of these married by age 15 (see Figure 2.10). In the least developed countries, nearly half of women aged 20–24 were married before the age of 18.
Negative consequences of child marriage abound, particularly for girls. They may be cut off from their families, their formal education left behind. Their development – and the fulfillment of their human rights – may be compromised. There are also health concerns associated with child marriage, which often leads to adolescent childbearing. In developing coun-tries, more than 90 per cent of births to adolescents occur within marriage10 (see ‘Adolescent childbear-ing’, in Chapter 5, page 24).
Data for several countries suggest that women who marry as children are at risk of domestic violence (see Chapter 6, on violence).
Many adolescent girls who marry or enter into union do so, often against their will, with men who are much older. A 2005 analysis of Demographic and Health Sur-vey data indicates that the age difference between the spouses tends to be greater when women marry early
than when they marry at an older age.11 Available data show that in the Gambia and Sierra Leone, more than half of girls aged 15–19 who are currently married or in union are with a man who is at least 10 years older.12
Marriages of girls to much older men are most prevalent in West African countries, but they also occur in other regions. Survey data from Bangladesh (2006), for example, indicate that 32 per cent of girls aged 15–19 are married or in union with a man 10 or more years their senior.13 (The actual percentage may be higher; in some surveys, large proportions of girls said they did not know their husband’s or partner’s age.)
A large age difference between spouses may affect the power relations within the marriage and make the young wife more vulnerable to violence and abuse. In addition, women with much older hus-bands are more likely to become widows, which may create economic instability and negatively affect their social status. Marrying older partners can also increase girls’ risk of HIV in countries with generalized HIV epidemics.14

Socio-demographic profile of adolescents 11
Adolescents’ interactions with media are constantly evolving. In developing countries, however, 28 per cent of girls and 17 per cent of boys aged 15–19 do not watch television, listen to the radio or read a newspaper on a weekly basis. Among adolescents who do use media, the most common form is television, with more than half of all boys and girls aged 15–19 in developing countries watching television at least once a week (see Figure 2.11).
Globally, access to information and communication technology (ICT) has improved for the general popula-tion.15 Yet, data on adolescent access to and use of ICTs are minimal, and standards and definitions that would aid data analysis and comparison across countries are lacking.
Overall, the available data suggest that Internet use is more likely with higher income and education, and more men than women use the technology in both industrial-ized and developing countries. Data also indicate a deep urban/rural divide, with urban dwellers more likely to log on. Internet use is also more common among people who are currently in school.16
In all countries with data, a higher proportion of people under age 25 use the Internet than people over age 25.17 In a few countries for which these data are further disaggre-gated by age group, youth aged 15–24 are generally more likely to use the Internet than adolescents aged 10–14 (see Figure 2.12). The gap in usage is narrower in economies in transition and in industrialized countries.
The profile of Internet usage is similar to that of mo-bile phone usage (see Figure 2.13). With the number of people forecast to be using mobile devices to access the Internet growing from 14 million in 2010 to 788 million by 2015, it is important to understand how adolescent users fit into this picture.18
Young people’s use of social media such as Facebook, Orkut in Brazil and India, RenRen in China and VK in the Russian Federation has grown exponentially over the past few years. In South Africa, nearly half the 44 million users of the MXit mobile phone-based network are aged 18–25, and fully one quarter are aged 13−17.19
The use of ICTs can enable access to information, foster the expression of ideas on a large scale and help adoles-cents connect with others; but it carries such risks as ex-posure to inappropriate content, unwelcome contact from others or the possibility of engaging in inappropriate conduct themselves.20 It is necessary to support children’s capacity to cope with such risks, thereby building their resilience as digital citizens.
Use of information and communication technology
0%
10%
20%
30%
40%
50%
60%
4142
555660
17
28
21
Adolescent boysAdolescent girls
Watches TV atleast once
a week
Listens tothe radio atleast once
a week
Reads anewspaperor magazine
at leastonce a week
Does not watch TV,listen to the radio
or readnewspapersor magazines
Television is the most commonly used form of media among adolescents in developing countriesPercentage of adolescents 15–19 years old who make use of specified media on a weekly basis, by sex
figUre 2.11
note: Estimates are based on subsets of 44 countries with available data covering 51% of the male population 15−19 years old and 56 countries with available data covering 66% of the female population 15−19 years old in the developing world (excluding China, for which comparable data are not available).
source: UNICEF global databases, 2011, based on DHS and other national surveys, 2000–2010.
Adolescents’ use of the internet varies across countries … Percentage of adolescents 10–14 years old and percentage of young people 15–24 years old who used the Internet from any location in the past 12 months, in selected countries and territories with available data
figUre 2.12
98
0%
20%
40%
60%
80%
100%
3029
1625
12
65
99
51
64
97 9910–14 years old15–24 years old
Paraguay El Salvador OccupiedPalestinian
Territory
Brazil Germany Slovenia
source: International Telecommunication Union, World Telecommunication/ICT Indicators Database, 2008–2010.
… as does adolescents’ use of mobile phones Percentage of adolescents 10–14 years old and percentage of young people 15–24 years old who used a mobile cellular telephone in the past 12 months, in selected countries and territories with available data
figUre 2.13
99
0%
20%
40%
60%
80%
100%
7576
37
57
9
9891
97
77
10–14 years old15–24 years old
El SalvadorOccupiedPalestinian
Territory
Brazil Germany Slovenia
source: International Telecommunication Union, World Telecommunication/ICT Indicators Database, 2008–2010.

12 Progress for Children
deed expanded in many countries: Approximately 531 million students were accommodated in secondary education in 2009, compared to 196 million in 1970.22
Yet secondary school enrolment remains low in the developing world, particularly in countries of Africa and Asia (see Figure 3.1). Many pupils of secondary
secondary educationSome 90 per cent of primary-school-aged children are enrolled in primary school worldwide, despite chal-lenges in some countries and regions.21 This success in moving towards universal primary education since 1990 has led to a growing demand for post-primary education, and secondary education systems have in-
MDG 1 – eradicate extreme poverty and hunger – has as its second target full and productive employment and decent work for all, including women and young people. MDG 2 – achieve universal primary education – is the basis for the further education and literacy that are necessary to prepare adolescents and young people for this ‘decent work’ as well as for their civic participation. And MDG 3 – promote gender equality and empower women – makes it possible for adolescent girls and boys to share equally in the benefits of goals 1 and 2.
edUCATion And WorKrelATed To Mdg 1, Mdg 2 And Mdg 33
secondary school enrolment is very low in countries of Africa and Asia Secondary school net enrolment/attendance ratio
figUre 3.1
note: This map is stylized and not to scale. It does not reflect a position by UNICEF on the legal status of any country or territory or the delimitation of any frontiers. The dotted line represents approximately the Line of Control in Jammu and Kashmir agreed upon by India and Pakistan. The final status of Jammu and Kashmir has not yet been agreed upon by the Parties. The final boundary between the Republic of the Sudan and the Republic of South Sudan has not yet been determined. The final status of the Abyei area has not yet been determined.
note: The net enrolment ratio (NER) is used for all countries with available data. For countries where NER was unavailable, the net attendance ratio (NAR) is used. The availability of net enrolment/attendance data differs from the availability of gross enrolment/attendance data; this accounts for differences between Figures 3.1 and 3.2.
source: NER: UNESCO Institute for Statistics, 2011. Data refer to 2009 or latest year available. NAR: UNICEF global databases, 2011, based on DHS and MICS, 2005–2010.

Education and work 13
figUre 3.2
gender parity has not been reached at the secondary level Gender parity index (GPI) of secondary school gross enrolment/attendance ratio
school age are in primary school, having entered school late or repeated grades; thus overage is a significant part of the challenge in addressing the educational needs of adolescents.
Globally, 60 per cent of secondary-school-aged children are enrolled in secondary school. In sub-Saharan Africa and the least developed countries, fewer than one third are enrolled. And even where national secondary enrol-ment ratios are high, disparities within countries may be an issue.
Gender parity – where the percentage of girls enrolled in or attending school is equal to the percentage of boys – has been reached in primary education in most countries. But gender parity at the secondary level is lagging behind (see Figure 3.2).
Overall, a greater percentage of boys than girls are in secondary school in most developing countries and most regions, and only CEE/CIS, East Asia and the Pacific, and North Africa have achieved gender parity at the secondary level.23 In these regions, however, Cambodia, Lao People’s Democratic Republic, Morocco, the Solomon Islands and Turkey stand out as exceptions – gender parity has not yet been achieved in these coun-
tries, and girls are disadvantaged. More girls than boys are likely to be enrolled in secondary school in Latin America and the Caribbean.
The primary to secondary school transitionIn many countries there is a drop-off in enrolment between primary and lower secondary education, and between lower and upper secondary education. Particularly in sub-Saharan Africa, drop-off is high between the primary and lower secondary levels. Globally, the lower secondary gross enrolment rate was 80 per cent in 2009, whereas the upper secondary gross enrolment rate was 56 per cent.24
In sub-Saharan Africa, girls are less likely than boys to be enrolled at both levels of secondary education. In Latin America and the Caribbean, there is near parity between girls and boys at the lower secondary level, but girls are more likely to be enrolled than boys at the upper secondary level.
A recent report from UNESCO found that around 71 million children of lower secondary school age were out of school,25 although many of these
note: This map is stylized and not to scale. It does not reflect a position by UNICEF on the legal status of any country or territory or the delimitation of any frontiers. The dotted line represents approximately the Line of Control in Jammu and Kashmir agreed upon by India and Pakistan. The final status of Jammu and Kashmir has not yet been agreed upon by the Parties. The final boundary between the Republic of the Sudan and the Republic of South Sudan has not yet been determined. The final status of the Abyei area has not yet been determined.
note: The gross enrolment ratio (GER) is used for all countries with available data. For countries where GER was unavailable, the gross attendance ratio (GAR) is used. The availability of net enrolment/attendance data differs from the availability of gross enrolment/attendance data; this accounts for differences between Figures 3.1 and 3.2.
source: GER: UNESCO Institute for Statistics, 2011. Data refer to 2009 or latest year available. GAR: UNICEF global databases, 2011, based on DHS and MICS, 2005–2010.

14 Progress for Children
figUre 3.3
children reside in countries where education at this level is compulsory.
The gap in lower secondary school completion rates between sub-Saharan Africa and the rest of the world appears to be widening.26 In fact, sub-Saharan Africa has the worst secondary education indicators of any region: Its level of enrolment of secondary-school-aged children is the lowest, as are its rates of secondary school completion, and it has fewer girls enrolled than boys.
Low secondary school enrolment stems in part from low primary school completion. In sub-Saharan Africa, only 47 per cent of 15–19-year-old girls and 52 per cent of 15–19-year-old boys have completed primary school (see Figure 3.3 for percentages in selected countries).27
The effective transition rate measures the probability that a student in the last grade of primary school will
enrol in the first grade of secondary school. Many industrialized countries and many countries in CEE/CIS, the Middle East and North Africa, and Latin America and the Caribbean have primary-to-secondary school transition rates of nearly 90 per cent or above. In the least developed countries, three fourths of children who complete primary school make the transition to secondary school.28
Behind the regional averages, however, are wide variations in primary-to-secondary school transition rates. In sub-Saharan Africa, rates range from as low as 36 per cent in the United Republic of Tanzania to as high as 98 per cent in Botswana.29 The transition rate does not reflect whether primary completion in the country is high or low, nor does it reflect such quality indicators as age in grade.
National averages often mask disparities, particularly in middle-income regions. For example, a 2006 study
0% 10% 20% 30% 40% 50% 60%
Rwanda
Burundi
Niger
Somalia
Guinea-Bissau
Senegal
Burkina Faso
Ethiopia
Mozambique
Central African Republic
Liberia
Uganda
Mauritania
Guinea
Madagascar
Côte d’lvoire
Malawi
Benin
Adolescent boys
Adolescent girls1414
1318
1221
1627
2027
2130
27
22
30
30
3034
2435
3136
3338
3636
2439
4644
3245
3856
4746
note: The primary completion rate is the percentage of the population 15–19 years old who have completed primary school.
source: UNICEF global databases, 2011, based on DHS, MICS and other national surveys, 2005–2010.
in sub-saharan Africa, primary school completion rates are lowPrimary school completion rates among adolescents 15–19 years old in selected sub-Saharan African countries with total completion rates below 50%, by sex

In most sub-Saharan African countries,
girls are less likely than boys to complete secondary school.
0% 5% 10% 15% 20% 25% 30% 35% 40%
Niger
Mali
Rwanda
Burkina Faso
Guinea
Mozambique
Madagascar
Ethiopia
Senegal
Benin
Liberia
Sierra Leone
DemocraticRepublic
of the Congo
Malawi
Congo
Namibia
Swaziland
Chad
United Republicof Tanzania
Kenya
Ghana
Lesotho
Young men0.4
1
14
4
2
4
25
52
3
6
7
6
411
117
11
1710
1019
1118
7
820
2522
9
20
32
5
66
27
25
19
33
34
35
37
Young women
BENIN
11%Secondary school completion rate
Secondary school completion rate
BENIN
Secondary school completion
rate
Secondary school Secondary school Secondary school completion completion
4%
NAMIBIA
20%Secondary school completion rate
Secondary school completion rate
NAMIBIA
Secondary school completion
rate
Secondary school Secondary school Secondary school Secondary school Secondary school Secondary school completion
8%
Note: The secondary school completion rate is the percentage of the population 20–24 years old who have completed secondary school.
Source: UNICEF global databases, 2011, based on DHS, MICS and other national surveys, 2003–2010.
In sub-Saharan Africa, secondary school completion rates are lowSecondary school completion rates among young people 20–24 years old in selected sub-Saharan African countries with total completion rates below 40%, by sex
FIGURE 3.4
Education and work 15
SECONDARY EDUCATION IN SUB-SAHARAN AFRICA
CHAD
9%Secondary school
completion rate
Secondary school completion rate
32%CHAD
16 Progress for Children
of Roma children in south-eastern Europe found they were only one fifth as likely as other children to make the transition from primary to secondary school.30
In most countries, gender does not seem to have an impact on transition from primary to secondary school.31 Thus in regions where secondary school enrolment is low, the focus needs to be on getting all students – both boys and girls – to complete primary school and make the transition to second-ary school.
secondary school completionWith returns on investment in secondary school greater for girls than for boys in developing coun-tries,32 obtaining a secondary education is particu-larly important for girls. However, girls are less likely than boys to complete secondary school in most sub-Saharan African countries. In 14 sub-Saharan African countries, secondary school completion rates for women aged 20–24 are under 10 per cent (see Figure 3.4). Regionwide, some 21 per cent of young women and 28 per cent of young men have completed secondary school.
Through secondary education, adolescents expand their skills and ability to think critically, which can translate into increased opportunities in the future; education also shapes the attitudes, values and aspirations that affect adolescents’ ability to function as members of their families, communities and societies. Secondary education thus prepares adolescents for adult civic engagement as well as gainful employment.
non-formal educationNon-formal education can occur within or outside of formal schools; it can include life skills, work skills and adult literacy training, as well as basic education for out-of-school children. Such educa-tion can either complement formal schooling or serve as an alternative to it. For disadvantaged girls, non-formal education is often the main route to learning.33
There is some evidence to suggest that the number of adolescents enrolled in non-formal programmes may be fairly significant. Yet enrolment in non-formal education is not captured in most countries’ enrol-ment data, and few non-formal programmes have been evaluated.34 More remains to be known about the effects of non-formal schooling on adolescents and, in particular, on girls in terms of what they learn and how they are prepared for adulthood.
Youth literacyThe literacy rate of youth aged 15–24, an MDG 2 indicator, rose from 83 per cent in 1990 to 89 per cent in 2009 (female: 86 per cent, male: 92 per cent).35 This increase parallels the expansion of universal primary education over the same time period. Youth literacy is consistently high in most countries of Latin America, and low or varied in sub-Saharan Africa and South Asia.
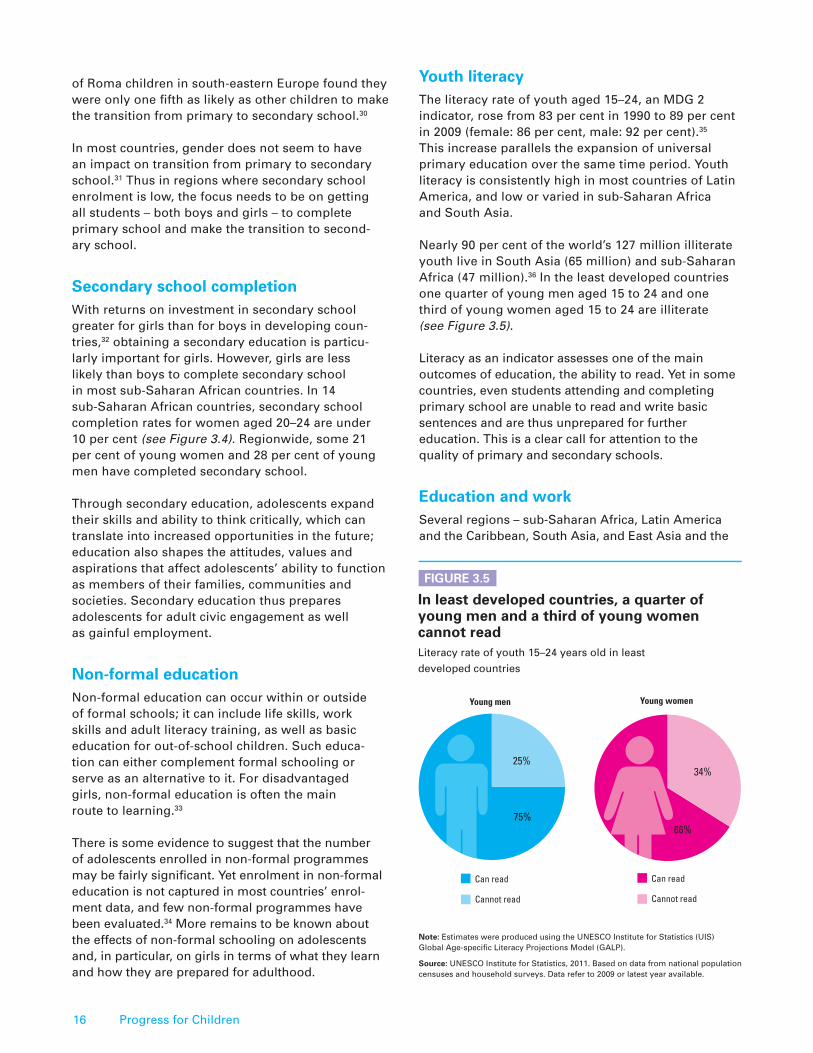
Nearly 90 per cent of the world’s 127 million illiterate youth live in South Asia (65 million) and sub-Saharan Africa (47 million).36 In the least developed countries one quarter of young men aged 15 to 24 and one third of young women aged 15 to 24 are illiterate (see Figure 3.5).
Literacy as an indicator assesses one of the main outcomes of education, the ability to read. Yet in some countries, even students attending and completing primary school are unable to read and write basic sentences and are thus unprepared for further education. This is a clear call for attention to the quality of primary and secondary schools.
education and workSeveral regions – sub-Saharan Africa, Latin America and the Caribbean, South Asia, and East Asia and the
in least developed countries, a quarter of young men and a third of young women cannot readLiteracy rate of youth 15–24 years old in least developed countries
note: Estimates were produced using the UNESCO Institute for Statistics (UIS) Global Age-specific Literacy Projections Model (GALP).
source: UNESCO Institute for Statistics, 2011. Based on data from national population censuses and household surveys. Data refer to 2009 or latest year available.
figUre 3.5
Can read
75%
25%
66%
34%
Young men Young women
Cannot read
Can read
Cannot read

countries, unemployment rates are higher among bet-ter-educated youth than less educated youth, because there are more of them than there are formal-sector jobs.40 Youth in developing countries are thus dispro-portionately affected by unemployment, and, among them, educated youth are doubly affected.
Vocational or technical training may be one way to smooth the school-to-work transition and provide a second chance for those who have emerged from school without the knowledge and skills to get what jobs are available. Experience in Latin America and the United States points to such training as an effective way to reach marginalized youth who have dropped out of school, helping them re-enter the education system.41 Vocational training is not without challenges, however, including those related to cost.
Adolescent labourThe younger a working adolescent is, the greater the possibility that he or she is involved in the type of work that can be defined as child labour or hazardous labour. Working can undermine adolescents’ educa-tion and health and can have an impact on their future livelihood choices and earning potentials.
Adolescents may engage in child labour because poverty compels them to help support their families. Thus they search for income-generating opportuni-ties – but they do not yet have skills or qualifications. Those adolescents who must work should be able to combine schooling and work. Yet many working adolescents forgo formal school because it does not fit into their daily lives.
The International Labour Organization (ILO) estimated that in 2008 nearly 60 per cent of the 215 million children engaged in child labour were aged 12–17.42 Boys are typically engaged in hazardous labour, such as in agriculture or industry, with higher rates of injury in such work than older workers. Girls are typically in-volved in domestic work, with potential risks of abuse, mistreatment and limited education opportunities.
Pacific – have a narrow gender gap in school atten-dance rates by age. All but sub-Saharan Africa, howev-er, have a widening gender gap in labour force partici-pation. In sub-Saharan Africa, the problem is different: a very low rate of labour force participation on the part of both young women and young men.37
Youth participation in the labour force depends on the labour market, as well as on educational attainment. Education itself provides individuals and societies with the benefits of wage earnings and economic growth, in addition to such non-market benefits as reduced fertility and mortality, increased civic engagement and lower crime.
Young people today are the most educated genera-tion ever, yet their prospects for getting jobs are often uncertain. Particularly since 2007, the rate of youth unemployment has risen, with around 75 million youth aged 15–24 now unemployed – 12.6 per cent of the labour force in this age group.38
In all regions except East Asia, young women have lower rates of labour force participation than young men, reflecting both social mores and the difficulty for young women to combine family and work responsibil-ities. While this gender gap in labour force participation has decreased in most regions, it is still pronounced in South Asia. In the Middle East and North Africa it has actually widened.39
In some middle income countries in particular, learning content and processes are often not aligned with opportunities on the labour market, thus many adolescents who complete their education do not find employment. This in turn contributes to increased rates of school drop-out: Adolescents see few job prospects, thus they lose their motivation to finish secondary school.
In most industrialized countries, education serves as a springboard towards secure employment, with youth who are less educated facing higher unemployment rates than their better-educated peers. But in developing
Education and work 17

18 Progress for Children
Higher immunization levels and better child nutrition – thanks to decades of investments in early childhood health and well-being – have resulted in a steep decline in the spread of communicable diseases that primarily affect young children, which is related to MDG 4. Many children have survived to adolescence because of these advances. They are also healthier overall because of them.
Yet over the past 50 years, adolescents have benefited less than younger children from the ‘epidemiological transition’ that has reduced all-cause mortality among children and young people aged 1–24. A 2011 review of trends in mortality in 50 countries revealed that, between 1955 and 2004, mortality declined significantly less for adolescents than it did for children under 10.43
Behaviours often established in adolescence – such as using tobacco, alcohol and drugs; having unprotected sex; and avoiding physical activity – along with conditions such as exposure to violence, account for two thirds of premature deaths and one third of the total disease burden in adults.44 Clearly, adolescence is an important time in which to consol-idate the promise of better child health and translate
4 relATed To Mdg 4
AdolesCenT MorTAliTY, MorBidiTY And heAlTh-relATed BehAVioUrs
0 50 100 150 200 250250 200 150 100 50 0
World
Least developed countries
Developing countries
Industrialized countries
East Asia and the Pacific
CEE/CIS
Latin America and the Caribbean
Middle East and North Africa
South Asia
Eastern and Southern Africa
West and Central Africa
DALYs per 1,000 adolescent boys DALYs per 1,000 adolescent girls
Injuries
Other communicable diseases
Neuropsychiatric disorders
HIV, TB and malaria
Other non-communicable diseases
Maternal conditions
figUre 4.1
injuries and neuropsychiatric disorders are major causes of mortality and morbidity among adolescents in all regionsMajor causes of disease burden in disability-adjusted life years (DALYs) per 1,000 adolescents 10–19 years old, by region and by sex
note: Neuropsychiatric disorders include depression, bipolar disorder, anxiety/panic disorders (including post-traumatic stress disorder and obsessive-compulsive disorder), psychotic disorders (including schizophrenia), seizure disorders (including epilepsy and Parkinson’s disease) and alcohol and drug-use disorders.
Disability-adjusted life years (DALYs) are a summary measure combining years of life lost because of premature mortality (YLLs) and years lost because of disability (YLDs) for incident cases of the disease or injury. One DALY represents the loss of the equivalent of one year of full health. Population data are for the year 2004. The data have been recalculated according to UNICEF regional classification.
source: WHO, The Global Burden of Disease: 2004 update, 2008, and United Nations Department of Economic and Social Affairs, Population Division, World Population Prospects: The 2010 revision, CD-ROM edition, 2011.

Adolescent mortality, morbidity and health-related behaviours 19
it into lasting good health for adolescents and the adults they will become.
Adolescent mortality and causes of deathEach year, 1.4 million deaths occur among 10–19-year-olds.45 Injuries are leading causes of death in adoles-cents and young people. These include road traffic injuries; injuries such as falls, burns, poisoning and drowning; and injuries from violence, including armed violence.
Complications related to pregnancy and childbirth ac-count for the deaths of some 50,000 adolescent girls each year and are among the leading causes of death in girls of this age group.46
A look at which adolescents are dying of what, and where, provides a glimpse of the disparate challenges in keeping all adolescents healthy. In Africa, childbirth is the leading killer of adolescent girls, with maternal causes accounting for the largest proportion of deaths among women in all age groups.47 In middle- and high-income countries, cars are the biggest killers, with road traffic injuries a leading cause of death among adolescent girls.48
Suicide is a leading cause of death among adolescents worldwide.49 Three countries of the CEE/CIS region – Belarus, Kazakhstan and the Russian Federation – have the highest rates of adolescent suicide in the world.50
Until age 10, mortality is not differentiated substantially by sex. As children become adolescents, however, sex begins to play a role and mortality patterns diverge.51 In developing countries, boys become more vulnerable to road traffic injuries and violence, and maternal causes become prominent in mortality among girls.
The risk of death increases as adolescents grow older. The mortality rate for adolescents aged 10–14 was 95 deaths per 100,000 persons (the lowest of any age cohort) in 2004. Among 15–19-year-olds it was 139 per 100,000 persons, and among 20–24-year-olds, 224.52
Adolescent burden of diseaseInjuries and neuropsychiatric disorders are major causes of mortality and morbidity among adolescents in all regions (see Figure 4.1).
From early to late adolescence and young adulthood, there is a shift in the risk factors for the leading causes of morbidity and mortality. For example, both environ-mental causes and behavioural factors are prominent among adolescents aged 10–14. Risks related to
individual behaviours, including alcohol use and unsafe sex, are more common for youth aged 15–24, while environmental causes become less relevant, particularly among boys.53
In Eastern and Southern Africa, one of the greatest risk factors for 10–14-year-olds, both boys and girls, is unsafe sex, which sets this region apart from the others in terms of key risk factors for this younger age group. Unsafe sex is the most common risk factor for 15–24-year-olds in this region, but the risk for females is nearly double that for males. In the younger age group (10–14), it is just slightly higher for girls than for boys.54
Adolescent mental healthEach year, an estimated 20 per cent of adolescents experience a mental health problem, most commonly major depression or other disturbances of mood.55 Mental health problems in adolescence, if unad-dressed, can carry over and negatively affect individu-als over the long term. A major depression experienced for the first time in adolescence, for example, can persist or recur through adulthood. Suicide is often associated with mental health problems, although it also stems from difficulties within the family.56
figUre 4.2
in 11 countries, more than one fifth of adolescent girls are overweight Proportion of adolescent girls 15–19 years old whose body mass index is above 25
0%
10%
20%
30%
40%
24
Turkey Egypt Jordan Swazi-land
Maldives Bolivia(Pluri-
nationalState of)
SierraLeone
Brazil Honduras Peru Lesotho
30
2423
22
37
22
36
212120
note: Analysis based on 58 countries with available data.
source: UNICEF global databases, 2011, based on DHS 2005–2010; data were reanalysed by UNICEF.

20 Progress for Children
PreVAlenCe of UnderWeighT AMong AdolesCenT girls
The prevalence of underweight among
adolescent girls 15−19 years old in some South Asian countries is very high.
in 11 countries, more than a quarter of adolescent girls are underweightPercentage of adolescent girls 15−19 years old whose body mass index is below 18.5
is very high. is very high. is very high. is very high. is very high. is very high. is very high. is very high. is very high.
0%
10%
20%
30%
40%
50%
India Bangladesh Niger Senegal Timor-Leste Ethiopia Namibia Madagascar Cambodia Nepal DemocraticRepublic of the Congo
47
35 34 34 33 3330
28 2826 25
47%AdolesCenT girls Are UnderWeighT
indiA
AdolesdolesArere
35%AdolesCenT girls Are UnderWeighT
BAnglAdesh
AdolesdolesdolesAAAre U
26%AdolesCenT girls Are UnderWeighT
nePAl
AdolesAre
note: Analysis based on 64 countries with available data.
source: UNICEF global databases, 2011, based on DHS 2005–2010; data were reanalysed by UNICEF.
In most developing countries, however, few mental health services or resources are available for adoles-cents and young people. Mental health professionals are often in short supply, and non-specialist health workers may not be able or motivated to provide qual-ity mental health services to young people. The stigma associated with mental disorders is a further challenge to addressing mental health needs.57
Adolescent nutritionBoth undernutrition and obesity or overweight are problems among adolescents in low- and middle- income countries (see Figure 4.2, on page 19).
Nearly 50 per cent of adolescent girls aged 15–19 in India are underweight, with a body mass index of less
than 18.5, and more than one quarter are underweight in 10 other countries (see Figure 4.3). Such undernu-trition renders adolescents vulnerable to disease and early death and has lifelong health consequences. In adolescent mothers, undernutrition is related to slow fetal growth and low birthweight.
Anaemia, most commonly iron-deficiency anaemia, increases the maternal risk of haemorrhage and sepsis during childbirth. It causes cognitive and physical deficits in young children and reduces productivity in adults. Women and young children are most vulner-able to anaemia due to insufficient iron in their diets, ongoing blood loss and periods of rapid growth.
In 21 out of 41 countries with data, more than one third of girls aged 15–19 are anaemic (see Figure 4.4).
figUre 4.3

Adolescent mortality, morbidity and health-related behaviours 21
Mild
Moderate
Severe
0% 10% 20% 30% 40% 50% 60% 70%
Mali
Senegal
Ghana
Benin
Congo
India
Sao Tome and Principe
Guinea
Sierra Leone
Cambodia
Democratic Republic of the Congo
Haiti
Niger
Egypt
Uganda
United Republic of Tanzania
Nepal
Bolivia (Plurinational State of)
Cape Verde
Madagascar
Zimbabwe
47 19 2
45 18 3
44 18 2
42 16 1
42 14 1
42 8 1
41 7
39 15 2
36 9
36 12 2
34 12 2
33 10
32 16
32 7
32 9 1
30 7 1
30 5
30 15 1
29 5 1
29 18 4
26 8 Severe public health problem
in 21 countries, more than one third of adolescent girls are anaemic Proportion of adolescent girls 15–19 years old who are anaemic
figUre 4.4
note: Analysis based on 41 countries with available data. The vertical line at the 40% mark represents the threshold at which anaemia is considered a severe national public health issue.source: UNICEF global databases, 2011, based on DHS 2005–2010; data were reanalysed by UNICEF.
As with tobacco, many people’s first exposure to alco-hol is during adolescence. In almost half the countries with available data, about one in four adolescents aged 13–15 reported having had an alcoholic drink sometime within the past month (see Figure 4.6). Boys are more likely to report past alcohol consumption than girls in most of the countries surveyed, with the exception of a few countries in Latin America and the Caribbean and sub-Saharan Africa. Harmful or excessive alcohol use can lead to alcohol addiction and dependence, injuries, cirrhosis and cancer.
The United Nations Office on Drugs and Crime (UNODC) estimates that between 149 and 272 mil-lion people aged 15–64 used illicit substances at least once in 2009.59 Many adolescents begin drug use by experimenting with marijuana, seen as a ‘soft’ and non-lethal drug. In surveys, adolescent boys aged 13–15 were more likely than adolescent girls of the same age to report having used drugs at least once in most of the countries with available data (see Figure 4.7).
One of the consequences of drug use among ado-lescents is increased risk of HIV infection. In seven countries (Armenia, Bangladesh, Georgia, Kazakhstan, Kyrgyzstan, the Philippines and Tajikistan), HIV inci-dence increased by more than 25 per cent between 2001 and 2009, largely owing to injecting drug use and unprotected sex among key populations, in all cases including adolescents.60
Anaemia prevalence is highest in Mali, where more than two thirds of girls aged 15–19 are anaemic. Anaemia is a severe public health problem in 16 countries, the largest number of cases being found in India, where more than half of girls aged 15–19 are anaemic.
Tobacco, alcohol and drugsMany people have their first experiences with tobacco, alcohol and illicit drugs during adolescence, partly out of a need to explore boundaries as they begin to devel-op their individuality. These are risky behaviours that can have a negative impact on adolescent health and well-being and bring lifelong negative consequences. Abuse of these substances is also associated with poor mental health.58
Addiction to tobacco often begins in adolescence, when young people are susceptible to peer pressure and feel a need to fit in. Tobacco smoking among adolescents can lead to such diseases as lung cancer and chronic respiratory infections in adults.
The available data show that Latin America and the Caribbean is the region with the highest prevalence of adolescent tobacco use – 26 per cent of boys and 25 per cent of girls aged 13–15 surveyed reported they had used tobacco during the past month (see Figure 4.5). In other regions, adolescent boys were consistently more likely to report tobacco use than adolescent girls.

22 Progress for Children
Adolescent boysAdolescent girls
0% 10% 20% 30%
Latin America and the Caribbean
West and Central Africa
Middle East and North Africa
Sub-Saharan Africa
CEE/CIS
South Asia
Eastern and Southern Africa
East Asia and the Pacific
Least developed countries
Developing countries
2625
2215
2110
1913
1913
178
1712
15
18
6
10
1117
0% 10% 20% 30% 40% 50% 60% 70%
Seychelles
Jamaica
Antigua and Barbuda
Suriname
Swaziland
Ghana
Philippines
Fiji
Solomon Islands
Guatemala
Uganda
Malawi
Tajikistan
The former YugoslavRepublic of Macedonia
6261
5847
4446
4131
363030
1426
2923
1522
1121
1318
1414
125
310.4
Adolescent boys
Adolescent girls
About 1 in 4 adolescents report drinking alcohol during the past month in nearly half of countries surveyedPercentage of students 13–15 years old who had at least one drink containing alcohol on one or more days during the past 30 days, in a random selection of countries with available data, by sex
note: Comparable data are available for a larger number of coun-tries, but because of space constraints, only a random selection is presented here. The legal drinking age varies across countries.Respondents were asked how many drinks they had consumed in the past 30 days but were told not to consider drinking a few sips of wine (or relevant country example) for religious purposes as a drink. Respondents participating in surveys conducted after 2008 were informed that a ‘drink’ was defined as a glass of wine, a bottle of beer, a small glass of liquor or a mixed drink.
source: WHO, Global School-based Student Health Survey, 2003–2011.
note: Estimates are based on a subset of 158 countries covering 99% of both the male and female populations aged 13–15 years in the developing world. Regional estimates represent data from countries that cover at least 50% of the regional population. Data coverage was insufficient to calculate an average for industrialized countries.
source: World Health Statistics 2011, based on data from WHO/CDC Global Youth Tobacco Surveys from 2000–2010, reanalysed by UNICEF.
Tobacco use among young adolescents is highest in latin America and the CaribbeanPercentage of adolescents 13–15 years old who have used tobacco in any form in the past 30 days, by region and by sex
figUre 4.6
figUre 4.5
figUre 4.7
Adolescent boys are more likely than adolescent girls to report using drugsPercentage of students 13–15 years old who used drugs one or more times during their life, in a random selection of countries with available data, by sex
0% 10% 20% 30% 40%
10.3
21
21
62
83
117
112
133
Indonesia
Tajikistan
Senegal
Tunisia
Mauritius
105
Swaziland
Uruguay
Thailand
Botswana
Kenya
Trinidad and Tobago
Saint Vincent andthe Grenadines
Namibia
Zambia
1413
1510
2713
3127
3739
Adolescent boys
Adolescent girls
note: Comparable data are available for a larger number of countries, but because of space constraints, only a random selection is presented here. Students surveyed were provided with examples of drugs relevant to their countries.
source: WHO, Global School-based Student Health Survey, 2003–2008.

Adolescent sexual behaviour, childbearing and maternal health, and HIV 23
Adolescent sexual behaviourAmong adolescents 15−19 years old in the developing world (excluding China), a higher percentage of girls (11 per cent) than boys (5 per cent) had sex before the age of 15. This pattern is seen in all regions with avail-able data (see Figure 5.1). In Latin America and the Caribbean, 17 per cent of girls had sex before the age of 15. Early sex can result in early childbearing, and it increases the risk of HIV infection.
The contraceptive prevalence rate and unmet need for family planning are two MDG 5 indicators related to the target of universal access to reproductive health. In sub-Saharan Africa, contraceptive use is low among women who are married or in union and even lower among married adolescent girls between the ages of 15 and 19. Many of these young married women may choose not to use contraception because they wish to have a child. Others do not wish to have a child, and among these, fully one quarter have an unmet need for family planning.61
A related indicator, condom use during higher-risk sex, refers to condom use during last sex with a non-marital, non-cohabiting partner and is used to assess progress towards the MDG target on HIV and AIDS. Global aver-ages remain low. In only three countries with an adult
Adolescence is the period when many young people begin to explore their sexuality, so access to sexual and reproductive health information and services is necessary for their well-being. MDG 5 – improve maternal health – is important to adolescents because 11 per cent of births worldwide occur to adolescent girls. Early childbirth curtails education and other opportunities for all adolescent girls and can be dangerous for the youngest among them.
MDG 6 – combat HIV/AIDS, malaria and other diseases – is important for adolescent boys and girls, because millions of those who are becoming sexually active live in countries with a high HIV burden. At the same time, many adolescents inject drugs or live in settings with concentrated HIV epidemics; their age and their social or economic status may limit their access to information and services. Some 2.2 million adolescents 10–19 years old are living with HIV globally, 1.8 million in sub-Saharan Africa.
AdolesCenT seXUAl BehAVioUr, ChildBeAring And MATernAl heAlTh, And hiV5relATed To Mdg 5 And Mdg 6
Adolescent girls are more likely than adolescent boys to have sex before age 15Percentage of adolescents 15–19 years old who had sex before age 15, by region and by sex
note: Estimates are based on a subset of countries with available data. This analy-sis included 48 countries with data on males and 77 countries with data on females, representing 48% and 63% of the respective male and female populations aged 15–19 in the developing world (excluding China, for which comparable data are not available). Regional estimates represent data from countries covering at least 50% of the regional population. Data coverage was insufficient to calculate averages for East Asia and the Pacific, the Middle East and North Africa, CEE/CIS, Latin America and the Caribbean (ad-olescent boys), least developed countries (adolescent boys) and industrialized countries.
source: UNICEF global databases, 2011, based on AIS, DHS, MICS and other national surveys, 2005–2010.
Latin Americaand the Caribbean
0% 5% 10% 15% 20%
17
168
1410
1211
83
14
115
West andCentral Africa
Sub-SaharanAfrica
Eastern andSouthern Africa
South Asia
Least developedcountries
Developingcountries
(excluding China)
Adolescent girls
Adolescent boys
figUre 5.1

24 Progress for Children
Indeed, in developing countries, 90 per cent of births to adolescents are within marriage. Almost all adoles-cent births occur within marriage in Asian and North African countries, as do around 70–80 per cent in sub-Saharan Africa and Latin America and the Caribbean.63
The adolescent birth rate (the number of births per 1,000 women aged 15–19) has declined in almost all regions since 1990, as has the birth rate among women overall. Since 2000, however, the decline in the adolescent birth rate has slowed or, in some regions, reversed.64 Yet, adolescent birth rates remain high. At 123 births per 1,000, sub-Saharan Africa today has the highest adolescent birth rate, and this has shown almost no decline since 1990.
Globally, each year around 16 million girls aged 15–19 give birth, accounting for around 11 per cent of all births.65 Countries of Latin America and the Caribbean and sub-Saharan Africa have the highest proportion of adolescent births: In both regions, around one in five babies is born to an adolescent mother (see Figure 5.3).
Approximately 95 per cent of adolescent births occur in low- and middle-income countries.66 Bangladesh, India and Nigeria alone account for one in every three of the world’s adolescent births. The only industrialized country among the top 10 countries with the highest number of adolescent births is the United States.67
One measure of early childbearing is the percentage of young women aged 20–24 who gave birth by age 18, a retrospective indicator. More than one in four women in sub-Saharan Africa has given birth before age 18.68
Still, there are differences among countries at the re-gional level. Within the West and Central Africa region, for example, 51 per cent of women aged 20–24 in Niger gave birth before age 18, whereas in Mali the figure is 46 per cent and in Guinea, 44 per cent (see Figure 5.4). Contrast this to the average in the developing world, which is 20 per cent.
In the three countries with the highest prevalence of early childbearing – Guinea, Mali and Niger – around 10 per cent of women gave birth before age 15.
Adolescent maternal healthAppropriate antenatal care and attendance by skilled health personnel at delivery are crucial for preventing maternal mortality and morbidity among adolescents. Girls 15−19 years old account for 11 per cent of all births and around 14 per cent of all maternal deaths, with some 50,000 girls dying from maternal causes annually.69
levels of condom use at last higher-risk sex are above 60% among adolescents – both boys and girls – in only three countries with a high burden of hiV: lesotho, namibia and swazilandPercentage of adolescents 15–19 years old who used a condom at last higher-risk sex, in countries with an adult HIV prevalence above 5%
note: The analysis includes only those countries whose most recent survey included both male and female data. Higher-risk sex is defined as sex with a non-marital, non-cohabiting partner during the last 12 months.
source: UNICEF global databases, 2011, based on AIS, DHS, MICS and Sexual Behaviour Survey (Zambia), 2005–2010. Data for South Africa refer to 2003, as estimates for 2005–2010 were not available.
Zambia33
Adolescent boys
0% 20% 40% 60% 80% 100%
United Republicof Tanzania
Uganda
Malawi
Zimbabwe
Kenya
Lesotho
SouthAfrica
Namibia
Swaziland
31
48
41
36
46
37
54
41
54
41
55
63
65
49
73
67
94
66
81
Adolescent girls
figUre 5.2
HIV prevalence above 5 per cent – Lesotho, where adult HIV prevalence is 23.6 per cent, Namibia (13.1 per cent) and Swaziland (25.9 per cent) – the level of condom use at last higher-risk sex is 60 per cent or more for both adolescent boys and adolescent girls aged 15–19 (see Figure 5.2). In nearly all of the countries, boys surveyed were more likely to report using condoms during higher-risk sexual activity than girls. Where disaggre-gated data for youth aged 15–24 are available, they reveal that condom use is less common among those in poorer households and those living in rural areas.62
Adolescent childbearingEarly childbearing often results from child marriage, the negative consequences of which are described in Chapter 2 (see pages 8−10).

Adolescent sexual behaviour, childbearing and maternal health, and HIV 25
The prevalence of births among adolescents is high in developing countriesBirths among adolescent girls 15–19 years old as a percentage of total births, 2000–2010
note: This map is stylized and not to scale. It does not reflect a position by UNICEF on the legal status of any country or territory or the delimitation of any frontiers. The dotted line represents approximately the Line of Control in Jammu and Kashmir agreed upon by India and Pakistan. The final status of Jammu and Kashmir has not yet been agreed upon by the Parties. The final boundary between the Republic of the Sudan and the Republic of South Sudan has not yet been determined. The final status of the Abyei area has not yet been determined.
source: United Nations Department of Economic and Social Affairs, Population Division, World Population Prospects: The 2010 revision, CD-ROM edition, 2011, and ‘2011 Update for the MDG Database: Adolescent Birth Rate’ (POP/DB/Fert/A/MDG2011), reanalysed by UNICEF.
Top 20 countries with the highest prevalence of early childbearing Percentage of young women 20–24 years old who gave birth before age 15 and before age 18, in the 20 countries (of those with available data) with the highest prevalence of early childbearing
source: UNICEF global databases, 2011, based on DHS and other national surveys, 2005–2010.
0% 10% 20% 30% 40% 50% 60%
Niger
Mali
Guinea
Bangladesh
Sierra Leone
Liberia
Madagascar
Uganda
Zambia
Côte d’lvoire
Congo
Ethiopia
United Republic of Tanzania
Swaziland
Nigeria
Honduras
Kenya
Sao Tome and Principe
Dominican Republic
Democratic Republic of the Congo
9
36
35
32
27
31
28
29
30
23
25
23
25
26
21
23
21
24
22
19
10
9
8
13
7
8
6
4
6
4
5
3
2
7
3
5
1
3
4
42
Before age 15
Between ages 15 and 18
figUre 5.3
figUre 5.4

26 Progress for Children
According to surveys from a subset of countries that disaggregate data by age, around 75 per cent of adolescent mothers in developing countries receive an-tenatal care,70 a level similar to that of all women aged 15–49 in those countries. Only about half of adolescent mothers (53 per cent) deliver with the assistance of skilled health personnel, which again differs little from the proportion of all mothers (54 per cent) and gener-ally reflects the low coverage of basic health services in developing countries (excluding China; see Figure 5.5).
A UNICEF analysis of maternal health indicators in three countries that account for about 30 per cent of all adolescent births in the world – the Democratic Re-public of the Congo, India and Nigeria – found striking disparities across wealth quintiles in the coverage of basic maternal health interventions like antenatal care and skilled attendance at birth.71 In Nigeria, 22 per cent of pregnant women under 20 years old in the poorest households are attended at least once during pregnan-cy by a skilled health provider, compared to 80 per cent of young women in the richest households. In India, less than 30 per cent of mothers under 20 years old in the poorest households are assisted during delivery
by a skilled birth attendant, compared to 90 per cent of young mothers in the richest households.
The issue of disparities in access to maternal health services in the developing world is particularly relevant in the context of adolescent girls from the poorest households, who are more likely than those from the richest households to begin childbearing early. Young women in the poorest households are seven times more likely to give birth before age 18 than young women from the richest households in India, six times more likely in Nigeria and about three times more likely in the Democratic Republic of the Congo.72
Adolescents and hiV Today, approximately 2.2 million adolescents (between a low estimate of 2.0 million and a high estimate of 2.5 million) aged 10–19 are living with HIV, and most of them do not know their status (see Figure 5.6).73 Globally, this breaks down to 1.3 million (1.2 million−1.5 million) adolescent girls and 870,000 (770,000−960,000) adolescent boys.
Young mothers are just as likely to give birth with a skilled attendant present as are all mothers in developing regions, amid insufficient coverage of basic maternal health servicesPercentage of births attended by skilled health personnel among young mothers (below 20 years old) and among all mothers 15–49 years old
note: Estimates are based on a subset of 79 developing countries with available data, covering 71% of births in the developing world (excluding China for which comparable data are not available). The estimates represent data from countries that cover at least 50% of the regional population. Data coverage was insufficient to calculate a regional average for CEE/CIS.
source: UNICEF global databases, 2011, based on DHS, MICS and other national surveys, 2006–2010.
Mothers below 20 years old
All mothers 15–49 years old
49
88
48
70
LatinAmericaand the
Caribbean
0%
20%
40%
60%
80%
100%
East Asiaand the Pacific
(excludingChina)
Middle Eastand
North Africa
West andCentralAfrica
Sub-SaharanAfrica
South AsiaEasternand
SouthernAfrica
Leastdevelopedcountries
Developingcountries(excluding
China)
74
87
70 70
4549
44 44
5449 50
47
55 55
figUre 5.5

Adolescent Sexual Behaviour, Childbearing and Maternal Health, and HIV 27Adolescent Sexual Behaviour, Childbearing and Maternal Health, and HIV 27
globally, about 2.2 million (2.0−2.5 million) adolescents were living with hiV in 2010Estimated population of adolescents 10−19 years old living with HIV, by region
Latin America and the Caribbean
68,000 adolescents living with HIV
Adolescent girls
Adolescent boys
50%50%
59%41%
Middle East and North Africa
23,400 adolescents living with HIV
47%53%
South Asia109,000 adolescents
living with HIVSub-Saharan Africa
1,870,000 adolescents living with HIV
50%50%
CEE/CIS66,000 adolescents
living with HIV
51%49%
lobally, about 2.2 million (2.0−2.5 million) V in 2010
Estimated population of adolescents 10−19 years old
Middle East and North Africa5050%%50%%
CEE/CIS66,000 adolescents
living with HIV
Some 1.3 million (1.2−1.5 million) adolescent girls and
870,000 (770,000−960,000) adolescent boys were living with HIV in 2010.
source: UNAIDS medium estimates, 2011.
63%37%
figUre 5.6
Adolescent sexual behaviour, childbearing and maternal health, and HIV 27
East Asia and the Pacific
80,000 adolescents living with HIV
Many adolescents with HIV were infected through peri-natal transmission; many others were infected through unprotected sex or through the sharing of non-sterile injecting equipment. Adolescent girls who are sexually active are particularly vulnerable to HIV biologically. They are also at higher risk because they may have older sexual partners who are more likely to have been exposed to HIV infection or may have other partners; adolescent girls in such relationships often cannot negotiate the correct and consistent use of condoms with their partners.74
HIV prevalence in young pregnant women aged 15−24 years old is used as an indicator for recent infection.
HIV prevalence in young pregnant women in antenatal clinics has declined in 22 of 24 countries with national prevalence of 1 per cent or higher, and in half of these countries – 12 countries, all in sub-Saharan Africa – the decline seen was statistically significant.75
Yet, in several countries, HIV incidence continues to rise, particularly among people who inject drugs, an increase that is largely due to escalating levels of unsafe injecting practices coinciding with initiation into injecting drug use at younger ages.
Preventing infection in adolescents and treating and supporting adolescents who have been infected
AdolesCenTs And hiV

28 Progress for Children
with HIV means addressing a host of context-specific barriers to providing information and services – barriers rooted in gender norms, sociocultural prac-tices, economic inequalities, low levels of knowledge, stigma and discriminatory practices, and legal systems.
While these remain barriers for all individuals at risk of HIV infection or who are living with HIV regardless of age, adolescents in both generalized and concen-trated epidemic settings are extremely vulnerable because of their age, biology and, often, legal status. The most marginalized among them – adolescents who inject drugs, those involved in sex work, and adolescent males who have sex with other males – experience great vulnerability to HIV infection in all epidemic settings.
A further challenge lies in providing a comprehen-sive level of support to adolescents living with HIV – especially where they lack the protection of family or are otherwise on their own – through their adherence to treatment and as they start their adult futures with sexual partners, as wage earners and as parents.
Challenges to providing adolescent girls with appropri-ate HIV-related information and services and cultivat-ing a protective environment for them in their homes, schools and societies remain particularly acute. In a number of countries where HIV prevalence among adults is above 5 per cent, prevalence exceeds 3 per cent among girls aged 15–19 (see Figure 5.7). In Swaziland, it is 10 per cent.
Particularly in sub-Saharan Africa, the vulnerability of adolescent girls to HIV has been associated with age-disparate sex related to early marriage or relationships with older partners for money or other material gain. In addition, in many countries, laws and policies restrict adolescent girls’ access to condoms, testing and ac-curate, comprehensive information.
While there is little detailed information on the subject, adolescents with disabilities are also likely to be at greater risk of HIV for several reasons. They may lack information in formats accessible to them, and if they are not in school, they do not benefit from sex educa-tion programmes. They are subject to higher levels of violence and sexual abuse.76 Additionally, it is often not acknowledged that adolescents with disabilities might have sex.77
hiV knowledge and behavioursComprehensive, correct knowledge is fundamental to the uptake of HIV services and behaviour change. Overall, the level of comprehensive, correct knowledge of HIV and AIDS remains very low among older ado-lescents aged 15–19, with more boys than girls having accurate knowledge (see Figure 5.8).
For levels of condom use during last higher-risk sex, see Figure 5.2 on page 24.
Most adolescents aged 15–19 in countries with adult HIV prevalence above 5 per cent know of a place to be
Collecting data from some of the most marginal-ized adolescents – those who live on the streets or in institutions, inject drugs, sell sex or are mem-bers of ethnic minorities – is challenging, because they live their lives largely outside the mainstream, often beyond formal structures and even without households.
Yet such information is extremely important. Central and Eastern Europe and the Common-wealth of Independent States (CEE/CIS), home to one quarter of the world’s injecting drug users, many of whom are young, is witnessing a surge in HIV incidence that is particularly threatening to marginalized adolescents. Accurate data can help guide policies and programmes to break the cycle of ‘blame and banishment’ that jeopardizes young lives.
Recent strides in data collection have begun to chip away at the wall that separates marginalized adolescents and youth from the services and information they need to maintain and improve their health. Since 2007, UNICEF has been working with research institutions and govern-ments in seven countries in the region to seek out and survey adolescents in such settings as institutions, board-ing facilities and collective centres as well as through formal networks.
Respondent-driven sampling, developed to collect infor-mation from hard-to-reach groups – including injecting drug users in Moldova, Romania and Serbia and sex workers in Romania – has been used with marginalized young people who could not be found within formal structures. Other data collection methods (such as time-location sampling) have also proved effective in reaching the hard to reach in this and other regions.
Collecting data on adolescents engaging in risky behaviour

Adolescent sexual behaviour, childbearing and maternal health, and HIV 29
note: Comprehensive and correct knowledge means that a person can correctly identify the two major ways of preventing the sexual transmission of HIV (using condoms and limiting sex to one faithful, uninfected partner), rejects the two most common local misconceptions about HIV transmission and knows that a healthy-looking person can have HIV.
Estimates are based on a subset of countries with available data. This analysis includes 47 countries with data on males and 93 countries with data on females, covering 53% and 79% of the respective male and female populations aged 15–19 in the developing world (excluding China, for which comparable data are not available). Regional estimates represent data from countries that cover at least 50% of the regional population. Data were insufficient to calculate averages for adolescent boys and girls for Latin America and the Caribbean, CEE/CIS and the industrialized countries, and averages for adolescent boys in East Asia and the Pacific, the Middle East and North Africa and the least developed countries.
source: UNICEF global databases, 2011, based on AIS, DHS, MICS and other national household surveys, 2005–2010.
source: UNICEF global databases, 2011, based on AIDS Impact Survey III (Botswana), AIS, DHS, HIV/AIDS and Malaria Survey (United Republic of Tanzania), and South African National HIV Prevalence, Incidence, Behaviour and Communication Survey, 2004–2010.
hiV prevalence among older adolescent girls is above 3% in most countries with a high burden of hiVHIV prevalence among adolescents 15–19 years old in countries with an adult HIV prevalence above 5%
Zambia
10
Adolescent boys
Adolescent girls
UnitedRepublic
of Tanzania
UgandaMalawiZimbabwe KenyaLesothoSouthAfrica
MozambiqueSwaziland0%
5%
10%
Botswana Cameroon
2
7
3
7
3
6
3
6
4
5
2
4
3
4
1
3
1
3
.5
2
1 11
figUre 5.7
levels of comprehensive knowledge among older adolescents remain very low across developing regionsPercentage of adolescents 15–19 years old with comprehensive knowledge of HIV, by region
figUre 5.8
Eastern andSouthern
Africa
38
0%
10%
20%
30%
40%
Adolescent boys
Adolescent girls
Sub-SaharanAfrica
East Asia andthe Pacific
(excluding China)
West andCentral Africa
Developingcountries
(excluding China)
Leastdevelopedcountries
South Asia Middle Eastand North
Africa
33 33
25
22
27
19
35
19
5
30
1921
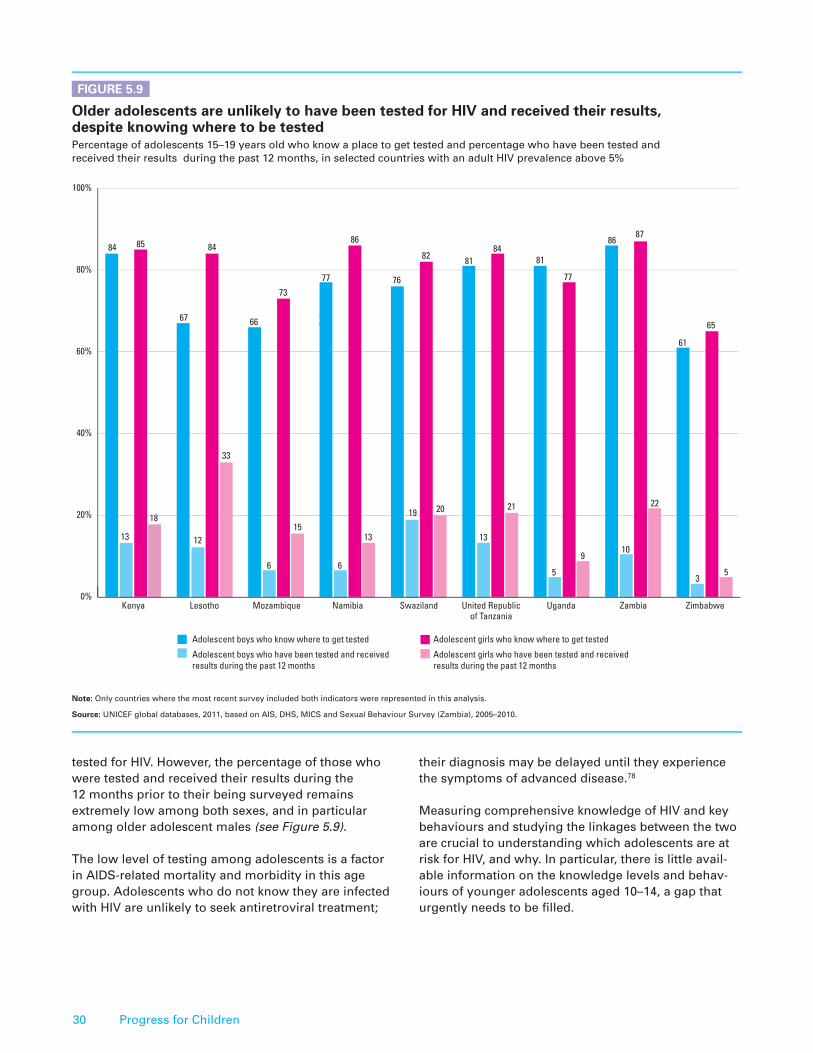
30 Progress for Children
tested for HIV. However, the percentage of those who were tested and received their results during the 12 months prior to their being surveyed remains extremely low among both sexes, and in particular among older adolescent males (see Figure 5.9).
The low level of testing among adolescents is a factor in AIDS-related mortality and morbidity in this age group. Adolescents who do not know they are infected with HIV are unlikely to seek antiretroviral treatment;
their diagnosis may be delayed until they experience the symptoms of advanced disease.78
Measuring comprehensive knowledge of HIV and key behaviours and studying the linkages between the two are crucial to understanding which adolescents are at risk for HIV, and why. In particular, there is little avail-able information on the knowledge levels and behav-iours of younger adolescents aged 10–14, a gap that urgently needs to be filled.
Adolescent girls who know where to get tested
Adolescent girls who have been tested and receivedresults during the past 12 months
Adolescent boys who know where to get tested
Adolescent boys who have been tested and receivedresults during the past 12 months
Kenya
33
73252567
8485
66
13
84
5
1518
0%
20%
40%
60%
80%
100%
Lesotho Mozambique Namibia Swaziland United Republicof Tanzania
Uganda Zambia Zimbabwe
12
6
86
77
13
6
82
86
76
2019
8481
21
13
77
81
9
5
87
22
10
65
61
53
older adolescents are unlikely to have been tested for hiV and received their results, despite knowing where to be testedPercentage of adolescents 15–19 years old who know a place to get tested and percentage who have been tested and received their results during the past 12 months, in selected countries with an adult HIV prevalence above 5%
note: Only countries where the most recent survey included both indicators were represented in this analysis.
source: UNICEF global databases, 2011, based on AIS, DHS, MICS and Sexual Behaviour Survey (Zambia), 2005–2010.
figUre 5.9

Violence 31
domestic violenceIntimate partner violence, the most common form of vi-olence against women in developing countries, occurs frequently in adolescent relationships.85 A 2005 WHO study on women’s health and domestic violence found that adolescent girls aged 15–19 were more likely than older women (aged 45–49) to have experienced partner violence.86
Adolescents experience many forms of violence: physical abuse, sexual abuse, peer violence, domes-tic violence, involvement in gang violence, and con-scription into armed forces or groups. While younger children are more likely to experience physical abuse, older children and adolescents are more vulnerable to sexual violence.79 Boys are at greater risk of physical and armed violence, girls of neglect, sexual abuse and exploitation.80
Adolescents living with disabilities are at increased risk for physical, sexual and psychological abuse because of their isolation.81
Many factors contribute to the likelihood that violence will mar the lives of adolescents. High rates of urban growth, for example, are linked to greater violence, as are social, political and economic inequalities.
sexual violenceAccording to the World Health Organization (WHO), approximately 150 million girls and 73 million boys under age 18 experienced sexual violence and exploita-tion in 2002, the most recent year for which compre-hensive data are available.82
In a number of countries with available data, large proportions of adolescent girls aged 15–19 report having experienced sexual violence, defined here as forced sexual intercourse or the performance of sexual acts against their will.83 In Uganda, 21 per cent of girls have reported such sexual violence.
Whether experienced as young children or as adoles-cents, sexual violence has a host of negative outcomes for the adolescent years and beyond. Girls who have experienced sexual violence are more likely to be de-pressed, to engage in behaviours that put them at risk of sexually transmitted infections or HIV infection, and to commit suicide. They are also three times as likely to have an unplanned pregnancy and are less likely to go to school.84
ViolenCe
The Millennium Declaration stipulates that parents have the right to raise their children free from violence, injustice and oppression. It reiterates the need to protect children from conflict and violence.
6 relATed To The MillenniUM deClArATion
spousal violence is common among married adolescent girls Percentage of ever-married adolescent girls 15–19 years old who report that they have ever experienced emotional, physical and/or sexual violence committed by their current or most recent husband or partner, in a subset of countries with available data where prevalence of spousal violence is 40% or higher
Physical violence was defined as: (a) being pushed or shaken, having something thrown at her, or having her arm twisted or her hair pulled; (b) being slapped; (c) being punched with a fist or with something that could hurt her, or being kicked, dragged or beaten up; (d) being choked or burned; or (e) being threatened or attacked with a knife, gun, or other type of weapon.sexual violence was defined as being forced to have sexual intercourse or perform any other sexual acts against her will (this includes forced sexual initiation). emotional violence was defined as: (a) having something said or done to humiliate her in front of others; (b) being threatened with hurt or harm to herself or someone close to her; or (c) being insulted or made to feel bad about herself.
source: UNICEF global databases, 2011, based on DHS and other national surveys, 2005–2010.
0% 10% 20% 30% 40% 50% 60% 70%
40
43
46
46
47
48
51
67
70
Malawi
Zambia
Liberia
United Republicof Tanzania
Bangladesh
Bolivia(Plurinational
State of)
Zimbabwe
Uganda
DemocraticRepublic
of the Congo
figUre 6.1

32 Progress for Children
Adolescent girls are vulnerable to violence within mar-riage, including sexual violence (see Figure 6.1). In surveys in the Democratic Republic of the Congo, 70 per cent of adolescent girls aged 15–19 who had ever been married reported having experienced violence at the hands of a current or former partner or spouse. And, be-cause of reporting bias, this may be an underestimation of the true size of the problem in this and other countries.
Many factors contribute to the incidence of domestic violence. In many places, child marriage, gender-based power relations, women’s low economic status and traditional practices or social norms perpetuate it. These are often deeply rooted and difficult to overcome.
Societal attitudes that convey acceptance or justification of domestic violence may make girls and women more vulnerable to becoming victims. Available data for devel-oping countries show that nearly 50 per cent of girls and women aged 15–49 believe that wife-beating is justified under certain circumstances; this percentage remains
Adolescent boys justify wife-beatingPercentage of adolescent boys 15–19 years old who think that a husband is justified in hitting or beating his wife under certain circumstances, in a subset of countries with available data where prevalence of supportive attitudes towards wife-beating is 50% or higher
note: Adolescent boys were asked whether they think that a husband is justified in hitting or beating his wife under certain circumstances, i.e., if his wife burns the food, argues with him, goes out without telling him, neglects the children or refuses sexual relations.
source: UNICEF global databases, 2011, based on DHS and other national surveys, 2002–2009.
virtually the same whether those surveyed are older or younger – that is, girls aged 15–19 hold the same views as women aged 45–49 (see Figure 6.2). Data show that large percentages of 15–19-year-old boys also justify the practice under certain circumstances (see Figure 6.3).
It is important to note that ‘justification’ should not necessarily be interpreted as a measure of approval of wife-beating, nor should it imply that a woman or girl will inevitably become a victim of wife-beating. Rather, it reflects societal views that accept such practices when women and girls have a lower status or when they do not fulfil certain expected gender roles.
Peer violence
In numerous countries, large percentages of students aged 13–15, boys in particular, report having been in-volved in physical fights or having been the victims of physical attacks or bullying within the past month (see Figures 6.4−6.6). Bullying, whether physical or
Samoa 50
0% 10% 20% 30% 40% 50% 60% 70% 80% 90%
Ethiopia
Kenya
Lesotho
Zambia
India
Sierra Leone
Swaziland
Azerbaijan
Uzbekistan
Uganda
Timor-Leste
Solomon Islands
Tuvalu
53
54
54
55
57
57
59
63
63
69
72
73
83
Adolescent girls are as likely as older women to justify wife-beating Percentage of girls and women 15–49 years old who think that a husband is justified in hitting or beating his wife under certain circumstances, by age group
note: Estimates are based on data from 74 countries with available data, covering 69% of the female population 15–49 years old in the developing world (excluding China, for which comparable data are not available). Girls and women were asked whether they think that a husband is justified in hitting or beating his wife under certain circumstances, i.e., if his wife burns the food, argues with him, goes out without telling him, neglects the children or refuses sexual relations.
source: UNICEF global databases, 2011, based on DHS, MICS and other national surveys, 2002–2010.
49
15–19 years old
20–24 years old
25–29 years old
30–34 years old
35–39 years old
40–44 years old
45–49 years old
0% 10% 20% 30% 40% 50%
49
49
50
49
50
50
figUre 6.2 figUre 6.3

Violence 33
note: Comparable data are available for a larger number of countries, but because of space constraints, only a random selection is presented here. Students were given the following definition when asked if they had been physically attacked in the past 12 months: “A physical attack occurs when one or more people hit or strike someone, or when one or more people hurt another person with a weapon (such as a stick, knife or gun). It is not a physical attack when two students of about the same strength or power choose to fight each other.”
source: WHO, Global School-based Student Health Survey, 2005–2008.
Many adolescents report that they have been physically attacked Percentage of students 13–15 years old who report having been physically attacked one or more times during the past 12 months, by sex, in a random selection of countries with available data
figUre 6.4
25
0%
10%
20%
30%
40%
50%
60%
70%
The formerYugoslav
Republic ofMacedonia
Adolescent boys
Tajikistan Argentina Mauritius Libya Thailand SaintVincentand the
Grenadines
Jordan Indonesia Sri Lanka Botswana Ghana Egypt Tunisia Djibouti
14
27
21
32
20
36
18
42
16
44
22
46
33
51
26
52
28
54
42
5755
5861 62
56
63
30
45
64Adolescent girls
emotional, typically takes place at school and affects many adolescents.
Cyberbullying, or bullying that takes place using various digital forums and technologies, is common in both industrialized and developing countries (see panel on the use of information and communication technology, on page 11).
gang violenceGang violence affects the lives of adolescents through-out the world. The average age for entry into gangs is 13 – early adolescence. Although there are often older members, most gang members are typically 12–24 years old.87
Children – mostly boys – join gangs for a variety of rea-sons, including poverty, social exclusion, lack of jobs and lack of educational opportunity.88 Gang peers can become like families, offering emotional support.
Latin America is considered one of the most violent regions of the world. Here, violence in general is a more prominent cause of death for adolescents than it is in other regions.89 Large numbers of Latin American boys are involved in gangs.
In the 53 countries of the WHO European region, 15,000 young people lose their lives each year to interpersonal violence, the third leading cause of death among people aged 10−29 years old.90 Four out of five homicide victims are young males.
The rates of homicide in low- and middle-income coun-tries of the region are nearly seven times higher than in high-income countries of the region. WHO projects that if the homicide rates in all countries of the region could be brought down to the level of the country of the region with the lowest homicide rate – Germany – then 9 out of 10 homicide deaths or 13,400 deaths annually could be avoided.91

34 Progress for Children
. . . and many adolescents report that they have been victims of bullying Percentage of students 13–15 years old who report having been bullied on one or more days during the past 30 days, by sex, in a random selection of countries with available data
note: Comparable data are available for a larger number of countries, but because of space constraints, only a random selection is presented here. Students were given the following definition when asked if they had been bullied in the past 30 days: “Bullying occurs when a student or group of students say or do bad and unpleasant things to another student. It is also bullying when a student is teased a lot in an unpleasant way or when a student is left out of things on purpose. It is not bullying when two students of about the same strength or power argue or fight or when teasing is done in a friendly and fun way.”
source: WHO, Global School-based Student Health Survey, 2003–2011.
Solomon Ghana Uganda Sri Lanka Pakistan Benin Guyana Thailand Kuwait Grenada United Uruguay Trinidad Costa Rica Tajikistan
68
64
5760
41
50
29
47
35
4541
43
3740
23
32
19
3026
29
21
2622
25
1922
2018
7 7
Adolescent boys Adolescent girls
0%
10%
20%
30%
40%
50%
60%
70%
Islands ArabEmirates
andTobago
figUre 6.6
Many adolescents report that they have been involved in physical fights . . .Percentage of students 13–15 years old who report having been in a physical fight one or more times during the past 12 months, by sex, in a random selection of countries with available data
note: Comparable data are available for a larger number of countries, but because of space constraints, only a random selection is presented here. Students were given the following definition when asked if they had been in a physical fight in the past 12 months: “A physical fight occurs when two or more students of about the same strength or power choose to fight each other.”
source: WHO, Global School-based Student Health Survey, 2005–2011.
24
0%
10%
20%
30%
40%
50%
60%
70%
80%
Malawi
Adolescent boys Adolescent girls
CostaRica
Philippines Uruguay CookIslands
Guyana Grenada Solomon Islands
Botswana Morocco Fiji Sri Lanka Djibouti TunisiaThe formerYugoslav
Republic ofMacedonia
21
32
12
41
18
44
32
47
20
47
34
51
25
53
27
5451
54
42
57
26
59
36
60
34
68
47
71
24
figUre 6.5

AdolesCenT hoMiCide in The AMeriCAs
el sAlVAdor
157AdolesCenT
deAThs
*
Adoles
el sAlVAdor
AdolesCenT deAThs
CenT
26
UsA
18AdolesCenT
deAThsAdoles
AdolesCenT deAThs
dolesCenTAThs
UsA
3
83AdolesCenT
deAThsAdoles
BrAZil
AdolesCenT deAThs
dolesCenThs
BrAZil
7
Violence in the Americas
Some 31 per cent of all the world’s homicides in 2010 took place in the Americas; here, the homicide rate for all ages was 15.6 per 100,000 persons, more than double the world average. About one in four homicides in the region is related to organized crime and the activi-ties of criminal gangs.92 While homicide rates in most world regions have been declining since 1995, they have increased in the Central America and Caribbean subregions.
Boys, especially older adolescent boys (aged 15–19), are particularly at risk of death from homicide in certain Latin American countries (see Figures 6.7 and 6.8); homicide is a leading cause of death among these older adolescent boys in most Latin American countries with available data (see Figure 6.9). Adolescent girls here are far less likely to die by homicide than adolescent boys.
(Note that these data do not distinguish between deaths in which the adolescent victim was directly involved in some violent or criminal behaviour and those where the adolescent may have been an unintended victim. The actual homicide rates in some Latin American countries are likely to be higher than those reported here, as many deaths are of an undetermined intention and could potentially have been homicides.)
Yet these data capture only part of the story. The full impact of violence on the lives of adolescents reaches far beyond the tragedy of adolescent death to encom-pass adolescents who sustain serious injuries or suffer emotional trauma; those who lose a parent or some-one else because of violence; and the damage such violence inflicts on the social bonds that sustain an adolescent’s world.
Deaths per 100,000 adolescent boys 15–19 years old
Deaths per 100,000 adolescent girls 15–19 years old
Chile
13AdolesCenT
deAThsAdoles
Chile
AdolesCenT deATh
dolesCenTATh
1
note: Comparable data are available for a larger number of countries, but because of space constraints only a random selection is presented here. Data on homicides among boys for more countries are included in Figure 6.8.
source: PAHO/WHO Mortality Information System, 2007–2010, reanalysed by UNICEF.
Adolescent boys in the Americas
are more likely than adolescent girls to be victims of homicide.
Violence 35
figUre 6.7

in certain latin American countries, more adolescent boys die as a result of homicide than from road traffic injuries or suicideRates of homicide, road traffic injury and suicide among adolescent boys 15–19 years old in Latin American countries where homicide is the leader among the three causes of death
homicide rates rise dramatically as adolescent boys get olderHomicide rate among adolescent boys 10–14 years old and 15–19 years old in Latin American countries with available data and in the United States
Nicaragua
Barbados
Colombia
Costa Rica
Bahamas
Saint Kittsand Nevis
Belize
Trinidadand Tobago
Panama
Brazil
Guatemala
Venezuela(Bolivarian
Republic of)
Saint Vincentand the Grenadines
12108
19
00
19
00
2120
7
4620
7
4600
4830
12
5422
8
68
189
7613
6
8327
5
953
7
10638
5
15715
10
0 20Deaths per 100,000
40 60 80 100 120 140 160
El Salvador
Suicide rateRoad traffic injury rateHomicide rate
0 20 40Deaths per 100,00060 80 100 120 140 160
Peru
Cuba
Argentina
Chile
Paraguay
United States
Ecuador
Mexico
Colombia
Brazil
Guatemala
Venezuela(Bolivarian
Republic of)
El Salvador
Uruguay
Guyana
Saint Lucia
Saint Vincent andthe Grenadines
Barbados
Costa Rica
Bahamas
Belize
Trinidadand Tobago
Panama
02
17
113
113
116
118
22
21
2
25
046
11
83
695
5
106
15157
14
28
012
019
1910
0
2
54
48
0
568
5
5
76
Adolescent boys 10–14 years old
Adolescent boys 15–19 years old
note: Countries with a total homicide rate of 0 for both age groups (Grenada and Suriname) were not included in this chart. Zeroes appearing in the chart do not necessarily imply that there were no adolescent victims of homicide in these countries but rather indicate that the recalculated homicide rates came to 0 after rounding because of small population size.
source: PAHO/WHO, Mortality Information System, 2006–2009, reanalysed by UNICEF.
note: Zeroes appearing in the chart do not necessarily imply that there were no adoles-cent victims of homicide, road traffic injury or suicide in these countries but rather indi-cate that the recalculated rates came to 0 after rounding because of small population size.
source: PAHO/WHO, Mortality Information System, 2007–2010, reanalysed by UNICEF.
36 Progress for Children
figUre 6.8 figUre 6.9

The way forward 37
Adolescence is a formative period during which children grow into their rightful place as full citizens and agents of change in their own lives and the lives of their societies. As they physically and psychologically mature, they form their values, core beliefs, sense of identity and understanding of their place in the world.
Adolescence is also a time when children’s and young people’s relationships with the people and communities that surround them can change dramatically. They leave behind childhood and take on new roles: as heads of household, earners and citizens – and as adult rights holders and duty bearers in their communities and societies.
lives. A secondary school education is particularly important for girls.
• Adolescents with hiV: Approximately 2.2 million adolescents are living with HIV, 1.3 million of them girls.95 Many of them do not even know they are in-fected, reflecting a lack of knowledge, low use of HIV testing and other services, and the stigma associated with AIDS.
• Adolescents without access to information: Millions of adolescents, particularly girls, still do not have access to information and communication technolo-gies, which further excludes and marginalizes them. ICT is a strong influence in adolescent lives and a potential tool to empower them in their civic participation and activism.
• Adolescents without access to services: Poverty, gender, disability, stigma and discriminatory laws may curtail adolescents’ access to services, including HIV prevention and treatment, education, assistance in humanitarian emergencies, and maternal health and reproductive care for adolescent girls.
Sub-Saharan Africa is repeatedly cited in this report as the most challenging place for an adolescent to live. Only about half of the children in this region have completed primary school, and less than one third are enrolled in secondary school. Youth employment rates are low, as in most regions. Sub-Saharan Africa is the only one of the world’s regions in which the adolescent population con-tinues to expand, and it is projected to have the greatest number of adolescents of any region by 2050.
Yet much of what is described in these pages is not about adolescents realizing their human potential, but about the risks and deprivations experienced by a diverse and heterogeneous group of 1.2 billion individu-als whose lot is defined – often unfairly – by geography, gender, culture and the societies in which they live.
Viewing adolescents through an equity lens – as the analysis in this edition of Progress for Children seeks to do – allows for a focus on several groups who are most marginalized and at risk of further deprivation, among them:
• Married adolescent girls: Nearly one in four ado-lescent girls aged 15−19 worldwide is married or in union. These girls are at risk of school dropout, early childbearing with its inherent health risks, domestic violence and HIV.
• Adolescent victims of violence: Available data sug-gest that large proportions of adolescent girls aged 15−19 have experienced sexual violence, and large proportions of adolescent boys and girls aged 13−15 have been physically attacked, involved in physical fights or bullied. Adolescent boys aged 15−19 living in certain Latin American countries are particularly at risk of death from homicide.
• Younger adolescents out of school: An estimated 71 million children of lower secondary school age are out of school,93 and 127 million youth aged 15–24 are illiterate.94 These adolescents are effectively pre-vented from acquiring the skills and knowledge that would enable them to make better decisions in their
The WAY forWArd7
38 Progress for Children
their time, their health status, the knowledge and information they have, their role in their families and communities, their use of online social networks and so on. Many large-scale surveys avoid gathering infor-mation from young adolescents out of a concern that they will not understand the questions being asked or because of consent issues. Such ethical and practical considerations must be balanced against the need for evidence to inform policies and guide investment in programmes to ensure the fulfillment of adolescents’ rights, including their right to express themselves and to be heard.
It is critical that the existing data be used to the great-est effect. In addition, the data have tended to focus on deficits, rather than on such positive qualities as adolescents’ resilience, capacities and contributions to their communities. Notwithstanding efforts to aid such understanding – the module on subjective youth well-being in the fourth round of MICS is one such effort (see panel, below) – these gaps are obstacles to under-standing adolescents and what they are capable of, and they make it harder to identify interventions that are appropriate for them.
The evidence baseFar more is known today than in the past about the state of adolescents in the world, thanks to the rich base of statistical data described in these pages. Such knowl-edge is helping to make adolescents more visible, and with greater visibility comes the potential for adolescents to benefit more fully from the protections the Convention on the Rights of the Child affords them as children.
Yet, important gaps in the knowledge base exist. More needs to be known and understood about the underly-ing social and economic determinants of deprivation in adolescence. Much of the recent research has sought to further an understanding of adolescent risk-taking, while far less research has been conducted on protective fac-tors, adolescent decision-making and how awareness translates to behavioural change. Some of the biggest gaps pertain to knowledge of child and adolescent development and, thus, knowledge about the critical moments for investment throughout the life cycle.
Little is known about adolescents aged 10−14: For example, there is a dearth of data on how they spend
innovations in data collection for adolescents: The case of MiCs
Multiple Indicator Cluster Surveys (MICS) provide one of the largest sources of statistically sound and internation-ally comparable data in the areas of health, nutrition, wa-ter and sanitation, education, child protection, and HIV and AIDS. Since 1995, UNICEF has assisted more than 100 developing countries in carrying out this household survey programme. MICS allow for data to be disaggre-gated by a large number of stratifiers, such as age, sex, education, geographic area, residence (urban or rural), ethnicity, religion, economic status, marital status and combinations of these.
MICS collect information on adolescents and youth, in-cluding age-specific indicators for youth aged 15−24 on reproductive health, education, sexual behaviour and HIV. Data on populations aged 15−19 and 20−24 are in-cluded in MICS standard tables for women aged 15−49 and cover topics such as contraceptive prevalence, unmet need for family planning, antenatal care cover-age, institutional deliveries, child marriage, polygyny, attitudes towards domestic violence, knowledge of HIV,
attitudes towards people living with HIV, and uptake of HIV counselling and testing during antenatal care. Data on household characteristics and children of young mothers aged 15–24 are also available from the MICS data sets.
With the aim of gathering evidence on the emerging challenges facing adolescents and youth, the fourth round of MICS, conducted during 2009−2011, included a new set of questions and indicators in domains relevant to adolescents and young people, such as access to media (television, radio and printed media) and technol-ogy (use of computers and the Internet), use of alcohol and tobacco, and subjective well-being. The module on subjective well-being, specifically designed for youth aged 15−24, includes questions on perceived life satisfac-tion in the areas of family, friendships, living environ-ment, school, job, income level, physical appearance and overall happiness. The questionnaire also captures young people’s assessment of recent changes in living conditions and their expectations about the future.
“The available data suggest that significant efforts in advocacy, programmes and policy are needed to realize the rights of adolescents.”

The way forward 39
protecting adolescents’ rights and creating opportu-nities that will reduce their vulnerability.
• develop services to address the specific needs of adolescents: Such services must be respectful of ado-lescents, attentive to their concerns, confidential and accessible. They must rely on a cadre of professionals who understand adolescents, are trusted by them and can counsel them successfully. There are many ex-amples of youth-friendly services that can be studied and evaluated for potential expansion and replication.
• recognize adolescents’ potential as agents of change: Adolescents often take on adult roles as spouses, workers, parents and members of their communities. Programmes and policies must acknowledge this capacity for real contribution on the part of adolescents to their communities, while at the same time ensuring the continued protection of adolescents as children.
The case for investing in adolescentsAdolescence is the final stage of childhood. It is a critical point at which investment can break the cycle of poverty and result in social, economic and political benefits for individuals, communities and nations.
Investing in adolescents is strategically important for the achievement of the MDGs, because adolescence is tied to employment, maternal mortality, quality education, poverty and other issues. Tackling issues of economic opportunity, the availability of health care and access to secondary education will boost adolescents’ prospects.
There is a crucial need for educational opportunities that are meaningful for young people as future wage-earners, parents and citizens. The foundation for this is quality basic education, including primary and lower secondary education. Secondary education must be rel-evant to students’ lives and linked to local economies. Girls, in particular, must acquire the skills that will help them earn their livelihoods and become productive members of society.
A further challenge is to address the prevailing social and cultural norms and practices that constrain the healthy development of millions of adolescents. These include harmful traditional practices such as child marriage, attitudes that justify and condone violence, and behaviours that drive the spread of HIV. All of these must be changed through sustained efforts that actively involve adolescents and other stakeholders, or the MDGs will not be achieved.
The available data suggest that significant efforts in advocacy, programmes and policy are needed to real-ize the rights of adolescents. The way forward suggests a six-pronged approach:
• Adopt a life-cycle approach: Children and adoles-cents have specific characteristics, capabilities and needs that evolve throughout the life cycle, and opportunities to advance their rights present them-selves at every stage. Positive interventions during early adolescence, for example, can avert negative outcomes in late adolescence. Because ‘remedial’ programmes are costly, it is crucial to strengthen the protective aspects of the environment for adoles-cents early on and invest in preventive programmes and policies that can help them.
• View adolescence through an equity lens: Policies and programmes to reach the most vulnerable groups of adolescents must be informed by data disaggregated by age, gender, wealth, residence status and family status. Efforts must be made to collect data from the most marginalized adoles-cents, including adolescents out of school; those with disabilities, HIV or chronic diseases; those from indigenous, migrant and minority households; those living on the street or in institutions and those otherwise beyond the reach of formal data-gathering exercises, in order to better understand the risks of their social exclusion.
• Make better use of data: More and better use must be made of the full range of available data to in-form programmatic and policy decision-making and advocacy. This includes not just data on the risks and deficits facing adolescents, but also data on their positive qualities and contributions. The gathering of qualitative data, research and analysis will enhance an understanding of existing quantitative data, such as those presented in these pages. Programming for adolescents must build on the existing evidence base and it must incorporate better systems of monitoring the results of interventions.
• Approach adolescents intersectorally: Adolescents benefit from programme interventions in all sectors – education, health, nutrition, maternal health, and HIV and AIDS – but these must come together to create the synergies that will have a transformative effect on their lives. Programme efforts to improve the uptake and delivery of high-impact interven-tions must be adolescent-sensitive. To achieve optimal scale and results, these must be supported through community partnership and sectoral ac-tions to address legislative barriers, change harmful social norms and ensure sustained investment in
40 Progress for Children
Adolescents are often seen as victims of weak protec-tive environments. But in many circumstances, they can begin to influence the events occurring around them. They can be resilient in the face of adversity and, in fact, can help identify problems and shape solutions based on their own experiences. Adolescents’ ability to voice their concerns and aspirations helps them protect themselves as they emerge into adulthood.
Many factors surrounding children and adolescents help create a protective environment around them. But having at least one strong relationship with a caring adult may be the single most important factor in a child’s positive development.96
The Millennium promiseThe path from childhood to adulthood is shaped by adults, and it is incumbent on adults to prepare and enable adolescents as they begin to take on adult responsibilities. The Convention on the Rights of the Child clearly articulates the responsibility of adults to protect children’s rights, including their right to expres-sion and involvement in shaping their own destinies, in keeping with their evolving capacities.
Adolescents must be valued as an asset to society. It is time to invest in them, especially in the most mar-ginalized adolescents, to ensure that they have the opportunity to fully realize their potential and that of their communities. A future in which adolescents are healthy, educated, protected and empowered is the promise of the Millennium Declaration for children and adolescents the world over.

References 41
referenCes1 World Health Organization, Child and Ado-
lescent Health and Development Progress Report 2009: Highlights, WHO, Geneva, 2010, p. 16.
2 World Health Organization, WHO Guide-lines on Preventing Early Pregnancy and Poor Reproductive Outcomes among Adolescents in Developing Countries, WHO, Geneva, 2011, pp. ix, 130.
3 World Health Organization, ’10 Facts on Adolescent Health’, Slide 3, WHO, Geneva, 2008, <www.who.int/features/factfiles/adolescent_health/facts/en/index2.html>, accessed 12 February 2012.
4 UNESCO Institute for Statistics, Out-of-School Adolescents, UIS, Montreal, 2010, p. 9.
5 United Nations, The Millennium Develop-ment Goals Report 2011, UN, New York, 2011, p. 23. The United Nations defines ‘youth’ as between the ages of 15 and 24.
6 Refers to UNAIDS medium estimates; see statistical table on page 51.
7 Handicap International and Save the Children, Out from the Shadows: Sexual violence against children with disabilities, Save the Children, London, 2011, pp. 13, 14; Groce, Nora Ellen, ‘Adolescents and Youth with Disability: Issues and challenges’, Asia Pacific Disability Rehabilitation Journal, vol. 15, no. 2, July 2004, pp. 16, 24; World Health Organization, World Report on Disability, pp. 9, 59, 147, 216.
8 Lloyd, Cynthia B., ed., Growing Up Global: The changing transitions to adulthood in developing countries, National Academies Press, Washington, D.C., 2005, p. 1.
9 United Nations Children’s Fund, From Invis-ible to Indivisible: Promoting and protecting the right of the girl child to be free from violence – In follow-up to the UN Secretary- General’s Study on Violence against Children, UNICEF, New York, 2008, p. 28.
10 World Health Organization, Department of Making Pregnancy Safer, ‘Adolescent Preg-nancy’, MPS Notes, vol. 1, no.1, October 2008, p. 2.
11 Lloyd, Cynthia B., ed., Growing Up Global, pp. 445−446.
12 UNICEF analysis of MICS data: Gambia (2005−2006); Sierra Leone (2005).
13 UNICEF analysis of MICS data: Bangladesh (2006).
14 United Nations Children’s Fund, Progress for Children: Achieving the MDGs with equity, UNICEF, New York, 2010, p. 31.
15 International Telecommunication Union, Measuring the Information Society: The ICT Development Index, ITU, Geneva, 2009.
16 International Telecommunication Union, Measuring the Information Society 2011, ITU, Geneva, 2011, p. 115.
17 Ibid., p. 128.
18 Cisco, ‘Getting It Right: Agile and secure mobility’, <www.cisco.com/web/learning/le21/le34/downloads/689/cio/cio11-2-2.pdf>, accessed 17 February 2012.
19 United Nations Children’s Fund, From ‘What’s Your ASLR’ to ‘Do You Wanna Go Private?’, UNICEF, New York, 2011, p. 6.
20 Livingstone, Sonia, et al., ‘EU Kids Online: September 2011’, London School of Eco-nomics and Political Science, London, 2011, p. 2; ‘EU Kids Online’, <www2.lse.ac.uk/media@lse/research/EUKidsOnline/Home.aspx>, accessed 9 February 2012.
21 Refers to primary school net enrolment ratio (2007−2009). United Nations Children’s Fund, The State of the World’s Children 2012: Children in an urban world, UNICEF, New York, 2012, p. 91.
22 UNESCO Institute for Statistics, Global Edu-cation Digest 2011: Comparing education statistics across the world, UIS, Montreal, 2011, p. 15.
23 United Nations, The Millennium Develop-ment Goals Report 2011, p. 21.
24 UNESCO Institute for Statistics, Global Education Digest 2011, pp. 19, 20.
25 UNESCO Institute for Statistics, Out-of-School Adolescents, p. 9. Lower secondary school age is defined at the country level; students typically enter lower secondary school between the ages of 10 and 13.
26 UNESCO Institute for Statistics, Global Education Digest 2011, p. 23.
27 UNICEF global databases, 2011, based on DHS, MICS and other surveys, 2005−2011.
28 UNESCO Institute for Statistics data reanalysed by UNICEF, 2011.
29 UNESCO Institute for Statistics, Global Education Digest 2011, pp. 15, 162.
30 United Nations Development Programme, Regional Bureau for Europe and the Com-monwealth of Independent States, At Risk: Roma and the Displaced in Southeast Europe, UNDP Regional Bureau for Europe and the Commonwealth of Independent States, Bratislava, 2006, pp. 37−38.
31 UNESCO Institute for Statistics, Global Education Digest 2011, pp. 156−164.
32 Psacharopoulos, George, and Harry A. Patrinos, ‘Returns to Education’, Education Economics, vol. 12, no. 2, August 2004, p. 113.
33 Lloyd, Cynthia B., New Lessons: The power of educating adolescent girls, Population Council, New York, 2009, p. 10.
34 Ibid., p. 2.
35 United Nations, The Millennium Develop-ment Goals Report 2011, p. 19.
36 Ibid., p. 23.
37 Lloyd, Cynthia B., New Lessons, p. 44; ‘Priorities for Adolescent Girls’ Education’ (internal document).
38 International Labour Organization, Global Employment Trends for Youth: 2011 update, ILO, Geneva, October 2011, p. 2.
39 International Labour Organization, Global Employment Trends for Youth: Special issue on the impact of the global economic crisis on youth, ILO, Geneva, August 2010, p. 9.
40 Ibid., p. 21; Radwan, Samir, ‘Arab Youth Unemployment: Economic, social and institutional exclusion and its impact on employment’, United Nations Economic and Social Commission for Western Asia, 2010, internal document, p. 12.
41 United Nations Educational, Scientific and Cultural Organization, Education for All Global Monitoring Report 2010: Reaching the marginalized, UNESCO and Oxford Uni-versity Press, Paris and Oxford, UK, 2010, p. 6.
42 International Labour Organization, Global Child Labour Developments: Measuring trends from 2004 to 2008, ILO, Geneva, 2010, pp. 3, 6, 7.
43 Viner, Russell M., et al., ‘50-year Mortality Trends in Children and Young People: A study of 50 low-income, middle-income and high-income countries’, Lancet, vol. 377, no. 9772, 2 April 2011, pp. 1162–1174.
44 World Health Organization, ‘10 Facts on Adolescent Health’, Slide 1, WHO, 2008, <www.who.int/features/factfiles/adolescent_health/facts/en/index.html>, accessed 12 February 2012.
45 World Health Organization, Child and Ado-lescent Health and Development Progress Report 2009: Highlights, p. 16.
46 World Health Organization, ‘Mortality Estimates by Cause, Age, and Sex for the Year 2008’, 2011 <www.who.int/healthinfo/global_burden_disease/en/>, accessed 21 February 2012. Patton, George C., et al., ‘Global Patterns of Mortality in Young People: A systematic analysis of population health data’, Lancet, vol. 374, no. 9693, 12 September 2009, pp. 881−892.

42 Progress for Children
47 Gore, Fiona M., et al., ‘Global Burden of Disease in Young People: A systematic analysis’, Lancet, vol. 377, no. 9783, 18 June 2011, pp. 2093–2102.
48 World Health Organization, ‘Women’s Health’.
49 Fisher, J., et al., ‘Nature, Prevalence and Determinants of Common Mental Health Problems and Their Management in Pri-mary Health Care’, International Journal of Social Psychiatry, vol. 57, suppl. 1, March 2011, pp. 9–12.
50 United Nations Children’s Fund, Mortality of Russian Teenagers from Suicide, UNICEF – Russian Federation, Moscow, 2011, p. 3.
51 Viner, Russell M., et al., ‘50-year Mortality Trends in Children and Young People’, pp. 1162–1174.
52 Patton, George C., ‘Global Patterns of Mor-tality in Young People’, p. 884.
53 World Health Organization, The Global Burden of Disease: 2004 update, WHO, Geneva, 2008; United Nations Department of Economic and Social Affairs, Population Division, World Population Prospects: The 2010 revision, CD-ROM edition, 2011. Data were reanalysed according to the UNICEF regional classification.
54 Ibid.
55 Fisher, Jane, et al., ‘Nature, Prevalence and Determinants of Common Mental Health Problems and Their Management in Pri-mary Health Care’, pp. 9–12.
56 Ibid.
57 Patel, Vikram, et al., ‘Mental Health of Young People: A global public-health chal-lenge’, Lancet, vol. 369, no. 9569, 14 April 2007, pp. 1302–1313.
58 Chang, Grace, Lon Sherritt and John R. Knight, ‘Adolescent Cigarette Smoking and Mental Health Symptoms’, Journal of Ado-lescent Health, vol. 36, no. 6, June 2005, pp. 517–522.
59 United Nations Office on Drugs and Crime, World Drug Report 2011, UNODC, Vienna, 2011, p. 22.
60 Joint United Nations Programme on HIV/AIDS, UNAIDS Report on the Global AIDS Epidemic 2010, UNAIDS, Geneva, 2010, pp. 17, 61.
61 United Nations, The Millennium Develop-ment Goals Report 2011, p. 34.
62 United Nations Children’s Fund, Progress for Children: Achieving the MDGs with equity, p. 33.
63 World Health Organization, Department of Making Pregnancy Safer, ‘Adolescent Pregnancy’, pp. 2, 8.
64 United Nations, The Millennium Develop-ment Goals Report 2011, p. 32.
65 World Health Organization, WHO Guide-lines on Preventing Early Pregnancy and Poor Reproductive Outcomes among Adolescents in Developing Countries, WHO, Geneva, 2011, pp. ix, 130.
66 United Nations Department of Economic and Social Affairs, Population Division, ‘2011 Update for the MDG Database: Ado-lescent birth rate’, POP/DB/Fert/A/MDG2011, reanalysed by UNICEF.
67 Ibid.
68 United Nations Children’s Fund, The State of the World’s Children 2012, p. 133.
69 World Health Organization. ‘Mortality Estimates by Cause, Age, and Sex for the Year 2008’, 2011; Patton, George C., et al., ‘Global Patterns of Mortality in Young People’, pp. 881−892.
70 UNICEF global databases 2011, based on DHS, MICS and other nationally representa-tive surveys for the period 2005–2010.
71 UNICEF analysis of DHS: Democratic Republic of the Congo (2007); India (2005−2006); Nigeria (2008).
72 Ibid.
73 UNAIDS estimates, 2011. Figures in paren-theses are low and high estimates.
74 Leclerc-Madlala, Suzanne, ‘Age-disparate and Intergenerational Sex in Southern Africa: The dynamics of hypervulnerability’, AIDS, vol. 22, suppl. 4, December 2008, pp. S17−S25.
75 World Health Organization, Joint United Nations Programme on HIV/AIDS and United Nations Children’s Fund, Global HIV/AIDS Response: Epidemic update and health sector progress towards Universal Access, Progress Report 2011, WHO, Geneva, 2011, p. 13.
76 World Health Organization, World Report on Disability, WHO, Geneva, 2011, p. 61.
77 Rohleder, Poul, et al., ‘HIV/AIDS and Disability in Southern Africa: A review of relevant literature’, Disability and Rehabilitation, vol. 31, no. 1, 2009, pp. 51–59, cited in UNICEF et al., Opportunity in Crisis: Preventing HIV from early adolescence to young adulthood, UNICEF, New York, June 2011, p. 10.
78 Ferrand, Rashida A., et al., ‘Undiagnosed HIV Infection among Adolescents Seeking Primary Health Care in Zimbabwe’, Clinical Infectious Diseases, vol. 51, no. 7, 1 October 2010, pp. 848–849; Ferrand, Rashida A., et al., ‘Causes of Acute Hospitalization in Adolescence: Burden and spectrum of HIV-related morbidity in a country with an early-onset and severe HIV epidemic: A prospective survey’, PLoS Medicine, vol. 7, no. 2, 2 February 2010, e1000178.
79 Pinheiro, Paulo S., World Report on Violence against Children, United Nations Secretary-General’s Study on Violence against Children, Geneva, 2006, p. 12.
80 United Nations Children’s Fund et al., Facts for Life, 4th ed., UNICEF, New York, 2010, p. 155.
81 Handicap International and Save the Children, Out from the Shadows: Sexual. violence against children with disabilities, p. 13; Groce, Nora Ellen, ‘Adolescents and Youth with Disability: Issues and chal-lenges’; World Health Organization, World Report on Disability, pp. 9, 59, 77.
82 United Nations Children’s Fund et al., Facts for Life, p. 149.
83 UNICEF global databases, 2011, based on DHS, 2005–2010.
84 Together for Girls Initiative, ‘Together for Girls We Can End Sexual Violence’, p. 3, <www.togetherforgirls.org>, accessed 21 February 2012.
85 Pinheiro, Paulo S., World Report on Vio-lence against Children, pp. 291, 292.
86 World Health Organization, WHO Multi-country Study on Women’s Health and Domestic Violence against Women: Initial results on prevalence, outcomes and women’s responses – Summary report, WHO, Geneva, 2005, p. 8.
87 Pinheiro, Paulo S., World Report on Violence against Children, p. 305; Seelke, Clare Rib-ando, Gangs in Central America, Congressio-nal Research Service, 3 January 2011, p. 4.
88 Ibid., p. 6; United Nations Human Settle-ments Programme, Strategy on Youth at Risk in Latin America, UN-Habitat, Nairobi, 2007, p. 18.
89 Viner, Russell M., et al., ‘50-year Mortality Trends in Children and Young People’, pp. 1162–1174.
90 World Health Organization, Regional Office for Europe, European Report on Preventing Violence and Knife Crime among Young People, WHO Regional Office for Europe, Copenhagen, 2010, pp. v, 3, 76, 86.
91 Ibid., pp. 11, 80, 99−101.
92 United Nations Office on Drugs and Crime, 2011 Global Study on Homicide: Trends, context, data, UNODC, Vienna, 2011, pp. 9–11, 19, 21, 49.
93 UNESCO Institute for Statistics, Out-of-School Adolescents, p. 9.
94 United Nations, The Millennium Develop-ment Goals Report 2011, p. 23.
95 United Nations Children’s Fund et al., Opportunity in Crisis, p. 24 (see table).
96 Landgren, Karin, ‘The Protective Environ-ment: Development support for child protection’, Human Rights Quarterly, vol. 27, no. 1, February 2005, pp. 214–248.
Statistical table: Adolescents 43
oVerVieW of The sTATisTiCAl TABle
The statistical table that follows presents the most recent key statistics on adolescents. It helps meet the demand for timely, reliable, comparable and comprehensive data on the state of the world’s children, including adolescents. (UNICEF has also recently begun to showcase data on adolescents in a statistical table in its flagship publication The State of the World’s Children.) The data support UNICEF’s focus on progress and results towards internationally agreed-upon goals and compacts relating to children’s rights and development. UNICEF is the lead agency responsible for global monitoring of the child-related goals of the Millennium Declaration as well as the Millennium Development Goals (MDGs) and indicators; the organization is also a key partner in the United Nations’ work on monitoring these targets and indicators.
The numbers presented in this statistical table are available online via the UNICEF global statistical website at <www.childinfo.org>. Please refer to the website for the latest tables and for any updates or corrigenda subsequent to printing.
generAl noTe on The dATAThe data presented in the following statistical table are derived from the UNICEF global databases, which include only internationally comparable and statistically sound data; these data are accompanied by definitions, sources and explanations of symbols. The statistical table draws on inter-agency estimates, data from other United Nations agencies, and nationally representative household surveys such as Multiple Indicator Cluster Surveys (MICS) and Demographic and Health Surveys (DHS). Data presented in the statistical table generally reflect information available as of July 2011. More detailed information on methodology and data sources is available at <www.childinfo.org>.
This report includes the latest population estimates and projections from World Population Prospects: The 2010 revision (United Nations Department of Economic and Social Affairs, Population Division). Data quality is likely to be adversely affected for countries that have recently suffered disasters, especially where basic country infrastructure has been fragmented or where major population movements have occurred.
Some of the data presented here are subject to evolving methodologies and revisions of time series data. For other indicators, comparable data are unavailable from one year to the next. It is therefore not advisable to compare data from consecutive editions of UNICEF publications.
Multiple indicator Cluster surveys: UNICEF supports countries in collecting statistically sound and internationally comparable data through MICS. Since 1995, nearly 240
surveys have been conducted in more than 100 countries and territories. The fourth round of MICS, involving more than 60 countries, will be completed in 2012, and planning for the fifth round of MICS is under way. MICS are among the largest sources of data for monitoring progress towards internationally agreed-upon development goals for children, including the MDGs. Many of the MICS indicators have been incorporated into the statistical table in this report. More information is available at <www.childinfo.org>.
regional classification: Regional estimates are presented only when the available data are representative of at least 50 per cent of corresponding regions, unless otherwise noted. Many estimates do not include China, as comparable data are often not available in UNICEF databases for this country. For a complete list of countries and territories in the regions and subregions, please see page 52.
data analysis: A series of United Nations inter-agency MDG monitoring groups focus on developing new methodologies, indicators and monitoring tools; building statistical capacity at the country level; developing joint estimates; and harmonizing partners’ monitoring work. UNICEF leads or plays an active role in the inter-agency monitoring groups focused on the following areas: maternal and child mortality estimation, water supply and sanitation, immunization, malaria, HIV and AIDS, and child protection. The joint estimates developed by these inter-agency monitoring groups are included in UNICEF’s global databases and are used to monitor progress towards international goals and targets, including the MDGs.

44 Progress for Children
statistical Table: Adolescents statistical Table: Adolescents (continued)population of adolescents Adolescents Adolescent Women skilled Adolescent Effective secondary youth literacy Adolescents Adolescents Adolescents Adolescents Adolescents Adolescents Adolescents Adolescents
aged 10–19 aged 10–19 birth rate aged 20–24 attendant girls transition rate school net rate (%) aged 15–19 aged 15–19 aged 15–19 aged 15–19 aged 15–19 not living with aged aged 15–19 who (thousands) as a proportion of the per 1,000 who gave at birth aged 15–19 from primary enrolment ratio 2005–2010* with exposure to who had sex who have who had who used a biological parents (%) 15–19 currently think a husband total population (%) females birth before among with a Bmi to secondary (%) media at least before age comprehensive higher-risk condom at last 2000–2010* married or is justified in aged 15–19 age 18 (%) mothers <18.5 (%) school (%) 2007–2010* once a week (%) 15 (%) knowledge sex in the last higher-risk in union hitting his under age 20 2007–2010* 2000–2010* 2005–2010* of hiV (%) 12 months (%) sex (%) Adolescents aged 10–19 living with hiV (%) wife (%) (%) 2005–2010* 2005–2010* 2005–2010* 2009† 2000–2010* 2002–2010*
Countries and territories 1950 2010 2050 1950 2010 2050 2000–2010* 2000–2010* 2006–2010* 2006–2010* male female male female male female male female Countries and territories male female male female male female male female male low–high estimate female low–high estimate aged 10–14 aged 15–17 male female male female
Afghanistan 1,785 7,771 14,921 22 25 20 151 – – – – – 38 15 – – – – Afghanistan – – – – – – – – – – – – – – – – – – Albania 267 561 275 22 18 9 20 3 100 9 – – – – 99 99 97 99 Albania 1 1 21 36 97 54 56 20 – – – – 1 2 1 8 37 24 Algeria 1,877 6,571 5,002 21 19 11 4 – 84 – 93 100 – – 94 89 – – Algeria – – – 12 – – – – <1,000 [<500–1,900] <500 [<500–<1,000] 2 2 – 2 – 66 Andorra – – – – – – 9 – – – – – 68 72 – – – – Andorra – – – – – – – – – – – – – – – – – – Angola 882 4,553 8,017 21 24 19 165 – 49 – – – – – 81 66 – – Angola – – – – – – – – 5,400 [3,800–7,500] 11,000 [8,000–15,000] – – – – – – Antigua and Barbuda – – – – – – 67 – – – 100 88 89 87 – – – – Antigua and Barbuda – – – – – – – – – – – – – – – – – – Argentina 3,147 6,797 6,158 18 17 12 65 – – – 100 100 76 85 99 99 – – Argentina – – – – – – – – 2,500 [<1,000–8,000] 1,800 [<1,000–3,100] – – – – – – Armenia 341 457 320 25 15 11 27 3 99 10 x – – 86 89 100 100 99 99 Armenia 3 <1 7 19 100 y 0 84 y – <100 [<100–<100] <100 [<100–<100] 2 4 0 7 31 22 Australia 1,136 2,911 3,648 14 13 12 17 – – – – – 87 88 – – – – Australia – – – – – – – – <500 [<200–1,100] <500 [<200–<500] – – – – – – Austria 959 942 789 14 11 9 10 – – – 100 100 – – – – – – Austria – – – – – – – – <500 [<200–1,300] <500 [<200–<1,000] – – – – – – Azerbaijan 745 1,477 1,453 26 16 13 41 4 86 12 100 98 91 94 100 100 97 95 Azerbaijan 1 <1 2 3 96 – 33 y – <100 [<100–<200] <500 [<200–<500] 1 4 0 10 63 39 Bahamas 16 59 48 21 17 11 39 – – – 100 100 83 87 – – – – Bahamas – – – – – – – – <200 [<100–<500] <500 [<100–<1,000] – – – – – – Bahrain 24 149 184 21 12 10 13 – – – 100 100 87 91 100 100 – – Bahrain – – – – – – – – – – – – – – – – – – Bangladesh 8,207 31,514 21,963 22 21 11 133 40 27 35 – – 40 43 74 77 – 63 y Bangladesh – – – 7 – – – – <500 [<200–<1,000] <500 [<200–<500] 5 19 – 46 – 41 Barbados 42 38 27 20 14 10 51 – – – 100 98 – – – – – – Barbados – – – – – – – – <100 [<100–<100] <100 [<100–<100] – – – – – – Belarus 1,601 1,075 830 21 11 10 22 – – – – – – – 100 100 – – Belarus – – – 32 – – – – <100 [<100–<100] <200 [<100–<200] 2 3 – 4 – – Belgium 1,193 1,209 1,320 14 11 11 11 – – – 100 98 – – – – – – Belgium – – – – – – – – <100 [<100–<500] <100 [<100–<100] – – – – – – Belize 14 72 73 21 23 14 91 – – – 96 97 62 68 – – – – Belize – – – 39 – 53 – 68 y <200 [<100–<200] <500 [<200–<500] 8 9 – – – 14 Benin 414 2,042 4,325 18 23 20 114 23 71 14 – – – – 65 43 83 64 Benin 13 13 31 17 96 54 42 26 1,300 [<1,000–1,900] 2,500 [1,700–3,500] 18 23 2 22 12 41 Bhutan 37 149 107 22 21 11 46 – 58 – 96 100 46 49 80 68 – – Bhutan – 2 – 22 – 1 – – <100 [<100–<100] <100 [<100–<100] 10 13 – 15 – 70 Bolivia (Plurinational Bolivia (Plurinational State of) 591 2,209 2,647 22 22 16 89 20 75 5 97 95 69 69 99 99 100 97 State of) 10 7 24 22 88 – 46 – <500 [<200–1,200] <500 [<200–<1,000] 10 14 4 13 – 17 Bosnia and Herzegovina 666 446 240 25 12 8 15 – – – – – – – 100 100 – – Bosnia and Herzegovina – 1 – 45 – 37 – 73 – – – – 0 1 – 7 – 4 Botswana 97 437 386 23 22 15 51 – 91 – – – 56 64 94 97 – – Botswana 3 2 – – – – – – 5,400 [3,800–,7600] 9,200 [7,100–12,000] 28 – – – – – Brazil 11,840 33,729 23,107 22 17 10 77 16 x 97 2 – – 78 85 97 99 – – Brazil – 33 – – – – – – 12,000 [7,000–9,000] 14,000 [8,000–23,000] – – – 25 – – Brunei Darussalam 10 64 63 20 16 11 17 – – – 100 99 88 91 100 100 – – Brunei Darussalam – – – – – – – – – – – – – – – – – – Bulgaria 1,281 724 551 18 10 10 44 – – – 98 97 84 81 98 97 – – Bulgaria – – – – – – – – <100 [<100–<100] <100 [<100–<100] – – – – – – Burkina Faso 933 3,880 9,901 22 24 21 128 27 49 27 x 76 73 18 13 47 33 70 59 Burkina Faso – 6 – 18 – 46 – 60 6,300 [4,600–8,500] 7,600 [5,300–11,000] 15 21 – 24 – 68 Burundi 530 1,947 2,200 22 23 16 30 – 71 – 90 46 10 8 77 76 – – Burundi – 3 – 30 – 30 – 26 7,300 [5,800–9,200] 10,000 [8,100–14,000] 13 14 – 10 – – Cambodia 969 3,286 2,316 22 23 12 52 9 73 28 x 82 80 36 32 89 86 88 87 Cambodia <1 <1 41 43 70 1 80 – 2,200 [1,100–4,700] 2,300 [1,000–5,500] 9 11 2 8 – 49 Cameroon 939 4,422 7,195 21 23 19 141 33 62 10 x 50 53 – – 89 77 77 61 Cameroon – 13 – 32 – 55 – 62 14,000 [11,000–19,000] 29,000 [23,000–40,000] 22 32 – 22 – 58 Canada 2,203 4,188 4,653 16 12 11 14 – – – – – – – – – – – Canada – – – – – – – – <1,000 [<500–1,300] <500 [<200–<1,000] – – – – – – Cape Verde 42 115 71 24 23 11 92 22 87 x – 92 95 – – 97 99 88 88 Cape Verde 32 11 36 37 97 79 78 64 – – – – 19 – 2 8 24 23 Central African Republic 263 1,012 1,518 20 23 18 133 38 x 60 – 59 59 13 8 72 57 – – Central African Republic 12 29 26 16 83 28 56 40 4,200 [2,600–5,800] 5,600 [3,500–7,900] 25 39 – 59 – – Chad 491 2,618 5,575 20 23 20 193 48 27 29 x – – – – 54 39 55 24 Chad – 21 – 10 – 7 – 30 4,700 [3,200–9,600] 9,400 [6,400–20,000] 16 25 – 42 – – Chile 1,195 2,817 2,095 20 16 10 53 – – – 88 100 83 86 99 99 – – Chile – – – – – – – – <1,000 [<500–2,700] <1,000 [<500–1,100] – – – – – – China 107,080 200,660 120,915 19 15 9 6 – – – – – – – 99 99 – – China – – – – – – – – 2,700 [1,700–4,200] 3,100 [1,800–5,000] – – – – – – Colombia 2,543 8,752 7,632 21 19 12 84 20 98 14 100 99 71 77 97 98 – – Colombia – 14 – 21 – 66 – 50 3,200 [1,100–11,000] 2,500 [1,100–5,800] 9 – – 14 – – Comoros 33 155 340 21 21 20 95 17 x – – – – – – 86 85 – – Comoros – – – – – – – – <100 [<100–<100] <100 [<100–<100] – – – – – – Congo 171 888 1,705 21 22 19 132 29 87 x 21 x 74 69 – – 87 78 75 63 Congo 24 23 18 8 99 79 33 20 2,600 [2,000–3,400] 4,200 [3,300–5,700] 19 26 2 19 – 76 Cook Islands – – – – – – 47 – – – – – 76 82 – – – – Cook Islands – – – – – – – – – – – – – – – – – – Costa Rica 186 836 605 19 18 10 67 – – – 98 91 – – 98 99 – – Costa Rica – – – – – – – – <500 [<200–<500] <200 [<100–<500] – – – 10 – – Côte d’Ivoire 594 4,563 7,442 23 23 18 111 29 61 – 70 67 – – 72 61 86 75 Côte d’Ivoire 17 20 30 18 97 70 57 40 15,000 [10,000–24,000] 20,000 [13,000–29,000] 28 35 2 20 – 63 Croatia 710 499 379 18 11 10 14 – – – 100 99 91 94 100 100 – – Croatia – – – – – – – – <100 [<100–<100] <100 [<100–<100] – – – – – – Cuba 1,231 1,483 848 21 13 9 50 – – – 99 99 82 83 100 100 – – Cuba – 12 – 54 – 49 – 75 <500 [<200–<1,000] <500 [<200–<500] – – – – – – Cyprus 96 154 129 20 14 10 6 – – – 100 100 95 96 100 100 – – Cyprus – – – – – – – – – – – – – – – – – – Czech Republic 1,186 1,110 1,028 13 11 10 12 – – – 100 100 – – – – – – Czech Republic – – – – – – – – <100 [<100–<100] <100 [<100–<100] – – – – – – Democratic People’s Democratic People’s Republic of Korea 2,729 4,123 3,116 28 17 12 1 – – – – – – – 100 100 – – Republic of Korea – – – 7 – – – – – – – – – – – – – – Democratic Republic Democratic Republic of the Congo 2,680 15,877 29,182 22 24 20 135 23 80 25 92 85 – – 69 62 55 43 of the Congo – 21 – 13 – 28 21 6 – [12,000 – 20,000] – [24,000–40,000] 20 26 – 25 – 72 Denmark 606 701 688 14 13 12 6 – – – 100 100 89 92 – – – – Denmark – – – – – – – – <100 [<100–<200] <100 [<100–<100] – – – – – – Djibouti 14 201 263 23 23 16 27 – – – 91 86 28 20 – – – – Djibouti – – – 16 – – – – <500 [<200–<1,000] <1,000 [<500–1,000] 8 12 – 4 – – Dominica – – – – – – 47 – – – 100 83 88 91 – – – – Dominica – – – – – – – – – – – – – – – – – – Dominican Republic 569 1,964 1,709 24 20 13 98 25 98 – 96 95 52 63 95 97 98 98 Dominican Republic 21 14 33 39 96 43 71 46 1,300 [<1,000–1,900] 2,300 [1,300–3,300] 19 – 3 19 14 6 Ecuador 697 2,829 2,465 21 20 13 100 – 97 x 5 x – – 59 60 97 97 – – Ecuador – – – – – – – – 1,100 [<500–3,700] <1,000 [<500–1,400] – – – 16 – – Egypt 4,411 15,926 16,817 21 20 14 50 7 76 4 – – 66 64 88 82 – 97 y Egypt – – 16 3 – – – – <1,000 [<500–<1,000] <500 [<500–<1,000] 1 3 – 13 – 50 yEl Salvador 499 1,462 939 23 24 12 68 – 97 5 x 96 94 54 56 95 95 – – El Salvador – – – – – – – – <1,000 [<500–3,000] <1,000 [<500–1,400] – – – 21 – – Equatorial Guinea 43 151 279 19 22 19 128 – – – – – – – 98 98 – – Equatorial Guinea – – – – – – – – <500 [<500–<1,000] 1,100 [<1,000–1,800] – – – – – – Eritrea 258 1,144 2,079 23 22 18 85 25 30 x 40 x 95 89 32 23 92 86 – 85 Eritrea – – – – – – – – <1,000 [<500–1,200] <1,000 [<1,000–1,600] 9 – – 29 – 70 Estonia 199 138 130 18 10 11 24 – – – 99 100 88 91 100 100 – – Estonia – – – – – – – – <100 [<100–<100] <100 [<100–<100] – – – – – – Ethiopia 4,042 20,535 22,488 22 25 15 109 28 7 x 33 x 90 92 – – 56 33 34 27 Ethiopia 2 11 32 21 68 7 44 27 y – – – – 14 21 2 22 53 77 Fiji 66 161 140 23 19 14 30 – – – 100 100 – – – – – – Fiji – – – – – – – – <100 [<100–<100] <100 [<100–<100] – – – – – –
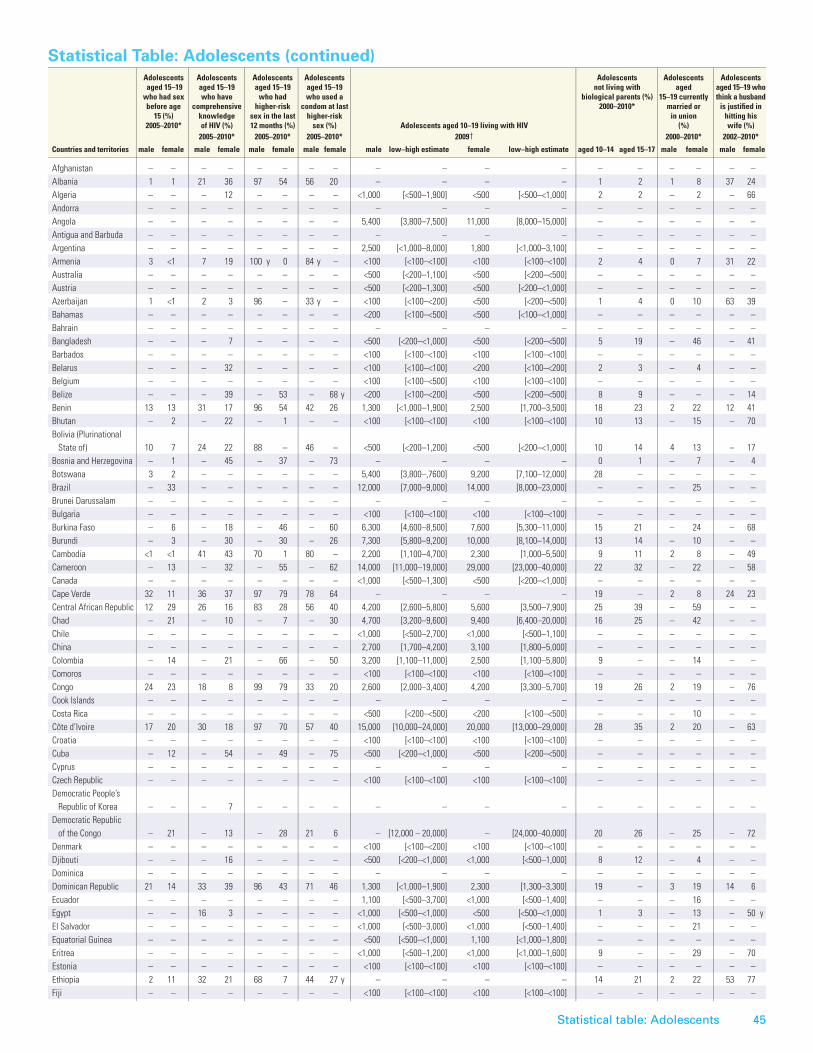
Statistical table: Adolescents 45
statistical Table: Adolescents statistical Table: Adolescents (continued)population of adolescents Adolescents Adolescent Women skilled Adolescent Effective secondary youth literacy Adolescents Adolescents Adolescents Adolescents Adolescents Adolescents Adolescents Adolescents
aged 10–19 aged 10–19 birth rate aged 20–24 attendant girls transition rate school net rate (%) aged 15–19 aged 15–19 aged 15–19 aged 15–19 aged 15–19 not living with aged aged 15–19 who (thousands) as a proportion of the per 1,000 who gave at birth aged 15–19 from primary enrolment ratio 2005–2010* with exposure to who had sex who have who had who used a biological parents (%) 15–19 currently think a husband total population (%) females birth before among with a Bmi to secondary (%) media at least before age comprehensive higher-risk condom at last 2000–2010* married or is justified in aged 15–19 age 18 (%) mothers <18.5 (%) school (%) 2007–2010* once a week (%) 15 (%) knowledge sex in the last higher-risk in union hitting his under age 20 2007–2010* 2000–2010* 2005–2010* of hiV (%) 12 months (%) sex (%) Adolescents aged 10–19 living with hiV (%) wife (%) (%) 2005–2010* 2005–2010* 2005–2010* 2009† 2000–2010* 2002–2010*
Countries and territories 1950 2010 2050 1950 2010 2050 2000–2010* 2000–2010* 2006–2010* 2006–2010* male female male female male female male female Countries and territories male female male female male female male female male low–high estimate female low–high estimate aged 10–14 aged 15–17 male female male female
Afghanistan 1,785 7,771 14,921 22 25 20 151 – – – – – 38 15 – – – – Afghanistan – – – – – – – – – – – – – – – – – – Albania 267 561 275 22 18 9 20 3 100 9 – – – – 99 99 97 99 Albania 1 1 21 36 97 54 56 20 – – – – 1 2 1 8 37 24 Algeria 1,877 6,571 5,002 21 19 11 4 – 84 – 93 100 – – 94 89 – – Algeria – – – 12 – – – – <1,000 [<500–1,900] <500 [<500–<1,000] 2 2 – 2 – 66 Andorra – – – – – – 9 – – – – – 68 72 – – – – Andorra – – – – – – – – – – – – – – – – – – Angola 882 4,553 8,017 21 24 19 165 – 49 – – – – – 81 66 – – Angola – – – – – – – – 5,400 [3,800–7,500] 11,000 [8,000–15,000] – – – – – – Antigua and Barbuda – – – – – – 67 – – – 100 88 89 87 – – – – Antigua and Barbuda – – – – – – – – – – – – – – – – – – Argentina 3,147 6,797 6,158 18 17 12 65 – – – 100 100 76 85 99 99 – – Argentina – – – – – – – – 2,500 [<1,000–8,000] 1,800 [<1,000–3,100] – – – – – – Armenia 341 457 320 25 15 11 27 3 99 10 x – – 86 89 100 100 99 99 Armenia 3 <1 7 19 100 y 0 84 y – <100 [<100–<100] <100 [<100–<100] 2 4 0 7 31 22 Australia 1,136 2,911 3,648 14 13 12 17 – – – – – 87 88 – – – – Australia – – – – – – – – <500 [<200–1,100] <500 [<200–<500] – – – – – – Austria 959 942 789 14 11 9 10 – – – 100 100 – – – – – – Austria – – – – – – – – <500 [<200–1,300] <500 [<200–<1,000] – – – – – – Azerbaijan 745 1,477 1,453 26 16 13 41 4 86 12 100 98 91 94 100 100 97 95 Azerbaijan 1 <1 2 3 96 – 33 y – <100 [<100–<200] <500 [<200–<500] 1 4 0 10 63 39 Bahamas 16 59 48 21 17 11 39 – – – 100 100 83 87 – – – – Bahamas – – – – – – – – <200 [<100–<500] <500 [<100–<1,000] – – – – – – Bahrain 24 149 184 21 12 10 13 – – – 100 100 87 91 100 100 – – Bahrain – – – – – – – – – – – – – – – – – – Bangladesh 8,207 31,514 21,963 22 21 11 133 40 27 35 – – 40 43 74 77 – 63 y Bangladesh – – – 7 – – – – <500 [<200–<1,000] <500 [<200–<500] 5 19 – 46 – 41 Barbados 42 38 27 20 14 10 51 – – – 100 98 – – – – – – Barbados – – – – – – – – <100 [<100–<100] <100 [<100–<100] – – – – – – Belarus 1,601 1,075 830 21 11 10 22 – – – – – – – 100 100 – – Belarus – – – 32 – – – – <100 [<100–<100] <200 [<100–<200] 2 3 – 4 – – Belgium 1,193 1,209 1,320 14 11 11 11 – – – 100 98 – – – – – – Belgium – – – – – – – – <100 [<100–<500] <100 [<100–<100] – – – – – – Belize 14 72 73 21 23 14 91 – – – 96 97 62 68 – – – – Belize – – – 39 – 53 – 68 y <200 [<100–<200] <500 [<200–<500] 8 9 – – – 14 Benin 414 2,042 4,325 18 23 20 114 23 71 14 – – – – 65 43 83 64 Benin 13 13 31 17 96 54 42 26 1,300 [<1,000–1,900] 2,500 [1,700–3,500] 18 23 2 22 12 41 Bhutan 37 149 107 22 21 11 46 – 58 – 96 100 46 49 80 68 – – Bhutan – 2 – 22 – 1 – – <100 [<100–<100] <100 [<100–<100] 10 13 – 15 – 70 Bolivia (Plurinational Bolivia (Plurinational State of) 591 2,209 2,647 22 22 16 89 20 75 5 97 95 69 69 99 99 100 97 State of) 10 7 24 22 88 – 46 – <500 [<200–1,200] <500 [<200–<1,000] 10 14 4 13 – 17 Bosnia and Herzegovina 666 446 240 25 12 8 15 – – – – – – – 100 100 – – Bosnia and Herzegovina – 1 – 45 – 37 – 73 – – – – 0 1 – 7 – 4 Botswana 97 437 386 23 22 15 51 – 91 – – – 56 64 94 97 – – Botswana 3 2 – – – – – – 5,400 [3,800–,7600] 9,200 [7,100–12,000] 28 – – – – – Brazil 11,840 33,729 23,107 22 17 10 77 16 x 97 2 – – 78 85 97 99 – – Brazil – 33 – – – – – – 12,000 [7,000–9,000] 14,000 [8,000–23,000] – – – 25 – – Brunei Darussalam 10 64 63 20 16 11 17 – – – 100 99 88 91 100 100 – – Brunei Darussalam – – – – – – – – – – – – – – – – – – Bulgaria 1,281 724 551 18 10 10 44 – – – 98 97 84 81 98 97 – – Bulgaria – – – – – – – – <100 [<100–<100] <100 [<100–<100] – – – – – – Burkina Faso 933 3,880 9,901 22 24 21 128 27 49 27 x 76 73 18 13 47 33 70 59 Burkina Faso – 6 – 18 – 46 – 60 6,300 [4,600–8,500] 7,600 [5,300–11,000] 15 21 – 24 – 68 Burundi 530 1,947 2,200 22 23 16 30 – 71 – 90 46 10 8 77 76 – – Burundi – 3 – 30 – 30 – 26 7,300 [5,800–9,200] 10,000 [8,100–14,000] 13 14 – 10 – – Cambodia 969 3,286 2,316 22 23 12 52 9 73 28 x 82 80 36 32 89 86 88 87 Cambodia <1 <1 41 43 70 1 80 – 2,200 [1,100–4,700] 2,300 [1,000–5,500] 9 11 2 8 – 49 Cameroon 939 4,422 7,195 21 23 19 141 33 62 10 x 50 53 – – 89 77 77 61 Cameroon – 13 – 32 – 55 – 62 14,000 [11,000–19,000] 29,000 [23,000–40,000] 22 32 – 22 – 58 Canada 2,203 4,188 4,653 16 12 11 14 – – – – – – – – – – – Canada – – – – – – – – <1,000 [<500–1,300] <500 [<200–<1,000] – – – – – – Cape Verde 42 115 71 24 23 11 92 22 87 x – 92 95 – – 97 99 88 88 Cape Verde 32 11 36 37 97 79 78 64 – – – – 19 – 2 8 24 23 Central African Republic 263 1,012 1,518 20 23 18 133 38 x 60 – 59 59 13 8 72 57 – – Central African Republic 12 29 26 16 83 28 56 40 4,200 [2,600–5,800] 5,600 [3,500–7,900] 25 39 – 59 – – Chad 491 2,618 5,575 20 23 20 193 48 27 29 x – – – – 54 39 55 24 Chad – 21 – 10 – 7 – 30 4,700 [3,200–9,600] 9,400 [6,400–20,000] 16 25 – 42 – – Chile 1,195 2,817 2,095 20 16 10 53 – – – 88 100 83 86 99 99 – – Chile – – – – – – – – <1,000 [<500–2,700] <1,000 [<500–1,100] – – – – – – China 107,080 200,660 120,915 19 15 9 6 – – – – – – – 99 99 – – China – – – – – – – – 2,700 [1,700–4,200] 3,100 [1,800–5,000] – – – – – – Colombia 2,543 8,752 7,632 21 19 12 84 20 98 14 100 99 71 77 97 98 – – Colombia – 14 – 21 – 66 – 50 3,200 [1,100–11,000] 2,500 [1,100–5,800] 9 – – 14 – – Comoros 33 155 340 21 21 20 95 17 x – – – – – – 86 85 – – Comoros – – – – – – – – <100 [<100–<100] <100 [<100–<100] – – – – – – Congo 171 888 1,705 21 22 19 132 29 87 x 21 x 74 69 – – 87 78 75 63 Congo 24 23 18 8 99 79 33 20 2,600 [2,000–3,400] 4,200 [3,300–5,700] 19 26 2 19 – 76 Cook Islands – – – – – – 47 – – – – – 76 82 – – – – Cook Islands – – – – – – – – – – – – – – – – – – Costa Rica 186 836 605 19 18 10 67 – – – 98 91 – – 98 99 – – Costa Rica – – – – – – – – <500 [<200–<500] <200 [<100–<500] – – – 10 – – Côte d’Ivoire 594 4,563 7,442 23 23 18 111 29 61 – 70 67 – – 72 61 86 75 Côte d’Ivoire 17 20 30 18 97 70 57 40 15,000 [10,000–24,000] 20,000 [13,000–29,000] 28 35 2 20 – 63 Croatia 710 499 379 18 11 10 14 – – – 100 99 91 94 100 100 – – Croatia – – – – – – – – <100 [<100–<100] <100 [<100–<100] – – – – – – Cuba 1,231 1,483 848 21 13 9 50 – – – 99 99 82 83 100 100 – – Cuba – 12 – 54 – 49 – 75 <500 [<200–<1,000] <500 [<200–<500] – – – – – – Cyprus 96 154 129 20 14 10 6 – – – 100 100 95 96 100 100 – – Cyprus – – – – – – – – – – – – – – – – – – Czech Republic 1,186 1,110 1,028 13 11 10 12 – – – 100 100 – – – – – – Czech Republic – – – – – – – – <100 [<100–<100] <100 [<100–<100] – – – – – – Democratic People’s Democratic People’s Republic of Korea 2,729 4,123 3,116 28 17 12 1 – – – – – – – 100 100 – – Republic of Korea – – – 7 – – – – – – – – – – – – – – Democratic Republic Democratic Republic of the Congo 2,680 15,877 29,182 22 24 20 135 23 80 25 92 85 – – 69 62 55 43 of the Congo – 21 – 13 – 28 21 6 – [12,000 – 20,000] – [24,000–40,000] 20 26 – 25 – 72 Denmark 606 701 688 14 13 12 6 – – – 100 100 89 92 – – – – Denmark – – – – – – – – <100 [<100–<200] <100 [<100–<100] – – – – – – Djibouti 14 201 263 23 23 16 27 – – – 91 86 28 20 – – – – Djibouti – – – 16 – – – – <500 [<200–<1,000] <1,000 [<500–1,000] 8 12 – 4 – – Dominica – – – – – – 47 – – – 100 83 88 91 – – – – Dominica – – – – – – – – – – – – – – – – – – Dominican Republic 569 1,964 1,709 24 20 13 98 25 98 – 96 95 52 63 95 97 98 98 Dominican Republic 21 14 33 39 96 43 71 46 1,300 [<1,000–1,900] 2,300 [1,300–3,300] 19 – 3 19 14 6 Ecuador 697 2,829 2,465 21 20 13 100 – 97 x 5 x – – 59 60 97 97 – – Ecuador – – – – – – – – 1,100 [<500–3,700] <1,000 [<500–1,400] – – – 16 – – Egypt 4,411 15,926 16,817 21 20 14 50 7 76 4 – – 66 64 88 82 – 97 y Egypt – – 16 3 – – – – <1,000 [<500–<1,000] <500 [<500–<1,000] 1 3 – 13 – 50 yEl Salvador 499 1,462 939 23 24 12 68 – 97 5 x 96 94 54 56 95 95 – – El Salvador – – – – – – – – <1,000 [<500–3,000] <1,000 [<500–1,400] – – – 21 – – Equatorial Guinea 43 151 279 19 22 19 128 – – – – – – – 98 98 – – Equatorial Guinea – – – – – – – – <500 [<500–<1,000] 1,100 [<1,000–1,800] – – – – – – Eritrea 258 1,144 2,079 23 22 18 85 25 30 x 40 x 95 89 32 23 92 86 – 85 Eritrea – – – – – – – – <1,000 [<500–1,200] <1,000 [<1,000–1,600] 9 – – 29 – 70 Estonia 199 138 130 18 10 11 24 – – – 99 100 88 91 100 100 – – Estonia – – – – – – – – <100 [<100–<100] <100 [<100–<100] – – – – – – Ethiopia 4,042 20,535 22,488 22 25 15 109 28 7 x 33 x 90 92 – – 56 33 34 27 Ethiopia 2 11 32 21 68 7 44 27 y – – – – 14 21 2 22 53 77 Fiji 66 161 140 23 19 14 30 – – – 100 100 – – – – – – Fiji – – – – – – – – <100 [<100–<100] <100 [<100–<100] – – – – – –
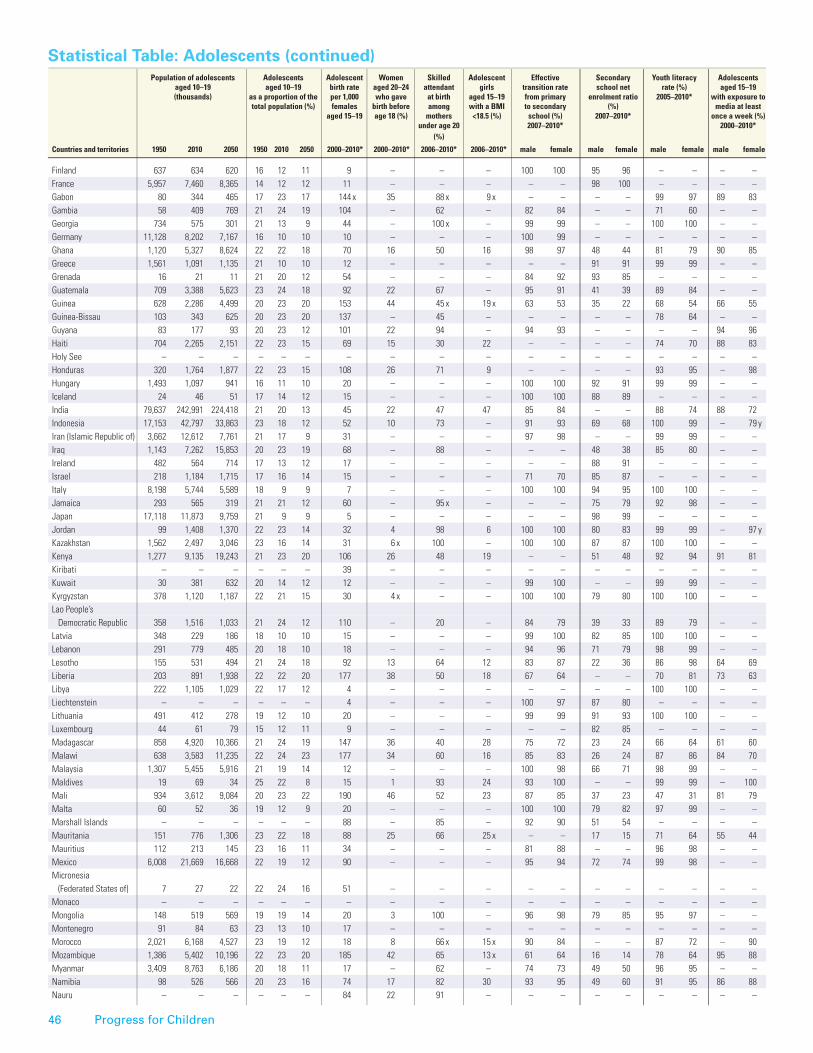
46 Progress for Children
statistical Table: Adolescents (continued) statistical Table: Adolescents (continued)population of adolescents Adolescents Adolescent Women skilled Adolescent Effective secondary youth literacy Adolescents Adolescents Adolescents Adolescents Adolescents Adolescents Adolescents Adolescents
aged 10–19 aged 10–19 birth rate aged 20–24 attendant girls transition rate school net rate (%) aged 15–19 aged 15–19 aged 15–19 aged 15–19 aged 15–19 not living with aged aged 15–19 who (thousands) as a proportion of the per 1,000 who gave at birth aged 15–19 from primary enrolment ratio 2005–2010* with exposure to who had sex who have who had who used a biological parents (%) 15–19 currently think a husband total population (%) females birth before among with a Bmi to secondary (%) media at least before age comprehensive higher-risk condom at last 2000–2010* married or is justified in aged 15–19 age 18 (%) mothers <18.5 (%) school (%) 2007–2010* once a week (%) 15 (%) knowledge sex in the last higher-risk in union hitting his under age 20 2007–2010* 2000–2010* 2005–2010* of hiV (%) 12 months (%) sex (%) Adolescents aged 10–19 living with hiV (%) wife (%) (%) 2005–2010* 2005–2010* 2005–2010* 2009† 2000–2010* 2002–2010*
Countries and territories 1950 2010 2050 1950 2010 2050 2000–2010* 2000–2010* 2006–2010* 2006–2010* male female male female male female male female Countries and territories male female male female male female male female male low–high estimate female low–high estimate aged 10–14 aged 15–17 male female male female
Finland 637 634 620 16 12 11 9 – – – 100 100 95 96 – – – – Finland – – – – – – – – <100 [<100–<200] <100 [<100–<100] – – – – – – France 5,957 7,460 8,365 14 12 12 11 – – – – – 98 100 – – – – France – – – – – – – – 2,000 [<1,000–6,300] 1,400 [<1,000–2,500] – – – – – – Gabon 80 344 465 17 23 17 144 x 35 88 x 9 x – – – – 99 97 89 83 Gabon – – – – – – – – <1,000 [<1,000–1,300] 1,900 [1,100–2,700] 22 – 2 18 – – Gambia 58 409 769 21 24 19 104 – 62 – 82 84 – – 71 60 – – Gambia – 4 – 40 – 18 – 49 <500 [<500–<1,000] 1,300 [<1,000–2,300] 21 31 – 25 – 71 Georgia 734 575 301 21 13 9 44 – 100 x – 99 99 – – 100 100 – – Georgia – – – 12 – – – – <100 [<100–<100] <100 [<100–<100] 2 7 – 11 – 5 Germany 11,128 8,202 7,167 16 10 10 10 – – – 100 99 – – – – – – Germany – – – – – – – – 1,200 [<1,000–1,500] <500 [<500–<500] – – – – – – Ghana 1,120 5,327 8,624 22 22 18 70 16 50 16 98 97 48 44 81 79 90 85 Ghana 4 8 30 28 96 74 40 24 6,800 [4,900–9,600] 12,000 [9,100–17,000] 23 27 1 8 28 41 Greece 1,561 1,091 1,135 21 10 10 12 – – – – – 91 91 99 99 – – Greece – – – – – – – – <200 [<100–<500] <100 [<100–<200] – – – – – – Grenada 16 21 11 21 20 12 54 – – – 84 92 93 85 – – – – Grenada – – – – – – – – – – – – – – – – – – Guatemala 709 3,388 5,623 23 24 18 92 22 67 – 95 91 41 39 89 84 – – Guatemala 14 7 24 20 – – – – 2,000 [<1,000–6,400] 1,600 [<1,000–2,800] – – – 20 – – Guinea 628 2,286 4,499 20 23 20 153 44 45 x 19 x 63 53 35 22 68 54 66 55 Guinea 18 20 20 17 99 47 34 24 2,500 [1,700–3,800] 4,000 [2,600–5,600] 19 – 3 36 – 79 Guinea-Bissau 103 343 625 20 23 20 137 – 45 – – – – – 78 64 – – Guinea-Bissau – 27 – 12 – 75 – 46 <500 [<500–<1,000] <1,000 [<1,000–1,400] 24 30 – 19 – 39 Guyana 83 177 93 20 23 12 101 22 94 – 94 93 – – – – 94 96 Guyana 16 10 45 53 97 52 85 59 <500 [<100–<500] <500 [<100–<1,000] 13 16 – 14 – 19 Haiti 704 2,265 2,151 22 23 15 69 15 30 22 – – – – 74 70 88 83 Haiti 42 15 34 31 99 71 33 32 4,100 [3,000–5,600] 6,500 [4,800–8,900] 25 32 2 17 – 29 Holy See – – – – – – – – – – – – – – – – – – Holy See – – – – – – – – – – – – – – – – – – Honduras 320 1,764 1,877 22 23 15 108 26 71 9 – – – – 93 95 – 98 Honduras – 10 – 28 – 21 – 23 1,200 [<500–3,800] 1,000 [<500–1,700] 15 21 – 20 – 18 Hungary 1,493 1,097 941 16 11 10 20 – – – 100 100 92 91 99 99 – – Hungary – – – – – – – – <100 [<100–<500] <100 [<100–<100] – – – – – – Iceland 24 46 51 17 14 12 15 – – – 100 100 88 89 – – – – Iceland – – – – – – – – <100 [<100–<100] <100 [<100–<100] – – – – – – India 79,637 242,991 224,418 21 20 13 45 22 47 47 85 84 – – 88 74 88 72 India 3 8 35 19 63 1 31 20 y 49,000 [43,000–56,000] 46,000 [41,000–53,000] 5 10 5 30 57 53 Indonesia 17,153 42,797 33,863 23 18 12 52 10 73 – 91 93 69 68 100 99 – 79 y Indonesia – – 2 y 6 y – – – – 1,300 [<1,000–2,100] 1,600 [<1,000–2,700] 9 – – 13 – 41 yIran (Islamic Republic of) 3,662 12,612 7,761 21 17 9 31 – – – 97 98 – – 99 99 – – Iran (Islamic Republic of) – – – – – – – – <500 [<500–<500] <500 [<500–<1,000] – – – 16 – – Iraq 1,143 7,262 15,853 20 23 19 68 – 88 – – – 48 38 85 80 – – Iraq – – – 2 – – – – – – – – 2 9 – 19 – 57 Ireland 482 564 714 17 13 12 17 – – – – – 88 91 – – – – Ireland – – – – – – – – <100 [<100–<500] <100 [<100–<100] – – – – – – Israel 218 1,184 1,715 17 16 14 15 – – – 71 70 85 87 – – – – Israel – – – – – – – – <100 [<100–<500] <100 [<100–<200] – – – – – – Italy 8,198 5,744 5,589 18 9 9 7 – – – 100 100 94 95 100 100 – – Italy – – – – – – – – <500 [<200–<500] <500 [<200–<500] – – – – – – Jamaica 293 565 319 21 21 12 60 – 95 x – – – 75 79 92 98 – – Jamaica – – – 59 – – – – <1,000 [<500–2,900] <1,000 [<500–1,500] 16 21 – 5 – 6 Japan 17,118 11,873 9,759 21 9 9 5 – – – – – 98 99 – – – – Japan – – – – – – – – <100 [<100–<500] <100 [<100–<200] – – – – – – Jordan 99 1,408 1,370 22 23 14 32 4 98 6 100 100 80 83 99 99 – 97 y Jordan – – – 12 y – – – – – – – – 1 2 – 6 – 91 yKazakhstan 1,562 2,497 3,046 23 16 14 31 6 x 100 – 100 100 87 87 100 100 – – Kazakhstan – – – 22 – – – – <500 [<200–<500] <1,000 [<1,000–1,400] – – – 5 – 7 Kenya 1,277 9,135 19,243 21 23 20 106 26 48 19 – – 51 48 92 94 91 81 Kenya 22 12 52 42 98 56 55 41 54,000 [39,000–71,000] 82,000 [61,000–110,000] 16 21 0 12 54 57 Kiribati – – – – – – 39 – – – – – – – – – – – Kiribati – – – – – – – – – – – – – – – – – – Kuwait 30 381 632 20 14 12 12 – – – 99 100 – – 99 99 – – Kuwait – – – – – – – – – – – – – – – – – – Kyrgyzstan 378 1,120 1,187 22 21 15 30 4 x – – 100 100 79 80 100 100 – – Kyrgyzstan – <1 – 19 – 11 – – <100 [<100–<200] <100 [<100–<200] 5 8 – 8 – 28 Lao People’s Lao People’s Democratic Republic 358 1,516 1,033 21 24 12 110 – 20 – 84 79 39 33 89 79 – – Democratic Republic – 9 – – – – – – <500 [<500–<500] <500 [<500–<1,000] 4 9 – – – 79 Latvia 348 229 186 18 10 10 15 – – – 99 100 82 85 100 100 – – Latvia – – – – – – – – <100 [<100–<100] <100 [<100–<100] – – – – – – Lebanon 291 779 485 20 18 10 18 – – – 94 96 71 79 98 99 – – Lebanon – – – – – – – – <100 [<100–<200] <100 [<100–<100] – – – – – – Lesotho 155 531 494 21 24 18 92 13 64 12 83 87 22 36 86 98 64 69 Lesotho 26 9 28 35 – – 65 63 6,800 [5,100–9,300] 13,000 [11,000–18,000] 40 47 1 16 54 48 Liberia 203 891 1,938 22 22 20 177 38 50 18 67 64 – – 70 81 73 63 Liberia 9 19 21 18 96 76 16 12 1,200 [<500–2,200] 1,600 [<1,000–2,900] 30 32 3 19 37 48 Libya 222 1,105 1,029 22 17 12 4 – – – – – – – 100 100 – – Libya – – – – – – – – – – – – – – – – – – Liechtenstein – – – – – – 4 – – – 100 97 87 80 – – – – Liechtenstein – – – – – – – – – – – – – – – – – – Lithuania 491 412 278 19 12 10 20 – – – 99 99 91 93 100 100 – – Lithuania – – – – – – – – <100 [<100–<100] <100 [<100–<100] – – – – – – Luxembourg 44 61 79 15 12 11 9 – – – – – 82 85 – – – – Luxembourg – – – – – – – – <100 [<100–<100] <100 [<100–<100] – – – – – – Madagascar 858 4,920 10,366 21 24 19 147 36 40 28 75 72 23 24 66 64 61 60 Madagascar 8 17 26 23 – – – – <1,000 [<500–2600] <1,000 [<500–1,100] 18 26 11 34 33 35 Malawi 638 3,583 11,235 22 24 23 177 34 60 16 85 83 26 24 87 86 84 70 Malawi 26 12 45 40 92 29 54 37 32,000 [24,000–43,000] 49,000 [38,000–66,000] 29 34 – 33 28 32 Malaysia 1,307 5,455 5,916 21 19 14 12 – – – 100 98 66 71 98 99 – – Malaysia – – – – – – – – <500 [<500–<500] <200 [<100–<500] – – – – – – Maldives 19 69 34 25 22 8 15 1 93 24 93 100 – – 99 99 – 100 Maldives – <1 – 22 y – – – – <100 [<100–<100] <100 [<100–<100] 6 15 – 5 – 41 Mali 934 3,612 9,084 20 23 22 190 46 52 23 87 85 37 23 47 31 81 79 Mali – 17 – 14 – 34 – 14 2,600 [1,100–4,800] 3,600 [1,600–6,500] 15 – – 40 – 83 Malta 60 52 36 19 12 9 20 – – – 100 100 79 82 97 99 – – Malta – – – – – – – – <100 [<100–<100] <100 [<100–<100] – – – – – – Marshall Islands – – – – – – 88 – 85 – 92 90 51 54 – – – – Marshall Islands 25 15 35 27 96 60 21 10 – – – – – – – – – – Mauritania 151 776 1,306 23 22 18 88 25 66 25 x – – 17 15 71 64 55 44 Mauritania – – 10 4 – – – – <500 [<200–1,400] <500 [<200–<1,000] 12 16 – 25 – – Mauritius 112 213 145 23 16 11 34 – – – 81 88 – – 96 98 – – Mauritius – – – – – – – – <100 [<100–<100] <100 [<100–<100] – – – – – – Mexico 6,008 21,669 16,668 22 19 12 90 – – – 95 94 72 74 99 98 – – Mexico – 4 – – – – – – 4,600 [3,400–6,700] 4,400 [3,300–6,300] – – – 15 – – Micronesia Micronesia (Federated States of) 7 27 22 22 24 16 51 – – – – – – – – – – – (Federated States of) – – – – – – – – – – – – – – – – – – Monaco – – – – – – – – – – – – – – – – – – Monaco – – – – – – – – – – – – – – – – – – Mongolia 148 519 569 19 19 14 20 3 100 – 96 98 79 85 95 97 – – Mongolia – <1 – 32 – – – – <100 [<100–<100] <100 [<100–<100] 4 5 – 4 – 17 Montenegro 91 84 63 23 13 10 17 – – – – – – – – – – – Montenegro – <1 – 29 – – – – – – – – – – – 2 – 6 Morocco 2,021 6,168 4,527 23 19 12 18 8 66 x 15 x 90 84 – – 87 72 – 90 Morocco – – – – – – – – <1,000 [<500–3,000] <1,000 [<500–1,200] – – – 11 – 64 Mozambique 1,386 5,402 10,196 22 23 20 185 42 65 13 x 61 64 16 14 78 64 95 88 Mozambique 27 23 31 37 – 43 – 43 26,000 [20,000–36,000] 63,000 [51,000–88,000] 22 34 – 40 – 37 Myanmar 3,409 8,763 6,186 20 18 11 17 – 62 – 74 73 49 50 96 95 – – Myanmar – – – 31 – – – – 5,200 [4,400–6,100] 4,900 [4,100–5,700] – – – – – – Namibia 98 526 566 20 23 16 74 17 82 30 93 95 49 60 91 95 86 88 Namibia 19 7 59 62 98 84 81 67 2,300 [1,300–3,700] 3,800 [2,400–5,600] 44 47 0 5 44 38 Nauru – – – – – – 84 22 91 – – – – – – – – – Nauru 35 15 8 8 96 70 – – – – – – – – – – – –

Statistical table: Adolescents 47
statistical Table: Adolescents (continued) statistical Table: Adolescents (continued)population of adolescents Adolescents Adolescent Women skilled Adolescent Effective secondary youth literacy Adolescents Adolescents Adolescents Adolescents Adolescents Adolescents Adolescents Adolescents
aged 10–19 aged 10–19 birth rate aged 20–24 attendant girls transition rate school net rate (%) aged 15–19 aged 15–19 aged 15–19 aged 15–19 aged 15–19 not living with aged aged 15–19 who (thousands) as a proportion of the per 1,000 who gave at birth aged 15–19 from primary enrolment ratio 2005–2010* with exposure to who had sex who have who had who used a biological parents (%) 15–19 currently think a husband total population (%) females birth before among with a Bmi to secondary (%) media at least before age comprehensive higher-risk condom at last 2000–2010* married or is justified in aged 15–19 age 18 (%) mothers <18.5 (%) school (%) 2007–2010* once a week (%) 15 (%) knowledge sex in the last higher-risk in union hitting his under age 20 2007–2010* 2000–2010* 2005–2010* of hiV (%) 12 months (%) sex (%) Adolescents aged 10–19 living with hiV (%) wife (%) (%) 2005–2010* 2005–2010* 2005–2010* 2009† 2000–2010* 2002–2010*
Countries and territories 1950 2010 2050 1950 2010 2050 2000–2010* 2000–2010* 2006–2010* 2006–2010* male female male female male female male female Countries and territories male female male female male female male female male low–high estimate female low–high estimate aged 10–14 aged 15–17 male female male female
Finland 637 634 620 16 12 11 9 – – – 100 100 95 96 – – – – Finland – – – – – – – – <100 [<100–<200] <100 [<100–<100] – – – – – – France 5,957 7,460 8,365 14 12 12 11 – – – – – 98 100 – – – – France – – – – – – – – 2,000 [<1,000–6,300] 1,400 [<1,000–2,500] – – – – – – Gabon 80 344 465 17 23 17 144 x 35 88 x 9 x – – – – 99 97 89 83 Gabon – – – – – – – – <1,000 [<1,000–1,300] 1,900 [1,100–2,700] 22 – 2 18 – – Gambia 58 409 769 21 24 19 104 – 62 – 82 84 – – 71 60 – – Gambia – 4 – 40 – 18 – 49 <500 [<500–<1,000] 1,300 [<1,000–2,300] 21 31 – 25 – 71 Georgia 734 575 301 21 13 9 44 – 100 x – 99 99 – – 100 100 – – Georgia – – – 12 – – – – <100 [<100–<100] <100 [<100–<100] 2 7 – 11 – 5 Germany 11,128 8,202 7,167 16 10 10 10 – – – 100 99 – – – – – – Germany – – – – – – – – 1,200 [<1,000–1,500] <500 [<500–<500] – – – – – – Ghana 1,120 5,327 8,624 22 22 18 70 16 50 16 98 97 48 44 81 79 90 85 Ghana 4 8 30 28 96 74 40 24 6,800 [4,900–9,600] 12,000 [9,100–17,000] 23 27 1 8 28 41 Greece 1,561 1,091 1,135 21 10 10 12 – – – – – 91 91 99 99 – – Greece – – – – – – – – <200 [<100–<500] <100 [<100–<200] – – – – – – Grenada 16 21 11 21 20 12 54 – – – 84 92 93 85 – – – – Grenada – – – – – – – – – – – – – – – – – – Guatemala 709 3,388 5,623 23 24 18 92 22 67 – 95 91 41 39 89 84 – – Guatemala 14 7 24 20 – – – – 2,000 [<1,000–6,400] 1,600 [<1,000–2,800] – – – 20 – – Guinea 628 2,286 4,499 20 23 20 153 44 45 x 19 x 63 53 35 22 68 54 66 55 Guinea 18 20 20 17 99 47 34 24 2,500 [1,700–3,800] 4,000 [2,600–5,600] 19 – 3 36 – 79 Guinea-Bissau 103 343 625 20 23 20 137 – 45 – – – – – 78 64 – – Guinea-Bissau – 27 – 12 – 75 – 46 <500 [<500–<1,000] <1,000 [<1,000–1,400] 24 30 – 19 – 39 Guyana 83 177 93 20 23 12 101 22 94 – 94 93 – – – – 94 96 Guyana 16 10 45 53 97 52 85 59 <500 [<100–<500] <500 [<100–<1,000] 13 16 – 14 – 19 Haiti 704 2,265 2,151 22 23 15 69 15 30 22 – – – – 74 70 88 83 Haiti 42 15 34 31 99 71 33 32 4,100 [3,000–5,600] 6,500 [4,800–8,900] 25 32 2 17 – 29 Holy See – – – – – – – – – – – – – – – – – – Holy See – – – – – – – – – – – – – – – – – – Honduras 320 1,764 1,877 22 23 15 108 26 71 9 – – – – 93 95 – 98 Honduras – 10 – 28 – 21 – 23 1,200 [<500–3,800] 1,000 [<500–1,700] 15 21 – 20 – 18 Hungary 1,493 1,097 941 16 11 10 20 – – – 100 100 92 91 99 99 – – Hungary – – – – – – – – <100 [<100–<500] <100 [<100–<100] – – – – – – Iceland 24 46 51 17 14 12 15 – – – 100 100 88 89 – – – – Iceland – – – – – – – – <100 [<100–<100] <100 [<100–<100] – – – – – – India 79,637 242,991 224,418 21 20 13 45 22 47 47 85 84 – – 88 74 88 72 India 3 8 35 19 63 1 31 20 y 49,000 [43,000–56,000] 46,000 [41,000–53,000] 5 10 5 30 57 53 Indonesia 17,153 42,797 33,863 23 18 12 52 10 73 – 91 93 69 68 100 99 – 79 y Indonesia – – 2 y 6 y – – – – 1,300 [<1,000–2,100] 1,600 [<1,000–2,700] 9 – – 13 – 41 yIran (Islamic Republic of) 3,662 12,612 7,761 21 17 9 31 – – – 97 98 – – 99 99 – – Iran (Islamic Republic of) – – – – – – – – <500 [<500–<500] <500 [<500–<1,000] – – – 16 – – Iraq 1,143 7,262 15,853 20 23 19 68 – 88 – – – 48 38 85 80 – – Iraq – – – 2 – – – – – – – – 2 9 – 19 – 57 Ireland 482 564 714 17 13 12 17 – – – – – 88 91 – – – – Ireland – – – – – – – – <100 [<100–<500] <100 [<100–<100] – – – – – – Israel 218 1,184 1,715 17 16 14 15 – – – 71 70 85 87 – – – – Israel – – – – – – – – <100 [<100–<500] <100 [<100–<200] – – – – – – Italy 8,198 5,744 5,589 18 9 9 7 – – – 100 100 94 95 100 100 – – Italy – – – – – – – – <500 [<200–<500] <500 [<200–<500] – – – – – – Jamaica 293 565 319 21 21 12 60 – 95 x – – – 75 79 92 98 – – Jamaica – – – 59 – – – – <1,000 [<500–2,900] <1,000 [<500–1,500] 16 21 – 5 – 6 Japan 17,118 11,873 9,759 21 9 9 5 – – – – – 98 99 – – – – Japan – – – – – – – – <100 [<100–<500] <100 [<100–<200] – – – – – – Jordan 99 1,408 1,370 22 23 14 32 4 98 6 100 100 80 83 99 99 – 97 y Jordan – – – 12 y – – – – – – – – 1 2 – 6 – 91 yKazakhstan 1,562 2,497 3,046 23 16 14 31 6 x 100 – 100 100 87 87 100 100 – – Kazakhstan – – – 22 – – – – <500 [<200–<500] <1,000 [<1,000–1,400] – – – 5 – 7 Kenya 1,277 9,135 19,243 21 23 20 106 26 48 19 – – 51 48 92 94 91 81 Kenya 22 12 52 42 98 56 55 41 54,000 [39,000–71,000] 82,000 [61,000–110,000] 16 21 0 12 54 57 Kiribati – – – – – – 39 – – – – – – – – – – – Kiribati – – – – – – – – – – – – – – – – – – Kuwait 30 381 632 20 14 12 12 – – – 99 100 – – 99 99 – – Kuwait – – – – – – – – – – – – – – – – – – Kyrgyzstan 378 1,120 1,187 22 21 15 30 4 x – – 100 100 79 80 100 100 – – Kyrgyzstan – <1 – 19 – 11 – – <100 [<100–<200] <100 [<100–<200] 5 8 – 8 – 28 Lao People’s Lao People’s Democratic Republic 358 1,516 1,033 21 24 12 110 – 20 – 84 79 39 33 89 79 – – Democratic Republic – 9 – – – – – – <500 [<500–<500] <500 [<500–<1,000] 4 9 – – – 79 Latvia 348 229 186 18 10 10 15 – – – 99 100 82 85 100 100 – – Latvia – – – – – – – – <100 [<100–<100] <100 [<100–<100] – – – – – – Lebanon 291 779 485 20 18 10 18 – – – 94 96 71 79 98 99 – – Lebanon – – – – – – – – <100 [<100–<200] <100 [<100–<100] – – – – – – Lesotho 155 531 494 21 24 18 92 13 64 12 83 87 22 36 86 98 64 69 Lesotho 26 9 28 35 – – 65 63 6,800 [5,100–9,300] 13,000 [11,000–18,000] 40 47 1 16 54 48 Liberia 203 891 1,938 22 22 20 177 38 50 18 67 64 – – 70 81 73 63 Liberia 9 19 21 18 96 76 16 12 1,200 [<500–2,200] 1,600 [<1,000–2,900] 30 32 3 19 37 48 Libya 222 1,105 1,029 22 17 12 4 – – – – – – – 100 100 – – Libya – – – – – – – – – – – – – – – – – – Liechtenstein – – – – – – 4 – – – 100 97 87 80 – – – – Liechtenstein – – – – – – – – – – – – – – – – – – Lithuania 491 412 278 19 12 10 20 – – – 99 99 91 93 100 100 – – Lithuania – – – – – – – – <100 [<100–<100] <100 [<100–<100] – – – – – – Luxembourg 44 61 79 15 12 11 9 – – – – – 82 85 – – – – Luxembourg – – – – – – – – <100 [<100–<100] <100 [<100–<100] – – – – – – Madagascar 858 4,920 10,366 21 24 19 147 36 40 28 75 72 23 24 66 64 61 60 Madagascar 8 17 26 23 – – – – <1,000 [<500–2600] <1,000 [<500–1,100] 18 26 11 34 33 35 Malawi 638 3,583 11,235 22 24 23 177 34 60 16 85 83 26 24 87 86 84 70 Malawi 26 12 45 40 92 29 54 37 32,000 [24,000–43,000] 49,000 [38,000–66,000] 29 34 – 33 28 32 Malaysia 1,307 5,455 5,916 21 19 14 12 – – – 100 98 66 71 98 99 – – Malaysia – – – – – – – – <500 [<500–<500] <200 [<100–<500] – – – – – – Maldives 19 69 34 25 22 8 15 1 93 24 93 100 – – 99 99 – 100 Maldives – <1 – 22 y – – – – <100 [<100–<100] <100 [<100–<100] 6 15 – 5 – 41 Mali 934 3,612 9,084 20 23 22 190 46 52 23 87 85 37 23 47 31 81 79 Mali – 17 – 14 – 34 – 14 2,600 [1,100–4,800] 3,600 [1,600–6,500] 15 – – 40 – 83 Malta 60 52 36 19 12 9 20 – – – 100 100 79 82 97 99 – – Malta – – – – – – – – <100 [<100–<100] <100 [<100–<100] – – – – – – Marshall Islands – – – – – – 88 – 85 – 92 90 51 54 – – – – Marshall Islands 25 15 35 27 96 60 21 10 – – – – – – – – – – Mauritania 151 776 1,306 23 22 18 88 25 66 25 x – – 17 15 71 64 55 44 Mauritania – – 10 4 – – – – <500 [<200–1,400] <500 [<200–<1,000] 12 16 – 25 – – Mauritius 112 213 145 23 16 11 34 – – – 81 88 – – 96 98 – – Mauritius – – – – – – – – <100 [<100–<100] <100 [<100–<100] – – – – – – Mexico 6,008 21,669 16,668 22 19 12 90 – – – 95 94 72 74 99 98 – – Mexico – 4 – – – – – – 4,600 [3,400–6,700] 4,400 [3,300–6,300] – – – 15 – – Micronesia Micronesia (Federated States of) 7 27 22 22 24 16 51 – – – – – – – – – – – (Federated States of) – – – – – – – – – – – – – – – – – – Monaco – – – – – – – – – – – – – – – – – – Monaco – – – – – – – – – – – – – – – – – – Mongolia 148 519 569 19 19 14 20 3 100 – 96 98 79 85 95 97 – – Mongolia – <1 – 32 – – – – <100 [<100–<100] <100 [<100–<100] 4 5 – 4 – 17 Montenegro 91 84 63 23 13 10 17 – – – – – – – – – – – Montenegro – <1 – 29 – – – – – – – – – – – 2 – 6 Morocco 2,021 6,168 4,527 23 19 12 18 8 66 x 15 x 90 84 – – 87 72 – 90 Morocco – – – – – – – – <1,000 [<500–3,000] <1,000 [<500–1,200] – – – 11 – 64 Mozambique 1,386 5,402 10,196 22 23 20 185 42 65 13 x 61 64 16 14 78 64 95 88 Mozambique 27 23 31 37 – 43 – 43 26,000 [20,000–36,000] 63,000 [51,000–88,000] 22 34 – 40 – 37 Myanmar 3,409 8,763 6,186 20 18 11 17 – 62 – 74 73 49 50 96 95 – – Myanmar – – – 31 – – – – 5,200 [4,400–6,100] 4,900 [4,100–5,700] – – – – – – Namibia 98 526 566 20 23 16 74 17 82 30 93 95 49 60 91 95 86 88 Namibia 19 7 59 62 98 84 81 67 2,300 [1,300–3,700] 3,800 [2,400–5,600] 44 47 0 5 44 38 Nauru – – – – – – 84 22 91 – – – – – – – – – Nauru 35 15 8 8 96 70 – – – – – – – – – – – –

48 Progress for Children
population of adolescents Adolescents number of Women skilled Adolescent Effective secondary youth literacy Adolescents Adolescents Adolescents Adolescents Adolescents Adolescents Adolescents Adolescents aged 10–19 aged 10–19 births per aged 20–24 attendant girls transition rate school net rate (%) aged 15-19 with aged 15-19 aged 15-19 aged 15-19 aged 15-19 not living with aged aged 15-19 who (thousands) as a proportion of the 1,000 who gave at birth aged 15–19 from primary enrolment ratio 2005–2010* with exposure to who had sex who have who had who used a biological parents (%) 15-19 currently think a husband total population (%) females birth before among with a Bmi to secondary (%) media at least before age comprehensive higher-risk condom at last 2000–2010* married or is justified in aged 15–19 age 18 (%) mothers <18.5 (%) school (%) 2007–2010* once a week (%) 15 (%) knowledge sex in the last higher-risk in union hitting his 2000–2010* 2000–2010* under age 20 2006–2010* 2007–2010* 2000–2010* 2005–2010* of hiV (%) 12 months (%) sex (%) Adolescents aged 10-19 living with hiV (thousands) (%) wife (%) 2006–2010* 2005–2010* 2005–2010* 2009 2000–2010* 2002–2010*
Countries and territories 1950 2010 2050 1950 2010 2050 male female male female male female male female male female male female male female male female male low-high estimate female low-high estimate aged 10–14 aged 15–17 male female male female
statistical Table: Adolescents (continued) statistical Table: Adolescents (continued)population of adolescents Adolescents Adolescent Women skilled Adolescent Effective secondary youth literacy Adolescents Adolescents Adolescents Adolescents Adolescents Adolescents Adolescents Adolescents
aged 10–19 aged 10–19 birth rate aged 20–24 attendant girls transition rate school net rate (%) aged 15–19 aged 15–19 aged 15–19 aged 15–19 aged 15–19 not living with aged aged 15–19 who (thousands) as a proportion of the per 1,000 who gave at birth aged 15–19 from primary enrolment ratio 2005–2010* with exposure to who had sex who have who had who used a biological parents (%) 15–19 currently think a husband total population (%) females birth before among with a Bmi to secondary (%) media at least before age comprehensive higher-risk condom at last 2000–2010* married or is justified in aged 15–19 age 18 (%) mothers <18.5 (%) school (%) 2007–2010* once a week (%) 15 (%) knowledge sex in the last higher-risk in union hitting his under age 20 2007–2010* 2000–2010* 2005–2010* of hiV (%) 12 months (%) sex (%) Adolescents aged 10–19 living with hiV (%) wife (%) (%) 2005–2010* 2005–2010* 2005–2010* 2009† 2000–2010* 2002–2010*
Countries and territories 1950 2010 2050 1950 2010 2050 2000–2010* 2000–2010* 2006–2010* 2006–2010* male female male female male female male female Countries and territories male female male female male female male female male low–high estimate female low–high estimate aged 10–14 aged 15–17 male female male female
Nepal 1,883 6,935 6,257 23 23 13 106 23 22 26 88 88 – – 87 77 88 80 Nepal 3 6 45 29 35 1 80 – 2,000 [<1,000–5,800] 1,600 [<1,000–2,600] 8 19 10 32 27 24 Netherlands 1,630 2,013 1,938 16 12 11 5 – – – – – 87 88 – – – – Netherlands – – – – – – – – <200 [<100–<1,000] <200 [<100–<500] – – – – – – New Zealand 279 618 678 15 14 12 34 – – – – – 95 97 – – – – New Zealand – – – – – – – – <100 [<100–<200] <100 [<100–<100] – – – – – – Nicaragua 300 1,326 1,016 23 23 13 109 28 76 7 x 100 94 – – 85 89 – 95 Nicaragua – 13 – – – – – – <500 [<200–<500] <200 [<200–<500] 11 – – 24 – 19 Niger 588 3,644 12,587 24 23 23 199 51 17 34 69 76 13 8 52 23 66 48 Niger 5 26 14 12 76 1 31 y – 1,600 [1,200–2,100] 2,800 [2,100–3,700] 13 – 3 59 – 68 Nigeria 8,196 35,326 80,709 22 22 21 123 28 25 19 – – 29 22 78 65 82 64 Nigeria 6 15 28 20 95 33 36 29 100,000 [76,000–130,000] 180,000 [150,000–250,000] 15 30 1 29 35 40 Niue – – – – – – 53 – – – – – – – – – – – Niue – – – – – – – – – – – – – – – – – – Norway 418 646 716 13 13 12 9 – – – 100 100 95 95 – – – – Norway – – – – – – – – <100 [<100–<200] <100 [<100–<100] – – – – – – Occupied Palestinian Occupied Palestinian Territory 207 1,022 1,746 22 25 18 60 – – – 97 97 82 87 99 99 – – Territory – – – – – – – – – – – – – – – 13 – – Oman 100 495 361 22 18 10 14 – – – – – 83 81 98 98 – – Oman – – – – – – – – <100 [<100–<100] <100 [<100–<100] – – – – – – Pakistan 8,087 39,911 39,103 22 23 14 16 10 39 – 75 73 36 29 79 61 – – Pakistan – – – 2 – – – – 3,200 [1,300–9,600] 2,100 [<1,000–3,400] – – – 16 – – Palau – – – – – – 29 – – – – – – – – – – – Palau – – – – – – – – – – – – – – – – – – Panama 174 639 653 20 18 13 87 – – – 98 99 63 69 97 96 – – Panama – – – – – – – – <1,000 [<200–1,600] <500 [<200–<1,000] – – – – – – Papua New Guinea 369 1,521 2,352 22 22 17 70 – 62 – – – – – 65 70 – – Papua New Guinea 4 4 – – – – – – <1,000 [<500–<1,000] 1,300 [<1,000–1,900] – – 3 15 – – Paraguay 343 1,376 1,520 23 21 15 65 16 x – – 90 90 58 62 99 99 – – Paraguay – 7 – – – – – – <500 [<200–1,200] <500 [<200–<500] – – – 11 – – Peru 1,666 5,771 4,833 22 20 12 69 15 82 6 97 95 – – 98 97 – 91 Peru – 6 – 17 – – – 31 1,700 [1,100–2,500] 1,100 [<1,000–1,700] 9 – – 11 – – Philippines 4,045 20,201 24,198 22 22 16 53 7 59 – 100 98 55 66 97 98 – 94 Philippines – 2 – 19 – 16 – 9 <500 [<200–1,400] <500 [<200–<1,000] – – – 10 – 15 Poland 4,735 4,487 3,275 19 12 9 16 – – – 100 99 92 94 100 100 – – Poland – – – – – – – – <500 [<100–<1,000] <200 [<100–<500] – – – – – – Portugal 1,612 1,100 819 19 10 9 16 – – – – – – – 100 100 – – Portugal – – – – – – – – <500 [<200–1,500] <500 [<200–<1,000] – – – – – – Qatar 5 136 207 21 8 8 15 – – – 100 99 65 96 98 98 – – Qatar – – – – – – – – <100 [<100–<100] <100 [<100–<100] – – – – – – Republic of Korea 4,238 6,595 4,290 22 14 9 2 – – – 100 100 98 94 – – – – Republic of Korea – – – – – – – – <500 [<100–<1,000] <200 [<100–<500] – – – – – – Republic of Moldova 473 495 251 20 14 9 24 5 100 x 16 x 99 98 79 80 99 100 99 98 Republic of Moldova 9 1 – – 94 54 65 47 <100 [<100–<100] <100 [<100–<100] 7 – 1 10 25 24 Romania 3,268 2,318 1,795 20 11 10 39 – – – 100 99 80 82 97 98 – – Romania – – – – – – – – <500 [<100–<1,000] <200 [<100–<500] – – – – – – Russian Federation 22,155 14,646 13,678 22 10 11 30 – – – 100 100 – – 100 100 – – Russian Federation – – – – – – – – 1,900 [1,500–2,300] 5,200 [4,200–6,200] – – – – – – Rwanda 471 2,314 5,139 23 22 20 43 7 83 17 x – – – – 77 77 79 60 Rwanda 15 5 49 45 96 53 37 28 5,700 [3,900–7,000] 6,900 [4,800–8,500] 21 25 1 3 – 51 Saint Kitts and Nevis – – – – – – 67 – – – 93 100 85 92 – – – – Saint Kitts and Nevis – – – – – – – – – – – – – – – – – – Saint Lucia 18 33 22 21 19 11 50 – – – 96 99 – – – – – – Saint Lucia – – – – – – – – – – – – – – – – – – Saint Vincent and Saint Vincent and the Grenadines 15 21 13 22 19 11 72 – – – – – 85 95 – – – – the Grenadines – – – – – – – – – – – – – – – – – – Samoa 19 43 41 23 23 19 29 5 86 – – – – – 99 100 97 97 Samoa – – 5 2 – – – – – – – – 13 15 1 7 50 58 San Marino – – – – – – 1 – – – 94 100 – – – – – – San Marino – – – – – – – – – – – – – – – – – – Sao Tome and Principe 7 40 49 12 24 17 110 25 86 14 73 72 30 35 95 96 96 95 Sao Tome and Principe 12 10 39 39 97 48 65 54 – – – – 23 27 1 20 25 23 Saudi Arabia 666 4,931 5,215 21 18 12 7 – – – 100 98 70 76 99 97 – – Saudi Arabia – – – – – – – – – – – – – – – – – – Senegal 522 2,941 5,530 22 24 19 96 22 51 x 34 x 74 69 – – 74 56 61 89 Senegal 13 9 21 18 98 14 44 31 1,300 [<1,000–1,800] 2,900 [2,200–4,100] 20 – 6 29 – 66 Serbia 1,311 1,225 885 19 12 10 22 – – – 100 99 89 91 99 99 – – Serbia – 1 – 43 – 73 – 87 <200 [<100–<500] <100 [<100–<200] 1 4 – 6 – 5 Seychelles – – – – – – 59 – – – 99 98 95 99 99 99 – – Seychelles – – – – – – – – – – – – – – – – – – Sierra Leone 395 1,332 2,074 21 23 19 143 40 45 16 – – – – 68 48 66 51 Sierra Leone 11 22 26 16 89 56 15 8 <1,000 [<500–1,300] 2,100 [1,300–3,600] 34 38 1 30 57 55 Singapore 215 740 574 21 15 9 5 – – – 88 94 – – 100 100 – – Singapore – – – – – – – – <100 [<100–<500] <100 [<100–<100] – – – – – – Slovakia 604 661 494 18 12 9 22 – – – 99 99 – – – – – – Slovakia – – – – – – – – <100 [<100–<100] <100 [<100–<100] – – – – – – Slovenia 265 197 187 18 10 9 5 – – – 100 99 91 92 100 100 – – Slovenia – – – – – – – – <100 [<100–<100] <100 [<100–<100] – – – – – – Solomon Islands 21 119 203 23 22 17 70 15 69 – – – 32 29 – – – – Solomon Islands 16 15 26 29 99 68 30 13 – – – – – – – – 73 72 Somalia 476 2,078 6,313 21 22 22 123 – 31 – – – – – – – – – Somalia – – – 3 – – – – 1,100 [<1,000–1,800] 2,000 [1,400–3,300] 11 14 – 25 – 75 ySouth Africa 2,825 9,956 8,442 21 20 15 54 15 93 x – 95 95 – – 97 98 – – South Africa – – – – – – – – 82,000 [74,000–92,000] 210,000 [190,000–230,000] 27 – 2 4 – – South Sudan§ – – – – – – – – – – – – – – – – – – South Sudan§ – – – – – – – – – – – – – – – – – – Spain 5,064 4,276 4,842 18 9 9 13 – – – 100 100 94 97 100 100 – – Spain – – – – – – – – 1,300 [1,000–1,600] <1,000 [<500–<1,000] – – – – – – Sri Lanka 1,611 3,173 2,843 20 15 12 23 4 98 – 97 98 – – 97 99 – – Sri Lanka – – – – – – – – <100 [<100–<200] <100 [<100–<200] – – – 9 – 54 ySudan§ – – – – – – – – – – – – – – – – – – Sudan§ – – – – – – – – – – – – – – – – – – Suriname 44 95 74 20 18 12 66 – 91 – 58 78 – – 99 99 – – Suriname – 9 – 41 – 77 – 56 <100 [<100–<500] <100 [<100–<200] 11 12 – 11 – 19 Swaziland 60 303 292 22 26 17 111 28 82 7 – – 31 26 92 95 94 89 Swaziland 2 3 52 56 99 83 94 66 3,600 [2,700–4,900] 7,400 [5,900–10,000] 40 44 0 7 59 54 Sweden 865 1,121 1,218 12 12 11 6 – – – 100 100 98 98 – – – – Sweden – – – – – – – – <100 [<100–<500] <100 [<100–<200] – – – – – – Switzerland 641 877 758 14 11 10 4 – – – 99 100 86 82 – – – – Switzerland – – – – – – – – <500 [<100–<1,000] <200 [<100–<500] – – – – – – Syrian Arab Republic 728 4,707 4,477 21 23 14 75 – 97 – 97 98 70 69 96 93 – – Syrian Arab Republic – – – 6 – – – – – – – – 1 3 – 10 – – Tajikistan 369 1,681 1,685 24 24 16 27 – 93 – – – 88 77 100 100 – – Tajikistan 4 <1 9 11 – – – – <100 [<100–<100] <100 [<100–<100] 2 4 – 6 – 85 yThailand 4,821 10,267 7,165 23 15 10 43 – 100 – – – 68 77 98 98 – – Thailand – – – 46 – – – – 9,000 [7,200–11,000] 11,000 [8,500–14,000] 19 17 – 15 – – The former Yugoslav The former Yugoslav Republic of Macedonia 256 286 173 21 14 9 20 – 100 x – 99 99 – – 99 99 – – Republic of Macedonia – 1 – 23 – 88 – 88 – – – – 1 1 – 2 – 14 Timor-Leste 94 295 589 22 26 20 54 9 33 33 – – – – – – 61 62 Timor-Leste 1 1 15 11 – – – – – – – – 12 19 0 8 72 81 Togo 294 1,393 1,892 21 23 17 89 x 19 x 71 – 82 73 – – 85 68 – – Togo – 12 – 33 – 66 – 51 2,800 [1,900–3,900] 5,600 [4,000–7,900] 23 28 – 12 – 54 Tonga 11 23 26 24 22 19 16 – – – – – – – 99 100 – – Tonga – – – – – – – – – – – – – – – – – – Trinidad and Tobago 119 196 135 19 15 10 33 – – – 92 97 – – 100 100 – – Trinidad and Tobago – 5 – 49 – 78 – 57 <500 [<200–1,200] <500 [<200–<1,000] 9 10 – 6 – 10 Tunisia 705 1,757 1,300 20 17 10 6 – – – 94 95 – – 98 96 – – Tunisia – – – – – – – – <100 [<100–<500] <100 [<100–<200] – – – – – – Turkey 4,772 13,042 10,258 22 18 11 51 8 90 1 – – 77 70 99 97 – – Turkey – – – – – – – – <200 [<100–<500] <200 [<100–<200] 2 6 – 10 – 30

Statistical table: Adolescents 49
population of adolescents Adolescents number of Women skilled Adolescent Effective secondary youth literacy Adolescents Adolescents Adolescents Adolescents Adolescents Adolescents Adolescents Adolescents aged 10–19 aged 10–19 births per aged 20–24 attendant girls transition rate school net rate (%) aged 15-19 with aged 15-19 aged 15-19 aged 15-19 aged 15-19 not living with aged aged 15-19 who
(thousands) as a proportion of the 1,000 who gave at birth aged 15–19 from primary enrolment ratio 2005–2010* with exposure to who had sex who have who had who used a biological parents (%) 15-19 currently think a husband total population (%) females birth before among with a Bmi to secondary (%) media at least before age comprehensive higher-risk condom at last 2000–2010* married or is justified in aged 15–19 age 18 (%) mothers <18.5 (%) school (%) 2007–2010* once a week (%) 15 (%) knowledge sex in the last higher-risk in union hitting his 2000–2010* 2000–2010* under age 20 2006–2010* 2007–2010* 2000–2010* 2005–2010* of hiV (%) 12 months (%) sex (%) Adolescents aged 10-19 living with hiV (thousands) (%) wife (%) 2006–2010* 2005–2010* 2005–2010* 2009 2000–2010* 2002–2010*
Countries and territories 1950 2010 2050 1950 2010 2050 male female male female male female male female male female male female male female male female male low-high estimate female low-high estimate aged 10–14 aged 15–17 male female male female
statistical Table: Adolescents (continued) statistical Table: Adolescents (continued)population of adolescents Adolescents Adolescent Women skilled Adolescent Effective secondary youth literacy Adolescents Adolescents Adolescents Adolescents Adolescents Adolescents Adolescents Adolescents
aged 10–19 aged 10–19 birth rate aged 20–24 attendant girls transition rate school net rate (%) aged 15–19 aged 15–19 aged 15–19 aged 15–19 aged 15–19 not living with aged aged 15–19 who (thousands) as a proportion of the per 1,000 who gave at birth aged 15–19 from primary enrolment ratio 2005–2010* with exposure to who had sex who have who had who used a biological parents (%) 15–19 currently think a husband total population (%) females birth before among with a Bmi to secondary (%) media at least before age comprehensive higher-risk condom at last 2000–2010* married or is justified in aged 15–19 age 18 (%) mothers <18.5 (%) school (%) 2007–2010* once a week (%) 15 (%) knowledge sex in the last higher-risk in union hitting his under age 20 2007–2010* 2000–2010* 2005–2010* of hiV (%) 12 months (%) sex (%) Adolescents aged 10–19 living with hiV (%) wife (%) (%) 2005–2010* 2005–2010* 2005–2010* 2009† 2000–2010* 2002–2010*
Countries and territories 1950 2010 2050 1950 2010 2050 2000–2010* 2000–2010* 2006–2010* 2006–2010* male female male female male female male female Countries and territories male female male female male female male female male low–high estimate female low–high estimate aged 10–14 aged 15–17 male female male female
Nepal 1,883 6,935 6,257 23 23 13 106 23 22 26 88 88 – – 87 77 88 80 Nepal 3 6 45 29 35 1 80 – 2,000 [<1,000–5,800] 1,600 [<1,000–2,600] 8 19 10 32 27 24 Netherlands 1,630 2,013 1,938 16 12 11 5 – – – – – 87 88 – – – – Netherlands – – – – – – – – <200 [<100–<1,000] <200 [<100–<500] – – – – – – New Zealand 279 618 678 15 14 12 34 – – – – – 95 97 – – – – New Zealand – – – – – – – – <100 [<100–<200] <100 [<100–<100] – – – – – – Nicaragua 300 1,326 1,016 23 23 13 109 28 76 7 x 100 94 – – 85 89 – 95 Nicaragua – 13 – – – – – – <500 [<200–<500] <200 [<200–<500] 11 – – 24 – 19 Niger 588 3,644 12,587 24 23 23 199 51 17 34 69 76 13 8 52 23 66 48 Niger 5 26 14 12 76 1 31 y – 1,600 [1,200–2,100] 2,800 [2,100–3,700] 13 – 3 59 – 68 Nigeria 8,196 35,326 80,709 22 22 21 123 28 25 19 – – 29 22 78 65 82 64 Nigeria 6 15 28 20 95 33 36 29 100,000 [76,000–130,000] 180,000 [150,000–250,000] 15 30 1 29 35 40 Niue – – – – – – 53 – – – – – – – – – – – Niue – – – – – – – – – – – – – – – – – – Norway 418 646 716 13 13 12 9 – – – 100 100 95 95 – – – – Norway – – – – – – – – <100 [<100–<200] <100 [<100–<100] – – – – – – Occupied Palestinian Occupied Palestinian Territory 207 1,022 1,746 22 25 18 60 – – – 97 97 82 87 99 99 – – Territory – – – – – – – – – – – – – – – 13 – – Oman 100 495 361 22 18 10 14 – – – – – 83 81 98 98 – – Oman – – – – – – – – <100 [<100–<100] <100 [<100–<100] – – – – – – Pakistan 8,087 39,911 39,103 22 23 14 16 10 39 – 75 73 36 29 79 61 – – Pakistan – – – 2 – – – – 3,200 [1,300–9,600] 2,100 [<1,000–3,400] – – – 16 – – Palau – – – – – – 29 – – – – – – – – – – – Palau – – – – – – – – – – – – – – – – – – Panama 174 639 653 20 18 13 87 – – – 98 99 63 69 97 96 – – Panama – – – – – – – – <1,000 [<200–1,600] <500 [<200–<1,000] – – – – – – Papua New Guinea 369 1,521 2,352 22 22 17 70 – 62 – – – – – 65 70 – – Papua New Guinea 4 4 – – – – – – <1,000 [<500–<1,000] 1,300 [<1,000–1,900] – – 3 15 – – Paraguay 343 1,376 1,520 23 21 15 65 16 x – – 90 90 58 62 99 99 – – Paraguay – 7 – – – – – – <500 [<200–1,200] <500 [<200–<500] – – – 11 – – Peru 1,666 5,771 4,833 22 20 12 69 15 82 6 97 95 – – 98 97 – 91 Peru – 6 – 17 – – – 31 1,700 [1,100–2,500] 1,100 [<1,000–1,700] 9 – – 11 – – Philippines 4,045 20,201 24,198 22 22 16 53 7 59 – 100 98 55 66 97 98 – 94 Philippines – 2 – 19 – 16 – 9 <500 [<200–1,400] <500 [<200–<1,000] – – – 10 – 15 Poland 4,735 4,487 3,275 19 12 9 16 – – – 100 99 92 94 100 100 – – Poland – – – – – – – – <500 [<100–<1,000] <200 [<100–<500] – – – – – – Portugal 1,612 1,100 819 19 10 9 16 – – – – – – – 100 100 – – Portugal – – – – – – – – <500 [<200–1,500] <500 [<200–<1,000] – – – – – – Qatar 5 136 207 21 8 8 15 – – – 100 99 65 96 98 98 – – Qatar – – – – – – – – <100 [<100–<100] <100 [<100–<100] – – – – – – Republic of Korea 4,238 6,595 4,290 22 14 9 2 – – – 100 100 98 94 – – – – Republic of Korea – – – – – – – – <500 [<100–<1,000] <200 [<100–<500] – – – – – – Republic of Moldova 473 495 251 20 14 9 24 5 100 x 16 x 99 98 79 80 99 100 99 98 Republic of Moldova 9 1 – – 94 54 65 47 <100 [<100–<100] <100 [<100–<100] 7 – 1 10 25 24 Romania 3,268 2,318 1,795 20 11 10 39 – – – 100 99 80 82 97 98 – – Romania – – – – – – – – <500 [<100–<1,000] <200 [<100–<500] – – – – – – Russian Federation 22,155 14,646 13,678 22 10 11 30 – – – 100 100 – – 100 100 – – Russian Federation – – – – – – – – 1,900 [1,500–2,300] 5,200 [4,200–6,200] – – – – – – Rwanda 471 2,314 5,139 23 22 20 43 7 83 17 x – – – – 77 77 79 60 Rwanda 15 5 49 45 96 53 37 28 5,700 [3,900–7,000] 6,900 [4,800–8,500] 21 25 1 3 – 51 Saint Kitts and Nevis – – – – – – 67 – – – 93 100 85 92 – – – – Saint Kitts and Nevis – – – – – – – – – – – – – – – – – – Saint Lucia 18 33 22 21 19 11 50 – – – 96 99 – – – – – – Saint Lucia – – – – – – – – – – – – – – – – – – Saint Vincent and Saint Vincent and the Grenadines 15 21 13 22 19 11 72 – – – – – 85 95 – – – – the Grenadines – – – – – – – – – – – – – – – – – – Samoa 19 43 41 23 23 19 29 5 86 – – – – – 99 100 97 97 Samoa – – 5 2 – – – – – – – – 13 15 1 7 50 58 San Marino – – – – – – 1 – – – 94 100 – – – – – – San Marino – – – – – – – – – – – – – – – – – – Sao Tome and Principe 7 40 49 12 24 17 110 25 86 14 73 72 30 35 95 96 96 95 Sao Tome and Principe 12 10 39 39 97 48 65 54 – – – – 23 27 1 20 25 23 Saudi Arabia 666 4,931 5,215 21 18 12 7 – – – 100 98 70 76 99 97 – – Saudi Arabia – – – – – – – – – – – – – – – – – – Senegal 522 2,941 5,530 22 24 19 96 22 51 x 34 x 74 69 – – 74 56 61 89 Senegal 13 9 21 18 98 14 44 31 1,300 [<1,000–1,800] 2,900 [2,200–4,100] 20 – 6 29 – 66 Serbia 1,311 1,225 885 19 12 10 22 – – – 100 99 89 91 99 99 – – Serbia – 1 – 43 – 73 – 87 <200 [<100–<500] <100 [<100–<200] 1 4 – 6 – 5 Seychelles – – – – – – 59 – – – 99 98 95 99 99 99 – – Seychelles – – – – – – – – – – – – – – – – – – Sierra Leone 395 1,332 2,074 21 23 19 143 40 45 16 – – – – 68 48 66 51 Sierra Leone 11 22 26 16 89 56 15 8 <1,000 [<500–1,300] 2,100 [1,300–3,600] 34 38 1 30 57 55 Singapore 215 740 574 21 15 9 5 – – – 88 94 – – 100 100 – – Singapore – – – – – – – – <100 [<100–<500] <100 [<100–<100] – – – – – – Slovakia 604 661 494 18 12 9 22 – – – 99 99 – – – – – – Slovakia – – – – – – – – <100 [<100–<100] <100 [<100–<100] – – – – – – Slovenia 265 197 187 18 10 9 5 – – – 100 99 91 92 100 100 – – Slovenia – – – – – – – – <100 [<100–<100] <100 [<100–<100] – – – – – – Solomon Islands 21 119 203 23 22 17 70 15 69 – – – 32 29 – – – – Solomon Islands 16 15 26 29 99 68 30 13 – – – – – – – – 73 72 Somalia 476 2,078 6,313 21 22 22 123 – 31 – – – – – – – – – Somalia – – – 3 – – – – 1,100 [<1,000–1,800] 2,000 [1,400–3,300] 11 14 – 25 – 75 ySouth Africa 2,825 9,956 8,442 21 20 15 54 15 93 x – 95 95 – – 97 98 – – South Africa – – – – – – – – 82,000 [74,000–92,000] 210,000 [190,000–230,000] 27 – 2 4 – – South Sudan§ – – – – – – – – – – – – – – – – – – South Sudan§ – – – – – – – – – – – – – – – – – – Spain 5,064 4,276 4,842 18 9 9 13 – – – 100 100 94 97 100 100 – – Spain – – – – – – – – 1,300 [1,000–1,600] <1,000 [<500–<1,000] – – – – – – Sri Lanka 1,611 3,173 2,843 20 15 12 23 4 98 – 97 98 – – 97 99 – – Sri Lanka – – – – – – – – <100 [<100–<200] <100 [<100–<200] – – – 9 – 54 ySudan§ – – – – – – – – – – – – – – – – – – Sudan§ – – – – – – – – – – – – – – – – – – Suriname 44 95 74 20 18 12 66 – 91 – 58 78 – – 99 99 – – Suriname – 9 – 41 – 77 – 56 <100 [<100–<500] <100 [<100–<200] 11 12 – 11 – 19 Swaziland 60 303 292 22 26 17 111 28 82 7 – – 31 26 92 95 94 89 Swaziland 2 3 52 56 99 83 94 66 3,600 [2,700–4,900] 7,400 [5,900–10,000] 40 44 0 7 59 54 Sweden 865 1,121 1,218 12 12 11 6 – – – 100 100 98 98 – – – – Sweden – – – – – – – – <100 [<100–<500] <100 [<100–<200] – – – – – – Switzerland 641 877 758 14 11 10 4 – – – 99 100 86 82 – – – – Switzerland – – – – – – – – <500 [<100–<1,000] <200 [<100–<500] – – – – – – Syrian Arab Republic 728 4,707 4,477 21 23 14 75 – 97 – 97 98 70 69 96 93 – – Syrian Arab Republic – – – 6 – – – – – – – – 1 3 – 10 – – Tajikistan 369 1,681 1,685 24 24 16 27 – 93 – – – 88 77 100 100 – – Tajikistan 4 <1 9 11 – – – – <100 [<100–<100] <100 [<100–<100] 2 4 – 6 – 85 yThailand 4,821 10,267 7,165 23 15 10 43 – 100 – – – 68 77 98 98 – – Thailand – – – 46 – – – – 9,000 [7,200–11,000] 11,000 [8,500–14,000] 19 17 – 15 – – The former Yugoslav The former Yugoslav Republic of Macedonia 256 286 173 21 14 9 20 – 100 x – 99 99 – – 99 99 – – Republic of Macedonia – 1 – 23 – 88 – 88 – – – – 1 1 – 2 – 14 Timor-Leste 94 295 589 22 26 20 54 9 33 33 – – – – – – 61 62 Timor-Leste 1 1 15 11 – – – – – – – – 12 19 0 8 72 81 Togo 294 1,393 1,892 21 23 17 89 x 19 x 71 – 82 73 – – 85 68 – – Togo – 12 – 33 – 66 – 51 2,800 [1,900–3,900] 5,600 [4,000–7,900] 23 28 – 12 – 54 Tonga 11 23 26 24 22 19 16 – – – – – – – 99 100 – – Tonga – – – – – – – – – – – – – – – – – – Trinidad and Tobago 119 196 135 19 15 10 33 – – – 92 97 – – 100 100 – – Trinidad and Tobago – 5 – 49 – 78 – 57 <500 [<200–1,200] <500 [<200–<1,000] 9 10 – 6 – 10 Tunisia 705 1,757 1,300 20 17 10 6 – – – 94 95 – – 98 96 – – Tunisia – – – – – – – – <100 [<100–<500] <100 [<100–<200] – – – – – – Turkey 4,772 13,042 10,258 22 18 11 51 8 90 1 – – 77 70 99 97 – – Turkey – – – – – – – – <200 [<100–<500] <200 [<100–<200] 2 6 – 10 – 30

50 Progress for Children
statistical Table: Adolescents (continued) statistical Table: Adolescents (continued)population of adolescents Adolescents Adolescent Women skilled Adolescent Effective secondary youth literacy Adolescents Adolescents Adolescents Adolescents Adolescents Adolescents Adolescents Adolescents
aged 10–19 aged 10–19 birth rate aged 20–24 attendant girls transition rate school net rate (%) aged 15–19 aged 15–19 aged 15–19 aged 15–19 aged 15–19 not living with aged aged 15–19 who (thousands) as a proportion of the per 1,000 who gave at birth aged 15–19 from primary enrolment ratio 2005–2010* with exposure to who had sex who have who had who used a biological parents (%) 15–19 currently think a husband total population (%) females birth before among with a Bmi to secondary (%) media at least before age comprehensive higher-risk condom at last 2000–2010* married or is justified in aged 15–19 age 18 (%) mothers <18.5 (%) school (%) 2007–2010* once a week (%) 15 (%) knowledge sex in the last higher-risk in union hitting his under age 20 2007–2010* 2000–2010* 2005–2010* of hiV (%) 12 months (%) sex (%) Adolescents aged 10–19 living with hiV (%) wife (%) (%) 2005–2010* 2005–2010* 2005–2010* 2009† 2000–2010* 2002–2010*
Countries and territories 1950 2010 2050 1950 2010 2050 2000–2010* 2000–2010* 2006–2010* 2006–2010* male female male female male female male female Countries and territories male female male female male female male female male low–high estimate female low–high estimate aged 10–14 aged 15–17 male female male female
nOtEs# For a complete list of countries and territories in the regions,
subregions and country categories, see page 52.§ Because of the cession in July 2011 of the Republic
of South Sudan by the Republic of the Sudan, and its subsequent admission to the United Nations on 14 July 2011, disaggregated data for the Sudan and South Sudan as separate States are not yet available for most indicators. Aggregated data presented are for the Sudan pre-cession (see Memorandum item preceding the Summary Indicators in the table).
– Data not available.x Data refer to years or periods other than those specified in the
column heading. Such data are not included in the calculation of regional and global averages.
y Data differ from the standard definition or refer to only part of a country. Such data are included in the calculation of regional and global averages.
* Data refer to the most recent year available during the period specified in the column heading.
** Excludes China.† Regional data on the number of adolescents living with HIV
are for the year 2010 and are derived from Global HIV/AIDS
Response: Epidemic update and health sector progress towards Universal Access – Progress report 2011, which was released in November 2011 by the World Health Organization, the Joint United Nations Programme on HIV/AIDS (UNAIDS) and UNICEF. Please note that the corresponding country data are not revised in the update and therefore refer to the year 2009.
DEFinitiOns OF thE inDiCAtOrs Adolescent birth rate – Number of births per 1,000 females 15–19 years old.
Women who gave birth before age 18 – Percentage of females 20–24 years old who gave birth before age 18. This standardized indicator from population-based surveys captures levels of fertility among adolescents up to the age of 18. Note that the data are based on the answers of females 20–24 years old, whose risk of giving birth before the age of 18 is behind them.
skilled attendant at birth – Percentage of births among mothers under 20 years old attended by skilled heath personnel (doctors, nurses or midwives).
Adolescent girls aged 15–19 with a Bmi <18.5 – Percentage of non-pregnant females 15–19 years old whose body mass index is below 18.5 kg/m2.
Effective transition rate from primary to secondary school – Number of new entrants to the first grade of secondary education in a given year, expressed as a percentage of students enrolled in the last grade of primary education in the previous year who are not repeating that grade during the year in question. Applies to general education programmes only.
secondary school net enrolment ratio – Number of children enrolled in secondary school who are of official secondary school age, expressed as a percentage of the total number of children of official secondary school age. The secondary net enrolment ratio does not include secondary-school-aged children enrolled in tertiary education, owing to challenges in age reporting and recording at that level.
youth literacy rate – Number of literate persons 15–24 years old, expressed as a percentage of the total population in that group.
Exposure to media – Percentage of the population 15–19 years old who make use of at least one of the following types of informa-tion media at least once a week: newspaper, magazine, television or radio.
sex before age 15 – Percentage of the population 15–19 years old who say they had sex before age 15.
Turkmenistan 268 1,031 828 22 20 12 21 2 97 x 16 x – – – – 100 100 – 96 Turkmenistan – – – 4 – – – – – – – – 1 3 – 5 – 37 yTuvalu – – – – – – 23 3 – – – – – – – – – – Tuvalu 19 2 57 31 55 – – – – – – – – – – – 83 69 Uganda 1,114 8,063 20,476 22 24 22 159 35 50 16 65 61 22 21 90 85 87 78 Uganda 14 12 38 31 94 44 46 36 49,000 [38,000–61,000] 78,000 [63,000–100,000] 26 33 2 20 69 70 Ukraine 7,358 4,889 3,757 20 11 10 30 3 99 – 100 100 85 85 100 100 99 99 Ukraine 3 1 33 39 96 70 74 73 <1,000 [<1,000–<1,000] 1,800 [1,400–2,200] 3 5 3 6 8 3 United Arab Emirates 15 877 924 21 12 8 22 – – – – – 82 84 94 97 – – United Arab Emirates – – – – – – – – – – – – – – – – – – United Kingdom 6,547 7,483 8,247 13 12 11 26 – – – – – 92 95 – – – – United Kingdom – – – – – – – – 1,400 [<1,000–5,200] <1,000 [<500–1,700] – – – – – – United Republic of United Republic of Tanzania 1,734 10,198 30,371 23 23 22 116 28 55 18 40 32 – – 78 76 79 70 Tanzania 8 1 41 46 95 49 41 48 47,000 [36,000–61,000] 76,000 [61,000–100,000] 21 31 4 18 39 52 United States 22,791 41,449 50,105 14 13 12 40 – – – – – 87 89 – – – – United States – – – – – – – – 17,000 [9,700–31,000] 11,000 [6,500–21,000] – – – – – – Uruguay 401 526 422 18 16 12 60 – – – 83 94 66 73 98 100 – – Uruguay – – – – – – – – <500 [<100–<1,000] <200 [<100–<500] – – – – – – Uzbekistan 1,408 5,941 4,213 22 22 12 26 4 – – 100 99 93 91 100 100 – – Uzbekistan – – – 27 – – – – <200 [<100–<500] <200 [<200–<500] 2 5 – 5 63 63 Vanuatu 11 53 88 23 22 17 92 x – 73 – – – – – 94 94 – – Vanuatu – – – 14 – – – – – – – – 13 12 – 13 – – Venezuela (Bolivarian Venezuela (Bolivarian Republic of) 1,068 5,482 5,361 21 19 13 101 – – – 98 98 67 75 98 99 – – Republic of) – – – – – – – – – – – – – – – 16 – – Viet Nam 5,583 15,807 10,291 20 18 10 35 4 74 x – – – – – 97 96 97 94 Viet Nam <1 1 – 45 52 y 4 – – <1,000 [<1,000–1,400] 1,100 [<1,000–1,700] 3 3 – 5 – 53 Yemen 926 5,974 11,630 21 25 19 80 25 x 37 – – – – – 96 72 – – Yemen – – – 2 y – – – – – – – – 2 6 – 19 – – Zambia 524 3,087 10,604 22 24 24 151 34 54 15 74 75 – – 82 67 80 71 Zambia 9 7 38 36 94 48 31 33 31,000 [24,000–41,000] 49,000 [40,000–66,000] 30 39 1 18 55 61 Zimbabwe 600 3,223 3,292 22 26 16 101 21 51 15 – – – – 98 99 68 60 Zimbabwe 5 5 – 51 97 24 54 41 44,000 [34,000–60,000] 60,000 [47,000–82,000] 34 39 – 21 – 57
MeMorAndUM§ MeMorAndUM§ Sudan and South Sudan 2,016 9,804 16,221 22 23 18 72 x 17 x 48 – 91 100 – – 89 83 – – Sudan and South Sudan – – – – – – – – 6,700 [4,900–9,900] 19,000 [14,000–28,000] 9 12 – 25 – –
Africa 49,285 228,066 415,185 21 22 19 108 25 51 18 79 77 36 30 79 70 72 65 Africa 10 14 31 23 90 36 40 31 670,000 [600,000–750,000] 1,200,000 [1,000,000–1,300,000] 17 24 2 22 – 57 Sub-Saharan Africa 40,049 196,540 386,509 22 23 20 123 28 48 20 78 76 30 24 77 67 72 61 Sub-Saharan Africa 10 14 33 25 90 36 40 31 670,000 [590,000–750,000] 1,200,000 [1,000,000–1,300,000] 19 27 2 24 43 57 Eastern and Eastern and Southern Africa 18,167 92,302 172,682 22 23 19 116 27 54 – 74 73 32 28 79 72 68 61 Southern Africa 11 12 38 33 86 34 46 37 480,000 [420,000–530,000] 800,000 [710,000–890,000] 21 27 3 19 50 60 West and Central Africa 19,851 94,232 197,344 21 23 20 130 29 45 21 80 77 29 20 73 61 74 61 West and Central Africa 8 16 27 19 94 38 35 27 190,000 [160,000–220,000] 350,000 [300,000–400,000] 18 29 1 28 – 55 Middle East and Middle East and North Africa 19,164 82,264 96,003 21 20 14 38 – 70 – 95 97 65 58 93 87 – – North Africa – – – 5 – – – – 9,400 [6,100–13,000] 14,000 [8,800–18,000] 3 6 – 15 – – Asia 253,929 655,548 533,600 21 18 12 36 19 ** 50 ** 45 ** 86 ** 85 ** 63 48 92 86 89 ** 74 ** Asia 3 ** 7 ** 30 ** 17 ** 62 ** 2 ** 33 ** 19 ** 97,000 [71,000–130,000] 90,000 [65,000–120,000] 6 ** 11 ** 5 ** 25 ** 56 ** 48 **South Asia 101,265 332,513 309,645 21 20 13 53 22 44 45 84 83 – – 85 72 88 71 South Asia 3 8 35 16 62 1 33 20 58,000 [34,000–85,000] 51,000 [30,000–75,000] 5 11 5 30 56 51 East Asia and the Pacific 152,663 323,035 223,955 20 16 10 19 8 ** 70 ** – 93 ** 93 ** 66 68 99 99 – 86 ** East Asia and the Pacific – – – 22 ** – – – – 40,000 [34,000–45,000] 40,000 [34,000–45,000] 9 ** – – 11 ** – 38 **Latin America and Latin America and the Caribbean 34,849 108,361 89,146 21 19 12 81 – 88 6 96 96 71 76 97 97 – – the Caribbean – 17 – – – – – – 33,000 [24,000–41,000] 35,000 [26,000–44,000] – – – 18 – – CEE/CIS 50,014 55,069 46,167 21 14 11 34 – – – 100 99 82 81 99 99 – – CEE/CIS – – – – – – – – 33,000 [27,000–44,000] 33,000 [27,000–44,000] 2 5 – 7 – 31 Industrialized Industrialized countries 100,787 114,933 122,298 16 12 11 22 – – – 90 92 100 100 – – countries – – – – – – – – 28,000 [23,000–34,000] 18,000 [15,000–22,000] – – – – – – Developing countries 356,851 1,061,866 1,113,911 21 19 14 56 20 ** 55 ** 32 ** 86 ** 85 ** 61 49 91 85 83 ** 72 ** Developing countries 5 ** 11 ** 30 ** 19 ** – 16 ** – 25 ** 810,000 [720,000–900,000] 1,300,000 [1,100,000–1,400,000] 10 ** 15 ** – 22 ** – 50 **Least developed Least developed countries 42,260 190,445 315,418 22 23 18 123 32 50 26 77 75 31 25 75 66 67 59 countries – 14 – 21 – 29 – 30 320,000 [290,000–360,000] 530,000 [460,000–590,000] 15 23 – 29 – 56 World 496,762 1,202,710 1,257,241 20 18 14 52 20 ** 55 ** – 86 ** 86 ** 65 55 92 87 – 72 ** World – 11 ** – 19 ** – – – – 870,000 [770,000–960,000] 1,300,000 [1,200,000–1,500,000] 10 ** 15 ** – 22 ** – 49 **
sUMMArY indiCATors# sUMMArY indiCATors#

Statistical table: Adolescents 51
statistical Table: Adolescents (continued) statistical Table: Adolescents (continued)population of adolescents Adolescents Adolescent Women skilled Adolescent Effective secondary youth literacy Adolescents Adolescents Adolescents Adolescents Adolescents Adolescents Adolescents Adolescents
aged 10–19 aged 10–19 birth rate aged 20–24 attendant girls transition rate school net rate (%) aged 15–19 aged 15–19 aged 15–19 aged 15–19 aged 15–19 not living with aged aged 15–19 who (thousands) as a proportion of the per 1,000 who gave at birth aged 15–19 from primary enrolment ratio 2005–2010* with exposure to who had sex who have who had who used a biological parents (%) 15–19 currently think a husband total population (%) females birth before among with a Bmi to secondary (%) media at least before age comprehensive higher-risk condom at last 2000–2010* married or is justified in aged 15–19 age 18 (%) mothers <18.5 (%) school (%) 2007–2010* once a week (%) 15 (%) knowledge sex in the last higher-risk in union hitting his under age 20 2007–2010* 2000–2010* 2005–2010* of hiV (%) 12 months (%) sex (%) Adolescents aged 10–19 living with hiV (%) wife (%) (%) 2005–2010* 2005–2010* 2005–2010* 2009† 2000–2010* 2002–2010*
Countries and territories 1950 2010 2050 1950 2010 2050 2000–2010* 2000–2010* 2006–2010* 2006–2010* male female male female male female male female Countries and territories male female male female male female male female male low–high estimate female low–high estimate aged 10–14 aged 15–17 male female male female
Turkmenistan 268 1,031 828 22 20 12 21 2 97 x 16 x – – – – 100 100 – 96 Turkmenistan – – – 4 – – – – – – – – 1 3 – 5 – 37 yTuvalu – – – – – – 23 3 – – – – – – – – – – Tuvalu 19 2 57 31 55 – – – – – – – – – – – 83 69 Uganda 1,114 8,063 20,476 22 24 22 159 35 50 16 65 61 22 21 90 85 87 78 Uganda 14 12 38 31 94 44 46 36 49,000 [38,000–61,000] 78,000 [63,000–100,000] 26 33 2 20 69 70 Ukraine 7,358 4,889 3,757 20 11 10 30 3 99 – 100 100 85 85 100 100 99 99 Ukraine 3 1 33 39 96 70 74 73 <1,000 [<1,000–<1,000] 1,800 [1,400–2,200] 3 5 3 6 8 3 United Arab Emirates 15 877 924 21 12 8 22 – – – – – 82 84 94 97 – – United Arab Emirates – – – – – – – – – – – – – – – – – – United Kingdom 6,547 7,483 8,247 13 12 11 26 – – – – – 92 95 – – – – United Kingdom – – – – – – – – 1,400 [<1,000–5,200] <1,000 [<500–1,700] – – – – – – United Republic of United Republic of Tanzania 1,734 10,198 30,371 23 23 22 116 28 55 18 40 32 – – 78 76 79 70 Tanzania 8 1 41 46 95 49 41 48 47,000 [36,000–61,000] 76,000 [61,000–100,000] 21 31 4 18 39 52 United States 22,791 41,449 50,105 14 13 12 40 – – – – – 87 89 – – – – United States – – – – – – – – 17,000 [9,700–31,000] 11,000 [6,500–21,000] – – – – – – Uruguay 401 526 422 18 16 12 60 – – – 83 94 66 73 98 100 – – Uruguay – – – – – – – – <500 [<100–<1,000] <200 [<100–<500] – – – – – – Uzbekistan 1,408 5,941 4,213 22 22 12 26 4 – – 100 99 93 91 100 100 – – Uzbekistan – – – 27 – – – – <200 [<100–<500] <200 [<200–<500] 2 5 – 5 63 63 Vanuatu 11 53 88 23 22 17 92 x – 73 – – – – – 94 94 – – Vanuatu – – – 14 – – – – – – – – 13 12 – 13 – – Venezuela (Bolivarian Venezuela (Bolivarian Republic of) 1,068 5,482 5,361 21 19 13 101 – – – 98 98 67 75 98 99 – – Republic of) – – – – – – – – – – – – – – – 16 – – Viet Nam 5,583 15,807 10,291 20 18 10 35 4 74 x – – – – – 97 96 97 94 Viet Nam <1 1 – 45 52 y 4 – – <1,000 [<1,000–1,400] 1,100 [<1,000–1,700] 3 3 – 5 – 53 Yemen 926 5,974 11,630 21 25 19 80 25 x 37 – – – – – 96 72 – – Yemen – – – 2 y – – – – – – – – 2 6 – 19 – – Zambia 524 3,087 10,604 22 24 24 151 34 54 15 74 75 – – 82 67 80 71 Zambia 9 7 38 36 94 48 31 33 31,000 [24,000–41,000] 49,000 [40,000–66,000] 30 39 1 18 55 61 Zimbabwe 600 3,223 3,292 22 26 16 101 21 51 15 – – – – 98 99 68 60 Zimbabwe 5 5 – 51 97 24 54 41 44,000 [34,000–60,000] 60,000 [47,000–82,000] 34 39 – 21 – 57
MeMorAndUM§ MeMorAndUM§ Sudan and South Sudan 2,016 9,804 16,221 22 23 18 72 x 17 x 48 – 91 100 – – 89 83 – – Sudan and South Sudan – – – – – – – – 6,700 [4,900–9,900] 19,000 [14,000–28,000] 9 12 – 25 – – Africa 49,285 228,066 415,185 21 22 19 108 25 51 18 79 77 36 30 79 70 72 65 Africa 10 14 31 23 90 36 40 31 670,000 [600,000–750,000] 1,200,000 [1,000,000–1,300,000] 17 24 2 22 – 57 Sub-Saharan Africa 40,049 196,540 386,509 22 23 20 123 28 48 20 78 76 30 24 77 67 72 61 Sub-Saharan Africa 10 14 33 25 90 36 40 31 670,000 [590,000–750,000] 1,200,000 [1,000,000–1,300,000] 19 27 2 24 43 57 Eastern and Eastern and Southern Africa 18,167 92,302 172,682 22 23 19 116 27 54 – 74 73 32 28 79 72 68 61 Southern Africa 11 12 38 33 86 34 46 37 480,000 [420,000–530,000] 800,000 [710,000–890,000] 21 27 3 19 50 60 West and Central Africa 19,851 94,232 197,344 21 23 20 130 29 45 21 80 77 29 20 73 61 74 61 West and Central Africa 8 16 27 19 94 38 35 27 190,000 [160,000–220,000] 350,000 [300,000–400,000] 18 29 1 28 – 55 Middle East and Middle East and North Africa 19,164 82,264 96,003 21 20 14 38 – 70 – 95 97 65 58 93 87 – – North Africa – – – 5 – – – – 9,400 [6,100–13,000] 14,000 [8,800–18,000] 3 6 – 15 – – Asia 253,929 655,548 533,600 21 18 12 36 19 ** 50 ** 45 ** 86 ** 85 ** 63 48 92 86 89 ** 74 ** Asia 3 ** 7 ** 30 ** 17 ** 62 ** 2 ** 33 ** 19 ** 97,000 [71,000–130,000] 90,000 [65,000–120,000] 6 ** 11 ** 5 ** 25 ** 56 ** 48 **South Asia 101,265 332,513 309,645 21 20 13 53 22 44 45 84 83 – – 85 72 88 71 South Asia 3 8 35 16 62 1 33 20 58,000 [34,000–85,000] 51,000 [30,000–75,000] 5 11 5 30 56 51 East Asia and the Pacific 152,663 323,035 223,955 20 16 10 19 8 ** 70 ** – 93 ** 93 ** 66 68 99 99 – 86 ** East Asia and the Pacific – – – 22 ** – – – – 40,000 [34,000–45,000] 40,000 [34,000–45,000] 9 ** – – 11 ** – 38 **Latin America and Latin America and the Caribbean 34,849 108,361 89,146 21 19 12 81 – 88 6 96 96 71 76 97 97 – – the Caribbean – 17 – – – – – – 33,000 [24,000–41,000] 35,000 [26,000–44,000] – – – 18 – – CEE/CIS 50,014 55,069 46,167 21 14 11 34 – – – 100 99 82 81 99 99 – – CEE/CIS – – – – – – – – 33,000 [27,000–44,000] 33,000 [27,000–44,000] 2 5 – 7 – 31 Industrialized Industrialized countries 100,787 114,933 122,298 16 12 11 22 – – – 90 92 100 100 – – countries – – – – – – – – 28,000 [23,000–34,000] 18,000 [15,000–22,000] – – – – – – Developing countries 356,851 1,061,866 1,113,911 21 19 14 56 20 ** 55 ** 32 ** 86 ** 85 ** 61 49 91 85 83 ** 72 ** Developing countries 5 ** 11 ** 30 ** 19 ** – 16 ** – 25 ** 810,000 [720,000–900,000] 1,300,000 [1,100,000–1,400,000] 10 ** 15 ** – 22 ** – 50 **Least developed Least developed countries 42,260 190,445 315,418 22 23 18 123 32 50 26 77 75 31 25 75 66 67 59 countries – 14 – 21 – 29 – 30 320,000 [290,000–360,000] 530,000 [460,000–590,000] 15 23 – 29 – 56 World 496,762 1,202,710 1,257,241 20 18 14 52 20 ** 55 ** – 86 ** 86 ** 65 55 92 87 – 72 ** World – 11 ** – 19 ** – – – – 870,000 [770,000–960,000] 1,300,000 [1,200,000–1,500,000] 10 ** 15 ** – 22 ** – 49 **
Comprehensive knowledge of hiV – Percentage of the popula-tion 15–19 years old who correctly identify the two major ways of preventing the sexual transmission of HIV (using condoms and limiting sex to one faithful, uninfected partner), who reject the two most common local misconceptions about HIV transmission and who know that a healthy-looking person can be HIV-positive.
higher-risk sex – Percentage of the population 15–19 years old who had sex with a non-marital, non-cohabiting partner in the last 12 months.
Condom use at last higher-risk sex – Percentage of the population 15–19 years old who have had sex with a non-marital, non-cohabiting partner during the past 12 months and who say they used a condom the last time they had sex with such a partner.
Adolescents aged 10–19 living with hiV – Estimated number of persons 10–19 years old living with HIV as of 2009.
Adolescents not living with biological parents – Percentage of the population 10–17 years old not living with either biological parent.
marital status – Percentage of the population 15–19 years old who are currently married or in union. This indicator is meant to provide a snapshot of the current marital status of boys and girls in this age group. It is worth noting that those not married at the time
of the survey are still exposed to the risk of marrying before they finish adolescence.
Justification of wife-beating – Percentage of the population 15–19 years old who consider a husband to be justified in hitting or beating his wife for at least one of the specified reasons: if his wife burns the food, argues with him, goes out without telling him, neglects the children or refuses sexual relations.
mAin DAtA sOurCEs Adolescent population – United Nations Population Division.
Adolescent birth rate – United Nations Population Division.
Women who gave birth before age 18 – Demographic and Health Surveys (DHS).
skilled attendant at birth – DHS, Multiple Indicator Cluster Surveys (MICS) and other nationally representative sources.
Adolescent girls aged 15–19 with a Bmi <18.5 – DHS.
Effective transition rate from primary to secondary school – UNESCO Institute for Statistics (UIS) global databases, 2011. Based on administrative data.
secondary school net enrolment ratio – UIS global databases, 2011. Based on administrative data.
youth literacy rate – UIS global databases, 2011. Based on administrative data.
Exposure to media – AIDS Indicator Surveys (AIS), DHS and other national household surveys.
sex before age 15 – AIS, DHS, MICS and other national house-hold surveys.
Comprehensive knowledge of hiV – AIS, DHS, MICS and other national household surveys.
higher-risk sex – AIS, DHS, MICS and other national household surveys.
Condom use at last higher-risk sex – AIS, DHS, MICS and other national household surveys.
Adolescents aged 10–19 living with hiV – Joint United Nations Programme on HIV/AIDS (UNAIDS), Report on the Global AIDS Epidemic 2010.
Adolescents not living with biological parents – DHS, MICS and other national household surveys.
marital status – DHS, MICS and other national household surveys.
Justification of wife-beating – DHS, MICS and other national household surveys.
sUMMArY indiCATors# sUMMArY indiCATors#
52 Progress for Children
regionAl ClAssifiCATion
Regional averages are calculated using data from the countries and territories as classified below.
Africa Sub-Saharan Africa; North Africa (Algeria, Egypt, Libya, Morocco, Tunisia)
sub-saharan Africa Eastern and Southern Africa; West and Central Africa; Djibouti; Sudan1
eastern and southern Africa Angola; Botswana; Burundi; Comoros; Eritrea; Ethiopia; Kenya; Lesotho; Madagascar; Malawi; Mauritius; Mozambique; Namibia; Rwanda; Seychelles; Somalia; South Africa; South Sudan1; Swaziland; Uganda; United Republic of Tanzania; Zambia; Zimbabwe
West and Central Africa Benin; Burkina Faso; Cameroon; Cape Verde; Central African Republic; Chad; Congo; Côte d’Ivoire; Democratic Republic of the Congo; Equatorial Guinea; Gabon; Gambia; Ghana; Guinea; Guinea-Bissau; Liberia; Mali; Mauritania; Niger; Nigeria; Sao Tome and Principe; Senegal; Sierra Leone; Togo
Middle east and north Africa Algeria; Bahrain; Djibouti; Egypt; Iran (Islamic Republic of); Iraq; Jordan; Kuwait; Lebanon; Libya; Morocco; Occupied Palestinian Territory; Oman; Qatar; Saudi Arabia; Sudan1; Syrian Arab Republic; Tunisia; United Arab Emirates; Yemen
Asia South Asia; East Asia and the Pacific
south Asia Afghanistan; Bangladesh; Bhutan; India; Maldives; Nepal; Pakistan; Sri Lanka
east Asia and the Pacific Brunei Darussalam; Cambodia; China; Cook Islands; Democratic People’s Republic of Korea; Fiji; Indonesia; Kiribati; Lao People’s Democratic Republic; Malaysia; Marshall Islands; Micronesia (Federated States of); Mongolia; Myanmar; Nauru; Niue; Palau; Papua New Guinea; Philippines; Republic of Korea; Samoa; Singapore; Solomon Islands; Thailand; Timor-Leste; Tonga; Tuvalu; Vanuatu; Viet Nam
latin America and the Caribbean Antigua and Barbuda; Argentina; Bahamas; Barbados; Belize; Bolivia (Plurinational State of); Brazil; Chile; Colombia; Costa Rica; Cuba; Dominica; Dominican Republic; Ecuador; El Salvador; Grenada; Guatemala; Guyana; Haiti; Honduras; Jamaica; Mexico; Nicaragua; Panama; Paraguay; Peru; Saint Kitts and Nevis; Saint Lucia; Saint Vincent and the Grenadines; Suriname; Trinidad and Tobago; Uruguay; Venezuela (Bolivarian Republic of)
Cee/Cis Albania; Armenia; Azerbaijan; Belarus; Bosnia and Herzegovina; Bulgaria; Croatia; Georgia; Kazakhstan; Kyrgyzstan; Montenegro; Republic of Moldova; Romania; Russian Federation; Serbia; Tajikistan; the former Yugoslav Republic of Macedonia; Turkey; Turkmenistan; Ukraine; Uzbekistan
industrialized countries/territories Industrialized countries/territories are defined as those not included in the UNICEF regional classification.
Andorra; Australia; Austria; Belgium; Canada; Cyprus; Czech Republic; Denmark; Estonia; Finland; France; Germany; Greece;
Holy See; Hungary; Iceland; Ireland; Israel; Italy; Japan; Latvia; Liechtenstein; Lithuania; Luxembourg; Malta; Monaco; Netherlands; New Zealand; Norway; Poland; Portugal; San Marino; Slovakia; Slovenia; Spain; Sweden; Switzerland; United Kingdom; United States
developing countries/territories Developing countries/territories are classified as such for purposes of statistical analysis only. There is no established convention for the designation of ‘developed’ and ‘developing’ countries or areas in the United Nations system.Afghanistan; Algeria; Angola; Antigua and Barbuda; Argentina; Armenia; Azerbaijan; Bahamas; Bahrain; Bangladesh; Barbados; Belize; Benin; Bhutan; Bolivia (Plurinational State of); Botswana; Brazil; Brunei Darussalam; Burkina Faso; Burundi; Cambodia; Cameroon; Cape Verde; Central African Republic; Chad; Chile; China; Colombia; Comoros; Congo; Cook Islands; Costa Rica; Côte d’Ivoire; Cuba; Cyprus; Democratic Republic of the Congo; Democratic People’s Republic of Korea; Djibouti; Dominica; Dominican Republic; Ecuador; Egypt; El Salvador; Equatorial Guinea; Eritrea; Ethiopia; Fiji; Gabon; Gambia; Georgia; Ghana; Grenada; Guatemala; Guinea; Guinea-Bissau; Guyana; Haiti; Honduras; India; Indonesia; Iran (Islamic Republic of); Iraq; Israel; Jamaica; Jordan; Kazakhstan; Kenya; Kiribati; Kuwait; Kyrgyzstan; Lao People’s Democratic Republic; Lebanon; Lesotho; Liberia; Libya; Madagascar; Malawi; Malaysia; Maldives; Mali; Marshall Islands; Mauritania; Mauritius; Mexico; Micronesia (Federated States of); Mongolia; Morocco; Mozambique; Myanmar; Namibia; Nauru; Nepal; Nicaragua; Niger; Nigeria; Niue; Occupied Palestinian Territory; Oman; Pakistan; Palau; Panama; Papua New Guinea; Paraguay; Peru; Philippines; Qatar; Republic of Korea; Rwanda; Saint Kitts and Nevis; Saint Lucia; Saint Vincent and the Grenadines; Samoa; Sao Tome and Principe; Saudi Arabia; Senegal; Seychelles; Sierra Leone; Singapore; Solomon Islands; Somalia; South Africa; South Sudan1; Sri Lanka; Sudan1; Suriname; Swaziland; Syrian Arab Republic; Tajikistan; Thailand; Timor-Leste; Togo; Tonga; Trinidad and Tobago; Tunisia; Turkey; Turkmenistan; Tuvalu; Uganda; United Arab Emirates; United Republic of Tanzania; Uruguay; Uzbekistan; Vanuatu; Venezuela (Bolivarian Republic of); Viet Nam; Yemen; Zambia; Zimbabwe
least developed countries/territories2
Least developed countries/territories are those countries and territories classified as such by the United Nations.
Afghanistan; Angola; Bangladesh; Benin; Bhutan; Burkina Faso; Burundi; Cambodia; Central African Republic; Chad; Comoros; Democratic Republic of the Congo; Djibouti; Equatorial Guinea; Eritrea; Ethiopia; Gambia; Guinea; Guinea-Bissau; Haiti; Kiribati; Lao People’s Democratic Republic; Lesotho; Liberia; Madagascar; Malawi; Mali; Mauritania; Mozambique; Myanmar; Nepal; Niger; Rwanda; Samoa; Sao Tome and Principe; Senegal; Sierra Leone; Solomon Islands; Somalia; South Sudan1; Sudan1; Timor-Leste; Togo; Tuvalu; Uganda; United Republic of Tanzania; Vanuatu; Yemen; Zambia
1 Because of the cession in July 2011 of the Republic of South Sudan by the Republic of the Sudan, and its subsequent admission to the United Nations on 14 July 2011, disaggregated data for the Sudan and South Sudan as separate States are not yet available for most indicators. Aggregated data presented are for the Sudan pre-cession, and these data are included in the Middle East and North Africa region as well as in all other categories according to the classification scheme described above.
2 For the purposes of this report, South Sudan is designated as a least developed country.

ACKnoWledgeMenTsProgress for Children: A report card on adolescents is the product of collaboration among many individuals who gave generously of their time and expertise.
We would like to thank the following partners for their contributions: Fatima Marinho, Andrea Gerger and Vilma Gawryszewski of the Pan American Health Organization (PAHO); Fiona Margaret Gore, Jane Beverly Ferguson, Colin Douglas Mathers and Véronique Joseph of the World Health Organization (WHO); and Doris Olaya and Kadiatou Sall-Beye of the International Telecommunication Union (ITU).
We are grateful for expert review by staff of UniCef regional and Country offices, particularly: Ayman Abulaban; Victor Aguayo; Bertrand Bainvel; Mereia Carling; Mark Connolly; Jean Michel Delmotte; Nina Ferencic; Joaquin Gonzalez-Aleman; Andres Lopez; Sheila Mangan; Sarah Martelli; Luz Angela Melo; Paul Nary; David Parker; Thi Minh Phuong Ngo; Marie-Pierre Poirier; Nicolas Reuge; Erin Tanner; Joachim Theis; Sheldon Yett; Yumiko Yokozeki; and the regional communication teams for facilitating contributions at all stages of publication.
PUBliCATions TeAM
editorial and research
Catherine Langevin-Falcon, Chief, Publications Section, Division of Communication; Hirut Gebre-Egziabher; Anna Grojec; Carol Holmes; Lisa Kenney; Antonius Koster; Charlotte Maitre; Meedan Mekonnen; Jennine Meyer; Kristin Moehlmann; Anne Santiago; Anastasia Warpinski; Judith Yemane; and Anne Ytreland.
statistics and monitoring
Tessa Wardlaw, Associate Director, Statistics and Monitoring, Division of Policy and Strategy; Claudia Cappa, Statistics and Monitoring Specialist; David Brown; Danielle Burke; Xiaodong Cai; Liliana Carvajal; Archana Dwivedi; Anne Genereux; Attila Hancioglu; Elizabeth Horn-Phathanothai; Priscilla Idele; Rouslan Karimov; Rolf Luyendijk; Colleen Murray; Holly Newby; Nicole Petrowski; Khin Wityee Oo; Chiho Suzuki; and Danzhen You.
Programme, policy and communication guidance
Judith Diers, Chief, Adolescent Development and Participation Unit, Programme Division; Yoka Brandt, Deputy Executive Director; Geeta Rao Gupta, Deputy Executive Director; Nicholas Alipui, Director, Programme Division; Khaled Mansour, Director, Division of Communication; Richard Morgan, Senior Advisor, Post-2015 Agenda; Maritza Ascencios; Wivina Belmonte; Rosangela Berman Bieler; Babita Bisht; Susan Bissell; Mickey Chopra; Paula Claycomb; Kathryn Donovan; Susan Durston; Rina Gill; Susan Kasedde; Christine Kenyi; Cynthia McCaffrey; Craig McClure; Luong Y. Nguyen; Rafael Obregon; Mima Perisic; Pierre Robert; Katherine Rogers; Christian Salazar; Werner Schultink; Peter Smerdon; Jordan Tamagni; Rita Ann Wallace; Juliet Young; and Maniza Zaman.
Production, translation and distribution
Jaclyn Tierney, Production Officer, Division of Communication; Marc Chalamet, French Editor; Carlos Perellón, Spanish Editor; Germain Ake; Fanuel Endalew; Jorge Peralta-Rodriguez; Elias Salem; Nogel Viyar; and Edward Ying Jr.
design and pre-press production: Prographics, Inc.
Printing: Gist and Herlin
Acknowledgements 53

United Nations Children’s Fund (UNICEF)Division of Communication3 United Nations PlazaNew York, NY 10017, USA
Website: www.unicef.orgEmail: [email protected]
© United Nations Children’s Fund (UNICEF)April 2012
Price: $15ISBN: 978-92-806-4629-0eISBN: 978-92-806-4634-4United Nations publication sales no.: E.12.XX.2
Scan this QR code to go to the UNICEF publications page: www. unicef.org/publications