PROGRESS WITHOUT EQUITY: - Women's Sports Foundation
43
www.WomensSportsFoundation.org • 800.227.3988 Center for Research on Physical Activity, Sport & Health, D’Youville College Women’s Sports Foundation SHARP Center, University of Michigan PROGRESS WITHOUT EQUITY: The Provision of High School Athletic Opportunity in the United States, by Gender 1993-94 through 2005-06 November 2011
Transcript of PROGRESS WITHOUT EQUITY: - Women's Sports Foundation

www.WomensSportsFoundation.org • 800.227.3988
Center for Research on Physical Activity, Sport & Health, D’Youville CollegeWomen’s Sports FoundationSHARP Center, University of Michigan
PROGRESS WITHOUT EQUITY:The Provision of High School Athletic Opportunity in the United States, by Gender 1993-94 through 2005-06
November 2011

Authorship and AcknowledgmentsThis report was authored by Don Sabo, Ph.D., Professor of Health Policy, D’Youville College, and Phil Veliz, M.S., University at Buffalo, the State University of New York.
This report flows from an analysis of high school athletic programs that is unprecedented in its national and historical scope. We are grateful for the Office of Civil Rights and the Department of Education for gathering and dispersing the data that made the analysis feasible. Special thanks are owed to The Margaret Fund for its continued support of this project and the advancement of gender equity in sport. We especially recognize Deborah Slaner Larkin’s enduring dedication to research on Title IX. The scholarly and empirical rigor invested in the creation of this report was substan-tially augmented by the consultative expertise of Nancy Hogshead-Makar, LLP, Donna A. Lopiano, Ph.D., Marjorie A. Snyder, Ph.D., and Susan Ware, Ph.D. Heartfelt thanks to Sr. Denise Roche, Ph.D., President of D’Youville College, for her continuing support of the Center for Research on Physical Activity, Sport & Health. We appreciate the spirit and support of SHARP leaders Carol Boyd, Ph.D., and Kathy Babiak, Ph.D. Special thanks to Deana Monahan for her editorial and graphic design expertise.
About CRPASHThe mission of the Center for Research on Physical Activity, Sport and Health (CRPASH) at D’Youville College is to design, conduct, and disseminate cutting-edge research on the links among physical activity, sport and health. We are an organizational catalyst for interdisciplinary research projects that foster education, policy development, and public health initiatives. We also specialize in get-ting knowledge and policy “off the shelf” and into communities, schools, and media, where it can impact people’s lives.
About the Women’s Sports FoundationThe Women’s Sports Foundation, founded in 1974, is the leader in promoting sports, health and education for girls and women. With Billie Jean King as its founder and ongoing visionary, the Women’s Sports Foundation continues to have a profound impact on female athletics, from its vigorous advocacy of Title IX legislation to providing grants and scholarships, grassroots programs for underserved girls, and groundbreaking research. An agent for change, the foundation has relationships with more than 1,000 of the world’s elite female athletes and is recognized globally for its leadership, vision, strength, expertise and influence. For more information, visit www.WomensSportsFoundation.org.
About the SHARP CenterEstablished in 2010, the new, first-of-its-kind, Sport, Health and Activity Research and Policy Center for Women and Girls (SHARP Center), is the result of a strategic partnership between the Women’s Sports Foundation and the University of Michigan’s Institute for Research on Women and Gender (IRWG) and School of Kinesiology. The SHARP Center generates interdisciplinary research on issues related to women’s sports, gender issues and kinesiology to enhance existing and establish new relationships with policymakers, academia and women’s sports organizations. Our vision is to build on extant understandings in order to create new knowledge that will inform policy and benefit women and girls.
Published November 2011, by the Women’s Sports Foundation® Eisenhower Park, 1899 Hempstead Turnpike, Suite 400, East Meadow, NY 11554; [email protected]; www.WomensSportsFoundation.org
© 2011, Women’s Sports Foundation, All Rights Reserved
This report may be downloaded from www.WomensSportsFoundation.org. This report may be reproduced and distributed only in its entirety. Any material taken from this report and published or transmitted in any form, electronic or mechanical, must be properly attributed to Progress Without Equity: The Provision of High School Athletic Opportunity in the United States, by Gender 1993-94 through 2005-06, published by the Women’s Sports Foundation
Preferred citation: Sabo, D. and Veliz, P. (2011). Progress Without Equity: The Provision of High School Athletic Opportunity in the United States, by Gender 1993-94 through 2005-06. East Meadow, NY: Women’s Sports Foundation.

www.WomensSportsFoundation.org • 800.227.39881Progress Without Equity: The Provision of High School Athletic Opportunity in the United States, by Gender 1993-94 through 2005-06
2 Introduction
4 Rethinking and Measuring Athletic Opportunity 6 Assessing the Provision of Athletic Opportunities in U.S. High Schools 7 Some Strengths of the Office of Civil Rights Data Collection
8 The Results 8 The Provision of Athletic Opportunities by Gender 8 The Provision of Athletic Opportunities by Gender and Type of Community 10 The Provision of Athletic Opportunities by Gender and School Economic Resources 11 Gender and Athletic Participation Opportunities across Geographic Regions 12 The Number of Sports and Teams by Gender 13 The Number of Sports and Teams by Gender and Type of Community 15 The Number of Sports and Teams by Gender and School Economic Resources 17 The Number of Sports and Teams by Gender and Geographic Region 19 Changes in the Gender Equity Ratio between 1993-94 and 2005-06 20 State-by-State Comparisons, Change in the Provision of Athletic Opportunity
30 Conclusion
33 Appendix A: Design and Data Analysis
34 Appendix B: Summary of Measurement Procedures for the Tables in this Report
38 Endnotes
TABLE OF CONTENTS

www.WomensSportsFoundation.org • 800.227.39882Progress Without Equity: The Provision of High School Athletic Opportunity in the United States, by Gender 1993-94 through 2005-06
Interscholastic sport is a U.S. social institution that
directly engages and impacts millions of adolescents,
as well as their families and communities. The National
Center for Education Statistics (2009) reports that among
various extracurricular activities provided by high schools,
interscholastic sports had the highest percentage of seniors
(38.8%) who participated in this school-based activity in
2004, followed by academic clubs (21.3%), vocational clubs
(21.3%), band (21%), vocational clubs (15.6%) and hobby
clubs (11.7%)1. Since the passage of Title IX in 1972, more
girls have tapped the social capital attached to sport along
with boys. Yet athletic opportunity in U.S. high schools is not
shared equally between the sexes. Protracted legal struggles
for gender equity continue, and many parents are frustrated
because their daughters are being shortchanged.2
There are three compelling reasons to study gender
differences in the provision of high school athletic
opportunities in the United States. First, a great deal of
research now points to the significant links between high
school athletic participation and the health and well-being
of both girls and boys. At a time when health reform has
become a national priority, policymakers increasingly
realize that interscholastic sports can be tapped as a
public health resource for American youth and families.
Second, a variety of research studies show that high school
athletic participation is favorably associated with academic
achievement, test scores, performance on standardized
tests, GPA and reduced dropout rates. And finally, despite
growing evidence that interscholastic sports are a health
and educational asset for American youth, there is
surprisingly little research on national trends in the provision
of athletic opportunities to girls and boys.
Because sport is such a dominant institutional practice
and modal life course experience for millions of youth,
the lack of systematic analysis and evaluation is striking.
The scarcity of reliable information has meant that policy
discussions and social planning efforts that pertain to
gender equity in U.S. high school sports were frequently
based on political contention rather than evidence. On
the policy front, the lack of facts and analysis also allowed
those who benefit from the political status quo of gender
inequality to run “business as usual,” while those who seek
equality and educational reform were stymied by insufficient
evidence to support their goals. In contrast, for those who
seek gender equity in interscholastic sports, evidence-based
research can underpin both advocacy and policy reform.
This study merged and analyzed survey data from two
government-sponsored nationwide databases (discussed
below), which allowed us to examine a nationally
INTRODUCTION

www.WomensSportsFoundation.org • 800.227.39883Progress Without Equity: The Provision of High School Athletic Opportunity in the United States, by Gender 1993-94 through 2005-06
representative sample of 24,370 public four-year high
schools between 1993-94, 1999-2000 and 2005-06.
Three measures of the extent of athletic opportunity in
each high school were used in the analysis: (1) the number
of participation opportunities, (2) the number of athletic
teams and (3) the number of sports. The main purpose
of the study was to describe and compare the provision of
interscholastic athletic opportunities of U.S. boys and girls
across the timeframe. We also show how the provision
of athletic opportunities varied by geographic region (i.e.,
Northeast, Midwest, South and West) and by the type of
community in which the school was located (i.e., urban,
suburban, town and rural). Finally, we used the percentage
of a school population eligible for free lunch as a proxy
measure to examine whether a school’s general economic
resources are tied to gender differences in the provision of
athletic opportunities.

www.WomensSportsFoundation.org • 800.227.39884Progress Without Equity: The Provision of High School Athletic Opportunity in the United States, by Gender 1993-94 through 2005-06
We define an “athletic opportunity” as a situation or
condition within a school that allows or enables a young
person to participate in some type of athletic activity. School
boards, administrators and athletic directors make decisions
about the number and kinds of athletic programs that are
offered in the school during the academic year. School
officials also designate how many students participate on
each team and whether rosters are open, capped or subject
to tryouts.
The definition of an “athletic opportunity” used in this
research study is not considered something that an
individual young person does, creates or initiates by virtue
of her or his participation. But rather, athletic opportunities
are viewed as resources that high schools provide to the
members of the student body. The policies and practices
in one school may generate many athletic opportunities for
its students, and another school may offer few. With regard
to gender equity, therefore, one overarching question is
whether boys and girls within a school or school district
receive fair shares of the athletic opportunities provided by
school leaders. Consistent with Title IX, the policies and
practices that guide the provision of athletic opportunities
by school officials should follow the statute:
“No person in the United States shall, on the basis of sex,
be excluded from participation in, be denied the benefits
of, or be subjected to discrimination under any education
program or activity receiving Federal financial assistance…”
School leaders create and allocate athletic opportunities to
their students in basically three ways.
(1) Schools provide a varying number of athletic
participation opportunities for their female and male
students. A softball team, for example, may have 20
members that translate to 20 athletic participation
opportunities. Note that the number of athletic
participation opportunities within a particular school
probably never equals the number of students involved
with sports because many boys and girls play multiple
sports. This means that some students take advantage
of more than one of the total athletic participation
opportunities provided by the school.3 When measuring
the provision of athletic participation opportunities in a
school, therefore, it makes sense to count each athletic
participation opportunity provided by the school rather
than the number of athletes in a school.
RETHINKING AND MEASURING ATHLETIC OPPORTUNITY

www.WomensSportsFoundation.org • 800.227.39885Progress Without Equity: The Provision of High School Athletic Opportunity in the United States, by Gender 1993-94 through 2005-06
(2) A school leadership creates policy goals, allocates
funds and administers a number of sports for its
students to select from and participate in. For example,
one school may sponsor basketball, football, track and
field, and lacrosse for boys, and basketball, volleyball,
track and field, and lacrosse for girls.
(3) A school provides a number of teams for its students.
For example, girls might be offered both junior-varsity
and varsity basketball teams, as well as volleyball and
swimming, while boys are offered both junior-varsity
and varsity football, basketball and track and field.
The following comparison can help sharpen understanding
of how to accurately measure the provision of educational
opportunities in a school in order to assess gender equity.
The school administrators and PTA leaders at “Middleton
High School” received substantial funds from a local donor
to create a health promotion program aimed at increasing
the extent of physical activity in the student body. The
donor specified that the program leaders must recruit and
involve both boys and girls in an equitable manner. During
the first year of the program, school leaders provided
three new after-school exercise activities. While most of the
enrollees participated in one exercise program during the
year, many students enrolled in two programs, and smaller
numbers participated in all three of the exercise classes.
At the end of the year, in accordance with the donor’s
directives, the program leaders needed to assess whether
they had actually provided equitable opportunities to both
boys and girls. To accomplish this task, they counted the
individual registrations across all three exercise classes.
Next, they calculated the number of participants among
girls in relation to the size of the female student body, and,
finally, they performed the same calculation among the
male students. Ideally, the respective participation rates
within the female and male student bodies would be similar.
Similar percentages would indicate gender equity.
The same basic rationale and measurement procedure
holds for counting and recording the extent that high
schools provide athletic participation opportunities across
the female and male student bodies. The Office of Civil
Rights Data Collection guidelines for the school officials who
recorded the athletic participation rates enacted this logic
and procedure with this instruction:
“Number of participants. Enter the number of students
who participate in (1) male-only teams and (2) female-only
teams. Count a student once for each team he/she is on.
For example, a student should be counted twice if he is on
two teams.”4
Finally, the most accurate and reliable measure of athletic
opportunity for purposes of assessing gender equity is
athletic participation opportunities. To solely rely on or
highlight the number of teams or sports can be misleading
and beckon false inferences; e.g., one women’s volleyball
team may have 14 members, whereas one men’s football
team may have 60 members.

www.WomensSportsFoundation.org • 800.227.39886Progress Without Equity: The Provision of High School Athletic Opportunity in the United States, by Gender 1993-94 through 2005-06
Assessing the Provision of Athletic Opportunities in U.S. High SchoolsData for this analysis draw from two sources. The first
source of data comes from the Civil Rights Data Collection
(CRDC)5. Three cross-sections of elementary and secondary
public school data collected during 1994 (n = 44,151),
2000 (n = 88,650)6 and 2006 (n = 62,484) were merged
to create a larger data set to analyze changes in the number
of different sports, athletic teams and percentage of athletic
opportunities that U.S. public high schools provided to
girls and boys. Only administrators at high schools were
asked to respond to questions that dealt with the number
of different sports offered to girls and boys, the number of
athletic teams offered to girls and boys, and the number
of girls and boys who participate on teams throughout the
school year. This analysis is restricted to high schools that
offered grades 9-12 to both girls and boys during the three
time periods, resulting in a sample of 24,370 high schools
(1994, n = 4,566; 2000, n = 12,030; 2006, n = 7,774).
The second source of data comes from the Common
Core of Data (CCD), which is collected annually by the
National Center for Education Statistics (NCES). The CCD
gathers basic demographics on all public U.S. elementary
and secondary schools. To help supplement the CRDC
data, CCD data were merged to determine each school’s
geographic location (i.e., Northeast, Midwest, South and
West), gender composition (the number of students who
are female and male), the type of community the school is
located in (i.e., urban, suburban, town or rural area), the
state in which the school is located and the percentage of
students who are eligible for free lunch (a proxy measure for
the economic resources of a school).
Consistent with the definitions discussed in the previous
section, we measured the extent that each school provided
three types of athletic opportunity to its female and male
students: (1) the percentage of athletic participation
opportunities within and between the female student body
and male student body, (2) the number of sports provided
to boys and girls and (3) the number of female-only and
male-only sport teams. The first measure was constructed
by taking the total number of participation opportunities
among girls in all the different sports that each high school
provided during the school year and dividing by the total
number of girls who were enrolled for the academic school
year. The same procedure was followed among the boys.7
(Details appear in Appendix B.)
Gender equity ratios were calculated for each of the three
measures above. A ratio provides information about the
proportion of one set of numbers to another. During an
election year, for example, pollsters set out to measure the
ratio of registered Democrats to Republicans in a particular
voting district. For example, if there are 3,000 Democrats
and 4,000 Republicans in “Cambria County,” then 3,000
is divided by 4,000 to produce a ratio of 0.75, which
translates to “for every three Democrats, there were four
Republicans.” If there were 4,000 Democrats and 4,000

www.WomensSportsFoundation.org • 800.227.39887Progress Without Equity: The Provision of High School Athletic Opportunity in the United States, by Gender 1993-94 through 2005-06
Republicans, then the ratio would equal 1.00. The gender
equity ratio allowed us to measure the proportion of athletic
opportunity among girls in relation to boys. When the
gender equity ratio falls below 1.00, it means that girls were
allocated fewer opportunities than boys. Conversely, if the
gender equity ratio exceeds 1.00, it means that girls were
given more opportunities than boys.
Finally, we gathered information about high schools
themselves including: (1) gender composition (i.e., the
number of students who are female and males within
schools), (2) federal lunch enrollment (i.e., percent of
students eligible for free lunches), (3) geographic region8
(i.e., location in the Midwest, Northeast, South or West),
and type of community9 (i.e., rural, suburban, town or
urban), and (4) school size (i.e., the number of students per
high school).
Some Strengths of the Office of Civil Rights Data Collection The findings presented in this report are based on the
Office of Civil Rights Data Collection, which offers educators
and policymakers access to reliable information using a
meaningful unit of analysis; i.e., our analysis is built on
information gathered from individual schools in each state
throughout the United States. In contrast, the National
Federation of State High School Associations (NFSHSA)
reports statistics that represent state totals rather than
information that pertains directly to individual schools.
An additional strength of the OCR Data Collection is that
all U.S. public high schools are required by federal law to
participate. The resulting sample, therefore, has a high
degree of representativeness. In contrast, the NFSHSA
relies on the voluntary participation of school officials to
report information.

www.WomensSportsFoundation.org • 800.227.39888Progress Without Equity: The Provision of High School Athletic Opportunity in the United States, by Gender 1993-94 through 2005-06
THE RESULTS
The Provision of Athletic Participation Opportunities by Gender and Type of CommunityTwo consistent patterns are visible in how the provision
of athletic participation opportunities differed by gender
across urban, suburban, town and rural communities.10
First, boys received a larger proportion of athletic
The main findings from our analysis are depicted and
discussed below. The provision of athletic opportunities in
the U.S. is examined from a variety of vantage points. The
measurement procedures employed for each of the Tables
in this report are detailed in Appendix B.
The Provision of Athletic Participation Opportunities by GenderA “good news and bad news” scenario emerged from
the data. While U.S. high schools increased the number
of athletic participation opportunities provided to girls
and boys between 1993-94 and 2005-06, they fell short
of gender equity. While scrutiny of Table 1 shows steady
increases in the percentages of athletic participation
opportunities across the time frame, the gender gap
actually widened between 1999-2000 and 2005-06.
Between 1993-94 and 1999-2000, the percentage
difference between girls and boys declined from 14% to
11%. By 2005-06, girls’ percentage of athletic participation
opportunities in proportion to their numbers in the female
student body reached 39%, while among the boys the figure
was 51% (a difference of 12%). Generally, while high schools
gradually increased their allocations of athletic participation
opportunities between 1993-94 and 2005-06, progress
toward closing the gender gap slowed.
0
10
20
30
40
50
60
1993-94 1999-2000 2005-06
Female Athletes Male Athletes
31
45
36
47
39
51
Valid (listwise) sample sizes for the number of high schools offering grades 9 through 12:1993-1994: n = 4,2531999-2000: n = 10,8372005-2006: n = 6,676
Table 1: The Percentage of Athletic Participation Opportunities that U.S. High Schools Provided to
Girls and Boys, 1993-94 through 2005-06

www.WomensSportsFoundation.org • 800.227.39889Progress Without Equity: The Provision of High School Athletic Opportunity in the United States, by Gender 1993-94 through 2005-06
participation opportunities than girls did for each school
year in all communities. At the same time, while schools
in all communities increased the number of athletic
opportunities for both sexes, the gender gap closed only
minimally between 1993-94 and 2005-06. In urban schools
during 1993-94, for example, the percentage of athletic
opportunities allotted among the boys was 31%, whereas
among the girls this figure was 19%--a percentage difference
of 13%. The same difference during 2005-06 was 12%.
Second, across the entire timeframe, for both boys and
girls, the lowest percentages of athletic participation
opportunities occurred in urban schools, whereas the
highest percentages were issued in rural schools (see
Table 2). Historically, it was rural high schools that did
the best job providing participation opportunities to boys,
whereas it was urban schools that showed the poorest
results issuing athletic opportunities to girls.
School size may also play a role. In rural schools,
enrollments may be smaller than in larger urban and
suburban schools, and there may be a smaller array
of extracurricular activities for young people to choose
from than in urban or suburban schools. Perhaps this
0
10
20
30
40
50
60
70
80
1993-94 1999-2000 2005-06
Urban Suburban Town Rural
31
43
34
47
37
53
Valid (listwise) sample sizes for the number of high schools offering grades 9 through 12, by type of community:
Table 2: The Percentage of Athletic Participation Opportunities that U.S. High Schools Provided to Girls and Boys, by the Type of Community Where the School is Located
19
33
19
35
25
46
0
10
20
30
40
50
60
70
80
1993-94 1999-2000 2005-06
Urban Suburban Town Rural
43
58
44
57
48
66
31
50
29
49
35
62
Urban1993-1994: n = 1,0481999-2000: n = 2,0202005-2006: n = 1,775
Suburban1993-1994: n = 1,0681999-2000: n = 3,3472005-2006: n = 2,266
Town1993-1994: n = 1,1681999-2000: n = 1,7792005-2006: n = 667
Rural1993-1994: n = 9691999-2000: n = 3,6912005-2006: n = 1,968
Females Males

www.WomensSportsFoundation.org • 800.227.398810Progress Without Equity: The Provision of High School Athletic Opportunity in the United States, by Gender 1993-94 through 2005-06
combination means that a larger proportion of students are
likely to take advantage of sport due to the smaller number
of options. Paradoxically, as the results discussed later in
this report depict, our analysis also showed that schools
located in rural and town communities offered fewer teams
and sports than did their suburban and urban counterparts.
It may be, therefore, that rural and town school leaders
managed larger squad sizes, thereby maximizing
participation rates throughout the school.
And finally, the cultural significance of high school sports
may be more salient and influential in rural areas and
towns, reflecting and reinforcing the commitment of the
community and school to invest resources in athletic
program development, recruitment and staffing. Rural and
town newspapers pepper their pages with results of area
athletic contests, all-star teams, team photos, scholar-
athletes, etc.—local coverage that often focuses on both
boys and girls. Upon entering many small towns across the
United States, drivers are apt to see signage announcing,
“Cordelia, Home of the Blue Falcons.”
The Provision of Athletic Participation Opportunities by Gender and School Economic Resources Some of the variation in the provision of athletic
participation across communities is owed to differences in
the amount of economic resources available to the school.
Schools with more ample fiscal resources, we hypothesized,
may be more willing and able to provide students with
greater athletic opportunity than schools with budgetary
constraints. However, less is known about how a school’s
economic well-being is related to a fair division of athletic
opportunity between the girls and boys. For this analysis
we used the percentage of students eligible for free lunch
as a proxy measure of a school’s economic status. Two
clear patterns emerged from the analysis (see Table 3 on
following page).
First, schools with greater economic resources provided
more athletic participation opportunities for their
students—both girls and boys—than their less fiscally
sound counterparts. This association is evident for each
of the school years under analysis. Second, boys were
afforded more athletic participation opportunities than girls
regardless of the economic viability of the school. During
the 2005-06 school year, for example, the male share of
athletic participation opportunities was 11-12% greater than
their female counterparts’.
There is some evidence of some initial progress with regard
to gender equity, but then a basic slowdown seems to
have emerged. The gap between female and male athletic
participation opportunities narrowed between 1993-94 and
1999-2000. The percentage differences between the sexes
were 13%, 15% and 15% across the fiscal categories during
the former period and 10%, 11%, and 12% during 1999-
2000. Despite these trends, however, the gender differences

www.WomensSportsFoundation.org • 800.227.398811Progress Without Equity: The Provision of High School Athletic Opportunity in the United States, by Gender 1993-94 through 2005-06
across school socioeconomic categories remained basically
stable between 1999-2000 and 2005-06; i.e., 11%, 12%
and 11%, respectively. The movement toward gender equity
during this period appears to have flatlined.
Gender and Athletic Participation Opportunities across Geographic RegionsThe analysis revealed several patterns in how athletic
participation opportunities were distributed between girls
and boys across geographic regions. Once again, girls
were provided proportionately fewer athletic participation
opportunities than boys during each school year and in all
geographic regions. The percentage of athletic participation
opportunities was highest for both girls and boys in the
Northeast, followed closely by those in the Midwest. Both
girls and boys in the South exhibited the lowest percentage
of athletic participation opportunities across the timeframe,
but girls were left even more outside the athletic opportunity
stream. Schools in the American Northeast and Midwest
generated the most athletic participation opportunities for
their students, yet in the midst of regional plenty, leaders
0
10
20
30
40
50
60
1993-94 1999-2000 2005-06
0–12.49% FLE 12.5%–24.9% FLE 25% or higher FLE 0–12.49% FLE 12.5%–24.9% FLE 25% or higher FLE
30
37
45
Valid (listwise) sample sizes for the number of high schools offering grades 9 through 12, by percent of schools’ student bodies eligible for free lunch:
Table 3: The Percentage of Athletic Participation Opportunities Provided by U.S. High Schools to Girls and Boys, by Percentage of School Population Eligible for Free Lunch
39
23
42
26
49
32
0
10
20
30
40
50
60
1993-94 1999-2000 2005-06
45
38
48
38
57
43
52 52
60
0 - 12.49% FLE1993-1994: n = 1,2971999-2000: n = 3,8002005-2006: n = 1,667
12.5% - 24.9% FLE1993-1994: n = 8731999-2000: n = 2,5622005-2006: n = 1,595
25% or higher FLE1993-1994: n = 1,0961999-2000: n = 2,7482005-2006: n = 2,937
Females Males

www.WomensSportsFoundation.org • 800.227.398812Progress Without Equity: The Provision of High School Athletic Opportunity in the United States, by Gender 1993-94 through 2005-06
failed to generate equitable access to athletic resources in
the schools (see Table 4).
From the vantage point of parents who wanted their
daughters to have ample opportunity to develop a physically
active and athletic lifestyle, at least during the timeframe of
this study, best not to live in the South and West. A bit more
positively, the percentage of southern girls who had athletic
participation opportunities increased 8% between the 1993-
94 and 2005-06 school years (from 22% to 30%), while the
respective increase among Southern boys was 6% (from
37% and 43%). The children of parents in the Northeast
and Midwest, in contrast, had more available athletic
opportunities than their southern and western counterparts,
although their daughters’ opportunities fell short of their
sons’ opportunities.
The Number of Sports and Teams by GenderThe years between 1999-2000 and 2005-06 saw an
increase in the average number different sports and teams
provided to girls and boys across the timeframe. Generally,
0
10
20
30
40
50
60
70
80
1993-94 1999-2000 2005-06
Northeast Midwest South West Northeast Midwest South West
41
32
45
32
51
37
Valid (listwise) sample sizes for the number of high schools offering grades 9 through 12, by region:
Table 4: The Percentage of Athletic Participation Opportunities Provided to U.S. High School Girls and Boys, by Geographical Region
51
22
48
24
52
30
0
10
20
30
40
50
60
70
80
1993-94 1999-2000 2005-06
55
44
57
41
64
46
61
37
55
37
62
43
Northeast1993-1994: n = 5171999-2000: n = 1,6372005-2006: n = 827
Midwest1993-1994: n = 9731999-2000: n = 3,2942005-2006: n = 1,655
South1993-1994: n = 2,0251999-2000: n = 3,7462005-2006: n = 2,700
West1993-1994: n = 7381999-2000: n = 2,1602005-2006: n = 1,494
Females Males

www.WomensSportsFoundation.org • 800.227.398813Progress Without Equity: The Provision of High School Athletic Opportunity in the United States, by Gender 1993-94 through 2005-06
boys and girls average about the same number of different
sports in 1999-2000 and 2005-06. During this same time
period, however, boys were allocated one more team on
average than girls (see Table 5).
The Number of Sports and Teams by Gender and Type of CommunityDuring the period between 1993-94 and 1999-2000, the
number of sports in U.S. high schools remained somewhat
constant across communities. It was between 1999-2000
and 2005-06 that witnessed jumps in both the number of
female-only and male-only sports provided by schools. By
2005-06, an average gender gap of about one sport was
reported (see Table 6 on following page).
The results show that the number of teams provided by U.S.
high schools differed by both gender and type of community
across the timeframe. The general picture in 1993-94
indicates that boys were allocated two more teams than
girls in urban, suburban and town communities, but one
additional team in rural communities. There was a small
increase in the average number of teams by 1999-2000;
0
3
6
9
12
15
1993-94 1999-2000 2005-06
Female Male Female Male
Valid (listwise) sample sizes for the number of high schools offering grades 9 through 12:1993-1994: n = 4,2531999-2000: n = 10,8372005-2006: n = 6,676
Table 5: The Average Number of Female-Only and Male-Only Sports and Athletic Teams Provided by U.S. High Schools, 1993-94 through 2005-06
5.05.7
5.25.7
7.7 8.1
0
3
6
9
12
15
1993-94 1999-2000 2005-06
10.8 10.6
14.6
8.99.5
13.4
Number of Different Sports Offered to Females and Males Number of Different Teams Offered to Females and Males

www.WomensSportsFoundation.org • 800.227.398814Progress Without Equity: The Provision of High School Athletic Opportunity in the United States, by Gender 1993-94 through 2005-06
0
2
4
6
8
10
1993-94 1999-2000 2005-06
Urban Suburban Town Rural
6.3
3.7
6.4
4.3
9.2
6.5
Valid (listwise) sample sizes for the number of high schools offering grades 9 through 12, by type of community:
Table 6: The Average Number of Female-Only and Male-Only Sports Provided by U.S. High Schools, by the Type of Community Where High School is Located
5.14.6
5.4
4.6
7.4 7.4
0
2
4
6
8
10
1993-94 1999-2000 2005-06
Urban Suburban Town Rural
7.0
4.3
6.9
4.6
9.4
6.86.1
5.46.0
5.2
7.9 7.8
Urban1993-1994: n = 1,0481999-2000: n = 2,0202005-2006: n = 1,775
Suburban1993-1994: n = 1,0681999-2000: n = 3,3472005-2006: n = 2,266
Town1993-1994: n = 1,1681999-2000: n = 1,7792005-2006: n = 667
Rural1993-1994: n = 9691999-2000: n = 3,6912005-2006: n = 1,968
Females Males

www.WomensSportsFoundation.org • 800.227.398815Progress Without Equity: The Provision of High School Athletic Opportunity in the United States, by Gender 1993-94 through 2005-06
i.e., an increase of two teams in urban, suburban and rural
schools, and one team in town communities. However,
schools in all communities reported a substantial increase
in the number of teams provided between 1999-2000 and
2005-06. During 2005-06, rural schools offered girls and
boys the same number of sports teams (n = 11), while in
the other communities, boys were provided with one more
team than girls (see Table 7).
The Number of Sports and Teams by Gender and School Economic ResourcesThe findings depicted in Tables 8 and 9 (on following pages)
show that schools with greater economic resources offered
more sports and teams to their students than schools
with less resources. This pattern persisted across all three
school years studied. Furthermore, U.S. schools increased
the number of sports and teams they offered between
1999-2000 and 2005-06.
0
5
10
15
20
1993-94 1999-2000 2005-06
Urban Suburban Town Rural
11.7
6.5
12.5
7.2
16.6
10.7
Valid (listwise) sample sizes for the number of high schools offering grades 9 through 12, by type of community:
Table 7: The Average Number of Female-Only and Male-Only Sports Teams Provided by U.S. High Schools, by the Type of Community Where High School is Located
8.8 8.59.5
8.4
12.8 12.6
0
5
10
15
20
1993-94 1999-2000 2005-06
Urban Suburban Town Rural
14.0
7.7
13.9
7.9
17.9
11.411.1 10.3 10.99.6
14.1 13.7
Urban1993-1994: n = 1,0481999-2000: n = 2,0202005-2006: n = 1,775
Suburban1993-1994: n = 1,0681999-2000: n = 3,3472005-2006: n = 2,266
Town1993-1994: n = 1,1681999-2000: n = 1,7792005-2006: n = 667
Rural1993-1994: n = 9691999-2000: n = 3,6912005-2006: n = 1,968
Female Teams Male Teams

www.WomensSportsFoundation.org • 800.227.398816Progress Without Equity: The Provision of High School Athletic Opportunity in the United States, by Gender 1993-94 through 2005-06
By the 2005-06 school year, U.S. schools offered
comparable numbers of sports to boys as girls. With regard
to the number of teams, however, schools in each economic
category sustained one more team for boys than for girls.
0
2
4
6
8
10
1993-94 1999-2000 2005-06
0–12.49% FLE 12.5%–24.9% FLE 25% or higher FLE 0–12.49% FLE 12.5%–24.9% FLE 25% or higher FLE
4.65.0
8.2
Valid (listwise) sample sizes for the number of high schools offering grades 9 through 12, by percent of schools’ student bodies eligible for free lunch:
Table 8: The Average Number of Female-Only and Male-Only Sports Provided by U.S. High Schools to Girls and Boys, by Percent of School Population Eligible for Free Lunch
6.2
4.0
6.4
4.2
9.4
6.6
0
2
4
6
8
10
1993-94 1999-2000 2005-06
5.4 5.05.5
4.8
8.4
7.16.9 6.8
9.6
0 - 12.49% FLE1993-1994: n = 1,2971999-2000: n = 3,8002005-2006: n = 1,667
12.5% - 24.9% FLE1993-1994: n = 8731999-2000: n = 2,5622005-2006: n = 1,595
25% or higher FLE1993-1994: n = 1,0961999-2000: n = 2,7482005-2006: n = 2,937
Females Males

www.WomensSportsFoundation.org • 800.227.398817Progress Without Equity: The Provision of High School Athletic Opportunity in the United States, by Gender 1993-94 through 2005-06
The Number of Sports and Teams by Gender and Geographic RegionThe number of sports that U.S. high schools offered their
students varied by geographic region and across the time
period. Northeastern schools provided the highest average
number of sports. Between 1993-94 and 1999-2000, the
number of sports provided to both sexes across regions
increased somewhat, but the largest increase occurred
between 1999-2000 and 2005-06 (See Table 10 on
following page). During the 2005-06 school year, schools in
the Northeast, Midwest and South offered somewhat similar
numbers of sports to both sexes, although boys edged
out girls slightly in each region (10, 8 and 8, respectively).
Western schools provided boys with an average of 8.1
sports, compared to 7.7 sports for girls.
A somewhat different picture emerged regarding the
number of teams. Regional differences existed that were
similar to the number of sports discussed above (See
Table 11 on page 19). The Northeast and West once
again provided more teams by 2005-06 than their regional
counterparts. In addition, the gender gap narrowed a bit
0
5
10
15
20
1993-94 1999-2000 2005-06
0–12.49% FLE 12.5%–24.9% FLE 25% or higher FLE 0–12.49% FLE 12.5%–24.9% FLE 25% or higher FLE
8.2 8.9
14.4
Valid (listwise) sample sizes for the number of high schools offering grades 9 through 12, by percent of schools’ student bodies eligible for free lunch:
Table 9: The Average Number of Female-Only and Male-Only Sports Teams Provided by U.S. High Schools to Girls and Boys, by the Percentage of School Population Eligible for Free Lunch
11.9
6.5
12.1
7.0
17.5
10.8
0
5
10
15
20
1993-94 1999-2000 2005-06
10.18.8
10.18.8
15.3
12.013.5 13.2
18.6
0 - 12.49% FLE1993-1994: n = 1,2971999-2000: n = 3,8002005-2006: n = 1,667
12.5% - 24.9% FLE1993-1994: n = 8731999-2000: n = 2,5622005-2006: n = 1,595
25% or higher FLE1993-1994: n = 1,0961999-2000: n = 2,7482005-2006: n = 2,937
Females Males

www.WomensSportsFoundation.org • 800.227.398818Progress Without Equity: The Provision of High School Athletic Opportunity in the United States, by Gender 1993-94 through 2005-06
0
2
4
6
8
10
1993-94 1999-2000 2005-06
Northeast Midwest South West Northeast Midwest South West
5.55.0
5.54.8
7.57.7
Valid (listwise) sample sizes for the number of high schools offering grades 9 through 12, by region:
Table 10: The Average Number of Female-Only and Male-Only Sports Provided by U.S. High Schools to Girls and Boys, by Geographic Region
7.5
4.0
7.6
4.1
9.5
7.3
0
2
4
6
8
10
1993-94 1999-2000 2005-06
6.1 5.9 5.95.2
7.8 8.18.1
4.9
8.1
4.6
9.9
7.7
Northeast1993-1994: n = 5171999-2000: n = 1,6372005-2006: n = 827
Midwest1993-1994: n = 9731999-2000: n = 3,2942005-2006: n = 1,655
South1993-1994: n = 2,0251999-2000: n = 3,7462005-2006: n = 2,700
West1993-1994: n = 7381999-2000: n = 2,1602005-2006: n = 1,494
Female Sports Male Sports

www.WomensSportsFoundation.org • 800.227.398819Progress Without Equity: The Provision of High School Athletic Opportunity in the United States, by Gender 1993-94 through 2005-06
across the timeframe. Whereas boys in each region were
provided with between one and three more teams during
the 1993-94 school year, by 2005-06 there was only a
one-team difference between girls’ and boys’ team numbers
across all four geographic regions.
Changes in the Gender Equity Ratio between 1993-94 and 2005-06Figures 1 and 2 (on following page) portray changes in the
ratio of athletic participation opportunities between girls
and boys across the 1993-94 through 2005-06 time frame.
The “gender equity ratio” was calculated by taking the
total number of athletic opportunities provided to girls and
dividing by the total number provided to boys. Ratios below
1.00 indicate fewer opportunities were provided to girls than
boys. A ratio of 1.00 means girls and boys received equal
athletic opportunities.
Figure 1 (on following page) reveals an observable trend
toward increasing gender equity across the entire U.S.
between 1993-94 and 1999-2000, but there was only a .01
increase toward gender equity occurring between 1999-
0
5
10
15
20
1993-94 1999-2000 2005-06
Northeast Midwest South West Northeast Midwest South West
10.4 9.6 10.5 9.6
14.3 14.6
Valid (listwise) sample sizes for the number of high schools offering grades 9 through 12, by region:
Table 11: The Average Number of Female-Only and Male-Only Sport Teams Provided by U.S. High Schools, by Geographic Region
13.2
6.8
13.2
6.8
16.4
11.3
0
5
10
15
20
1993-94 1999-2000 2005-06
11.9 12.0 11.710.7
15.6 15.814.9
8.8
14.4
7.9
17.6
12.3
Northeast1993-1994: n = 5171999-2000: n = 1,6372005-2006: n = 827
Midwest1993-1994: n = 9731999-2000: n = 3,2942005-2006: n = 1,655
South1993-1994: n = 2,0251999-2000: n = 3,7462005-2006: n = 2,700
West1993-1994: n = 7381999-2000: n = 2,1602005-2006: n = 1,494
Female Sports Teams Male Sports Teams

www.WomensSportsFoundation.org • 800.227.398820Progress Without Equity: The Provision of High School Athletic Opportunity in the United States, by Gender 1993-94 through 2005-06
2000 and 2005-06. This means that most of girls’ gains in
athletic participation opportunities came between 1993-94
and 1999-2000.
Figure 2 reveals some historical shifts in the provision
of athletic participation opportunities within geographic
regions. First, the Northeast made the most progress
toward achieving gender equity, followed by the West,
Midwest and South. However, all four regions fell short of
achieving an equitable allocation of athletic participation
opportunities. Boys got more, girls got less. The largest
gender gap appeared in the South, but progress did occur
throughout the time frame. Schools in the Northeast
surpassed their Southern counterparts with regard to
providing athletic participation opportunities to their coeds,
but there was also backsliding between 1999-2000 and
2005-06 (i.e., 0.86 to 0.82).
Overall, the greatest amount of progress toward gender
equity occurred between the 1993-94 and 1999-2000
school years, where there was a visible narrowing of the
gender gap. Between 1999-2000 and 2005-06, however,
the momentum of reform appears to have slowed. Gender
inequity in athletic participation opportunities not only
0.6
0.7
0.8
1993-94 1999-2000 2005-06
0.63
0.730.74
*Note: The gender equity ratio is calculated by taking the total number of athletic participation opportunities provided to girls and dividing by the total number of athletic participation opportunities provided to boys. Ratios below 1.00 indicates fewer athletic participation opportunities provided to girls than boys.
Figure 1: The Gender Equity Ratios for Athletic Participation Opportunity, 1993-94 through 2005-06*
Participation Ratio
0.4
0.6
0.8
1.0
1993-94 1999-2000 2005-06
0.55
0.63
0.70
*Note: The gender equity ratio is calculated by taking the total number of athletic participation opportunities provided to girls and dividing by the total number of athletic participation opportunities provided to boys. Ratios below 1.00 indicates fewer participation opportunities were provided to girls than boys.
Figure 2: The Gender Equity Ratio between the Number of Athletic Participation Opportunities Provided
to U.S. Girls and Boys, by Geographic Region, 1993-94 through 2005-06*
Northeast Midwest South West
0.80
0.860.82
0.69
0.770.76
0.75

www.WomensSportsFoundation.org • 800.227.398821Progress Without Equity: The Provision of High School Athletic Opportunity in the United States, by Gender 1993-94 through 2005-06
persisted throughout the time frame, but progress toward
building equity bogged down.
State-by-State Comparisons, Change in the Provision of Athletic OpportunityThe final section of this report provides regional and state-
by-state breakdowns of the extent that the provision of three
types of athletic opportunities changed for each gender
between the 1993-94 and 2005-06 school years. These
data were designed to help readers compare and assess
the degree of gender equity within their regions and states.
Some readers may speculate about how these results for
the 2005-06 school year compare to the current athletic
realities in their schools, district or state.
The gender equity ratios presented in the first two columns
of Table 12 (on pages 22-23) show that boys were provided
with substantially more athletic participation opportunities
than girls in every state except Alaska. The gains in
athletic participation that girls made between 1993-94 and
2005-06, therefore, fell far short of achieving equity. In
contrast, the results in columns two through six show that
many states provided girls and boys equal or somewhat
comparable numbers of teams and sports during 2005-06.
In a few states, girls were allocated more teams and sports
than boys. In states like Maine, New Hampshire, Michigan,
Minnesota, Delaware, Virginia, Montana, Alaska and Hawaii,
the gender equity ratios exceeded 1.00—which means that
girls had proportionately more teams than boys did.
Finally, we measured the extent of the change in the
provision of athletic opportunities between the 1993-94
and 2005-06 school years. Table 13 (on pages 24-25)
presents the results by geographic region and for each state
(including the District of Columbia). The first and second
columns report the differences between the proportions of
athletic participation opportunities allotted to each gender
respectively.11 Here a plus sign (+) indicates a percentage
point gain in athletic participation opportunities, while a
minus sign (-) means a percentage point decline across
the timeframe, and an equal sign (=) means no change
occurred. The findings in columns three and four show the
average increase in the number of sports across the 12-year
time period for boys and girls. Finally, the next two columns
present the average increase in the number of teams for
boys and girls.
The overall findings reveal an array of differences across
the timeframe. Table 13, for example, shows that, on
average, high schools in the Northeast added three teams
for both boys and girls, but boys ended up with 18 teams
in 2005-06 compared to 16 teams for girls. In contrast,
schools in Delaware added seven teams for boys and
10 for girls, totaling 21 and 22 teams for boys and girls,
respectively, by 2005-06. In one state, Louisiana, girls
registered no additional teams across the time frame, while
boys averaged a loss of one team. Despite the additions of

www.WomensSportsFoundation.org • 800.227.398822Progress Without Equity: The Provision of High School Athletic Opportunity in the United States, by Gender 1993-94 through 2005-06
Table 12: State-by-State Comparisons: Change in the Gender Equity Ratios Across High Schools
between 1993-94 and 2005-06
Participation Sports Teams
Gender Equity
Ratio: Participation
Oportunities 05-06
Change Since 93-94
Gender Equity Ratio:
Sports 05-06
Change Since 93-94
Gender Equyity Ratio:
Teams 05-06
Change Since 93-94
Northeast 0.82 -0.03 0.98 +0.06 0.93 -0.01
Maine 0.94 +0.03 1.00 -0.07 1.01 -0.01
New Hampshire 0.95 -0.20 1.09 -0.18 1.06 -0.14
Vermont 0.89 -0.03 1.86 +0.80 0.97 -0.13
Massachusetts 0.78 -0.08 0.92 =0.00 0.89 -0.01
Rhode Island 0.76 -0.05 0.97 =0.00 0.90 +0.03
Connecticut 0.81 -0.02 0.96 =0.00 0.94 +0.05
New York 0.86 +0.07 0.98 -0.06 0.97 +0.05
Pennsylvania 0.75 -0.02 0.90 +0.03 0.85 +0.00
New Jersey 0.78 +0.04 0.94 +0.03 0.90 +0.06
Midwest 0.76 +0.07 0.95 +0.08 0.93 +0.07
Wisconsin 0.79 + 0.05 0.94 +0.10 0.92 +0.04
Michigan 0.82 + 0.03 0.99 =0.00 1.02 =0.00
Illinois 0.65 -0.06 0.89 -0.03 0.81 -0.03
Indiana 0.75 +0.11 0.98 +0.13 0.95 +0.14
Ohio 0.73 +0.13 0.92 +0.13 0.90 +0.12
Missouri 0.75 +0.11 0.97 +0.10 0.92 +0.07
North Dakota 0.79 +0.12 0.94 -0.01 0.91 +0.04
South Dakota 0.86 -0.01 0.97 +0.09 0.99 +0.10
Nebraska 0.73 +0.10 0.95 +0.13 0.96 +0.16
Kansas 0.72 +0.07 0.91 +0.05 0.90 =0.00
Minnesota 0.85 +0.06 1.19 +0.24 1.02 +0.05
Iowa 0.82 +0.17 0.94 +0.08 0.96 +0.12
South 0.70 +0.15 0.97 +0.17 0.93 +0.19
Delaware 0.88 +0.12 0.83 -0.09 1.05 +0.15
Maryland 0.83 +0.10 1.02 +0.04 1.03 +0.10

www.WomensSportsFoundation.org • 800.227.398823Progress Without Equity: The Provision of High School Athletic Opportunity in the United States, by Gender 1993-94 through 2005-06
Participation Sports Teams
Gender Equity
Ratio: Participation
Oportunities 05-06
Change Since 93-94
Gender Equity Ratio:
Sports 05-06
Change Since 93-94
Gender Equyity
Ratio: Teams 05-06
Change Since 93-94
South, cont. 0.70 +0.15 0.97 +0.17 0.93 +0.19
DC 0.56 -0.23 1.11 +0.24 0.97 +0.11
Virginia 0.77 +0.08 1.00 +0.12 1.01 +0.12
West Virginia 0.77 +0.18 0.92 +0.13 0.88 +0.11
North Carolina 0.69 +0.02 0.92 +0.07 0.93 +0.09
South Carolina 0.73 +0.20 0.96 +0.12 0.92 +0.17
Georgia 0.66 +0.13 0.94 +0.22 0.89 +0.15
Florida 0.76 +0.37 1.02 +0.40 0.97 +0.39
Kentucky 0.82 +0.26 0.97 +0.18 0.95 +0.25
Tennessee 0.62 +0.13 0.94 +0.17 0389 +0.15
Mississippi 0.62 +0.23 0.91 +0.38 0.88 +0.37
Alabama 0.62 +0.15 0.92 +0.11 0.82 +0.16
Oklahoma 0.77 +0.20 0.96 +0.19 0.94 +0.21
Texas 0.64 +0.12 1.00 +0.17 0.91 +0.15
Arkansas 0.65 +0.16 0.97 +0.30 0.93 +0.32
Louisiana 0.74 +0.28 0.86 +0.13 0.85 +0.15
West 0.76 +0.09 0.97 +0.12 0.96 +0.11
Idaho 0.71 +0.10 0.96 +0.16 0.98 +0.10
Montana 0.81 +0.01 1.03 +0.03 1.04 =0.00
Wyoming 0.92 -0.05 1.01 +0.11 1.02 -0.02
Nevada 0.69 +0.02 0.90 -0.01 0.91 =0.00
Utah 0.77 +0.07 0.98 +0.01 0.96 +0.04
Colorado 0.79 +0.03 0.98 +0.09 0.97 +0.04
Arizona 0.72 =0.00 0.96 +0.01 0.94 +0.00
New Mexico 0.80 +0.22 0.98 +0.23 0.95 +0.16
Alaska 1.30 +0.55 1.39 +0.50 1.57 +0.57
Washington 0.81 -0.21 1.05 +0.08 1.00 +0.07
Oregon 0.75 +0.09 1.00 +0.07 0.98 +0.11
California 0.72 +0.14 0.91 +0.10 0.90 +0.16
Hawaii 0.80 +0.15 1.06 +0.17 1.09 +0.24

www.WomensSportsFoundation.org • 800.227.398824Progress Without Equity: The Provision of High School Athletic Opportunity in the United States, by Gender 1993-94 through 2005-06
Table 13: State-by-State Comparisons: Percentage of Athletic Opportunities, Average Number of Teams and
Sports Across High Schools Between 1993-94 and 2005-06
Boys Girls Boys Girls Boys Girls
Percentage of Athletic
Opportunities 05-06
Change Since 93-94
Percentage of Athletic
Opportunities 05-06
Change Since 93-94
Num
ber of Sports 05-06
Change Since 93-94
Num
ber of Sports 05-06
Change Since 93-94
Num
ber of Teams 05-06
Change Since 93-94
Num
ber of Teams 05-06
Change Since 93-94
Northeast 62% +0% 52% +0% 10 +3 9 +3 18 +3 16 +3
Maine 63% +9% 61% +8% 9 +3 9 +2 14 +4 14 +4
New Hampshire 56% +3% 55% -3% 10 +4 10 +4 16 +8 16 +7
Vermont 61% +15% 57% +9% 9 +4 9 +5 16 +3 15 +1
Massachusetts 54% -14% 46% -12% 10 +1 9 +1 17 +1 16 +1
Rhode Island 56% +9% 43% +5% 11 +3 10 +3 15 +2 13 +2
Connecticut 58% =0% 49% +1% 11 +3 11 +3 19 +5 18 +6
New York 66% -10% 62% -2% 11 +2 11 +2 21 +2 20 +4
Pennsylvania 45% -3% 37% -1% 8 +1 7 +1 13 +2 12 +2
New Jersey 56% -5% 45% -2% 11 +2 10 +2 20 +3 18 +4
Midwest 64% -3.3% 51% +3% 8 +2 8 +2 16 +3 14 +3
Wisconsin 62% +1% 51% +3% 8 +3 8 +3 17 +5 16 +5
Michigan 55% -6% 47% -3% 9 +2 9 +2 15 +2 15 +2
Illinois 47% -5% 36% -1% 7 +1 7 +1 17 +5 14 +4
Indiana 48% +2% 37% +5% 10 +2 9 +3 17 +2 16 +3
Ohio 51% +8% 40% +12% 8 +2 7 +3 14 +4 12 +4
Missouri 51% +3% 38% +5% 7 +2 7 +2 16 +4 14 +4
North Dakota 73% +6% 63% +12% 6 =0 6 =0 12 +1 10 +1
South Dakota 64% -29% 60% -20% 5 +1 5 +1 9 +2 9 +2
Nebraska 60% -3% 52% +9% 7 +2 7 +2 15 +2 14 +3
Kansas 60% -4% 52% +5% 7 +4 7 +4 15 +8 13 +7
Minnesota 54% -9% 50% -4% 9 =0 10 =0 21 =0 21 =0
Iowa 64% -3% 60% +11% 8 +1 7 +2 16 +2 15 +4
South 43% +5% 30% +8% 8 +2 7 +3 12 +3 11 +4
Delaware 41% -8% 36% -2% 12 4 10 +3 21 +7 22 +10
Maryland 40% +4% 34% +6% 8 +2 8 +2 13 +2 13 +3

www.WomensSportsFoundation.org • 800.227.398825Progress Without Equity: The Provision of High School Athletic Opportunity in the United States, by Gender 1993-94 through 2005-06
Boys Girls Boys Girls Boys Girls
Percentage of Athletic
Opportunities 05-06
Change Since 93-94
Percentage of Athletic
Opportunities 05-06
Change Since 93-94
Num
ber of Sports 05-06
Change Since 93-94
Num
ber of Sports 05-06
Change Since 93-94
Num
ber of Teams 05-06
Change Since 93-94
Num
ber of Teams 05-06
Change Since 93-94
South, cont. 43% +5% 30% +8% 8 +2 7 +3 12 +3 11 +4
Virginia 46% +3% 37% +6% 10 +3 10 +3 14 +3 14 +4
West Virginia 45% +5% 36% +11% 7 +3 6 +3 11 +4 10 +4
North Carolina 46% +4% 32% +4% 10 +3 9 +4 13 +3 12 +4
South Carolina 50% +9% 33% +11% 8 +3 8 +3 12 +3 11 +5
Georgia 37% +5% 24% +6% 8 +3 7 +4 12 +3 11 +4
Florida 22% -3% 16% +4% 7 +1 7 +3 10 =0 10 +3
Kentucky 47% +19% 38% +21% 8 +4 8 +4 14 +7 13 +8
Tennessee 38% +9% 24% +9% 8 +3 7 +4 10 +3 9 +4
Mississippi 47% +11% 29% +14% 7 +3 6 +4 9 +4 8 +5
Alabama 45% +7% 28% +10% 6 +2 5 +2 9 +2 8 +3
Oklahoma 53% +1% 43% +11% 6 +2 5 +2 9 +3 8 +4
Texas 47% +7% 33% +10% 8 +4 8 +4 17 +8 15 +8
Arkansas 47% +7% 33% +12% 6 +2 5 +3 10 +4 8 +5
Louisiana 41% +9% 25% +10% 3 -1 3 =0 6 -1 5 =0
West 46% -1% 37% +3% 8 +3 8 +3 16 +4 15 +5
Idaho 57% -15% 45% -2% 7 +3 7 +3 13 +4 13 +5
Montana 64% -1% 60% +4% 5 +3 5 +3 9 +4 9 +5
Wyoming 68% -1% 63% -7% 6 +3 6 +3 10 +5 10 +5
Nevada 42% +6% 31% +6% 10 +6 9 +6 17 +10 15 +10
Utah 54% +10% 44% +10% 8 +2 8 +2 15 +3 14 +4
Colorado 52% -5% 44% =0% 8 +2 8 +2 17 +4 16 +4
Arizona 43% =0% 33% +1% 8 +3 8 +2 15 +4 14 +4
New Mexico 48% +10% 40% +14% 7 +3 7 +4 13 +5 12 +6
Alaska 34% -16% 32% -4% 5 +3 6 +4 9 +2 10 +4
Washington 50% =0% 42% -1% 8 +2 9 +3 19 +6 18 +5
Oregon 48% -7% 40% -1% 7 +2 7 +2 14 +1 14 +3
California 32% -2% 24% +3% 8 +2 8 +2 17 +3 15 +5
Hawaii 50% +13% 42% +15% 14 +3 14 +5 20 +2 21 +6

www.WomensSportsFoundation.org • 800.227.398826Progress Without Equity: The Provision of High School Athletic Opportunity in the United States, by Gender 1993-94 through 2005-06
teams in most schools across the timeframe, boys ended
up with an average of two more teams than girls in the
Northeast and Midwest, and one more team than girls in
the South and West. These state-by-state findings can also
be summarized this way:
(1) The average number of teams added was the same for
girls and boys in 18 states.
(2) The average number of teams added for girls was
higher than for boys in 27 states.
(3) The average number of teams added for boys was
higher than for girls in 5 states.
These results show that even though girls made some gains
in the number of teams across the timeframe, boys’ gains
either remained the same as girls or increased in relation to
girls in 23 states. Girls’ gains in the number of sports were
either higher (N = 27) or the same as the boys (N = 18) in a
total of 45 states. While the basic trend was toward gender
equity, the evidence does not support the contention that
“girls’ gains” came at the expense of “boys’ losses.”
With regard to changes in the number of sports between
1993-94 and 2004-05, closer scrutiny of the results
shows that:
(1) The average number of sports added was the same for
girls and boys in 32 states.
(2) The average number of sports added for girls was
higher than for boys in 14 states.
(3) The average number of sports added for boys was
higher than for girls in 3 states.
The above summary confirms that, across the U.S., boys
were allotted a greater number of sports than girls. While
the expansion of the number of sports provided across the
time frame was comparable for boys and girls in a majority
of states (N = 32), it was higher for girls in 14 states, and
higher for boys in five states. (In the District of Columbia
and Louisiana, there was a greater decline in the average
number of sports offered to boys compared to girls.)
An additional tally of the data presented in Table 13
reveals an overall pattern among the individual differences
between the states with regard to the provision of athletic
participation opportunities. We calculated the number and
percentage of states in which the proportion of girls’ share
of athletic participation opportunities increased, decreased
or stayed the same between the 1993-94 and 2005-06
school years. The same tally was done among the boys.
Athletic participation opportunities among girls increased in
34 states (66%) and, among boys, in 27 states (53%). The
comparable numbers of states with decreases in athletic
participation opportunities were 16 (31%) and 21 (41%) for
girls and boys, respectively. It must be emphasized these
numbers and percentages need to also be understood
in relation to the larger finding that, within most states
and across the country, the average share of athletic
participation opportunities among the female student
body remained lower than the proportion of boys’ athletic
participation opportunities among the male student body.

www.WomensSportsFoundation.org • 800.227.398827Progress Without Equity: The Provision of High School Athletic Opportunity in the United States, by Gender 1993-94 through 2005-06
These findings show that, by 2005-06, girls and boys
were often allocated nearly equal numbers of sports and
teams. However, boys received substantially more athletic
participation opportunities than girls. Despite the jump in
the provision of athletic opportunities to girls between 1993-
94 and 1999-2000 and slow growth thereafter, the gender
equity ratio of 0.74 during 2005-06 fell short of providing
girls a number of athletic participation opportunities
comparable to boys (review Figure 1). Taken together, these
national findings12 suggest that even though U.S. schools
hiked the number of teams and sports for girls across the
time period, girls’ overall team memberships were lower in
number than their male counterparts. Put simply, though
girls and boys were often supplied with a similar number
of teams and sports by 2005-06, schools provided and
managed larger rosters for boys than girls.
Finally, readers can review Table 14 (on following pages)
in order to see where their state ranked in the provision of
athletic participation opportunities during 2005-06. Please
note that the first two columns show the descending athletic
participation rates among girls and boys respectively.
The first column shows the average rates (converted to
percentages) of athletic participation opportunities filled
by girls among the female student body in each state. The
second column presents the results for boys. And finally,
the gender equity ratios between girls and boys in the
schools within each state were averaged and presented
in descending order by state in the third column. Scrutiny
of the findings shows that the provision of higher rates of
athletic opportunities to girls within a state is not a direct
indicator of gender equity between girls and boys.

www.WomensSportsFoundation.org • 800.227.398828Progress Without Equity: The Provision of High School Athletic Opportunity in the United States, by Gender 1993-94 through 2005-06
Table 14: State-by-State Rankings: Percentage of Athletic Participation Opportunities Across High Schools
and Gender Equity Ratio for Athletic Opportunities 2005-06
Percentage of Athletic
Opportunities (Girls)
Percentage of Athletic
Opportunities (Boys)
Gender Equity Ratio:
Athletic Opportunities
North Dakota 63% North Dakota 73% Alaska 1.3
Wyoming 63% Wyoming 68% New Hampshire 0.95
New York 62% New York 66% Maine 0.94
Maine 61% Iowa 64% Wyoming 0.92
South Dakota 60% Montana 64% Vermont 0.89
Iowa 60% South Dakota 64% Delaware 0.88
Montana 60% Maine 63% New York 0.86
Vermont 57% Wisconsin 62% South Dakota 0.86
New Hampshire 55% Vermont 61% Minnesota 0.85
Kansas 52% Kansas 60% Maryland 0.83
Nebraska 52% Nebraska 60% Iowa 0.82
Wisconsin 51% Connecticut 58% Kentucky 0.82
Minnesota 50% Idaho 57% Michigan 0.82
Connecticut 49% New Hampshire 56% Connecticut 0.81
Michigan 47% New Jersey 56% Montana 0.81
Massachusetts 46% Rhode Island 56% Washington 0.81
Idaho 45% Michigan 55% Hawaii 0.8
New Jersey 45% Massachusetts 54% New Mexico 0.8
Colorado 44% Minnesota 54% Colorado 0.79
Utah 44% Utah 54% North Dakota 0.79
Oklahoma 43% Oklahoma 53% Wisconsin 0.79
Rhode Island 43% Colorado 52% New Jersey 0.78
Hawaii 42% Missouri 51% Massachusetts 0.78
Washington 42% Ohio 51% Oklahoma 0.77
New Mexico 40% Hawaii 50% Utah 0.77
Ohio 40% South Carolina 50% Virginia 0.77
Oregon 40% Washington 50% West Virginia 0.77
Kentucky 38% Indiana 48% Florida 0.76
Missouri 38% New Mexico 48% Rhode Island 0.76
Indiana 37% Oregon 48% Indiana 0.75
Pennsylvania 37% Illinois 47% Missouri 0.75

www.WomensSportsFoundation.org • 800.227.398829Progress Without Equity: The Provision of High School Athletic Opportunity in the United States, by Gender 1993-94 through 2005-06
Percentage of Athletic
Opportunities (Girls)
Percentage of Athletic
Opportunities (Boys)
Gender Equity Ratio:
Athletic Opportunities
Virginia 37% Arkansas 47% Oregon 0.75
Delaware 36% Kentucky 47% Pennsylvania 0.75
Illinois 36% Texas 47% Louisiana 0.74
West Virginia 36% Mississippi 47% Nebraska 0.73
Maryland 34% North Carolina 46% Ohio 0.73
Arizona 33% Virginia 46% South Carolina 0.73
Arkansas 33% Alabama 45% Arizona 0.72
South Carolina 33% Pennsylvania 45% California 0.72
Texas 33% West Virginia 45% Kansas 0.72
Alaska 32% Arizona 43% Idaho 0.71
North Carolina 32% Nevada 42% Nevada 0.69
Nevada 31% Delaware 41% North Carolina 0.69
Mississippi 29% Louisiana 41% Georgia 0.66
Alabama 28% Maryland 40% Arkansas 0.65
Louisiana 25% Tennessee 38% Illinois 0.65
California 24% Georgia 37% Texas 0.64
Georgia 24% Alaska 34% Alabama 0.62
Tennessee 24% California 32% Mississippi 0.62
Florida 16% Florida 22% Tennessee 0.62
DC 6% DC 15% DC 0.56

www.WomensSportsFoundation.org • 800.227.398830Progress Without Equity: The Provision of High School Athletic Opportunity in the United States, by Gender 1993-94 through 2005-06
Policymakers ideally reach out for information in order
to inform their efforts to maintain or modify projects and
programs. Some of the data they work with are close to
the ground, that is, superintendents or building principals
typically know “the numbers” in their schools or district.
They also know the principle of gender equity and the legal
guidance affixed to Title IX.
This report provides educators and policymakers at the
national and state levels with new and accurate information.
Throughout its 37-year history, the Women’s Sports
Foundation has sought to base its knowledge of gender
and sport on evidence. In order to extend and expand this
commitment to evidence-based research, the Foundation
has partnered with the University of Michigan to create a
joint research and policy center. The center is known as the
Women’s Sports, Health and Activity Research and Policy
Center (SHARP). The center will generate interdisciplinary
research on issues related to women’s sports, health,
gender issues and kinesiology. The mission of CRPASH at
D’Youville College is also propelled by the tenet that policy
is best based on evidence.
The data presented here reflect the provision of athletic
opportunities to U.S. girls and boys during an historical
period in which the influence of Title IX was expanding.
Some school officials and athletic directors may use this
information as a touchstone for conversation and reform.
In other schools, a male athletic director’s devotion to the
“way it was” or persistent gender stereotypes may thwart
recognition of the need for greater gender equity. Some
administrators might also attempt to fly under the radar of
the law.
Despite the social and economic challenges that daunt
most educational reform, some progress was made toward
expanding the opportunity sector of interscholastic sports
to include more girls between 1993-94 and 2005-06.
And yet, gender equity was not achieved. Indeed some
of the findings revealed a decline (in the Northeast)
or leveling off of increases in the provision of athletic
participation opportunities among girls between 1999-
2000 and 2005-06 (in the Midwest and West). While
southern schools reported an upswing during this same
period, they provided the lowest regional rate of athletic
participation opportunities.
The most striking policy implication unearthed by this
analysis is embedded in two seemingly contradictory
findings. While many schools generally provided girls and
boys with equitable numbers of sports and teams during
2005-06, boys still received a disproportionately more
CONCLUSION

www.WomensSportsFoundation.org • 800.227.398831Progress Without Equity: The Provision of High School Athletic Opportunity in the United States, by Gender 1993-94 through 2005-06
athletic participation opportunities than girls in most
schools, communities and states. Nationally, for example,
boys’ share of athletic participation opportunities was about
26% higher than girls’ (i.e., gender ratio of .74) (See Figure
1 on page 20). One key question for school administrators
is, therefore, when is the addition of teams and sports for
girls truly intended to mend gender inequities in a school,
or in contrast, when is the addition of girls’ teams or sports
a smokescreen that hides and extends gender inequity in
the school?
The findings suggest an alternative strategy for school
officials to pursue in order to provide equitable athletic
participation opportunities for their female and male
students. Schools can create a larger number of teams
and sports for girls than boys in order to establish more
of a balance in the provision of athletic participation
opportunities across genders. Such a policy prescription
might strike some observers as unfair. However, in many
schools, boys are offered freshman football, junior varsity
football and varsity football. The comparatively large squad
sizes needed for football are thus magnified by the number
of teams provided, resulting in a high overall number of
athletic participation opportunities for boys. Similarly, school
officials can add more teams and sports for girls than for
boys, or they can create additional squads within sports
(e.g., volleyball or basketball) in order to increase the total
athletic participation opportunities among girls and, in
effect, to further approach gender equity across all sports.
The fact that the number of teams and sports increased
across 12 years without a comparable acceleration
toward gender equity in athletic participation opportunities
strengthens legal arguments that participation rates need
to be the central focus of program assessment. And
methodologically, our results should alert researchers to
recognize the limited validity of relying on team numbers
and sport numbers as operational measures of gender
equity in U.S. high schools.
One timeworn rationale for giving boys more athletic
participation opportunities is that girls are not as interested
in sports as boys. If this were the case, however, then how
does one explain the huge increase in girls’ participation
in sport that mushroomed during the past 30 to 35 years?
Did girls suddenly and spontaneously become interested in
sports during the 1980s and, subsequently, rush through
the doors of opportunity? It is much more likely that the
surge in girls’ athletic participation was a response to the
creation of programs, teams and recruitment strategies that
were undertaken by schools and communities across the
country. Children’s interest levels vary by grade level, school
location and family income levels.13 And our data show that
girls’ participation rates vary a great deal between southern
states (lowest rates of athletic participation among girls)
compared to northeastern states (highest rates of girls’
participation). Are southern girls and boys so different from
their northeastern counterparts? The historical evidence
confirms the adage, “If you build it, they will come.”

www.WomensSportsFoundation.org • 800.227.398832Progress Without Equity: The Provision of High School Athletic Opportunity in the United States, by Gender 1993-94 through 2005-06
Finally, the context of current policy debates about high
school sport is often confined to sport itself. Put simply,
debates focus on what is happening “in the sports
programs.” But if the research across nearly three decades
tells us anything, it is that the influence of youth sports
spills over into the classroom, family life, test-taking, and
general health and well-being of American youth. Amidst
the current economic downturn, sport remains a sound
investment in youth development. The investment should
be made equitably. With regard to gender equity in sport,
there is more at stake than who wears the cleats, throws
the balls, runs the fastest, or becomes the best teammate
or team leader. Then and now, high school athletic
participation was a conduit for physical, social, educational
and health gains among U.S. adolescents. Increasingly,
parents want the same resources for their daughters
as their sons. We hope that the results and analyses
presented in this report put empirical wind in the sails of
further reform.

www.WomensSportsFoundation.org • 800.227.398833Progress Without Equity: The Provision of High School Athletic Opportunity in the United States, by Gender 1993-94 through 2005-06
Data for this analysis draws from two sources. By merging
these three national data sets, the researchers were able to
detect and analyze how athletic opportunities varied across
geographic region and type of community, as well as in
relation to various school characteristics. The first source of
data comes from the Civil Rights Data Collection (CRDC)14.
Three cross-sections of elementary and secondary public
schools collected during 1994 (n = 44,151), 2000 (n =
88,650)15 and 2006 (n = 62,484)16 were merged to create
a larger data set to analyze changes in the number of
different sports, number of athletic teams and percentage of
athletic opportunities that U.S. public high schools provided
to girls and boys. Only administrators at high schools were
asked to respond to questions that dealt with the number
of different sports offered to girls and boys, the number of
athletic teams offered to girls and boys, and the number
of girls and boys who participate on teams throughout the
school year. This analysis is restricted to high schools that
offered grades 9-12 to both girls and boys during the three
time periods, resulting in a sample of 24,370 high schools
(1994, n = 4,566; 2000, n = 12,030; 2006, n = 7,774).
The second source of data comes from the Common
Core of Data (CCD), which is collected annually by the
National Center for Education Statistics (NCES). The CCD
gathers basic demographics on all public U.S. elementary
and secondary schools. To help supplement the CRDC
data, CCD data were merged to determine each school’s
geographic location (i.e., whether the school is located in
an urban, suburban, town or rural area), the percent of
students who are eligible for free lunch, gender composition
(i.e., number of students who are female and male), and
the number of students enrolled during the school year.
The CCD was collected during the same time periods as
the CRDC data. The CCD data17 that was merged to create
the final data set includes the data files from the 1993-94,
1999-2000 and 2005-06 school years.
APPENDIX A: DESIGN AND DATA ANALYSIS
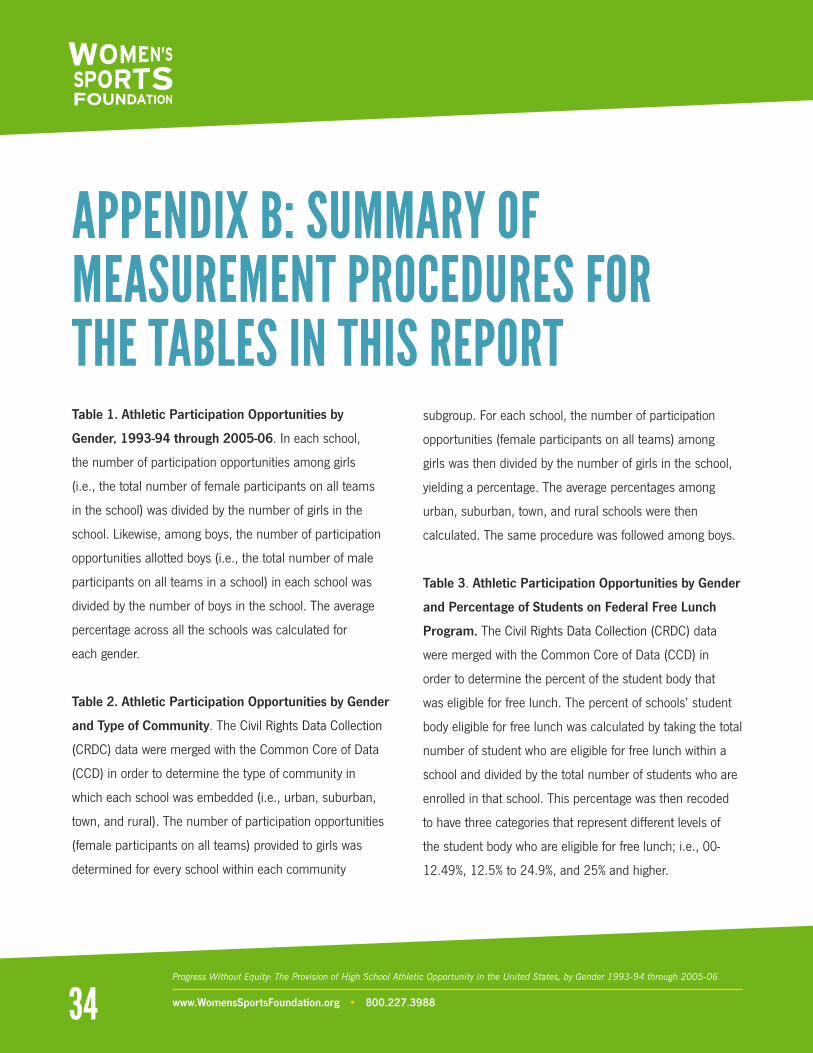
www.WomensSportsFoundation.org • 800.227.398834Progress Without Equity: The Provision of High School Athletic Opportunity in the United States, by Gender 1993-94 through 2005-06
Table 1. Athletic Participation Opportunities by
Gender, 1993-94 through 2005-06. In each school,
the number of participation opportunities among girls
(i.e., the total number of female participants on all teams
in the school) was divided by the number of girls in the
school. Likewise, among boys, the number of participation
opportunities allotted boys (i.e., the total number of male
participants on all teams in a school) in each school was
divided by the number of boys in the school. The average
percentage across all the schools was calculated for
each gender.
Table 2. Athletic Participation Opportunities by Gender
and Type of Community. The Civil Rights Data Collection
(CRDC) data were merged with the Common Core of Data
(CCD) in order to determine the type of community in
which each school was embedded (i.e., urban, suburban,
town, and rural). The number of participation opportunities
(female participants on all teams) provided to girls was
determined for every school within each community
subgroup. For each school, the number of participation
opportunities (female participants on all teams) among
girls was then divided by the number of girls in the school,
yielding a percentage. The average percentages among
urban, suburban, town, and rural schools were then
calculated. The same procedure was followed among boys.
Table 3. Athletic Participation Opportunities by Gender
and Percentage of Students on Federal Free Lunch
Program. The Civil Rights Data Collection (CRDC) data
were merged with the Common Core of Data (CCD) in
order to determine the percent of the student body that
was eligible for free lunch. The percent of schools’ student
body eligible for free lunch was calculated by taking the total
number of student who are eligible for free lunch within a
school and divided by the total number of students who are
enrolled in that school. This percentage was then recoded
to have three categories that represent different levels of
the student body who are eligible for free lunch; i.e., 00-
12.49%, 12.5% to 24.9%, and 25% and higher.
APPENDIX B: SUMMARY OF MEASUREMENT PROCEDURES FOR THE TABLES IN THIS REPORT

www.WomensSportsFoundation.org • 800.227.398835Progress Without Equity: The Provision of High School Athletic Opportunity in the United States, by Gender 1993-94 through 2005-06
Table 4. Athletic Participation Opportunities by
Gender and Geographic Region. The Civil Rights Data
Collection (CRDC) data were merged with the Common
Core of Data (CCD) in order to determine the geographical
region in which each school was located and, subsequently,
subgrouped schools in their respective geographic region
(Northeast, Midwest, South and West). The number of
participation opportunities provided to girls was determined
for every school in the states (including the District of
Columbia) that comprised the geographic region. For
each school, the number of participation opportunities
among girls was then divided by the number of girls in the
school, yielding a percentage. The average percentages
among schools in the Northeast, Midwest, South and West
were then calculated. The same procedure was followed
among boys.
Table 5. Number of Sports and Teams by Gender,
1993-94 through 2005-06. The number of female-only
sports in each school was determined and an average
among all schools was calculated. The same procedure was
followed among boys. The number of female-only athletic
teams in each school was determined and an average
among all the schools was calculated. The same procedure
was followed among boys.
Table 6. Number of Sports by Gender and Type of
Community. The number of female-only sports in each
school was determined and averages were calculated
among all schools within urban, suburban, town and
rural communities. The same procedure was followed to
calculate the number of male-only sports among boys.
Table 7. Number of Teams by Gender and Type of
Community. The number of female-only teams in each
school was determined and averages were calculated
among all schools within urban, suburban, town and rural
communities. The same procedure was followed among boys.
Table 8. Number of Sports by Gender the Percentage
of Students on Federal Free Lunch Program. See Table
3 for details on measurement and classification procedures.
Table 9. Number of Teams by Gender and Percentage
of Students on Federal Free Lunch Program. See Table
3 for details on measurement and classification procedures.
Table 10. Number of Sports by Gender and Geographic
Region. The number of female-only sports in each school
was determined and averages were calculated among all
schools within the four geographic regions; i.e., Northeast,
Midwest, South and West. The same procedure was
followed among boys.
Table 11. Number of Teams by Gender and Geographic
Region. The number of female-only sports teams in each
school was determined and averages were calculated
among all schools within the four geographic regions; i.e.,
Northeast, Midwest, South and West. The same procedure
was followed among boys.

www.WomensSportsFoundation.org • 800.227.398836Progress Without Equity: The Provision of High School Athletic Opportunity in the United States, by Gender 1993-94 through 2005-06
Figure 1. The Gender Equity Ratios for Athletic
Participation Opportunity, 1993-94 through 2005-06.
The gender equity ratio was calculated by taking the total
number of athletic opportunities provided to girls (female
participants) in each school divided by the total number of
athletic opportunities provided to boys (male participants)
in each school. The ratios were then averaged across the
entire U.S. sample. A similar calculation was performed
for the states that comprise the four geographic regions
of the nation. If the gender equity ratio equals 1.00, then
equal numbers of participation opportunities were provided
to girls and boys. When the gender equity ratio falls below
1.00, it means that girls were allocated fewer opportunities
than boys. Conversely, if the gender equity ratio is above
1.00, it means that girls were given more opportunities
than boys.
Figure 2. The Gender Equity Ratio between the
Number of Athletic Participation Opportunities
Provided to U.S. Girls and Boys, by Geographic Region,
1993-94 and 2005-06. The gender equity ratios were
calculated the same as outlined above but by analyzing data
by geographic region and year the school year when the
data were collected.
Table 12. Regional and State-by-State Comparisons
of the Three Gender Equity Ratios, by Gender and
Geographic Region, 2005-06. For each of the 50 states
in the United States and the District of Columbia, three
gender equity ratios were calculated in order to compare the
amount of athletic opportunities provided by high schools
to girls and boys across the timeframe. The three gender
equity ratios measure the number of athletic participation
opportunities (participants), the number of teams and
the number of sports. In each instance the number of
opportunities allotted to girls was divided by the number
provided to boys, producing a ratio. As above, when the
gender equity equals 1.00, this indicates an equitable
allocation of athletic opportunities between girls and boys.
When the ratio falls below 1.00, it means that girls were
allocated fewer opportunities than boys. Conversely, if the
gender equity ratio is above 1.00, it means that girls were
given more opportunities than boys.
Table 13. Changes in the Provision of Athletic
Opportunities between 1993-94 and 2005-06,
Regional and State-by-State and Comparisons by
Gender. The same calculations were done here as
presented in Table 12. Here, however, the respective
differences were also calculated to measure overall
increases and decreases in the gender equity ratio
with regard to athletic participation opportunities. The
differences in the gender equity ratios, the number of teams
and the number of sports between 1993-94 and 2005-
06 were calculated in order to compare changes in the
number of additional (or reduction of) athletic participation
opportunities, teams and sports created for girls and boys
across the 12-year time frame.

www.WomensSportsFoundation.org • 800.227.398837Progress Without Equity: The Provision of High School Athletic Opportunity in the United States, by Gender 1993-94 through 2005-06
Table 14. State-by-State Rankings: Percentage of
Athletic Participation Opportunities across High
Schools and the Gender Equity Ratios for Athletic
Participation Opportunities, 2005-06. The same
calculation procedure detailed for Table 1 was conducted
here as a foundation for comparison and ranking. For
each school, the number of participation opportunities
among girls (i.e., the total number of female participants
on all teams in the school) was divided by the number of
girls in the school. Likewise, the number of participation
opportunities allotted boys (i.e., the total number of male
participants on all teams in the school) was divided by the
number of boys in the school. The average percentage
across all the schools was calculated for each gender and
an average percentage was computed for each state by
multiplying the rate by 100. These averages were then
ranked in descending order. Finally, the gender equity
ratios among schools within each state were averaged and
presented in descending order.

www.WomensSportsFoundation.org • 800.227.398838Progress Without Equity: The Provision of High School Athletic Opportunity in the United States, by Gender 1993-94 through 2005-06
ENDNOTES1 National Center for Education Statistics. 2010. Digest
of Education Statistics. Table 164.
2 One nationwide survey of parents found that 39%
of mothers and 37% of fathers agreed that “The
schools in my community care more about boys’
sports programs than girls’ sports programs.” Sabo,
D. & Veliz, P. (2008). Go Out & Play: Youth Sports
in America. East Meadow, NY: Women’s Sports
Foundation, p. 136.
3 For example, Sabo, D. and Veliz, P. (2008) found that
among a national U. S. sample of high school students,
53% of girls participated in one or two sports in their
school and community, while 14% participated in three
or more sports. The respective percentages among
high school boys were 48% and 22% (p. 12). See Go
Out & Play: Youth Sports in America. East Meadow, NY:
Women’s Sports Foundation.
4 This question comes from the survey used in the Civil
Rights Data Collection. It should also be noted that
the OCR instructions specify that respondents “Do not
include intramural sports or cheerleading.”
5 CRDC data has been collected in 1994, 2000, 2002,
2004 and 2006. The surveys are distributed during
the specified years, but ask school administrators to
report on the pervious school year (i.e., CRDC data
from 1994 has information pertaining to the 1993-94
school year).
6 The Civil Right Data Collection for 2000 collected
information on all public schools in the United States
during the 1999-2000 school year.
7 The CRDC asked school administrators to report the
total number of sport participants for each sport during
the school year. This means that some students were
counted more than once if they participated in more
than one sport (e.g., a student would be counted once
if she is on the volleyball team and twice if she also
plays basketball).

www.WomensSportsFoundation.org • 800.227.398839Progress Without Equity: The Provision of High School Athletic Opportunity in the United States, by Gender 1993-94 through 2005-06
8 Regional divisions (U.S. census Bureau): Northeast
(includes Mid-Atlantic states) - New England, Maine,
New Hampshire, Vermont, Massachusetts, Rhode
Island, Connecticut, New York, Pennsylvania, New
Jersey; Midwest (includes West North Central
states) - Wisconsin, Michigan, Illinois, Indiana, Ohio,
Missouri, North Dakota, South Dakota, Nebraska,
Kansas, Minnesota, Iowa; South - Delaware, Maryland,
District of Columbia, Virginia, West Virginia, North
Carolina, South Carolina, Georgia, Florida, Kentucky,
Tennessee, Mississippi, Alabama, Oklahoma, Texas,
Arkansas, Louisiana; West - Idaho, Montana, Wyoming,
Nevada, Utah, Colorado, Arizona, New Mexico, Alaska,
Washington, Oregon, California, Hawaii.
9 CCD collection for the 1999-2000 and 2005-06 school
years defined eight geographic regions where schools
could be located. “Large City” and “Midsize City”
were combined to represent high schools located in
urban areas. “Urban fringe of a large city” and “Urban
fringe of a midsize city” were combined to represent
high schools located in suburban areas. “Large Town”
(population ≥ to 25,000 located outside a metropolitan
Core Based Statistical Area (CBSA) or inside a
micropolitan CBSA) and “Small Town” (population
25,000 ≥ to 2,500 and located outside a metropolitan
CBSA or inside a micropolitan CBSA) were combined
to represent schools located in towns. “Rural, outside
CBSA” and “Rural, inside CBSA” were combined
to represent schools located in rural area. It should
also be noted that the CCD collection for the 1993-
94 school year only had one geographic category for
rural areas, but did have similar categories for urban,
suburban and town areas.
10 CCD collection defined 8 geographic regions where
schools could be located. “Large City” and “Midsize
city” were combined to represent high schools located
in urban areas. “Urban fringe of a large city” and
“Urban fringe of a midsize city” were combined to
represent high schools located in suburban areas.
“Large Town” (population ≥ to 25,000 located outside
a metropolitan CBSA or inside a micropolitan CBSA)
and “Small Town” (population 25,000 ≥ to 2,500
and located outside a metropolitan CBSA or inside
a micropolitan CBSA) were combined to represent
schools located in towns. “Rural, outside CBSA” and
“Rural, inside CBSA” were combined to represent
schools located in rural area.
11 As explained earlier in the text, the percentage of
athletic participation opportunities provided to girls
was calculated by dividing the total number of reported
participation slots filled by girls across all teams by the
number of girls in the school. The same procedure was
done among the boys.

www.WomensSportsFoundation.org • 800.227.398840Progress Without Equity: The Provision of High School Athletic Opportunity in the United States, by Gender 1993-94 through 2005-06
12 There is emphasis placed on “national” because
the extent of gender equity varied across geographic
regions and between states. These data are presented
in the next section of this report.
13 Sabo, D. & Veliz, P. (2008). Go Out and Play: Youth
Sports in America. East Meadow, NY: Women’s Sports
Foundation. See Part VII.
14 CRDC data has been collected in 1994, 2000, 2002,
2004 and 2006. The surveys are distributed during the
specified years, but ask school administrators to report
on the pervious school year (i.e. CRDC data from 1994
has information pertaining to the 1993-94 school year).
15 The Civil Right Data Collection for 2000 collected
information on all public schools in the United States
during the 1999-2000 school year.
16 The Civil Right Data Collection for 2006 collected
information on all public schools in the United States
during the 2005-06 school year.
17 CCD Data can be found at the following website:
http://nces.ed.gov/ccd/ccddata.asp

Founded in 1974 by tennis legend, Billie Jean King, the
Women’s Sports Foundation is dedicated to advancing the
lives of girls and women through sports and physical activity.
ABOUT THE WOMEN’S SPORTS FOUNDATION
800.227.3988