
Progress report Impregnated Micro-Sandwich structures, SIMS 5874_2012 - I invio/DELTA TECH... ·...
26
1 Progress report Material characterization and impact performance of Semi Impregnated Micro-Sandwich structures, SIMS By. Prof. G. Belingardi, Alem .T. Beyene & J.Ji Dipartimento di Ingegneria Meccanica e Aerospaziale
Transcript of Progress report Impregnated Micro-Sandwich structures, SIMS 5874_2012 - I invio/DELTA TECH... ·...

1
Progress report
Material characterization and impact performance of Semi Impregnated Micro-Sandwich structures, SIMS
By.
Prof. G. Belingardi, Alem .T. Beyene & J.Ji
Dip
art
ime
nto
di
Ing
eg
ne
ria
Me
cca
nic
a e
Ae
rosp
azi
ale
2
Material characterization and impact performance of Semi Impregnated
Micro-Sandwich structures, SIMS
1.Introduction
In the development of thin sandwich structures that contain long fibre composite skins and low-cost fleece core, porosity that often remains within the fleece is expected, while the non-woven fleece is needed to be completely wetted and bonded by the matrix both inside the fleece itself and to the composite skins in order to obtain the desired stiffness. Such structures are actually thinner and easier to manufacture than the traditional one and have been widely used in the past, both in automotive and sporting good applications including helmet and footwear [1], In the present investigation program, a material characterization and damage study are conducted on a Semi Impregnated Micro-Sandwich structures (SIMS). SIMS is a novel material that has been devised and proposed by DELTAtech company. As per claimed by the company [2], in comparison with the traditional thin sandwich structures, SIMS is relatively thicker but is low-cost and has high impact performance, so that it is an interesting candidate for automotive applications in impact absorbing components. As the mechanical properties of the materials produced is strongly influenced by the microstructure achieved during the manufacturing process, an extensive optimization of material processing constraints is needed to limit the amount of dry fiber in the structure. With such proper constraint combination and controlled impregnation, the materials can exhibit very high toughness due to the deformation mechanism in the dry regions of the non-woven fleece. In particular the fibre in the dry regions can slide respect to each other without showing a neat fracture; this mechanism causes high level of failure strain of the material and high level of energy absorbed during the deformation. Besides, the possibility to adjust the sandwich microstructure, by changing the impregnation level of the non-woven core, offers a flexible tool for tuning material properties during the manufacturing process [2 ].
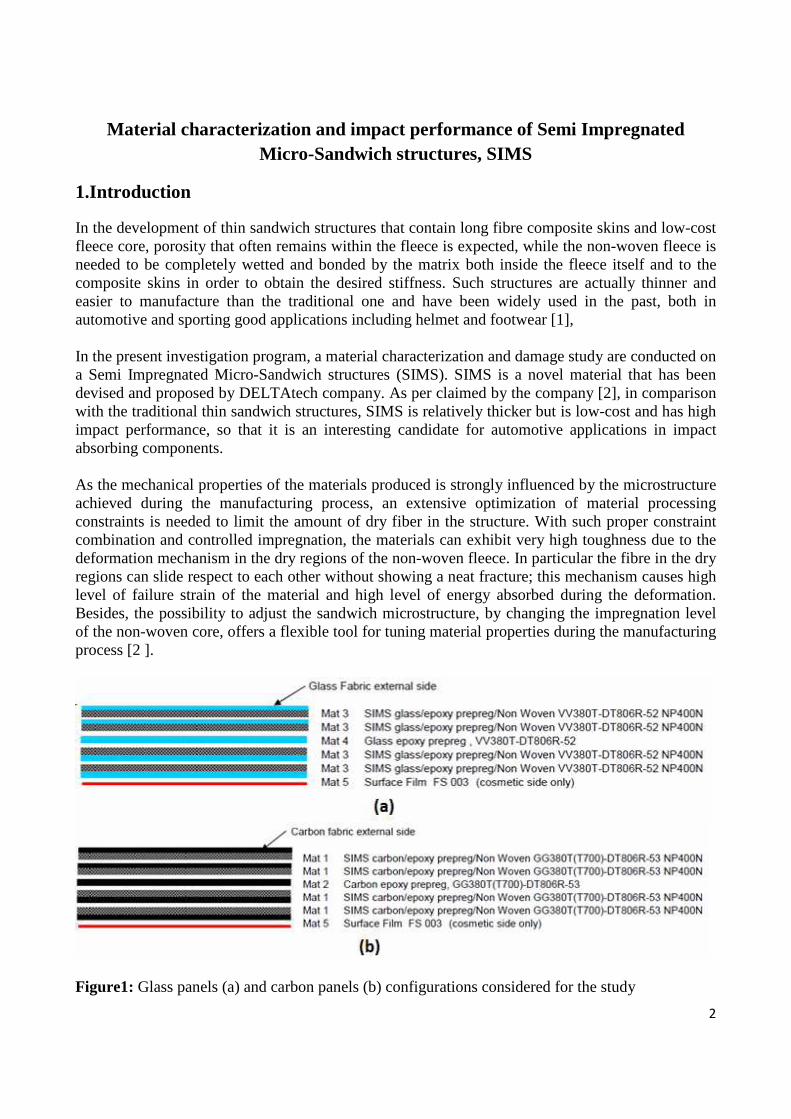
Figure1: Glass panels (a) and carbon panels (b) configurations considered for the study

3
For the current study, micro-sandwich panels were fabricated from glass fabric and carbon fabric pre-preg and nonwoven needle-punched PET, as shown in figure 1, in the following they are referred as G-SIMS and C-SIMS respectively. Thick plies of dry non-woven fleece were used, in combination with thin woven prepreg plies. This results in relatively thick structures with different extent of dry fibre content within the core thickness.
Figure 2: Dry fiber presence at different level of resin content. The dry zone percentage in the core is progressively descending from picture a to picture d, it results directly related to the level of the impregnation of the glass fabric used for the skins. Panel d shows no presence of dry regions. [2] During panels fabrication, the amount of fleece impregnation were controlled, as different level of impregnation varies the amount of dry fiber present in the structure that ultimately affects the material behavior as shown on figure 2 where the content is respectively (a) 36.4% of Glass fabric resin and 0% of Non-woven PET resin,(b) 40.9% of Glass fabric resin and 0% of Non-woven PET resin, (c) 49.4 % of Glass fabric resin and 0% of Non-woven PET resin and, finally, (d), 36.4% of Glass fabric resin and 60% of Non-woven PET resin. In general, when fleece impregnation level was too low, and therefore not enough stiff bridging could form between the two composite skins, the obtained panel was relatively soft and characterized by very poor dimensional stability. On the other side, once sufficient matrix bridging could form between the skins, panels showed good stiffness and dimensional stability which, in case of small deformations, seemed to be independent on the level of core impregnation.

4
2.Panel fabrication
One panel of carbon and one panel of glass Semi Iimpregnated Micro-Sandwich were prepared. They respectively consist of a mat composed carbon/epoxy prepreg/Non-Woven GG380T(T700)-DT806R-53 NP400N, Carbon epoxy prepreg, GG380T(T700)-DT806R-53 and Surface Film FS 003 (cosmetic side only) for C-SIMS and a mat composed glass/epoxy prepreg/Non-Woven VV380T-DT806R-52 NP400N, Glass epoxy prepreg , VV380T-DT806R-52 and Surface Film FS 003 (cosmetic side only) for G-SIMS, with the layup configuration shown figure 1. Both sides of the panel were covered by well treated flat metal. The whole assembly was placed into a vacuum bag, having care to allow the fleece in the laminate to communicate with the vacuum system. The panels were cured in autoclave at 100°C for 90 min, with heating ramp 2÷3 °C/min and 4 bar pressure. Once autoclave pressure was reached, the vacuum bag was vented to atmospheric pressure. 3. Material characterization
Considering the novelty of the proposed material, extensive material characterization has been conducted to obtain the main mechanical properties of the material and to understand the failure mechanism for the intended loading case. Four test programs were designed: tensile tests (both longitudinal and transverse directions), compressive tests (both longitudinal and transverse directions), plane shear tests (both longitudinal and transverse direction), and drop-dart tests. A brief summary of the test set-up is presented in the following sections.
3.1 Tensile test As per ASTM D3039, samples were cut from the panels of each material type in both longitudinal and transverse directions. The samples were instrumented with strain gages, as shown in figure 3, to measure Young’s modulus and Poisson’s ratio. Tensile tests were conducted with a 100 kN capacity servo-hydraulic testing machine (INSTRON-8801), shown in Figure 4. Each sample was clamped by means of hydraulic wedge grips. The machine was equipped with a standard load cell and a crosshead displacement measuring device. During the mount phase of the specimen, the maximum preload was controlled and set lower than 0.2 kN in order to avoid specimen damage. According to ASTM D3039, samples were subjected to monotonic tensile loading with a stroke rate of 2 mm/min. The strain gages data were acquired by a NI WLS-9163 data acquisition board while the load and crosshead displacement data were acquired from the testing machine by a NI DAQCard-6062E card. All data were acquired with a sampling rate equal to 1 kHz.

5
Figure 3: Sample for tensile test
Figure 4: Experimental set-up for tensile test 3.1.1 Result of tensile tests.
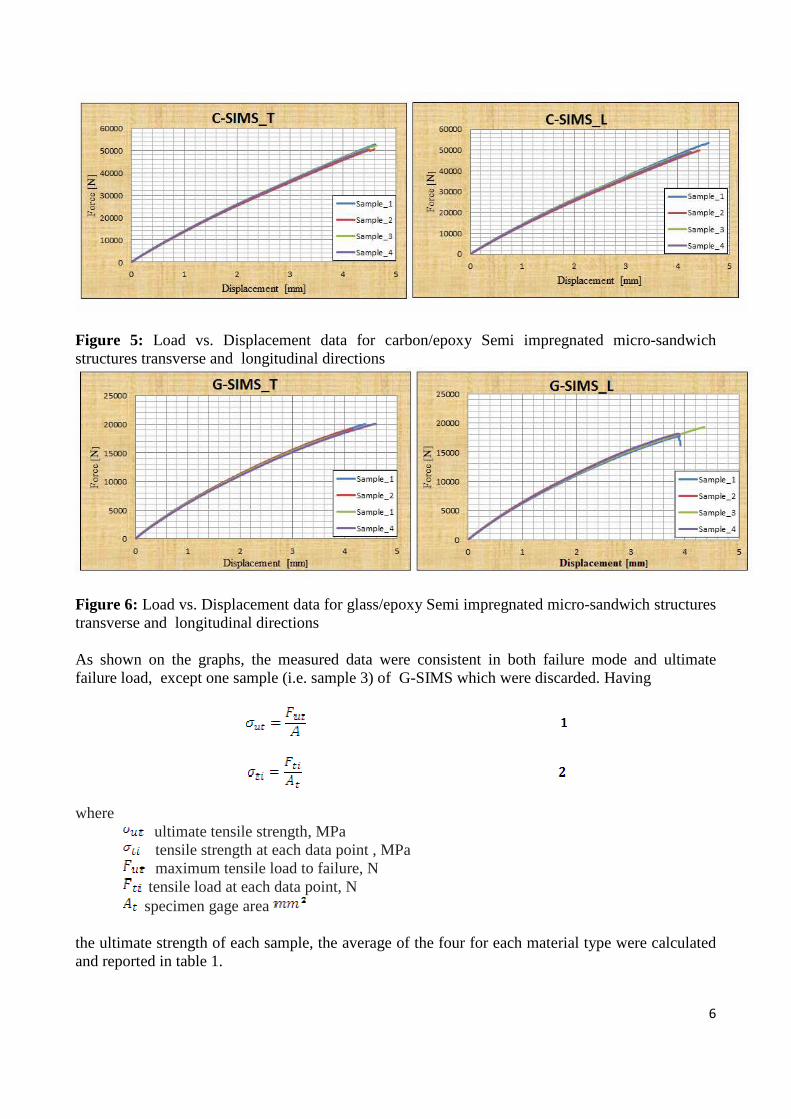
With the set-up described in the previous paragraph, four samples of each material type in both longitudinal and transverse direction, instrumented with strain gages were subjected to monotonic tensile loading with a stroke rate of 2 mm/min up to failure. The load and crosshead displacement data acquired from the testing machine were recorded as shown on figures 5 and 6 and then the ultimate tensile strength and the stress at each data acquisition point were calculated using equations 1 and 2 respectively
6
Figure 5: Load vs. Displacement data for carbon/epoxy Semi impregnated micro-sandwich structures transverse and longitudinal directions
Figure 6: Load vs. Displacement data for glass/epoxy Semi impregnated micro-sandwich structures transverse and longitudinal directions As shown on the graphs, the measured data were consistent in both failure mode and ultimate failure load, except one sample (i.e. sample 3) of G-SIMS which were discarded. Having
where
ultimate tensile strength, MPa tensile strength at each data point , MPa maximum tensile load to failure, N tensile load at each data point, N specimen gage area
the ultimate strength of each sample, the average of the four for each material type were calculated and reported in table 1.

7
A sample picture that demonstrate the failure mode for each material type is presented in figure 7. As shown in the figure 7, for all C-SIMS samples, besides fracture at the failure zone, a complete central delamination was observed. This failure phenomenon was not observed for G-SIMS samples, except for one of them. As described in the introductory part, Semi impregnated micro-sandwich structures were developed through intentionally limiting the amount of matrix, in order to get completely dry fiber in the final structure. However, developing a uniform matrix bridging all over the panel through such controlled impregnation may not be possible. Therefore, the presence of matrix bridging variation along the length of the panel or ultimately in the sample may create shear load which may be the cause for delamination. The variation of the failure mode between the two materials in terms of delamination may need a further study with closed observation of fabrication process .
Figure 7: Failure mode of tensile loaded G-SIMS and C-SIMS samples The only problem observed on G-SIMS samples was that, due to the strength of glass sandwich structure, some samples failed nearby the griping zone which may have an effect on the ultimate tensile strength. To measure Young’s modulus and Poisson’s ratio, a lab view routine was developed to acquire simultaneously the strains in both longitudinal and transverse direction and the load. As previously mentioned, a NI WLS-9163 data acquisition board was used to acquire strain data and the load and crosshead displacement data were acquired by a NI DAQCard-6062E card.

8
Figure 8: Stress vs. strain data of sample 1 G-SIMS and tensile modules calculation
Figure 9: Strain 1 vs. strain 2 data of sample 1 G-SIMS and tensile Poisson ratio calculation Having calculated the stress at each data point by using equation 2, it is plotted against the respective strain data. The initial linear part of the data curves was used to calculate both Young’s modulus and Poisson’s ratio. Such data analysis was done for each sample separately as shown figures 8 and 9, and then the results from the four samples were averaged to get the material properties that are reported in table 1.

9
C-SIMS G-SIMS
Longitudinal Transverse Longitudinal Transverse
Tensile strength (MPa) 411.8 396.1 154.8 142.7
T. Young Modulus (GPa) 28,7 24,3 11,08 9,7
T. Poisson’s ratio 0.105 0.09 0,21 0,21
Table 1: Tensile test results 3.2 Compression test As per ASTM D6641/D6641M, samples were cut from the same panels where tensile samples were taken, in both longitudinal and transverse directions. The samples were instrumented with strain gages, to measure Young’s modulus and Poisson’s ratio. Here, since there is a limited space to place stain gage on the same face as nominal gage section is 13 mm, the two strain data, i.e. the longitudinal and transverse strains, were acquired by attaching the stain gages on opposite faces of the samples as shown in figure 10. Buckling and bending at the gage section are the common problem in compressive loading tests and this can occur due to imperfections in the test specimen, the specimen fixture, improper gage section or the testing procedure and needs to be monitored. The occurrence of Euler buckling totally invalidates the test and the presence of bending have to be limited to 10% . Therefore the in order
Figure 10: A back-to-back strain gages for buckling and bending percentage test to control such buckling and bending problems a back-to-back strain gages placement, i.e. positioning longitudinal stain gages on both sides of the samples as shown figure 10, was used for some set of samples of each material and the percentage of the bending was determined using equation 3
Having calibrated test set up, here again the 100 kN capacity servo-hydraulic testing machine (INSTRON-8801), shown in Figure 11, was used together with the specimen fixtures specific for the compressive tests. According to ASTM D6641/D6641M, samples were subjected to monotonic compressive loading with a stroke rate of 1.3 mm/min. The strain gages data were acquired by a NI WLS-9163 data acquisition board and the load and crosshead displacement data were acquired from

10
the testing machine by a NI DAQCard-6062E card. All data were acquired with a sampling rate equal to 1 kHz
Figure 11: Test set-up for compression test
3.2.1 Result of compression tests.
With the set-up described in the previous paragraph, four samples of each material type in both longitudinal and transverse directions, instrumented with strain gages, were subjected to monotonic compressive loading with a stroke rate of 1.3 mm/min up to failure.
Figure 12: Load vs. Displacement data for carbon/epoxy Semi impregnated micro-sandwich structures longitudinal and transverse directions

11
Figure 13: Load vs. Displacement data for glass/epoxy Semi impregnated micro-sandwich structures longitudinal and transverse directions
The load and crosshead displacement data acquired from the testing machine were recorded as shown on figures 12 and 13 and then the ultimate compression strength and the stress at each data point were calculated using equation 4 and 5 respectively. Having the ultimate stress of each sample, the average of the four for each material type were calculated and reported in table 2.
where
ultimate compressive strength, MPa compressive strength at each data point , MPa maximum compressive load to failure, N compressive load at each data point, N specimen gage area
To measure Young’s modulus and Poisson’s ratio, the lab view routine developed for tensile test was used to acquire simultaneously the strain in both longitudinal and transverse directions and the load. As previously mentioned, a NI WLS-9163 data acquisition board was used to acquire strain data and the load and crosshead displacement data were acquired by a NI DAQCard-6062E card.

12
Figure 14: Stress vs. strain data of sample 1 G-SIMS and compressive modules calculation
Figure 15: Strain 1 vs. strain 2 data of sample 1 G-SIMS and compressive Poisson ratio calculation Having calculated the stress at each data point by using equation 5, it is plotted against the respective strain data. The initial linear part of the data curves was used to calculate both Young’s modulus and Poisson’s ratio. Such data analysis was done for each sample separately as shown in figures 14 and 15, and then the results from the four samples were averaged to get the material properties as reported in table 2.
13
C-SIMS G-SIMS
Longitudinal Transverse Longitudinal Transverse
Compressive strength (MPa) 128.4 125.3 113.3 106.1
C. Young Modulus (GPa) 26,8 22,84 10,48 10,44
C. Poisson’s ratio 0.044 0.048 0,17 0,189
Table 2: Compressive test results By comparison of the mechanical properties reported in Tables 1 and 2, it comes out that the obtained Young’s modulus in tension and in compression are quite similar, the Poisson ratio in compression are smaller that the tensile ones and, as expected, there is a large difference between the strength in tension and in compression. In particular for the C-SIMS specimens the compression value with respect to the tensile value is of the order of magnitude of 30 %, while for the G-SIMS is of the order of magnitude of 70 %. This is probably due to the fact that the C-SIMS specimens in compression, having higher fiber strength, are more sensitive to the lateral instability.
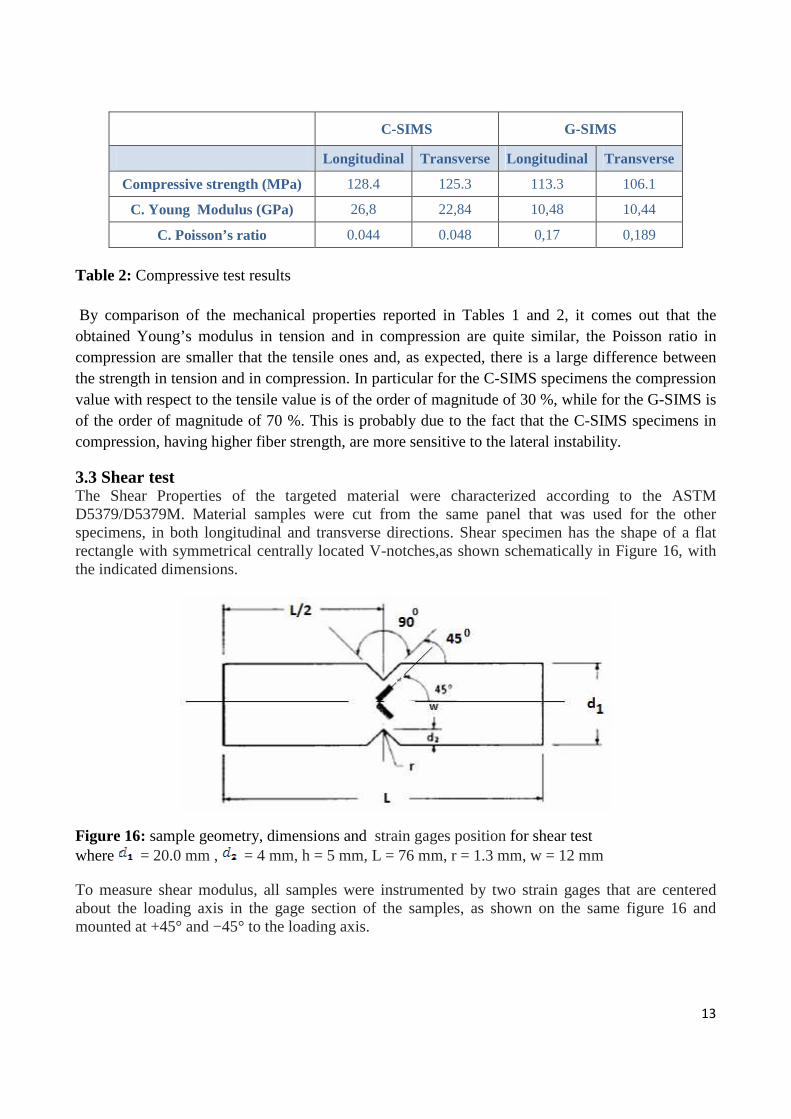
3.3 Shear test The Shear Properties of the targeted material were characterized according to the ASTM D5379/D5379M. Material samples were cut from the same panel that was used for the other specimens, in both longitudinal and transverse directions. Shear specimen has the shape of a flat rectangle with symmetrical centrally located V-notches,as shown schematically in Figure 16, with the indicated dimensions.
Figure 16: sample geometry, dimensions and strain gages position for shear test where = 20.0 mm , = 4 mm, h = 5 mm, L = 76 mm, r = 1.3 mm, w = 12 mm
To measure shear modulus, all samples were instrumented by two strain gages that are centered about the loading axis in the gage section of the samples, as shown on the same figure 16 and mounted at +45° and −45° to the loading axis.

14
Figure 17: Test set-up and specimen fixture used for shear test A 100 kN capacity servo-hydraulic testing machine (INSTRON-8801) with proper specific shear test fixture, as shown in Figure 17, was used. As per the standard, samples were subjected to monotonic shear loading with a stroke rate of 1.3 mm/min. Again the strain gages data were acquired by a NI WLS-9163 data acquisition board while the load and crosshead displacement data were acquired from the testing machine by a NI DAQCard-6062E card. All data were acquired with a sampling rate equal to 1 kHz The sample were centered in the fixture so that the line of action of the load acts directly through the center of the notch on the coupon. Both jaws have been lightly tightened so that the specimen is contacting the upper and lower grip surfaces on both left- and right-hand sides and is lightly supported on the back side away from the gage section. 3.3.1 Result of shear tests With the set-up described in the previous paragraph, four samples of each material type in both longitudinal and transverse direction instrumented with strain gages were subjected to monotonic compressive loading with a stroke rate of 1.3 mm/min up to the failure load. The load and crosshead displacement data acquired from the testing machine were recorded as shown on figures 18 and 19 and then the ultimate shear strength and the stress at each data point were calculated using equation 6 and 7 respectively. Having calculated the ultimate stress of each sample, the average of the four for each material type were calculated and reported in table 3.

15
where τus ultimate shear strength, MPa
shear strength at each data point , MPa maximum shear load to failure, N shear load at each data point, N sample shear area
Figure 18: Load vs. Displacement data for glass/epoxy Semi impregnated micro-sandwich structures longitudinal and transverse directions
Figure 19: Load vs. Displacement data for carbon/epoxy Semi impregnated micro-sandwich structures longitudinal and transverse directions
To measure Young’s modulus, the lab view routine developed for tensile test was used to acquire simultaneously the strain in both +45° and −45° directions and the load. As previously mentioned, a NI WLS-9163 data acquisition board was used to acquire strain data and the load and crosshead displacement data were acquired by a NI DAQCard-6062E card. Having indicated normal strains at +45° and −45° , the strain value for the sample at each required data point was calculated using equation 8.
where:

16
= shear strain at i-th data point,
5 = + 45° normal strain at i-th data point, 5 = −45° normal strain at i-th data point,
Figure 20: Stress vs. strain data of sample 1 G-SIMS and shear modules calculation
Having the stress and strain at each data point using equations 7 and 8, the stress were plotted against the respective strain data. The initial linear part of the data curve was used to calculate the shear elastic modulus. Such data analysis was done for each sample separately as shown figure 20, and then the four sample results were averaged to get the material property and tabulated in table 3.
C-SIMS G-SIMS
Longitudinal Transverse Longitudinal Transverse
Shear strength (MPa) 63.78 61.44 66.85 65.9
Shear elastic Modulus (GPa) 6,09 5.9 5.4 4.85
Table 3: Shear test results 3.4 Drop dart tests Experimental impact dynamic tests were performed according to ASTM 5628 standard using an instrumented free-fall drop dart testing machine .The impactor has a hemispherical head with a radius of 10 mm and has a maximum falling height of 2 m (see Figure 21). The drop-weight apparatus is equipped with a motorized lifting track. The collected data were stored after each impact and the impactor was returned to its original starting height. Using this technique, the chosen

17
impact velocity was consistently obtained in successive impacts. By means of a piezoelectric load cell, force–time curves were acquired and, with a double integration, force–displacement curves were obtained.
Figure 21 : Drop dart testing machine and specimen configuration
Before conducting the dynamic tests, quasi static perforation tests were conducted on a 100 kN capacity servo-hydraulic testing machine INSTRON-8801, with the specimen fixture shown in Figure 23.
Figure 22: Sample dimension for quasi-static perforation and dynamic impact tests

18
In quasi-static tests, samples were subjected to monotonic compressive loading with a stroke rate of 1.3 mm/min , to determine the penetration strength and the amount of energy needed to perforate the material specimen. Square specimen panels, with 100 mm side length, as shown in figure 22, were clamped with a plate characterized by a 76.2 mm inner diameter hole, and fixed to a rigid base to prevent slippage of the specimen during the test. The clamping system was designed to provide an adequate uniform pressure all over the clamping area.
Figure 23: Test set-up and attachment used for penetration test 3.4.1 Result of perforation tests With the set-up described in the previous paragraph, three samples of each material type were tested and the load and crosshead displacement data from the testing machine were acquired as shown figures 24 and 25.

19
Figure 24: Load vs. Displacement data for carbon/epoxy Semi impregnated micro-sandwich structures
Figure 25: Load vs. Displacement data for glass/epoxy Semi impregnated micro-sandwich structures Having the load and displacement data, the penetration strength, i.e. the maximum force before the relevant failure of the material occurs, the failure displacement, i.e. the corresponding displacement, and the energy absorbed by the material for complete perforation were determined. Average values are reported in table 4
Material Max Penetration Force [N] Failure Displacement [mm] Absorbed Energy [J]
C_SIMS 8000 5 132,17

20
G_SIMS 3200 3 68,3
Table 4: perforation test results
3.4.2 Preliminary results of dynamic tests Having the energy required for perforation of the targeted material, the response of the material for dynamic loading was studied by taking four energy level, i.e. 50%, 65%, 80% and 100% of quasi-static indentation energy. Force–time curve (data) and the actual initial impact velocity were acquired directly from the test machine through Lab VIEW Signal express environment developed for this particular test scenario. The other important dynamic variables were calculated using the scheme of Figure 26 and the equations 9-13. Curves presented in figures 27-30 show the (preliminary) results obtained up to now for some sequence of repeated impact tests. The curves describe force vs. time, force vs. displacement, energy vs. displacement and energy vs. time trends for the test conducted at equal energy level i.e. 34.13 J for both G-SIMS a and C-SIMS..
Figure 26: Drop dart test motion description
9
10
11

21
12
Besides the damage degree (DD) and damage index (DI) i.e. the damage variable that are used to monitor how the damaging takes place in the material through the number of impacts were calculated using the equation 14&15 respectively [3].
where
damage degree
damage index Absorbed energy Impact energy
Maximum dart displacement
Maximum dart displacement measured in quasi static perforation test
Figure 27: Load vs. time data for G-SIMS a, and C-SIMS ,b at 34.13 J impact energy
22
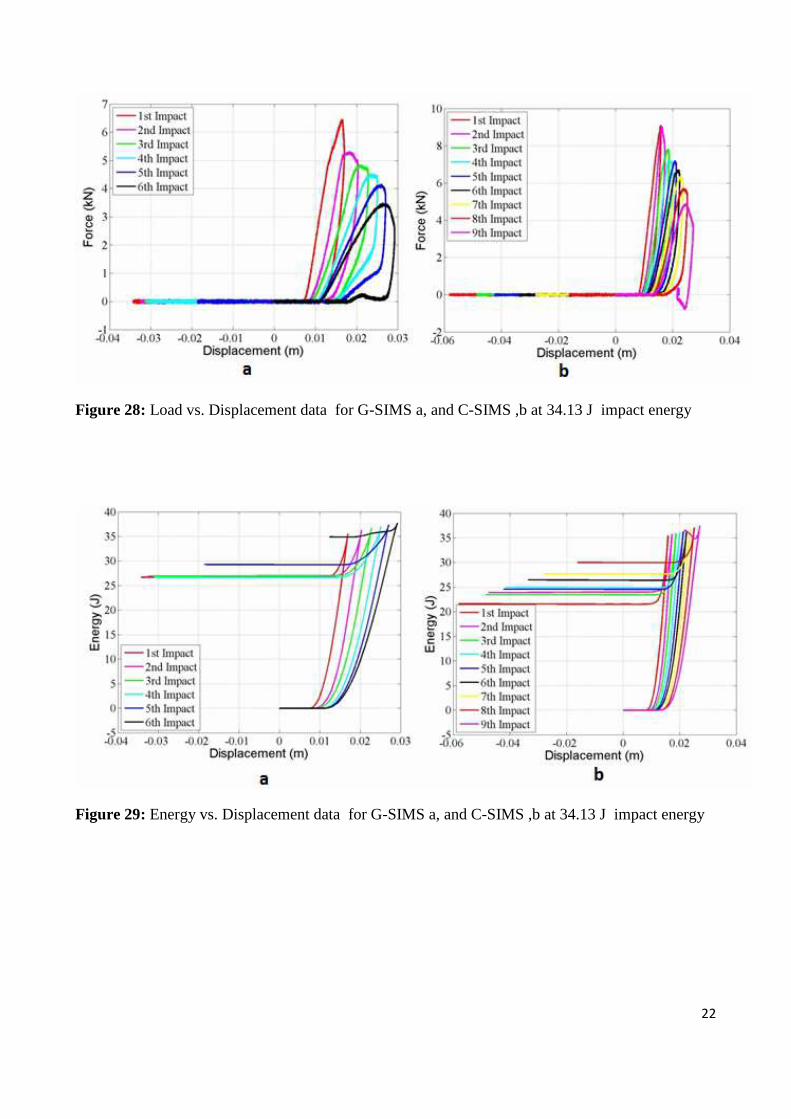
Figure 28: Load vs. Displacement data for G-SIMS a, and C-SIMS ,b at 34.13 J impact energy
Figure 29: Energy vs. Displacement data for G-SIMS a, and C-SIMS ,b at 34.13 J impact energy

23
Figure 30: Energy vs. time data for G-SIMS a, and C-SIMS ,b at 34.13 J impact energy
Figure 31: Damage index vs. number of impact data for G-SIMS a, and C-SIMS ,b at 34.13 J impact energy

24
Figure 32: Failure progress through number of impact for G-SIMS at 34.13 J impact energy

25
Figure 33: Failure progress through number of impact for G-SIMS at 34.13 J impact energy
Figure 34: Damage index and Damage degree vs. impact energy for G-SIMS a, and C-SIMS ,b at 34.13J impact energy For the selected energy, i.e. 34.13 J, which is a 50% of G-SIMS perforation energy, a sign of penetration appears at the 4th impact for G-SIMS and 8th impact for C-SIMS. This phenomenon can be observed from the damaged samples figures 32 and 33 and from the number of impact vs. damage index curves. Observing the number of impact vs. damage index curve as shown in figure 31, the abrupt growth to perforation from 4th impact for G-SIMS sample and 8th impact of C-SIMS sample is a clear indication of a serious damage in the sample material.
4. References

26
1. Patent US2002/0064640A1 Thin composite laminate and use thereof in making sports articles, especially boots
2. P. Nieri, I. Montanari, A. Terenzi, L. Torre, and J. M. Kenny – “A novel composite configuration for low-cost panels with improved toughness”, Europe 29th International Conference and Forum, March 31st - April 2nd
3. G. Belingardi, M.P. Cavatorta, D.S. Paolino, 2008, “A new damage index to monitor the range of the penetration process in thick laminates”. Composites Science and Technology, 68 (13), 2583-2826.