Progress Report for Second Year of Contract …/67531/metadc619799/m2/1/high...Progress Report for...
28
Page 1 Progress Report for Second Year of Contract Number DE-FG02-85ER13347 tO The U.S. Department of Energy Attention: Dr. Clement R. Yonker Process and TechniquesBranch Divisionof Chemical Sciences Office of Basic Energy Science ER-142, MSG-236 U.S. Departmentof Energy Washington,D.C. 20585 Hadamard Transform Spectrometry: A New Analytical Technique from Kansas State University Department of Chemistry- Willard _all Manhattan, KS 66506-3701 Principal Investigator: William G. Fateley University Distinguished Professor; 913-532-6298 Co-Principal Investigator: Robert M. Hammaker Professor; 913-532-6671 Date of Submission November 15, 1992 DISCLAIMER This report was prepared as an account of work sponsored by anagency of the United States Government. Neither the United States G,wernment nor any agency thereof, nor any of their employees, makes any warranty, express or implied, orassumes any legalliability or responsi- bility for the accuracy, completeness, or usefulness of any informati°n, apparatus, Pr°duct' °rowned rights. Refer- ,_ _ _ _ _'__i ? process disclosed, or represents that its use would not infringe privately "_ _ _ it._ encc herein to any specific commercial product, process, or service by trade name, trademark, _ ':i/. " I . manufacturer, or otherwise does not necessarily constitute or imply its endorsement, recom- mendation, or favoring by the United States Government or any agency thereof. The views and opinions of authors expressed herein do not necessarily state or reflect those of the 1 United States Government or any agency thereof. D_UTH1N OF TH(,_ DOCUSEHT IS UFJLIMIT_
Transcript of Progress Report for Second Year of Contract …/67531/metadc619799/m2/1/high...Progress Report for...

Page 1
Progress Report for Second Year of
Contract Number DE-FG02-85ER13347
tO
The U.S. Department of Energy
Attention: Dr. Clement R. YonkerProcess andTechniquesBranchDivisionof ChemicalSciencesOffice of Basic EnergyScience
ER-142, MSG-236U.S. Departmentof EnergyWashington,D.C. 20585
Hadamard Transform Spectrometry:A New Analytical Technique
from Kansas State UniversityDepartment of Chemistry- Willard _all
Manhattan, KS 66506-3701
Principal Investigator: William G. FateleyUniversity Distinguished Professor; 913-532-6298
Co-Principal Investigator: Robert M. HammakerProfessor; 913-532-6671
Date of Submission November 15, 1992
DISCLAIMER
This report was prepared as an account of work sponsored by an agency of the United StatesGovernment. Neither the United States G,wernment nor any agency thereof, nor any of their
employees, makes any warranty, express or implied, or assumes any legal liability or responsi-
bility for the accuracy, completeness, or usefulness of any informati°n, apparatus, Pr°duct'°rownedrights. Refer- ,_ _ _ __'__i?
process disclosed, or represents that its use would not infringe privately "_ _ _ it._encc herein to any specific commercial product, process, or service by trade name, trademark, _ ':i/. " I .
manufacturer, or otherwise does not necessarily constitute or imply its endorsement, recom-mendation, or favoring by the United States Government or any agency thereof. The views
and opinions of authors expressed herein do not necessarily state or reflect those of the 1United States Government or any agency thereof.
D_UTH1N OFTH(,_DOCUSEHTIS UFJLIMIT_

Page 2
A Progress ReportMarch 15, 1992 to November 15, 1992
This progressreportcontainsthe followingsections:
1. HadamardTransformPhotoacousticSpectrometryandDepthProfiling.Mr.StevenL. Wright, GraduateStudent in the ChemistryDepartment. ProfessorJosephV.Paukstelis,Chemistry Department.
2. Hadamard Transform Imagingwith a 2D Hadamard EncodingMask. Ms. KarenJ. Latas, Mr. Edward A. Orr, Mr. Steven L. Wright, Graduate Students in theChemistry Department. Mr. A. NormanMortensen,GraduateStudentin Electricaland Computer Engineering• Professor Joseph V. Paukstelis, ChemistryDepartment. ProfessorStephenA. Dye=,Electricaland ComputerEngineering.
3. H_damard Transform Raman Spectrometry. Mr. Edward A. Orr, Mr. John M.Poholarz, Mr. Steven L. Wright, graduateStudentsinthe Chemistry Department.Mr. J. Lance Porter, Mr. Mark Spinar, Graduate Students in Electrical andComputer Engineering,ProfessorJoseph V. Paukstelis,Chemistry Department.Professor Stephen A. Dyer, Electrical and Computer Engineering.
4. Work on the Growth of VO2(s) Crystals for Hadamard Masking Material. Mr.Edward A. Orr, Graduate St6dent in the Chemistry Department.
5. Publication arising from this project.
6. Talks presented on this work.

_t
Page 3
1. Hadamard Transform Photoacoustic Spectrometry and Depth Profiling. Mr. Steven
L. Wright, Graduate Student in the Chemistry Department. Professor Joseph V.
Paukstelis, Chemistry Department.
The assembly of a Hadamard transform photoacoustic (HT-PAS) spectrometer
using a Jarrell-Ash double monochromator and a MTEC photoacoustic cell was described
in last year's progress report and preliminary results with a 50 nanometer spectral window
were presented. We have now chosen to develop a simple high throughput low
resolution visible HT-PAS spectrometer to demonstrate the feasibility of depth profiling
with a HT-PAS spectrometer using either variation of the modulation frequency or phase
sensitive detection at the appropriate modulation frequency. A schematic diagram of the
HT-PAS spectrometer appears in Figure 1. The components are all commercially
available and the special features are our second generation Hadamard encoding mask
based on a polymer dispersed liquid crystal (PDLC) material and the use of a linear
variable filter mounted on the Hadamard encoding mask to serve as the spectral
separator. By means of constructive and destructive interference, only one spectral
resolution element (of 127) is allowed to pass for a given position along the length of the
linear variable filter. To illustrate the depth profiling ability of the HT-PAS spectrometer
a layered sample was prepared consisting of a thermally thin (20 _m) surface layer of
neodymium oxide dispersed in a polystyrene matrix on a thermally thick (2.5 mm) interior
layer of holmium oxide dispersed in a polystyrene matrix.
The spectra of pure neodymium oxide and pure holmium oxide obtained with our
HT-PAS spectrometer appear in Figure 2 for comparative purposes. Figure 3 shows

'w'
Page4
SCHEMATIC DIAGRAMof
HT-PAS SPECTROMETER
HOT MIRROR HT-ENCODING PA8
MASK L3 L4 CELL
-7 E
-- ,1 / L2 _, ,,,,,sou.cEL,NEARF,LTE.MEO.AN,OALOUTPUT TO
CHOPPER LOCK-INAMPLIFIER
Figure 1. Schematicdiagram of the HT-PASspectrometer.

w
Page 5
neodymium oxide
400 700nanome [ers
Figure 2. Visible Hadamard transform photoacoustic spectra of neodymium oxide andholmium oxide

Page 6
. . . . . . . . . . . . .
"''''.'''''''''
_ _ ° / \ j
208 14z u = 9urn_ .,,. , ,.,,
. . . . . . . . . . . . . .
° . . . ° . . • . . . . . .
/26 Hz u = 26 um
• . . . ° . ° _m D m R
[. . . . . . . . . . . . . .
. . . . . . . . . . . . .
. . . . . . . . . . . . . .
. . , . . . . . . • . . .
>"_ :..... "'-'" ;'" ".... ' '- t
13 Hz u = 37 um _ .....
400 nanometers 700
Figure 3. An illustration of depth profiling by variation of the modulation frequencyusing the layered sample: (a) modulation frequency, f, 208 Hz; thermaldiffusion length, IJ, 9 pm; (b) f, 26 Hz, p, 26 I_m; (c) f, 13 Hz; IJ.,37 IJ.m.

Page 7
three different spectra of the layered sample acquired with three different modulation
frequencies corresponding to three different extents of depth penetration (thermal
diffusion length, _). The top spectrum in Figure 3 contains only the spectral features of
neodymium oxide from the surface layer. The middle spectrum in Figure 3 shows the
spectral features of holmium oxide from the interior layer beginning to appear in addition
to the spectral features of neodymium oxide from the surface layer. The bottom spectrum
in Figure 3 contains the spectral features of both layers with comparable intensity
consistent with a penetration into the interior layer comparable to the thickness of the
surface layer.
The advantages of phase sensitive detection when depth profii!ng layered samples
is illustrated in Figure 4 where the sine waves to the left of the spectra represent average
signals from the two layer and illustrate the phase differences in signals for different
depths of penetration. The observed photoacoustic signal is a combination of all signals
generated within one thermal diffusion length (_). When phase information is not required
an amplitude spectrum is obtained by adjusting the reference phase angle of the lock-in
amplifier so as to maximize the amplitude of the photoacoustic signal. This amplitude
maximum generally occurs at a point where signals from all depths within one thermal
diffusion length make some contribution to the total photoacoustic signal. To selectively
view a given layer within one thermal diffusion length the appropriate reference phase
angle must be selected so as to maximize the signal of the layer we wish to observe and
to minimize or reject unwanted signals. The top spectrum in Figure 4 (which is also the
bottom spectrum in Figure 3) and the three spectra in Figure 3 were all obtained by

Page 8
phase analysis
/_ f"x ,,_/_k,/ xj
,'\ /\ /\_- X_/ Xj'
J'xrelative phase _oo 7oonanorneters
layered sample
Figure 4. An illustration of selective depth profiling using phase sensitive detection ata modulation frequency, f, of 13 Hz and corresponding thermal diffusionlength of 37 I_m: (a) both layers contribute to the total photoacoustic signal;(b) maximization of the contribution from the surface layer; (c) maximizationof the contribution from the interior layer.

Page 9
adjusting the reference phase angle of the lock-in amplifier so as to maximize the
amplitude of the photoacoustic signal. The vertical lines on the sine waves to the left of
the spectra in Figure 4 illustrate the selection of the reference phase angle of the lock-in
amplifier to maximize the amplitude of the photoacoustic signal (top spectrum) or to
maximize the signal from the surface layer (middle spectrum) or to maximize the signal
from the interior layer (bottom spectrum). Actually the only way to completely reject a
signal is if it is exactly in quadrature with the signal of interest. Since layers will have
finite thickness so there is a phase gradient throughout their depth, there are some
components we want to reject which are not in quadrature with the selected reference
phase angle. Thus, a perfect separation of signals from a layer from all other signals may
not result but good separations are possible. In our sample comparisons of the pure
neodymium oxide spectrum in Figure 2 with the surface layer spectrum of neodymium
oxide in the middle spectruln in Figure 4 and of the pure holmium oxide spectrum in
Figure 2 with the interior layer spectrum of holmium oxide in the bottom spectrum in
Figure 4 show that this technique has given very encouraging results.
The feasibility of Hadamard transform photoacoustic spectrometry has been
demonstrated. The expected signal-to-noise improvement using Hadamard transform
optics over conventional dispersive optics was illustrated in last year's progress report
(Figures 1 and 2 in that report) and was also obtained using the HT-PAS spectrometer
in Figure 1. Because all spectral elements are modulated at the same frequency (in
contrast to Fourier transform (FT) spectrometers which do not use the step scan design),

_w
Page 10
selective depth profiling using either variation of the modulation frequency or phase
sensitive detection at the appropriate modulation frequency is possible.
2. Hadamard Transform Imaging with a 2D Hadamard Encoding Mask. Ms. Karen
J. Latas, Mr. Edward A. Orr, Mr. Steven L. Wright, Graduate Students in the
Chemistry Department. Mr. A. Norman Mortensen, Graduate Student in Electrical
and Computer Engineering. Professor Joseph V. Paukstelis, Chemistry
Department. Professor Stephen A. Dyer, Electrical and Computer Engineering.
Our plans to utilize a two-dimensional (2D) Hadamard encoding mask for imaging
studies were presented in last year's progress report. The 2D Hadamard encoding mask
contains 100 pixels as a 10 x 10 array in a square of area 1 cm2 and operates in a
similar manner to our first generation Hadamard encoding mask for spectral resolution
by surrounding a cholesteric liquid crystal with a set of two polarizers. The development
of the controlling software to operate the 2D Hadamard encoding mask has been
completed. Our plans to investigate the mapping of aluminum impurities in gallium-
arsenide wafers by monitoring the laser induced fluorescence (LIF) upon irradiation with
the 488.0 nm line of an Ar+ laser (see last year's progress report) have been superseded
by plans to develop 2D Raman imaging of compounds on thin-layer chromatography
(TLC) plates using surface enhanced Raman scattering (SERS) generated with colloidal
silver. We have now progressed to the point of observing the SERS Raman image of a
spot on a TLC plate consisting of 3 nanograms of pararosaniline hydrochloride.
Page 11
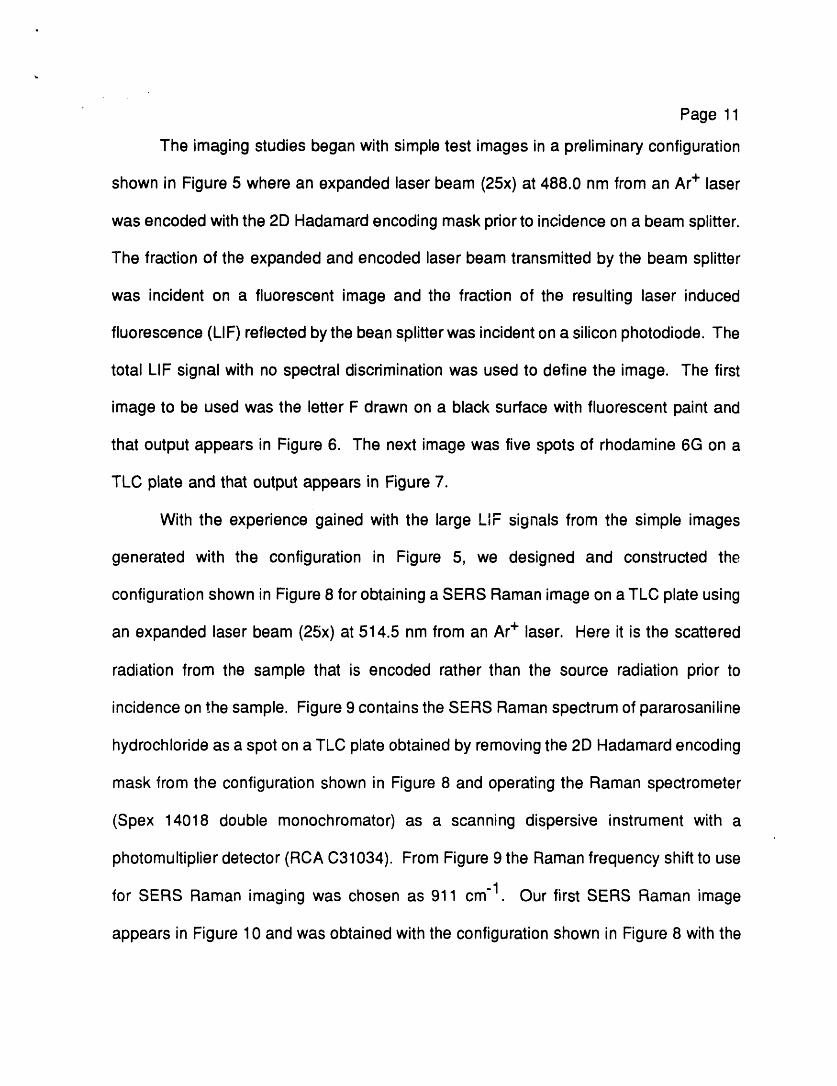
The imaging studies began with simple test images in a preliminary configuration
shown in Figure 5 where an expanded laser beam (25x) at 488.0 nm from an Ar+ laser
was encoded with the 2D Hadamard encoding mask prior to incidence on a beam splitter.
The fraction of the expanded and encoded laser beam transmitted by the beam splitter
was incident on a fluorescent image and the fraction of the resulting laser induced
fluorescence (LIF) reflected by the bean splitter was incident on a silicon photodiode. The
total LIF signal with no spectral discrimination was used to define the image. The first
image to be used was the letter F drawn on a black surface with fluorescent paint and
that output appears in Figure 6. The next image was five spots of rhodamine 6G on a
TLC plate and that output appears in Figure 7.
With the experience gained with the large LIF signals from the simple images
generated with the configuration in Figure 5, we designed and constructed the
configuration shown in Figure 8 for obtaining a SERS Raman image on a TLC plate using
an expanded laser beam (25x) at 514.5 nm from an Ar+ laser. Here it is the scattered
radiation from the sample that is encoded rather than the source radiation prior to
incidence on the sample. Figure 9 contains the SERS Raman spectrum of pararosaniline
hydrochloride as a spot on a TLC plate obtained by removing the 2D Hadamard encoding
mask from the configuration shown in Figure 8 and operating the Raman spectrometer
(Spex 14018 double monochromator) as a scanning dispersive instrument with a
photomultiplier detector (RCA C31034). From Figure 9 the Raman frequency shift to use
for SERS Raman imaging was chosen as 911 cm"1. Our first SERS Raman image
appears in Figure 10 and was obtained with the configuration shown in Figure 8 with the

4
"11ml
(C2e-
tn
"' _- SAMPLE
fno:D"t'D
° [-1_ BEAM SPLITTERID
ID3
O TELESCOPE CAMERA
SILICON EYEPIECE LENS
_ PHOTODIODE "_ LENSO
O
O
n.
TWO DIMENSIONAL
--, HADAMARD(D
=_3. ENCODING MASK I l EXPANDED,_ LASER BEAMOO
C
_- SCHEMATIC DIAGRAM OF 2D OPTICS• _

"lu!ed lueoseJonl; ql!M eoejJns_toolqe uo UMEJp_-IJellel eql _o e6ew! eq.L "9eJn61.-I
eL el3ed

Page 14
r.f3
Figure 7. The image of full spots of rhodamine 6G on a TLC plate.

"11mll
: SPEXQ
._ MONOCHROMATOR _ 14-018
EXPANDED§-mo ARGON ION
¢_ LASER BEAM_30 _=--" I- i0
-I_ FOLDINGr- m MIRROR ! -"(-)_n I• " o HADAMARD CAMERA• _ ENCODING LENS
::3"
MASK I
- l0
o
o LIQUID13"
LIGHTPIPE_. TLC PLATE LENS--Ill::l
SCHEMATIC DIAGRA[d OF IMAGING OPTICSO0
mI_ 1133 _

"1'1m
t_
"_SURFACED-ENHANCED RAMAN SPECTRUMm --4
_ -OFPARAROSANILINE SPOT ON TLC PlaTEO_
"_ _ 41gm
=3 m 11cm-1
t_
"_ _ ,,
_° _ __ ," "_i g,//'_%'-'/_ Z _ i, •
,o=-=-=. Zr"I'U _ l_tL, , _ ',,,<t") .--- ,1 .
o:I"0...__,1 .................. ,, ,= ,i =1 iJ, i ..I ,l: i_f, ,_1i] i Zll FI Ill II |1
co 35450 800 1200 1725£t)
"O,,, RAMAN SH 1FT ore-1 ¢3
"CIi _1[i i ..... iii ................
o 0)

Page 17
INTENSITYFigure 10. The SERS Raman image of oararosanilin_ hydrochloride on a TLC plate
using a Raman frequency shift of 911 cm".

Page 18
Spex 14018 double monochromator set at a Raman frequency shift of 911 cm"1. We will
continue development of SERS Raman imaging of TLC plates with a long term goal of
_gnerating a convenient and compact imaging unit for general use with Raman
spectrometers. Our next project will be to test an alternate configuration to that in Figure
8 by using an off-axis parabolic mirror with encoding of the source radiation prior to
incidence on the sample. Once we establish whether source radiation encoding prior to
incidence on the sample or encoding of the scattered radiation from the sample is the
better overall arrangement, we will begin to develop the next generation of configurations
for SERS Raman imaging.
3. Hadamard Transform Raman Spectrometry. Mr. Edward A. Orr, Mr. John M.
Poholarz, Mr. Steven L. Wright, Graduate Students in the Chemistry Department.
Mr. J. Lance Porter, Mr. Mark Spinar, Graduate Students in Electrical and
Computer Engineering, Professor Joseph V. Paukstelis, Chemistry Department.
Professor Stephen A. Dyer, Electrical and Computer Engineering.
Plans for the continued development of our Hadamard transform Raman
spectrometer were presented in last year's progress report. These plans included the
introduction of a modified second generation stationary Hadamard encoding mask based
on a polymer dispersed liquid crystal (PDLC) material with on board heaters to allow for
faster switching times and the development of new and faster detection system
electronics based on the Motorola DSP 56001 digital signal processor. Also included in
last year's progress report were plans to develop a new Hadamard transform
spectrometer for the near infrared (NIR) spectral region. The development of this new

Page 19
Hadamard transform spectrometer has been discontinued in this project as others are
now doing related work with funding independent of this contract Substantial progress
has been made in the development of the new detection system electronics based on the
Motorola DSP 56001 digital signal processor and completion of the project appears near.
Problems with commercial components appear to have been solved and the software
appears to be complete or nearly complete. The Hadamard encoding masks with on
board heaters have been obtained and tested and should decrease our data acquisition
time by a factor of 4.
The time required for the PDLC stationary Hadamard encoding mask to switch
from the "ON" state to the "OFF" state is not as short as we would like. If the mask is
forced to run faster than this specification, artifacts appear in the spectra. Figure 11
presents oscilloscope traces for the detector response when the mask is switched from
the "ON" state to the "OFF" state at 24°C and 40°C. The improvement at 40°C is
apparent as the curve falls much more sharply and the change in signal is also somewhat
larger (i.e. better contrast leading to better signal-to-noise ratio other things being equal).
Figure 12 shows the emission spectra of a mercury pen lamp for mask operation with a
50 millisecond (ms) delay between encodements at temperatures of 24°C, 30°C, 35"C,
and 40°C. We use the mercury pen lamp spectra rather than Raman spectra because
the sharper lines make the artifact easier to recognize. Figure 13 contains the emission
spectra of a mercury pen lamp at 40"C for delay times between mask encodements of
20 ms, 30 ms, 40 ms, 50 ms, 75 ms, and 80 ms. Based on these results we have
' , 'I,'_1111_ It ,r , ,1111T

Page 20
, ,'rl_: 0 , iV : 20m._!
ON ..:: [, ., i |
Ii
III
II!
-- |.......... |
!
I
, OFF --'.. _ -,--.-._ -,-4--_
.....
r, _ ,,
lvIASK SWITCHING TlhlE @ 24°C
ON
,_! _TFI_.: 0, IV : P.Omm
.. #I
¢!!
...... _ , ,,, |
/
•-t--4"-4--t---'t--4-4-4"- .... _ .... 7 ,=, , , " .... ,=, , , , " .... - , , , • ' " ' 'OI
"° I.. /,
• - tt, _o .....
.. I.......
-- OFF ,.... , ,
.......... j .....
MASK SWITCHING TIME @ 40°C
Figure 11. Oscilloscope traces for the detector response when the mask is switchedfrom the"ON" state to the"OFF" state at 24"C and 40"C.

'0.01_pue'0._iI_'0.0_'0.171_IoseJnl_JedwelI_sluewepooueueeMleq,(_lePsw OgE ql!M uo!l13Jedo_ISI_LUJO)dwel ued _nojeLUe t0 wnJloeds uo!ss!uJegLIJ" "2:Lejnl3!.-I
INTENSITY

•sw 08pue 'sw £z 'sw 0£ 'sw 017'sw 08 'sw O_1os;uewepooue _tsew ueeMleqsew!_ /[eleP Jol 0.017 le dwelued fdnoJew e 1o wruloeds uo!ss!we eq.l. "Sle_nlSl=l

Page 23
adopted 40"C and 80 ms as our new standard operating conditions for our PDLC
stationary Hadamard encoding masks with on board heaters. The published spectra ("A
New Stationary Hadamard Encoding Maskfor Near-Infrared Hadamard Transform Raman
Spectrometry," A. P Bohlke, J. M. Jarvis, J. S. White, J. D. Tate, J. V. Paukstelis, R. M.
Hammaker, and W. G. Fateley, J. Molec. Struct., 247_,392-303 (1991)) presented at the
1990 Workshop on Advanced Laser Technology for Chemical measurements were
obtained in 3.2 minutes but with the new standard operating conditions we estimate those
spectra could be obtained in 45 seconds.
Another area of past effort has been in signal processing and additional efforts
here are desirable. There are two problems in the signal processing area: (1) signal
recovery made desirable by imperfections in the mask material (i.e. the "ON" state is not
perfectly transparent and the "OFF" state is not perfectly opaque) and (2) elimination or
reduction of artifacts generated by switching the mask encodements too fast (i.e. using
a shorter delay time than the 80 ms adopted for the masks with on board heaters). Our
collaborators in Electrical and Computer Engineering (Professor Stephen A. Dyer and his
faculty colleagues and their students) have treated the first problem and a summary of
these efforts is now in print. ("Hadamard Methods in Signal Recovery", S. A. Dyer, R.
M. Hammaker, and W. G. Fateley, Computer-Enhanced Analytical Spectroscopy, Vo!. 3,
edited by P. C. Jurs, Plenum, New York, pp. 31-67 (1992).) However, all their
demonstrations used simulations and the experimental characterization of each mask
element (i.e. transmittance in the "ON" state and in the "OFF" state) has not been done
and used as a final test of their procedures. Our group has developed a procedure to

Paqe 24
approach the second problem and our colleagues in Electrical and Computer Engineering
have improved on our procedure. However, the improved procedure has been tested by
simulation but not yet incorporated into our operating system and tested on experimental
data. Thus, additional effort is required to complete and bring together all the new
developments for our Hadamard transform Raman (HT-Raman) spectrometer and
demonstrate the improved capabilities that should be achievable.
4. Work on the Growth of VO2(s) Crystals for Hadamard Masking Material. Mr.
Edward A. Orr, Graduate Student in the Chemistry Department.
The synthesis of vanadium (IV)-tetra-isopropoxide for use in dip coating of a
substrate was described in last year's progress report as were our efforts to prepare and
clean the substrate. We have been unsuccessful in obtaining satisfactory coatings of
vanadium dioxide (VO2) by this method and have suspended our efforts. With funding
independent of this contract, we now have an outside investigator pursuing a sputtering
technique to prepare VO2 films on appropriate substrates. The desirable properties of
VO2 film as a Hadamard masking material (described in our original proposal and last
year's progress report) motivate us to continue the efforts to develop a Hadamard
encoding mask using VO2 as the switching material.
5. Publications arising from this project.
The following publications have appeared or are scheduled to appear during 1992.
"Hadamard Methods in Signal Recovery," S. A. Dyer, R. M. Hammaker, and W. G.Fateley, Co.mPuter-Enhanced Analytical Spectroscopy, Vol. 3, Edited by P. C. Jurs,Plenum, New York, pp. 31-67 (1992).
"Near-Infrared Hadmard Transform Raman Spectrometry- A Progress Report," S. L.Wright, J. L. Porter, J. D. Tate, E. A. Orr, J. V. Paukstelis, R.. Hammaker, and W. G.

Page 25
Fateley, Thirteenth International Conference on Raman Spectroscopy, proceedings of theThirteenth International Conference on Raman Spectroscopy, W_rzburg, Germany,August 31-September 4, 1992, Edited by W. Kiefer, M. Cardona, G. Schaack, F. W.Schneider, and H. W. SchrStter, John Wiley and Sons, New York, pp. 1092-1093 (1992).
"Hadamard Transform Raman Spectrometry, Past, Present, and Future," W. G. Fateley,R. M. Hammaker, J. V. Paukstelis, A. P. Bohlke, A. N. Mortensen, J. L. Porter, E. A. Orr,J. D. Tate, and S. L. Wright, Thirteenth International Conference on RamanSDectroscol:)y, proceedings of the Thirteenth International Conference on RamanSpectroscopy, W(jrzburg, Germany, August 31-September 4, 1992, Edited by W. Kiefer,M. Cardona, G. Schaack, F. W. Schneider, and H. W. SchrStter, John Wiley and Sons,New York, pp. 1114-1115 (1992).
"A Stationary Hadamard Transform Interferometer," J. D. Tate, B. Curnutte, Jr., J. V.Paukstelis, R. M. Hammaker, and W. G. Fateley, Chapter in Advances in Near IRMeasurements, Vol.1, Edited by G. Patonay, JAI Press, Inc., Greenwich, CT, pp 000-000(1992).
6. Talks presented on this work.
The following presentations were made or are scheduled to be made during 1992
January
Society for Applied Spectroscopy Lecture TourSouthern California Stati_n
University of Utah (Intermountain Section)
March
43rd Pittsburgh Conference on Analytical Chemistryand Applied Spectroscopy - one contributed paper
May
40th Annual Fisk Infrared Institute
September
13th International Conference of RamanSpectroscopy - one invited paper and one poster
Lj
f
Page 26
October
American Chemical Society Lecture TourBrigham Young University
Utah State UniversityDOE Workshop: Advanced Laser Technology
for Chemical Measurements
November
University of Arizona31st Eastern Analytical Symposium - one invited paper