Programs for Improving Women’s - 3ieimpact …€¦ · · 2016-06-09Programs for Improving...
35
Economic Self-Help Group Programs for Improving Women’s Empowerment: A Systematic Review October 2015 Copyright © 2014 American Institutes for Research. All rights reserved. Carinne Brody, Thomas De Hoop, Martina Vojtkova, Ruby Warnock, Megan Dunbar, Padmini Murthy, Shari L. Dworkin
Transcript of Programs for Improving Women’s - 3ieimpact …€¦ · · 2016-06-09Programs for Improving...
Economic Self-Help Group
Programs for Improving Women’s
Empowerment: A Systematic
Review
October 2015
Copyright © 2014 American Institutes for Research. All rights reserved.
Carinne Brody, Thomas De Hoop, Martina Vojtkova, Ruby
Warnock, Megan Dunbar, Padmini Murthy, Shari L.
Dworkin
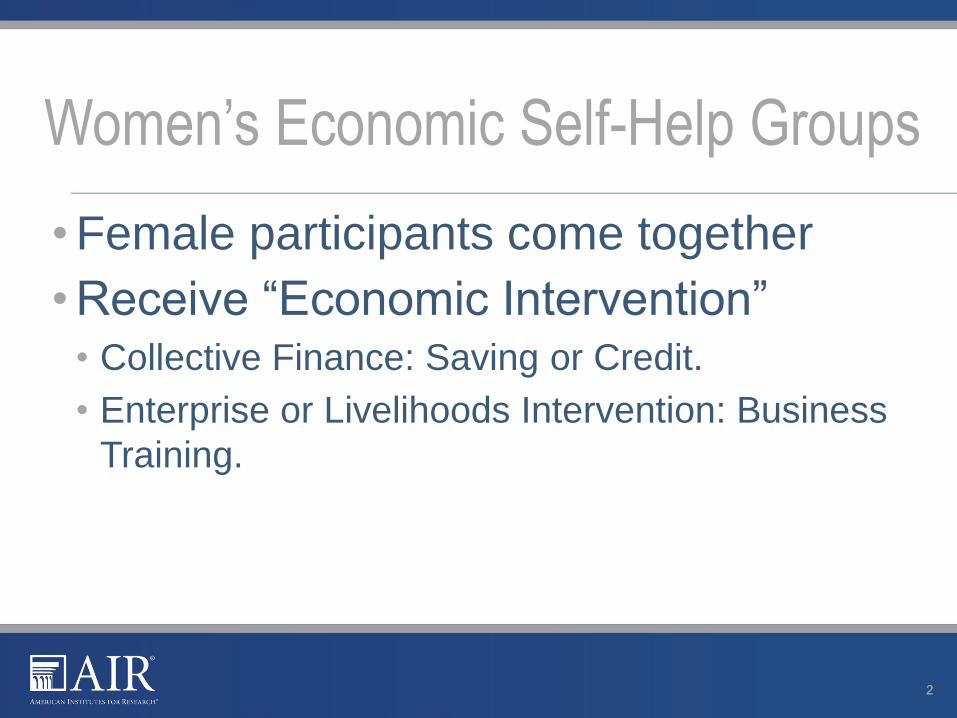
• Female participants come together
• Receive “Economic Intervention”• Collective Finance: Saving or Credit.
• Enterprise or Livelihoods Intervention: Business
Training.
Women’s Economic Self-Help Groups
2
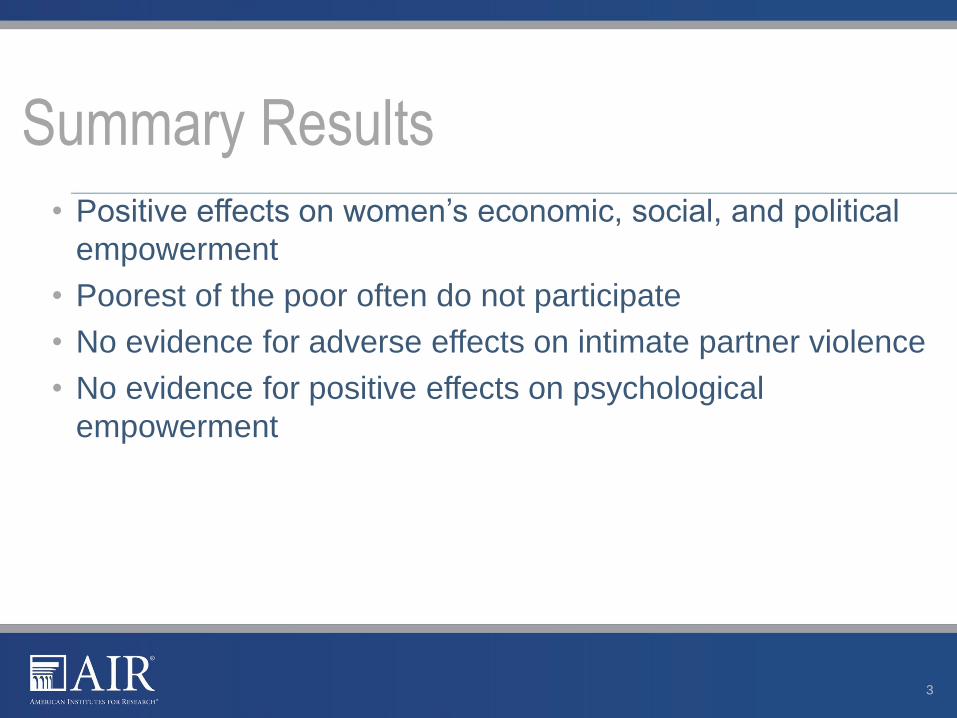
• Positive effects on women’s economic, social, and political
empowerment
• Poorest of the poor often do not participate
• No evidence for adverse effects on intimate partner violence
• No evidence for positive effects on psychological
empowerment
Summary Results
3
• Evaluation Questions
• Theory of Change
• Systematic review: Methodology
• Quantitative Analysis
• Qualitative Analysis
• Synthesis
• Conclusion
Overview Presentation
4

1. What is the impact of women’s economic self-help groups
on individual empowerment in low and middle-income
countries?
2. What are the perspectives of female participants on factors
determining their participation in, and benefits from,
economic self-help groups?
Evaluation Questions
5
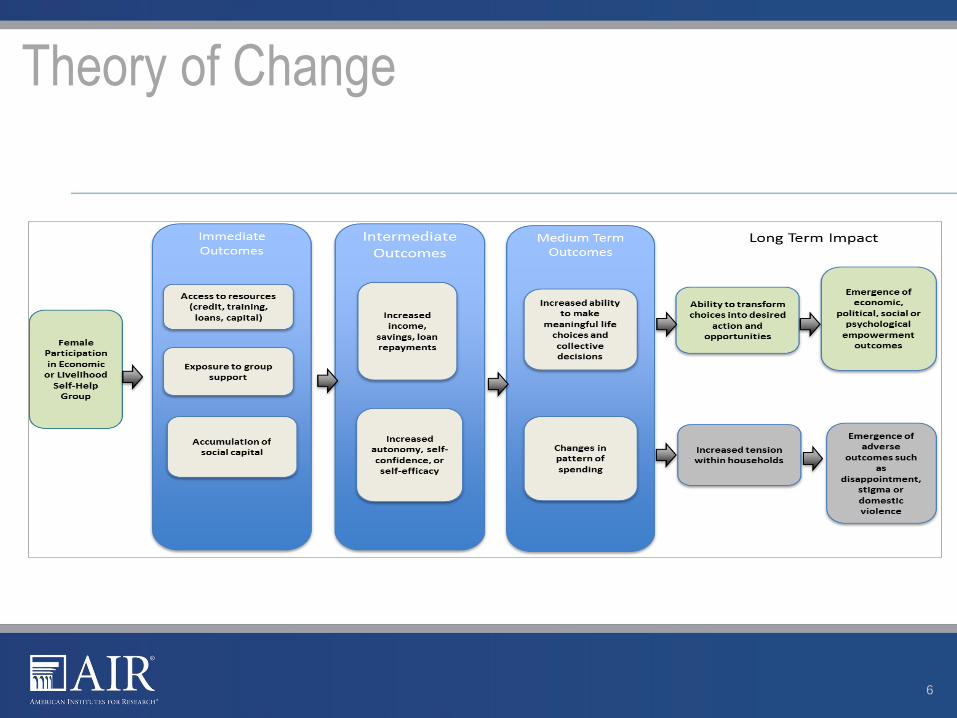
Theory of Change
6
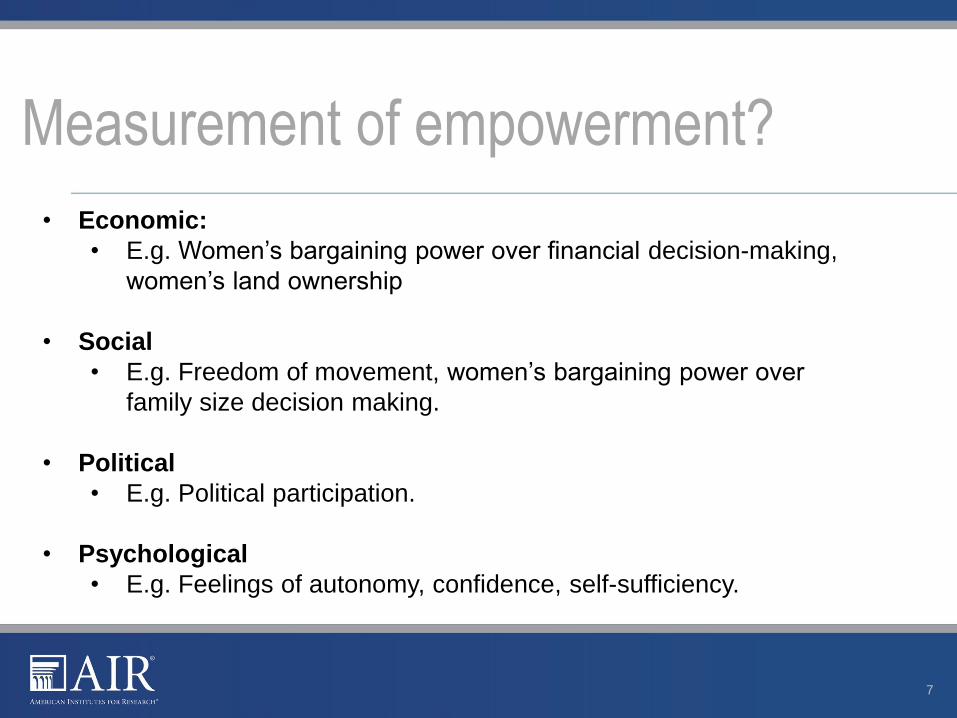
Measurement of empowerment?
7
• Economic:
• E.g. Women’s bargaining power over financial decision-making,
women’s land ownership
• Social
• E.g. Freedom of movement, women’s bargaining power over
family size decision making.
• Political
• E.g. Political participation.
• Psychological
• E.g. Feelings of autonomy, confidence, self-sufficiency.
• Systematic critical appraisal of literature
• Synthesis of literature (Waddington et al.,
2012)
• Impact of self-help groups
• Perspectives of female self-help group members
Systematic Review
8

Inclusion Randomized Controlled Trials, Quasi-
Experimental Evaluations, and Multivariate Regression
9
Innovation: Inclusion Qualitative Studies
10
• In-Depth Interviews
• Ethnography
• Focus-Groups
Systematic reviews that only include quantitative evidence
can be considered too rigid, failing to address other
important questions, such as why an intervention does not
work (Snilstveit, Oliver, & Vojtkova, 2012)
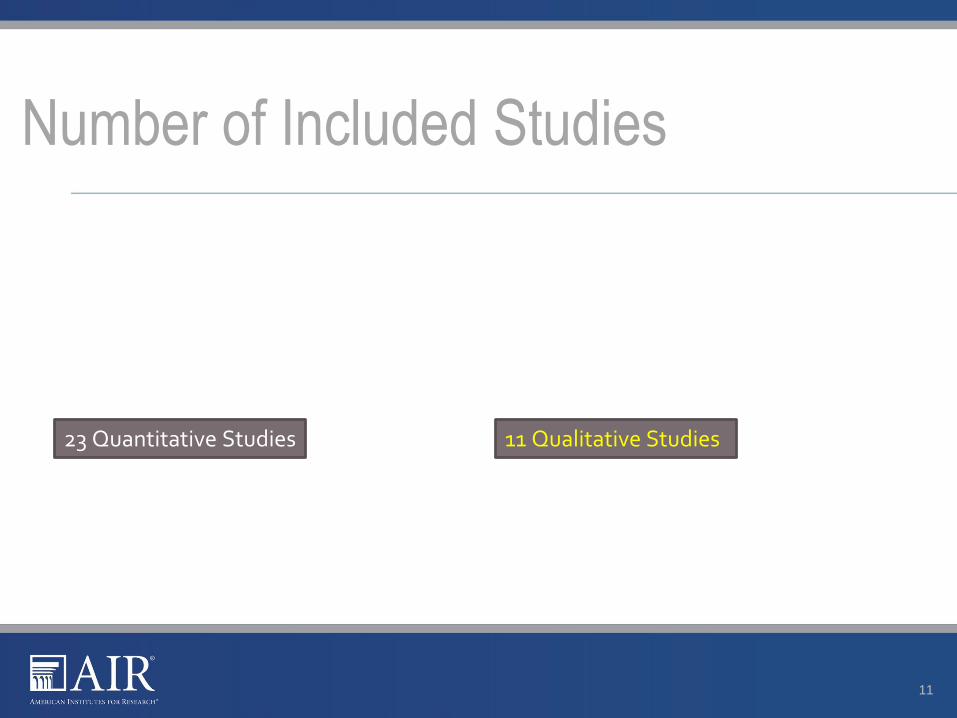
Number of Included Studies
11
23 Quantitative Studies 11 Qualitative Studies

Risk of Bias Assessment Quantitative
12
38%
29%
24%
14%
38%
24%
10%
24%
24%
48%
67%
62%
0% 20% 40% 60% 80% 100%
Other biases
Outcome and analysis reporting bias
Performance bias
Selection bias
Low risk of bias
Medium risk of bias
High risk of bias
Risk of Bias Assessment Quantitative
13
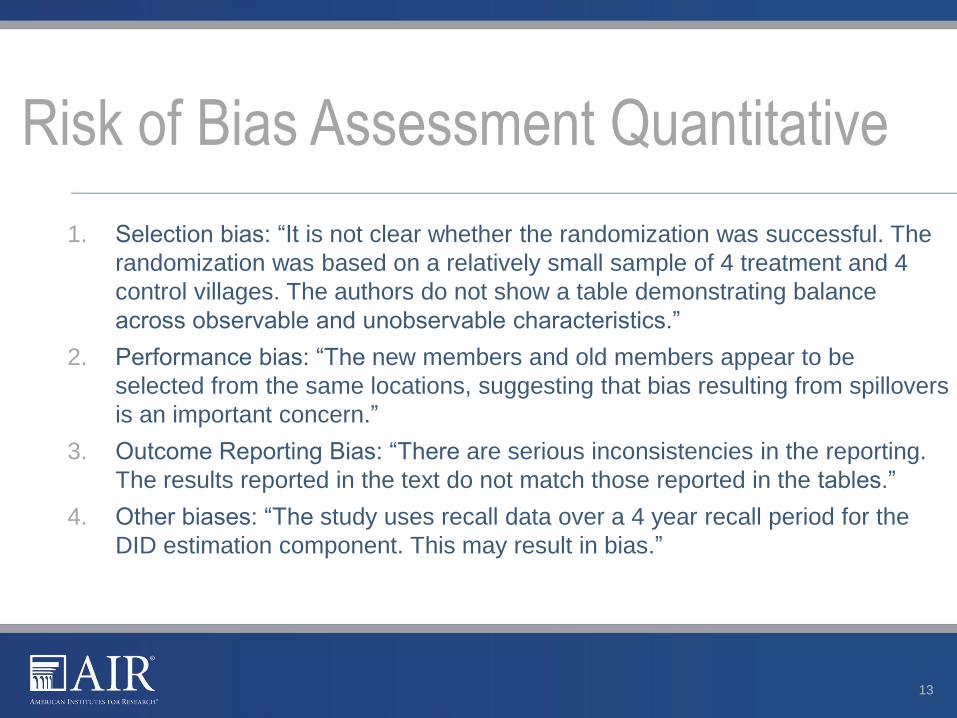
1. Selection bias: “It is not clear whether the randomization was successful. The
randomization was based on a relatively small sample of 4 treatment and 4
control villages. The authors do not show a table demonstrating balance
across observable and unobservable characteristics.”
2. Performance bias: “The new members and old members appear to be
selected from the same locations, suggesting that bias resulting from spillovers
is an important concern.”
3. Outcome Reporting Bias: “There are serious inconsistencies in the reporting.
The results reported in the text do not match those reported in the tables.”
4. Other biases: “The study uses recall data over a 4 year recall period for the
DID estimation component. This may result in bias.”
Risk of Bias Assessment Qualitative
14
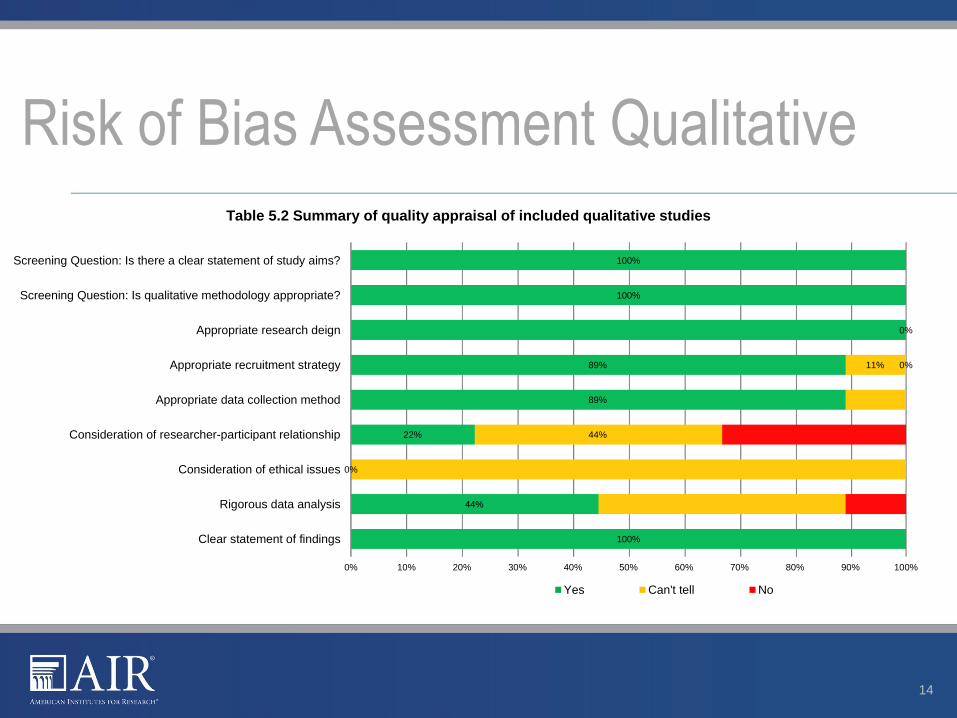
0% 10% 20% 30% 40% 50% 60% 70% 80% 90% 100%
Clear statement of findings
Rigorous data analysis
Consideration of ethical issues
Consideration of researcher-participant relationship
Appropriate data collection method
Appropriate recruitment strategy
Appropriate research deign
Screening Question: Is qualitative methodology appropriate?
Screening Question: Is there a clear statement of study aims?
100%
44%
0%
22%
89%
89%
100%
100%
44%
11%
0%
0%
Table 5.2 Summary of quality appraisal of included qualitative studies
Yes Can't tell No

Risk of Bias Assessment Qualitative
15
1. Recruitment of participants: “The authors did not explain how the participants
were selected.”
2. Data collection tools: “The authors did not describe their interview guides and
data format.”
3. Data saturation: “There was no mention of data saturation as reason for
stopping for recruitment.”
4. Researcher-participant relationship: “The authors did not report information
about the researcher-participant relationship.”
5. Data-analysis: “The authors did not describe the analysis of the data in
sufficient detail.”
Effects on Economic Empowerment: RCTs
16
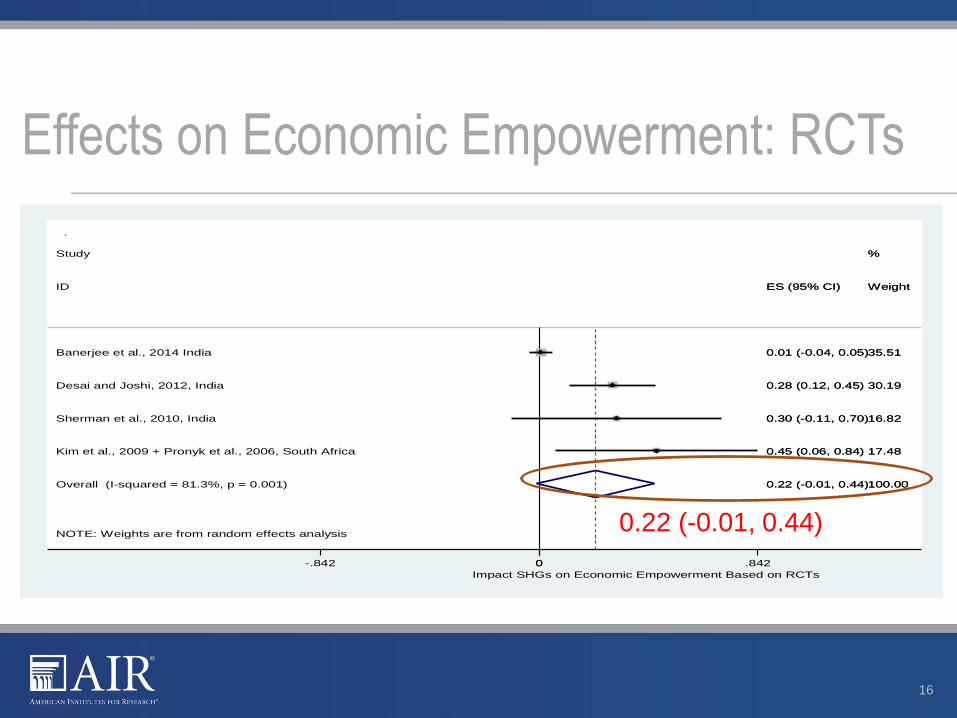
NOTE: Weights are from random effects analysis
Overall (I-squared = 81.3%, p = 0.001)
Banerjee et al., 2014 India
Kim et al., 2009 + Pronyk et al., 2006, South Africa
Sherman et al., 2010, India
Study
ID
Desai and Joshi, 2012, India
0.22 (-0.01, 0.44)
0.01 (-0.04, 0.05)
0.45 (0.06, 0.84)
0.30 (-0.11, 0.70)
ES (95% CI)
0.28 (0.12, 0.45)
100.00
35.51
17.48
16.82
%
Weight
30.19
0.22 (-0.01, 0.44)
0.01 (-0.04, 0.05)
0.45 (0.06, 0.84)
0.30 (-0.11, 0.70)
ES (95% CI)
0.28 (0.12, 0.45)
100.00
35.51
17.48
16.82
%
Weight
30.19
Impact SHGs on Economic Empowerment Based on RCTs
0-.842 0 .842
0.22 (-0.01, 0.44)
Effects on Family-Size Decision-Making
Power: RCTs
17
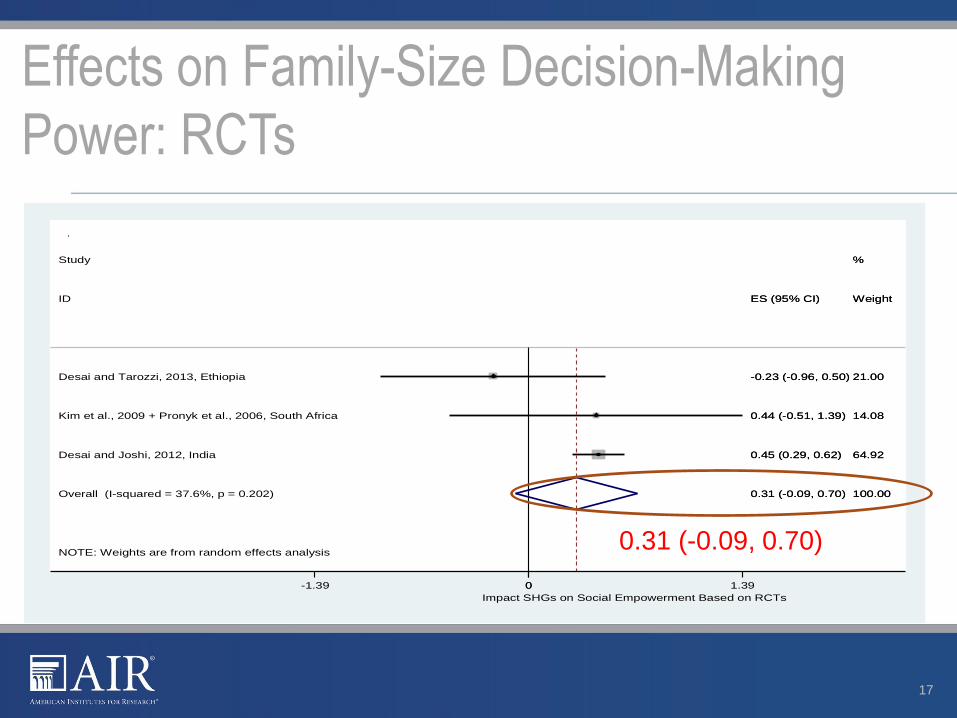
NOTE: Weights are from random effects analysis
Overall (I-squared = 37.6%, p = 0.202)
ID
Study
Desai and Joshi, 2012, India
Desai and Tarozzi, 2013, Ethiopia
Kim et al., 2009 + Pronyk et al., 2006, South Africa
0.31 (-0.09, 0.70)
ES (95% CI)
0.45 (0.29, 0.62)
-0.23 (-0.96, 0.50)
0.44 (-0.51, 1.39)
100.00
Weight
%
64.92
21.00
14.08
0.31 (-0.09, 0.70)
ES (95% CI)
0.45 (0.29, 0.62)
-0.23 (-0.96, 0.50)
0.44 (-0.51, 1.39)
100.00
Weight
%
64.92
21.00
14.08
Impact SHGs on Social Empowerment Based on RCTs
0-1.39 0 1.39
0.31 (-0.09, 0.70)

Effects on Economic Empowerment: RCTs
+ Medium-Risk Selection-Bias Studies
18
NOTE: Weights are from random effects analysis
Overall (I-squared = 86.8%, p = 0.000)
Banerjee et al., 2014 India
Sherman et al., 2010, India
Study
De Hoop et al., 2014 India
Pitt et al., 2006, Bangladesh
ID
Desai and Joshi, 2012, India
Deininger and Liu, 2013 India
Kim et al., 2009 + Pronyk et al., 2006, South Africa
0.18 (0.05, 0.31)
0.01 (-0.04, 0.05)
0.30 (-0.11, 0.70)
0.03 (-0.21, 0.27)
0.12 (0.03, 0.21)
ES (95% CI)
0.28 (0.12, 0.45)
0.28 (0.20, 0.36)
0.45 (0.06, 0.84)
100.00
20.32
6.80
%
12.15
18.81
Weight
15.45
19.34
7.14
0.18 (0.05, 0.31)
0.01 (-0.04, 0.05)
0.30 (-0.11, 0.70)
0.03 (-0.21, 0.27)
0.12 (0.03, 0.21)
ES (95% CI)
0.28 (0.12, 0.45)
0.28 (0.20, 0.36)
0.45 (0.06, 0.84)
100.00
20.32
6.80
%
12.15
18.81
Weight
15.45
19.34
7.14
Impact SHGs on Economic Empowerment Based on RCTs and Medium Risk of Bias Quasi-Experimental Studies
0-.842 0 .842
0.18 (0.05, 0.31)

Effects on Mobility: RCTs + Medium-Risk
Selection-Bias Studies
19
NOTE: Weights are from random effects analysis
Overall (I-squared = 70.8%, p = 0.033)
Pitt et al., 2006, Bangladesh
Study
Deininger and Liu, 2013 India
De Hoop et al., 2014 India
ID
0.18 (0.06, 0.31)
0.29 (0.19, 0.38)
0.15 (0.07, 0.22)
0.04 (-0.20, 0.27)
ES (95% CI)
100.00
39.81
%
42.45
17.74
Weight
0.18 (0.06, 0.31)
0.29 (0.19, 0.38)
0.15 (0.07, 0.22)
0.04 (-0.20, 0.27)
ES (95% CI)
100.00
39.81
%
42.45
17.74
Weight
Impact SHGs on Mobility Based on Quasi-Experimental Studies 0-.378 0 .378
0.18 (0.06, 0.31)
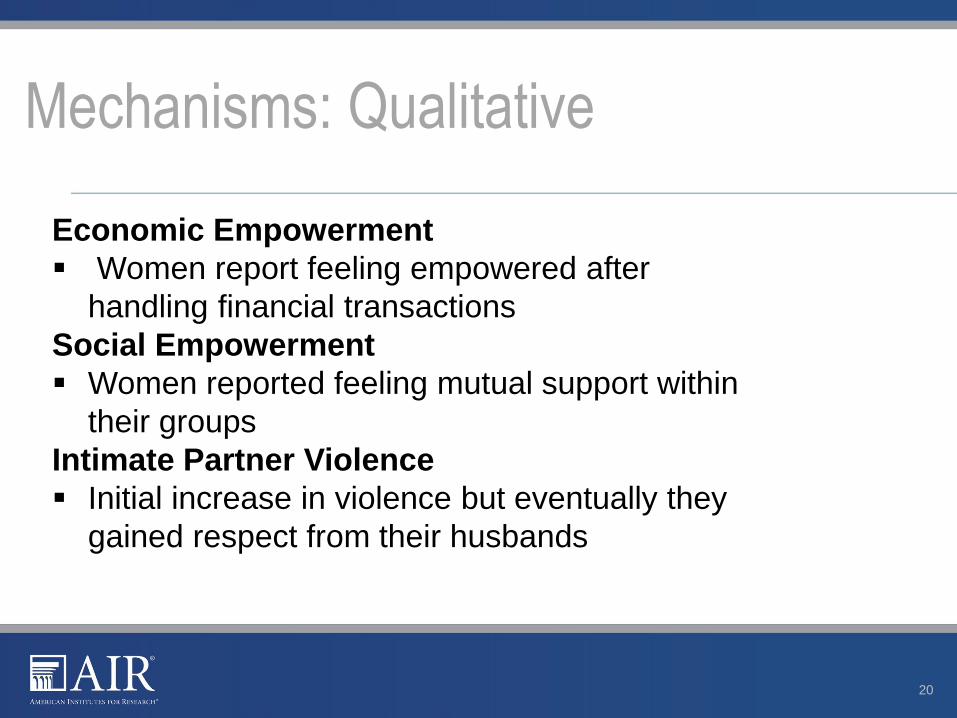
Mechanisms: Qualitative
20
Economic Empowerment
Women report feeling empowered after
handling financial transactions
Social Empowerment
Women reported feeling mutual support within
their groups
Intimate Partner Violence
Initial increase in violence but eventually they
gained respect from their husbands

• Too financially constrained for participation
• Caste or class discrimination
Limited participation of the poorest
21

Revised Theory of Change: Some Key Assumptions
22
Women
become
members of
self-help group
Introduction
Women’s
Self-Help
Group
Husband and mother-
in-law approve
participation
Knowledge about
and time for
participation
No caste and class
discrimination

Revised Theory of Change
23

• Microfinance did not show positive effect on
empowerment in other SR
• So is training the secret?
• What type of training?• Health education?
• Entrepreneurial skills?
• Women’s rights?
Potential Moderators: Training
24
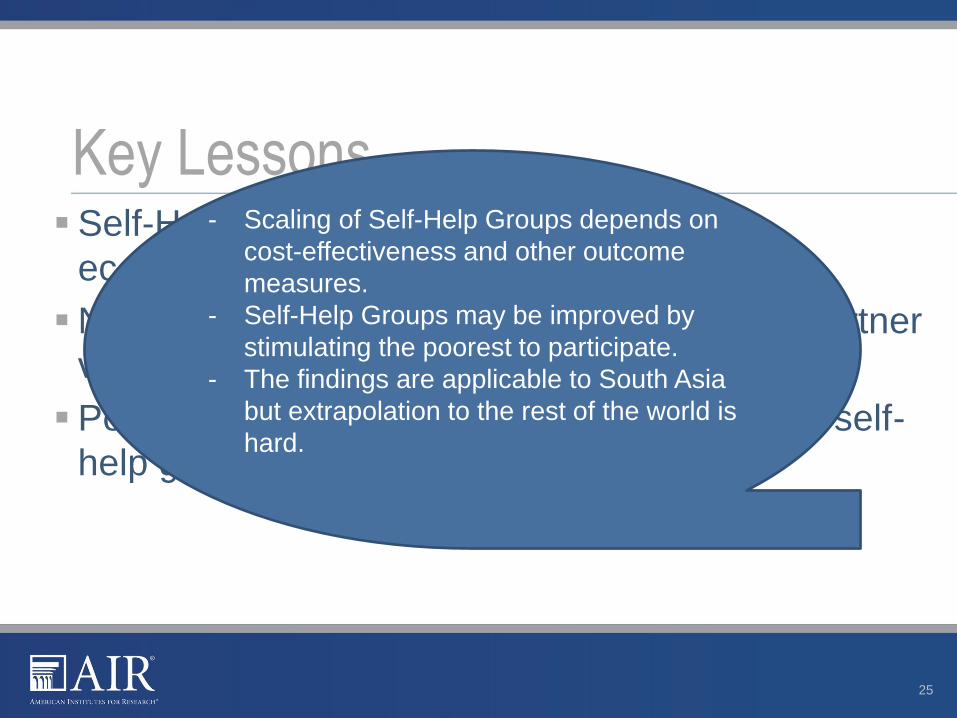
Self-Help Groups have positive effects on
economic, social, and political empowerment
No evidence for adverse effects on intimate partner
violence
Poorest of the poor do not often participate in self-
help group programs
Key Lessons
25
- Scaling of Self-Help Groups depends on
cost-effectiveness and other outcome
measures.
- Self-Help Groups may be improved by
stimulating the poorest to participate.
- The findings are applicable to South Asia
but extrapolation to the rest of the world is
hard.

Thomas de Hoop
202-403-6803
1000 Thomas Jefferson Street NW
Washington, DC 20007
General Information: 202-403-5000
TTY: 887-334-3499
www.air.org
26

Effects on Political Empowerment: RCTs +
Medium-Risk Selection-Bias Studies
27
NOTE: Weights are from random effects analysis
Overall (I-squared = 71.2%, p = 0.062)
Desai and Joshi, 2012, India
Pitt et al., 2006, Bangladesh
Study
ID
0.19 (0.01, 0.36)
0.29 (0.12, 0.46)
0.11 (0.02, 0.20)
ES (95% CI)
100.00
42.41
57.59
%
Weight
0.19 (0.01, 0.36)
0.29 (0.12, 0.46)
0.11 (0.02, 0.20)
ES (95% CI)
100.00
42.41
57.59
%
Weight
Impact SHGs on Political Empowerment Based on RCTs and Medium Risk of Bias Quasi-Experimental Studies
0-.456 0 .456
0.19 (0.01, 0.36)

Effects on Psychological Empowerment:
RCTs + Medium-Risk Selection-Bias
28
NOTE: Weights are from random effects analysis
Overall (I-squared = 0.0%, p = 0.363)
Kim et al., 2009 + Pronyk et al., 2006, South Africa
De Hoop et al., 2014 India
ID
Study
0.02 (-0.21, 0.26)
0.50 (-0.55, 1.56)
0.00 (-0.24, 0.24)
ES (95% CI)
100.00
4.84
95.16
Weight
%
0.02 (-0.21, 0.26)
0.50 (-0.55, 1.56)
0.00 (-0.24, 0.24)
ES (95% CI)
100.00
4.84
95.16
Weight
%
Impact SHGs on Psychological Empowerment RCTs and Medium Risk of Bias Quasi-Experimental Studies
0-1.56 0 1.56
0.02 (-0.21, 0.26)
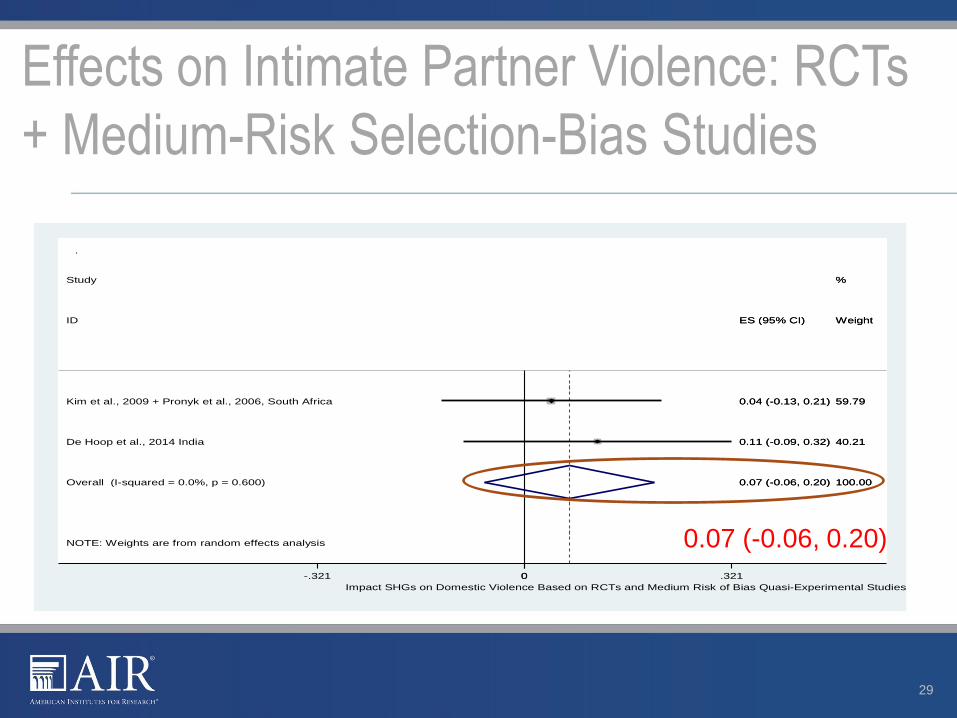
Effects on Intimate Partner Violence: RCTs
+ Medium-Risk Selection-Bias Studies
29
NOTE: Weights are from random effects analysis
Overall (I-squared = 0.0%, p = 0.600)
Study
Kim et al., 2009 + Pronyk et al., 2006, South Africa
ID
De Hoop et al., 2014 India
0.07 (-0.06, 0.20)
0.04 (-0.13, 0.21)
ES (95% CI)
0.11 (-0.09, 0.32)
100.00
%
59.79
Weight
40.21
0.07 (-0.06, 0.20)
0.04 (-0.13, 0.21)
ES (95% CI)
0.11 (-0.09, 0.32)
100.00
%
59.79
Weight
40.21
Impact SHGs on Domestic Violence Based on RCTs and Medium Risk of Bias Quasi-Experimental Studies
0-.321 0 .321
0.07 (-0.06, 0.20)
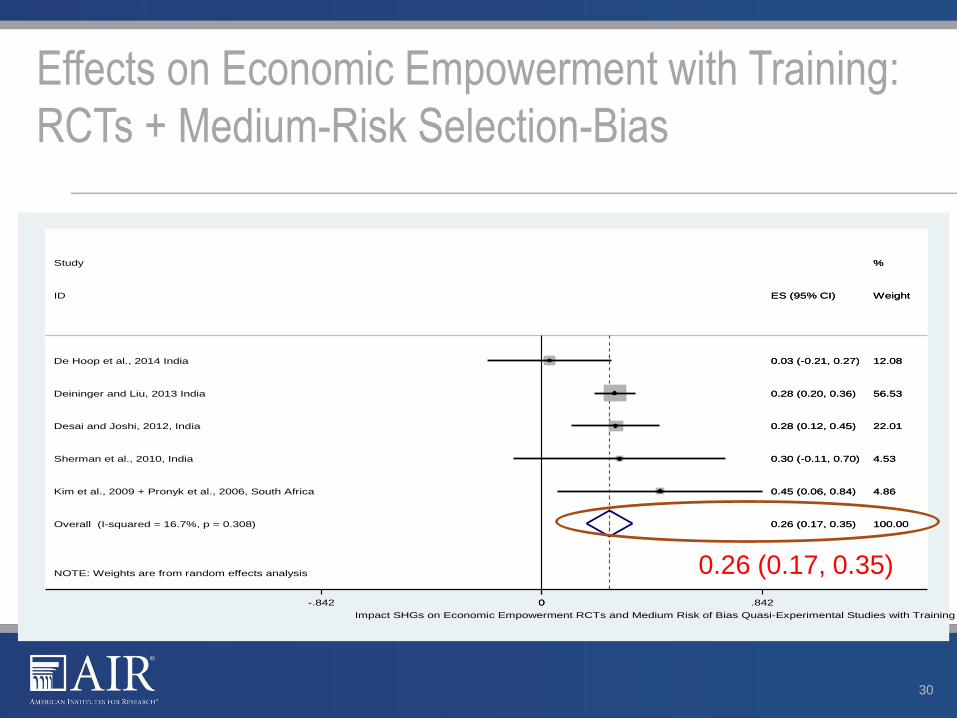
Effects on Economic Empowerment with Training:
RCTs + Medium-Risk Selection-Bias
30
NOTE: Weights are from random effects analysis
Overall (I-squared = 16.7%, p = 0.308)
Deininger and Liu, 2013 India
De Hoop et al., 2014 India
ID
Kim et al., 2009 + Pronyk et al., 2006, South Africa
Sherman et al., 2010, India
Desai and Joshi, 2012, India
Study
0.26 (0.17, 0.35)
0.28 (0.20, 0.36)
0.03 (-0.21, 0.27)
ES (95% CI)
0.45 (0.06, 0.84)
0.30 (-0.11, 0.70)
0.28 (0.12, 0.45)
100.00
56.53
12.08
Weight
4.86
4.53
22.01
%
0.26 (0.17, 0.35)
0.28 (0.20, 0.36)
0.03 (-0.21, 0.27)
ES (95% CI)
0.45 (0.06, 0.84)
0.30 (-0.11, 0.70)
0.28 (0.12, 0.45)
100.00
56.53
12.08
Weight
4.86
4.53
22.01
%
Impact SHGs on Economic Empowerment RCTs and Medium Risk of Bias Quasi-Experimental Studies with Training
0-.842 0 .842
0.26 (0.17, 0.35)

Effects on Economic Empowerment without
Training: RCTs + Medium-Risk Selection-Bias
31
NOTE: Weights are from random effects analysis
Overall (I-squared = 77.9%, p = 0.034)
Banerjee et al., 2014 India
Pitt et al., 2006, Bangladesh
ID
Study
0.06 (-0.05, 0.16)
0.01 (-0.04, 0.05)
0.12 (0.03, 0.21)
ES (95% CI)
100.00
56.82
43.18
Weight
%
0.06 (-0.05, 0.16)
0.01 (-0.04, 0.05)
0.12 (0.03, 0.21)
ES (95% CI)
100.00
56.82
43.18
Weight
%
Impact SHGs on Economic Empowerment RCTs and Medium Risk of Bias Quasi-Experimental Studies without Training
0-.211 0 .211
0.06 (-0.05, 0.16)

Effects on Economic Empowerment High-Risk
Selection-Bias
32
NOTE: Weights are from random effects analysis
Overall (I-squared = 42.1%, p = 0.178)
ID
Swendeman et al., 2009, India
Study
Osmani, 2007, Bangladesh
Nessa et al., 2012, Bangladesh
0.65 (0.33, 0.98)
ES (95% CI)
1.15 (0.47, 1.83)
0.37 (-0.10, 0.83)
0.65 (0.41, 0.89)
100.00
Weight
17.36
%
29.31
53.34
0.65 (0.33, 0.98)
ES (95% CI)
1.15 (0.47, 1.83)
0.37 (-0.10, 0.83)
0.65 (0.41, 0.89)
100.00
Weight
17.36
%
29.31
53.34
Impact SHGs on Economic Empowerment Based on High Risk of Bias Studies 0-1.83 0 1.83
0.65 (0.33, 0.98)
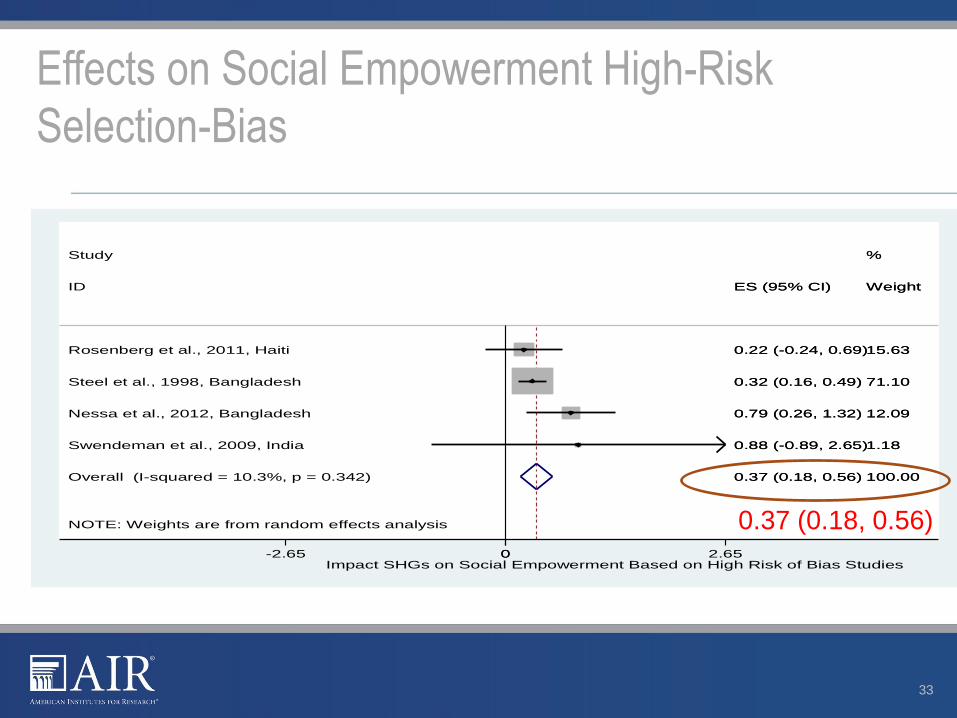
Effects on Social Empowerment High-Risk
Selection-Bias
33
NOTE: Weights are from random effects analysis
Overall (I-squared = 10.3%, p = 0.342)
Swendeman et al., 2009, India
Steel et al., 1998, Bangladesh
Nessa et al., 2012, Bangladesh
ID
Rosenberg et al., 2011, Haiti
Study
0.37 (0.18, 0.56)
0.88 (-0.89, 2.65)
0.32 (0.16, 0.49)
0.79 (0.26, 1.32)
ES (95% CI)
0.22 (-0.24, 0.69)
100.00
1.18
71.10
12.09
Weight
15.63
%
0.37 (0.18, 0.56)
0.88 (-0.89, 2.65)
0.32 (0.16, 0.49)
0.79 (0.26, 1.32)
ES (95% CI)
0.22 (-0.24, 0.69)
100.00
1.18
71.10
12.09
Weight
15.63
%
Impact SHGs on Social Empowerment Based on High Risk of Bias Studies 0-2.65 0 2.65
0.37 (0.18, 0.56)

Publication Bias: Economic Empowerment
34
0
.1
.2
.3
.4
Stan
dard
erro
r
-1 -.5 0 .5 1Effect estimate
Studies
1%
5%
10%

Publication Bias: Social Empowerment
35
0
.2
.4
.6
.8
1
Sta
ndar
d er
ror
-2 -1 0 1 2Effect estimate
Studies
1%
5%
10%