Programme Performance Report Template - gov.uk · Programme Performance Report Template . ......
50
Diabetic Eye Programme Performance Report Template Version 1.2 / 15 May 2015
-
Upload
vuongduong -
Category
Documents
-
view
223 -
download
1
Transcript of Programme Performance Report Template - gov.uk · Programme Performance Report Template . ......

Diabetic Eye
Programme Performance Report Template
Version 1.2 / 15 May 2015

About the NHS Diabetic Eye Screening Programme
The NHS Diabetic Eye Screening (DES) Programme aims to reduce the risk of sight loss for people with diabetes through the early detection, appropriate monitoring and treatment of diabetic retinopathy, which is one of the biggest causes of blindness among people of working age.
Public Health England (PHE) is responsible for the NHS Screening Programmes. PHE is an executive agency of the Department of Health and works to protect and improve the nation’s health and wellbeing, and reduce health inequalities.
NHS Diabetic Eye Screening Programme Victoria Warehouse The Docks Gloucester GL1 2EL Tel: +44 (0)300 422 4468 Twitter: @PHE_Screening diabeticeye.screening.nhs.uk www.gov.uk/phe Prepared by: Donna Prentis For queries relating to this document, contact: [email protected]
© Crown Copyright 2015 You may re-use this information (excluding logos) free of charge in any format or medium, under the terms of the Open Government Licence v3.0. To view this licence, visit OGL or email [email protected] Where we have identified any third party copyright information you will need to obtain permission from the copyright holders concerned.
Published June 2015 PHE publications gateway number: 2015128
2
About this publication
Project / Category Reporting
Document title Programme Performance Report Template
Version / Date Version 1.2 15/05/2015
Release Status Final
Author Donna Prentis, Kristin Bash, David Taylor
Owner Donna Prentis
Type Report Specification
Authorised By NHS NDESP National Programme Team
Valid From 15/05/2015
Review Date 15/06/2016
Audience NHS DESP, DESP software providers, commissioners, screening leads, DE screening providers, GPs.
Distribution Name / Group Responsibility
Amendment history Version Date Author Description
0.1 20 Aug 2012 KB/DP Final draft
1.0 02 Nov 2012 DP Final release
1.1 15 July 2013 AA/DP Addition of KPI references
1.2 15 May 2015 DP Amendments (see table page 8) Review / approval Version Date Requirement Signed
1.1 02/11/12 Approved Donna Prentis
1.2 15/05/15 Approved Donna Prentis
3

Contents
About the NHS Diabetic Eye Screening Programme 2
About this publication 3
Contents 4
Executive summary 5
Introduction 5 Annual report submission 5 Scope 6 Reporting requirements 6 Key to explanatory marks 6 Report section summary 6
Summary of key changes from v1.1 8
Programme Performance Report 9
Section 2 – Definitions 28
Appendices 31
Appendix A – Patient register 31 Appendix B – Calculating ‘appointments due to take place within reported time period’ [3.2.b] when using open invitations 31 Appendix C - Hierarchy of grades with their inferred outcomes 32 Appendix D - Referral Outcome Grader Performance Monitoring Report 33 Appendix E - Revised Content in Grader Activity report and Arbitration reports 34 Appendix F - Updated Inter Grader Agreement specifications 35 Appendix G - Grading Queue Ageing report 49 Appendix H – DS appointment ageing report 50
4

Executive summary
Introduction
From 2006 and annually thereafter, diabetic retinopathy screening programmes have been required to submit to the National Screening Programme an annual report, containing general information about the service offered and information to support an assessment against the Performance Objectives and Quality Assurance Standards for the programme. Many of these same data are useful to programmes for monitoring programme performance and internal QA reviews throughout the year. A new Programme Performance Report has therefore been designed to provide detailed information to programmes when they require it, and to provide a basis for reporting back to the National Screening Programme within the annual report requirement. This template provides a report structure which all programmes will be required to use, in order to facilitate the collation and comparison of data for the submission of the annual report. Each of the terms in this report and the Performance Objectives have been defined so as to be unambiguous and consistent with the targets, standards, and software which define systematic screening for diabetic retinopathy. Updates to the report have been made to reflect changes in the national pathway, including new reporting data for the Digital Surveillance (previously the OPDR) and slit lamp biomicroscopy (SLB) Surveillance pathways. The template is divided into two columns: the first states the return required, and the second provides the detail of how this should be measured and how it relates to the Quality Standards and Performance Objectives (v1.11). The report should be run over a 12 calendar month time period to ensure the data produced for each field fulfils the description provided for each field. Report date ranges selected are recommended to end a minimum of 90 days prior to the date the report is run to allow for the majority of grading, referral and treatment data to be captured (although seven months is required for a formal annual report submission – see below). Annual report submission
Where this report is being run for the annual report submission, the report will cover one complete financial year (1 April - 31 March), and must be returned to the National Screening Programme Office by 31 October following the end of each report period. Returns are generally based on attendance for a retinopathy screening appointment during the reporting period, with seven months being required before the report is due to follow these appointments through the grading, assessment and treatment process. In cases where a snapshot of information is required, information should usually be reported as at the last day of the reporting period. Programmes are encouraged to supplement
5

unavailable, unusual or out-of-tolerance returns with an explanatory note, particularly where data have been affected by significant changes during the reporting period (for example, new management software or a change in programme boundaries). Scope
This report covers each aspect of programme operation necessary to evaluate performance against the NHS Diabetic Eye Screening Programme (NHS DESP) Quality Standards and Performance Objectives (v1.11). All returns relating to retinopathy grading apply to pathology recorded using the National Grading Standard (retinopathy, maculopathy, photocoagulation, assessability). Reporting requirements
The software must provide the capability of producing this report on the following basis: • Per programme • Per individual Region within the defined boundaries of the programme • Per individual Local Area (LA) within the defined boundaries of the programme • Per individual Clinical Commissioning Group (CCG) within the defined boundaries of the
programme. Key to explanatory marks
broken underline term is further defined and explained in the glossary of terms asterisk (*) return will require the collation of data which will not usually be
collected by a screening service, such as ophthalmology treatment information
[square brackets] indicate headers to provide context and grouping information regarding subcategories: no return required
Report section summary
The report is divided into ten sections and, in general, is designed to follow the patient pathway as the patient moves through the different stages of screening: Section heading Summary description
1. Programme information Contact and programme boundary details. 2. Delivery model Programme model and software. 3. Patient throughput Total number of patients, number eligible,
suspended, invited, screened, removed. 4. Routine Digital Screening (RDS)
outcomes by grade Outcomes of RDS events that occurred during the reported time period.
5. Grading process Grader activity and comparison. 6. Ophthalmology referrals/outcomes Referrals, consultation times, laser treatment
times resulting from RDS and surveillance
6

events that occurred during the reported time period.
7. Quality assurance processes Participation in EQA. 8. Reducing new blindness SI/SSI certifications and VA measurements. 9. Surveillance activity – Outcomes from
SLB surveillance Outcomes of SLB surveillance events that occurred during the reported time period..
10. Surveillance activity – Outcomes from Digital Surveillance (DS)
Outcomes of DS surveillance events that occurred during the reported time period..
Definitions table Appendices A - H
7

Summary of key changes from v1.1
The following table summarises the key changes in the PPR from version 1.1 (15-07-2013). The changes are mostly minor corrections to the original document, and are denoted in red throughout the document. Report field Change Notes 3.7.3 Added to guidance note. Footnote 17 Corrected field reference. 6.2.b Added ‘RD’ to clarify type of
screening encounter.
6.4.6 Corrected to R1M1. 9.1.3 Aligned with Performance
Objective 10.
10.1.3.1 Corrected headings to align with 10.1.1.1.
10.2.8, 10.2.9 Corrected to R3A. 10.3 Added additional outcomes of
1, 2, 4, 5, 7 8, 10 and 11 month recall to number of patients retained in DS pathway.
Multiple fields Corrected lowercase ‘a’ and ‘s’ to uppercase for all instances of R3A and R3S.
Multiple fields Updated references to QA Standards and Performance Objectives, including terminology (not in red).
Section 2 – definitions Clarified definition of positive test.
8

Programme Performance Report
Name Description Guidance 1. Programme information 1.1. Programme name Unique name1 for this diabetic eye screening
programme.
1.1.1 Programme Region Region that the programme is located in, or lead region if the programme lies within the boundaries of one or more region.
1.2a. CCG units that commission the programme
List of CCG Units2that commission the programme denoting the lead CCG where applicable,
1.3a Local areas wholly covered List of Local Areas (LAs)3 falling wholly within the defined boundaries of this programme.
1.3b. Local areas covered in part List of Local Areas (LAs)4 falling partly within the defined boundaries of this programme.
1.4. Programme Manager Name, job title and contact details for the programme lead / manager.
1.5. Accountable Clinical Lead Name, title, job title and contact details for the accountable clinical lead
1.6. Location Address, contact name, contact e-mail and contact telephone for the administrative centre for the programme.
1.7. Referral and Treatment Centres A list of the acute Trust(s) and hospitals into which patients are referred for assessment and/or treatment following a positive test, and the name, title, and job title
1 Should identify the screening programme and not just the Clinical Commissioning Group (CCG) areas that it covers; for example ‘Gloucestershire Diabetic Eye Screening Service’.
2 Term ‘CCG Units’ to denote relationship of commissioning organisations (Clinical Commissioning Groups) to the area of registered populations within and between which the DESP screening populations will be defined. Note that these will reflect registered populations (as per GP registrations). 3 Term ‘Administrative Units’ to denote area of resident populations (eg, Local Authorities) which fall within the defined boundaries of the programme. Note that these will reflect where populations live and where they are registered with a GP practice. 4 ibid.
9
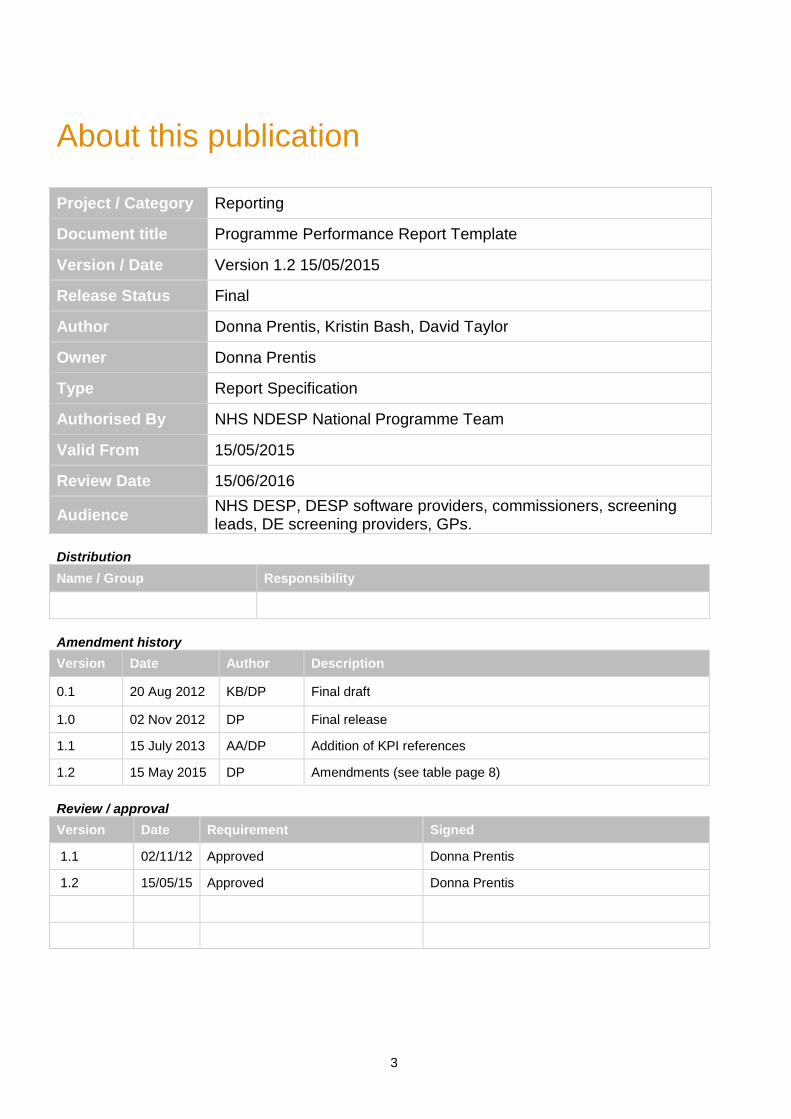
of the lead ophthalmologist based at each location. 1.8 GP practice participation 1.8.a. Number of GP practices within the defined
boundaries of the programme referring in to the programme. 1.8.b. Number of GP practices within the defined boundaries of the programme. Performance Objective 1.3
2. Delivery model 2.1. Programme structure / model Brief summary of how screening is delivered, including
whether the programme issues invitations for screening from a single location, plus:
• number of static sites • number of mobile sites • number of optometric sites, and • whether any independent/external provider is
used.
2.2. Cameras used • number of static cameras in non optometric sites • number of mobile cameras • number of static cameras on optometric sites
2.3. Management software used Supplier, product and version
3. Patient throughput [Please see Appendix A for a diagram showing the programme register.]
3.1.0. Patients seen in different DESP [These patients are off-register and do not appear within any other fields.]
a) Number of living people aged 12 and above within catchment area of DESP who have chosen to have screening at a different DESP at final day of reporting period.
b) List of DESP names which are providing screening to the patients in [3.1.0.a] above.
10

3.1. Programme size The number of living people aged 12 and above on the programme register5 at final day of reporting period Performance Objective 16
Programme size [3.1] should equal patients eligible [3.1.1] plus patients ineligible [3.1.2]
3.1.1. Patients eligible for screening Number of people eligible for screening by this programme: at final day of reporting period Performance Objective 2.1
This will include patients that are excluded and suspended.
3.1.2. Patients ineligible for screening – NPL
Number of people ineligible for screening by this programme at final day of reporting period, due to having no perception of light (NPL) in both eyes
3.1.3. Patients excluded from screening
Number of people excluded: a) at final day of reporting period; b) within the reporting period6. Performance Objective 2.1 [3.1.3a]
Patients excluded at final day [3.1.3.a] should equal patients excluded categorised as informed opt-out [3.1.4.a] plus medically unfit [3.1.4.b]
3.1.4. Patients excluded from screening according to category
Number of people excluded at final day of reporting period, categorised as7:
a) Informed opt-out b) Medically unfit
3.1.5. Patients suspended from screening
Number of people suspended a) At final day of reporting period b) Within reporting period
Performance Objective 2.1 [3.1.5a]
Patients suspended at final day [3.1.5.a] should equal patients suspended categorised as SLBS [3.1.6.a] plus DS [3.1.6.b] plus HES [3.1.6.c]
3.1.6. Patients suspended from screening according to category
Number of people suspended at final day of reporting period according to category:
a) Slit Lamp Biomicroscopy Surveillance (SLBS) b) Digital Surveillance (DS) c) Hospital Eye Service (HES)
5 [3.1] should be the total of all patients listed on the Register and will include patients who fall into the following categories ; categories: eligible, ineligible, excluded and suspended.
6 The circumstances under which a patient can be marked as either Suspended or Excluded are detailed in the ‘Suspensions and Exclusions paper, ‘Exclusions and suspensions and management of ungradable images’. Patients who are Excluded continue to count within the Eligible category.
7 ibid 11

3.2. Number of people invited for Routine Digital Screening (RDS)
Number of people invited for a RDS screening event8: a) during the reported time period9; and b) which was due to take place within the reported time period10. Performance Objective 2.1 [3.2.a] Performance Objective 3, KPI DE1 [3.2.b]
Please see Appendix B for rules regarding counting open invitations.
3.2.1. Invitations made for first screening11
Number of new additions to the register [3.5] 12 who were issued a first invitation for first RDS event within the reported time period. Performance Objective
3.2.2 Invitations made for first screening within 3 months
Number of new additions to the register [3.5] 13 who were issued a first invitation for first RDS event, within 3 months of the programme being notified of their diagnosis. Performance Objective 2.2
3.2.3 Newly registered patients who DNA/DNR following first invitation to first screening
Number of new additions to the register [3.5] 14 who were issued a first invitation for first RDS event within the reported time period who DNA first booked appointment or DNR to first invitation for first RDS event.
3.3 DNA/DNR patients Patients who have received final reminder/invite letter within the reported time period, without attending any RDS appointment:
a) Total number within reported time period b) Total number within [3.3.a] above, aged between
12 and 44 years at final day of reported time period.
8 Note that this return should represent the number of people who have received an invitation, rather than the number of invitations sent: if more than one invitation was issued for screening events within the reported time period, only the initial invitation should be counted. Patients attending for routine screening without a prior appointment or invitation should be deemed as receiving an invitation on the date of screening.
9 ie the invitation was issued within the reporting period, but the proposed appointment date might fall outside the reporting period. 10Counts invitations that were issued at any time for a proposed appointment date within the reporting period. Programmes with partial booking systems which offer a range of
dates during which the patient can arrange an appointment should use the first date in this range as the proposed appointment date. For open appointment models (where no proposed date is offered to the patient), where a realisable invitation is not taken up, see Appendix B.
11 First Screening refers to new patients’ first screening event within the DESP. See definitions in glossary for ‘first screening’ and ‘new registrations’ for further detail. 12 Note that this is a subset of new additions to the register within the reported time period (field 3.5) 13 ibid 14 Note that this is a subset of new additions to the register within the reported time period (field 3.5)
12
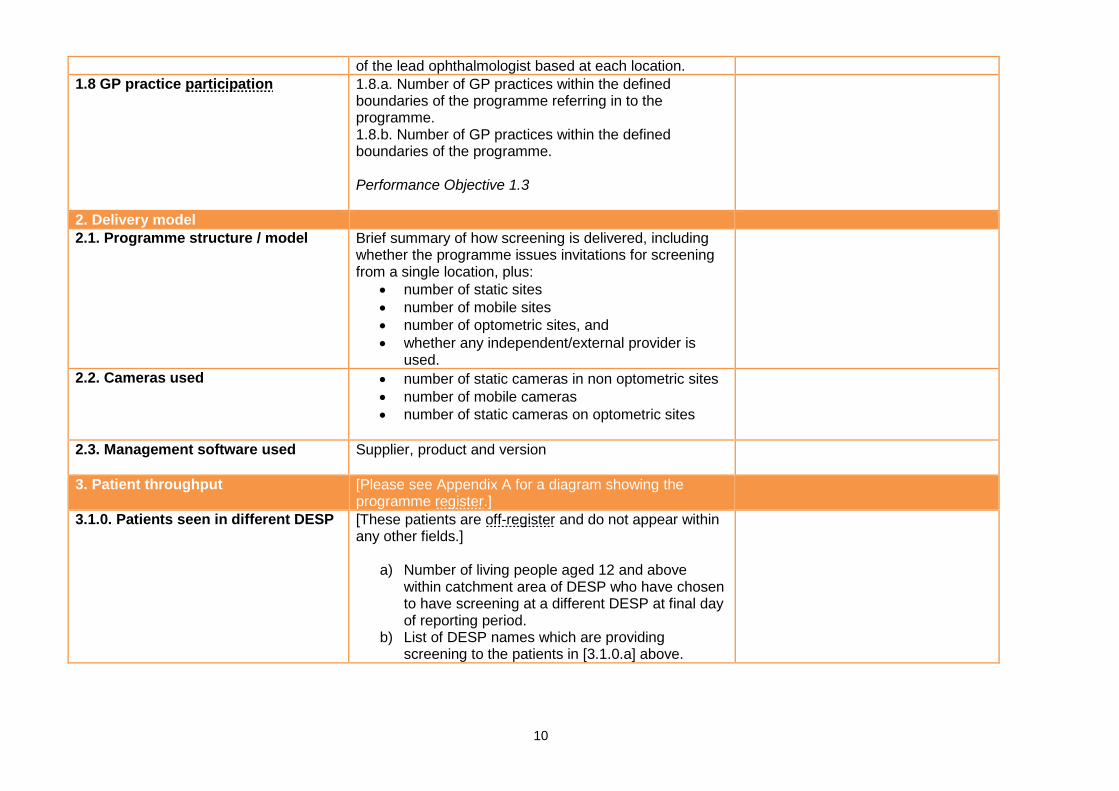
c) Total number within [3.3.a] above, aged 45 years or over at final day of reported time period.
3.4. Patients screened Number of people who have attended a successful RDS event during the reported time period15. Performance Objective 3, KPI DE1 Performance Objective 4, Performance Objective 6
Patients screened [3.4] should equal the sum of RDS outcomes by grade [4.1.1] to [4.1.10]
3.4.1. Patients screened while in HES Number (out of 3.4) who received screening for DR while in HES for a non-DR condition.16
3.4.2. Annual screening Of the people who attended a RDS event during the 12 months previous to the current reported time period;
a) Number of people who subsequently attended a RDS event during the reported time period.
b) Number of people who subsequently attended a RDS event during the reported time period, falling within 12 months of previous RDS.
Performance Objective 17
3.5. New registrations Number of new additions to the register within the reported time period. Performance Objective 2.2
3.6. Moved off-register Number of people with diabetes who moved off-register within the reported time period.
3.7 Cohort-based Performance Measures
[Reporting measures within section 3.7 are new and reflect the performance of only the cohort of patients who are eligible for screening and not suspended on the final day of the reporting period.]
3.7.1. Number eligible and not suspended
Number of patients eligible and not suspended on the final day of the report period17.
3.7.2. Cohort performance measure – number invited
Number of patients eligible and not suspended on the final day of the report period [3.7.1.] who were invited for
This count will exclude any patients who were made eligible near the end of the
15 Section [3.4] should not include patients who are recorded as exceptions [4.2] unless they have subsequently attended RDS and a gradeable or U digital image has been taken. 16 Patients who are seen in HES for a non-DR lesion may have their DR screening while in hospital under agreement between HES and DESP; further detail available in ‘Exclusions, Suspensions and Management of Ungradables’. 17 This is equivalent to field [3.1.1.] minus [3.1.5.a].
13

an RDS event during the reported time period18. reported time period but were not invited until after the reported time period.
3.7.3. Cohort performance measure - number screened
Number of patients eligible and not suspended on the final day of the report period [3.7.1.] who were invited for an RDS event [3.7.2.] that subsequently attended a RDS event during the 15 month period that starts from the first day of the reported time period19.
This count allows 3 months after the final day of the reporting period, for patients who were invited at the end of the reported time period, to attend for screening. This assumes all invitations are for a ‘realisable appointment’ for a date within 3 months of the date of issue. This count will only be accurate if the report period is a full year.
3.7.4. Cohort performance measure – percentage invited
Percentage of patients eligible and not suspended on the final day of the report period [3.7.1.] who were invited for an RDS event during the reported time period
3.7.5. Cohort performance measure – percentage screened
Percentage of patients eligible and not suspended on the final day of the report period [3.7.1.] who were invited for an RDS event [3.7.2.] that subsequently attended a RDS event during the 15 month period that starts from the first day of the reported time period
4. Routine Digital Screening (RDS) outcomes by grade
[4.1. RDS outcomes by grade:]20 [The aggregate outcomes within each grading category should relate to Routine Digital Screening (RDS) screening events within the reported time period.21 The category should represent the final grading outcome for the eye for which action is most urgently required.22]
18 This measure will therefore not include patients that became eligible near the end of the report period and were sent an invitation after the final day of the report period. 19 Extending the reported time period by 3 months allows programmes 3 months for the patients to attend a RDS event arising from a realisable appointment. 20 Note that the numbers of grading outcomes falling within each grading category [4.1.1 to 4.1.10] should sum to exactly the number of patients screened [3.4]. Patients
attending for photography and subsequently referred for slit-lamp biomicroscopy during the reported time period should be counted in this section and section 6. It is recommended that all image sets are graded to completion, regardless of any change to the patient status occurring after the digital screening encounter.
21 Therefore these figures will relate to grading activity outside the reporting period for patients screened near the end of the financial year. Where a patient attends a RDS encounter on more than one occasion during the reported time period, only the final grading outcome of the final RDS encounter should be reported.
22 The agreed hierarchy for ‘eye for which action is most urgently required’ is given in Appendix C along with the inferred outcomes for that grade. It is recommended that all image sets are graded to completion regardless of the status of the patient (for example if a patient status changes to ‘deceased’ during the grading process).
Drill down should be available from numbered totals into patient identified lists. This facility is required at the programme only for the purpose of checking submissions and is not required within the report for submission to EARS. An additional management report is required for the programmes internal use as described in Appendix F
14

4.1.1. Grade: R0M0 Number of patients, according to [4.1] above, with a final grading outcome of ‘R0 No retinopathy, M0 No maculopathy’.
4.1.2. Grade: R1M0 Number of patients, according to [4.1] above, with a final grading outcome of ‘R1 Background retinopathy, M0 No maculopathy’.
4.1.3. Grade: R1M1 Number of patients, according to [4.1] above, with a final grading outcome of ‘R1 Background retinopathy, M1 Maculopathy’.
4.1.4. Grade: R2M0 Number of patients, according to [4.1] above, with a final grading outcome of ‘R2 Pre-proliferative retinopathy, M0 No maculopathy’.
4.1.5. Grade: R2M1 Number of patients, according to [4.1] above, with a final grading outcome of ‘R2 Pre-proliferative retinopathy, M1 Maculopathy’.
4.1.6. Grade: R3SM0 Number of patients, according to [4.1] above, with a final grading outcome of ‘R3S - Stable Proliferative retinopathy, M0 - No maculopathy’.
4.1.7. Grade: R3SM1 Number of patients, according to [4.1] above, with a final grading outcome of ‘R3S - Stable Proliferative retinopathy, M1 - Maculopathy’.
4.1. 8. Grade: R3AM0 Number of patients, according to [4.1] above, with a final grading outcome of ‘R3A - Active Proliferative retinopathy, M0 - No maculopathy’.
4.1.9. Grade: R3AM1 Number of patients, according to [4.1] above, with a final grading outcome of ‘R3A - Active Proliferative retinopathy, M1 - Maculopathy’.
4.1. 10. Grade: U Number of patients, according to [4.1] above, deemed Ungradable. Performance Objective 4
4.2 Image Capture Exceptions Number of patients for whom no photograph could be taken at time of appointment23
Exceptions do not close out a screening event and the designation of ‘exception’ is not a grading outcome; patients whose appointments end in exceptions are re-invited to RDS for screening event and
23 Exceptions do not close out a screening event and the designation of ‘exception’ is not a grading outcome; patients whose appointments end in exceptions are re-invited to RDS for screening event and will be included in both [4.1] and [4.2].
15
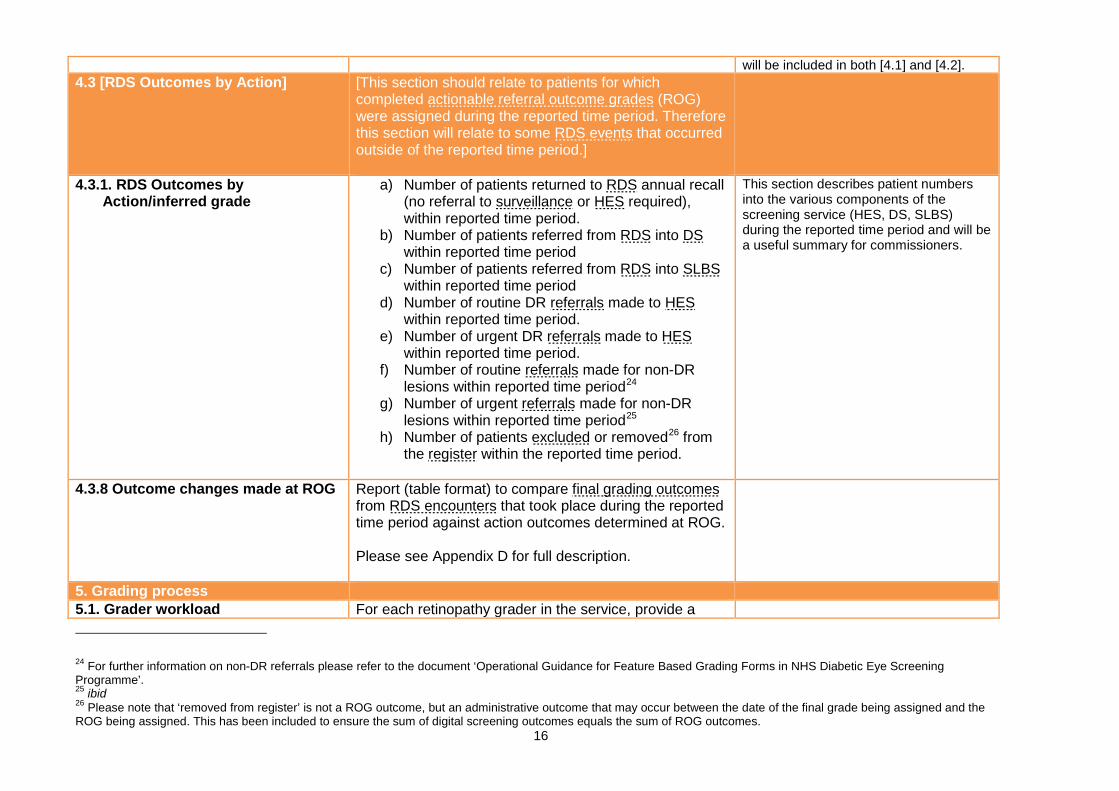
will be included in both [4.1] and [4.2]. 4.3 [RDS Outcomes by Action] [This section should relate to patients for which
completed actionable referral outcome grades (ROG) were assigned during the reported time period. Therefore this section will relate to some RDS events that occurred outside of the reported time period.]
4.3.1. RDS Outcomes by Action/inferred grade
a) Number of patients returned to RDS annual recall (no referral to surveillance or HES required), within reported time period.
b) Number of patients referred from RDS into DS within reported time period
c) Number of patients referred from RDS into SLBS within reported time period
d) Number of routine DR referrals made to HES within reported time period.
e) Number of urgent DR referrals made to HES within reported time period.
f) Number of routine referrals made for non-DR lesions within reported time period24
g) Number of urgent referrals made for non-DR lesions within reported time period25
h) Number of patients excluded or removed26 from the register within the reported time period.
This section describes patient numbers into the various components of the screening service (HES, DS, SLBS) during the reported time period and will be a useful summary for commissioners.
4.3.8 Outcome changes made at ROG Report (table format) to compare final grading outcomes from RDS encounters that took place during the reported time period against action outcomes determined at ROG. Please see Appendix D for full description.
5. Grading process 5.1. Grader workload For each retinopathy grader in the service, provide a
24 For further information on non-DR referrals please refer to the document ‘Operational Guidance for Feature Based Grading Forms in NHS Diabetic Eye Screening Programme’. 25 ibid 26 Please note that ‘removed from register’ is not a ROG outcome, but an administrative outcome that may occur between the date of the final grade being assigned and the ROG being assigned. This has been included to ensure the sum of digital screening outcomes equals the sum of ROG outcomes.
16

pseudonymised27 report (table format) of activity relating to all full grading carried out within the reported time period.28 Please see Appendix E for full description.
5.2. Individual Grader Tables – Comparison of grading with final grade: Kappa Table
Please see Appendix F for full description.
5.3. Summary of Individual grader tables.
Please see Appendix F for full description.
5.4. Result notification times Number of result letter notifications issued following a RDS screening encounter within the reported period29: a) within 3 weeks of RDS screening encounter b) within 6 weeks of RDS screening encounter Performance Objective 6, KPI DE2 [5.4.a]
6. Ophthalmology (HES) referrals / outcomes
[Note that this section should be used to report ophthalmology outcomes that result from RDS screening or surveillance encounters from all DESP pathways (RDS, SLBS or DS) within the reported time period.]
6.1. Urgent referral times - Number of patients marked as ‘R3AM0/R3AM1’ referred to an ophthalmology clinic in relation to a screening or surveillance event that took place within the reported time period, within: a) 1 week of screening or surveillance event30 b) 2 weeks of screening or surveillance event Performance Objective 7 [6.1b]
27 For example, ‘Grader A’, ‘Grader B’, etc. This should allow problems with individual graders to be traced back if necessary without compromising workforce confidentiality. 28 The assessment of grading workload does not therefore relate to digital screening encounters within the reported time period; often, grading carried out near the start of the
financial year will relate to digital screening encounters from the previous financial year. Please refer to appendix 2 of this report for guidance on how to calculate grader workload.
29 Issuing of results letters must be to both GP and patient for the count to be included in this section. 30 ie grading completed and appropriate referral made within 1 week of screening encounter.
17

6.2. Ophthalmology referrals: all patients
Number of patients referred to an ophthalmology clinic following a positive test relating to:
a) a screening or surveillance event that took place within the reported time period
b) a RD screening event that took place within the reported time period.31
c) a DS event that took place within the reported time period
d) a SLBS event that took place within the reported time period
Total referrals [6.2.a] should equal the sum of referrals from RDS [6.2.b], DS [6.2.c] and SLBS [6.2.d]
6.2.1. Ophthalmology referrals: by category
Number of patients referred to an ophthalmology clinic following a positive test relating to a screening or surveillance event that took place within the reported time period with: a) a final grading outcome32 of ‘R3AM0 proliferative
retinopathy without maculopathy’ b) a final grading outcome33 of ‘R3AM1 Proliferative
retinopathy with maculopathy’ c) a final grading outcome of ‘R3SM0’ stable proliferative
retinopathy without maculopathy. d) a final grading outcome of ‘R3SM1’ stable proliferative
retinopathy with maculopathy e) a final grading outcome of ‘R2M0 Pre-proliferative
retinopathy’ f) a final grading outcome of ‘R2M1’ g) a final grading outcome of ‘R1M1’ h) any other final grading outcome (R1M0, R0M0, U) –
excluding referrals for eye diseases other than diabetic retinopathy.
Performance Objective 7, Performance Objective 8, KPI
DE3 [6.2.1 a and 6.2.1.b]
Total referrals [6.2.a] should equal the sum of referrals by category [6.2.1.a] to [6.2.1.h]
6.3. Consultation times: by category * Number of patients within [6.2.1] above with:
31 This refers to patients who are referred to HES as determined by ROG outcome; screening encounters that end in referable grade but sent to another DESP pathway (eg, DS) are not included in this category. 32 Final grading outcome should be measured on the eye for which action is most urgently required. The agreed hierarchy for ‘eye for which action is most urgently required’ is:
R3aM1 > R3aM0 > R3sM1 > R2M1 > R1M1 > R2M0 > U > R3sM0 > R1M0 > R0M0, see Appendix C for further details. 33ibid.
18

a) a final grading outcome of ‘R3AM0/R3AM1 Proliferative retinopathy’ receiving consultation within 2 weeks of notification of positive test
b) a final grading outcome of ‘R3AM0/R3AM1 Proliferative retinopathy’ receiving consultation within 4 weeks of notification of positive test
c) a final grading outcome of ‘R2M0/R2M1 Pre-proliferative retinopathy’ receiving consultation within 13 weeks of notification of positive test
d) a final grading outcome of ‘R2M0/R2M1 Pre-proliferative retinopathy’ receiving consultation within 18 weeks of notification of positive test
e) a final grading outcome of ‘R1M1 Maculopathy’ receiving consultation within 13 weeks of notification of positive test
f) a final grading outcome of ‘R1M1’ receiving consultation within 18 weeks of notification of positive test
Performance Objective 8, KPI DE3 [6.3 b]
6.4. Patients listed for first laser treatment at first visit *
a) Number of patients listed at first visit for first laser
treatment for ‘R3AM0 Proliferative retinopathy’ following a positive test relating to a screening event that took place within the reported time period.
b) Number of patients listed at first visit for first laser
treatment for ‘R3AM1 Proliferative retinopathy’ following a positive test relating to a screening event that took place within the reported time period.
c) Number of patients listed at first visit for first laser
treatment for ‘R2M0 Pre-proliferative retinopathy’ following a positive test relating to a screening event that took place within the reported time period.
d) Number of patients listed at first visit for first laser
treatment for ‘R2M1 Pre-proliferative retinopathy’ following a positive test relating to a screening event
19
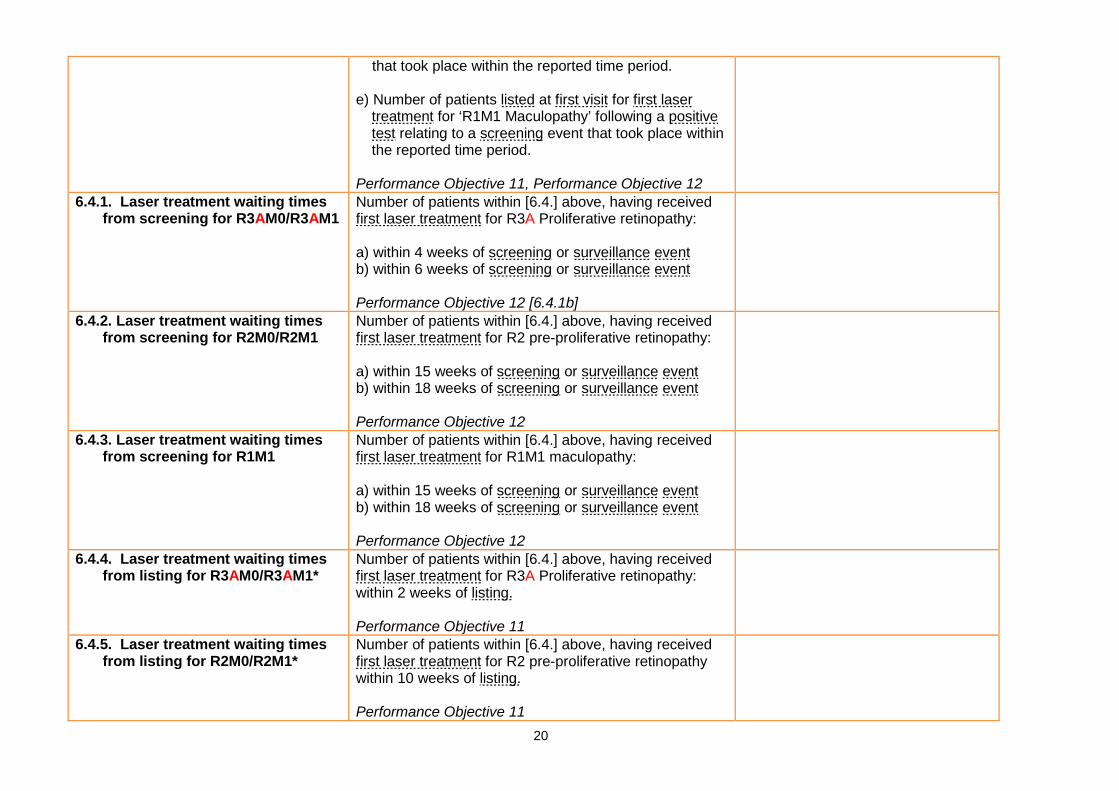
that took place within the reported time period. e) Number of patients listed at first visit for first laser
treatment for ‘R1M1 Maculopathy’ following a positive test relating to a screening event that took place within the reported time period.
Performance Objective 11, Performance Objective 12
6.4.1. Laser treatment waiting times from screening for R3AM0/R3AM1
Number of patients within [6.4.] above, having received first laser treatment for R3A Proliferative retinopathy: a) within 4 weeks of screening or surveillance event b) within 6 weeks of screening or surveillance event Performance Objective 12 [6.4.1b]
6.4.2. Laser treatment waiting times from screening for R2M0/R2M1
Number of patients within [6.4.] above, having received first laser treatment for R2 pre-proliferative retinopathy: a) within 15 weeks of screening or surveillance event b) within 18 weeks of screening or surveillance event Performance Objective 12
6.4.3. Laser treatment waiting times from screening for R1M1
Number of patients within [6.4.] above, having received first laser treatment for R1M1 maculopathy: a) within 15 weeks of screening or surveillance event b) within 18 weeks of screening or surveillance event Performance Objective 12
6.4.4. Laser treatment waiting times from listing for R3AM0/R3AM1*
Number of patients within [6.4.] above, having received first laser treatment for R3A Proliferative retinopathy: within 2 weeks of listing. Performance Objective 11
6.4.5. Laser treatment waiting times from listing for R2M0/R2M1*
Number of patients within [6.4.] above, having received first laser treatment for R2 pre-proliferative retinopathy within 10 weeks of listing. Performance Objective 11
20

6.4.6. Laser treatment waiting times from listing for R1M1*
Number of patients within [6.4.] above, having received first laser treatment for R1M1 Maculopathy R2 pre-proliferative retinopathy within 10 weeks of listing. Performance Objective 11
7. Quality assurance processes 7.1. Evidence of external quality
assurance Date of participation in most recent a peer-review EQA visit programme Performance Objective 19
7.2. Report submission date Date of submission of current report. Performance Objective 18
8. Reducing new blindness 8.1. New certifications of severe sight
impairment * Number of new certifications of severe sight impairment within the reported time period amongst current patients, which are predominantly due to diabetic retinopathy. Performance Objective 13
8.2. New certifications of sight impairment*
Number of new certifications of sight impairment within the reported time period amongst current patients, which are predominantly due to diabetic retinopathy. Performance Objective 13
8.3. Incident visual acuity: 6/60 or worse
Number of current patients with visual acuity of 6/6034 or worse in the better seeing eye being recorded for the first time within the reporting period. Performance Objective
8.4. Incident visual acuity: 6/18 or worse
Number of current patients with visual acuity of 6/1834 or worse in the better seeing eye being recorded for the first time within the reporting period. Performance Objective
8.5 Number of patients with a concurrent visual acuity measurement recorded
Number of current patients attending a screening encounter in the reporting period with a concurrent visual acuity measurement recorded for at least one eye
8.6. Incident visual acuity: 6/60 or worse predominantly due to diabetic retinopathy
Number of current patients referred with visual acuity of 6/6034 or worse in the better seeing eye being recorded for the first time within the reporting period, which is
34 log MAR equivalent: +1.0. This should be the most recent best corrected VA measurement. 21
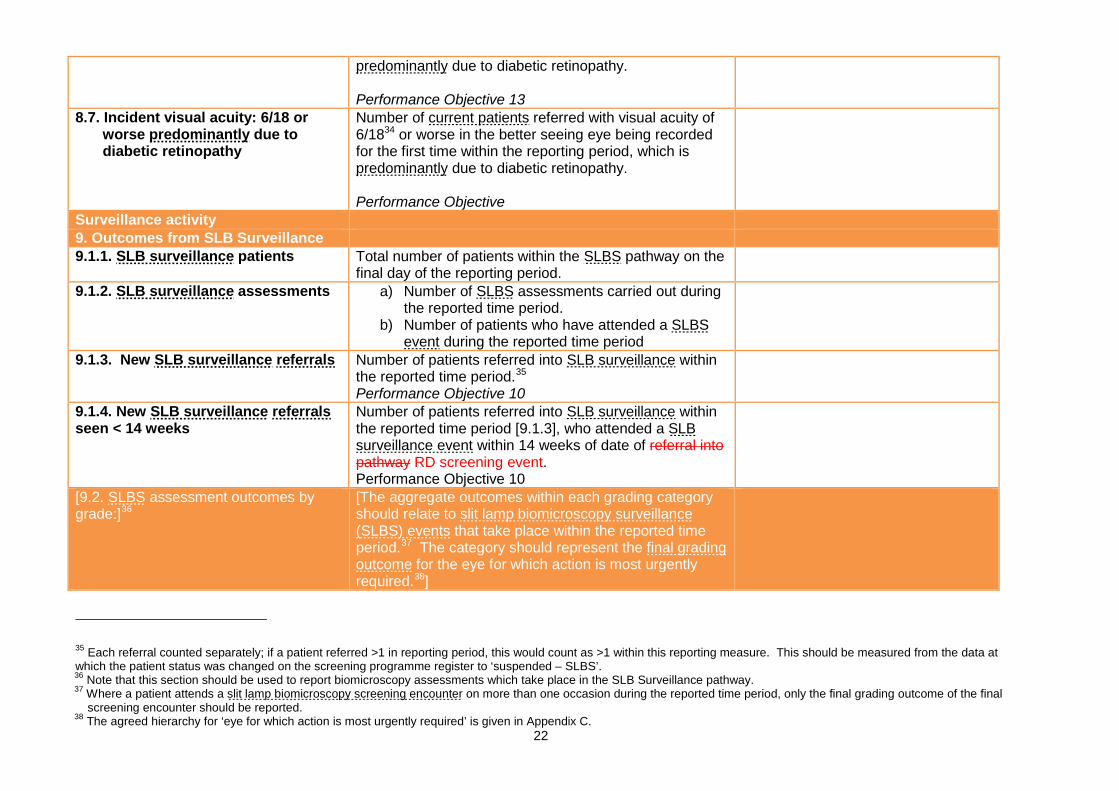
predominantly due to diabetic retinopathy. Performance Objective 13
8.7. Incident visual acuity: 6/18 or worse predominantly due to diabetic retinopathy
Number of current patients referred with visual acuity of 6/1834 or worse in the better seeing eye being recorded for the first time within the reporting period, which is predominantly due to diabetic retinopathy. Performance Objective
Surveillance activity 9. Outcomes from SLB Surveillance 9.1.1. SLB surveillance patients Total number of patients within the SLBS pathway on the
final day of the reporting period.
9.1.2. SLB surveillance assessments a) Number of SLBS assessments carried out during the reported time period.
b) Number of patients who have attended a SLBS event during the reported time period
9.1.3. New SLB surveillance referrals Number of patients referred into SLB surveillance within the reported time period.35 Performance Objective 10
9.1.4. New SLB surveillance referrals seen < 14 weeks
Number of patients referred into SLB surveillance within the reported time period [9.1.3], who attended a SLB surveillance event within 14 weeks of date of referral into pathway RD screening event. Performance Objective 10
[9.2. SLBS assessment outcomes by grade:]36
[The aggregate outcomes within each grading category should relate to slit lamp biomicroscopy surveillance (SLBS) events that take place within the reported time period.37 The category should represent the final grading outcome for the eye for which action is most urgently required.38]
35 Each referral counted separately; if a patient referred >1 in reporting period, this would count as >1 within this reporting measure. This should be measured from the data at which the patient status was changed on the screening programme register to ‘suspended – SLBS’. 36 Note that this section should be used to report biomicroscopy assessments which take place in the SLB Surveillance pathway. 37 Where a patient attends a slit lamp biomicroscopy screening encounter on more than one occasion during the reported time period, only the final grading outcome of the final
screening encounter should be reported. 38 The agreed hierarchy for ‘eye for which action is most urgently required’ is given in Appendix C.
22

9.2.1. Grade: R0M0 Number of patients, according to [9.2] above, with a final grading outcome of ‘R0 No retinopathy, M0 No maculopathy’.
9.2.2. Grade: R1M0 Number of patients, according to [9.2] above, with a final grading outcome of ‘R1 Background retinopathy, M0 No maculopathy’.
9.2.3. Grade: R1M1 Number of patients, according to [9.2] above, with a final grading outcome of ‘R1 Background retinopathy, M1 Maculopathy’.
9.2.4. Grade: R2M0 Number of patients, according to [9.2] above, with a final grading outcome of ‘R2 Pre-proliferative retinopathy, M0 No maculopathy’.
9.2.5. Grade: R2M1 Number of patients, according to [9.2] above, with a final grading outcome of ‘R2 Pre-proliferative retinopathy, M1 Maculopathy’.
9.2.6. Grade: R3SM0 Number of patients, according to [9.2] above, with a final grading outcome of ‘R3S - Stable Proliferative retinopathy, M0 No maculopathy’.
9.2.7. Grade: R3SM1 Number of patients, according to [9.2] above, with a final grading outcome of ‘R3S - Stable Proliferative retinopathy, M1 Maculopathy’.
9.2.8. Grade: R3AM0 Number of patients, according to [9.2] above, with a final grading outcome of ‘R3A - Active Proliferative retinopathy, M0 No maculopathy’.
9.2.9. Grade: R3AM1 Number of patients, according to [9.2] above, with a final grading outcome of ‘R3A - Active Proliferative retinopathy, M1 Maculopathy’.
9.2.10. Grade: U Number of patients, according to [9.2] above, deemed ungradable following biomicroscopy examination.
[9.3 SLBS Outcomes by Action] [This section should relate to patients for which completed actionable outcomes were assigned during the reported time period. Therefore this section will relate to some SLBS events that occurred outside of the reported time period.]
9.3. SLBS Outcomes by Action a) Number of patients retained in SLBS pathway, no referral to HES or DS required, patient not returned to RDS.
This section describes patient numbers into the various components of the screening service (RDS, HES, DS) during the reported time period and will be a
23

b) Number of patients retained in SLBS pathway for 6 month recall.
c) Number of patients retained in SLBS pathway for 12 month recall.
d) Number of patients returned to RDS annual recall within reported time period.
e) Number of patients referred to DS within reported time period
f) Number of routine DR referrals made to HES within reported time period.
g) Number of urgent DR referrals made to HES within reported time period.
h) Number of routine referrals made for non-DR lesions within reported time period39
i) Number of urgent referrals made for non-DR lesions within reported time period40
j) Number of patients excluded whilst in SLBS pathway within reported time period.
useful summary for commissioners.
10. Outcomes from Digital Surveillance (DS)41
10.1.1.. Digital surveillance patients Total number of patients within the DS pathway on the final day of the reported time period.
10.1.1.1. Digital surveillance patients by category
Total number of patients within the DS pathway on the final day of the reported time period [10.1.1] according to category:
a) Pregnant b) Maculopathy (R1M1, R2M1, R3SM1) c) Pre-proliferative, no maculopathy (R2M0) d) Stable proliferative (R3SM0) e) Other
10.1.2. Digital surveillance assessments
a) Number of DS assessments carried out during the reported time period.
b) Number of patients who have attended a DS
39 For further information on non-DR referrals please refer to the document ‘Operational Guidance for Feature Based Grading Forms in NHS Diabetic Eye Screening Programme’. 40 ibid 41 Note that this section should be used to report Digital Surveillance assessments which form part of the DESP screening process.
24

event during the reported time period. 10.1.3. New DS referrals Number of patients referred into DS within the reported
time period.42
10.1.3.1 New DS referrals by category Number of patients referred into DS within the reported time period [10.1.3] referred according to category:
a) Pregnant b) Maculopathy (R1M, R2M1, R3SM1) c) Pre-proliferative, no maculopathy (R2M0/R2M1) d) Stable proliferative R3 (R3SM0/R3sM1) e) Other
10.2. Digital surveillance assessment by grade:]
[The aggregate outcomes within each grading category should relate to DS screening encounters that take place within the reported time period. The category should represent the final grading outcome for the eye for which action is most urgently required.43]
10.2.1. Grade: R0M0 Number of patients, according to [10.2] above, with a final grading outcome of ‘R0 No retinopathy, M0 No maculopathy’.
10.2.2. Grade: R1M0 Number of patients, according to [10.2] above, with a final grading outcome of ‘R1 Background retinopathy, M0 No maculopathy’.
10.2.3. Grade: R1M1 Number of patients, according to [10.2] above, with a final grading outcome of ‘R1 Background retinopathy, M1 Maculopathy’.
10.2.4. Grade: R2M0 Number of patients, according to [10.2] above, with a final grading outcome of ‘R2 Pre-proliferative retinopathy, M0 No maculopathy’.
10.2.5. Grade: R2M1 Number of patients, according to [10.2] above, with a final grading outcome of ‘R2 Pre-proliferative retinopathy, M1 Maculopathy’.
10.2.6 Grade: R3SM0 Number of patients, according to [10.2] above, with a final grading outcome of ‘R3S - Stable Proliferative retinopathy, M0 No maculopathy’.
42 Each referral counted separately; if a patient referred >1 in reporting period, this would count as >1 within this reporting measure. This should be measured from the data at which the patient status was changed on the screening programme register to ‘suspended – DS’. 43 The agreed hierarchy for ‘eye for which action is most urgently required’ is given in Appendix C
25

10.2.7 Grade: R3SM1 Number of patients, according to [10.2] above, with a final grading outcome of ‘R3S - Stable Proliferative retinopathy, M1 Maculopathy’.
10.2.8. Grade: R3AM0 Number of patients, according to [10.2] above, with a final grading outcome of ‘R3A - Active Proliferative retinopathy, M0 No maculopathy’.
10.2.9 Grade: R3AM1 Number of patients, according to [10.2] above, with a final grading outcome of ‘R3A - Active Proliferative retinopathy, M1 Maculopathy’.
10.2.10. Grade: U Number of patients, according to [10.2] above, deemed ungradable following digital surveillance examination.
[10.3 DS Outcomes by Action] [This section should relate to patients for which completed actionable outcomes were assigned during the reported time period. Therefore this section will relate to some DS events that occurred outside of the reported time period.]
10.3. DS Outcomes by Action a) Number of patients retained in DS pathway, no referral to HES or SLBS required, patient not returned to RDS.
b) Number of patients retained in DS pathway for 1 month recall.
c) Number of patients retained in DS pathway for 2 month recall.
d) Number of patients retained in DS pathway for 3 month recall.
e) Number of patients retained in DS pathway for 4 month recall.
f) Number of patients retained in DS pathway for 5 month recall.
g) Number of patients retained in DS pathway for 6 month recall.
h) Number of patients retained in DS pathway for 7 month recall.
i) Number of patients retained in DS pathway for 8 month recall.
j) Number of patients retained in DS pathway for 9 month recall.
This section describes patient numbers into the various components of the screening service (RDS, HES, SLBS) during the reported time period and will be a useful summary for commissioners.
26

k) Number of patients retained in DS pathway for 10 month recall.
l) Number of patients retained in DS pathway for 11 month recall.
m) Number of patients retained in DS pathway for 12 month recall.
n) Number of patients returned to RDS annual recall within reported time period.
o) Number of patients referred to SLBS within reported time period
p) Number of routine DR referrals made to HES within reported time period.
q) Number of urgent DR referrals made to HES within reported time period.
r) Number of routine referrals made for non-DR lesions within reported time period44
s) Number of urgent referrals made for non-DR lesions within reported time period45
t) Number of patients excluded from the DS pathway within reported time period.
44 For further information on non-DR referrals please refer to the document ‘Operational Guidance for Feature Based Grading Forms in NHS Diabetic Eye Screening Programme’. 45 ibid
27
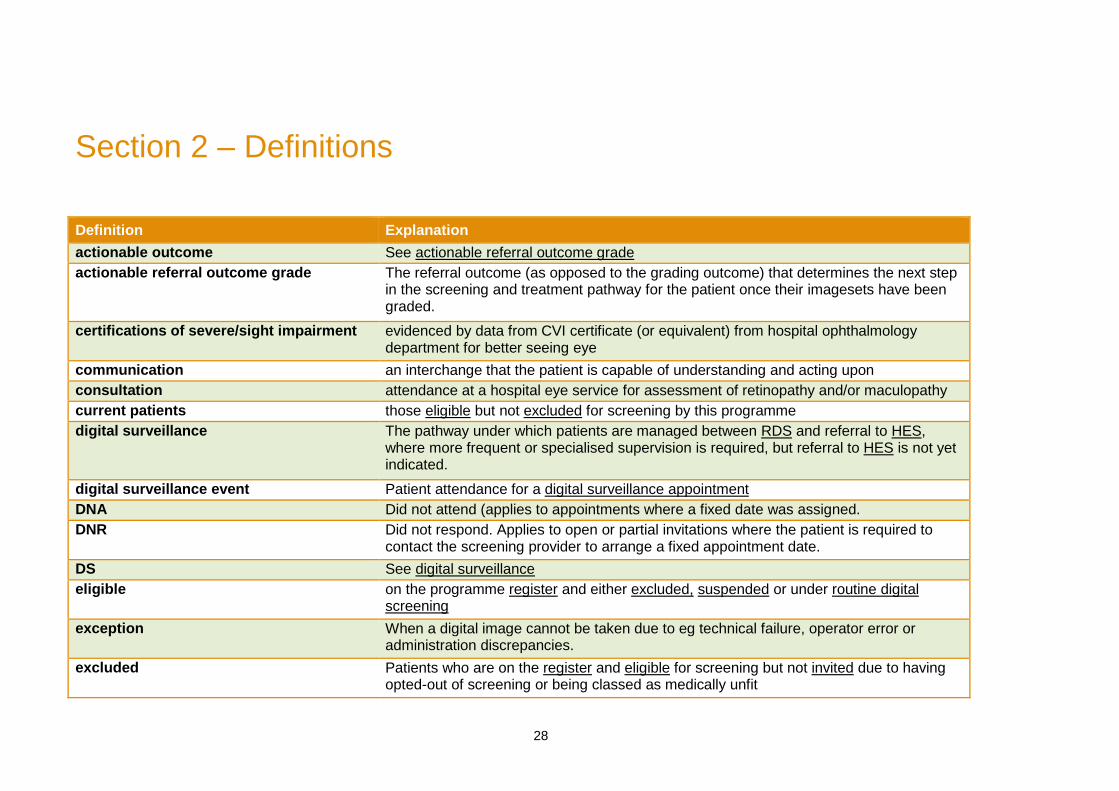
Section 2 – Definitions
Definition Explanation actionable outcome See actionable referral outcome grade actionable referral outcome grade The referral outcome (as opposed to the grading outcome) that determines the next step
in the screening and treatment pathway for the patient once their imagesets have been graded.
certifications of severe/sight impairment evidenced by data from CVI certificate (or equivalent) from hospital ophthalmology department for better seeing eye
communication an interchange that the patient is capable of understanding and acting upon consultation attendance at a hospital eye service for assessment of retinopathy and/or maculopathy current patients those eligible but not excluded for screening by this programme digital surveillance The pathway under which patients are managed between RDS and referral to HES,
where more frequent or specialised supervision is required, but referral to HES is not yet indicated.
digital surveillance event Patient attendance for a digital surveillance appointment DNA Did not attend (applies to appointments where a fixed date was assigned. DNR Did not respond. Applies to open or partial invitations where the patient is required to
contact the screening provider to arrange a fixed appointment date. DS See digital surveillance eligible on the programme register and either excluded, suspended or under routine digital
screening exception When a digital image cannot be taken due to eg technical failure, operator error or
administration discrepancies. excluded Patients who are on the register and eligible for screening but not invited due to having
opted-out of screening or being classed as medically unfit
28

final grading outcome following internal quality assurance procedures, the assessment of a level of diabetic retinopathy from the evidence as presented
first invitation when the patient has not been previously invited since being added to the screening programme register.
first laser treatment the date at which laser treatment for diabetic retinopathy was first carried out following listing
first RDS event when the patient has not previously attended a RDS event, since being added to the screening programme register
first screening See first RDS event first visit an appointment with a specialist directly resulting from a referral from a screening service
full grading a determination by a grader of the level of diabetic retinopathy HES Hospital Eye Service imageset the set of images which are captured for a single patient during screening. Usually, a
patient imageset consists of four images – one macular and one nasal for each eye. ineligible Patients who are on the register but are not eligible for screening due to having no
perception of light in both eyes. invitation See invited. Must be a realisable appointment within three months of invitation being sent
invited formal communication made by the screening service for a routine digital screening event to take place within the reported time period
listed the date at which a decision to treat by laser was recorded by the specialist off-register Patients who are not on the screening programme register due to being categorised as
either; deceased, moved out of area, not diabetic, under 12, seen in another programme or refused demographic transfer.
participation any GP practice with which eligible patients of this programme are registered positive test any disease outcome relating to diabetic retinopathy (ie presence of retinopathy and/or
maculopathy, or ungradeable predominantly ‘the major cause’, as determined by the ophthalmologist RDS See routine digital screening referred an appropriate referral request was made
register collated list of patients under this screening programme who are either eligible or ineligible for screening.
29

result letter notifications an appropriate indication to an entitled party (minimum of patient and patient's GP), being issued/printed of: a. the date at which the patient was screened b. the final outcome of grading the patient imagesets c. the action recommended
routine digital screening the first stage of the patient screening pathway where digital images are obtained, graded and a referral outcome is decided.
routine digital screening encounter patient attendance for RDS where images were obtained routine digital screening event see routine digital screening encounter SLBS See slit lamp biomicroscopy surveillance slit lamp biomicroscopy surveillance The pathway under which patients are managed following RDS, where patients for whom
adequate retinal examination cannot be obtained by retinal photography, are examined by SLB.
slit lamp biomicroscopy surveillance event
Patient attendance for a SLBS appointment
surveillance See digital surveillance and slit lamp biomicroscopy surveillance suspended Patients who are on the register and eligible for screening but not invited for RDS due to
receiving screening in either HES, DR or SLBS.
30

Appendices
Appendix A – Patient register
Please refer to ‘Diabetic Eye Screening Programme Cohort Management Overview’ document. Appendix B – Calculating ‘appointments due to take place within reported time period’ [3.2.b] when using open invitations
As each open invitation is generated, this will count as being due to take place 3 months (89 calendar days*) from the date generated, until one of the following occurs:
1) Patient contacts programme centre to make appointment appointment is now counted as due on the new appointment date
2) Patient DNR by 89 calendar days appointment continues to be counted as due to take place 89 calendar days from the date generated
*365 days per year, minus 8 public holidays equals 29.8 days per month, which approximates to 89 days in 3 months.
31

Appendix C - Hierarchy of grades with their inferred outcomes
Grade Inferred Outcome R3aM1 Urgent Refer - Treatable R3aM0 R3sM1
Refer - Treatable R2M1 R1M1 R2M0 Refer – Not Treatable U Refer – Further Investigation R3sM0
Not Referable R1M0 R0M0 Table C. Hierarchy of grades with their inferred outcomes. The agreed hierarchy for ‘eye for which action is most urgently required’ is R3aM1 > R3aM0 > R3sM1 > R2M1 > R1M1 > R2M0 > U > R3sM0 > R1M0 > R0M0
32

Appendix D - Referral Outcome Grader Performance Monitoring Report
All grade stages should have a calculated “inferred” outcome based on the table in Appendix A above. Thus if primary grade is R3M0, the inferred outcome is Urgent Referral. This will allow comparison based on outcomes for each patient as well as grade comparisons. This report should be generated for the annual report submission, but also be available to be run at any time covering a programme specified time period, for the purpose of resource planning. The following tables should be generated, for all ROG grades within the reported time period, for:
1. Each individual ROG grader, and: 2. Aggregated activity for all ROG graders in a single table
Inferred Outcomes Total Percentage of Total Not Referable A Ungradable B Referable not Treatable C Total Referable not Treatable B+C Referable Treatable D Urgent Referable E Total Referable D+E Table D.1. Total and percentage inferred outcomes of ROG ROG Actual Outcomes Total Percentage of Total Not Referred A Ungradable Referred SLB B Referred to Digital Surveillance
C
Total Referred Surveillance B+C Referred D Urgent Referred E Total Referred D+E Referred Other Non DR lesions
Urgent Referral for Non DR No of Patients Excluded Table D.2. Total and percentage actual outcomes of ROG
33

Appendix E - Revised Content in Grader Activity report and Arbitration reports
The following table should be generated relating to all full grading carried out within the reported time period showing activity for all graders, in the following formats:
1. Showing grader identification for internal programme use 2. Pseudonymised for DESP EQA use
A B C D E F G H J I Grader Id Grader status No Of
Sessions Imagesets Graded
Ave N per session
Max No Per Session
Ave time mins per Imageset
%U %Ref
%Agree With Final
X53 Primary 2567 137 4.2 X53 Secondary X217 ROG 459 5.3
Table E. Grader activity and arbitration table D= Number of imagesets full graded by each grader during the reported time period E= Average number of imagesets graded per grading session F= Maximum number of imagesets graded per grading session G= Average time taken to grade an imageset in minutes Arbitration report. This is already available in a number of softwares and is a table of agreement /disagreement between the grader and the arbitration grade stage and which is presented as a truth table with hyperlinked drill down so that cases of disagreement can be inspected to allow a detailed feedback to the grader of the actual cases involved. The report should be selectable to run from date to date and for an individual grader and grade stage.
34

Appendix F - Updated Inter Grader Agreement specifications
For general report sections 5.2, 5.3 [Please note the tables for sections 1.a, 2.a and 3.a have been replaced with a more comprehensive 3-section table, the requirement for the bar charts in sections 1.e, 1.f, 2.c, 2.d, 3.b and 3.c has been removed, and where relevant all tables have been updated to reflect the new R3a/R3s grade.] National grading protocols advise that most imagesets (all those with any disease and at least 10% of those with no disease) should be examined by at least two independent graders, neither having knowledge of the grade suggested by the other. Where programmes are of sufficient size (over 12,000 people with diabetes), it is therefore possible to gain some understanding of grader performance by comparing full grading outcomes across graders who have examined the same images. A high level of agreement will indicate that graders are working consistently, whereas large numbers of discrepancies could indicate a problem with the performance or training of a particular grader. In time, providing programmes are using software that records comparable data based on the Diabetic Retinopathy Screening Dataset (supplemented by the Quality Assurance Standards and Performance Objectives and the related definitions and explanatory notes), it will be possible to compare local inter-grader performance with national trends. It is important to recognise that inter-grader agreement is a measure of consistency of grading but not necessarily of objective high standard. In order to ensure a consistently high standard of grading, it is necessary to supplement this method with standardised accreditation (for all of the workforce in every programme) and external quality assurance using gold-standard test imagesets and expert assessment. Explanation Inter-grader agreement is measured on patient imagesets which have been seen by the grader being evaluated and at least one other grader. Imagesets graded anything other than R0 should be examined by at least two graders, as should at least 10% of imagesets graded R0. The tables below show only imagesets for which a final grading outcome has been determined and relates to screening episodes (as opposed to grading completion) which occurred during the reporting period. A grading outcome may relate to a first full grade or second full grade by the grader in question. Report format For ease of analysis, it is required that the inter-grader agreement report be exportable either directly to EARS or to Microsoft Excel in the format specified below. An option should be provided to identify each grader for internal quality assurance and where possible each grader listed in section 5.1 should be included, with the same grader ID.
35

The row and column content/formats in the configuration specified above must be used. One worksheet (Excel) or section (EARS) should be used per grading type (in the order: primary, secondary and arbitration). Where Excel is used directly (for programmes using any other type of software) the tables above must be produced twice – once including the percentage rows and once excluding them, as per the attachment below. EARS must allow the column and row headers and the numbers (not the percentages) to be either exported to Excel, (and for the worksheet to contain no merged cells and one header row as specified).
A) Report summary The required grading accuracy and inter-grader agreement outputs for sections 5.2 and 5.3 of the annual reports are summarised below, and are best produced as either a pdf or Word document.
1. For graders performing primary grading, relating only to those imagesets they have primary graded: a. One table (that is exportable to Excel, with the row and column content/formats in the configuration specified in B.1. below) per
pseudo-anonymised grader showing a breakdown of primary grades (in RxMx format), with percentage of each grade and totals of both numbers and percentages.
b. One agreement table per pseudo-anonymised grader showing the level of agreement between the primary grader and the final grade, including total agreements, proportion agreements and Cohen’s Kappa.
c. One two-way table per pseudo-anonymised grader displaying, for the worst eye, agreement between their primary retinopathy grade and the final retinopathy grade, total number of agreements and Cohen’s Kappa.
d. One two-way table per pseudo-anonymised grader displaying, for the worst eye, agreement between their primary maculopathy grade and the final maculopathy grade, total number of agreements and Cohen’s Kappa.
2. For graders performing secondary grading, relating only to those imagesets they have secondary graded: a. One table (that is exportable to Excel, with the row and column content/formats in the configuration specified in B.1. below) per
pseudo-anonymised grader showing a breakdown of secondary grades (in RxMx format), with percentage of each grade and totals of both numbers and percentages.
b. One agreement table per pseudo-anonymised grader showing the level of agreement between the secondary grader and the final grade, including total agreements, proportion agreements and Cohen’s Kappa.
3. For graders performing arbitration grading, relating only to those imagesets they have arbitrated: a. One table (that is exportable to Excel, with the row and column content/formats in the configuration specified in B.1. below) per
pseudo-anonymised grader showing a breakdown of arbitration grades (in RxMx format), with percentage of each grade and totals of both numbers and percentages.
36

4. An additional table should be provided in the annual report of worst R value and worst M value per eye. Plus % ie Retinopathy per eye at final grade
R0 R1 R3S R2 R3A M0 M1 U Total N % Table F.1.
37

B) Report description and examples: Required formats and examples of data for each output described are:
Table a.: Summary of grader results Summary Table of all graders (Section 1) ID Level Sets
Graded U R0 R1M0 R3sM0 R1M1 R3sM1 R2M0 R2M1 R3aM0 R3aM1
12 Primary K1 A B C D E F G H I J % A / K1% B / X% C / X% D / X% E / X% F / X% G / X% H / X% I / X% J / X% 13 Primary K2 % 26 Primary K3 % 13 Secondary K4 % 26 Secondary % 26 Arbitration % 205 Arbitration % etc Kn = SUM (An:Jn) X = All Assessable SUM( B:J) Summary Table of all Graders (section 2) ID Level Unassessable Any DR Referable Referable Fast Track Fast Track Maculopathy
38

R3a R3a of
all sets graded
Of assessable image sets
of assessable image sets
of assessable image sets with DR
of assessable image sets
of assessable image sets with DR
of assessable image sets with DR
12 Primary L M N O P Q R 13 Primary 26 Primary 13 Secondary 26 Secondary 26 Arbitration 205 Arbitration Cell Calculations Ln = An / SUM (An:Jn) Mn = SUM(Cn:Jn) / SUM(Bn:Jn) Nn = Mn = SUM(En:Jn) / SUM(Bn:Jn) On = SUM(En:Jn) / SUM(Cn:Jn) Pn = (In+Jn) / SUM(Bn:Jn) Qn = (In+Jn) / SUM(Cn:Jn) Rn = (E+F+H+J) / SUM(Cn:Jn) Summary Table All Graders Section 3 Grader identifier
Level of grading
Cohen's Kappa statistic vs final grade over 8 grading outcomes
Cohen's Kappa statistic vs final grade over R grades
Cohen's Kappa statistic vs final grades over M grades
12 Primary From 2 way
tables all grades
From 2 way table retinopathy
From 2 way table maculopathy
34 Primary S T U 39

56 Primary 12 Secondary 56 Secondary 36 Arbitration 56 Arbitration Calculating proportion graded imagesets with any DR: This calculation is modified in this release by the addition of new R3A/S Grade Any Retinopathy = (R1M0+R3SM0 + R1M1 +R3SM1+ R2M0 + R2M1 + R3AM0 + R3AM1) Proportion with any DR = (Any Retinopathy / R0 + Any Retinopathy)*100
40

Table b:
Comments for table b: Updates to this version: Table b is replaced in this release by a larger table accommodating new R3A/S Grades and removing “Other”
As before the table is accompanied by cells reporting the kappa values and confidence intervals
Total agreement: 656/857 Proportion agreement: 76.50%
Cohen's Kappa:
0.603
Confidence interval: 0.47 to 0.71
Primary
Arbitration grader >> R0M0 R1M0 R3sM0 R1M1 R3sM1 R2M0 R2M1 R3AM0 R3AM1 U Total
R0M0 254 87 0 2 0 0 1 6 0 0 350 R1M0 24 369 1 4 0 2 0 0 0 0 400 R3sM0 0 0 0 0 0 0 0 0 0 0 0 R1M1 0 16 0 8 0 1 0 1 0 0 26 R3sM1 1 2 2 0 0 3 1 0 0 0 9 R2M0 1 16 0 1 0 4 0 0 0 0 22 R2M1 0 0 0 0 0 0 0 0 0 0 0 R3AM0 1 14 0 0 0 0 1 21 0 0 37 R3AM1 1 3 0 0 0 0 0 0 0 0 4 U 9 0 0 0 0 0 0 0 0 0 9 Total 291 507 3 15 0 10 3 28 0 0 857
41

Description: This report shows the level of agreement between a Grader (could be primary or secondary or arbitration), and the final grade. The ‘final’ grade can be at either Secondary, Arbitration or ROG grading, as appropriate. Where the ROG grader doubles as the arbitration grader the system should not take account of that grade stage in these tables. The grading recorded by the Primary Grader is shown along the top (the horizontal X axis) and the final grade is shown on the left (the vertical Y axis). The name of the Primary Grader is not shown, and a pseudo-anonymised grader number (eg Grader1) is shown instead. Where the numbers appear, this shows the intersection between the Primary Grader, and the final grade. In the example above the Primary Grader allocated R0 to 291 imagesets, 254 of which had a final grade of R0, hence agreed. Of those allocated to R0 by the Primary Grader which did not get a final grade of R0, 24 were allocated R1M0, 1 to R2M0, 1 to R3SM1,1 to R3AM0, 1 to R3AM1, and 9 were unassessable
• The areas highlighted in blue are where the Primary Grader final has recorded a more serious level of pathology than the final grade • The areas highlighted in red are where the Primary Grader final has recorded a level of pathology lower than the final grade; and • The areas highlighted in green are where the Primary Grader and the final grade agree
If there was perfect agreement between the Primary Grader and the final grade, then all the numbers would be on the diagonal (green background). A summary count of the total ratio of agreement (Total agreement) is given, and this expressed as a percentage (Proportion agreement). Row and column counts and totals are also included in the grid. Also included in the report above is a value for Cohen’s Kappa. This is a weighted value for the agreement between the grader and the final grade, and is primarily useful in aiding statistical analysis at a national level. (A value of 0 (zero) would imply that the data agreed no better than if the grader allocated grades at random, and a value of 1 implies that there is perfect agreement. Higher values imply better agreement, values above 0.8 may be considered to be excellent, but the value cannot be considered in isolation, and a value of 0.8 would not indicate good performance if all the disagreements are where the grader allocates a non referable level and the final grader is R3)
42

Table c: for those photosets where primary grading is regradedGrader A→
Final Grade ↓ R0 R1 R3s R2 U other TotalR0 84 10 6 8 5 0 113R1 8 594 0 5 16 5 628R3s 0 18 6 3 21 3 51R2 2 31 17 48 20 0 118U 0 9 0 0 16 1 26other other 4 0 0 7 0 0 11 Cohen's Kappa 0.xxx weighted kappa 0.tt95% CI (0.zzz to 0.yyy) 95% CI (0.zzz to 0.yyy) Updates to this version: Table c is replaced in this release by a larger table accommodating new R3A/S Grades Cell R3S is inserted between R1 and R2 in both rows and columns The column and row for “Other “is removed The intersecting cells are colour formatted as above:-
• where a non referable is overgraded to referable the intersect colour is blue • Where a referable is undergraded the intersect colour is pink
As before the table is accompanied by cells reporting the kappa values and confidence intervals
43

Table d:
Grader A→Final Grade ↓ M0 M1 U TotalM0 613 73 45 731M1 55 99 17 171U 2 7 16 25other 11 0 0 11Total 681 179 78 938 Cohen's Kappa 0.xxx weighted kappa 0.tt95% CI (0.zzz to 0.yyy) 95% CI (0.zzz to 0.yyy) Updates to this version: In this table the Row “Other” is no longer required.
44

C) Report calculations: This section illustrates the Kappa calculation for Modified Table b The first part of the table here shows the cell references (blue) and the second part has some example actual values (green) – these are used in the illustrative calculation (grey) below to show how the Kappa value is derived. The same calculation method is used for tables c and d The three tables in this appendix should be available to be run between given dates for the programme. In providing the annual report the summary table in appendix F should be used to show the three Kappa values from this section. Grader grade® Grader 34 CALC S for summary
table Unassessable R0 R1M0 R1M1 R2M0 R2M1 R3sM0 R3sM1 R3aM0 R3aM1
Final grade¯
Unassessable n11 n12 n13 n14 n15 n16 n17 n18 n19 n20 T1
R0 n21 n22 n23 n24 n25 n26 n27 n28 n29 n30 T2 R1M0 n31 n32 n33 n34 n35 n36 n37 n38 n39 n40 T3 R1M1 n41 n42 n43 n44 n45 n46 n47 n48 n49 n50 T4 R2M0 n51 n52 n53 n54 n55 n56 n57 n58 n59 n60 T5 R2M1 n61 n62 n63 n64 n65 n66 n67 n68 n69 n70 T6 R3sM0 n71 n72 n73 n74 n75 n76 n77 n78 n79 n80 T7 R3sM1 n81 n82 n83 n84 n85 n86 n87 n88 n89 n90 T8 R3aM0 n91 n92 n93 n94 n95 n96 n97 n98 n99 n100 T9 R3aM1 n101 n102 n103 n104 n105 n106 n107 n108 n109 n110 T10 V1 V2 V3 V4 V5 V6 V7 V8 V9 V10 Total
45

Grader grade® Grader 34 example values
Calc Cell S Value
Unassessable R0 R1M0 R1M1 R2M0 R2M1 R3sM0 R3sM1 R3aM0 R3aM1
Final grade¯ Unassessable 30 0 0 0 0 0 0 0 0 0 30
R0 0 10 0 0 0 0 0 0 0 0 10 R1M0 0 0 52 0 0 0 0 0 0 0 52 R1M1 0 0 0 520 0 0 0 0 0 0 520 R2M0 0 0 0 0 98 0 0 0 0 0 98 R2M1 0 0 0 0 0 1 0 0 0 0 1 R3sM0 0 0 0 0 0 0 1 0 0 0 1 R3sM1 0 0 0 0 0 0 0 8 0 0 8 R3aM0 0 0 0 0 0 0 0 0 3 0 3 R3aM1 0 0 0 0 0 0 0 0 0 5 5 30 10 52 520 98 1 1 8 3 5 728
46

to calculate Cohen's kappa need proportion of agreements number of image sets that agree n11+n22+n33+n44+n55+n66+n77+n88+n99+n110
Proportion that agree (n11+n22+n33+n44+n55+n66+n77+n88+n99+n110)/Total
Expected agreements T1*V1/(total*total)+ 0.001698164
T2*V2/(total*total)+ 0.000188685
T3*V3/(total*total)+ 0.005102041
T4*V4/(total*total)+ 0.510204082
T5*V5/(total*total)+ 0.018121302
T6*V6/(total*total)+ 1.88685E-06
T7*V7/(total*total)+ 1.88685E-06
T8*V8/(total*total)+ 0.000120758
T9*V9/(total*total)+ 1.69816E-05
T10*V10/(total*total) 4.71712E-05
Expected total proportion agreements sum of above 0.535502959
Proportion agreements SUM(B19,C20,D21,E22,F23,G24,H25,I26,J27,K28)/L29 1 (sum diagonals/total)
(proportion that agree-expected agreements)/ 0.464497041
(1-expected agreements) 0.464497041
47

Kappa = propn that agree-expected/1-expected = 0.464/0.464 1
Kappa values from the table All retinopathy = Value S Kappa values from the table R Values = Value T Kappa values from the table M Values = Value U These values are transferred to the summary report of grader performance in appendix F
48

Appendix G - Grading Queue Ageing report
This report is intended to be used by programmes to help them manage their grading queues, and will not be required as part of the annual report submission. The report should present number of image sets within each grading queue, categorised by the length of time the imagesets have been awaiting grading at each level from the date of screening event. Each number should have hyperlinked drill-down to see the details of each patient represented within the report. This report should be produced separately for both routine digital screen image sets and digital surveillance image sets. An example table is shown below: Table G Name of DESP:
Date of report: Monday, 23rd April
Grading Queue
0-2 days*
3-5 days*
6-10 days*
11-14 days*
16 - 21 days*
22-28 days*
29 + days* Totals
Primary 35 19 11 7 5 0 1 78 Secondary 3 15 22 9 3 7 0 59 Arbitration 0 8 15 7 3 1 0 34 ROG 6 2 1 0 0 0 0 9 Totals 44 44 49 23 11 8 1 180
*Days indicate days since date of photography - show total time within grading process.
Additional functionality would allow drill down within any box to show patients who are within each queue and timeframe.
49

Appendix H – DS appointment ageing report
This report is intended to be used by programmes to help them manage their surveillance pathway queues, and will not be required as part of the annual report submission. The report should present, in percentage format, the days past which attendance at SLBS or DS was scheduled to take place. This will apply to patients who are already under the SLBS or DS pathway and therefore have attended at least one DS or SLBS encounter and been assigned an outcome from that assessment (eg DS review in 3 months). This report should not include patients who have been assigned an outcome of ‘refer back to routine digital screening’ as these patients will no longer form part of the surveillance pathways. In all cases the start point (scheduled recall date) will be outcome assigned from DS or SLBS, and the end point will be patient attendance at assigned outcome. Numerator = at the date the report is run, the total number of days past the scheduled recall date Denominator = days between previous surveillance event and scheduled recall date Each number should have hyperlinked drill-down to see the details of each patient represented within the report. An example table is shown below: Table H Name of DESP - Surveillance Ageing Report
Date of report: Monday, 23rd April Surveilliance
pathway 0-75%
76-100%
101-125%
126-150%
151-200% 200+% Totals
SLB 20 10 10 5 0 5 50 OPDR 15 20 10 5 5 0 55 Totals 35 30 20 10 5 5 105
50