
PROGRAMME OF ACTIVITIES DESIGN DOCUMENT (PoA-DD) · 2016-09-04 · Version 02.0 PROGRAMME OF...
73
UNFCCC/CCNUCC CDM – Executive Board Page 1 PROGRAMME DESIGN DOCUMENT FORM FOR SMALL-SCALE CDM PROGRAMMES OF ACTIVITIES (F-CDM-SSC-PoA-DD) Version 02.0 PROGRAMME OF ACTIVITIES DESIGN DOCUMENT (PoA-DD) PART I. Programme of activities (PoA) SECTION A. General description of PoA A.1. Title of the PoA >> Small Hydropower Programme of Activities in Armenia Version 03 25/12/2012 A.2. Purpose and general description of the PoA >>The proposed CDM programme of activities “Small Hydro Power Programme of Activities in Armenia” (hereafter referred to as “the PoA”) is a programme for the installation of hydro power projects in Armenia. The purpose of the PoA is to use carbon finance for small hydropower projects in Armenia. The PoA has been supported by EBRD through financing Technical Assistance for the set up of the PoA in the frame of the ArmSEFF program (the Armenian Sustainable Energy Finance Facility for industrial energy efficiency and renewable energy projects) in order to enable, simplify and support development of SHPP projects in Armenia. The PoA consists of individual component project activities (CPAs) which will construct small hydro power plants (SHPP) within the boundaries of Armenia to generate electricity from the hydro energy and supply the electricity to the Armenian electricity grid. The PoA will comprise the CPAs that install new small hydro power plants at a site where no renewable power plants have been operated prior to the implementation of the project activity (greenfield plants); This PoA will include: (i) small-scale run-of-river hydropower plants, and (ii) small-scale hydropower plants with reservoirs. Each small-scale CPA under this PoA will comprise one or more such hydropower plants and have a combined installed capacity of no more than 15 MW, the threshold for small-scale renewable energy CDM projects. The PoA, through its successful implementation, will serve as a model for investors, authorities and public and will result in perception changes that are critical to expanding the use of small hydro power in Armenia. Further, the establishment of a market for investing in small hydro power projects will significantly impact building of capacity to manufacture system components domestically and lead to value creation and availability of green job opportunities in the region. The PoA aims to develop a platform for overcoming institutional, financial and structural hurdles for the construction of small hydropower projects. In this way the PoA will promote the development of renewable energy and facilitate the abatement of greenhouse gas emissions through replacement of fossil fuel based electricity in Armenia.
Transcript of PROGRAMME OF ACTIVITIES DESIGN DOCUMENT (PoA-DD) · 2016-09-04 · Version 02.0 PROGRAMME OF...
UNFCCC/CCNUCC CDM – Executive Board Page 1
PROGRAMME DESIGN DOCUMENT FORM FOR SMALL-SCALE CDM PROGRAMMES OF ACTIVITIES (F-CDM-SSC-PoA-DD)
Version 02.0
PROGRAMME OF ACTIVITIES DESIGN DOCUMENT (PoA-DD)
PART I. Programme of activities (PoA)
SECTION A. General description of PoA A.1. Title of the PoA >> Small Hydropower Programme of Activities in Armenia Version 03 25/12/2012 A.2. Purpose and general description of the PoA >>The proposed CDM programme of activities “Small Hydro Power Programme of Activities in Armenia” (hereafter referred to as “the PoA”) is a programme for the installation of hydro power projects in Armenia. The purpose of the PoA is to use carbon finance for small hydropower projects in Armenia. The PoA has been supported by EBRD through financing Technical Assistance for the set up of the PoA in the frame of the ArmSEFF program (the Armenian Sustainable Energy Finance Facility for industrial energy efficiency and renewable energy projects) in order to enable, simplify and support development of SHPP projects in Armenia. The PoA consists of individual component project activities (CPAs) which will construct small hydro power plants (SHPP) within the boundaries of Armenia to generate electricity from the hydro energy and supply the electricity to the Armenian electricity grid. The PoA will comprise the CPAs that
install new small hydro power plants at a site where no renewable power plants have been operated prior to the implementation of the project activity (greenfield plants);
This PoA will include:
(i) small-scale run-of-river hydropower plants, and (ii) small-scale hydropower plants with reservoirs.
Each small-scale CPA under this PoA will comprise one or more such hydropower plants and have a combined installed capacity of no more than 15 MW, the threshold for small-scale renewable energy CDM projects. The PoA, through its successful implementation, will serve as a model for investors, authorities and public and will result in perception changes that are critical to expanding the use of small hydro power in Armenia. Further, the establishment of a market for investing in small hydro power projects will significantly impact building of capacity to manufacture system components domestically and lead to value creation and availability of green job opportunities in the region. The PoA aims to develop a platform for overcoming institutional, financial and structural hurdles for the construction of small hydropower projects. In this way the PoA will promote the development of renewable energy and facilitate the abatement of greenhouse gas emissions through replacement of fossil fuel based electricity in Armenia.

UNFCCC/CCNUCC CDM – Executive Board Page 2 The PoA is expected to contribute to sustainable development in the following manner, which are – among others - also required by the Armenian DNA as project approval criteria for CDM projects1: Environmental benefits - Improvement of air and water quality through increased use of renewable energy; - Efficient utilization of natural resources; - Biodiversity protection as a major part of the EIA process. Economical benefits - The PoA will promote sustainable development in Armenia by promoting investment and thereby
improving the local economies; - The PoA will generate demand for local products when spare parts are needed, leading to promotion
of business activities; - The PoA will support the transfer of green, sustainable and up-to-date technology and technical
know-how to the host country - New infrastructure will contribute to economic growth, improve standard of life of the local people
and poverty alleviation; Social criteria - The PoA will increase employment opportunities in Armenia and increase the share of green jobs in
the regions; - The PoA will help to further develop local capacities - Full respect of stakeholders’ participation will be kept in the CPAs linked to this PoA Confirmation that the proposed PoA is a voluntary action by the coordinating/managing entity The PoA is a voluntary action taken by the CME. CME is not in any way enforced to accomplish its objectives. A.3. CMEs and participants of PoA >> Coordinating/Managing Entity (CME) of this PoA is Energy Changes Projektentwicklung GmbH. CME will have the following responsibilities with respect to the implementation of the proposed PoA:
- Identifying the CPAs and evaluating their eligibility - Creating PoA documentation (the CDM-PoA-DD and CDM-CPA-DD) - Obtaining a Letter of Authorization from the host country - Obtaining a Letter of Approval from the host country and the Annex I Party involved - Communicating with and providing assistance and trainings for the CPAs implementers - Coordinating the monitoring activities and managing the data - Drafting monitoring reports for all CPAs in accordance with the methodology outlined in the PoA
DD - Coordinating and communicating with the validator, verifier and the CDM Executive Board - Requesting the UNFCCC to issue CERs
CME will enter into contractual agreements with the individual owner(s) of the small hydro power plants(s) at the time of inclusion of CPA under the PoA2. The overall structure of the proposed scheme is given in Figure 1 below:
1 http://www.nature-ic.am/en/Projects_Approval_Criteria 2 As per „Standard for demonstration of additionality, development of eligibility criteria and application of multiple
methodologies for programme of activities, Version 01.0 (EB 65, Annex 3), paragraph 19, the time of CPA inclusion under the PoA is specified as follows: The CPAs shall be included in the PoA on the basis that the DOE has confirmed the eligibility of CPAs.

UNFCCC/CCNUCC CDM – Executive Board Page 3 Figure 1: Structure of the proposed Programme of Activities
CPA implementers who will operate CPAs under the PoA may be private or public sector entities. Ownership of each CPA will be defined at the CPA level and contractual agreements of CPA implementers with CME will be in place before inclusion of the respective CPA. A.4. Party(ies)
Name of Party involved (host) indicates a host Party
Private and/or public entity(ies) project participants
(as applicable)
Indicate if the Party involved wishes to be considered as
project participant (Yes/No)
Armenia (host) Energy Changes Projektentwicklung GmbH
No
A.5. Physical/ Geographical boundary of the PoA >> The geographical boundary of the PoA extends up to the physical boundaries of Armenia.
A.6. Technologies/measures >> The proposed PoA is a small scale CDM project activity, and falls under: Type I. - Renewable energy projects
CPA PoA
COORDINATING / MANAGING ENTITY
CPA 1 - SHPP CPA implementer
CPA 2 - SHPP CPA implementer
.
.
.
CPA n - SHPP CPA implementer

UNFCCC/CCNUCC CDM – Executive Board Page 4 Scale Small scale
(under 15 MW of installed capacity) Applicable methodology AMS-I.D. Grid connected renewable electricity generation Version 17.0, (EB 61) Technology/measure 1. Installing a new renewable energy power plant at a site where no
renewable power plant was operated prior to the implementation of the project activity (greenfield plant),
2. New renewable power plant will be supplying electricity to a national or a regional grid
3. New renewable power plant will be run-of-river small hydro power plant and/or small hydro power plant with reservoir
4. If small hydro power plants with reservoirs then • implemented in an existing reservoir with no change in the
volume of the reservoir; • or implemented in an existing reservoir, where the volume of
reservoir is increased and the power density of the project activity, as per definitions given in the project emissions section of the applied methodology, is greater than 4 W/m2;
• or implementing new reservoir and the power density of the power plant, as per definitions given in the project emissions section of the applied methodology, is greater than 4 W/m2
A.7. Public funding of PoA
>> There is no public funding from an Annex I country involved in the proposed PoA.

UNFCCC/CCNUCC CDM – Executive Board Page 5
SECTION B. Demonstration of additionality and development of eligibility criteria B.1. Demonstration of additionality for PoA >> The following is demonstrated in this section:
(i) The proposed PoA is a voluntary coordinated action; The implementation of hydro power projects or any renewable power projects is not mandatory in Armenia. No obligation exists for any entity to develop a PoA in Armenia, either. The proposed PoA is a voluntary initiative conceived by Energy Changes Projektentwicklung GmbH in order to stimulate sustainable development through renewable energy utilization in Armenia. The PoA has been supported by EBRD through financing Technical Assistance for the set up of the PoA in the frame of the ArmSEFF program (the Armenian Sustainable Energy Finance Facility for industrial energy efficiency and renewable energy projects) in order to enable, simplify and support the small hydro power development in Armenia. The proposed PoA can therefore be regarded as a voluntary coordinated action.
(ii) If the PoA is implementing a voluntary coordinated action, it would not be implemented in the absence of the PoA;
According to the PoA Standard, Paragraph 7, the additionality shall be demonstrated by establishing that in the absence of CDM, none of the implemented CPAs would occur. The “Clarifications Regarding the Procedures for Registration of a Programme of Activities as a Single CDM Project Activity And Issuance of Certified Emission Reductions for a Programme Of Activities”, (EB 60 Annex 26) 3 , clarifies that a full additionality assessment is not required in the context of component project activities, rather the confirmation of additionality for CPAs should be conducted by means of the eligibility criteria. Therefore each small scale CPA included under the proposed PoA shall clearly demonstrate its additionality by means of eligibility criteria which are derived from Attachment A to Appendix B of the simplified modalities and procedures for small scale CDM project activities, Version 08 (EB 63, Annex 24)4, “Project participants shall provide an explanation to show that the project activity would not have occurred anyway due to at least one of the following barriers:
(a) Investment barrier: a financially more viable alternative to the project activity would have led to higher emissions;
(b) Technological barrier: a less technologically advanced alternative to the project activity involves lower risks due to the performance uncertainty or low market share of the new technology adopted for the project activity and so would have led to higher emissions;
(c) Barrier due to prevailing practice: prevailing practice or existing regulatory or policy requirements would have led to implementation of a technology with higher emissions;
(d) Other barriers: without the project activity, for another specific reason identified by the project participant, such as institutional barriers or limited information, managerial resources, organizational capacity, financial resources, or capacity to absorb new technologies, emissions would have been higher.”
Furthermore, the following documents are considered for further guidance and guidelines: (a) “Non-binding best practice examples to demonstrate additionality for SSC project activities” (EB 35, Annex 34)5, (b) General Guidelines for SSC CDM Methodologies, EB 66, Annex 23, Version 18.06(c) “Guidelines for demonstrating additionality of microscale project activities”, currently Version 03 (EB 63, Annex 23)7
3http://cdm.unfccc.int/Reference/Guidclarif/PoA/poa_guid06.pdf 4 http://cdm.unfccc.int/Reference/Guidclarif/ssc/methSSC_guid05.pdf 5 http://cdm.unfccc.int/EB/035/eb35_repan34.pdf

UNFCCC/CCNUCC CDM – Executive Board Page 6 Additionally in the case investment barrier is chosen to determine the eligibility criterion the relevant sections of the following tool and guideline shall be taken into account: (c) „Tool for the demonstration and assessment of additionality“ Version 06 (EB 65, Annex 21)8 (d) “Guidelines on the assessment of investment analysis” Version 05 (EB 62, Annex 05)9 Additionality has to be proven by each CPA through one of the following paths, using the above stipulated guidelines and regulations in order to be eligible for being included in the PoA:
- In case of microscale projects smaller than 5MW: by means of eligibility criteria derived from the “Guidelines for demonstrating additionality of microscale project activities”
If the CPA is a small scale project activity, the attachment A of Appendix B of the “Simplified modalities and procedures for small-scale CDM project activities” shall be applied. Only those projects which meet the eligibility criteria for additionality can be included in the PoA. Thus, by demonstrating the additionality of each CPA included in the PoA it is established that in the absence of the CDM PoA, none of the CPAs included in the PoA would be implemented.
(iii) If the PoA is implementing a mandatory policy/regulation, this would/is not enforced; The implementation of small hydro power technology is not mandatory in Armenia. The proposed PoA is a voluntary action.
(iv) If mandatory a policy/regulation is enforced, the PoA will lead to a greater level of
enforcement of the existing mandatory policy/regulation. The implementation of small hydro power technology is not mandatory in Armenia. The proposed PoA is a voluntary action.
As it is demonstrated above, the GHG emissions reduction through the replacement of grid electricity through generation of electricity from hydro power is not mandatory in Armenia and would not be implemented as part of the policy/regulation enforcement and each CPA included in the PoA will demonstrate its additionality. Thus it is demonstrated that the proposed PoA is additional. B.2. Eligibility criteria for inclusion of a CPA in the PoA >> The eligibility criteria for inclusion of a CPA in the PoA are based on the requirements of the “Standard for demonstration of additionality, development of eligibility criteria and application of multiples methodologies for programme of activities”, Version 01.0 (EB 65)10; further on referred to as “PoA Standard”. By using this PoA Standard it is demonstrated that all the CPAs that are in compliance with the additionality-related eligibility criteria set below will ensure that all the relevant additionality-related guideline, tools or any requirements embedded in the methodologies are met. A CPA is eligible for inclusion under the PoA, provided that the CPA fulfils the following criteria, demonstrated through the listed evidences for each eligibility criteria, as follows: Eligibility criterion: Demonstration of criteria usability to assess the
CPA inclusion:
6
http://cdm.unfccc.int/filestorage/C/R/L/CRL8TYAOPD3HJXWK5G90ES6Q7BNUIZ/eb66_repan23.pdf?t=QXp8bTNyOWNjfDCadYXc_hmTSeQ8u55EXWUJ
7http://cdm.unfccc.int/filestorage/W/V/I/WVI3RN692YMCGLZT40QXBOUA8H5KFP/eb63_repan23.pdf?t=alB8bTB4NTlifDAWgEvM1uR11OyTp5RT7Vdy
8 http://cdm.unfccc.int/methodologies/PAmethodologies/tools/am-tool-01-v6.0.0.pdf/history_view 9 http://cdm.unfccc.int/Reference/Guidclarif/reg/reg_guid03.pdf 10 http://cdm.unfccc.int/Reference/Standards/meth/meth_stan04.pdf

UNFCCC/CCNUCC CDM – Executive Board Page 7 (a) The geographical boundary of the CPA
including any time-induced boundary11 is consistent with the geographical boundary set in the PoA
Only the CPA installed within the boundary of Armenia as it may exist at the time of CPA shall be eligible for inclusion under the PoA.
(b) Conditions that avoid double counting of emission reductions like unique identifications of product and end-user locations (e.g. programme logo)
Only the CPA uniquely identified and defined in an unambiguous manner shall be eligible for inclusion under the PoA. There must be no other CDM project activity registered with the same identification data.
(c) The specifications of technology/measure including the level and type of service, performance specification including compliance with testing/certifications
Only the CPA that employs a hydro power technology with total installed capacity equal or below 15 MW shall be eligible for inclusion under the PoA.
(d) Conditions to check the start date of the CPA through documentary evidence
Only the CPA with the starting date on the day or later of the start of validation of the PoA (uploading for global stakeholders comments on the UNFCCC web site) shall be eligible for inclusion under the PoA.
(e) Conditions that ensure compliance with applicability and other requirements of single or multiple methodology/ies applied by CPAs
1. Only the CPA complying with the applicability criteria of the methodology AMS-I.D., Version 17.0 (EB 61) shall be eligible for inclusion under the PoA. Criteria as per the methodology AMS-I.D., Version 17.0 (EB 61): 2. Only the CPA connected to the Armenian electricity grid shall be eligible for inclusion under the PoA 3. If the CPA is a small hydro power plant with reservoir: Only the CPA fulfilling one of the following conditions shall be eligible for inclusion under the PoA:
3.1. The project activity is implemented in an existing reservoir with no change in the volume of the reservoir;
3.2. The project activity is implemented in an existing reservoir, where the volume of reservoir is increased and the power density of the project activity, as per definitions given in the project emissions section of the applied methodology, is greater than 4 W/m2;
3.3. The project activity is implementing new reservoir and the power density of the power plant, as per definitions given in the project emissions section of the applied methodology, is greater than 4 W/m2.
(f) The conditions that ensure that CPAs
meet the requirements pertaining to the demonstration of additionality
1. Only the CPA that clearly demonstrates its additionality shall be eligible for inclusion under the PoA. 2.1. If the CPA is a micro scale project activity, the “Guidelines for demonstrating additionality of microscale project activities” shall be applied.
11 For example, an emission factor for electricity generation is dependent on the boundaries of regional or state or sub-regional
grids.

UNFCCC/CCNUCC CDM – Executive Board Page 8
2.2. If the CPA is a small scale project activity, the attachment A of Appendix B of the “Simplified modalities and procedures for small-scale CDM project activities” shall be applied.
(g) The PoA-specific requirements stipulated by the CME including any conditions related to undertaking local stakeholder consultations and environmental impact analysis12
1. Only the CPA that undertakes the environmental analysis as per requirements of the CDM modalities and procedures shall be eligible for inclusion under the PoA. Only the CPA that performs the environmental impact analysis (EIA) in accordance with the Armenian laws/regulations if it is required shall be eligible for inclusion under the PoA. 2. Only the CPA that has conducted the stakeholder involvement process and that has taken into the due account all the concerns raised during the process shall be eligible for inclusion under the PoA. 3. Only the CPA that installs new power generation equipment in the small hydropower plants shall be eligible under the PoA. No power generation equipment may be transferred from other existing facilities.
(h) Conditions to provide an affirmation that funding from Annex I parties, if any; does not result in a diversion of official development assistance.
Only the CPA that has not/will not receive any public funding from Annex I country or the funding is not a diversion from the Official Development Aid (ODA) shall be eligible for inclusion under the PoA.
(i) Where applicable, target group (e.g. domestic (commercial/industrial, rural/urban, grid-connected/off-grid) and distribution mechanisms (e.g. direct installation)13
Target group are SHPP developers in Armenia. There are no specific distribution mechanisms.
(j) Where applicable, the conditions related to sampling requirements for a PoA in accordance with the approved guidelines/standard from the Board pertaining to sampling and surveys
Not applicable.
(k) Where applicable, the conditions that ensure that CPA in aggregate meets the small-scale or micro-scale threshold criteria 14 and remain within those thresholds throughout the crediting period of the CPA
Only the CPA with the total installed capacity under or equal to 15 MW throughout whole crediting period shall be eligible for inclusion under the PoA.
(l) Where applicable, the requirements for the debundling check, in case CPAs
Only the CPA which is a single small/micro scale project activity not a debundled component of a large
12 See also paragraph 6 (m) of “Procedures for registration of a programme of activities as a single CDM project activity and
issuance of CERs for a PoA” 13 This is to re-test the validity of assumptions made at the PoA level. For example, in a lighting efficiency application, lighting
usage hours of 3.5 hours per day would be valid if the target group is residence/households. Usage hours would be different in commercial applications and vice versa.
14 See the latest approved version of the Guidelines for demonstrating additionality of microscale project activities (Version 3, http://cdm.unfccc.int/Reference/Guidclarif/ssc/methSSC_guid22.pdf) and the latest approved version of the General Guidelines to SSC methodologies (https://cdm.unfccc.int/Reference/Guidclarif/ssc/methSSC_guid06.pdf )

UNFCCC/CCNUCC CDM – Executive Board Page 9
belong to small-scale (SSC) or microscale project categories15
scale project activity shall be eligible for inclusion under the proposed PoA.
(m) Individual criterion to enhance environmental and social performance of CPAs under the PoA
Only a CPA that is not objected by the Armenian DNA shall be eligible under the PoA.
Updating the eligibility criteria According to the Standard for demonstration of additionality, development of eligibility criteria and application of multiple methodologies for programme of activities, currently Version 01.0 (EB 65) 16, (further on referred to as “PoA Standard”), if the version of methodology AMS-I.D. applied by the proposed PoA is revised or replaced, subsequent to being placed on hold, the CME shall update the eligibility criteria to the requirements of the revised or new methodology/ies with immediate effect and include them in a new version of the PoA-DD (e.g. version 1.1) and new generic CDM-CPA-DD, validate it by a DOE, and shall submit it to the Board for approval. B.3. Application of methodologies >>The following approved baseline and monitoring methodology applies to all CPAs that will be included in the PoA: Title: AMS-I.D. Grid connected renewable electricity generation Version: 17.0, (EB 61) Reference: http://cdm.unfccc.int/methodologies/DB/RSCTZ8SKT4F7N1CFDXCSA7BDQ7FU1X In case the applied approved methodology is put on hold or withdrawn, no new CPAs will be added to the PoA in accordance with the timelines indicated in latest version of the “Procedures for the revision of an approved baseline and monitoring methodology by the EB”, currently Version 09 (EB 35, Annex 13)17. If the methodology is subsequently revised, the CDM-PoA-DD must be revised accordingly and validated by a DOE and approved by the EB that will define the new version of the PoA and the PoA specific CDM-CPA-DD. Such revisions are not required in cases where a methodology is revised without being placed on hold or withdrawn.
SECTION C. Management system >> Energy Changes Projektentwicklung GmbH as the coordinating/managing entity of the PoA will be in charge of coordinating the project participants, collecting the monitoring data and communicating with DOEs and CDM Executive Board. The CME will build appropriate in-house CDM capacity for PoA management and CPA inclusions and it will ensure proper capacity building for CPA implementers, too. The operational and management arrangements to be established at the CME level are described in this section. Arrangements/structures to be established at the CPA level are described in Part II, Section B.7.2. of this PoA-DD. Organisational structure of the PoA:
15 Please refer to the latest approved version of the Guidelines on assessment of debundling for SSC project activities”: Version
3, EB 54, http://cdm.unfccc.int/Reference/Guidclarif/ssc/methSSC_guid17.pdf 16
http://cdm.unfccc.int/filestorage/E/6/T/E6TY7DMI28WGCUV5J0K3LAOHBQ9RFN/eb65_repan03.pdf?t=T2d8bTNucW9vfDCwxMNGjW1pvUALpRC-AVaL c
17 http://cdm.unfccc.int/Reference/Procedures/meth_proc03_ver09.pdf

UNFCCC/CCNUCC CDM – Executive Board Page 10
Operational/management arrangements established by CME for implementation of the proposed PoA include:
(a) A clear definition of roles and responsibilities of personnel involved in the process of inclusion of CPAs, including a review of their competencies;
The CME of this PoA Energy Changes Projektentwicklung GmbH (EC) is an Austrian consulting company with long term experience in development of CDM project activities and PoAs. The management of EC will be responsible for implementation of the PoA. The CME will assign the tasks to individual personnel and/or hire new (internal employees or external consultants) if needed after the PoA gets registered with UNFCCC. Some of the positions or tasks may be outsourced by external experts. CDM team within the company shall be established and tasks assigned as described below. CME will hire additional CDM Project Managers when needed. Position Responsibilities & competencies EC • Secures Training for the CDM team
• Secures the legal and economical issues (contracts, invoices, etc.) • Secures external CDM consultant (optional) • Keeps personal files of the staff (on training and education) • Trades the CERs
CDM Project Manager • Identifies and evaluates new CPAs • Ensures all requirements and eligibility criteria are met by all
assigned CPAs • Keeps a database of CPAs (PoA database) • Communicates with CPA implementers • Provides training for CPA implementers • Collects monitoring data from CPAs • Prepares monitoring reports for emission reductions verification • Supports validation, registration and verification of the CPA(s) • Ensures all requirements, applicability criteria are met by the PoA • Controls the methodology & tools changes, makes amendments to
PoA-DD as required • Quality control, reporting to management, suggestions and
improvements
(b) Records of arrangements for training and capacity development for personnel All training and education records of the employees are stored in personal employee´s file of the company.

UNFCCC/CCNUCC CDM – Executive Board Page 11
(c) Procedures for technical review of inclusion of CPAs Responsible person (CDM Project Manager) shall verify that the CPA complies with conditions and justifies the compliance by documentation/evidence, as listed in Part II, Section B.5 of this PoA-DD.
(d) A procedure to avoid double counting (e.g. to avoid the case of including a new CPA that has already been registered either as a CDM project activity or as a CPA of another PoA)
In order to avoid double counting the CME will confirm, as per the PROCEDURES FOR REGISTRATION OF A PROGRAMME OF ACTIVITIES AS A SINGLE CDM PROJECT ACTIVITY AND ISSUANCE OF CERTIFIED EMISSION REDUCTIONS FOR A PROGRAMME OF ACTIVITIES, EB 55 Annex 38 Paragraph 6(i), that the project activity included in the CPA is not registered in any other CPA of the PoA or any other registered CDM Project activity through the following procedure: • At the time of CPA eligibility check, CME (CDM Project Manager) will perform thorough control to
identify any double counting conflict on internal PoA level and external CDM level, as follows:
Internal double counting check: The PoA database as described above will not enable duplicate entries of the GPS coordinates which are unique for each CPA. Thus it will be ensured that one SHPPSHPP is not included in more than one CPA and that one CPA is not included in the PoA more than once. External double counting check: CME (CDM Project Manager) will perform a control using the public information sources such as UNFCCC website data, UNEP Risoe CD4CDM data, the VCS website, etc. and confirm that the CPA is not registered as a CPA of other PoA or as any other registered CDM project activity.
• At the time of inclusion, CPA implementer shall sign a contract with CME, amongst other confirming that the CPA implementer will not register the particular SHPP or a unit thereof as a single CDM project activity or as a CPA under another PoA.
Should a case occur that the SHPP and/or the CPA is registered in other CPA of the PoA or other registered CDM project activity or that the CPA implementer fails to sign the contract then the CME will not proceed with inclusion of the corresponding CPA into the proposed PoA.
(e) Records and documentation control process for each CPA under the PoA In order to ensure transparency and high quality of the information and documentation managed by CME the record keeping system for every CPA and the overall PoA database is specially designed. Record keeping system for each CPA: In order to unambiguously identify each small hydro power plant enrolled in the PoA the CME shall develop a serial number system and assign a unique serial number to each CPA. The serial number shall consist of letters and numbers and it will uniquely distinguish each CPA from the others. This serial coding system shall be used to keep the PoA database. The database will be used to record the baseline and monitoring data continuously and to track the emission reductions of each CPA during the crediting period(s). CME will be responsible for management of records and data related to each CPA. The database will be kept electronically and on paper if appropriate (e.g. documentation and evidence) and it will constitute the basis for the verification by the DOE. The data recorded and documented by CME in the PoA database: - Serial number of the CPA - Name of the CPA implementer, address, contacts - Exact CPA Location: City/State/Province, GPS coordinate/s of the SHPP/s - Commissioning date of the small hydro power plant and of each unit

UNFCCC/CCNUCC CDM – Executive Board Page 12 - Start date and end date of each crediting period - Technical specification of each SHPP (type, make, model, installed capacity, year, etc.) - End dates of operation permits, if applicable - Monitored parameters - Verification status A record-keeping system will be established by each CPA implementer, too. CPA implementer shall monitor and record the plant data. The plant data monitoring will primarily include the measurement of electricity supplied to the grid and electricity imported from the grid (consumed) by each CPA. The CPA implementer will report the monitored parameters to the CME Project Manager.
(f) Measures for continuous improvements of the PoA management system Management system of the PoA shall be continuously reviewed by all involved personnel in order to identify any potential weaknesses, threats and their elimination as well as opportunities for improvement. All personnel will be encouraged to raise their comments and suggestions to the CDM Project Manager or to the management board directly. CDM Project Manager or selected representative of the company management shall then execute detailed discussion with all involved in order to find the solution. If necessary, he will assign financial and/or human resources identify the responsible person to perform the actions and report about the results. “Prevention before remedy” approach will be favoured.
(g) Any other relevant elements 1. Justification that the SSC-CPA included in the PoA is not a de-bundled component of another
CDM programme activity (CPA) or CDM project activity.
According to the Guidelines on assessment of debundling for SSC project activities, Version 03, (EB 54, Annex 13)18, Section II “Guidance for determining the occurrence of debundling under a programme of activities (PoA), a proposed small-scale CPA of a PoA shall be deemed to be a de-bundled component of a large scale activity if there is already an activity19, which satisfies both conditions (a) and (b) below:
(a) Has the same activity implementer as the proposed small scale CPA or has a coordinating or managing entity, which also manages a large scale PoA of the same technology/measure, and; (b) The boundary is within 1 km of the boundary of the proposed small-scale CPA, at the closest point.
If a proposed small-scale CPA of a PoA is deemed to be a debundled component in accordance with paragraph 2 above, but the total size of such a CPA combined with a registered small-scale CPA of a PoA or a registered CDM project activity does not exceed the limits for small-scale CDM and small-scale A/R project activities as set out in Annex II of the decision 4/CMP.1 and 5/CMP.1 respectively, the CPA of a PoA can qualify to use simplified modalities and procedures for small-scale CDM and small-scale A/R CDM project activities. In order to exclude the de-bundling, at the time of inclusion of each CPA: • The CME (management) shall check and confirm that it is not managing a large scale PoA of the
same technology/measure within 1 km of this CPA´s project boundary, in the same project category and with the same technology, and
• The CME (CDM Project Manager) shall check and confirm that CPA implementer is not already implementing a project activity of the same technology/measure within 1 km of this CPA´s project boundary, in the same project category and with the same technology.
18 http://cdm.unfccc.int/Reference/Guidclarif/ssc/methSSC_guid17.pdf 19 Which may be a (i) registered small-scale CPA of a PoA, (ii) an application to register another small-scale CPA of a PoA or
(iii) another registered CDM project activity.

UNFCCC/CCNUCC CDM – Executive Board Page 13 Should a case occur that any of the two requirements is not met then the CME will not proceed with inclusion of the corresponding CPA into the proposed PoA. Thus it shall be ensured for each CPA included under the PoA that it is not a debundled component of a large scale project activity.
2. The CPA implementers are aware and have agreed that their activity is being subscribed to the PoA:
The CPA implementer involved in any of the CPAs under this programme of activities shall confirm this by signing a contract with CME, as mentioned above. Before inclusion of the CPA in the PoA the CPA implementer shall enter in to this contractual agreement with the CME, confirming that:
- The CPA has not been and will not be registered as a single CDM project activity or as a CPA under another PoA.
- The CPA implementer is aware that the CPA will be subscribed to the present PoA.
UNFCCC/CCNUCC CDM – Executive Board Page 14
SECTION D. Duration of PoA D.1. Start date of PoA >> Starting date of the PoA is the day of uploading of the CDM-PoA-DD to UNFCCC web site for global stakeholders’ comments. Expected start date of the proposed PoA is 03/08/2012. D.2. Length of the PoA >> 28 years 0 months As per the “Procedures for registration of a programme of activities as a single CDM project activity and issuance of certified emission reductions for a programme of activities”, Version 04.1 (EB 55), Annex 3820 the length of the PoA shall not exceed 28 years.
SECTION E. Environmental impacts E.1. Level at which environmental analysis is undertaken >> Environmental Analysis is done at SSC-CPA level Projects (CPAs) are unique in their technical conditions and environmental impacts and therefore the EIA shall be undertaken for each CPA separately. E.2. Analysis of the environmental impacts >> The environmental impact assessment/analysis will be done at the CPA level and it will be described in detail in the CPA-DD. EIAs of all individual CPAs shall be carried out in accordance with national legislation of Armenia.
SECTION F. Local stakeholder comments F.1. Solicitation of comments from local stakeholders >> The Local Stakeholder Consultations will be held at the CPA level, taking into consideration the unique technical realisation and local impacts of CPAs. Each CPA implementer with CME assistance shall:
• invite local stakeholders to provide comments on the proposed CPA and shall demonstrate how due steps/actions were taken to appropriately engage stakeholders and solicit comments,
• invite comments from local stakeholders in an open and transparent manner, in a way that facilitates comments to be received from local stakeholders and allows for a reasonable time for comments to be submitted. The CPA implementer shall describe the proposed CPA in a manner that allows the local stakeholders to understand it, prepare a summary of the comments received from local stakeholders, demonstrate that all comments received for the proposed CPA have been considered, complete the local stakeholder consultation process before submitting the proposed CPA to a DOE for validation.
F.2. Summary of comments received >> The Local Stakeholder Consultations will be held at the CPA level, taking into consideration the unique technical realisation and local impacts of CPAs. F.3. Report on consideration of comments received >> The Local Stakeholder Consultations will be held at the CPA level, taking into consideration the unique technical realisation and local impacts of CPAs. 20 http://cdm.unfccc.int/filestorage/X/T/1/XT12DHPN79U4FISGMYA0OJW5KZLQVR.1/eb55_repan38.pdf?t=aXR8bHVocTNvfD
D4bftQ4X81fyvUkfR1XEij
UNFCCC/CCNUCC CDM – Executive Board Page 15 SECTION G. Approval and authorization >> As per Section F of the “Clean Development mechanism project standard”, at the time of submission of this PoA-DD to the DOE for validation it is the Version 01.0, EB 65, Annex 5, the project participants shall obtain a letter of approval from the DNA of each Party involved in the proposed CDM project activity confirming that21:
(a) The Party is a Party to the Kyoto Protocol;
(b) Participation in the proposed CDM project activity is voluntary;
(c) Project participants are authorized to participate in the proposed CDM project activity. In addition, for project participants from the host Party, the letter of approval shall also confirm that the proposed CDM project activity assists the host Party in achieving sustainable development.
PART II. Generic component project activity (CPA)
SECTION A. General description of a generic CPA A.1. Purpose and general description of generic CPAs >> A typical CPA under this PoA:
• Is a new, greenfield hydro power plant, • is located within the boundary of Armenia, • consists of one or more hydro power plants/units, • is run-of-river hydro power plant or a hydropower plant with reservoir, • has a total installed capacity of no more than 15 MW, • supplies the generated electricity to the Armenian electricity grid , • will result in an increased share of renewable energy utilization and reduction of carbon intensity
of energy production in Armenia.
SECTION B. Application of a baseline and monitoring methodology B.1. Reference of the approved baseline and monitoring methodology(ies) selected >> The following approved baseline and monitoring methodology applies to all CPAs that will be included in the PoA: Title: AMS-I.D. Grid connected renewable electricity generation Version: 17.0, (EB 61) Reference: http://cdm.unfccc.int/methodologies/DB/RSCTZ8SKT4F7N1CFDXCSA7BDQ7FU1X In case the applied approved methodology is put on hold or withdrawn, no new CPAs will be added to the PoA in accordance with the timelines indicated in latest version of the “Procedures for the revision of an approved baseline and monitoring methodology by the EB”, currently Version 09 (EB 35, Annex 13)22. If the methodology is subsequently revised, the CDM-PoA-DD must be revised accordingly and validated by a DOE and approved by the EB that will define the new version of the PoA and the PoA specific CDM-CPA-DD. Such revisions are not required in cases where a methodology is revised without being placed on hold or withdrawn. The approved methodology also refers to
21 At the time of making the PDD public at the stage of validation, a Party involved may or may not have provided its approval of
the proposed CDM project activity, but by the time of requesting registration, approval from all Parties involved shall be obtained.
22 http://cdm.unfccc.int/Reference/Procedures/meth_proc03_ver09.pdf
UNFCCC/CCNUCC CDM – Executive Board Page 16
• the latest approved versions of the “Tool to calculate the emission factor for an electricity system"; and
• the most recent version of "ACM0002 - Consolidated baseline methodology for grid-connected electricity generation from renewable sources", at the time of submission of this PoA to the DOE for validation it is Version 12.3.0 (EB 66)23
• “General guidelines to SSC CDM methodologies”, at the time of submission of this PoA to the DOE for validation it is Version 18 (EB 66) 24“
It is confirmed that the selected methodology and tools are approved for application to CPAs under PoAs by the Board. The additionality of the CPAs shall be demonstrated and assessed according to the “Standard for demonstration of additionality, development of eligibility criteria and application of multiple methodologies for programme of activities”, at the time of submission of this PoA to the DOE for validation it is Version 01.0 (EB 65)25. The PoA follows:
• “Procedures for registration of a programme of activities as a single CDM project activity and issuance of certified emission reductions for a programme of activities”, at the time of submission of this PoA-DD to the DOE for validation in is Version 04.1, EB 55, Annex 3826,
• “Clean Development mechanism project standard”, at the time of submission of this PoA-DD to the DOE for validation in is the Version 01.0, EB 65, Annex 527
B.2. Application of methodology(ies) >> The methodology AMS-I.D. - “Grid connected renewable electricity generation” has been applied since it relates to grid-connected electricity generation from renewable sources and since it is foreseen that the total installed capacity of each CPA shall not overcome the small scale threshold of 15 MW. Only this type I methodology is applied. The applicability of this methodology is justified as all CPAs included in the PoA have to demonstrate the fulfilment of respective eligibility criteria. The applicability criteria of the methodology, along with component project activity eligibility criteria (Section B.5., criterion (e)), are provided in the table below: Applicability condition Justification 1. & 2. This methodology comprises renewable energy generation units, such as photovoltaic, hydro, tidal/wave, wind, geothermal and renewable biomass:
(a) supplying electricity to a national or a regional grid; or
(b) supplying electricity to an identified consumer facility via national/regional grid through a contractual arrangement such as wheeling.”
The proposed CPAs will install renewable energy generation units – small hydro power plants. The electricity generated by the CPA SHPP plants will be supplied into the electricity grid of Armenia.
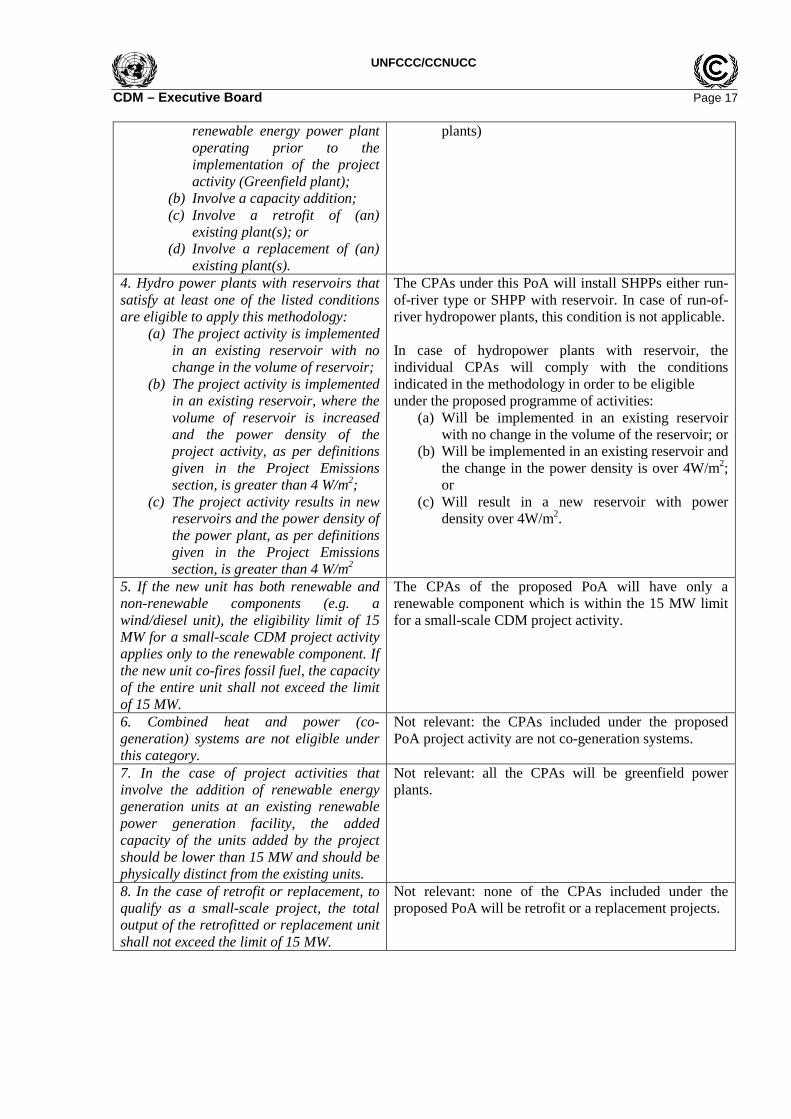
3. This methodology is applicable to project activities that:
(a) Install a new power plant at a site where there was no
The CPAs under this PoA will install SHPPs
(a) Only at sites where there was no renewable energy power plant operating before (greenfield
24http://cdm.unfccc.int/filestorage/C/R/L/CRL8TYAOPD3HJXWK5G90ES6Q7BNUIZ/eb66_repan23.pdf?t=QXp8
bTNyOWNjfDCadYXc_hmTSeQ8u55EXWUJ 25http://cdm.unfccc.int/Reference/Standards/meth/meth_stan04.pdf 26 http://cdm.unfccc.int/Reference/Procedures/PoA_proc01.pdf 27 http://cdm.unfccc.int/Reference/Standards/pp/pp_stan01.pdf
UNFCCC/CCNUCC CDM – Executive Board Page 17
renewable energy power plant operating prior to the implementation of the project activity (Greenfield plant);
(b) Involve a capacity addition; (c) Involve a retrofit of (an)
existing plant(s); or (d) Involve a replacement of (an)
existing plant(s).
plants)
4. Hydro power plants with reservoirs that satisfy at least one of the listed conditions are eligible to apply this methodology:
(a) The project activity is implemented in an existing reservoir with no change in the volume of reservoir;
(b) The project activity is implemented in an existing reservoir, where the volume of reservoir is increased and the power density of the project activity, as per definitions given in the Project Emissions section, is greater than 4 W/m2;
(c) The project activity results in new reservoirs and the power density of the power plant, as per definitions given in the Project Emissions section, is greater than 4 W/m2
The CPAs under this PoA will install SHPPs either run-of-river type or SHPP with reservoir. In case of run-of-river hydropower plants, this condition is not applicable. In case of hydropower plants with reservoir, the individual CPAs will comply with the conditions indicated in the methodology in order to be eligible under the proposed programme of activities:
(a) Will be implemented in an existing reservoir with no change in the volume of the reservoir; or
(b) Will be implemented in an existing reservoir and the change in the power density is over 4W/m2; or
(c) Will result in a new reservoir with power density over 4W/m2.
5. If the new unit has both renewable and non-renewable components (e.g. a wind/diesel unit), the eligibility limit of 15 MW for a small-scale CDM project activity applies only to the renewable component. If the new unit co-fires fossil fuel, the capacity of the entire unit shall not exceed the limit of 15 MW.
The CPAs of the proposed PoA will have only a renewable component which is within the 15 MW limit for a small-scale CDM project activity.
6. Combined heat and power (co-generation) systems are not eligible under this category.
Not relevant: the CPAs included under the proposed PoA project activity are not co-generation systems.
7. In the case of project activities that involve the addition of renewable energy generation units at an existing renewable power generation facility, the added capacity of the units added by the project should be lower than 15 MW and should be physically distinct from the existing units.
Not relevant: all the CPAs will be greenfield power plants.
8. In the case of retrofit or replacement, to qualify as a small-scale project, the total output of the retrofitted or replacement unit shall not exceed the limit of 15 MW.
Not relevant: none of the CPAs included under the proposed PoA will be retrofit or a replacement projects.

UNFCCC/CCNUCC CDM – Executive Board Page 18 B.3. Sources and GHGs
>> As per methodology AMS-I.D., Version 17.0 (EB 61), the spatial extent of the project boundary includes the project power plant and all power plants connected physically to the electricity system that the CDM project power plant is connected to. The baseline includes the emissions related to the electricity produced by the facilities and power plants to be displaced by the CPA. This involves emissions from displaced fossil fuel use at power plants connected to the electricity grid of Armenia. Table below illustrates the emission sources and gases included in the project boundary for the purpose of calculating project emissions and baseline emissions:
Source Gas Included? Justification / Explanation
Base
line CO2 emissions from electricity generation
in fossil fuel fired power plants that are displaced due to the project activity
CO2 Yes Main emission source CH4 No Minor emission source
N2O No Minor emission source
Proj
ect a
ctiv
ity
Emissions from water reservoirs from hydro power plants
CO2 No Minor emission source
CH4 Yes Main emission source if CPA is hydro power plant with reservoir
N2O No Minor emission source
Emissions related to the operation of geothermal power plants
CO2 No Not applicable, no geothermal power plant
CH4 No Not applicable, no geothermal power plant
N2O No Not applicable, no geothermal power plant
CO2 emissions from on-site consumption of fossil fuels due to the project activity
CO2 No Not applicable, no fossil fuel consumption
CH4 No No
N2O No No
B.4. Description of baseline scenario >> As per AMS.I.D., Version 17.0 (EB 61), paragraph 10, the baseline scenario is prescribed as follows: If the project activity is the installation of a new grid connected renewable power plant/unit, “The baseline scenario is that the electricity delivered to the grid by the project activity would have otherwise been generated by the operation of grid-connected power plants and by the addition of new generation sources into the grid”. Baseline emissions of a CPA are calculated using the grid emission factor (GEF) that reflects the existing power plants’ consumption of fossil fuels and expected electricity generation of the power plants implemented by the CPA. B.5. Demonstration of eligibility for a generic CPA >> A CPA is eligible for inclusion under the PoA, provided that the CPA fulfils the following criteria, demonstrated through the listed evidences for each eligibility criteria, as follows: (a) Eligibility criterion: The geographical boundary of the CPA including any time-induced
boundary28 is consistent with the geographical boundary set in the PoA Demonstration of criterion usability to assess the CPA inclusion:
28 For example, an emission factor for electricity generation is dependent on the boundaries of regional or state or sub-regional
grids.

UNFCCC/CCNUCC CDM – Executive Board Page 19
Only the CPA installed within the boundary of Armenia as it may exist at the time of CPA shall be eligible for inclusion under the PoA. Evidence for demonstration of CPA compliance with criterion: 1. GPS coordinates of the CPA 2. Map of the respective country with marked location of the project activity
(b) Eligibility criterion: Conditions that avoid double counting of emission reductions like unique
identifications of product and end-user locations (e.g. programme logo) Demonstration of criterion usability to assess the CPA inclusion: Only the CPA uniquely identified and defined in an unambiguous manner shall be eligible for inclusion under the PoA. There must be no other CDM project activity registered with the same identification data. Evidence for demonstration of CPA compliance with criterion: 1. UNFCCC web site check at the time of CPA inclusion under the PoA by the CME and confirmation that the CPA is not registered as a part of any other PoA or as an individual CDM project 2. Unique identification of the CPA, unique CPA code which shall be assigned to the CPA (when the CPA is included under the PoA) entered into the PoA database, containing data:
• Name of the CPA implementer (SHPP owner), • Exact CPA location: State/Province/City/GPS coordinates of SHPPs , • Commissioning date of the SHPP (expected date if the SHPP is not commissioned yet), • Expected start date/end date of crediting period(s), • Installed capacity of each power unit
3. Alternatively, a protocol/ report of the CME´s own site visit to the location (c) Eligibility criterion: The specifications of technology/measure including the level and type of
service, performance specification including compliance with testing/certifications Demonstration of criterion usability to assess the CPA inclusion: Only the CPA that employs a hydro power technology with total installed capacity equal or below 15 MW shall be eligible for inclusion under the PoA. Evidence for demonstration of CPA compliance with criterion: Provided evidence as appropriate and available, e.g. technical project report, technical project design, technology description from the manufacturer
(d) Eligibility criterion: Conditions to check the start date of the CPA through documentary evidence
Demonstration of criterion usability to assess the CPA inclusion: Only the CPA with the starting date on the day or later of the start of validation of the PoA (uploading for global stakeholder’s comments on the UNFCCC web site) shall be eligible for inclusion under the PoA. Evidence for demonstration of CPA compliance with criterion: Check by CME, comparison of the dates and confirmation that the start date of the CPA (date when the technology has been/will be ordered/purchased) is/will be after the start date of the PoA
(e) Eligibility criterion: Conditions that ensure compliance with applicability and other requirements
of single or multiple methodology/ies applied by CPAs Demonstration of criterion usability to assess the CPA inclusion: 1. Only the CPA using the methodology AMS-I.D., Version 17.0 (EB 61) and complying with its applicability criteria at the time of CPA application for inclusion under the PoA shall be eligible for inclusion under the PoA. Criteria as per the methodology AMS-I.D., currently Version 17.0 (EB 61): 2. Only the CPA connected to the Armenian electricity grid shall be eligible for inclusion under the

UNFCCC/CCNUCC CDM – Executive Board Page 20
PoA 3. If the CPA is a small hydro power plant with reservoir: Only the CPA fulfilling one of the following conditions shall be eligible for inclusion under the PoA: 3.1. The project activity is implemented in an existing reservoir with no change in the volume of the reservoir; 3.2. The project activity is implemented in an existing reservoir, where the volume of reservoir is increased and the power density of the project activity, as per definitions given in the project emissions section of the applied methodology, is greater than 4 W/m2; 3.3. The project activity is implementing new reservoir and the power density of the power plant, as per definitions given in the project emissions section of the applied methodology, is greater than 4 W/m2 Evidence for demonstration of CPA compliance with methodology criterion: 1. UNFCCC web site check at the time of CPA inclusion under the PoA by the CME and confirmation that a valid version of the methodology is used 2. Provided evidence as appropriate and available, e.g. preliminary grid feed-in approval, Power Purchase Agreement, or other respective agreement or contract of CPA with operator of the electricity grid, or Technical Project Report specifying the grid connection point, etc. 3. Provided evidence as appropriate and available, e.g. Technical Project Report and/or hydro power technology order, technology purchase, etc. 3.1. Technical Project Report or a respective document if the project activity is implemented in an existing reservoir with no change in the volume of the reservoir 3.2. & 3.3. Power density calculation by CME. The information and evidences for the demonstration of the power density will be made available for inspection by the DOE and information will be included in the CPA-DD.
(f) Eligibility criterion: The conditions that ensure that CPAs meet the requirements pertaining to the
demonstration of additionality Demonstration of criterion usability to assess the CPA inclusion: Only the CPA that clearly demonstrates its additionality shall be eligible for inclusion under the PoA. Evidence for demonstration of CPA compliance with criterion: Evidence is provided through correct application of the procedures of the PoA Standard and by the fact that the statements and assumptions are supported by reliable data sources and evidence, where appropriate. Additionality is being assessed and demonstrated at CPA level, individually for each CPA. Every CPA will provide an explanation showing that the project activity would not have occurred otherwise due to at least one of the following barriers below and that it is voluntarily coordinated and would not be implemented in the absence of CDM. The assessment and demonstration of additionality of the CPA will be described in the CPA-DD. A typical CPA included in this PoA is a small scale project activity or a microscale project activity.
• For small scale CPAs (from 5 and up to 15 MW): The additionality shall be demonstrated in accordance with the “Simplified modalities and procedures for small-scale CDM project activities”, (decision 4/CMP.1, Annex II)29, paragraph 28,
• For microscale CPAs (up to 5 MW): The additionality shall be demonstrated in accordance with the “Guidelines for demonstrating additionality of microscale project activities”, currently Version 03 (EB 63, Annex 23) or in accordance with the “Simplified modalities and procedures for small-scale CDM project activities”, (decision 4/CMP.1, Annex II), paragraph 28,
Details regarding different approaches on demonstration of additionality to be applied by the CPAs
29 http://cdm.unfccc.int/Reference/COPMOP/08a01.pdf#page=43

UNFCCC/CCNUCC CDM – Executive Board Page 21
are described in the Appendix 6 of this PoA-DD. (g) Eligibility criterion: The PoA-specific requirements stipulated by the CMEs including any
conditions related to undertaking local stakeholder consultations and environmental impact analysis30 Demonstration of criterion usability to assess the CPA inclusion: 1. Only the CPA that undertakes the environmental analysis as per requirements of the CDM modalities and procedures shall be eligible for inclusion under the PoA. Only the CPA that performs the environmental impact analysis (EIA) in accordance with the Armenian laws/regulations shall be eligible for inclusion under the PoA. 2. Only the CPA that has conducted the stakeholder involvement process and that has taken into the due account all the concerns raised during the process shall be eligible for inclusion under the PoA. 3. Only the CPA that installs new power generation equipment in the small hydropower plants shall be eligible under the PoA. No power generation equipment may be transferred from other existing facilities. Evidence for demonstration of CPA compliance with criterion: 1. EIA report or description/explanation why the EIA is not performed. 2. Description and documentation of the stakeholder involvement process, summary of concerns raised and clarifications provided thereof, if applicable. 3. As appropriate and applicable: Technology orders, technology purchase.
(h) Eligibility criterion: Conditions to provide an affirmation that funding from Annex I parties, if
any; does not result in a diversion of official development assistance. Demonstration of complying with the eligibility criterion: Only the CPA that has not/will not receive any public funding from Annex I country or the funding is not a diversion from the Official Development Aid (ODA) shall be eligible for inclusion under the PoA. Evidence for demonstration of CPA compliance with criterion: CPA implementer confirms to CME that no public funding from Annex I country is involved in the CPA. or Respective evidence on the received funding from Annex I country, check and confirmation of no ODA conflict by CME on individual, case-specific basis.
(i) Eligibility criterion: Where applicable, target group (e.g. domestic (commercial/industrial,
rural/urban, grid-connected/off-grid) and distribution mechanisms (e.g. direct installation)31 Demonstration of criterion usability to assess the CPA inclusion: Target group are SHPP developers in Armenia. There are no specific distribution mechanisms. Evidence for demonstration of CPA compliance with criterion: CPA implementer developing a small hydro power plant is specified in the CPA-DD. No specific evidence is needed.
(j) Eligibility criterion: Where applicable, the conditions related to sampling requirements for a PoA
in accordance with the approved guidelines/standard from the Board pertaining to sampling and surveys
30 See also paragraph 6 (m) of “Procedures for registration of a programme of activities as a single CDM project activity and
issuance of CERs for a PoA” 31 This is to re-test the validity of assumptions made at the PoA level. For example, in a lighting efficiency application, lighting
usage hours of 3.5 hours per day would be valid if the target group is residence/households. Usage hours would be different in commercial applications and vice versa.
UNFCCC/CCNUCC CDM – Executive Board Page 22
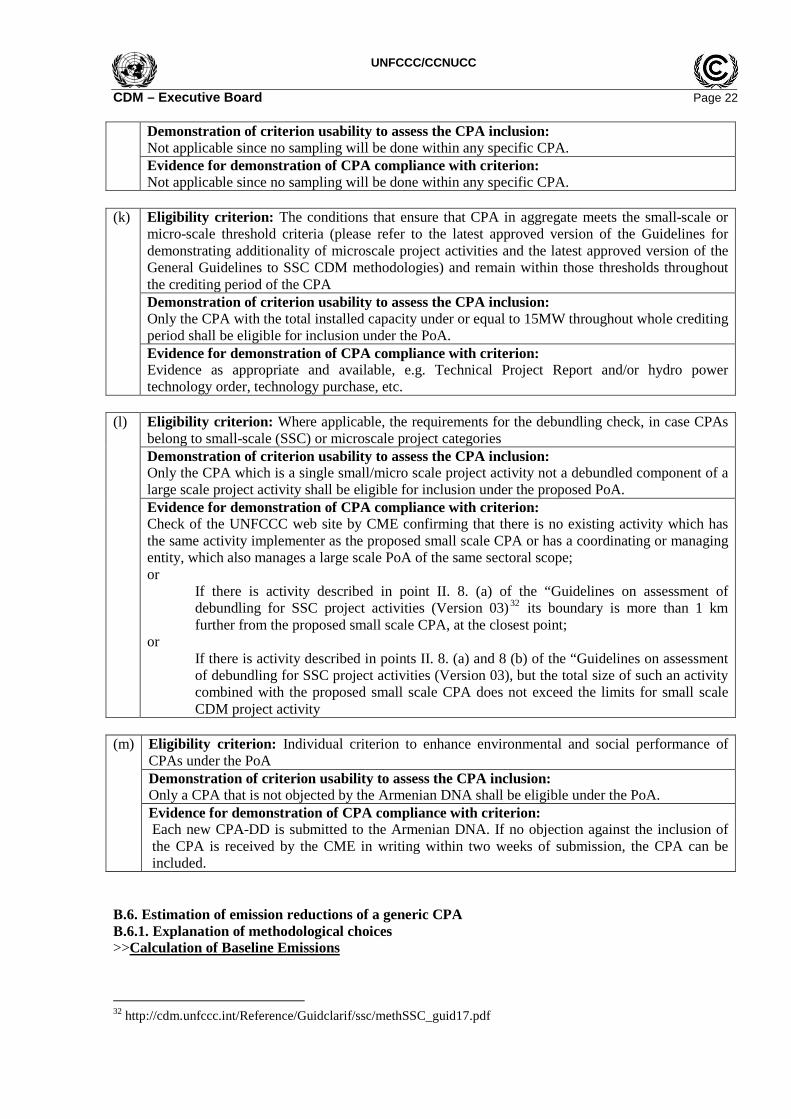
Demonstration of criterion usability to assess the CPA inclusion: Not applicable since no sampling will be done within any specific CPA. Evidence for demonstration of CPA compliance with criterion: Not applicable since no sampling will be done within any specific CPA.
(k) Eligibility criterion: The conditions that ensure that CPA in aggregate meets the small-scale or
micro-scale threshold criteria (please refer to the latest approved version of the Guidelines for demonstrating additionality of microscale project activities and the latest approved version of the General Guidelines to SSC CDM methodologies) and remain within those thresholds throughout the crediting period of the CPA Demonstration of criterion usability to assess the CPA inclusion: Only the CPA with the total installed capacity under or equal to 15MW throughout whole crediting period shall be eligible for inclusion under the PoA. Evidence for demonstration of CPA compliance with criterion: Evidence as appropriate and available, e.g. Technical Project Report and/or hydro power technology order, technology purchase, etc.
(l) Eligibility criterion: Where applicable, the requirements for the debundling check, in case CPAs
belong to small-scale (SSC) or microscale project categories Demonstration of criterion usability to assess the CPA inclusion: Only the CPA which is a single small/micro scale project activity not a debundled component of a large scale project activity shall be eligible for inclusion under the proposed PoA. Evidence for demonstration of CPA compliance with criterion: Check of the UNFCCC web site by CME confirming that there is no existing activity which has the same activity implementer as the proposed small scale CPA or has a coordinating or managing entity, which also manages a large scale PoA of the same sectoral scope; or
If there is activity described in point II. 8. (a) of the “Guidelines on assessment of debundling for SSC project activities (Version 03)32 its boundary is more than 1 km further from the proposed small scale CPA, at the closest point;
or If there is activity described in points II. 8. (a) and 8 (b) of the “Guidelines on assessment of debundling for SSC project activities (Version 03), but the total size of such an activity combined with the proposed small scale CPA does not exceed the limits for small scale CDM project activity
(m) Eligibility criterion: Individual criterion to enhance environmental and social performance of
CPAs under the PoA Demonstration of criterion usability to assess the CPA inclusion: Only a CPA that is not objected by the Armenian DNA shall be eligible under the PoA. Evidence for demonstration of CPA compliance with criterion: Each new CPA-DD is submitted to the Armenian DNA. If no objection against the inclusion of the CPA is received by the CME in writing within two weeks of submission, the CPA can be included.
B.6. Estimation of emission reductions of a generic CPA B.6.1. Explanation of methodological choices >>Calculation of Baseline Emissions
32 http://cdm.unfccc.int/Reference/Guidclarif/ssc/methSSC_guid17.pdf

UNFCCC/CCNUCC CDM – Executive Board Page 23 According to the selected methodology AMS-I.D. Version 17.0, paragraph 11: The baseline emissions are the product of electrical energy baseline EGBL,y expressed in MWh of electricity produced by the renewable generating unit multiplied by the grid emission factor. 𝐵𝐸𝑦 = 𝐸𝐺𝐵𝐿,𝑦 ∗ 𝐸𝐹𝐶𝑂2,𝑔𝑟𝑖𝑑,𝑦
(Equation 1, AMS-I.D., Version 17.0) Where: BEy Baseline emissions in year y (tCO2) EGBL,y Quantity of net electricity supplied to the grid as a result of the implementation of the
CDM project activity in year y (MWh) EFCO2,grid,y CO2 emission factor of the grid in year y (tCO2/MWh) The quantity of net electricity supplied to the grid (EGBL,y) will be calculated annually according to the on-site measurements in the small hydro power plant as the difference between the total (gross) electricity generation of the project activity SHPP in the year y (EGgross,y) and the electricity consumption of the project activity in the year y (electricity consumption by the auxiliary equipment at the plant: ECy). 𝐸𝐺𝐵𝐿,𝑦 = 𝐸𝐺𝑔𝑟𝑜𝑠𝑠,𝑦 − 𝐸𝐶𝑦
(supportive equation) Where: EGBL,y Quantity of net electricity supplied to the grid as a result of the implementation of
the CDM project activity in year y (MWh) EGgross,y Quantity of the total (gross) electricity generation of the project activity SHPP in the
year y (on-site measurements) (MWh) ECy Quantity of the electricity consumption of the project activity in the year y
(electricity consumption by the auxiliary equipment at the plant, on-site measurements) (MWh)
The grid emission factor: According to the methodology AMS-I.D., Version 17.0, paragraph 12: The emission factor (measured in tCO2e/MWh) can be calculated in a transparent and conservative manner, as follows:
(a) A combined margin (CM), consisting of the combination of operating margin (OM) and build margin (BM) according to the procedures prescribed in the “Tool to calculate the emission factor for an electricity system”,
OR
(b) The weighted average emissions (in tCO2e/MWh) of the current generation mix. The data of the year in which project generation occurs must be used.
The grid emission factor of the Armenian electricity grid is calculated according to the procedures prescribed in the UNFCCC methodological “Tool to calculate the emission factor for an electricity system”, at the time of submission of this PoA-DD to DOE for validation the valid Version 2.2.1 (EB 63) (further on referred to as “GEF Tool”)33
• For the Armenian GEF, only the grid connected power plants are considered and the simple adjusted OM method is applied for the calculation.
For the Armenian GEF the ex ante vintage option is chosen, the emission factor is determined once at the validation stage, thus no monitoring and recalculation of the emissions factor during the crediting period is required. 33 http://cdm.unfccc.int/methodologies/PAmethodologies/tools/am-tool-07-v2.2.1.pdf

UNFCCC/CCNUCC CDM – Executive Board Page 24 Calculation of the grid emission factor: 𝐸𝐹𝑔𝑟𝑖𝑑,𝐶𝑀,𝑦 = 𝐸𝐹𝑔𝑟𝑖𝑑,𝑂𝑀,𝑦 ∗ 𝑤𝑂𝑀 + 𝐸𝐹𝑔𝑟𝑖𝑑,𝐵𝑀,𝑦 ∗ 𝑤𝐵𝑀
(Equation 14, GEF Tool, Version 2.2.1) Where: EFgrid,CM,y Combined margin emission factor in year y (tCO2/MWh) EFgrid,OM,y Operating margin CO2 emission factor in year y (tCO2/MWh) EFgrid,BM,y Build margin CO2 emission factor in year y (tCO2/MWh) wOM Weighting of operating margin emissions factor (%) wBM Weighting of build emissions factor (%)
According to the “Electricity Tool” the following default values have been used for wOM and wBM: All other projects (other than wind and solar power generation project activities): wOM = 0.5 and wBM = 0.5 for the first crediting period, and wOM = 0.25 and wBM = 0.75 for the second and third crediting period. Details of methodological steps applied to GEFs calculations and the data used are provided in the Appendix 4 of the PoA – DD. In the attached report under Appendix 4 the Combined Margin Grid Emission Factor is calculated for the year 2010. This is the most recent year where hourly electricity data is available. According to paragraph 28 of the “Procedures for registration of a Programme of Activities as a single CDM Project Activity and Issuance of Certified Emission Reductions for a Programme of Activities”, (Version 04.1), (EB 55, Annex 38)34, the latest version of the Procedures for Renewal of the Crediting Period of a Registered CDM project activity (currently Version 06.0, EB 63, Annex 2935) shall be applied, mutatis mutandi, to a PoA every seven years from the start date of the crediting period. In Annex 1 of these Procedures, “Tool to assess the validity of the original/current baseline and to update the baseline at the renewal of a crediting period” it is stated in step 1.4 that updates should be undertaken in the following cases:
• Where IPCC default values are used, the values should be updated if any new default values have been adopted and published by the IPCC;
• Where emission factors are used and determined only once for the crediting period, they should be updated, except if the emission factors are based on the historical situation at the site of the project activity prior to the implementation of the project and cannot be updated because the historical situation does not exist anymore as a result of the CDM project activity.
The grid emission factor of the Armenian electricity grid is calculated ex-ante, once at the validation of the PoA and fixed for the first crediting period. During the first 7 years of the PoA the GEF fixed at validation shall be used by all CPAs included under the PoA and thus will be fixed for the first crediting period of the respective CPAs. The grid emission factors will be revised and updated at the point of the renewal of the crediting period of the PoA (every seven years) according to the applicable procedures. Calculation of Project Emissions According to AMS-I.D., Version 17.0, paragraph 20: For most renewable energy the project activities, PEy = 0.
34 http://cdm.unfccc.int/Reference/Procedures/PoA_proc01.pdf 35 http://cdm.unfccc.int/Reference/Procedures/reg_proc04.pdf 35 http://cdm.unfccc.int/methodologies/DB/C505BVV9P8VSNNV3LTK1BP3OR24Y5L
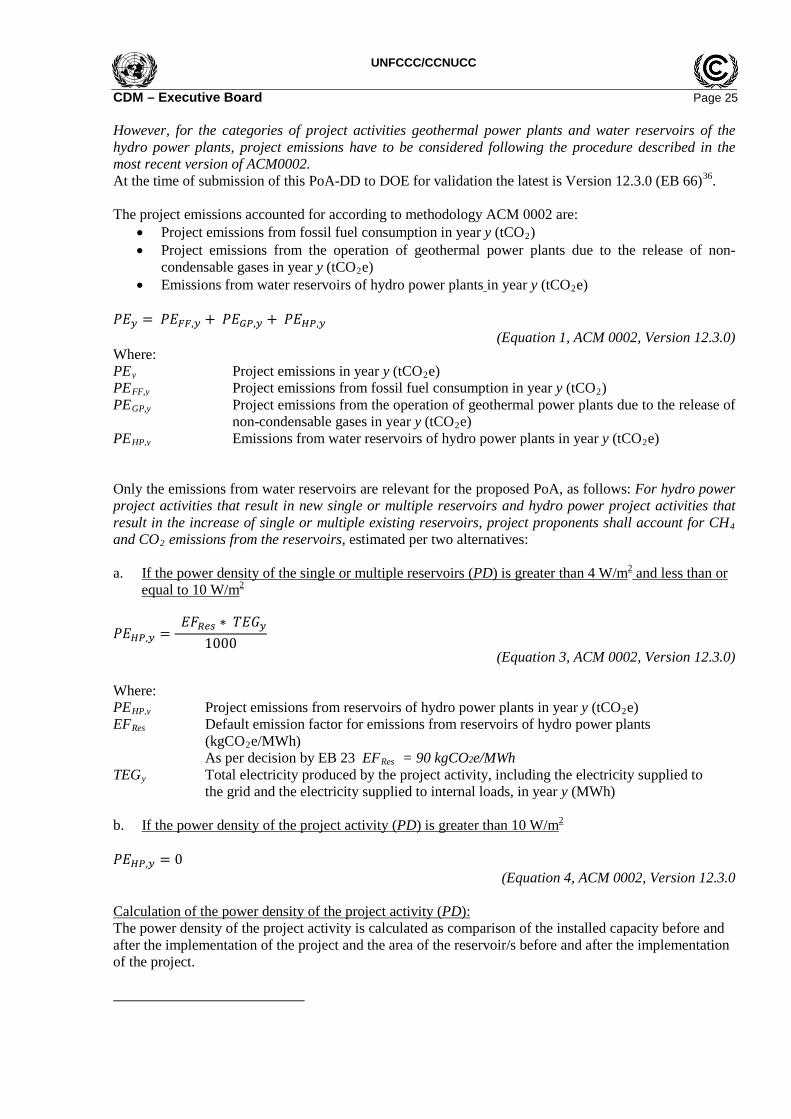
UNFCCC/CCNUCC CDM – Executive Board Page 25 However, for the categories of project activities geothermal power plants and water reservoirs of the hydro power plants, project emissions have to be considered following the procedure described in the most recent version of ACM0002. At the time of submission of this PoA-DD to DOE for validation the latest is Version 12.3.0 (EB 66)36. The project emissions accounted for according to methodology ACM 0002 are:
• Project emissions from fossil fuel consumption in year y (tCO2) • Project emissions from the operation of geothermal power plants due to the release of non-
condensable gases in year y (tCO2e) • Emissions from water reservoirs of hydro power plants in year y (tCO2e)
𝑃𝐸𝑦 = 𝑃𝐸𝐹𝐹,𝑦 + 𝑃𝐸𝐺𝑃,𝑦 + 𝑃𝐸𝐻𝑃,𝑦
(Equation 1, ACM 0002, Version 12.3.0) Where: PEy Project emissions in year y (tCO2e) PEFF,y Project emissions from fossil fuel consumption in year y (tCO2) PEGP,y Project emissions from the operation of geothermal power plants due to the release of
non-condensable gases in year y (tCO2e) PEHP,y Emissions from water reservoirs of hydro power plants in year y (tCO2e) Only the emissions from water reservoirs are relevant for the proposed PoA, as follows: For hydro power project activities that result in new single or multiple reservoirs and hydro power project activities that result in the increase of single or multiple existing reservoirs, project proponents shall account for CH4 and CO2 emissions from the reservoirs, estimated per two alternatives: a. If the power density of the single or multiple reservoirs (PD) is greater than 4 W/m2 and less than or
equal to 10 W/m2
𝑃𝐸𝐻𝑃,𝑦 = 𝐸𝐹𝑅𝑒𝑠 ∗ 𝑇𝐸𝐺𝑦
1000
(Equation 3, ACM 0002, Version 12.3.0) Where: PEHP,y Project emissions from reservoirs of hydro power plants in year y (tCO2e) EFRes Default emission factor for emissions from reservoirs of hydro power plants
(kgCO2e/MWh) As per decision by EB 23 EFRes = 90 kgCO2e/MWh TEGy Total electricity produced by the project activity, including the electricity supplied to
the grid and the electricity supplied to internal loads, in year y (MWh) b. If the power density of the project activity (PD) is greater than 10 W/m2 𝑃𝐸𝐻𝑃,𝑦 = 0
(Equation 4, ACM 0002, Version 12.3.0 Calculation of the power density of the project activity (PD): The power density of the project activity is calculated as comparison of the installed capacity before and after the implementation of the project and the area of the reservoir/s before and after the implementation of the project.
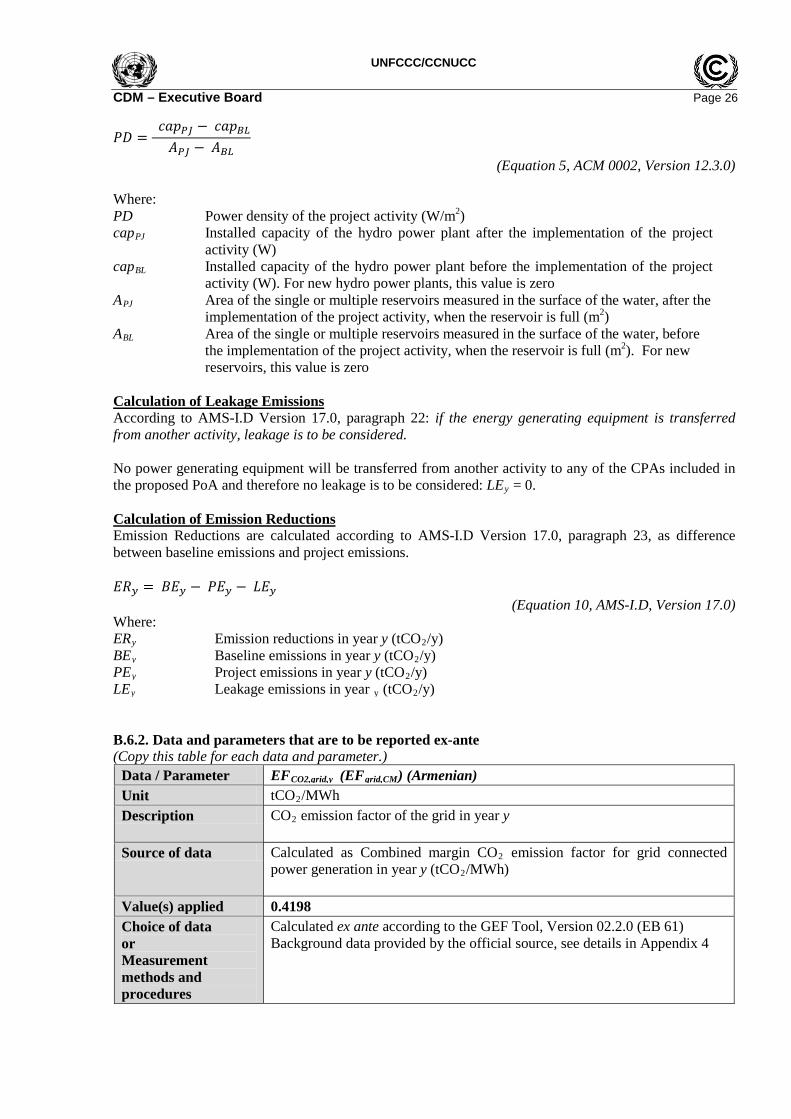
UNFCCC/CCNUCC CDM – Executive Board Page 26 𝑃𝐷 =
𝑐𝑎𝑝𝑃𝐽 − 𝑐𝑎𝑝𝐵𝐿𝐴𝑃𝐽 − 𝐴𝐵𝐿
(Equation 5, ACM 0002, Version 12.3.0) Where: PD Power density of the project activity (W/m2) capPJ Installed capacity of the hydro power plant after the implementation of the project
activity (W) capBL Installed capacity of the hydro power plant before the implementation of the project
activity (W). For new hydro power plants, this value is zero APJ Area of the single or multiple reservoirs measured in the surface of the water, after the
implementation of the project activity, when the reservoir is full (m2) ABL Area of the single or multiple reservoirs measured in the surface of the water, before
the implementation of the project activity, when the reservoir is full (m2). For new reservoirs, this value is zero
Calculation of Leakage Emissions According to AMS-I.D Version 17.0, paragraph 22: if the energy generating equipment is transferred from another activity, leakage is to be considered. No power generating equipment will be transferred from another activity to any of the CPAs included in the proposed PoA and therefore no leakage is to be considered: LEy = 0. Calculation of Emission Reductions Emission Reductions are calculated according to AMS-I.D Version 17.0, paragraph 23, as difference between baseline emissions and project emissions. 𝐸𝑅𝑦 = 𝐵𝐸𝑦 − 𝑃𝐸𝑦 − 𝐿𝐸𝑦
(Equation 10, AMS-I.D, Version 17.0) Where: ERy Emission reductions in year y (tCO2/y) BEy Baseline emissions in year y (tCO2/y) PEy Project emissions in year y (tCO2/y) LEy Leakage emissions in year y (tCO2/y) B.6.2. Data and parameters that are to be reported ex-ante (Copy this table for each data and parameter.)
Data / Parameter EFCO2,grid,y (EFgrid,CM) (Armenian) Unit tCO2/MWh Description CO2 emission factor of the grid in year y
Source of data Calculated as Combined margin CO2 emission factor for grid connected
power generation in year y (tCO2/MWh)
Value(s) applied 0.4198 Choice of data or Measurement methods and procedures
Calculated ex ante according to the GEF Tool, Version 02.2.0 (EB 61) Background data provided by the official source, see details in Appendix 4

UNFCCC/CCNUCC CDM – Executive Board Page 27
Purpose of data (i) Calculation of baseline emissions Additional comment The Armenian grid emission factor is determined ex-ante once at the PoA
validation stage, and fixed for the first 7 years of the PoA crediting period. Thus no monitoring and recalculation of the emissions factor for future CPAs is required during the first 7 years of the PoA. It will be used by all Armenian CPAs included into the PoA during the first 7 years of the PoA crediting period; and fixed for the first 7 years of the respective crediting period of these CPAs. The Armenian grid emission factor will be revised after 7 years of the PoA crediting period, and fixed and used accordingly.
Data / Parameter capBL Unit W Description Installed capacity of the hydro power plant before the implementation of the
project activity. Source of data As prescribed by methodology ACM 0002, currently Version 12.3.0 (EB 66),
for new power plants, this value is zero. Value(s) applied 0 Choice of data or Measurement methods and procedures
The proposed CPA is newly built hydropower station. Therefore, based on the methodology, for new hydro power plants, this value is zero.
Purpose of data (ii) Calculation of project emissions Additional comment Only applicable if the project activity is a SHPP with reservoir.
Data / Parameter ABL Unit m² Description Area of the reservoir measured in the surface of the water, before the
implementation of the project activity, when the reservoir is full (m2). For new reservoirs, this value is zero.
Source of data Technical documentation of the project, e.g. Technical Project Report. or measurement/calculation based on geographical data from credible sources; e.g.:topographical surveys, maps, satellite pictures, etc.
Value(s) applied - Will be provided in each CPA-DD.
Choice of data or Measurement methods and procedures
If the value is not be available in the technical documentation of the CPA, it will be measured/calculated and it will be described in accordance with PoA Guidelines for completing the PoA –DD form for small-scale CDM PoAs, PART II. Generic component project activity (CPA) Section B.6.2, letter (c)37
Purpose of data (ii) Calculation of project emissions Additional comment Only applicable if the project activity is a SHPP with reservoir
Data / Parameter capPJ Unit W
37 http://cdm.unfccc.int/Reference/Guidclarif/pdd/PDD_guid11.pdf
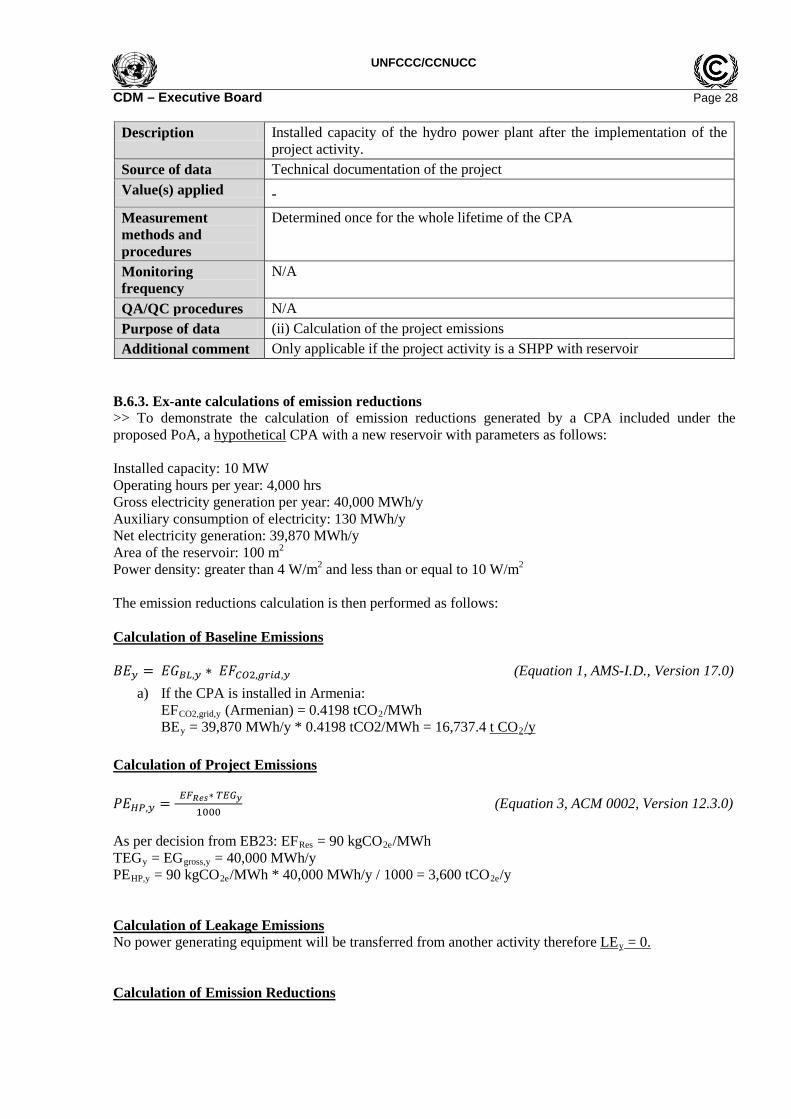
UNFCCC/CCNUCC CDM – Executive Board Page 28
Description Installed capacity of the hydro power plant after the implementation of the project activity.
Source of data Technical documentation of the project Value(s) applied - Measurement methods and procedures
Determined once for the whole lifetime of the CPA
Monitoring frequency
N/A
QA/QC procedures N/A Purpose of data (ii) Calculation of the project emissions Additional comment Only applicable if the project activity is a SHPP with reservoir
B.6.3. Ex-ante calculations of emission reductions >> To demonstrate the calculation of emission reductions generated by a CPA included under the proposed PoA, a hypothetical CPA with a new reservoir with parameters as follows: Installed capacity: 10 MW Operating hours per year: 4,000 hrs Gross electricity generation per year: 40,000 MWh/y Auxiliary consumption of electricity: 130 MWh/y Net electricity generation: 39,870 MWh/y Area of the reservoir: 100 m2 Power density: greater than 4 W/m2 and less than or equal to 10 W/m2 The emission reductions calculation is then performed as follows: Calculation of Baseline Emissions 𝐵𝐸𝑦 = 𝐸𝐺𝐵𝐿,𝑦 ∗ 𝐸𝐹𝐶𝑂2,𝑔𝑟𝑖𝑑,𝑦 (Equation 1, AMS-I.D., Version 17.0)
a) If the CPA is installed in Armenia: EFCO2,grid,y (Armenian) = 0.4198 tCO2/MWh BEy = 39,870 MWh/y * 0.4198 tCO2/MWh = 16,737.4 t CO2/y
Calculation of Project Emissions 𝑃𝐸𝐻𝑃,𝑦 = 𝐸𝐹𝑅𝑒𝑠∗ 𝑇𝐸𝐺𝑦
1000 (Equation 3, ACM 0002, Version 12.3.0)
As per decision from EB23: EFRes = 90 kgCO2e/MWh TEGy = EGgross,y = 40,000 MWh/y PEHP,y = 90 kgCO2e/MWh * 40,000 MWh/y / 1000 = 3,600 tCO2e/y Calculation of Leakage Emissions No power generating equipment will be transferred from another activity therefore LEy = 0. Calculation of Emission Reductions

UNFCCC/CCNUCC CDM – Executive Board Page 29 𝐸𝑅𝑦 = 𝐵𝐸𝑦 − 𝑃𝐸𝑦 − 𝐿𝐸𝑦 (Equation 10, AMS-I.D, Version 17.0)
a) If the CPA is installed in Armenia: ERy = 16,737.4 t CO2/y - 3,600 tCO2e/y - 0 t CO2/y = 13,137.4 t CO2/y

UNFCCC/CCNUCC CDM – Executive Board Page 30 B.7. Application of the monitoring methodology and description of the monitoring plan B.7.1. Data and parameters to be monitored by each generic CPA (Copy this table for each data and parameter) Data / Parameter EGBL,y Unit MWh/y Description Quantity of net electricity supplied to the grid as result of the
implementation of the CDM project activity in the year y Source of data Calculated from the on-site measurements
Calculated as the difference between the total (gross) electricity generation of the project activity in the year y (EGgross,y) and the electricity consumption of the project activity in the year y (auxiliary electricity consumption at the SHPP (ECy)
Value(s) applied (estimated value for the purpose of ex-ante emission reductions calculation)
Measurement methods and procedures
Calculated from the on-site measurements by electricity meter(s) at the point of feeding to the grid
Monitoring frequency The measurements will be continuous, with at least monthly recording and annual summarization. The data will be archived electronically for 2 years following the end of the last crediting period.
QA/QC procedures Measured data used to calculate the net electricity supplied to the grid will be cross-checked with electricity purchase and the invoices for consumed electricity from the grid operator. Measuring equipment will be properly calibrated and with proper accuracy, as described per each parameter individually
Purpose of data (i) Calculation of baseline emissions Additional comment - Data / Parameter EGgross,y Unit MWh/y Description Quantity of the total gross electricity generated and supplied by
the project activity SHPP to the grid in the year y Source of data On-site measurements by electricity meter(s) installed at the
point of feeding in to the grid Value(s) applied (value for ex ante estimation) Measurement methods and procedures
Electricity meter(s) at the point of feeding into the grid
Monitoring frequency The measurements will be continuous, with at least monthly recording and annual summarization. The data will be archived electronically for 2 years following the end of the last crediting period.
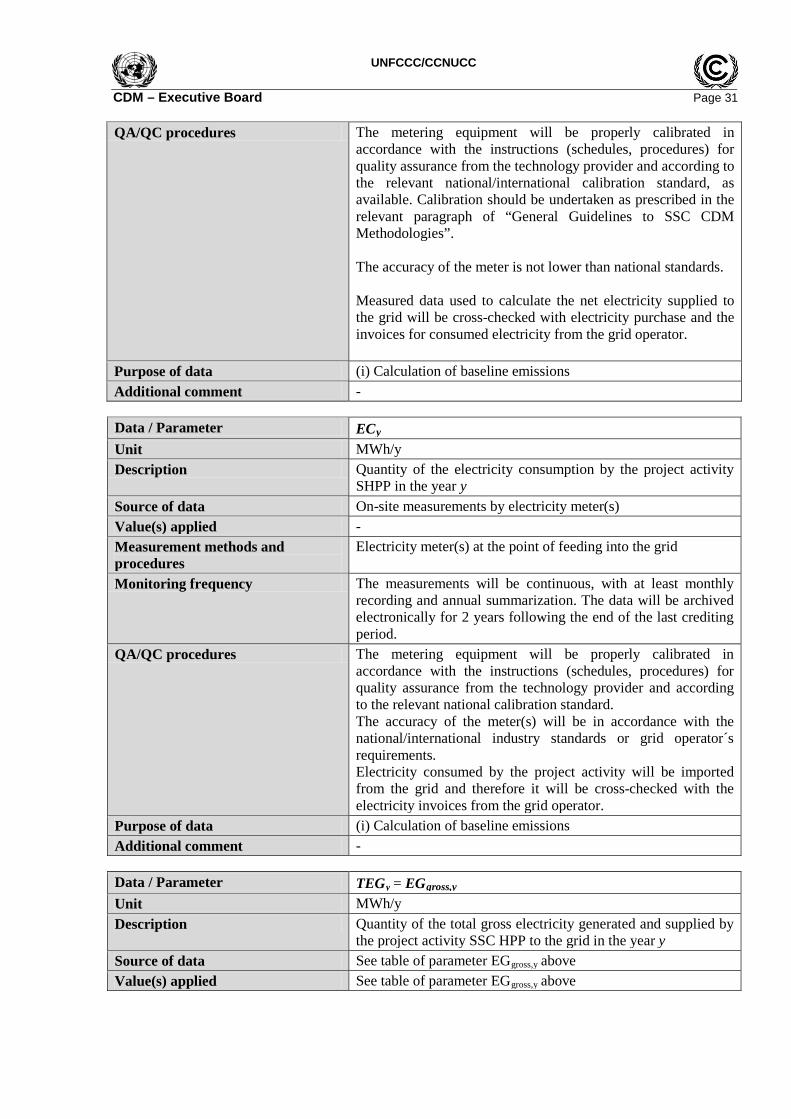
UNFCCC/CCNUCC CDM – Executive Board Page 31 QA/QC procedures The metering equipment will be properly calibrated in
accordance with the instructions (schedules, procedures) for quality assurance from the technology provider and according to the relevant national/international calibration standard, as available. Calibration should be undertaken as prescribed in the relevant paragraph of “General Guidelines to SSC CDM Methodologies”. The accuracy of the meter is not lower than national standards. Measured data used to calculate the net electricity supplied to the grid will be cross-checked with electricity purchase and the invoices for consumed electricity from the grid operator.
Purpose of data (i) Calculation of baseline emissions Additional comment - Data / Parameter ECy Unit MWh/y Description Quantity of the electricity consumption by the project activity
SHPP in the year y Source of data On-site measurements by electricity meter(s) Value(s) applied - Measurement methods and procedures
Electricity meter(s) at the point of feeding into the grid
Monitoring frequency The measurements will be continuous, with at least monthly recording and annual summarization. The data will be archived electronically for 2 years following the end of the last crediting period.
QA/QC procedures The metering equipment will be properly calibrated in accordance with the instructions (schedules, procedures) for quality assurance from the technology provider and according to the relevant national calibration standard. The accuracy of the meter(s) will be in accordance with the national/international industry standards or grid operator´s requirements. Electricity consumed by the project activity will be imported from the grid and therefore it will be cross-checked with the electricity invoices from the grid operator.
Purpose of data (i) Calculation of baseline emissions Additional comment - Data / Parameter TEGy = EGgross,y Unit MWh/y Description Quantity of the total gross electricity generated and supplied by
the project activity SSC HPP to the grid in the year y Source of data See table of parameter EGgross,y above Value(s) applied See table of parameter EGgross,y above
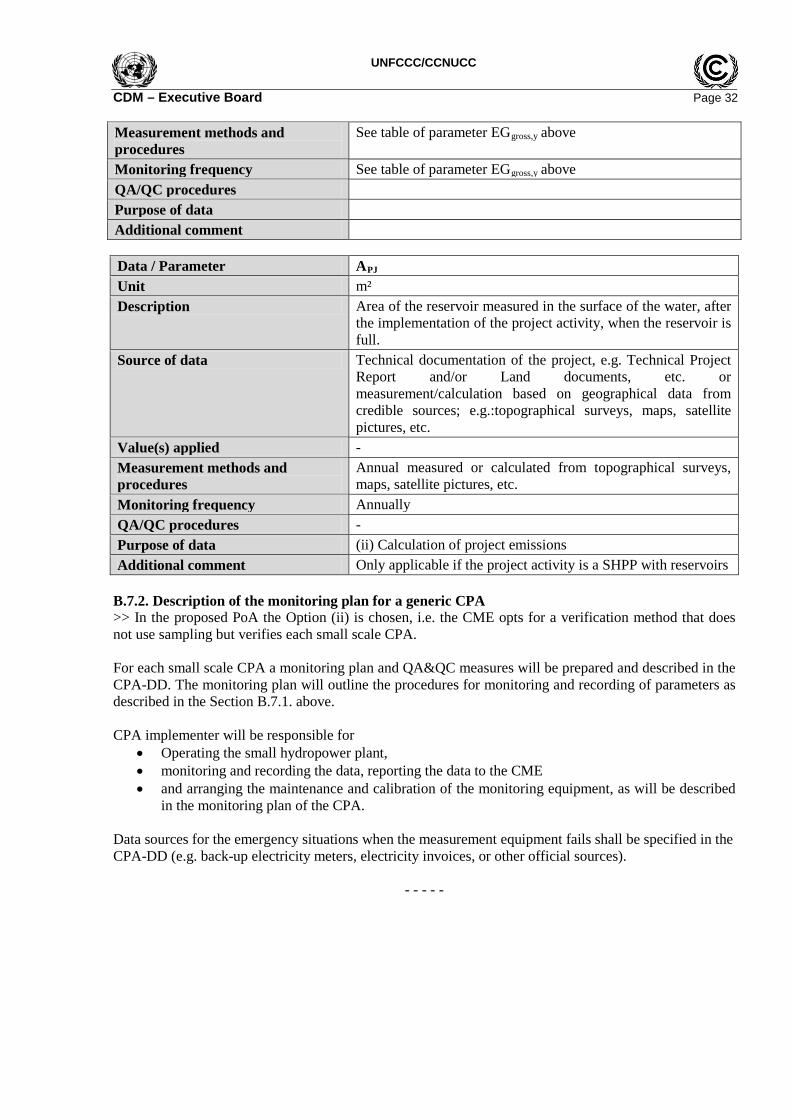
UNFCCC/CCNUCC CDM – Executive Board Page 32 Measurement methods and procedures
See table of parameter EGgross,y above
Monitoring frequency See table of parameter EGgross,y above QA/QC procedures Purpose of data Additional comment Data / Parameter APJ Unit m² Description Area of the reservoir measured in the surface of the water, after
the implementation of the project activity, when the reservoir is full.
Source of data Technical documentation of the project, e.g. Technical Project Report and/or Land documents, etc. or measurement/calculation based on geographical data from credible sources; e.g.:topographical surveys, maps, satellite pictures, etc.
Value(s) applied - Measurement methods and procedures
Annual measured or calculated from topographical surveys, maps, satellite pictures, etc.
Monitoring frequency Annually QA/QC procedures - Purpose of data (ii) Calculation of project emissions Additional comment Only applicable if the project activity is a SHPP with reservoirs
B.7.2. Description of the monitoring plan for a generic CPA >> In the proposed PoA the Option (ii) is chosen, i.e. the CME opts for a verification method that does not use sampling but verifies each small scale CPA. For each small scale CPA a monitoring plan and QA&QC measures will be prepared and described in the CPA-DD. The monitoring plan will outline the procedures for monitoring and recording of parameters as described in the Section B.7.1. above. CPA implementer will be responsible for
• Operating the small hydropower plant, • monitoring and recording the data, reporting the data to the CME • and arranging the maintenance and calibration of the monitoring equipment, as will be described
in the monitoring plan of the CPA. Data sources for the emergency situations when the measurement equipment fails shall be specified in the CPA-DD (e.g. back-up electricity meters, electricity invoices, or other official sources).
- - - - -

UNFCCC/CCNUCC CDM – Executive Board Page 33
Appendix 1: Contact information on entity/individual responsible for the PoA
Organization Energy Changes Projektentwicklung GmbH Street/P.O. Box Obere Donaustrasse 12-28 Building City Vienna State/Region Postcode 1020 Country Austria Telephone +43 (0) 1 96 84 529 Fax +43 (0) 1 96 84 529 E-mail [email protected] Website www.energy-changes.com Contact person Clemens Ploechl Title Managing Partner Salutation Last name Ploechl Middle name First name Clemens Department Mobile Direct fax Direct tel. +43 676 847133100 Personal e-mail [email protected]
Appendix 2: Affirmation regarding public funding
No public funding from Annex 1 country is involved for the proposed PoA.
Appendix 3: Application of methodology(ies)
Application of the methodology is described in the Section B.3 of this PoA-DD.

UNFCCC/CCNUCC CDM – Executive Board Page 34
Appendix 4: Further background information on ex ante calculation of emission reductions
According to the approved UNFCCC “Tool to calculate the emission factor for an electricity system (Version 02.2.0)”, hereinafter referred to as the “Tool” the Combined Margin (CM) consists of the combination of Operating Margin (OM) and Build Margin (BM).
This methodological tool determines the CO2 emission factor for the displacement of electricity generated by power plants in an electricity system, by calculating the combined margin emission factor (CM) of the electricity system. The CM is the result of a weighted average of two emission factors pertaining to the electricity system: the operating margin (OM) and the build margin (BM). The following report is based on the Armenian studies “Calculation of Grid (Baseline) Emission Factor for the Electricity System of the Republic of Armenia38“ for the years 2009-2011, which provide the accurate calculation of the CM Grid Emission Factors for the Armenian electricity grid according to the above mentioned approved UNFCCC “Tool”. Introduction This document presents the results of the assessment of the grid emission factor for the Armenian power system for 2011. Grid emission factor (amount of CO2 emissions associated with 1 kWh of electricity generated in an electricity grid) can be applied for development of CDM project activities that substitutes grid electricity, i.e. where a project activity supplies electricity to a grid or a project activity that results in savings of electricity that would have been provided by the grid (e.g. demand-side energy efficiency projects). The grid emission factor for 2011 was calculated in accordance with the Version 02.2.1) of the “Tool to calculate the emission factor for an electricity system” approved by CDM EB 63.
In particular, the document presents the following information:
Explanation of the concept of baseline and its specification under the CDM; Description of the Armenian power system and power plants serving the system in 2011; Description of the methodological tool and approaches used for calculation of the emission factor; Description of data and parameters used in calculation. Calculation of Operating Margin and Build Margin; Estimation of Combined Margin (grid factor), i.e. GHG emissions that would have occurred in
absence of the proposed CDM project activity;
The document is developed by request and for the Ministry of Nature Protection of RA (MoNP), serving as Designated National Authority for the CDM in Armenia (DNA) in cooperation with UNDP Armenia and ALLPLAN GmbH. The document is aimed to facilitate development of renewable energy CDM projects in Armenia via reducing project development costs associated with data collection and baseline calculation.
The document has been made publicly available for all interested local and international parties via posting on the website of the Climate Change Information Center of Armenia at www.nature-ic.am.
Application of the baseline calculation for CDM projects should be in accordance with the relevant rules and procedures set by the CDM Executive Board as well as with national procedures set by the DNA.
The grid emission factor presented in this document is recommended by the DNA for development of CDM projects in 2012; however, it is not compulsory for project developers. 38 http://www.nature-ic.am/res/pdfs/projects/CP/SNC/Baseline%20Study%20for%202010%20ENG.pdf
UNFCCC/CCNUCC CDM – Executive Board Page 35 According to the acting CDM procedures, baseline study is a subject to validation by a Designated Operational Entity (DOE). In other words, application of the baseline recommend by the DNA will help project participants to reduce transaction costs associated with baseline development; however, it does not release them from an obligation to validate the baseline once it is used for CDM project activity as a component of the Project Design Document (PDD).
Grid emission factor presented in this study has been calculated by means of MO Excel calculation model developed by the expert team. The model can be used for subsequent annual update of the emission factor.
The model, source data and reference documents used for current assessment are available in MoNP and Climate Change Information Center of Armenia (CCIC).
For further question regarding this document please contact Dr. Diana Harutyunyan, UNDP Climate Change Related Projects Coordinator at: [email protected].
1. Clean Development Mechanism The Clean Development Mechanism (CDM), defined in Article 12 of the Kyoto Protocol, allows industrialized countries with legally binding greenhouse gas reduction commitments (also referred to Annex I countries to the UNFCCC) to invest in emission-reduction projects in developing countries (non-Annex I parties) as an alternative to more expensive emission reductions in their own countries. Such projects can earn saleable certified emission reduction (CER) credits, each equivalent to one tone of CO2, which can be counted towards meeting the Kyoto targets.
So far, the CDM is the only mechanism under the Protocol promoting partnerships between developed and developing countries. The CDM rules, however, do not explicitly exclude projects from being undertaken by partnership between one or more developing countries; these are referred to as ‘unilateral' or ‘South-South' projects.
The CDM has three stated objectives:
• To assist Parties not included in Annex I (i.e. developing countries) in achieving sustainable development;
• To contribute to the ultimate objective of the Convention to stabilize greenhouse gas concentrations in the atmosphere at a level that would prevent dangerous anthropogenic interference with the climate system; and
• To assist Parties included in Annex I (developed countries) in achieving compliance with their quantified emission limitation and reduction commitments under Article 3 of the Kyoto Protocol.
2. CDM Designated National Authority DNA is the body granted responsibility by a Party to authorize and approve participation in CDM projects. The CDM rules provide only limited guidance on the role of the DNA or the requirements for establishing a DNA. These issues are instead left to the Party to determine. Establishment of a DNA is one of the requirements for participation by a Party in the CDM.
The Republic of Armenia signed the United Nations Framework Convention on Climate Change (UNFCCC) on June 13, 1992 and ratified it as a non-Annex I country on May 14, 1993. On December 26, 2002, the National Assembly of Armenia ratified the Kyoto Protocol, which made the Armenia the 108th Party to join the Protocol. Thus, Armenia has met one of the main requirements for participation in the CDM. It is important to mention that Armenia, as a non-Annex I country, does not have any quantitative obligations regarding greenhouse gases emissions reduction or limitation.
On September 16, 2003, the Ministry of Foreign Affairs of the Republic of Armenia submitted a notification to the UNFCCC Secretariat on the assignment of the Ministry of Nature Protection (MoNP) of the Republic of Armenia as Designated National Authority for CDM in Armenia. The Head of
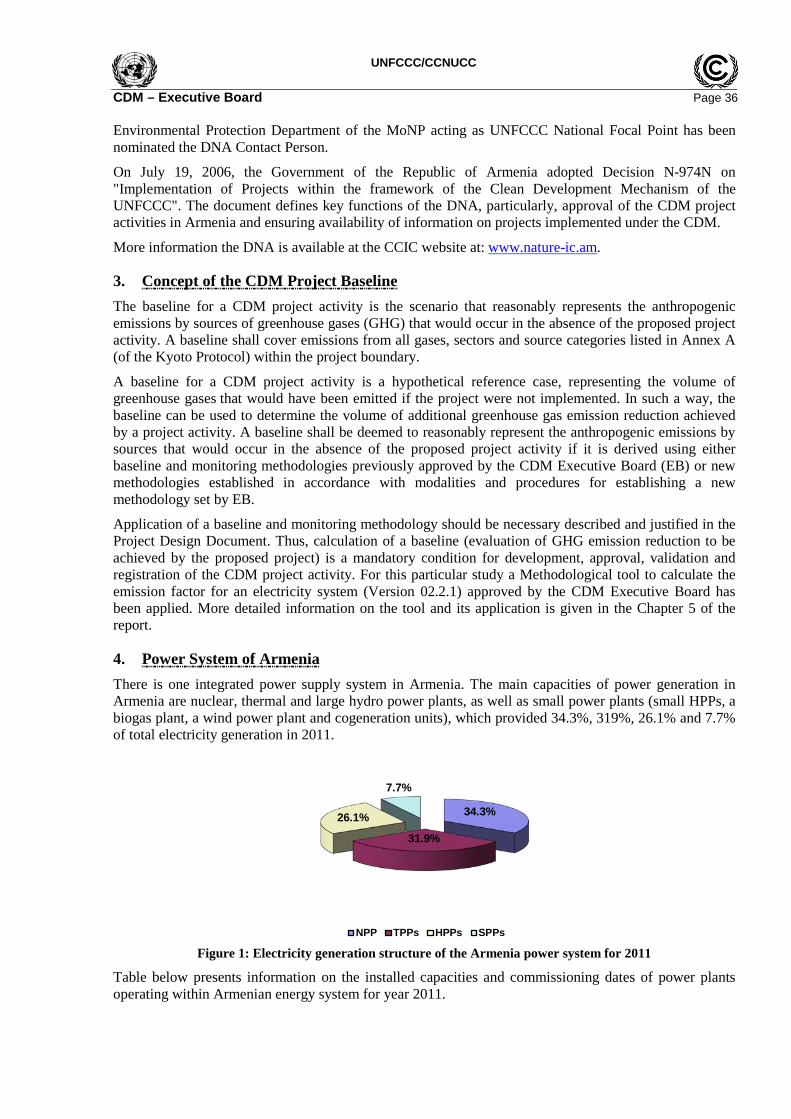
UNFCCC/CCNUCC CDM – Executive Board Page 36 Environmental Protection Department of the MoNP acting as UNFCCC National Focal Point has been nominated the DNA Contact Person.
On July 19, 2006, the Government of the Republic of Armenia adopted Decision N-974N on "Implementation of Projects within the framework of the Clean Development Mechanism of the UNFCCC". The document defines key functions of the DNA, particularly, approval of the CDM project activities in Armenia and ensuring availability of information on projects implemented under the CDM.
More information the DNA is available at the CCIC website at: www.nature-ic.am.
3. Concept of the CDM Project Baseline The baseline for a CDM project activity is the scenario that reasonably represents the anthropogenic emissions by sources of greenhouse gases (GHG) that would occur in the absence of the proposed project activity. A baseline shall cover emissions from all gases, sectors and source categories listed in Annex A (of the Kyoto Protocol) within the project boundary.
A baseline for a CDM project activity is a hypothetical reference case, representing the volume of greenhouse gases that would have been emitted if the project were not implemented. In such a way, the baseline can be used to determine the volume of additional greenhouse gas emission reduction achieved by a project activity. A baseline shall be deemed to reasonably represent the anthropogenic emissions by sources that would occur in the absence of the proposed project activity if it is derived using either baseline and monitoring methodologies previously approved by the CDM Executive Board (EB) or new methodologies established in accordance with modalities and procedures for establishing a new methodology set by EB.
Application of a baseline and monitoring methodology should be necessary described and justified in the Project Design Document. Thus, calculation of a baseline (evaluation of GHG emission reduction to be achieved by the proposed project) is a mandatory condition for development, approval, validation and registration of the CDM project activity. For this particular study a Methodological tool to calculate the emission factor for an electricity system (Version 02.2.1) approved by the CDM Executive Board has been applied. More detailed information on the tool and its application is given in the Chapter 5 of the report.
4. Power System of Armenia There is one integrated power supply system in Armenia. The main capacities of power generation in Armenia are nuclear, thermal and large hydro power plants, as well as small power plants (small HPPs, a biogas plant, a wind power plant and cogeneration units), which provided 34.3%, 319%, 26.1% and 7.7% of total electricity generation in 2011.
Figure 1: Electricity generation structure of the Armenia power system for 2011
Table below presents information on the installed capacities and commissioning dates of power plants operating within Armenian energy system for year 2011.
34.3%
31.9%
26.1%
7.7%
NPP TPPs HPPs SPPs
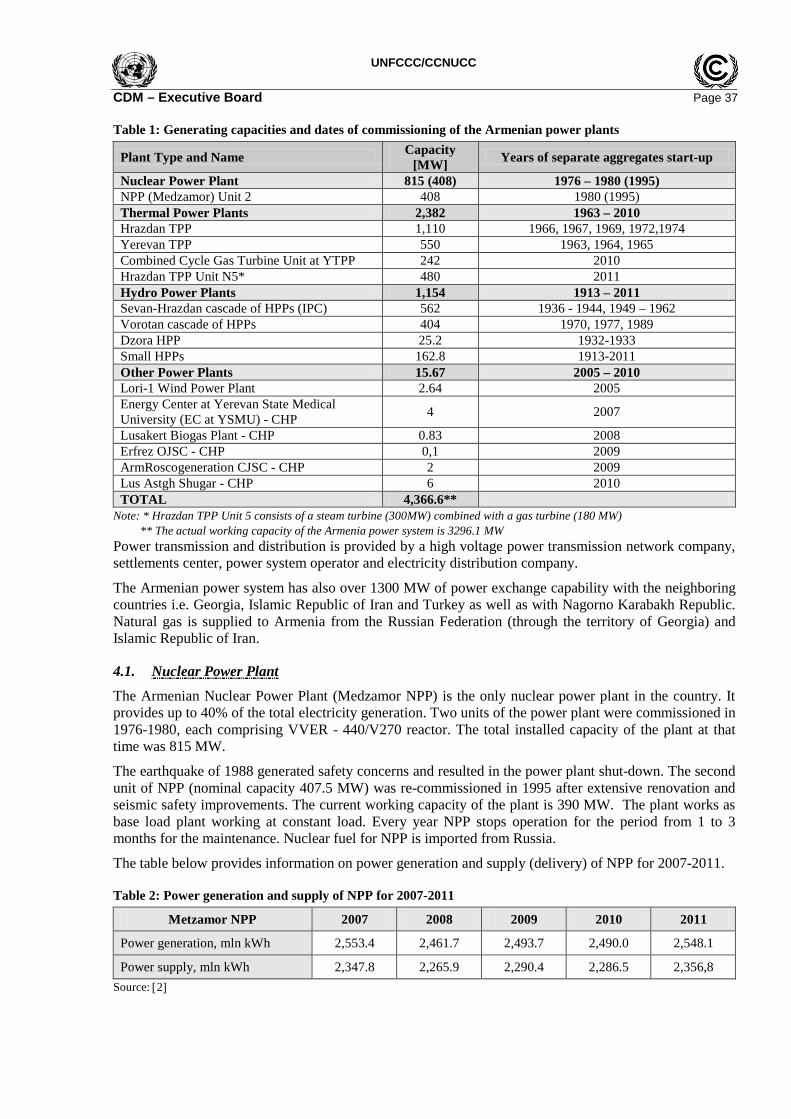
UNFCCC/CCNUCC CDM – Executive Board Page 37 Table 1: Generating capacities and dates of commissioning of the Armenian power plants
Plant Type and Name Capacity [MW] Years of separate aggregates start-up
Nuclear Power Plant 815 (408) 1976 – 1980 (1995) NPP (Medzamor) Unit 2 408 1980 (1995) Thermal Power Plants 2,382 1963 – 2010 Hrazdan TPP 1,110 1966, 1967, 1969, 1972,1974 Yerevan TPP 550 1963, 1964, 1965 Combined Cycle Gas Turbine Unit at YTPP 242 2010 Hrazdan TPP Unit N5* 480 2011 Hydro Power Plants 1,154 1913 – 2011 Sevan-Hrazdan cascade of HPPs (IPC) 562 1936 - 1944, 1949 – 1962 Vorotan cascade of HPPs 404 1970, 1977, 1989 Dzora HPP 25.2 1932-1933 Small HPPs 162.8 1913-2011 Other Power Plants 15.67 2005 – 2010 Lori-1 Wind Power Plant 2.64 2005 Energy Center at Yerevan State Medical University (EC at YSMU) - CHP 4 2007
Lusakert Biogas Plant - CHP 0.83 2008 Erfrez OJSC - CHP 0,1 2009 ArmRoscogeneration CJSC - CHP 2 2009 Lus Astgh Shugar - CHP 6 2010 TOTAL 4,366.6**
Note: * Hrazdan TPP Unit 5 consists of a steam turbine (300MW) combined with a gas turbine (180 MW) ** The actual working capacity of the Armenia power system is 3296.1 MW Power transmission and distribution is provided by a high voltage power transmission network company, settlements center, power system operator and electricity distribution company.
The Armenian power system has also over 1300 MW of power exchange capability with the neighboring countries i.e. Georgia, Islamic Republic of Iran and Turkey as well as with Nagorno Karabakh Republic. Natural gas is supplied to Armenia from the Russian Federation (through the territory of Georgia) and Islamic Republic of Iran.
4.1. Nuclear Power Plant
The Armenian Nuclear Power Plant (Medzamor NPP) is the only nuclear power plant in the country. It provides up to 40% of the total electricity generation. Two units of the power plant were commissioned in 1976-1980, each comprising VVER - 440/V270 reactor. The total installed capacity of the plant at that time was 815 MW.
The earthquake of 1988 generated safety concerns and resulted in the power plant shut-down. The second unit of NPP (nominal capacity 407.5 MW) was re-commissioned in 1995 after extensive renovation and seismic safety improvements. The current working capacity of the plant is 390 MW. The plant works as base load plant working at constant load. Every year NPP stops operation for the period from 1 to 3 months for the maintenance. Nuclear fuel for NPP is imported from Russia.
The table below provides information on power generation and supply (delivery) of NPP for 2007-2011.
Table 2: Power generation and supply of NPP for 2007-2011
Metzamor NPP 2007 2008 2009 2010 2011
Power generation, mln kWh 2,553.4 2,461.7 2,493.7 2,490.0 2,548.1
Power supply, mln kWh 2,347.8 2,265.9 2,290.4 2,286.5 2,356,8 Source: [2]
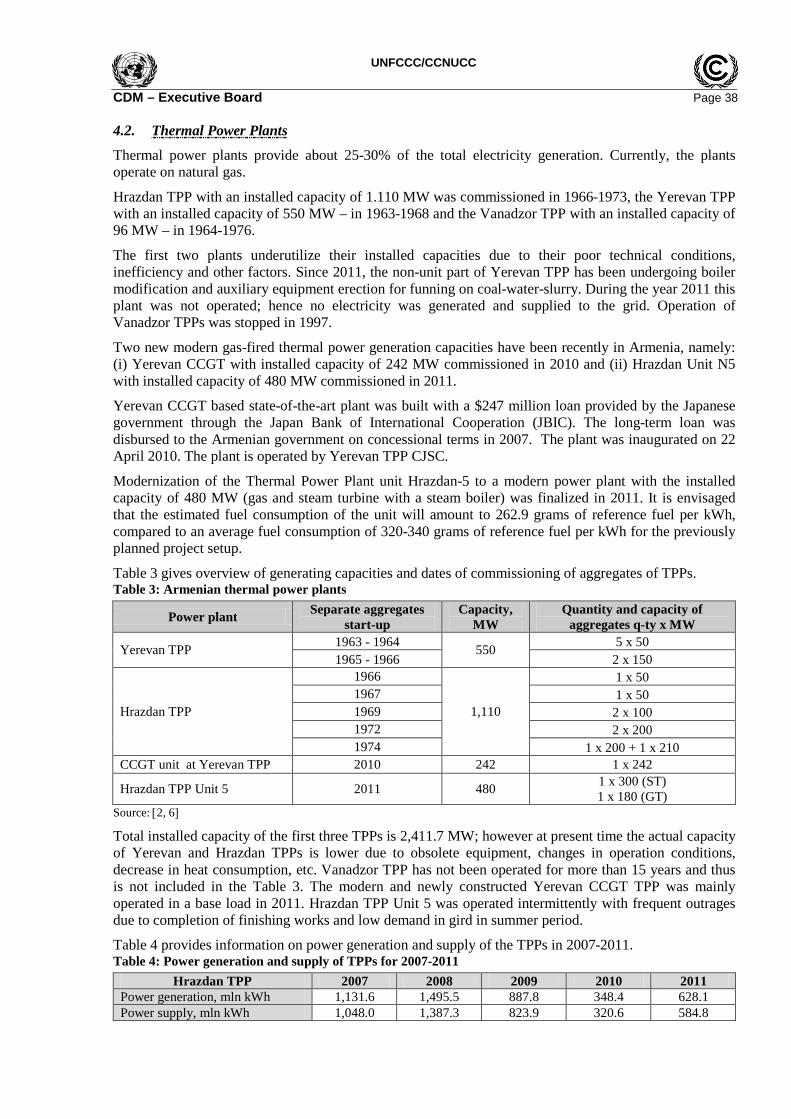
UNFCCC/CCNUCC CDM – Executive Board Page 38 4.2. Thermal Power Plants
Thermal power plants provide about 25-30% of the total electricity generation. Currently, the plants operate on natural gas.
Hrazdan TPP with an installed capacity of 1.110 MW was commissioned in 1966-1973, the Yerevan TPP with an installed capacity of 550 MW – in 1963-1968 and the Vanadzor TPP with an installed capacity of 96 MW – in 1964-1976.
The first two plants underutilize their installed capacities due to their poor technical conditions, inefficiency and other factors. Since 2011, the non-unit part of Yerevan TPP has been undergoing boiler modification and auxiliary equipment erection for funning on coal-water-slurry. During the year 2011 this plant was not operated; hence no electricity was generated and supplied to the grid. Operation of Vanadzor TPPs was stopped in 1997.
Two new modern gas-fired thermal power generation capacities have been recently in Armenia, namely: (i) Yerevan CCGT with installed capacity of 242 MW commissioned in 2010 and (ii) Hrazdan Unit N5 with installed capacity of 480 MW commissioned in 2011.
Yerevan CCGT based state-of-the-art plant was built with a $247 million loan provided by the Japanese government through the Japan Bank of International Cooperation (JBIC). The long-term loan was disbursed to the Armenian government on concessional terms in 2007. The plant was inaugurated on 22 April 2010. The plant is operated by Yerevan TPP CJSC.
Modernization of the Thermal Power Plant unit Hrazdan-5 to a modern power plant with the installed capacity of 480 MW (gas and steam turbine with a steam boiler) was finalized in 2011. It is envisaged that the estimated fuel consumption of the unit will amount to 262.9 grams of reference fuel per kWh, compared to an average fuel consumption of 320-340 grams of reference fuel per kWh for the previously planned project setup.
Table 3 gives overview of generating capacities and dates of commissioning of aggregates of TPPs. Table 3: Armenian thermal power plants
Power plant Separate aggregates start-up
Capacity, MW
Quantity and capacity of aggregates q-ty x MW
Yerevan TPP 1963 - 1964 550 5 x 50 1965 - 1966 2 x 150
Hrazdan TPP
1966
1,110
1 x 50 1967 1 x 50 1969 2 x 100 1972 2 x 200 1974 1 x 200 + 1 x 210
CCGT unit at Yerevan TPP 2010 242 1 x 242
Hrazdan TPP Unit 5 2011 480 1 x 300 (ST) 1 x 180 (GT)
Source: [2, 6]
Total installed capacity of the first three TPPs is 2,411.7 MW; however at present time the actual capacity of Yerevan and Hrazdan TPPs is lower due to obsolete equipment, changes in operation conditions, decrease in heat consumption, etc. Vanadzor TPP has not been operated for more than 15 years and thus is not included in the Table 3. The modern and newly constructed Yerevan CCGT TPP was mainly operated in a base load in 2011. Hrazdan TPP Unit 5 was operated intermittently with frequent outrages due to completion of finishing works and low demand in gird in summer period.
Table 4 provides information on power generation and supply of the TPPs in 2007-2011. Table 4: Power generation and supply of TPPs for 2007-2011
Hrazdan TPP 2007 2008 2009 2010 2011 Power generation, mln kWh 1,131.6 1,495.5 887.8 348.4 628.1 Power supply, mln kWh 1,048.0 1,387.3 823.9 320.6 584.8

UNFCCC/CCNUCC CDM – Executive Board Page 39
Yerevan TPP 2007 2008 2009 2010 2011 Power generation, mln kWh 357.1 336.4 240.7 73.4 0.0 Power supply, mln kWh 304.8 286.8 203.7 61.3 0.0
CCGT Unit at YTPP 2007 2008 2009 2010 2011 Power generation, mln kWh 991.3 1,685.7 Power supply, mln kWh 957.0 1,628.3
Hrazdan TPP Unit N5 2007 2008 2009 2010 2011 57.9 52.6
Source: [2]
In 2011 Hrazdan TPP and Yerevan CCGT Unit produced about 80% and 70% more electricity in comparison with the previous year to cover growing power demand recorded in 2011.
No data on fuel (natural gas) consumption in 2011 for Hrazdan TPP Unit N5 has been reported to the expert team either by Public Services Regulatory Commission of RA (one of the key sources of official data for this study) or by the plant management. Hence, for estimation of fuel consumption of the mentioned plant experts applied default efficiency factors for power plants listed in the Annex I of the Tool to calculate the emission factor for an electricity system. According to the Tool, default efficiency factor for natural gas fired combined cycle plant constructed after 2000 (new units) is 60%.
Based on this parameter as well as on data on power generated by the plant in 2011 (57.9 mln kWh) and caloric value of natural gas (34,289 GJ/1000 m3 – the lowest rate reported by PSRC i.e. conservative approach), natural gas consumption for Hrazdan TPP Unit N5 for 2011 has been evaluated (9,205,500 m3).
Tables below show natural gas and syngas39 consumption of the above mentioned thermal power plants in 2009-2011. Table 5a: Natural and synthetic gas consumption at the Armenia TPPs in 2007- 2009
TPPs Fuel Type Fuel Consumption
1000 m3 Caloric Value
kcal/m3 2007 2008 2009 2009
Yerevan TPP Natural Gas (NG) 152,573 157,262 113,288 8,270.5
Syngas (SG) 111,466 38,233 16,830 2,401 Hrazdan TPP Natural Gas (NG) 353,948 44,894 250,914 8,148
Table 6b: Natural and synthetic gas consumption at the Armenia TPPs in 2008- 2010
TPPs Fuel Type Fuel Consumption
1000 m3 Caloric Value
kcal/m3 2008 2009 2010 2010
Yerevan TPP Natural Gas (NG) 157,262 113,288 38,195 8,288
Syngas (SG) 38,233 16,830 6,689 2,400 Hrazdan TPP Natural Gas (NG) 44,894 250,914 104,271 8,277
CCGT at YTPP Natural Gas (NG) 217,824 8,260
Table 7c: Natural and synthetic gas consumption at the Armenia TPPs in 2009-2011
TPPs Fuel Type Fuel Consumption, 1000 m3 Caloric Value kcal/m3 for 2011 2009 2010 2011
Yerevan TPP Natural Gas (NG) 113,288 38,195 0 N/A
Syngas (SG) 16,830 6,689 0 N/A
39 Syngas is produced by Nairit Plant CJSC during production of acetylene and supplied to Yerevan TPP.
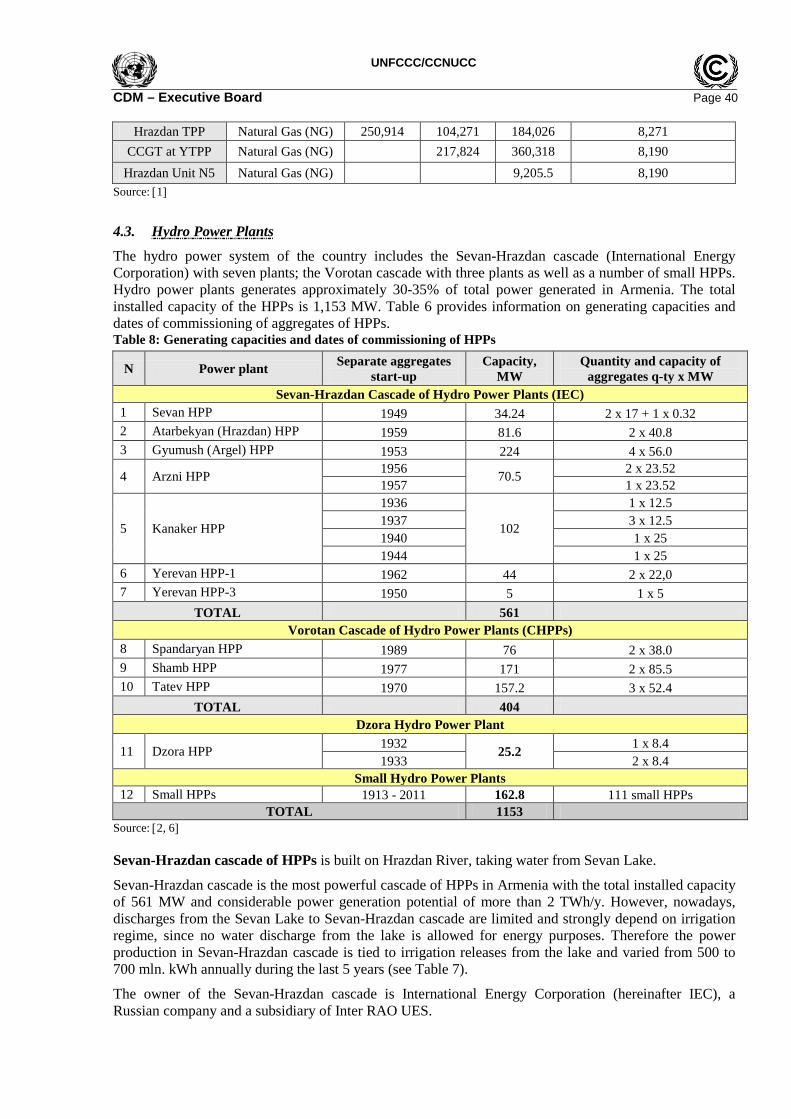
UNFCCC/CCNUCC CDM – Executive Board Page 40
Hrazdan TPP Natural Gas (NG) 250,914 104,271 184,026 8,271 CCGT at YTPP Natural Gas (NG) 217,824 360,318 8,190
Hrazdan Unit N5 Natural Gas (NG) 9,205.5 8,190 Source: [1]
4.3. Hydro Power Plants
The hydro power system of the country includes the Sevan-Hrazdan cascade (International Energy Corporation) with seven plants; the Vorotan cascade with three plants as well as a number of small HPPs. Hydro power plants generates approximately 30-35% of total power generated in Armenia. The total installed capacity of the HPPs is 1,153 MW. Table 6 provides information on generating capacities and dates of commissioning of aggregates of HPPs. Table 8: Generating capacities and dates of commissioning of HPPs
N Power plant Separate aggregates start-up
Capacity, MW
Quantity and capacity of aggregates q-ty x MW
Sevan-Hrazdan Cascade of Hydro Power Plants (IEC) 1 Sevan HPP 1949 34.24 2 x 17 + 1 x 0.32 2 Atarbekyan (Hrazdan) HPP 1959 81.6 2 x 40.8 3 Gyumush (Argel) HPP 1953 224 4 x 56.0
4 Arzni HPP 1956 70.5 2 x 23.52 1957 1 x 23.52
5 Kanaker HPP
1936
102
1 x 12.5 1937 3 x 12.5 1940 1 x 25 1944 1 x 25
6 Yerevan HPP-1 1962 44 2 x 22,0 7 Yerevan HPP-3 1950 5 1 x 5
TOTAL 561 Vorotan Cascade of Hydro Power Plants (CHPPs)
8 Spandaryan HPP 1989 76 2 x 38.0 9 Shamb HPP 1977 171 2 x 85.5 10 Tatev HPP 1970 157.2 3 x 52.4
TOTAL 404 Dzora Hydro Power Plant
11 Dzora HPP 1932 25.2 1 x 8.4 1933 2 x 8.4
Small Hydro Power Plants 12 Small HPPs 1913 - 2011 162.8 111 small HPPs
TOTAL 1153 Source: [2, 6] Sevan-Hrazdan cascade of HPPs is built on Hrazdan River, taking water from Sevan Lake.
Sevan-Hrazdan cascade is the most powerful cascade of HPPs in Armenia with the total installed capacity of 561 MW and considerable power generation potential of more than 2 TWh/y. However, nowadays, discharges from the Sevan Lake to Sevan-Hrazdan cascade are limited and strongly depend on irrigation regime, since no water discharge from the lake is allowed for energy purposes. Therefore the power production in Sevan-Hrazdan cascade is tied to irrigation releases from the lake and varied from 500 to 700 mln. kWh annually during the last 5 years (see Table 7).
The owner of the Sevan-Hrazdan cascade is International Energy Corporation (hereinafter IEC), a Russian company and a subsidiary of Inter RAO UES.
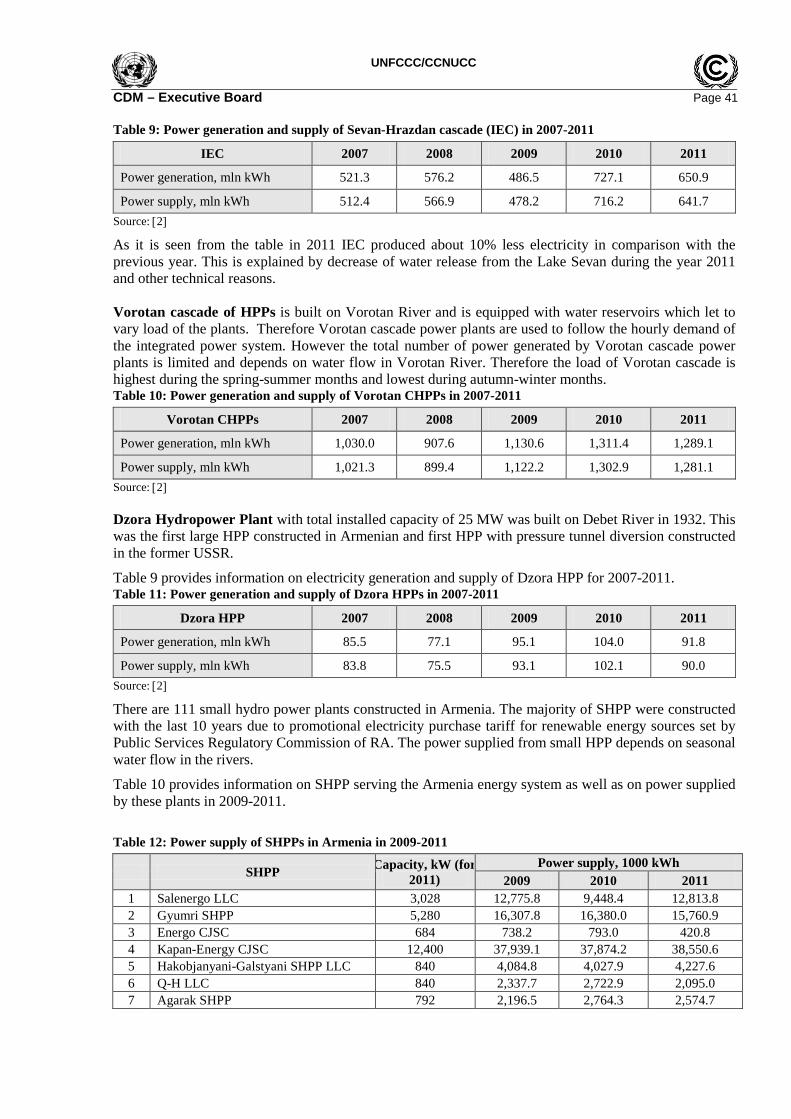
UNFCCC/CCNUCC CDM – Executive Board Page 41 Table 9: Power generation and supply of Sevan-Hrazdan cascade (IEC) in 2007-2011
IEC 2007 2008 2009 2010 2011
Power generation, mln kWh 521.3 576.2 486.5 727.1 650.9
Power supply, mln kWh 512.4 566.9 478.2 716.2 641.7 Source: [2]
As it is seen from the table in 2011 IEC produced about 10% less electricity in comparison with the previous year. This is explained by decrease of water release from the Lake Sevan during the year 2011 and other technical reasons. Vorotan cascade of HPPs is built on Vorotan River and is equipped with water reservoirs which let to vary load of the plants. Therefore Vorotan cascade power plants are used to follow the hourly demand of the integrated power system. However the total number of power generated by Vorotan cascade power plants is limited and depends on water flow in Vorotan River. Therefore the load of Vorotan cascade is highest during the spring-summer months and lowest during autumn-winter months. Table 10: Power generation and supply of Vorotan CHPPs in 2007-2011
Vorotan CHPPs 2007 2008 2009 2010 2011
Power generation, mln kWh 1,030.0 907.6 1,130.6 1,311.4 1,289.1
Power supply, mln kWh 1,021.3 899.4 1,122.2 1,302.9 1,281.1 Source: [2] Dzora Hydropower Plant with total installed capacity of 25 MW was built on Debet River in 1932. This was the first large HPP constructed in Armenian and first HPP with pressure tunnel diversion constructed in the former USSR.
Table 9 provides information on electricity generation and supply of Dzora HPP for 2007-2011. Table 11: Power generation and supply of Dzora HPPs in 2007-2011
Dzora HPP 2007 2008 2009 2010 2011
Power generation, mln kWh 85.5 77.1 95.1 104.0 91.8
Power supply, mln kWh 83.8 75.5 93.1 102.1 90.0 Source: [2]
There are 111 small hydro power plants constructed in Armenia. The majority of SHPP were constructed with the last 10 years due to promotional electricity purchase tariff for renewable energy sources set by Public Services Regulatory Commission of RA. The power supplied from small HPP depends on seasonal water flow in the rivers.
Table 10 provides information on SHPP serving the Armenia energy system as well as on power supplied by these plants in 2009-2011.
Table 12: Power supply of SHPPs in Armenia in 2009-2011
SHPP Capacity, kW (for 2011)
Power supply, 1000 kWh 2009 2010 2011
1 Salenergo LLC 3,028 12,775.8 9,448.4 12,813.8 2 Gyumri SHPP 5,280 16,307.8 16,380.0 15,760.9 3 Energo CJSC 684 738.2 793.0 420.8 4 Kapan-Energy CJSC 12,400 37,939.1 37,874.2 38,550.6 5 Hakobjanyani-Galstyani SHPP LLC 840 4,084.8 4,027.9 4,227.6 6 Q-H LLC 840 2,337.7 2,722.9 2,095.0 7 Agarak SHPP 792 2,196.5 2,764.3 2,574.7

UNFCCC/CCNUCC CDM – Executive Board Page 42
8 Armavir Luys CJSC 2,040 4,845.7 4,569.3 3,712.5 9 Mushegh SHPP LLC 442 2,601.8 2,703.9 2,752.1 10 Ijevan SHPP 612 4,211.9 3,434.5 2,996.5 11 Hydroenergia LLC (Yerevan) 750 3,421.9 3,546.6 3,414.2 12 Energia LLC (Avan) 200 1,061.0 1,131.3 962.9 13 Energia LLC (Aparan) 1,648 15,560.6 14,694.1 15,045.6 14 Ararat JEG CJSC (Kamenka) 620 3,568.6 2,009.4 3,491.6 15 Hydroenergia LLC (Kotayk) 1,190 2,613.0 2,581.2 3,216.6 16 G.Tatevosyan LLC 47 207.0 236.5 181.4 17 Energotekhnika LLC 320 1,054.8 1,181.6 1,239.4 18 Ler - Jur LLC (Atchut 1) 500 2,187.6 2,170.2 1,597.4 19
Energatsantsshin OJSC 1,200 1,066.2 22.8 182.8
20 Elegis SHPP LLC (Elegis) 800 4,673.9 5,144.7 5,420.3 21 Zovashen SHPP LLC 1,520 3,218.7 3,788.1 4,067.0 22 Atlas Energo LLC 440 562.1 545.9 322.5 23 Elgia LLC 180 2,180.4 1,153.4 0.0 24 Narenergo LLC 1,000 5,520.7 6,362.5 5,924.1 25 Bazenk CJSC (Yeghegis SHPP)* 9,950 26,230.9 30,844.7 20,387.1 26 Ler - Jur LLC (Atchut 2) 800 3,796.7 4,059.7 3,650.7 27 H-G HPP LLC 1,200 7,701.9 8,388.1 7,639.3 28 G.G.V. LLC 1,710 4,640.2 5,546.7 6,511.4 29 Akinq CJSC 1,400 1,423.3 2,223.8 1,980.9 30 H.A.G. Eryak CJSC 350 2,144.7 2,345.7 2,710.7 31 Zangezur - 95 SHPP 800 5,210.2 5,338.9 4,507.7 32 Benzar Energy LLC 279 978.2 898.1 793.0 33 Loraget SHPP LLC 514 1,473.9 2,328.7 1,633.0 34 Astghik - Hovhannes LLC 60 0.0 22.1 119.7 35 Tirakal LLC 5,200 13,973.8 15,299.6 12,656.3 36 Singl Gor LLC 621 2,207.2 2,567.6 2,032.1 37 Bitlis Men LLC 2,000 2,607.2 3,458.4 3,518.1 38 Ler Eks Energia LLC (2) 224 1,793.8 1,813.5 1,716.7 39 Ler - Jur LLC (Chichkhan) 1,000 3,267.8 2,791.9 3,458.4 40 RINE LLC 90 358.4 526.4 513.3 41 Elegis SHPP LLC (Hermon) 1,200 4,465.5 5,763.1 4,312.4 42 Pargev - Vardan LLC 280 1,094.3 1,101.0 1,077.1 43 Mavr LLC (Chanakhchi) 1,440 3,097.9 2,996.6 2,547.2 44 Engels Tumanyan LLC 60 295.1 282.2 317.4 45 Izodrom LLC 1,000 6,688.5 7,539.3 9,857.3 46 Tezh SHPP 2,064 6,452.7 6,038.0 4,454.0 47 Smbul LLC 100 858.4 927.6 944.5 48 Ost-El LLC (Haghpat 1) 320 0.0 0.0 0.0 49 Ost-El LLC (Haghpat 2) 1,900 2,175.3 4,493.8 4,297.9 50 Firma G.A.K. LLC 740 1,428.6 1,753.3 630.8 51 Ler Eks Energia LLC (4) 285 1,900.9 1,887.9 1,698.5 52 Ararat JEG CJSC (Gnevank 1 and 2) 1,287 5,602.3 6,384.5 7,515.7 53 Shaghat LLC 55 176.7 220.0 132.6 54 Hosk LLC 380 1,783.0 2,268.4 2,397.4 55 Ler Eks Energia LLC (6) 340 2,408.1 2,500.5 2,362.8 56 Qurkik Jalal LLC 420 852.2 648.0 581.9 57 Lernapati Kantegh LLC 549 1,319.9 1,459.7 1,139.1 58 THS LLC 5,140 8,921.8 10,205.7 10,037.9 59 Zorakar LLC 1,280 2,106.8 2,536.3 2,238.1 60 Atlas Energo LLC 2,000 2,274.7 5,480.2 4,529.3

UNFCCC/CCNUCC CDM – Executive Board Page 43
61 Gosghek LLC 364 784.9 1,017.7 994.3 62 Syunik LLC 1,500 7,762.1 9,296.1 8,038.8 63 Hak Hek LLC 1,530 3,367.3 4,313.2 3,119.7 64 Ler Eks Energia LLC (3) 256 2,074.0 2,061.9 1,945.2 65 Sektor Qvant LLC 493 2,960.0 3,537.8 4,514.6 66 A.A.Khachatrayn LLC 306 2,241.9 4,174.1 5,776.8 67 Hermon MAD LLC 1,570 1,601.9 2,636.8 2,179.7 68 Ani OJSC 3,900 904.7 4,719.3 6,310.2 69 Surb Aghbyur LLC 737 1,466.6 3,731.1 2,915.7 70 Arnavar LLC 1,229 1,761.7 3,309.7 2,785.7 71 Qarevard LLC 1,640 1,256.8 6,407.1 6,336.1 72 Eliza Farm LLC 725 938.1 3,287.2 3,059.7 73 Vakuflo LLC 1,260 1,560.8 3,263.0 2,774.8 74 Firma G.A.K. LLC (Her-Her 1) 630 1,181.0 4,760.3 5,542.7 75 Sektor Qvant LLC (Dzoragyugh 3) 274 596.9 4,336.2 5,289.9 76 Gosh SHPP 650 340.3 1,653.7 1,604.7 77 Sanrayz Electric CJSC 959 0.0 2,093.6 1,636.2 78 El-Kas LLC 2,910 0.0 9,558.7 8,473.1 79 Amberd SHPP (1) 2,280 0.0 5,585.0 5,480.9 80 VICI GROUP LLC (Hakhunm) 640 0.0 692.1 898.6 81 Loraget Hek LLC (Sisakan-1) 850 0.0 1,987.7 2,639.8 82 MINA-MAYA LLC (Eghegnadzor) 1,620 0.0 5,357.3 5,182.9 83 VG ev Vordiner (Her-Her-1) 1,610 0.0 2,903.5 3,073.5 84 Jaghayi Dzor (Goght-1) 1,950 0.0 5,589.8 4,709.9 85 Jaghayi Dzor (Goght-2) 2,320 0.0 5,178.9 5,167.7 86 Lusakunq LLC (Ayrq HPP-1) 360 0.0 132.7 833.6 87 Kh & M Ynkerner (Vararakn) 708 0.0 3,062.6 3,617.8 88 El-En-Eks LLC (Aghstev-1) 1,400 0.0 2,110.1 7,943.8 89 Lusakunq LLC (Ayrq HEK-2) 700 0.0 297.8 709.2 90
Apahov Taniq LLC (Vahagni) 1,000 0.0 3,146.8 7,383.4 91 Jahuk LLC (Artavan-1) 2,900 0.0 1,181.4 6,615.5 92 Azatek HEK CJSC (Azatek) 500 0.0 114.9 2,025.0 93 Tigran & Ashkhen LLC (T&A SHPP) 370 0.0 1,041.8 2,008.6 94 Energatsntsshin OJSC (Tsav) 2,740 0.0 1,934.8 6,600.5 95 ERIK SHPP LLC (Erik) 2,460 0.0 1,608.3 6,864.2 96 Qanar CJSC (Sarnakunq) 390 0.0 1,742.9 2,348.9 97 Lusakunk LLC (Avazan SHPP) 710 0.0 0.0 709.2 98 H.A.G. Eryak (Voskepar SHPP) 150 0.0 0.0 0.0 99 ZH ev H LLC (Angeghakot SHPP) 150 0.0 0.0 404.8
100 MKSHG Energia LLC (Martuni
1,800 0.0 0.0 3,552.4 101
Elbist LLC (Marmashen SHPP) 2,200 0.0 0.0 4,628.3
102 Karbi Jrhos HPP 1,000 0.0 0.0 1,700.7 103 Masfish LLC (Vardanants SHPP) 1,050 0.0 0.0 3,726.2 104 Sirarpi AH LLC 70 0.0 0.0 1,189.9 105 Afamia LLC (Darbas SHPP-2) 900 0.0 0.0 277.2 106 Firma G.A.K. LLC (Saravan) 2,470 0.0 0.0 2,015.2 107 Griar CJSC (Getik-1) 5,600 0.0 0.0 3,945.6 108 Jermuk Hidrotekh LLC (Jermuk HPP-
2,350 0.0 0.0 1,396.2
109 Mina-Maya LLC (Eghegnadzor SHPP-
1,060 0.0 0.0 3,308.5 110 Khum SHPP 290 0.0 0.0 309.1 111 Martsiget-2 SHPP (Argishti-1 LLC) 5,130 0.0 0.0 135.5
TOTAL 162,800 297,445.7** 400,052.6*** 441,406.6****
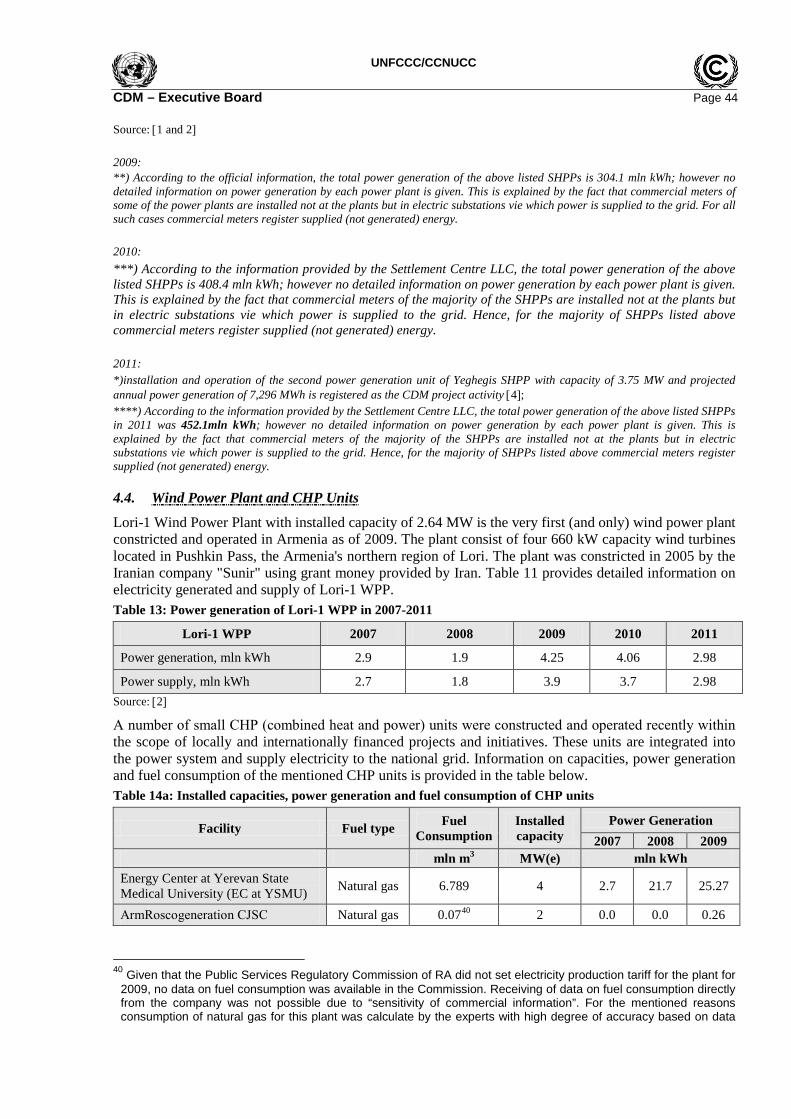
UNFCCC/CCNUCC CDM – Executive Board Page 44 Source: [1 and 2] 2009: **) According to the official information, the total power generation of the above listed SHPPs is 304.1 mln kWh; however no detailed information on power generation by each power plant is given. This is explained by the fact that commercial meters of some of the power plants are installed not at the plants but in electric substations vie which power is supplied to the grid. For all such cases commercial meters register supplied (not generated) energy. 2010: ***) According to the information provided by the Settlement Centre LLC, the total power generation of the above listed SHPPs is 408.4 mln kWh; however no detailed information on power generation by each power plant is given. This is explained by the fact that commercial meters of the majority of the SHPPs are installed not at the plants but in electric substations vie which power is supplied to the grid. Hence, for the majority of SHPPs listed above commercial meters register supplied (not generated) energy. 2011: *)installation and operation of the second power generation unit of Yeghegis SHPP with capacity of 3.75 MW and projected annual power generation of 7,296 MWh is registered as the CDM project activity [4]; ****) According to the information provided by the Settlement Centre LLC, the total power generation of the above listed SHPPs in 2011 was 452.1mln kWh; however no detailed information on power generation by each power plant is given. This is explained by the fact that commercial meters of the majority of the SHPPs are installed not at the plants but in electric substations vie which power is supplied to the grid. Hence, for the majority of SHPPs listed above commercial meters register supplied (not generated) energy.
4.4. Wind Power Plant and CHP Units
Lori-1 Wind Power Plant with installed capacity of 2.64 MW is the very first (and only) wind power plant constricted and operated in Armenia as of 2009. The plant consist of four 660 kW capacity wind turbines located in Pushkin Pass, the Armenia's northern region of Lori. The plant was constricted in 2005 by the Iranian company "Sunir" using grant money provided by Iran. Table 11 provides detailed information on electricity generated and supply of Lori-1 WPP. Table 13: Power generation of Lori-1 WPP in 2007-2011
Lori-1 WPP 2007 2008 2009 2010 2011
Power generation, mln kWh 2.9 1.9 4.25 4.06 2.98
Power supply, mln kWh 2.7 1.8 3.9 3.7 2.98 Source: [2]
А number of small CHP (combined heat and power) units were constructed and operated recently within the scope of locally and internationally financed projects and initiatives. These units are integrated into the power system and supply electricity to the national grid. Information on capacities, power generation and fuel consumption of the mentioned CHP units is provided in the table below. Table 14a: Installed capacities, power generation and fuel consumption of CHP units
Facility Fuel type Fuel Consumption
Installed capacity
Power Generation 2007 2008 2009
mln m3 MW(e) mln kWh Energy Center at Yerevan State Medical University (EC at YSMU) Natural gas 6.789 4 2.7 21.7 25.27
ArmRоscogeneration CJSC Natural gas 0.0740 2 0.0 0.0 0.26
40 Given that the Public Services Regulatory Commission of RA did not set electricity production tariff for the plant for
2009, no data on fuel consumption was available in the Commission. Receiving of data on fuel consumption directly from the company was not possible due to “sensitivity of commercial information”. For the mentioned reasons consumption of natural gas for this plant was calculate by the experts with high degree of accuracy based on data
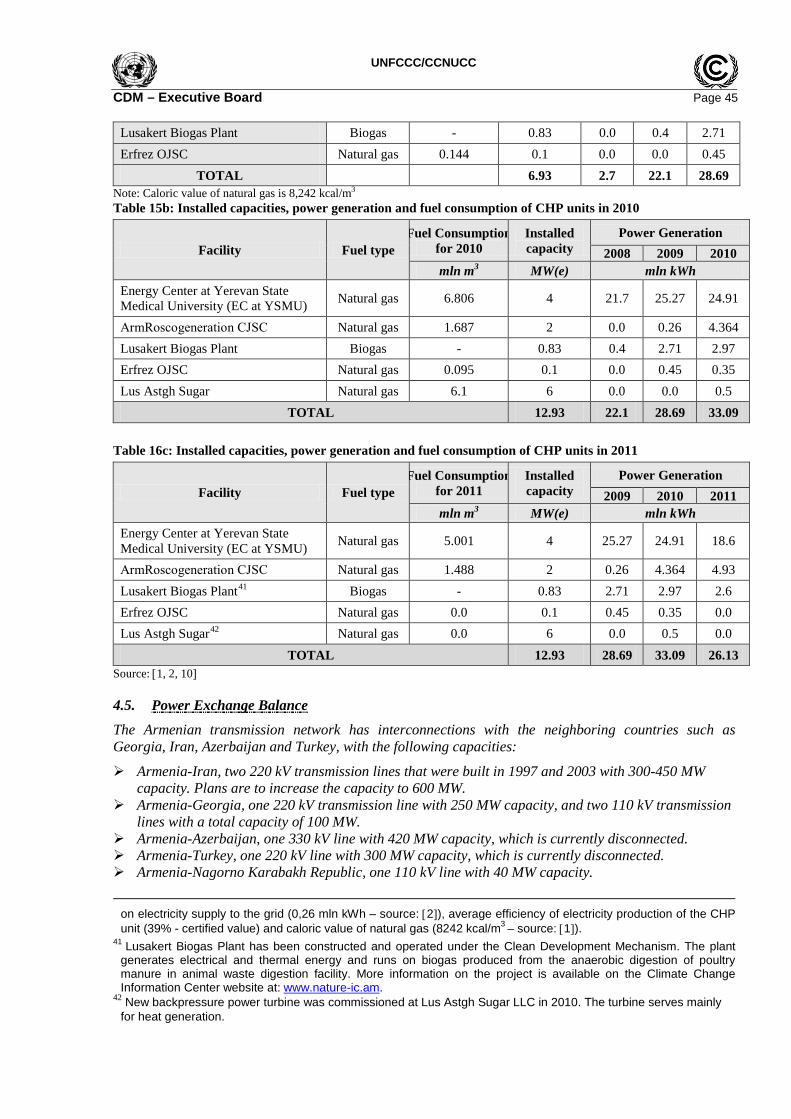
UNFCCC/CCNUCC CDM – Executive Board Page 45
Lusakert Biogas Plant Biogas - 0.83 0.0 0.4 2.71 Erfrez OJSC Natural gas 0.144 0.1 0.0 0.0 0.45
TOTAL 6.93 2.7 22.1 28.69 Note: Caloric value of natural gas is 8,242 kcal/m3 Table 15b: Installed capacities, power generation and fuel consumption of CHP units in 2010
Facility Fuel type Fuel Consumption
for 2010 Installed capacity
Power Generation 2008 2009 2010
mln m3 MW(e) mln kWh Energy Center at Yerevan State Medical University (EC at YSMU) Natural gas 6.806 4 21.7 25.27 24.91
ArmRоscogeneration CJSC Natural gas 1.687 2 0.0 0.26 4.364 Lusakert Biogas Plant Biogas - 0.83 0.4 2.71 2.97 Erfrez OJSC Natural gas 0.095 0.1 0.0 0.45 0.35 Lus Astgh Sugar Natural gas 6.1 6 0.0 0.0 0.5
TOTAL 12.93 22.1 28.69 33.09 Table 16c: Installed capacities, power generation and fuel consumption of CHP units in 2011
Facility Fuel type Fuel Consumption
for 2011 Installed capacity
Power Generation 2009 2010 2011
mln m3 MW(e) mln kWh Energy Center at Yerevan State Medical University (EC at YSMU) Natural gas 5.001 4 25.27 24.91 18.6
ArmRоscogeneration CJSC Natural gas 1.488 2 0.26 4.364 4.93 Lusakert Biogas Plant41 Biogas - 0.83 2.71 2.97 2.6 Erfrez OJSC Natural gas 0.0 0.1 0.45 0.35 0.0 Lus Astgh Sugar42 Natural gas 0.0 6 0.0 0.5 0.0
TOTAL 12.93 28.69 33.09 26.13 Source: [1, 2, 10]
4.5. Power Exchange Balance
The Armenian transmission network has interconnections with the neighboring countries such as Georgia, Iran, Azerbaijan and Turkey, with the following capacities:
Armenia-Iran, two 220 kV transmission lines that were built in 1997 and 2003 with 300-450 MW capacity. Plans are to increase the capacity to 600 MW.
Armenia-Georgia, one 220 kV transmission line with 250 MW capacity, and two 110 kV transmission lines with a total capacity of 100 MW.
Armenia-Azerbaijan, one 330 kV line with 420 MW capacity, which is currently disconnected. Armenia-Turkey, one 220 kV line with 300 MW capacity, which is currently disconnected. Armenia-Nagorno Karabakh Republic, one 110 kV line with 40 MW capacity.
on electricity supply to the grid (0,26 mln kWh – source: [2]), average efficiency of electricity production of the CHP unit (39% - certified value) and caloric value of natural gas (8242 kcal/m3 – source: [1]).
41 Lusakert Biogas Plant has been constructed and operated under the Clean Development Mechanism. The plant generates electrical and thermal energy and runs on biogas produced from the anaerobic digestion of poultry manure in animal waste digestion facility. More information on the project is available on the Climate Change Information Center website at: www.nature-ic.am.
42 New backpressure power turbine was commissioned at Lus Astgh Sugar LLC in 2010. The turbine serves mainly for heat generation.
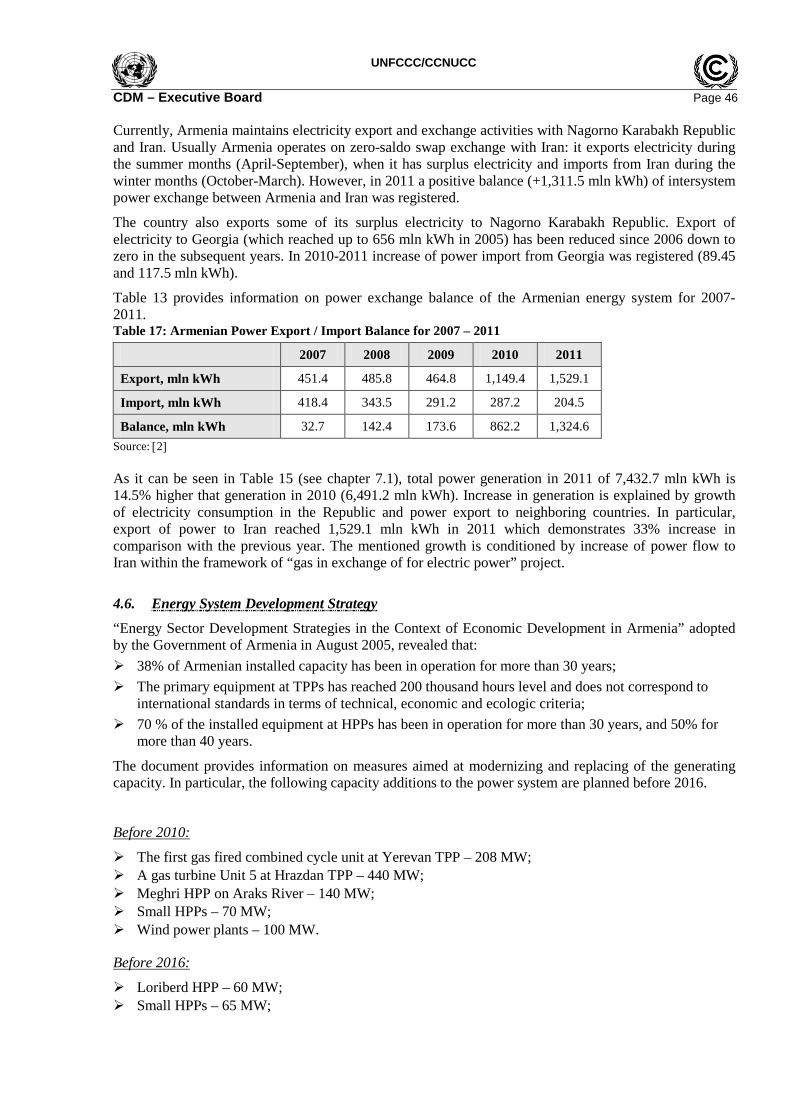
UNFCCC/CCNUCC CDM – Executive Board Page 46 Currently, Armenia maintains electricity export and exchange activities with Nagorno Karabakh Republic and Iran. Usually Armenia operates on zero-saldo swap exchange with Iran: it exports electricity during the summer months (April-September), when it has surplus electricity and imports from Iran during the winter months (October-March). However, in 2011 a positive balance (+1,311.5 mln kWh) of intersystem power exchange between Armenia and Iran was registered.
The country also exports some of its surplus electricity to Nagorno Karabakh Republic. Export of electricity to Georgia (which reached up to 656 mln kWh in 2005) has been reduced since 2006 down to zero in the subsequent years. In 2010-2011 increase of power import from Georgia was registered (89.45 and 117.5 mln kWh).
Table 13 provides information on power exchange balance of the Armenian energy system for 2007-2011. Table 17: Armenian Power Export / Import Balance for 2007 – 2011
2007 2008 2009 2010 2011
Export, mln kWh 451.4 485.8 464.8 1,149.4 1,529.1
Import, mln kWh 418.4 343.5 291.2 287.2 204.5
Balance, mln kWh 32.7 142.4 173.6 862.2 1,324.6 Source: [2] As it can be seen in Table 15 (see chapter 7.1), total power generation in 2011 of 7,432.7 mln kWh is 14.5% higher that generation in 2010 (6,491.2 mln kWh). Increase in generation is explained by growth of electricity consumption in the Republic and power export to neighboring countries. In particular, export of power to Iran reached 1,529.1 mln kWh in 2011 which demonstrates 33% increase in comparison with the previous year. The mentioned growth is conditioned by increase of power flow to Iran within the framework of “gas in exchange of for electric power” project.
4.6. Energy System Development Strategy
“Energy Sector Development Strategies in the Context of Economic Development in Armenia” adopted by the Government of Armenia in August 2005, revealed that: 38% of Armenian installed capacity has been in operation for more than 30 years; The primary equipment at TPPs has reached 200 thousand hours level and does not correspond to
international standards in terms of technical, economic and ecologic criteria; 70 % of the installed equipment at HPPs has been in operation for more than 30 years, and 50% for
more than 40 years.
The document provides information on measures aimed at modernizing and replacing of the generating capacity. In particular, the following capacity additions to the power system are planned before 2016.
Before 2010:
The first gas fired combined cycle unit at Yerevan TPP – 208 MW; A gas turbine Unit 5 at Hrazdan TPP – 440 MW; Meghri HPP on Araks River – 140 MW; Small HPPs – 70 MW; Wind power plants – 100 MW.
Before 2016:
Loriberd HPP – 60 MW; Small HPPs – 65 MW;

UNFCCC/CCNUCC CDM – Executive Board Page 47 Wind power plants – 200 MW; The second gas fired combined cycle unit at Yerevan TPP – 208 MW; The 6th combined cycle unit at Hrazdan TPP – 400 MW.
Commissioning of the first CCGT unit at Yerevan TPP took place in 2010. Gas-fired Unit-5 (steam turbine in combination with a gas turbine) at Hrazdan TPP was commissioned in 2011.
Some of the provisions of the above mentioned Energy Strategy were revised (updated) in Work Plan of the Ministry of Energy of Armenia based on the Provisions of the National Security Strategy of RA (2007) and in Renewable Energy Roadmap for Armenia (2011).
5. Methodology As it was mentioned in the chapter 3 of this report for this particular study a Methodological tool to calculate the emission factor for an electricity system (Version 02.2.1) approved by the CDM Executive Board (EB63) has been applied. In this chapter detailed explanation of the mentioned tool is given.
5.1. Scope and Applicability
This methodological tool determines the CO2 emission factor for the displacement of electricity generated by power plants in an electricity system, by calculating the Combined Margin emission factor (CM) of the electricity system. The CM is the result of a weighted average of two emission factors pertaining to the electricity system: the Operating Margin (OM) and the Build Margin (BM).
OM is the emission factor that refers to the group of existing power plants whose current electricity generation would be affected by the proposed CDM project activity.
BM is the emission factor that refers to the group of prospective power plants whose construction and future operation would be affected by the proposed CDM project activity. This tool may be applied to estimate the OM, BM and/or CM when calculating baseline emissions for a project activity that substitutes grid electricity, i.e. where a project activity supplies electricity to a grid or a project activity that results in savings of electricity that would have been provided by the grid (e.g. demand-side energy efficiency projects). This tool is also referred to in the “Tool to calculate project emissions from electricity consumption” for the purpose of calculating project and leakage emissions in case where a project activity consumes electricity from the grid or results in increase of consumption of electricity from the grid outside the project boundary. This tool provides procedures to determine the following parameters:
Parameter Unit Description
EFgrid,CM,y tCO2/MWh Combined margin CO2 emission factor for electricity system in year y
EFgrid,BM,y tCO2/MWh Build margin CO2 emission factor for electricity system in year y
EFgrid,OM,y tCO2/MWh Operating margin CO2 emission factor for electricity system in year y
5.2. Baseline Methodology Procedure
The tool sets the following six steps for calculation of baseline: STEP 1. Identify the relevant electricity systems. STEP 2. Choose whether to include off-grid power plants in the project electricity system (optional). STEP 3. Select a method to determine the operating margin (OM). STEP 4. Calculate the operating margin emission factor according to the selected method. STEP 5. Calculate the build margin (BM) emission factor.

UNFCCC/CCNUCC CDM – Executive Board Page 48 STEP 6. Calculate the combined margin (CM) emissions factor. Step 1: Identify the relevant electricity systems
For determining the electricity emission factors, a project electricity system is defined by the spatial extent of the power plants that are physically connected through transmission and distribution lines to the project activity and that can be dispatched without significant transmission constraints.
Similarly, a connected electricity system, e.g. national or international, is defined as an electricity system that is connected by transmission lines to the project electricity system. Power plants within the connected electricity system can be dispatched without significant transmission constraints but transmission to the project electricity system has significant transmission constraint.
For the purpose of this study the national grid is considered as the project electricity system.43.
Electricity transfers from connected electricity systems to the project electricity system are defined as electricity imports and electricity transfers to connected electricity systems are defined as electricity exports.
Electricity exports should not be subtracted from electricity generation data used for calculating and monitoring the electricity emission factors.
The Armenian power system maintains power exchange with the national electricity grid of Iran. In such a way, Iranian national grid is considered as the connected electricity system. According to the methodology for net electricity import from the connected electricity system located in another country, the emission factor is 0 tons CO2 per MWh. STEP 2. Choose whether to include off-grid power plants in the project electricity system
This step is not relevant to this study. STEP 3. Select a method to determine the operating margin (OM)
The calculation of the operating margin emission factor (EFgrid,OM,y) is based on one of the following methods:
(a) Simple OM; or (b) Simple adjusted OM; or (c) Dispatch data analysis OM; or (d) Average OM.
For the purpose of this study option (b) – Simple adjusted OM was selected for calculation of the operating margin emission factor. This is because low-cost/must-run resources44 constitute more than 50% of the total grid generation in the host country (see Chapter 7).
For calculation of the Simple adjusted OM, the model proposes to use either of the two following data vintages:
Ex ante option: If the ex ante option is chosen, the emission factor is determined once at the validation stage, thus no monitoring and recalculation of the emissions factor during the crediting period is required. 43 No information on delineation of the project electricity system and connected electricity system has been published by the host country DNA. According to the acting legislation, the proposed renewable power generation project (capacity) will be connected to the Armenian national power grid operated by the Electric Networks of Armenia” CJSC (ENA). This national electricity grid is the unique transmission and distribution line, to which all power plants serving the energy system of Armenia are physically connected. 44 Low-cost/must-run resources are defined as power plants with low marginal generation costs or power plants that are dispatched independently of the daily or seasonal load of the grid. They typically include hydro, geothermal, wind, low-cost biomass, nuclear and solar generation.

UNFCCC/CCNUCC CDM – Executive Board Page 49 For grid power plants, use a 3-year generation-weighted average, based on the most recent data available at the time of submission of the CDM-PDD to the DOE for validation.
Ex post option: If the ex post option is chosen, the emission factor is determined for the year in which the project activity displaces grid electricity, requiring the emissions factor to be updated annually during monitoring. If the data required calculating the emission factor for year y is usually only available later than six months after the end of year y, alternatively the emission factor of the previous year y-1 may be used.
For the underlying project activity the ex-ante option for the years 2009 to 2011 is chosen for calculation of Simple adjusted OM. Step 4: Calculate the operating margin emission factor according to the selected method
The simple adjusted OM emission factor (EF grid, OM-adj,y) is a variation of the simple OM, where the power plants / units (including imports) are separated in low-cost/must-run power sources (k) and other power sources (m). The simple adjusted OM is calculated based on the net electricity generation of each power unit and an emission factor for each power unit, as follows:
Where: EFgrid,OM-adj,y - Simple adjusted operating margin CO2 emission factor in year y (tCO2/MWh) λy - Factor expressing the percentage of time when low-cost/must-run power units are on
the margin in year y EGm,y - Net quantity of electricity generated and delivered to the grid by power unit m in year y (MWh) EGk,y - Net quantity of electricity generated and delivered to the grid by power unit k in year y
(MWh) EFEL,m,y - CO2 emission factor of power unit m in year y (tCO2/MWh) EFEL,k,y - CO2 emission factor of power unit k in year y (tCO2/MWh) m - All grid power units serving the grid in year y except low-cost/must-run power units k - All low-cost/must run grid power units serving the grid in year y y - The relevant year as per the data vintage chosen
Net electricity imports must be considered low-cost/must-run units k.
Emission factors EFEL,m,y is determined in the following way.
Where: EFEL,m,y - CO2 emission factor of power unit m in year y (tCO2/MWh) FCi,m,y - Amount of fossil fuel type i consumed by power unit m in year y (mass or volume unit) NCVi,y - Net calorific value (energy content) of fossil fuel type i in year y (GJ/mass or volume unit) EFCO2,i,y - CO2 emission factor of fossil fuel type i in year y (tCO2/GJ) EGm,y - Net quantity of electricity generated and delivered to the grid by power unit m in year y (MWh) m - All power units serving the grid in year y except low-cost/must-run power units i - All fossil fuel types combusted in power unit m in year y y - The relevant year as per the data vintage chosen

UNFCCC/CCNUCC CDM – Executive Board Page 50
The same equation is used for calculation of CO2 emission factor for low-cost/must-run power units (EFELk,y). The parameter λy is defined as follows:
Lambda ( λy) should be calculated as follows (see figure below):
Step (i) Plot a load duration curve. Collect chronological load data (typically in MW) for each hour of the year y, and sort the load data from the highest to the lowest MW level. Plot MW against 8760 hours in the year (in descending order).
Step (ii) Collect power generation data from each power plant/unit. Calculate the total annual generation (in MWh) from low-cost / must-run power plants/units (i.e. Σk EGk,y).
Step (iii) Fill the load duration curve. Plot a horizontal line across the load duration curve such that the area under the curve (MW times hours) equals the total generation (in MWh) from low-cost/must-run power plants/units (i.e. Σk EGk,y).
Step (iv) Determine the “Number of hours for which low-cost/must-run sources are on the margin in year y”. First, locate the intersection of the horizontal line plotted in Step (iii) and the load duration curve plotted in Step (i). The number of hours (out of the total of 8760 hours) to the right of the intersection is the number of hours for which low-cost/must-run sources are on
the margin. If the lines do not intersect, then one may conclude that low-cost/must-run sources do not appear on the margin and λy is equal to zero. Step 5: Calculate the build margin emission factor
The sample group of power units m used to calculate the build margin should be determined as per the following procedure:
(a) Identify the set of five power units, excluding power units registered as CDM project activities, that started to supply electricity to the grid most recently (SET5-units) and determine their annual electricity generation (AEGSET-5-units, in MWh);
(b) Determine the annual electricity generation of the project electricity system, excluding power units registered as CDM project activities (AEGtotal, in MWh). Identify the set of power units, excluding power units registered as CDM project activities, that started to supply electricity to the grid most recently and that comprise 20% of AEGtotal (if 20% falls on part of the generation of a unit, the generation of that unit is fully included in the calculation) (SET≥20%) and determine their annual electricity generation (AEGSET-
≥20%, in MWh);
(c) From SET5-units and SET≥20% select the set of power units that comprises the larger annual electricity generation (SETsample);
Identify the date when the power units in SETsample started to supply electricity to the grid. If none of the power units in SETsample started to supply electricity to the grid more than 10 years ago, then use SETsample to calculate the build margin. Ignore steps (d), (e) and (f).

UNFCCC/CCNUCC CDM – Executive Board Page 51 Otherwise:
(d) Exclude from SETsample the power units which started to supply electricity to the grid more than 10 years ago. Include in that set the power units registered as CDM project activity, starting with power units that started to supply electricity to the grid most recently, until the electricity generation of the new set comprises 20% of the annual electricity generation of the project electricity system (if 20% falls on part of the generation of a unit, the generation of that unit is fully included in the calculation) to the extent is possible. Determine for the resulting set (SETsample-CDM) the annual electricity generation (AEGSET-sample-
CDM, in MWh);
If the annual electricity generation of that set is comprises at least 20% of the annual electricity generation of the project electricity system (i.e. AEGSET-sample-CDM ≥ 0.2 × AEGtotal), then use the sample group SETsample-CDM to calculate the build margin. Ignore steps (e) and (f).
Otherwise:
(e) Include in the sample group SETsample-CDM the power units that started to supply electricity to the grid more than 10 years ago until the electricity generation of the new set comprises 20% of the annual electricity generation of the project electricity system (if 20% falls on part of thegeneration of a unit, the generation of that unit is fully included in the calculation);
(f) The sample group of power units m used to calculate the build margin is the resulting set (SETsample-
CDM->10yrs).
The build margin emissions factor is the generation-weighted average emission factor (tCO2/MWh) of all power units m during the most recent year y for which power generation data is available, calculated as follows:
Where: EFgrid,BM,y - Build margin CO2 emission factor in year y (tCO2/MWh) EGm,y - Net quantity of electricity generated and delivered to the grid by power unit m in year y (MWh) EFEL,m,y - CO2 emission factor of power unit m in year y (tCO2/MWh) m - Power units included in the build margin y - Most recent historical year for which power generation data is available Step 6: Calculate the combined margin emissions factor
The calculation of the combined margin (CM) emission factor (EFgrid,CM,y) is based on one of the following methods:
(a) Weighted average CM; or
(b) Simplified CM.
For the purpose of this study the weighted average CM method (option a) has been used..
The combined margin emissions factor is calculated as follows:

UNFCCC/CCNUCC CDM – Executive Board Page 52 Where: EFgrid,BM,y - Build margin CO2 emission factor in year y (tCO2/MWh) EFgrid,OM,y - Operating margin CO2 emission factor in year y (tCO2/MWh) wOM - Weighting of operating margin emissions factor (%) wBM - Weighting of build margin emissions factor (%) The following default values should be used for wOM and wBM:
Wind and solar power generation project activities: wOM = 0.75 and wBM = 0.25 (owing to their intermittent and non-dispatchable nature) for the first crediting period and for subsequent crediting periods;
All other projects: wOM = 0.5 and wBM = 0.5 for the first crediting period, and wOM = 0.25 and wBM = 0.75 for the second and third crediting period, 9 unless otherwise specified in the approved methodology which refers to this tool.
6. Data Sources In accordance with the provisions of the tool, calculation of baseline is done based on data from an official source (where available). Information from the following organizations has been used for all relevant calculations:
Public Services Regulatory Commission of RA (former Energy Commission of Armenia) was established in on April 3, 1997 by the Order of the President of the Republic of Armenia to implement regulatory and tariff policy in the energy sector of the country. The main functions of the commission are as follows: issues generation operational licenses and construction authorizations, sets maximum tariffs for electricity and gas imports, issues licenses for power market service provision activities, sets tariffs for electrical and thermal energy and gas, etc.
“Settlement Center” Close Joint-Stock Company (under the Ministry of Energy and Natural Resources of RA) is the state-owned company, which executes registration and measuring of power generation and supply through the country, based on commercial meters indicators, as well as carries out relevant financial calculations and analysis necessary for the settlement of accounts between power generating companies and electricity purchaser – “Armenian Electric Network of Armenia” CJSC.
Settlement Center runs comprehensive and advanced software which allows both simultaneous estimation of more than 40 parameters of the network and power system and archiving the most important data, including half-hourly generation and own consumption for all power plants serving the Armenian energy system. The current document incorporates information and data on the Armenian energy sector, officially obtained from the Ministry of Energy and Natural Resources (Settlement Center CJSC) and Public Services Regulatory Commission of RA as well as from other publicly available official sources referred in this chapter and in the bibliography. All data as well as reference documents can be obtained from the DNA and furnished to a DOE upon request of the project proponents should the latter use this study for CDM project development. Some specific data were obtained from ArmRosgasprom CJSC. The tool requires that the data used for baseline assessment be presented in a matter that enabled reproducing of the calculation of the build margin and operating margin grid emission factors. For that reason all key data and parameters used for the calculation of the CM GEF are introduced in the tables below. Measurement procedures and monitoring frequency of each particular data and parameter should be decided as per provisions of the Tool and corresponding monitoring plan requirements. Given that ex post option was chosen, the emission factor is determined for the year in which the project activity displaces
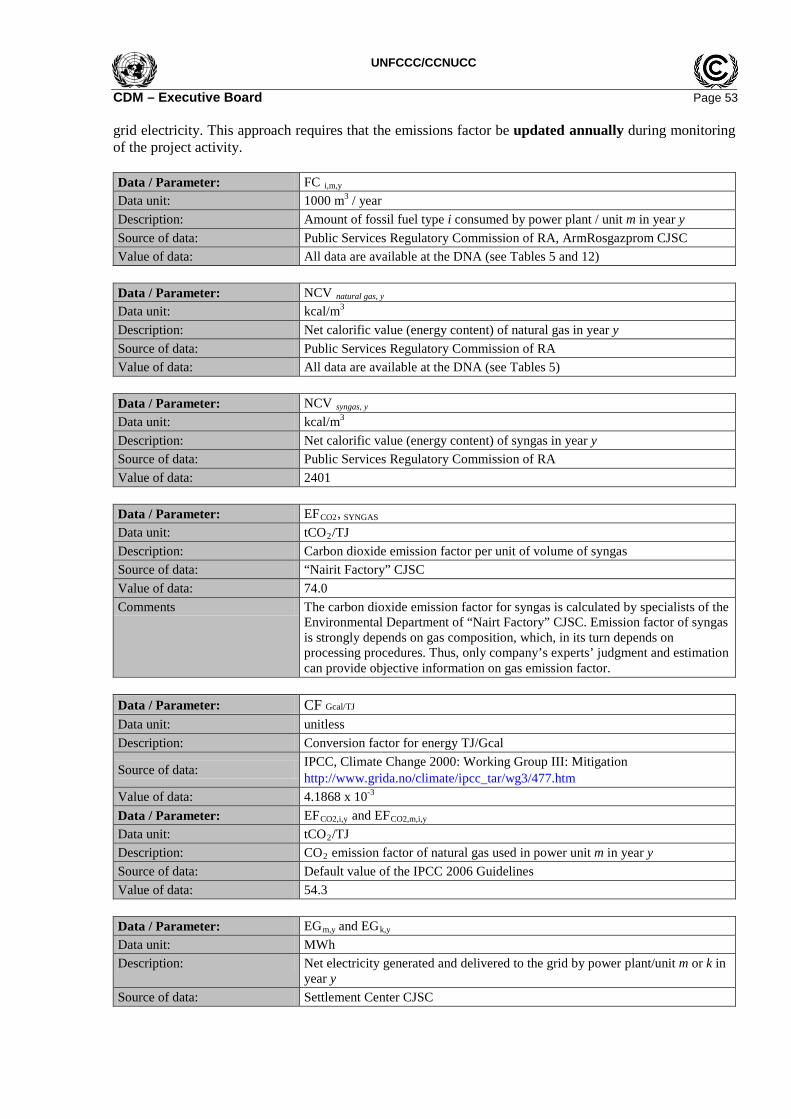
UNFCCC/CCNUCC CDM – Executive Board Page 53 grid electricity. This approach requires that the emissions factor be updated annually during monitoring of the project activity. Data / Parameter: FC i,m,y Data unit: 1000 m3 / year Description: Amount of fossil fuel type i consumed by power plant / unit m in year y Source of data: Public Services Regulatory Commission of RA, ArmRosgazprom CJSC Value of data: All data are available at the DNA (see Tables 5 and 12)
Data / Parameter: NCV natural gas, y Data unit: kcal/m3 Description: Net calorific value (energy content) of natural gas in year y Source of data: Public Services Regulatory Commission of RA Value of data: All data are available at the DNA (see Tables 5)
Data / Parameter: NCV syngas, y Data unit: kcal/m3 Description: Net calorific value (energy content) of syngas in year y Source of data: Public Services Regulatory Commission of RA Value of data: 2401
Data / Parameter: EFCO2, SYNGAS Data unit: tCO2/TJ Description: Carbon dioxide emission factor per unit of volume of syngas Source of data: “Nairit Factory” CJSC Value of data: 74.0 Comments The carbon dioxide emission factor for syngas is calculated by specialists of the
Environmental Department of “Nairt Factory” CJSC. Emission factor of syngas is strongly depends on gas composition, which, in its turn depends on processing procedures. Thus, only company’s experts’ judgment and estimation can provide objective information on gas emission factor.
Data / Parameter: CF Gcal/TJ Data unit: unitless Description: Conversion factor for energy TJ/Gcal
Source of data: IPCC, Climate Change 2000: Working Group III: Mitigation http://www.grida.no/climate/ipcc_tar/wg3/477.htm
Value of data: 4.1868 x 10⁻³ Data / Parameter: EFCO2,i,y and EFCO2,m,i,y Data unit: tCO2/TJ Description: CO2 emission factor of natural gas used in power unit m in year y Source of data: Default value of the IPCC 2006 Guidelines Value of data: 54.3
Data / Parameter: EGm,y and EGk,y Data unit: MWh Description: Net electricity generated and delivered to the grid by power plant/unit m or k in
year y Source of data: Settlement Center CJSC

UNFCCC/CCNUCC CDM – Executive Board Page 54 Value of data: All data are available at the DNA (see Chapter 4 and 7)
Data / Parameter: Group of power source plants for the OM Data unit: Name of plants Description: OM includes all generating power plants serving the power system except for
low-cost / must-run power plants / units and imports. Source of data: Public Services Regulatory Commission of RA Value of data: All data are available at the DNA (see Chapter 7)
Data / Parameter: Group of power source plants for the BM Data unit: Name of plants Description: BM includes either the set of five power units that have been built most
recently or the set of power capacity additions in the electricity system that comprise 20% of the system generation (in MWh) and that have been built most recently.
Source of data: Public Services Regulatory Commission of RA Value of data: All data are available at the DNA (see Chapter 7) Data / Parameter: EFgrid,OM,y Data unit: tCO2/MWh Description: Operating margin (OM) emission factor Source of data: Public Service Regulatory Commission of RA, Settlement Center CJSC Value of data: All data are available at the DNA (see Chapter 7)
Data / Parameter: EFgrid,BM,y Data unit: tCO2/MWh Description: Build margin (BM) emission factor Source of data: Public Service Regulatory Commission of RA, Settlement Center CJSC Value of data: All data are available at the DNA (see Chapter 7) Data / Parameter: EFgrid,BM,y Data unit: tCO2/MWh Description: Build margin (BM) emission factor Source of data: Public Service Regulatory Commission of RA, Settlement Center CJSC Value of data: All data are available at the DNA (see Chapter 7)
Data / Parameter: Import of electricity Data unit: MWh Description: Electricity transfers from connected electricity systems Source of data: Settlement Center CJSC Value of data: All data are available at the DNA (see Table 13)
Data / Parameter: Lambda factor Description: Period of time when low-cost / must run sources are on the margin Source of data: Settlement Center CJSC Value of data: All data are available at the DNA (see Chapter 7)
7. Baseline Calculation This chapter represents the results of Operating, Built and Combined Margin emissions calculations performed in accordance with the above described methodological approaches.

UNFCCC/CCNUCC CDM – Executive Board Page 55 Calculations have been made by means of MO Excel based model for each year (2009 to 2011), which allows a user to assess grid emission factor under various scenarios of power system development.
Results of Combined Margin calculation presented may be used by project participants for evaluation of GHG mitigation potential of CDM project activities and, thus, can be allied for development of both CDM Project Idea Notes and Project Design Documents. However, these results should not be treated us compulsory.
7.1. Calculation of Simple Adjusted Operational Margin
For calculation of the operating margin emission factor option (b) Simple Adjusted OM method was selected because low-cost/must-run resources constitute more than 50% of the total grid generation in Armenia. This is demonstrated in the table 14.
In accordance with provisions of the Tool, Hrazdan TPP, Hrazdan TPP Unit N5 and Yerevan TPP were selected as no low-cost / must-run power plants. Table 18: Share of low-cost/must-run plants in total power generation in 2007-2011 (mln kWh)
2007 2008 2009 2010 2011 NPP 2,553.4 2,461.7 2,493.7 2,490.0 2,548.1 Hrazdan TPP (no low-cost/must run) 1,131.6 1,495.5 887.8 348.4 628.1 Yerevan TPP (no low-cost/must run) 357.1 336.4 240.7 73.4 0.0 CCGT Unit at YTPP (no low-cost/must run) 0.0 0.0 0.0 991.3 1,685.7 Hrazdan TPP Unit N5 (no low-cost/must run) 0.0 0.0 0.0 0.0 57.9 Sevan-Hrazdan cascade of HPPs (IPC) 521.3 576.2 486.5 727.1 650.9 Vorotan cascade of HPPs 1,030 907.6 1,130.6 1,311.4 1,289.1 Dzora HPP 85.5 77.1 95.1 104.0 91.8 Small HPPs and other small plants* 215.7 259.7 337.0 445.5 481.2 TOTAL 5,897.5 6,114.2 5,671.4 6,491.2 7,432.7 Must-run and low-cost plants 4,408.8 4,282.3 4,542.6 5,078.0 5,061 Share of low-cost/must-run plants, % 74.76% 70.04% 80.10% 78.23% 68.1%
Source: [2] *) This category also incorporates 5 small-scale CHP units listed in Table 12 and the Lori-1 WPP listed in Table 11! In order to evaluate Operating Margin, net quantity of electricity (mln kWh) generated and delivered to the grid by all power units serving the system need to be identified as well as CO2 emission factor (tCO2/MWh) of power units operated on fossil fuels need to be calculated.
Information on electricity generation and supply (delivery) by low-cost/must-run and other plants for the year 2009 to 2011 are presented in the tables below. According to the Tool, electricity import is also considered in calculation of Simple Adjusted OM. Table 19a: Data on electricity generation and supply by low-cost/must-run and other plants in 2009
POWER PLANT Capacity Generation Delivery Type of fuel MW mln kWh mln kWh
Metzamor NPP 880.0 2,493.7 2,290.4 nuclear Hrazdan TPP* 1,110.0 887.8 823.9 NG Yerevan TPP* 550.0 240.7 203.7 NG and SG Sevan-Hrazdan CHPPs (IEC) 556.0 486.5 478.2 hydro Vorotan Cascade of HPPs 400.0 1,130.6 1,122.2 hydro Dzora HPP 25.0 95.1 93.1 hydro Lori-1 WPP 2.64 4.25 3.9 wind EC at YSMU - CHP 4.0 25.27 25.09 natural gas

UNFCCC/CCNUCC CDM – Executive Board Page 56
ArmRoscogeneration CJSC - CHP 2.0 0.26 0.26 natural gas Erfrez OJSC - CHP 0.1 0.45 0.41 natural gas Lusaker Biogas Plant CJSC - CHP 0.83 2.71 2.70 biogas Small HPPs 102.4 304.1 297.6 hydro Total 3,632.97 5,671.3 5,341.4 Import 291.2 291.2 TOTAL 3,632.97 5,962.5 5,632.5 No low-cost/must-run plants (*) 1,660 1128.5 1,027.6 Low-cost/must-run plants (incl. imports) 1,972.97 4,834.0 4,604.9
Table 20b: Data on electricity generation and supply by low-cost/must-run and other plants in 2010
POWER PLANT Capacity Generation Delivery Type of fuel MW mln kWh mln kWh
Metzamor NPP 408.0 2,490.0 2,286.5 nuclear Hrazdan TPP* 1,110.0 348.4 320.6 NG Yerevan TPP* 550.0 73.4 61.3 NG and SG CCGT Unit at Yerevan TPP* 242.0 991.3 957.0 NG Sevan-Hrazdan CHPPs (IEC) 561.0 727.1 716.2 hydro Vorotan Cascade of HPPs 404.0 1,311.4 1,302.9 hydro Dzora HPP 25.0 104.0 102.1 hydro Lori-1 WPP 2.64 4.06 3.7 wind EC at YSMU – CHP 4.0 24.91 24.64 NG ArmRoscogeneration CJSC – CHP 2.0 4.36 4.36 NG Lusakert Biogas Plant - CHP 0.83 2.97 2.9 biogas Erfrez OJSC - CHP 0.1 0.35 0.33 NG Lus Astgh Sugar - CHP 6.0 0.5 0.5 NG Small HPPs 130.14 408.4 400.05 hydro Total 3,445.7 6,491.2 6,183.1 Import 287.16 287.16 TOTAL 3,445.7 6,778.31 6,470.24 No low-cost/must-run plants (*) 1,902 1,413.1 1,338.9 Low-cost/must-run plants (incl. imports) 1,543.7 5,365.26 5,131.34
Table 21c: Data on electricity generation and supply by low-cost/must-run and other plants in 2011
POWER PLANT Capacity Generation Delivery Type of fuel MW mln kWh mln kWh
Metzamor NPP 815.0 2,548.1 2,356.8 nuclear Hrazdan TPP* 1,110.0 628.1 584.8 NG Yerevan TPP* 550.0 0.0 0.0 NG and SG CCGT Unit at Yerevan TPP* 271.7 1,685.7 1,628.3 NG Hrazdan TPP Unit N5* 480.0 57.9 52.6 NG Sevan-Hrazdan CHPPs (IEC) 562.0 650.9 641.7 hydro Vorotan Cascade of HPPs 404.0 1,289.1 1,281.1 hydro Dzora HPP 25.2 91.8 90.0 hydro Lori-1 WPP 2.64 3.0 3.0 wind

UNFCCC/CCNUCC CDM – Executive Board Page 57
EC at YSMU – CHP 4.0 18.6 18.6 NG ArmRoscogeneration CJSC – CHP 2.0 4.93 4.93 NG Lusakert Biogas Plant - CHP 0.83 2.6 2.6 biogas Erfrez OJSC - CHP 0.1 0.0 0.0 NG Lus Astgh Sugar - CHP 6.0 0.0 0.0 NG Small HPPs 162.8 452.1 441.29 hydro Total 4,396.3 7,432.8 7,105.73 Import 204.5 204.5 TOTAL with Import 4,396.3 7,637.3 7,310.23 No low-cost/must-run plants (*) 2,411.7 2,371.7 2,265.7 Low-cost/must-run plants (incl. imports) 1,984.6 5,265.6 5,044.53
Source: [2] All small CHP units are included in low-cost/must-run plants list because these plants are not dispatched by the national operator (dispatching unit) but rather operated independently based on power purchase agreements. According to the acting legislation45 national grid is obliged to purchase all power generated by such type of power plants within 5 years after the plants operation date. In the tables 16 and 17 results of calculation of emission factors for no low-cost/must-run and low-cost/must-run power plants for 2011 are given. Table 22a: Calculation of emission factors for no low-cost/must-run power plants for 2009
POWER PLANT
Capacity Delivery Type of
fuel
FCi,m,y NCV i,y EFco2,I,y Emission
factor tCO2/MWh
MW MWh 1000NM3 GJ/1000NM3 tCO2/GJ
Hrazdan TPP 1,110 823,900 NG 250,914 34.114 0.0543 0.56
Yerevan TPP 550 203,700 NG 113,288 34.626 0.0543
1.11 SG 16,830 10.052 0,074
TOTAL 1,660 1,027,600
Table 23b: Calculation of emission factors for no low-cost/must-run power plants for 2010
POWER PLANT
Capacity Delivery Type of
fuel
FC i,m,y NCV i,y EFco2,I,y Emission
factor tCO2/MWh
MW MWh 1000NM3 GJ/1000NM3 tCO2/GJ
Hrazdan TPP 1,110 320,600 NG 104,271.3 34.654 0.0543 0.61
Yerevan TPP 550 61,300 NG 38,195 34.700 0.0543
1.26 SG 6,689 10.048 0.0740
CCGT at YTPP 242 957,000 NG 217,823.7 34.583 0.0543 0.43 TOTAL 1,902 1,338,900
Table 24c: Calculation of emission factors for no low-cost/must-run power plants for 2011
POWER PLANT Capacity Delivery Typ
e of FC i,m,y NCV i,y EFco2,I,y Emission factor
45 Decree of the Government of RA N509-N (dated on April 13, 2006) on Heating System Rehabilitation Pioneer
Projects based on CHP Plants.

UNFCCC/CCNUCC CDM – Executive Board Page 58
fuel tCO2/MWh
MW MWh 1000nm3 GJ/1000nm3 tCO2/GJ
Hrazdan TPP 1,110 584,800 NG 184,026 34.626 0.0543 0.59
Yerevan TPP 550 0.0 NG 0.0 0.0 0.0
0.0 SG 0.0 0.0 0.0
CCGT at YTPP 242 1,628,300 NG 360,318 34.289 0.0543 0.41
Hrazdan Unit-5 480 52,600 NG 9,205.5 34.289 0.0543 0.33
TOTAL 2,382 2,265,700 Note: EF for Hrazdan Unit N5 is calculated according to Option A2 of the Tool Table 25a: Calculation of emission factors for low-cost/must-run power plants for 2009
POWER PLANT Capacity Delivery Type
of fuel
FCi,m,y NCV i,y EFco2,I,y Emission factor
tCO2/MWh MW MWh 1000NM3 GJ/1000N
M3 tCO2/GJ
Metzamor NPP, Large and Small HPPs, Lori-1 WPP
1,966.0 4,285,400 HY 0 0 0 0
EC at YSMU 4.0 25,090.0 NG 6,789 34.507 0.0543 0.51 ArmRoscogeneration 2.0 260.0 NG 70 34.507 0.0543 0.50 Erfrez OJSC 0.1 410.0 NG 144 34.507 0.0543 0.66 Lusakert Biogas Plant 0.83 2,700 BG - - - 0* TOTAL 1,972.9 4,313,860
*) Emission factor for LBP is zero because power is generated from renewable source (biogas).
Table 26b: Calculation of emission factors for low-cost/must-run power plants for 2010
POWER PLANT Capacity Delivery Type
of fuel
FCi,m,y NCV i,y EFco2,I,y Emission factor
tCO2/MWh MW GWh 1000NM3
GJ/1000NM3 tCO2/GJ
Metzamor NPP, Large and Small HPPs, Lori-1 WPP
1,530.8 4,811.450 HY 0 0 0 0
EC at YSMU 4.0 24.64 NG 6,806 34.654 0.0543 0.52 ArmRoscogeneration 2.0 4.36 NG 1,687 34.654 0.0543 0.73 Erfrez OJSC 0.1 0.33 NG 95.14 34.654 0.0543 0.54 Lus Astgh Sugar 6.0 0.5 NG 6,100 34.654 0.0543 22.96* Lusakert Biogas Plant (CDM project activity) 0.83 2.9 BG - - - 0**
TOTAL 1,543.7 4,844.18 *) Extremely high level of EF is explained by the fact that the backpressure turbine is mainly used for heat production. **) Emission factor for LBP is zero because power is generated from renewable source (biogas). Table 27c: Calculation of emission factors for low-cost/must-run power plants for 2011

UNFCCC/CCNUCC CDM – Executive Board Page 59
POWER PLANT Capacity Delivery Typ
e of fuel
FCi,m,y NCV i,y EFco2,I,y Emission factor
tCO2/MWh MW MWh 1000nm3 GJ/1000nm3 tCO2/GJ
Metzamor NPP, Large and Small HPPs, Lori-1 WPP
1,984.6 4,839,700 NU, HY,W
0 0 0 0
EC at YSMU 4.0 18,600 NG 5,001 34.289 0.0543 0.5
ArmRoscogeneration 2.0 4,930 NG 1,488.5 34.289 0.0543 0.56
Erfrez OJSC 0.1 0.0 NG 0.0 N/A 0.0543 0.0
Lus Astgh Sugar 6.0 0.0 NG 0.0 N/A 0.0543 0.0
Lusakert Biogas Plant 0.83 2,600 BG - - - 0.0*
TOTAL 1,997.5 4,865,830 *) Emission factor for LBP is zero because power is generated from renewable source (biogas). Calculation of lambda factor
After calculation of emission factors for all the relevant power plants serving the system it is necessary to calculate lambda factor in accordance with the procedure set by the Tool based on chronological (hourly) power generation data for each plant/unit. Chronological data required for this calculation was provided by the Settlement Center CJSC as per request of the DNA.
On the figure below the load duration curve is depicted as well as number of hours during which low-cost/must-run plants are on the margin are identified.
Tables 18a to 18c show the result of lambda factor calculation.
Figure 2a: Lambda calculation for Simple Adjusted OM method - 2009
Table 28a: Lambda factor for 2009
The number of hours for which low-cost/must-run sources are on the margin for 2009 1,996 hours
0.0
200.0
400.0
600.0
800.0
1,000.0
1,200.0
118
035
953
871
789
610
7512
5414
3316
1217
9119
7021
4923
2825
0726
8628
6530
4432
2334
0235
8137
6039
3941
1842
9744
7646
5548
3450
1351
9253
7155
5057
2959
0860
8762
6664
4566
2468
0369
8271
6173
4075
1976
9878
7780
5682
3584
1485
93

UNFCCC/CCNUCC CDM – Executive Board Page 60
Lambda factor for 2009 1,996 / 8,760 = 0.228
Figure 2b: Lambda calculation for Simple Adjusted OM method - 2010
Table 29b: Lambda factor for 2010
The number of hours for which low-cost/must-run sources are on the margin for 2009 1,580 hours
Lambda factor for 2009 1,580 / 8,760 = 0.1803
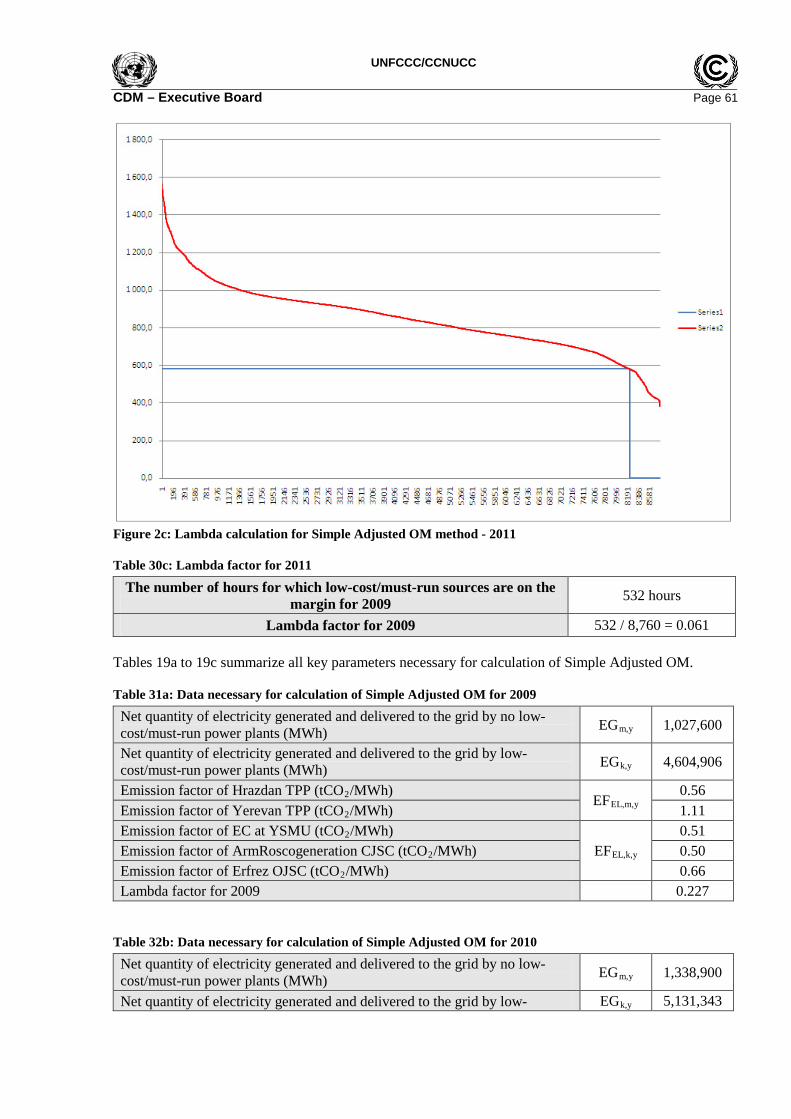
UNFCCC/CCNUCC CDM – Executive Board Page 61
Figure 2c: Lambda calculation for Simple Adjusted OM method - 2011
Table 30c: Lambda factor for 2011
The number of hours for which low-cost/must-run sources are on the margin for 2009 532 hours
Lambda factor for 2009 532 / 8,760 = 0.061 Tables 19a to 19c summarize all key parameters necessary for calculation of Simple Adjusted OM.
Table 31a: Data necessary for calculation of Simple Adjusted OM for 2009
Net quantity of electricity generated and delivered to the grid by no low-cost/must-run power plants (MWh) EGm,y 1,027,600
Net quantity of electricity generated and delivered to the grid by low-cost/must-run power plants (MWh) EGk,y 4,604,906
Emission factor of Hrazdan TPP (tCO2/MWh) EFEL,m,y
0.56 Emission factor of Yerevan TPP (tCO2/MWh) 1.11 Emission factor of EC at YSMU (tCO2/MWh)
EFEL,k,y 0.51
Emission factor of ArmRoscogeneration CJSC (tCO2/MWh) 0.50 Emission factor of Erfrez OJSC (tCO2/MWh) 0.66 Lambda factor for 2009 0.227
Table 32b: Data necessary for calculation of Simple Adjusted OM for 2010
Net quantity of electricity generated and delivered to the grid by no low-cost/must-run power plants (MWh) EGm,y 1,338,900
Net quantity of electricity generated and delivered to the grid by low- EGk,y 5,131,343
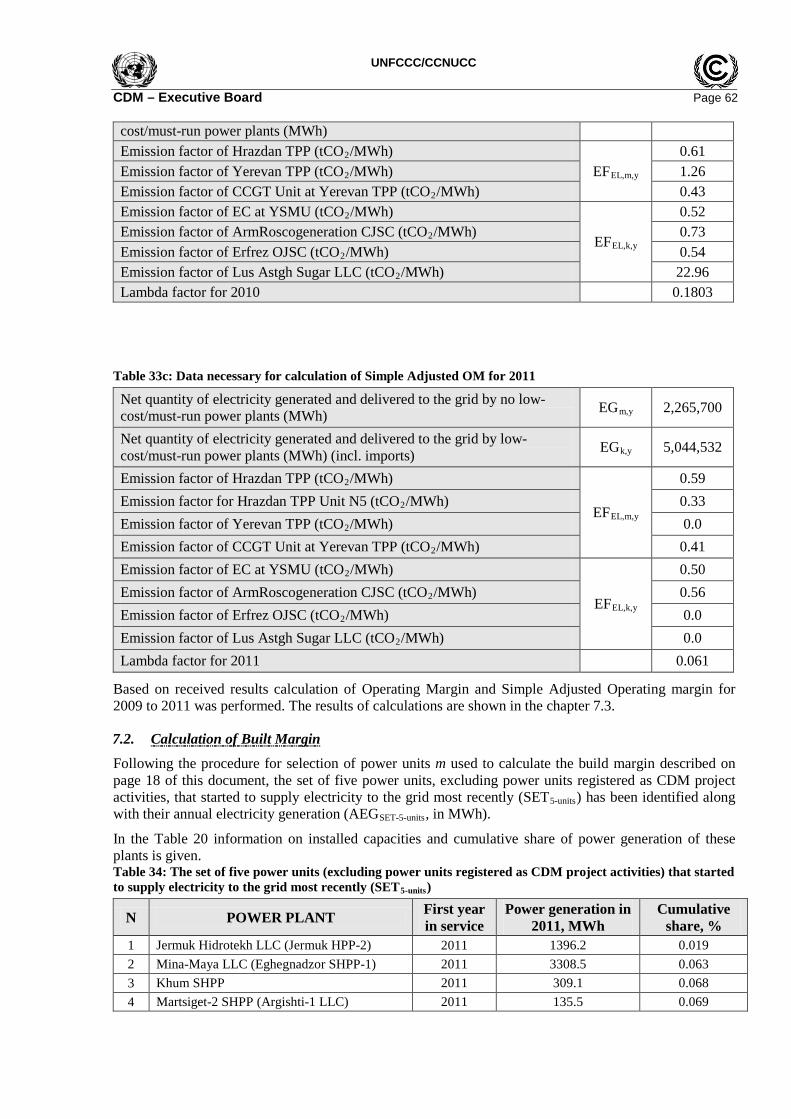
UNFCCC/CCNUCC CDM – Executive Board Page 62 cost/must-run power plants (MWh) Emission factor of Hrazdan TPP (tCO2/MWh)
EFEL,m,y 0.61
Emission factor of Yerevan TPP (tCO2/MWh) 1.26 Emission factor of CCGT Unit at Yerevan TPP (tCO2/MWh) 0.43 Emission factor of EC at YSMU (tCO2/MWh)
EFEL,k,y
0.52 Emission factor of ArmRoscogeneration CJSC (tCO2/MWh) 0.73 Emission factor of Erfrez OJSC (tCO2/MWh) 0.54 Emission factor of Lus Astgh Sugar LLC (tCO2/MWh) 22.96 Lambda factor for 2010 0.1803
Table 33c: Data necessary for calculation of Simple Adjusted OM for 2011
Net quantity of electricity generated and delivered to the grid by no low-cost/must-run power plants (MWh) EGm,y 2,265,700
Net quantity of electricity generated and delivered to the grid by low-cost/must-run power plants (MWh) (incl. imports) EGk,y 5,044,532
Emission factor of Hrazdan TPP (tCO2/MWh)
EFEL,m,y
0.59 Emission factor for Hrazdan TPP Unit N5 (tCO2/MWh) 0.33 Emission factor of Yerevan TPP (tCO2/MWh) 0.0 Emission factor of CCGT Unit at Yerevan TPP (tCO2/MWh) 0.41 Emission factor of EC at YSMU (tCO2/MWh)
EFEL,k,y
0.50 Emission factor of ArmRoscogeneration CJSC (tCO2/MWh) 0.56 Emission factor of Erfrez OJSC (tCO2/MWh) 0.0 Emission factor of Lus Astgh Sugar LLC (tCO2/MWh) 0.0 Lambda factor for 2011 0.061
Based on received results calculation of Operating Margin and Simple Adjusted Operating margin for 2009 to 2011 was performed. The results of calculations are shown in the chapter 7.3.
7.2. Calculation of Built Margin
Following the procedure for selection of power units m used to calculate the build margin described on page 18 of this document, the set of five power units, excluding power units registered as CDM project activities, that started to supply electricity to the grid most recently (SET5-units) has been identified along with their annual electricity generation (AEGSET-5-units, in MWh).
In the Table 20 information on installed capacities and cumulative share of power generation of these plants is given. Table 34: The set of five power units (excluding power units registered as CDM project activities) that started to supply electricity to the grid most recently (SET5-units)
N POWER PLANT First year in service
Power generation in 2011, MWh
Cumulative share, %
1 Jermuk Hidrotekh LLC (Jermuk HPP-2) 2011 1396.2 0.019 2 Mina-Maya LLC (Eghegnadzor SHPP-1) 2011 3308.5 0.063 3 Khum SHPP 2011 309.1 0.068 4 Martsiget-2 SHPP (Argishti-1 LLC) 2011 135.5 0.069
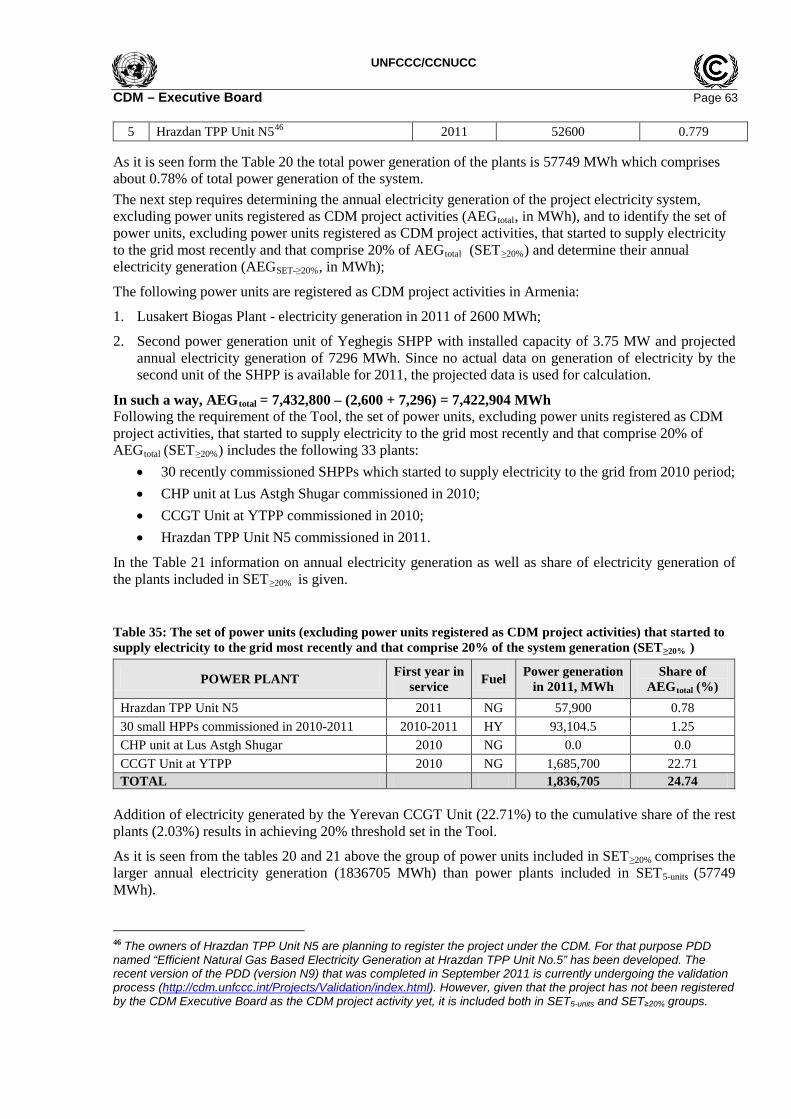
UNFCCC/CCNUCC CDM – Executive Board Page 63
5 Hrazdan TPP Unit N546 2011 52600 0.779
As it is seen form the Table 20 the total power generation of the plants is 57749 MWh which comprises about 0.78% of total power generation of the system. The next step requires determining the annual electricity generation of the project electricity system, excluding power units registered as CDM project activities (AEGtotal, in MWh), and to identify the set of power units, excluding power units registered as CDM project activities, that started to supply electricity to the grid most recently and that comprise 20% of AEGtotal (SET≥20%) and determine their annual electricity generation (AEGSET-≥20%, in MWh);
The following power units are registered as CDM project activities in Armenia:
1. Lusakert Biogas Plant - electricity generation in 2011 of 2600 MWh;
2. Second power generation unit of Yeghegis SHPP with installed capacity of 3.75 MW and projected annual electricity generation of 7296 MWh. Since no actual data on generation of electricity by the second unit of the SHPP is available for 2011, the projected data is used for calculation.
In such a way, AEGtotal = 7,432,800 – (2,600 + 7,296) = 7,422,904 MWh Following the requirement of the Tool, the set of power units, excluding power units registered as CDM project activities, that started to supply electricity to the grid most recently and that comprise 20% of AEGtotal (SET≥20%) includes the following 33 plants:
• 30 recently commissioned SHPPs which started to supply electricity to the grid from 2010 period; • CHP unit at Lus Astgh Shugar commissioned in 2010; • CCGT Unit at YTPP commissioned in 2010; • Hrazdan TPP Unit N5 commissioned in 2011.
In the Table 21 information on annual electricity generation as well as share of electricity generation of the plants included in SET≥20% is given.
Table 35: The set of power units (excluding power units registered as CDM project activities) that started to supply electricity to the grid most recently and that comprise 20% of the system generation (SET≥20% )
POWER PLANT First year in service Fuel Power generation
in 2011, MWh Share of
AEGtotal (%) Hrazdan TPP Unit N5 2011 NG 57,900 0.78 30 small HPPs commissioned in 2010-2011 2010-2011 HY 93,104.5 1.25 CHP unit at Lus Astgh Shugar 2010 NG 0.0 0.0 CCGT Unit at YTPP 2010 NG 1,685,700 22.71 TOTAL 1,836,705 24.74
Addition of electricity generated by the Yerevan CCGT Unit (22.71%) to the cumulative share of the rest plants (2.03%) results in achieving 20% threshold set in the Tool.
As it is seen from the tables 20 and 21 above the group of power units included in SET≥20% comprises the larger annual electricity generation (1836705 MWh) than power plants included in SET5-units (57749 MWh).
46 The owners of Hrazdan TPP Unit N5 are planning to register the project under the CDM. For that purpose PDD named “Efficient Natural Gas Based Electricity Generation at Hrazdan TPP Unit No.5” has been developed. The recent version of the PDD (version N9) that was completed in September 2011 is currently undergoing the validation process (http://cdm.unfccc.int/Projects/Validation/index.html). However, given that the project has not been registered by the CDM Executive Board as the CDM project activity yet, it is included both in SET5-units and SET≥20% groups.

UNFCCC/CCNUCC CDM – Executive Board Page 64 Since all power units included in the selected group (SET≥20% ) started to supply electricity to the grid no more than 10 years ago, the set of power plants in the table 21 is used for calculation of the Build Margin.
In the Tables 22 emission factors for plants included in Build Margin are given. Table 36: Emission factors for plants included in Build Margin
POWER PLANT Emission factor tCO2/MWh Hrazdan TPP Unit N5 0.33 30 small HPPs commissioned in 2010-2011 0 CHP unit at Lus Astgh Shugar 0 CCGT Unit at YTPP 0.41

UNFCCC/CCNUCC CDM – Executive Board Page 65
7.3. Calculation of Combined Margin
As the result of the performed calculations the following emission factors have been received for 2009 to 2011. Table 23: Combined Margin GEF for the years 2009 to 2011
The ex-ante calculated Combined Margin GEF amounts to 0.4198 tonsCO2/MWh for the years 2009 to 2011.
Baseline EF simple OM
[tCO2/MWh]λ value
LCMR [MWh]
N-LCMR [MWh]
2009 0.6718 0.2279 4,604,906 1,027,6002010 0.5095 0.1804 5,131,343 1,338,9002011 0.4564 0.0610 5,044,532 2,265,700
14,780,781 4,632,200
wOM = 0.50wBM = 0.50
EF Simple Adjusted OM
[tCO2/MWh]
0.5193 5,632,5060.4186 6,470,243
Total (2009-2011) =
0.4517 0.3878
0.4198CM [tCO2/MWh]
Alternative weights
Emission factors for the National Grid of Armenia
EF Simple AdjustedOM
[tCO2/MWh]
0.428819,412,981EF BM,2011
[tCO2/MWh]
Load [MWh]
7,310,232
UNFCCC/CCNUCC CDM – Executive Board Page 66
References
1. Public Services Regulatory Commission of RA (www.psrc.am).
2. Analysis of Technical and Economic Indices of the Armenian Power Energy System for 2011. Report developed in 2011 by Settlement Center CJSC under the Ministry of Energy and Natural Resources of RA.
3. Ministry of Energy and Natural Resources of RA (www.minenergy.am).
4. Climat Change Information Center of Armenia (www.nature-ic.am)
5. Strategy of the Development of the Energy Sector within the Context of Economic Development in Armenia. Protocol Decision No1 of the Government of the Republic of Armenia. Adopted by the Government of Armenia on June 23, 2005 (protocol N24).
6. 100 Years of Armenian Energetic, Musaler Tpagratun Ltd., Yerevan, 2003.
7. CDM Development Manual. EC “Technical Assistance to Armenia, Azerbaijan, Georgia and Moldova with Respect to their Global Climate Change Commitments” Project, 2006 (www.nature-ic.am).
8. Methodological Tool to calculate the emission factor for an electricity system, Version 02.2.1 (www.unfccc.int).
9. CDM Rulebook (www.cdmrulebook.org)
10. Armrosgazprom CJSC (www.armrusgasprom.am)
UNFCCC/CCNUCC CDM – Executive Board Page 67
Abbreviations
BG Biogas BM Build Margin CCIC Climate Change Information Center CCGT Combined Cycle Gas Turbine CDM Clean Development Mechanism CER Certified Emission Reduction CJSC Closed Joint Stock Company CM Combined Margin DNA Designated National Authority DOE Designated Operational Entity EB Executive Board EC at YSMU Energy Center at Yerevan State Medical University GEF Global Environment Facility GHG Greenhouse Gases HY Hydropower IEC International Energy Corporation NG Natural Gas NPP Nuclear Power Plant MO Microsoft Office MoNP Ministry of Nature Protection of Republic of Armenia OM Operating Margin SHPP Small Scale Hydro Power Plant SG Syngas TPP Thermal Power Plant UNFCCC United Nations Framework Convention on Climate Change WP Wind Power WPP Wind Power Plant YTPP Yerevan Thermal Power Plant

UNFCCC/CCNUCC CDM – Executive Board Page 68
Appendix 5: Further background information on the monitoring plan
Monitoring plan is described in the Section B.7. of PART II of this PoA-DD.
Appendix 6: Demonstration of additionality of a small scale CPA
Only for CPAs <= 5MW installed capacity additionality can be demonstrated as follows: According to the “Guidelines for Demonstrating Additionality of Microscale Project Activities” (Version 03) a CPA shall be additional if
• it is located in a special underdeveloped zone of the host country identified by the government before 28 May 2010; or
• hydropower <= 5MW installed capacity is recommended by the host country designated national
authority (DNA) and approved by the Executive Board to be additional in the host country at the time of inclusion of the CPA into the PoA.
For all CPAs > 5MW additionality shall be demonstrated as follows; CPAs <= 5MW shall either apply above mentioned procedure or the one outlined below: In accordance with the “Simplified modalities and procedures for small-scale CDM project activities”, (decision 4/CMP.1, Annex II)47, paragraph 28, a simplified baseline and monitoring methodology may be used for a small-scale CDM project activity if project participants are able to demonstrate to a designated operational entity that the project activity would otherwise not be implemented due to the existence of one or more barrier(s) listed in attachment A to Appendix B of the simplified modalities and procedures for small-scale CDM project activities”, currently Version 08 (EB 63, Annex 24) 48: For demonstration of additionality of a typical CPA within this PoA, additional guidance or guidelines of the following documents may be used: (a) “Non-binding best practice examples to demonstrate additionality for SSC project activities” (EB 35, Annex 34)49, (b) “Guidelines for demonstrating additionality of microscale project activities”, currently Version 03 (EB 63, Annex 23)50 Additionally in the case investment barrier is chosen to determine the eligibility criterion the relevant sections of the following tool and guideline shall be taken into account: (c) „Tool for the demonstration and assessment of additionality“ Version 06 (EB 65, Annex 21)51 (d) “Guidelines on the assessment of investment analysis” Version 05 (EB 62, Annex 05)52 According to “Non-binding best practice examples to demonstrate additionality for SSC project activities” (EB 35, Annex 34), best practice examples include but are not limited to CPA included under the proposed PoA shall provide an explanation to show the project activity would not have occurred anyway due to at least one of the barriers, as follows: 47 http://cdm.unfccc.int/Reference/COPMOP/08a01.pdf#page=43 48 https://cdm.unfccc.int/Reference/Guidclarif/ssc/methSSC_guid05.pdf 49 http://cdm.unfccc.int/EB/035/eb35_repan34.pdf 50http://cdm.unfccc.int/filestorage/W/V/I/WVI3RN692YMCGLZT40QXBOUA8H5KFP/eb63_repan23.pdf?t=alB8bTB4NTlifDAW
gEvM1uR11OyTp5RT7Vdy 51 http://cdm.unfccc.int/methodologies/PAmethodologies/tools/am-tool-01-v6.0.0.pdf/history_view 52 http://cdm.unfccc.int/Reference/Guidclarif/index.html#meth
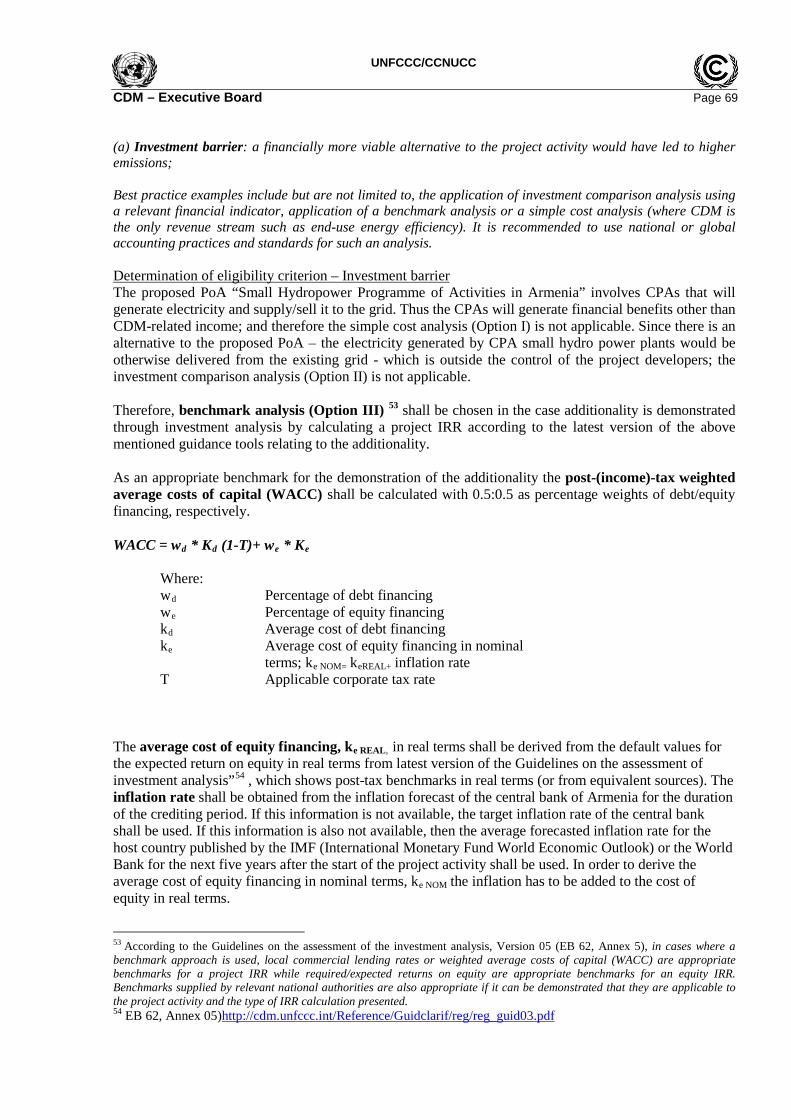
UNFCCC/CCNUCC CDM – Executive Board Page 69 (a) Investment barrier: a financially more viable alternative to the project activity would have led to higher emissions; Best practice examples include but are not limited to, the application of investment comparison analysis using a relevant financial indicator, application of a benchmark analysis or a simple cost analysis (where CDM is the only revenue stream such as end-use energy efficiency). It is recommended to use national or global accounting practices and standards for such an analysis. Determination of eligibility criterion – Investment barrier The proposed PoA “Small Hydropower Programme of Activities in Armenia” involves CPAs that will generate electricity and supply/sell it to the grid. Thus the CPAs will generate financial benefits other than CDM-related income; and therefore the simple cost analysis (Option I) is not applicable. Since there is an alternative to the proposed PoA – the electricity generated by CPA small hydro power plants would be otherwise delivered from the existing grid - which is outside the control of the project developers; the investment comparison analysis (Option II) is not applicable. Therefore, benchmark analysis (Option III) 53 shall be chosen in the case additionality is demonstrated through investment analysis by calculating a project IRR according to the latest version of the above mentioned guidance tools relating to the additionality. As an appropriate benchmark for the demonstration of the additionality the post-(income)-tax weighted average costs of capital (WACC) shall be calculated with 0.5:0.5 as percentage weights of debt/equity financing, respectively. WACC = wd * Kd (1-T)+ we * Ke
Where: wd Percentage of debt financing we Percentage of equity financing kd Average cost of debt financing ke Average cost of equity financing in nominal
terms; ke NOM= keREAL+ inflation rate T Applicable corporate tax rate
The average cost of equity financing, ke REAL, in real terms shall be derived from the default values for the expected return on equity in real terms from latest version of the Guidelines on the assessment of investment analysis”54 , which shows post-tax benchmarks in real terms (or from equivalent sources). The inflation rate shall be obtained from the inflation forecast of the central bank of Armenia for the duration of the crediting period. If this information is not available, the target inflation rate of the central bank shall be used. If this information is also not available, then the average forecasted inflation rate for the host country published by the IMF (International Monetary Fund World Economic Outlook) or the World Bank for the next five years after the start of the project activity shall be used. In order to derive the average cost of equity financing in nominal terms, ke NOM the inflation has to be added to the cost of equity in real terms.
53 According to the Guidelines on the assessment of the investment analysis, Version 05 (EB 62, Annex 5), in cases where a benchmark approach is used, local commercial lending rates or weighted average costs of capital (WACC) are appropriate benchmarks for a project IRR while required/expected returns on equity are appropriate benchmarks for an equity IRR. Benchmarks supplied by relevant national authorities are also appropriate if it can be demonstrated that they are applicable to the project activity and the type of IRR calculation presented. 54 EB 62, Annex 05)http://cdm.unfccc.int/Reference/Guidclarif/reg/reg_guid03.pdf

UNFCCC/CCNUCC CDM – Executive Board Page 70 As average cost of debt financing, kd, the last available commercial lending rate for long term credits in the currency, which is relevant for the specific CPA, shall be taken into account. The CPA implementer shall use the determined WACC to compare with the project IRR to assess the financial attractiveness of the investment in the proposed CPA. According to the “Guidelines for assessment of the investment analysis” the following guidance is given:
• The cost of financing expenditures (i.e. loan repayments and interest) shall not be included in the calculation of the project IRR.
• Depreciation, and other non-cash items related to the project activity, which have been deducted in estimating gross profits on which tax is calculated, should be added back to net profits for the purpose of calculating the financial indicator.
In case other financial indicators are more suitable for the demonstration of the financial additionality of individual projects, the justification will be provided in the specific CPA. The calculation and the complete investment analysis of a specific CPA will be provided in excel format, unprotected, together with the relevant documents of the specific CPA. Assumptions included in the investment analysis will be supported by available evidences or excluded from the analysis. As a general approach, the following procedure will be applied by the CPA:
• Period considered for investment analysis: the period considered for conducting the investment analysis should not be limited to the crediting period of the specific CPA, but will be referring to the expected operational lifetime of the main equipment, based on the indications of the technological provider;
• If any rehabilitation or maintenance is expected to occur in the period considered for assessment, the calculation of the IRR may include the costs related to these;
• Plant load factor, defined ex-ante in the CDM-PDD according to one of the following options, according to the provisions in EB48, Annex 11:
o The PLF provided to banks and/or equity financiers while applying the project activity for project financing, or to the government while applying the project activity for implementation approval;
o The PLF determined by a third party contracted by the project participants (e.g. an engineering company);
Based on the above assumptions and approaches, the CPA implementer will calculate the Project IRR based on the available data at the time of investment decision. IRR without expected incomes from CDM will be compared to the benchmark as derived above. An investment analysis will be conducted for the specific proposed project activity, including the variables and input data related with capital investment, O&M cost and the estimated savings or revenues at the time of investment decision. The following table presents typical data used in the IRR calculation of the project and the main sources of this information. The calculation will be based on conservative assumptions all of which should be listed in the SSC-CPA-DD of the future specific project. Table: Key assumptions for investment analysis
Input Unit Value Source Comment Investment cost EUR Quotations, purchase
agreements, feasibility study reports (FSR), internationally

UNFCCC/CCNUCC CDM – Executive Board Page 71
accepted values (investment/installed MW), others.
Equity EUR Investment analysis, loan agreements, others.
Project life-time (years of operation)
Years Concession Agreement, technical specifications of main equipment, others
Start of operational generation
Date FSR, others
Installed capacity MW FSR, others Annual gross generation
GWh FSR, hydrological studies, others
Losses (for transmission to the grid connection point)
% FSR, others
Wholesale Power Price (Base Load)
EUR/MWh FSR, Power Purchase Agreement,
OPEX EUR/MW FSR, others Income tax % FSR, national regulation,
others For Albania: http://www.doingbusiness.org/data/exploreeconomies/albania/paying-taxes/
Depreciation % FSR, others Host country inflation rate
% Inflation forecast of the central bank of the host country for the duration of the crediting period; Target inflation rate of the central bank; average forecasted inflation rate for the host country published by the IMF (International Monetary Fund World Economic Outlook) or the World Bank for the next five years after the start of the project activity
Project IRR (without CER)
% Financial analysis
Project IRR (with CERs)
% Financial analysis
As a result of the comparison of the project IRR with the benchmark analysis it shall be demonstrated that the proposed CPA (project) is not financially attractive. As per the “Guidelines on the assessment of the investment analysis”, only variables that constitute more than 20% of either total project costs or total project revenues should be subjected to reasonable variation and the results of this variation should be presented in the PDD and be reproducible in the associated spreadsheets. A sensitivity analysis shows whether the conclusion regarding the financial/economic attractiveness is robust to reasonable variations in the critical assumptions. The results of the variation shall be presented in the CPA-DDs and reproduced in the associated spreadsheets. In any case the following parameters shall be part of a scenario analysis.

UNFCCC/CCNUCC CDM – Executive Board Page 72 Table: Variations of input parameters
IRR Sensitivity Analysis 90% 95% 100% 105% 110%
Investment costs Generation volume Electricity price
For the specific CPA it shall be demonstrated that even the most favorable variations, e.g. +10% electricity price or -10% investment, will not help the project to reach the required benchmark. It is hence further substantiated that the CPA is not financially attractive and therefore additional. (b) Access-to-finance barrier: the project activity could not access appropriate capital without consideration of the CDM revenues; Best practice examples include but are not limited to, the demonstration of limited access to capital in the absence of the CDM, such as a statement from the financing bank that the revenues from the CDM are critical in the approval of the loan. Determination of eligibility criterion - Access-to finance barrier: The CPA implementer shall provide a statement by a financing entity (not only banks are financing but also e.g. manufacturers or ESCOs) which contains information that associated income from CO2 reductions is critical in the approval of the loan or other form of capital provided (such as Mezzanine or equity). (c) Technological barrier: a less technologically advanced alternative to the project activity involves lower risks due to the performance uncertainty or low market share of the new technology adopted for the project activity and so would have led to higher emissions; Best practice examples include but are not limited to, the demonstration of non- availability of human capacity to operate and maintain the technology, lack of infrastructure to utilize the technology, unavailability of the technology and high level of technology risk. Determination of eligibility criterion – Technological barrier It is demonstrated by providing a confirmation from an independent DOE (other than the validating DOE) that the CPA is facing such barrier. (d) Barrier due to prevailing practice: prevailing practice or existing regulatory or policy requirements would have led to implementation of a technology with higher emissions; Best practice examples include but are not limited to, the demonstration that project is among the first of its kind in terms of technology, geography, sector, type of investment and investor, market etc. Determination of eligibility criterion – Barrier due to prevailing practice It is demonstrated by providing a confirmation from an independent DOE (other than the validating DOE) that the CPA is facing such barrier. (e) Other barriers such as institutional barriers or limited information, managerial resources, organizational capacity, or capacity to absorb new technologies. It is demonstrated by providing a confirmation from an independent DOE (other than the DOE validating the PoA DD) that the CPA is facing such barrier.

UNFCCC/CCNUCC CDM – Executive Board Page 73
- - - - -


![PROGRAMME OF ACTIVITIES DESIGN DOCUMENT (PoA-DD)1].pdf · A.5. Physical/ Geographical boundary of the PoA >> The geographical area in which SSC-CPAs included in this PoA will be implemented](https://static.fdocuments.us/doc/165x107/5cf72a7988c99346318c9147/programme-of-activities-design-document-poa-dd-1pdf-a5-physical-geographical.jpg)