Profitable ideas in North American equities Danny Bubis, CFA.
22
Profitable ideas in North American equities
-
Upload
geraldine-moody -
Category
Documents
-
view
216 -
download
2
Transcript of Profitable ideas in North American equities Danny Bubis, CFA.

Profitable ideas in North American equities

Agenda
Energy – secular outlook remains strong
Financials – past the worst
Gold – losing its luster?
Mega-cap technology – it ain’t 1999 anymore!

Tetrem – Who we are
Value investors
North American
Independent
Established

0%
2%
4%
6%
8%
10%
12%
'85 '88 '91 '94 '97 '00 '03 '06 '09 '12
Equity Risk Premium (NTM Earnings Yield less Real Bond Yield)
Stocks are cheap versus bonds
Source: Strategas. As of March 31, 2012.
Equity risk premium (forward earnings yield less real bond yield)

Bear markets precede secular bull markets
Source: Strategas. As of March 31, 2012.
-5%
0%
5%
10%
15%
20%
25%
'20 '30 '40 '50 '60 '70 '80 '90 '00 '10
S&P 500 10-Year Returns (1920 - Q1 2012)
S&P 500 10-year returns(1920 – Q1 2012)
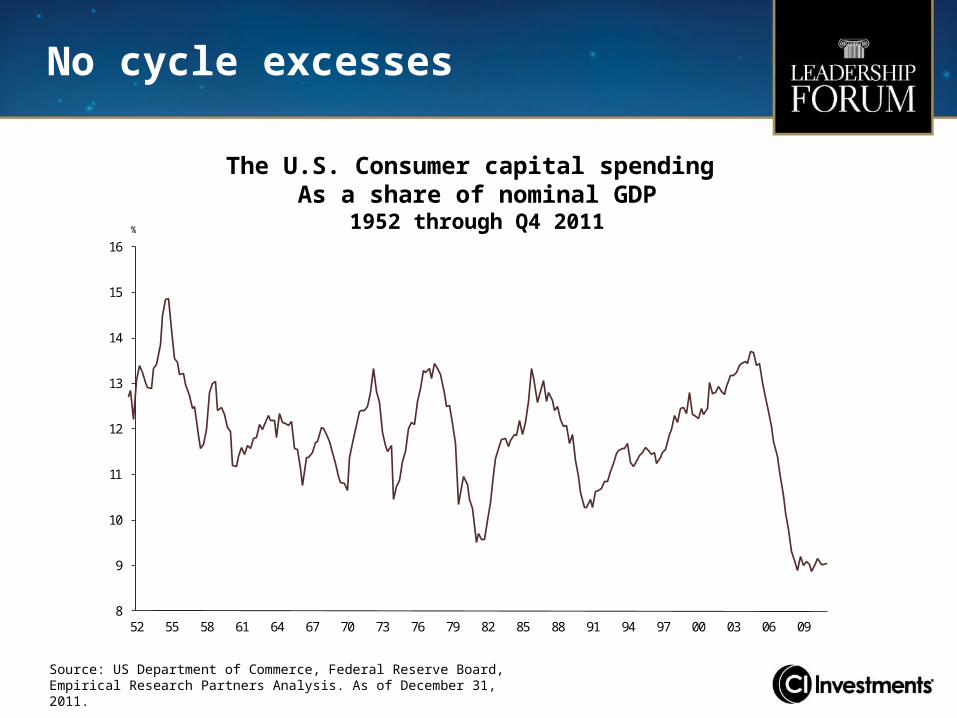
No cycle excesses
8
9
10
11
12
13
14
15
16
52 55 58 61 64 67 70 73 76 79 82 85 88 91 94 97 00 03 06 09
The US Consumer Capital Spendingas a Share of Nominal-GDP
1952 Through Q4 2011%
Source: US Department of Commerce, Federal Reserve Board, Empirical Research Partners Analysis. As of December 31, 2011.
The U.S. Consumer capital spending As a share of nominal GDP
1952 through Q4 2011

Corporate balance sheets are strong
Source: Strategas Research Partners. As of December 31, 2011.
U.S. Non-financial corporationsCash as a percent of total assets

Energy stocks are contrarian
Source: Empirical Research Partners. As of April 13, 2012.
Relative price to book of E&P stocks1952-2012
2.4
2.0
1.6
1.2
0.8
0.40 6 11 17 22 28 33 39 44 50 55 61 66 72 77 83 89 94 100
E&P Stocks More Expensive
Current:All E&PStocks Current:
Natural GasE&P Stocks
Percentile (100 = Lowest Price-to-Book Ratios)

Secular demand growth
Source: US Energy Information Administration. As of December 31, 2011.
World energy consumption, 1990 – 2035(quadrillion Btu)

Moving towards equilibrium
Source: Bloomberg. As of March 30, 2012.
Oil to natural gas ratio

Suncor: cash flow is coming
Unmatched assets• 27 billion barrels of resource base• No exploration required• 40-year resource life• Low-risk regulatory environment
Financially strong• $4B cash on balance sheet• Next material debt maturity 2018
Harvesting the cash• Expect $3B free cash flow in 2012• Ample room to raise dividend (10% payout ratio)• Long-term cash flow can hit 25% of current market cap

Source: Scotiabank. Canadian Banks include: BMO, BNS, CM, NA, RY and TDUS Banks include: BAC, C, JPM, USB and WFC
Financials – past the worst
U.S. and Canadian banks Tier 1 capital ratio2007 – fourth quarter 2011

CIBC: do you see what we see?
Compelling value• 19% P/E discount vs. peers • 4.8% dividend yield, safe and growing
Industry leading returns and capital levels• 22% ROE (group average 18%)• Highest capital ratios
Opportunity to differentiate through capital return• Expect meaningful share repurchase announcement• Room for future dividend increases

Source: Dow Jones Indexes and KBW Estimates.
U.S. Banks are cheap on valuation
KBW Bank Index – Price to tangible book value

-$500
-$300
-$100
$100
$300
$500
$700
2001 2002 2003 2004 2005 2006 2007 2008 2009 2010 2011
2008 Credit Crisis April 2012
Source: 13D Research, Bloomberg. As of April 25, 2012.
Spread Between NYSE Arca Gold Miners Index and Spot Gold
Gold stocks lagging bullion
Spread between NYSE Arca Gold Miners Index and Spot Gold

Source: Market Vane Corporation. As of April 17, 2012.
0
20
40
60
80
100
5-Jan-00 5-Jan-01 5-Jan-02 5-Jan-03 5-Jan-04 5-Jan-05 5-Jan-06 5-Jan-07 5-Jan-08 5-Jan-09 5-Jan-10 5-Jan-11 5-Jan-12
Gold Sentiment (% bullish)
+1 Standard Deviation
-1 Standard Deviation
Average
Gold sentiment (% bullish)
Gold sentiment getting contrarian

0
5
10
15
20
25
30
For
war
d P
/E
March 2012
0
30
60
90
120
150
For
war
d P
/E
March 2000
Average is calculated as median. Highest outlier in each period not shown: Yahoo! Inc. in 2000 (P/E of 441x) and Amazon.com Inc. in 2012 (P/E of 164x).Source: Strategas. As of March 2012.
Overall Average: 31.0x
Overall Average: 13.6x
Tech Average: 73.1x
Tech Average: 13.8x
March 2000
March 2012
Mega-cap technology – It ain’t 1999 anymore!

Source: Capital IQ: data.Rolling 5 year standard deviation.Companies contained in Tech Basket: ORCL, IBM, MSFT, CSCO, INTC. Companies contained in Consumer Basket: KO, GIS, WMT, PG.
EPS Volatility – Tech vs. Consumer Staples
Mega-cap technology – stable earnings

FY 1999 FY2012 Change
Price $58.37 $30.35 -48%
Revenue $23B $72B 213%
EPS $0.85 $2.76 225%
P/E 68.7x 11.3x -84%
Dividend Yield
NA 2.60%
Dividend 3 Year CAGR
NA 15.40%
Microsoft
Revenge of the nerds revisited – Nerds in Paradise
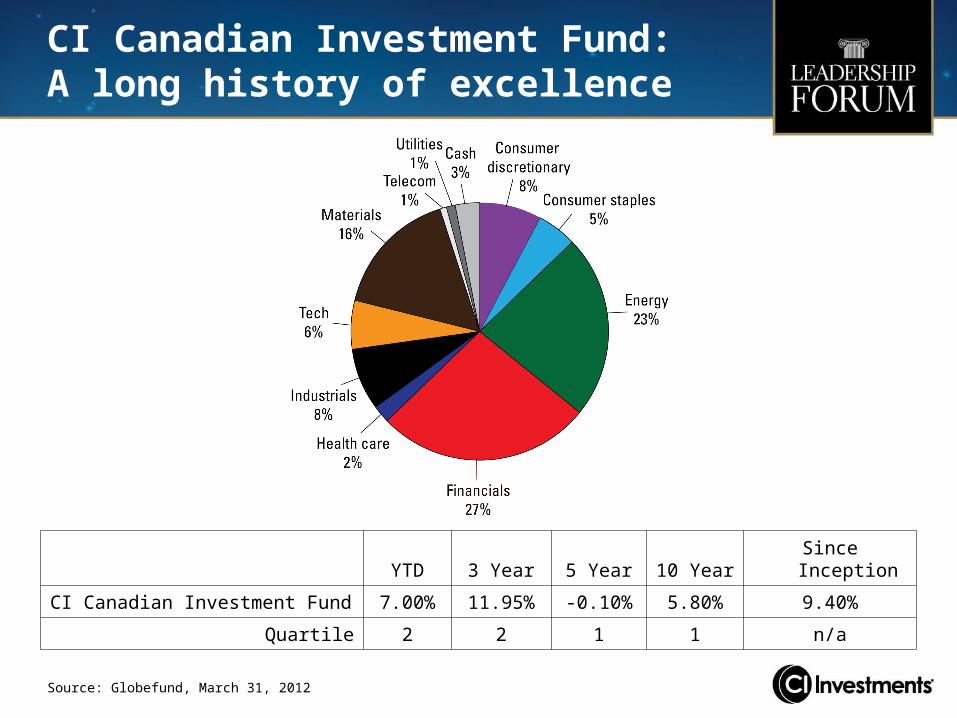
CI Canadian Investment Fund: A long history of excellence
YTD 3 Year 5 Year 10 Year Since Inception
CI Canadian Investment Fund 7.00% 11.95% -0.10% 5.80% 9.40%
Quartile 2 2 1 1 n/a
Source: Globefund, March 31, 2012

Tetrem’s new mandates
YTD 1 Year 3 Year 5 Year
Castlerock Canadian Dividend Fund B 6.3% 2.6% 15.1% 1.9%
Quartile 1 1 2 2
Castlerock Capital Appreciation Fund B 9.0% -3.3% 9.3% -3.4%
Quartile 3 3 3 2
Castlerock Canadian Dividend B Castlerock Capital Appreciation B
Tetrem assumed management of the funds April, 2012Source: Globefund, March 31, 2012

Thank you
Commissions, trailing commissions, management fees and expenses all may be associated with mutual fund investments. Please read the prospectus before investing. Unless otherwise indicated and except for returns for periods less than one year, the indicated rates of return are the historical annual compounded total returns including changes in security value. All performance data assume reinvestment of all distributions or dividends and do not take into account sales, redemption, distribution or optional charges or income taxes payable by any securityholder that would have reduced returns. Mutual funds are not guaranteed, their values change frequently and past performance may not be repeated.
®CI Investments and the CI Investments design are registered trademarks of CI Investments Inc.