Profitability and cost shifting in government procurement ... Series/Chen... · Profitability and...
32
Profitability and cost shifting in government procurement contracts * Hui Chen University of Zürich Katherine Gunny † University of Colorado, Boulder This draft: October 2014 Abstract: We examine whether contractors with cost plus contracts earn a higher profit, and whether the higher profit is associated with cost shifting, using a unique set of data of federal procurement contracts between the years 2005 and 2010. Prior research often examines government contractor profitability without differentiating the contract types, which determines the contractor’s ability to cost-shift. We identify firms that are awarded cost plus contracts in some years but not in other years. We find their profitability significantly increases during the years with cost plus contracts. We also find that these firms exhibit greater discretionary expenditures during the years with cost plus contracts, relative to the years without, which is consistent with cost shifting. However, effective monitoring through the Cost Accounting Standards helps to mitigate such behavior. _____________________________ * The authors’ emails are [email protected] and [email protected]. We thank Yonca Ertimur, Bjorn Jorgensen, Steve Rock, and workshop participants at University of Colorado at Boulder for helpful comments. † Corresponding author.
Transcript of Profitability and cost shifting in government procurement ... Series/Chen... · Profitability and...

Profitability and cost shifting in government procurement contracts*
Hui Chen
University of Zürich
Katherine Gunny†
University of Colorado, Boulder
This draft: October 2014
Abstract: We examine whether contractors with cost plus contracts earn a higher profit, and
whether the higher profit is associated with cost shifting, using a unique set of data of federal
procurement contracts between the years 2005 and 2010. Prior research often examines
government contractor profitability without differentiating the contract types, which determines
the contractor’s ability to cost-shift. We identify firms that are awarded cost plus contracts in some
years but not in other years. We find their profitability significantly increases during the years with
cost plus contracts. We also find that these firms exhibit greater discretionary expenditures during
the years with cost plus contracts, relative to the years without, which is consistent with cost
shifting. However, effective monitoring through the Cost Accounting Standards helps to mitigate
such behavior.
_____________________________
* The authors’ emails are [email protected] and [email protected]. We thank Yonca Ertimur,
Bjorn Jorgensen, Steve Rock, and workshop participants at University of Colorado at Boulder for helpful
comments.
† Corresponding author.

2
1. Introduction
Public procurement is the purchase by federal, state, and local governments of products
and services. The US government spends a large amount of money on public procurement. For
example, it reported $391.3 billion and $540.1 billion on federal procurement in the years 2005
and 2010, respectively.1 Partially due to its significance in amount, federal procurement spending
has generated controversy. Critics claim that government contractors earn excessive profits at the
taxpayers’ expense and that the government does not sufficiently monitor the contractors. To
respond to the growing dissatisfaction against federal contractors, President Obama has proposed
and implemented a series of initiatives to tighten the requirements for federal contractors. One of
these measures is a move away from cost plus contracts and toward more fixed price contracts
(Michaels and Cole, 2009).
Fixed price and cost plus are the two most common types of procurement contracts offered
by the US government to contractors.2 For a fixed price contract, a contractor provides a product
or service to the government at a fixed price that is determined through negotiation or bidding. For
a cost plus contract, the contract price is equal to a contractor’s cost to produce the product or
service plus a profit margin. That is, with a cost plus contract, the government reimburses the
contractor for its declared costs to fulfill the contract and pays an additional fee, the profit,
according to the negotiation. Therefore, if offered a cost plus contract, a contractor has an incentive
1 See: http://www.usaspending.gov/ 2 In practice, there are hybrids of both types of contracts. For example, Rogerson (1992) describes four common
types of contracts employed by the US Department of Defense: (1) pure fixed price, (2) pure cost reimbursement,
(3) incentive fixed price (i.e., realized costs are reimbursed up to a pre-specified threshold level), and (4) incentive
cost reimbursement (i.e., incentive fixed price contracts revert to pure cost reimbursement at a pre-specified
threshold cost level). For our analysis, we refer to any contracts with revenue that is sensitive to the seller’s cost as
cost plus. In our sensitivity analysis, we ensure our results are robust to this empirical choice.

3
to inflate its reported costs to earn a higher profit. Specifically, the contractor could use its
accounting discretion to shift costs from other segments of its business to the government contract.3
We use a unique set of data to examine whether contractors with cost plus contracts earn
higher profits and whether these higher profits are associated with cost shifting. To control for
confounding exogenous factors, we identify firms that are awarded cost plus contracts in some
years and not in other years. We find their profitability significantly increases during the years
with cost plus contracts. We also find that these firms exhibit greater discretionary expenditures
during the years with cost plus contracts, consistent with cost shifting. However, effective
monitoring through the Cost Accounting Standards seems to mitigate this behavior.
A vast theoretical literature explores the intricacies of optimal contracts and information
problems in procurement setting (Laffont and Tirole 1986; McAfee and McMillan 1986; Rogerson
1992; Rogerson 1994; etc.). Since the government cannot costlessly observe the true cost incurred
by a contractor, the contractor with a cost plus contract can manipulate reported cost through cost
inflation or cost shifting. Rogerson (1992) demonstrates that a government contractor could over-
allocate overhead to government contracts while under-allocating overhead in commercial
contracts, to strategically shift cost from commercial to government business. Furthermore, given
these informational asymmetries, a first best solution can never be achieved. In contrast, fixed
price contracts do not lead to the distortion of incentives as the contractor fully captures any
profit/loss earned under the fixed price, regardless of its real cost or reported cost.
Empirical evidence on government contractors’ cost shifting has been scant, mainly due to
lack of data. Until 2004, information about which government contractors received cost plus
3 As a result, cost plus contracts are oftentimes singled out for being abuse prone. For example, in a U.S. House of
Representative report (2004), prepared for Rep. Henry Waxman, a section states “Reliance on Abuse-Prone Contract
Types Is Increasing” and the section discusses how cost plus contracts expose taxpayers to risk.

4
contracts was not publicly disclosed. A few empirical papers examine cost shifting and
profitability among government contractors but without differentiating the types of contracts.
Thomas and Tung (1992) find evidence that Department of Defense contractors shift pension costs
to the government. Lichtenberg (1992) finds government contractors earned excess profits on
government contracts in the 1980s and suggests cost shifting as the reason. However, McGown
and Vendrzyk (2002) hypothesize that a government contractor can shift costs only in segments
with both government and commercial contracts. They fail to find significant differences in
profitability between mixed segments (i.e. with both government and commercial business) and
segments with only government or only commercial profits. Therefore they conclude that
government contractors do not engage in cost shifting.
Prior research has also examined cost shifting in other settings. Eldenburg and Soderstrom
(1996), using data from the state of Washington, find that hospitals engage in cost shifting among
payers. The practice they focus on involves hospital managers purposefully biasing budgeted
information. Eldenburg and Kallapur (1997) likewise examine the hospitals’ response to a
Medicare policy change in 1983. They find that the hospitals maximize their revenues by changing
their patient mix and overhead. Eldenburg and Krishnan (2006) provide a comprehensive review
on cost and incentive issues in the healthcare industry.
We examine whether government contractors with cost plus contracts earn unusually high
profits and, if so, whether the high profitability is associated with cost shifting facilitated by
accounting discretion. To address our research questions, we construct a database of 4.9 million
federal procurement contracts (5,745 firm-years, 1,137 firms) between 2005 and 2010 from the
Federal Procurement Data System website.4 For our main test, we identify U.S. publicly traded
4 https://www.fpds.gov/fpdsng_cms/index.php/en/

5
government contractors that have been awarded a cost plus contract in at least one year and only a
fixed price contract in at least another year during our sample period. The final sample consists of
258 firms or 1,505 firm-years. This sample enables us to use the firm as its own control and
mitigates concerns that firm characteristics drives differences in cost shifting and profitability. We
find that our sample firms have greater discretionary expenditures as well as higher profitability
during the years with cost plus contracts, relative to other years without cost plus contracts. This
is consistent with the conventional wisdom that government contractors that are awarded cost plus
contracts shift costs to obtain higher profits.
We also examine the effect of government monitoring. We identify contracts that are
required to be compliant with the Cost Accounting Standards (CAS). When contracts (both fixed
and cost plus) are subject to CAS coverage, the firm is required to provide a detailed disclosure
about the accounting policies used to determine CAS related costs. Thus it faces increased
monitoring by the government to prevent cost shifting. We predict the association between cost
plus contracts and profitability to decrease as the percentage of revenue subject to CAS increases.
Our results are consistent with our predictions.
We conduct several sensitivity tests to rule out alternative explanations. First, we employ
different samples to ensure our results are not sensitive to sample selection. For our main
analysis, the firm serves as its own control, by using 1,505 firm-years (258 firms) with at least
one year with a cost contract and one year without a cost contract over the sample period. Our
results are robust to two alternative subsamples: (1) all contractors (5,745 firm-years, 1,137
firms) and (2) all contractors with at least one cost contract (2,201 firm-years, 383 firms).
Second, for our main analyses, we refer to any contracts with revenue that is sensitive to the
seller’s cost as cost plus. However, in practice contracts are often hybrids that fall within the
6
spectrum between cost plus and fixed price. Our results are robust to using a sample that includes
only pure fixed price and pure cost reimbursement.
Note that our findings do not endorse the view that cost plus contracts should be reduced
or even eliminated in government procurement. Different forms of contracts serve different
purposes and may make sense in different contracting environments. Prior research on optimal
contract form demonstrates that factors such as project risk, market competition, contractor
characteristics, and trust are critical in determining the contract form. For example, when a
project is long term and highly uncertain, the government is more likely to adopt cost plus
contract to share risk. The same is true is when a contractor has a low risk tolerance because it is
young, small, highly leveraged, or all of the above. Fixed price contracts often imply higher risk
for the contractor, thus tend to be used only when the project outcome is certain or when the
contractor has a high risk tolerance. Furthermore, the government can rarely obtain the
contractors’ true costs information because frequent audits are costly. The government must
trade off the potential gains recovered from these audits and the monitoring cost of doing them.
We make several contributions to the literature. First, we are the first paper to examine
government procurement using contract-level data, which provides a cleaner setting than prior
studies. McGowan and Vendrzyk (2002) do not differentiate contract types and fail to find
evidence of higher profitability for defense contractors. This result could be due to the fact that,
for our sample, only 4% of contracts are cost plus and only 37% of government contractors have
cost plus contracts. Not differentiating the contract types could bias against finding differential
profitability because only cost plus contracts provide an incentive to shift cost and increase profits.
McGowan and Vendrzyk (2002) also examine firms’ government segment profitability relative to
commercial segment profitability. Before 1998 and the implementation of Statement of Financial

7
Accounting Standards 131, firms had more discretion in their segment reporting (Berger and Hann
2007) and could have had proprietary reasons to withhold reporting for profitable segments. Thus
examining segment profitability also biases against finding differential profitability.
Second, we examine research and development (R&D) expense and selling, general, and
administrative (SG&A) expense as the expenditures used by contractors to shift costs. Thomas and
Tung (1992) examine defense contractors and whether they shift pension costs across contracts
and time to the government. They find evidence of cost shifting using pension costs. One difficulty
in interpreting their results is that cost plus contracts could provide an incentive to increase
promised pension cost benefits. Thus their observed cost increase might be due to increasing
promised pension payments rather than cost shifting. In contrast, R&D and SG&A are not
susceptible to this problem. Our results confirm that procurement contractors shift costs, consistent
with Thomas and Tung (1992), and provide evidence on other types of expenditures used for cost
shifting besides pension costs.
Third, we provide evidence that cost shifting may explain the relatively higher profitability
of government contractors. Lichtenberg (1992) finds excess profits on government contracts in the
1980s and suggests cost shifting as the explanation. McGowan and Vendrzyk (2002) do not
examine cost shifting directly and infer from their segment profitability comparisons that cost
shifting is not an explanation for excess profitability. They suggest the result in Lichtenberg (1992)
is likely due to other non-accounting explanations. In contrast, we directly examine both cost
shifting and profitability. We find evidence that cost shifting is one explanation for relatively
higher profitability.
Lastly, we are the first researchers to provide evidence on the effectiveness of cost
accounting standards. Our results suggest that cost accounting standards mitigate the positive

8
association between cost plus contracts and profitability. When cost accounting standards apply,
there is increased monitoring by the government and increased disclosure of costs, which likely
decrease the contractors’ ability to shift costs. Although our evidence illuminates the benefits of
cost accounting standards, we do not attempt to investigate the tradeoff between the costs and
benefits of these standards.
2. Background and hypotheses development
The terms under fixed price and cost plus contracts differ, which results in different
incentives for the contractors. For a fixed price contract, the contractor provides a product or
service to the government at a fixed price. For example, the Department of Homeland Security
might contract with Dell Inc. to buy laptops at a fixed price per unit. In most cases, no ex post
renegotiation of the agreed-upon price is permitted. Therefore the government knows the price
upfront. Since the price is fixed, contract revenue is not sensitive to the seller’s cost of production.
The seller bears all risk associated with any cost overruns.
With cost plus contracts, the revenue is sensitive to the seller’s cost. The contract revenue
is equal to the seller’s production cost plus a fixed fee or guaranteed profit margin. Thus the
government does not know the final price before the project begins and bears the risk of any
overruns. Generally, when the costs are difficult to estimate or when the product or service is hard
to explicitly define ahead of time, the government may have incentives to offer a cost plus contract.
For example, an aerospace firm might contract with the National Aeronautics and
Space Administration (NASA) to build a rocket propulsion unit. For the aerospace company to
produce the unit, it needs to make a transaction-specific investments in technology and human
capital because the product is highly specialized and only purchased by NASA. From the aerospace
firms’ perspective, engaging in this transaction under a fixed price contract may be too risky given
9
the project’s required investment and its inherent uncertainty and complexity. To appropriately
share risk and incentivize the aerospace firm to invest sufficiently, NASA would likely have to
offer a cost plus contract and bear the risk of any cost overruns.
Under cost plus contracts, contractors have incentives to shift costs to the government,
whereas under fixed price contracts they generally do not. Obviously, if incurred costs were
observable, there could be no cost shifting: the government would reimburse the contractor for
expenditures incurred only for the contracted project. However, given information asymmetry
between the contractor and the government, which is typical, true cost information is difficult to
verify. Since the contractor’s revenue increases in the cost reimbursed, the contractor’s profit will
be higher when it shifts other cost to the government. Specifically, if a firm receives cost plus
contracts in some years and only fixed price contracts in others, its profitability could vary across
years due to the differential availability of cost shifting based on contract type. This leads to our
first hypothesis:
H1: Government procurement contractors’ profitability is higher in years with a cost
plus contract relative to years without a cost plus contract.
Thomas and Tung (1992) point out that contractor firms can shift costs both inter-contract
and inter-time. With inter-contract shifting, firms shift cost from noncost plus contracts (e.g.,
private sector or fixed price government contracts) to cost plus contracts within the same contract
period. For example, consider a firm that spends a total of $100 million on R&D and reports $100
million in R&D expense on the income statement. Out of $100 million, it incurs $20 million for
the government contract and $80 million for its commercial business. Imagine that it could shift
$5 million of R&D expenses from commercial business to the government project. The
government must then reimburse the firm $25 million for its R&D expenses, and the firm’s
10
commercial work gets “subsidized” by $5 million. Empirically, it is difficult to observe inter-
contract cost shifting because, with or without the shifting, the firm reports $100 million in R&D
expense on the income statement.
With inter-period shifting, firms shift costs into contract periods with a cost plus contract
from periods without such a contract. Consider again the firm that spends a total of $100 million
on R&D. Again assume the contractor should incur $20 million of R&D expenses on the
government project. With inter-period cost shifting, the firm could intentionally engage in more
R&D than necessary to fulfill the government contract, and this research could benefit its
commercial business in the future. If the incremental expense amounts to an additional $5 million
in R&D costs, the government ends up subsidizing the contractor’s commercial business by
overpaying $5 million dollars. With inter-period cost shifting, the firm reports $105 million on the
income statement for the year it has a cost plus contract with the government, instead of the $100
million it would have reported if it had not had the contract. Therefore inter-period cost shifting
can be detected empirically from the firm’s financial statement information.
In this paper, we proxy for the government contractors’ inter-period cost shifting using
their discretionary expenditures. Our second hypothesis is therefore:
H2: Government procurement contractors’ discretionary expenditures are
higher in years with a cost plus contract relative to years with only fixed price
contracts.
When there is information asymmetry between the contractor and the government, the
contractor can include more expenditures in reimbursed cost than were incurred. Since the
contractor’s revenue is increasing in cost, more cost shifting will lead to a greater profitability.
However, the government can increase its monitoring to prevent cost shifting. With increased
monitoring, the government can decrease the contractors’ ability to shift costs. As such, we expect
11
the association between cost contracts and profitability to decrease as monitoring by the
government increases.
In terms of increased monitoring, some government contracts are subject to Cost
Accounting Standards. Cost Accounting Standards are a set of 19 standards and rules for use in
determining costs.5 A contract could be subject to full CAS coverage (i.e., required to follow all
19 standards), modified CAS coverage (required to follow only four standards: CAS #401, #402,
#405, and #406)6, or be exempt from coverage. There are many reasons a contract could be exempt
from CAS, including that it is less than $7.5 million (and the firm does not have other contracts
over $7.5 million), it is for commercial items, or it has “adequate price competition.” When
contracts are subject to full CAS coverage, the firm is required to provide a CAS Disclosure
Statement, which describes in detail the accounting policies used to determine CAS related costs.
CAS standards can apply for both cost plus contracts and fixed price contracts. For fixed
price contracts, the information subject to CAS could be used in determining the contract price
(i.e., the government could use the information to set the fixed price). For cost plus contracts, the
information subject to CAS could be used in determining the fixed fee, profit margin, or
reimbursed costs. To the extent contracts subject to CAS indicate increased monitoring efforts by
the government to prevent cost shifting, we expect the association between cost plus contracts and
profitability to decrease as monitoring by the government increases. This leads to our third
hypothesis:
H3: Government contractors with cost plus contracts are relatively less profitable
when cost accounting standards apply.
5 For example, Thomas and Tung (1992) describe the CAS pension rules (#412 and #413) as similar to tax rules and
Generally Accepted Accounting Principles but stricter than Employee Retirement Income Security Act rules. 6 CAS #401, “Consistency in Estimating, Accumulating and Reporting Costs”; CAS#402, “Consistency in
Allocating Costs Incurred for the Same Purpose”; CAS #405, “Accounting for Unallowable Costs; CAS #406, “Cost
Accounting Period.”

12
3. Research Design
3.1. Measure of discretionary expenditure
Discretionary expenditures are defined as the sum of R&D, advertising, and SG&A
expenditures. We estimate the following model based on the entire Compustat sample with data
available to estimate the models following Roychowdhury (2006). We estimate the normal level
of discretionary expenditures as follows:
DisExpt / Assetst-1 = µ0 + µ1 (1/Assetst-1) + µ2 (St-1/Assetst-1) + εt (1)
where
DisExpt = research and development expense plus advertising and selling, general, and
administrative expense
Assetst-1 = total assets
St = sales.
Model (1) is estimated cross-sectionally for each industry-year with at least 15
observations. Continuous variables are winsorized at the 1% and 99% levels to reduce the
influence of outliers. For each firm-year, abnormal discretionary expenditure (Abnormal DisExp)
is the residual from the corresponding industry-year regression. As an alternative proxy for
abnormally high discretionary expenditures, we create an indicator variable equal to one if the
residual from model (1) is in the highest quintile and zero otherwise (Abnormal DisExp_Q10) for
a given year.
3.2. Hypothesis testing
To test our first hypothesis (H1), we adopt the following regression model used in Core et
al. (1999):
ROA = β0 + β1Cost contract + β2Lagged ROA + β3StdROA + β4Log sales
+ β4Log procurement sales + εt (2)
Where

13
StdROA = standard deviation of ROA during the prior three years including
year t
Log sales = the natural logarithm of sales in millions
Log procurement sales = the natural logarithm of procurement contract sales in millions.
In all regressions, continuous variables are winsorized at the 1% and 99% levels to reduce
the influence of outliers, and the standard errors are corrected to control for clustering across firm
and year (Gow et al. 2010; Petersen 2009). We include year and industry (two-digit SIC) fixed
effects. We include the standard deviation of ROA over the fiscal year (Std ROA) and the natural
logarithm of annual net sales (LnSales). We augment the Core et al. (1999) regression model and
include ROA to control for the time-series properties of performance. Of particular interest to us is
the coefficient on Cost contract. If contracting firms have higher return on assets in years with cost
plus contracts, we should observe a positive β1.
To test our second hypothesis (H2), we estimate the following OLS regression model:
Abnormal DisExp or
Abnormal DisExp_Q10
= α0 + α1Cost contract + α2Log assets + α3Market-to-book
+ α4ROA + εt (3)
Where
Abnormal DisExp = the residual from model (1)
Abnormal DisExp_Q10 = an indicator variable equal to one if the residual from model (1)
is in the highest quintile and zero otherwise
Cost contract = an indicator variable equal to 1 if the firm has at least one cost
contract and zero otherwise
Log asset = natural logarithm of total assets in millions
Market-to-book = the market value of equity divided by the book value
ROA = earnings before extraordinary items divided by total assets
The control variables are from Gunny (2010). Firm size, Log assets, controls for any size
effects, and the market-to-book ratio controls for growth opportunities. Return on assets, ROA, is
included to address concerns that abnormal discretionary expenditures are correlated with
performance. Of particular interest to us is the coefficient on Cost contract, α1. If contracting firms
have higher discretionary expenditures in years with cost plus procurement contracts, we should

14
observe a positive α1. A positive coefficient would be consistent with inter-period cost shifting and
the results in Thomas and Tung (1992).
To test our third hypothesis (H3), we augment model (3) as follows:
ROA = γ0 + γ1Cost contractt + γ2%CASt + γ3%CAS*Cost contractt + γ4Lagged ROA
+ γ5StdROA + γ6Log sales + γ7Log procurement sales + εt (4)
where
%CAS = percentage of procurement revenue subject to cost accounting standards.
H3 suggests that the positive association between whether the firm has a cost plus contract
and performance will be constrained as the government’s monitoring effort increases. Our proxy
for monitoring is the percentage of contract revenue that is subject to cost accounting standards
(%CAS), either full or partial coverage. When CAS applies, specific rules must be applied to
determine cost. When full CAS applies, a firm must also produce a CAS Disclosure Statement,
which describes in detail the accounting policies used to determine CAS related costs. CAS
standards can apply to fixed and cost plus contracts. For fixed contracts, this could help reduce
information asymmetry when negotiating the price of the contract. For cost plus contracts, CAS
could help by preventing cost shifting. Therefore we expect a negative coefficient on the variable
%CAS. Of particular interest to us is the coefficient on the interaction between Cost contract and
%CAS. If firms with cost plus contracts are less profitable when a greater percentage of contract
revenue is subject to CAS, we would expect a negative coefficient on the interaction term, γ3.
4. Sample and Descriptive Statistics
4.1. Sample selection
Panel A of Table 1 describes the sample details. First, we retrieve data on all procurement
contracts between 2004 and 2010 from the Federal Procurement Data System website. Next, we
map the 21,657,724 contracts to firms available in Compustat and retain 6,098,655 contracts. Next,

15
after requiring nonmissing control variables, we are left with 4,912,232 contracts or 1,137 firms.
Table 1 reveals that 209,278 (4.26%) of contracts are cost plus and 379 (33.33%) firms have at
least one cost plus contract over the sample period. Panel B of Table 1 describes our three samples.
Sample 1 consists of all procurement contractors in our sample including 5,745 firm-years (1,137
firms), of which 1,315 firm-years involve cost plus contracts and 4,439 firm-years do not. The next
two samples exclude firms without cost plus contracts over the sample period. As discussed earlier,
the government only offers cost plus contracts in certain situations, such as when the costs are
difficult to estimate or when the product or service is hard to explicitly define ahead of time. As
such, firms that receive cost contracts could differ from firms that do not receive cost contracts,
and this self-selection could bias our results.
Sample 2 excludes firms without any cost contracts over the sample period and consists of
2,201 firm-years (383 firms), of which 1,315 firm-years have cost plus contracts and 886 do not.
Sample 3 consists of firms with at least one year with a cost plus contract and one year without
over the sample period. This sample consists of 1,505 firm-years (258 firms), of which 619 firm-
years have cost plus contracts and 886 do not.7 Sample 3 allows each firm to serve as its own
control and mitigate concerns that self-selection drives our findings. Therefore we use sample 3 in
our main analysis and conduct sensitivity analysis using sample 1 and sample 2.
4.2. Descriptive statistics
Panel A of Table 2 provides the descriptive statistics of contract revenue and frequency
by contracting department. The first four columns describe all contracts and the last four
columns provide analysis for cost plus contracts. The top three departments by contract revenue
7 The difference between sample 2 and sample 3 is that firms with a cost contract every year (383 – 258 = 125 firms)
are excluded.
16
are the Army, Navy, and Air Force.8 The General Services Administration and the Department of
Veteran Affairs have the greatest frequency of contracts.
Panel B of Table 2 provides the descriptive statistics of contract revenue and frequency
by three-digit North American Industry Classification System (NAICS). The government
procurement database provides the NAICS code associated with each contract. The top three
industries for all contracts by contract revenue are professional, scientific, and technical services
(541), transportation equipment manufacturing (336), and computer and electronic product
manufacturing (334). For cost plus contracts, professional, scientific, and technical services
(541) is the largest and comprises 63% of all cost plus contract revenue. The next largest
industry is transportation equipment manufacturing (336), which comprises 14% of cost plus
contract revenue. Cost plus contracts are typically awarded when the product or service is hard to
explicitly define ahead of time. Consistent with this notion, industries with products and services
that are difficult to specify (e.g., professional, scientific, and technical services) are awarded
more frequently with cost plus contracts, whereas industries with less complicated offerings
(e.g., merchant wholesalers, nondurable goods) are not.
Table 3 presents descriptive statistics for a sample of 258 firms with at least one year
with a cost plus contract and one year with only fixed price contracts. Panel A provides summary
statistics for sample firm-years with at least one cost plus contract, and Panel B for firm-years
with only fixed price contracts. Firm-years with cost contracts have significantly higher mean
and median abnormal discretionary expenditures (Abnormal DisExp) than firm-years with only
fixed price contracts. Also, both the mean and median return on assets (ROA) are significantly
8 Because of data availability prior studies typically use a sample consisting of the top 100 Department of Defense
contractors (by revenue) that are publicly traded (e.g., Thomas and Tung 1992). The Department of Defense consists
of the Army, Navy, Air Force, and Defense (nonmilitary).

17
higher for firm-years with at least one cost plus contract compared to firm-years with only fixed
contracts. Overall, the univariate differences indicate that firm-years with at least one cost
contract have and better financial performance and more discretionary expenditures, consistent
with hypotheses 1 and 2.
Between the samples with cost plus contracts and fixed price contracts, mean assets,
market-to-book, standard deviation of ROA, sales, and procurement sales are not significantly
different. These insignificant differences between the two samples indicate that our sample
selection procedure that uses the firm as its own control mitigates concerns that firm
characteristics drive the variation in our variables of interest (i.e., abnormal discretionary
expenditures and return on assets). Lastly, %CAS is significantly higher for the cost plus sample,
which is expected since cost plus contracts are more likely to be subject to the cost accounting
standards.
5. Results
5.1. Main results
We report the results of estimating model (2) in Table 4. If cost plus contracts are associated
with higher profitability relative to fixed contracts, we would expect the contractors to have better
financial performance in years with cost plus contracts. Consistent with this expectation, we find
a significantly positive relation between return on assets and whether the firm has a cost contract.
Specifically, the coefficient on Cost contract is 0.008 (p = 0.03). This suggests that firm-years with
cost plus contracts have higher profitability compared to firm-years with only fixed price contracts,
consistent with our Hypothesis 1. In terms of economic significance, the marginal effect on Cost
contract is 0.762%. The marginal effect can be interpreted as the percentage increase in ROA
during years with a cost contract. Mean assets for the sample is $3.33 million. Therefore firm-

18
years with cost contracts have earnings before extraordinary items that is $25.37 million higher
than firm years without cost contracts, holding all other variables at their mean.
We report the results of estimating model (3) in Table 5. We use two variables to proxy for
abnormal discretionary expenditures. First, we estimate an ordinary least squares regression with
the continuous variable, Abnormal DisExp, as the dependent variable. Second, we estimate a
logistic regression with the dichotomous variable, Abnormal DisExp_Q10, as the dependent
variable. The first column reveals a significant relation between abnormal discretionary
expenditures and whether the firm has a cost contract. Specifically, the coefficient on Cost contract
is 0.128 (p = 0.04). The second column reveals a significant relation between whether the firm is
in the highest quintile of abnormal discretionary expenditures and whether the firm has a cost
contract. The coefficient on Cost contract is 0.411 (p = 0.01). The analysis presented in Table 5
provides evidence consistent with Hypothesis 2 that procurement contractors shift costs across
time to the government through cost plus contracts. Overall, our results provide evidence of cost
shifting.
Taken together, the results in Table 4 and 5 suggest government procurement contractors
shift costs to the government when they have cost plus contracts and this leads to greater
profitability relative to firm-years with only fixed price contracts. Please note two important
caveats when interpreting these results. First, Hypothesis 2 tests for inter-period cost shifting since
it is easier to observe than inter-contract shifting. Even though we test exclusively for inter-period
shifting, both types of cost shifting could occur. Second, firms shifting costs and increasing their
profits may not be suboptimal from the government’s perspective. The optimality of contract form
is determined by many factors. Cost plus contracts may lead to distorted incentives, but that does
not necessarily imply that fixed price contracts would be preferable.

19
Hypothesis 3 suggests that the positive association between having a cost plus contract and
financial performance is constrained as the government’s monitoring increases. Our proxy for
monitoring is the percentage of contract revenue subject to cost accounting standards (%CAS). We
test our third hypothesis (H3) and report the results of model (4) in Table 6. We continue to observe
a positive relation between having a cost contract and the firm’s return on assets. The coefficient
on %CAS is negative and significant, suggesting firm profitability decreases as the percentage of
contract revenue subject to cost accounting standards increases. More importantly, we show that
the relation between Cost contract and ROA varies with %CAS in the predicted manner.
Specifically, the coefficient on the interaction between Cost contract and %CAS is significantly
negative (γ3 = -0.047, p = 0.08). These results provide support for our third hypothesis (H3) and
suggest that as the government’s monitoring increases the association between having a cost plus
contract and profitability decreases.
5.2. Sensitivity Analysis
For our main analysis, our sample consists of the 258 firms that have at least one year with
a cost plus contract and one year without, over the sample period (see Panel B of Table 1, sample
3). For this sample, the firm serves as its own control. For a sensitivity test, we explore the
robustness of our results to alternative control samples. We estimate model (2) and model (3) using
two alternative samples: all contractors (see Panel B of Table 1, sample 1) and all contractors with
at least one cost plus contract over the sample period (see Panel B of Table 1, sample 2).
We report the result of sensitivity analysis of estimating model (2) in Panel A of Table 9.
For both alternative control samples, we continue to find a positive association between abnormal
discretionary expenditures and the firm having a cost plus contract. Specifically, the coefficient on
Cost contract for Sample 1 is 0.0659 (p = 0.05), and the coefficient on Cost contract for Sample 2

20
is 0.0906 (p=0.04). Next, we report the result of sensitivity analysis of estimating model (3) in
Panel B of Table 9. Again, we find a significantly positive relation between the firms’ return on
assets and the firms having a cost contract. Specifically, the coefficient on Cost contract for
Sample 1 is 0.0045 (p = 0.02), and the coefficient on Cost contract for Sample 2 is 0.0070 (p =
0.03). This provides evidence that our findings that firm-years with cost plus contracts have higher
profitability compared to firm-years with only fixed price contracts is robust to alternative control
samples.
We also use alternative categorization of contracts to re-run our tests. For the main
analyses, we refer to any contracts with revenue that is sensitive to the seller’s cost as cost plus.
However, Rogerson (1992) describes four common types of contracts employed by the U.S.
Department of Defense: (1) pure fixed price, (2) pure cost reimbursement, (3) incentive fixed price
(i.e., realized costs are reimbursed up to a pre-specified threshold), and (4) incentive cost
reimbursement (i.e., incentive fixed price contracts revert to pure cost reimbursement at a pre-
specified cost threshold). We estimate model (2) and model (3) on the sample including only (1)
pure fixed price and (2) pure cost reimbursement, and the results are robust.
6. Conclusion
In government procurement, cost plus contracts facilitate risk-sharing between the
government and contractors, especially when the product or service is difficult to define ex ante.
Critics, however, claim that contractors abuse the flexibility provided by cost plus contracts and
shift other costs to the government to earn higher profits than deserved. In this paper, we use a
unique dataset of the U.S. federal procurement contracts to examine whether contractors that are
awarded cost plus contracts earn higher profits and whether the higher profits are associated with
cost shifting. We find evidence consistent with cost plus contract being associated with higher
21
profitability and greater discretionary expenditures, which indicate cost shifting. We also find that
the government’s monitoring through the Cost Accounting Standards helps to mitigate this
problem.
Our findings, however, do not prove that cost plus contracts are inferior to fixed price
contracts. Optimal contract form is determined by many factors, such as project risk, market
competition, and contractor characteristics. And cost plus contracts may be necessary when the
uncertainty associated with a project is high. Furthermore, once the cost plus contract is chosen,
contractors can earn an informational rent since the government cannot observe the true cost
incurred. More stringent monitoring is very costly and can be more expensive to the taxpayers.

22
References
Core, J., R. Holthausen, and D. Larcker. 1999. Corporate governance, chief executive officer
compensation, and firm performance. Journal of Financial Economics 51 (3): 371-406.
Eldenburg, L., and S. Kallapur. 1997. Changes in hospital service mix and cost allocations in
response to changes in Medicare reimbursement schemes. Journal of Accounting and
Economics 23 (1) 31-51
Eldenburg, L., and R. Krishnan. 2006. Management accounting and control in health care: an
economics perspective. Handbooks of Management Accounting Research, Volume 2, 859-
88.
Eldenburg, L., and N. Soderstrom. 1996. Accounting system management by hospitals operating
in a changing regulatory environment. The Accounting Review 71 (1) 23-42.
Gow, I. D., G. Ormazabal, and D. J. Taylor. 2010. Correcting for cross-sectional and time-series
dependence in accounting research. The Accounting Review 85 (2): 483-512.
Gunny, K. A. 2010. The relation between earnings management using real activities
manipulation and future performance: evidence from meeting earnings benchmarks.
Contemporary Accounting Research 18 (3): 868-891.
Laffont, J.J., and J. Tirole. 1993. A theory of incentives in procurement and regulation. Cambridge,
Mass.: MIT Press.
Laffont, J.J., and J. Tirole. 1986. Using cost observation to regulate firms. Journal of Political
Economy 94 (3): 614-641.
Lichtenberg, F. 1992. A perspective on accounting for defense contracts. The Accounting Review
67 (4): 741-752.
McAfee, R., and P. McMillan. 1986. Bidding for contracts: a principal-agent analysis. RAND
Journal of Economics 86 (17): 326-338.
McGowan, A. S., and V. P. Vendrzyk. 2002. The relation between cost shifting and segment
profitability in defense-contracting industry. The Accounting Review 77 (4): 949-969.
Michaels, D., and A. Cole. 2009. Defense contractors resist fixed-price jobs. The Wall Street
Journal. December 14.
Rogerson, W. 1992. Overhead allocation and incentives for cost minimization in defense
procurement. The Accounting Review 67 (4): 671-690.
Rogerson, W. 1994. Economic incentives and the defense procurement process. Journal of
Economic Perspectives 8 (4): 65-90.

23
Roychowdhury, S. 2006. Earnings management through real activities manipulation. Journal of
Accounting and Economics 42 (3): 335-370.
Thomas, J., and S. Tung. 1992. Cost manipulation incentives under cost reimbursement: pension
costs for defense contracts. The Accounting Review 67 (4): 691-711.
Petersen, M. A. 2009. Estimating standard errors in finance panel data sets: comparing approaches.
Review of Financial Studies 22 (1): 435-480.
U.S. House of Representative. 2006. Dollars, not sense: Government contracting under the Bush
administration. Report prepared for Rep. Henry A. Waxman. June.

24
Table 1
Panel A: Sample selection
Year
All federal
procurement
contracts
Contracts
mapped to
Compustat
Contracts
with control
variables Firms
Cost plus
contracts Firms
2005 2,849,310 685,199 495,573 861 32,998 237
2006 3,723,011 926,604 753,137 916 35,445 247
2007 4,008,419 1,167,812 972,510 937 33,079 264
2008 4,391,358 1,335,355 1,114,443 1,000 31,242 237
2009 3,341,336 1,019,336 799,357 1,016 34,704 231
2010 3,344,290 964,349 777,212 1,024 41,810 249
21,657,724 6,098,655 4,912,232 1,137 209,278 379
Panel B: Control samples
Firm-years Firms
Firm-years
with at least
one cost
contact
Firm-years
with no cost
contract (i.e.
only fixed)
Sample 1 5,745 1,137 1,315 4,439
Sample 2 2,201 383 1,315 886
Sample 3 1,505 258 619 886
*Includes all procurement contractors
*Includes procurement contractors with at least one cost contract over
the sample period
*Includes procurement contractors with at least one year with a cost plus
contract and one year with only fixed contracts

Table 2
Panel A: Contract revenue and frequency by contracting department
Department
Contract
revenue
(in millions) %
# of
contracts %
Contract
revenue
(in millions) %
# of
contracts %
Department of the army 75,820 25% 318,283 6% 40,855 36% 99,010 47%
Department of the navy 68,641 23% 234,272 5% 20,072 18% 24,277 12%
Department of the air force 62,234 21% 144,796 3% 27,682 24% 45,030 22%
General services administration 15,311 5% 1,333,167 27% 1,118 1% 1,047 1%
Department of veteran affairs 13,858 5% 1,135,401 23% 45 0% 183 0%
National Aeronautics and space admin. 10,725 4% 27,088 1% 7,587 7% 8,471 4%
Department of homeland security 9,565 3% 16,292 0% 3,999 3% 4,426 2%
Department of defense (non military) 8,046 3% 46,589 1% 2,154 2% 1,979 1%
Department of health and human services 7,388 2% 42,961 1% 2,895 3% 3,264 2%
Department of the treasury 4,934 2% 24,265 0% 1,799 2% 2,463 1%
Department of justice 3,606 1% 78,920 2% 131 0% 156 0%
Department of the interior 2,925 1% 54,899 1% 371 0% 672 0%
Department of state 2,530 1% 8,684 0% 824 1% 1,249 1%
Department of transportation 2,421 1% 23,819 0% 167 0% 173 0%
Department of energy 2,382 1% 7,209 0% 1,647 1% 1,475 1%
Department of commerce 1,978 1% 18,546 0% 665 1% 1,467 1%
Railroad retirement board 1,368 0% 4,455 0% 1 0% 7 0%
Department of agriculture 1,327 0% 13,020 0% 935 1% 5,858 3%
Agency for international development 1,011 0% 1,825 0% 682 1% 462 0%
Department of the labor 861 0% 9,501 0% 422 0% 442 0%
Other 3,427 1% 1,368,240 408 7,167
300,358 4,912,232 114,458 209,278
All contracts Cost plus contracts

Panel B: Contract revenue and frequency by industry
NAICS Industry
Contract
revenue
(in millions) %
# of
contracts %
Contract
revenue
(in millions) %
# of
contracts %
Professional, scientific, and technical services 108,586 36% 252,848 5% 71,808 63% 133,448 64%
Transportation equipment manufacturing 57,522 19% 429,885 9% 15,884 14% 21,356 10%
Computer and electronic product manufacturing 35,906 12% 234,442 5% 6,858 6% 8,215 4%
Merchant wholesalers, nondurable goods 17,785 6% 454,306 9% 10 0% 57 0%
Administrative and support services 10,272 3% 32,511 1% 5,680 5% 5,402 3%
Merchant wholesalers, durable goods 7,246 2% 345,302 7% 54 0% 82 0%
Telecommunications 7,202 2% 64,842 1% 779 1% 1,099 1%
Fabricated metal product manufacturing 6,588 2% 133,014 3% 575 1% 691 0%
Machinery manufacturing 6,353 2% 87,216 2% 744 1% 1,229 1%
Air transportation 5,119 2% 8,566 0% 1 0% 29 0%
Chemical manufacturing 4,036 1% 120,157 2% 96 0% 79 0%
Miscellaneous manufacturing 3,859 1% 167,507 3% 61 0% 155 0%
Repair and maintenance 3,825 1% 25,850 1% 1,790 2% 2,483 1%
Electronics and appliance stores 3,205 1% 44,088 1% 130 0% 201 0%
Food manufacturing 2,897 1% 10,249 0% 2 0% 4 0%
Waste management and remediation service 2,770 1% 15,920 0% 1,308 1% 1,758 1%
Educational services 2,765 1% 14,246 0% 645 1% 576 0%
Utilities 2,569 1% 10,032 0% 32 0% 113 0%
Electrical equipment, appliance, and component manufact. 2,129 1% 29,662 1% 165 0% 260 0%
Furniture and related product manufacturing 2,101 1% 46,645 1% 6 0% 140 0%
Other 7,624 3% 2,384,944 7,831 31,901
300,358 4,912,232 114,458 209,278
All contracts Cost plus contracts

The sample consists of 1,505 firm-year observations between 2005 and 2010. Panel A includes 619 firm-years (258)
firms with at least one cost plus contract. Panel B includes 886 firm-years (258 firms) with only fixed price
contracts. ***/**/* represent statistical significance at 1%/5%/10% levels between the means and medians of the
sample in Panel A compared to the sample in Panel B. All continuous variables are winsorized at the 1% and 99%
levels. Abnormal DisExp is the residual from model (1). Log assets is the natural logarithm of total assets in
millions. Market-to-book is the market value of equity divided by the book value. ROA is earnings before
extraordinary items divided by total assets. StdROA is the standard deviation of ROA during the prior three years
including year t. Log sales is the natural logarithm of sales in millions. Procurement sales is procurement contract
sales in millions. %CAS is the percentage of procurement revenue subject to the cost accounting standards.
Table 3
Descriptive statistics by contract type
Mean Median Std. Dev. 25% 75%
Abnormal DisExp 0.36 0.00 1.73 -0.22 0.33
ROA 0.04 0.05 0.13 0.02 0.09
Assets 8.08 8.09 2.10 6.78 9.62
Market-to-book 2.94 2.14 28.19 1.38 3.87
Std ROA 0.03 0.02 0.06 0.01 0.04
Sales 7.93 8.02 1.97 6.78 9.37
Procurement sales (in millions) 65.96 14.49 174.01 3.32 47.83
%CAS 0.05 0.00 0.16 0.00 0.00
Mean Median Std. Dev. 25% 75%
Abnormal DisExp 0.18** -0.02** 1.36 -0.20 0.31
ROA 0.02** 0.04*** 0.14 0.01 0.08
Assets 8.13 8.16 2.20 6.66 9.82
Market-to-book 2.69 2.03* 9.65 1.33 3.45
Std ROA 0.04 0.02 0.06 0.01 0.03
Sales 7.93 8.00 2.05 6.75 9.47
Procurement sales (in millions) 57.08 6.29* 177.19 1.35 30.52
%CAS 0.02*** 0.00*** 0.12 0.00 0.00
Panel A: Firm-years with cost plus pricing contracts for sample of firms with one cost-plus year
and one fixed control only year (619 firm-years and 258 firms)
Panel B: Firm-years with only fixed price contracts for sample of firms with one cost-plus year
and one fixed price contract only year (886 firm-years and 258 firms)
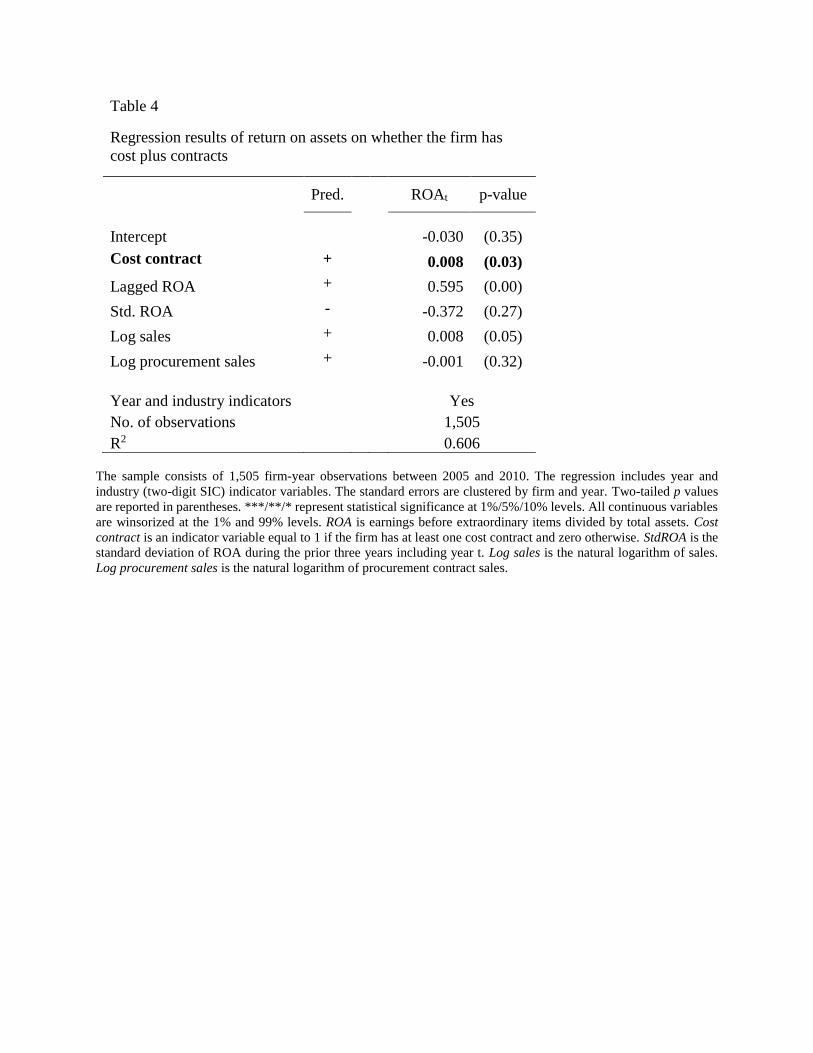
Table 4
Regression results of return on assets on whether the firm has
cost plus contracts
Pred.
ROAt p-value
Intercept -0.030 (0.35)
Cost contract + 0.008 (0.03)
Lagged ROA + 0.595 (0.00)
Std. ROA - -0.372 (0.27)
Log sales + 0.008 (0.05)
Log procurement sales + -0.001 (0.32)
Year and industry indicators Yes
No. of observations 1,505
R2 0.606
The sample consists of 1,505 firm-year observations between 2005 and 2010. The regression includes year and
industry (two-digit SIC) indicator variables. The standard errors are clustered by firm and year. Two-tailed p values
are reported in parentheses. ***/**/* represent statistical significance at 1%/5%/10% levels. All continuous variables
are winsorized at the 1% and 99% levels. ROA is earnings before extraordinary items divided by total assets. Cost
contract is an indicator variable equal to 1 if the firm has at least one cost contract and zero otherwise. StdROA is the
standard deviation of ROA during the prior three years including year t. Log sales is the natural logarithm of sales.
Log procurement sales is the natural logarithm of procurement contract sales.

Table 5
Regression results of abnormal discretionary expense on whether the firm has cost plus
contracts and controls
Abnormal
DisExp p-value
Abnormal
DisExp_Q10 p-value
Intercept 0.230 (0.24) -2.991 (0.00)
Cost contract 0.128 (0.04) 0.411 (0.01)
Log assets -0.029 (0.22) -0.071 (0.22)
Market-to-book 0.000 (0.54) -0.002 (0.38)
ROA 0.268 (0.06) -0.123 (0.74)
Year and industry indicators Yes Yes
No. of observations 1,505 1,505
R2 0.023
Pseudo R2 0.114
The sample consists of 1,505 firm-year observations between 2005 and 2010. The regression includes year and
industry (two-digit SIC) indicator variables. The standard errors are clustered by firm and year. Two-tailed p values
are reported in parentheses. ***/**/* represent statistical significance at 1%/5%/10% levels. All continuous variables
are winsorized at the 1% and 99% levels. Abnormal DisExp is the residual from model (1). Abnormal DisExp_Q10 is
an indicator variable equal to one if the residual from model (1) is in the highest quintile and zero otherwise. Cost
contract is an indicator variable equal to 1 if the firm has at least one cost contract and zero otherwise. Log asset is
the natural logarithm of total assets in millions. Market-to-book is the market value of equity divided by the book
value. ROA is earnings before extraordinary items divided by total assets. The regression with Abnormal DisExp is
estimated using ordinary least squares. The regression with Abnormal DisExp_10Q is estimated using a logistic
regression.

Table 6
Regression results of return on assets on whether the firm has
cost plus contracts and subject to cost accounting standards
Pred.
ROAt p-value
Intercept -0.025 (0.39)
Cost contract + 0.012 (0.02)
%CAS - -0.059 (0.05)
Cost contract * %CAS - -0.047 (0.08)
Lagged ROA + 0.579 (0.00)
Std. ROA - -0.373 (0.26)
Log sales + 0.008 (0.05)
Log procurement sales + -0.001 (0.42)
Year and industry indicators Yes
No. of observations 1,505
R2 0.613
The sample consists of 1,505 firm-year observations between 2005 and 2010. The regression includes year and
industry (two-digit SIC) indicator variables. The standard errors are clustered by firm and year. Two-tailed p values
are reported in parentheses. ***/**/* represent statistical significance at 1%/5%/10% levels. All continuous variables
are winsorized at the 1% and 99% levels. ROA is earnings before extraordinary items divided by total assets. Cost
contract is an indicator variable equal to 1 if the firm has at least one cost contract and zero otherwise. StdROA is the
standard deviation of ROA during the prior three years including year t. Log sales is the natural logarithm of sales.
Log procurement sales is the natural logarithm of procurement contract sales. %CAS is the percentage of procurement
revenue subject to cost accounting standards.

Table 7
Sensitivity analysis for alternative control samples
Panel A: Regression results of abnormal discretionary expense on whether the firm
has cost plus contracts and controls
Pred.
Abnormal
DisExp p-value
Highest
quintile of
abnormal
DisExp p-value
Intercept 0.4660 (0.01) 0.4205 (0.19)
Cost contracts + 0.0659 (0.05) 0.0906 (0.04)
Log assets + -0.0506 (0.00) -0.0339 (0.07)
Market-to-book - 0.0004 (0.33) 0.0001 (0.85)
ROA + 0.2938 (0.03) 0.3139 (0.04)
No. of observations 5,754 2,201
R2 0.088 0.061
Panel B: Regression results of return on assets on whether the firm has cost plus
contracts and cost accounting standards clause
All contractors
All contractors with
at least one cost
contract
Pred.
ROAt p-value
ROAt p-value
Intercept 0.1245 (0.20) 0.0044 (0.82)
Cost contract + 0.0045 (0.02) 0.0070 (0.03)
Lagged ROA + 0.5511 (0.00) 0.5396 (0.00)
Std. ROA - -0.2087 (0.08) -0.4501 (0.17)
Log sales + 0.0093 (0.00) 0.0061 (0.03)
Log procurement sales + -0.0004 (0.55) -0.0019 (0.13)
Year and industry indicators Yes Yes
No. of observations 5,754 2,201
No. of firms 1,137 383
R2 0.44 0.57

The sample consists of 1,505 firm-year observations between 2005 and 2010. The regressions include year and
industry (two-digit SIC) indicator variables. The standard errors are clustered by firm and year. Two-tailed p values
are reported in parentheses. ***/**/* represent statistical significance at 1%/5%/10% levels. All continuous variables
are winsorized at the 1% and 99% levels. Abnormal DisExp is the residual from model (1). Abnormal DisExp_Q10 is
an indicator variable equal to one if the residual from model (1) is in the highest quintile and zero otherwise. Cost
contract is an indicator variable equal to 1 if the firm has at least one cost contract and zero otherwise. Log asset is
the natural logarithm of total assets in millions. Market-to-book is the market value of equity divided by the book
value. ROA is earnings before extraordinary items divided by total assets. Cost contract is an indicator variable equal
to 1 if the firm has at least one cost plus contract and zero otherwise. StdROA is the standard deviation of ROA during
the prior three years including year t. Log sales is the natural logarithm of sales. Log procurement sales is the natural
logarithm of procurement contract sales.