Profitability Analysis and Money Management of Quantitative Trading Strategies
17
Performance Evaluation & Money Management Finbridge 2015 Shaurya Chandra 14 th March, 2015
-
Upload
quantinsti -
Category
Economy & Finance
-
view
251 -
download
4
Transcript of Profitability Analysis and Money Management of Quantitative Trading Strategies

Performance Evaluation & Money Management
Finbridge 2015
Shaurya Chandra14th March, 2015

Some Hard Truth about Trading..
• You might get some stock trading tip here & there…...
• But, it takes a real hard work to make profit consistently!!

Building a Diversified Portfolio?
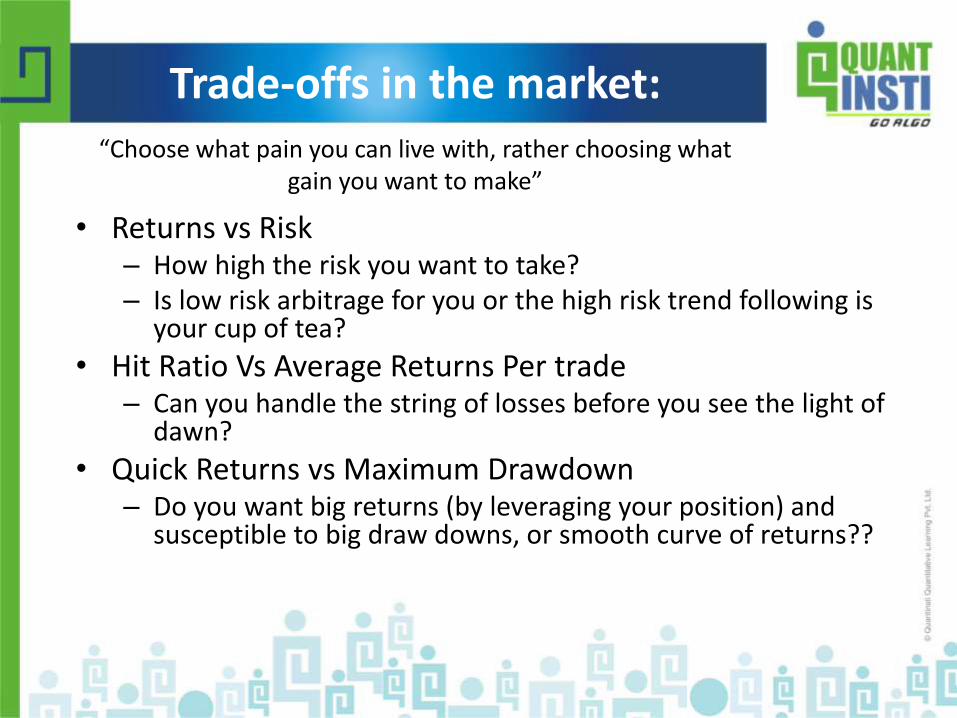
Trade-offs in the market:
• Returns vs Risk– How high the risk you want to take?– Is low risk arbitrage for you or the high risk trend following is
your cup of tea?
• Hit Ratio Vs Average Returns Per trade– Can you handle the string of losses before you see the light of
dawn?
• Quick Returns vs Maximum Drawdown– Do you want big returns (by leveraging your position) and
susceptible to big draw downs, or smooth curve of returns??
“Choose what pain you can live with, rather choosing what gain you want to make”
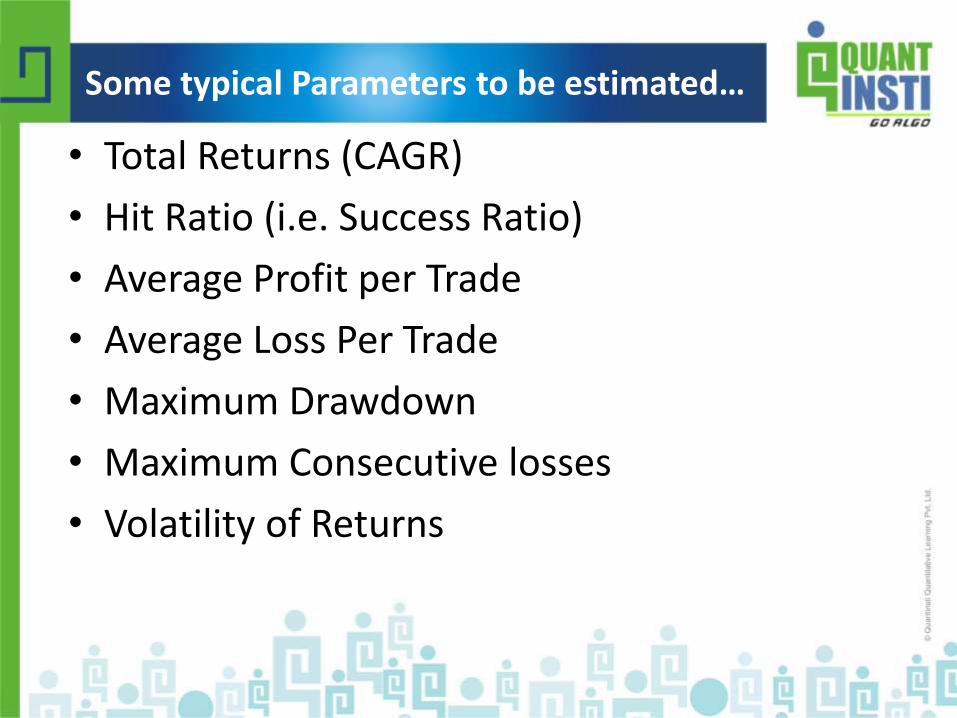
Some typical Parameters to be estimated…
• Total Returns (CAGR)
• Hit Ratio (i.e. Success Ratio)
• Average Profit per Trade
• Average Loss Per Trade
• Maximum Drawdown
• Maximum Consecutive losses
• Volatility of Returns

• Absolute Risk-adjusted Return Measures– Sharpe Ratio
– Sortino Ratio
• Relative Return Measures– Up-Capture Ratio / Down-Capture Ratio
– Up-Number Ratio / Down-Number Ratio
– Proficiency Ratio (Up/Down Percentage Ratio)
6
In-Depth Strategy Analysis

• Sharpe ratio = (excess return over risk free rate) / (standard deviation of excess returns)
It is a measure of the excess return per unit of standard deviation in an investment asset. Sharpe ratio provides very useful information regarding the return of an asset for a given risk.
Limitations
– Based on historical data , assumes “Future would be same as the Past”
– Poor at estimating tail risk – Normal Distribution Assumption , hence no differentiation between +ve and –ve trades
– Doesn’t account for Draw-downs (leading to low volatility) and transaction costs
7
p
fp
σ
RRratio Sharpe
Absolute Risk Adjusted Return
Measures
Relative Return
Measures
Strategy Analysis

• Sortino ratio = (return over target return) / (downside risk, i.e. semi deviation or variance on the downside only).
<R> = Expected Return
Rf = Risk Free Rate
σf = Standard Deviation of Negative Returns
Unlike Sharpe ratio, Sortino ratio does not punish high variance if the returns are on the upside.
8
d
fratio Sortino
RR
Strategy Analysis
Absolute Risk Adjusted Return
Measures
Relative Return
Measures

The Flaw of Averages

• Calmar ratio = (return) / (maximum drawdown). Generally quoted for the last 3 years
• Sterling ratio = (return) / (absolute(average drawdown – 10%)).
Generally quoted for the last 3 years
10
Strategy Analysis
Absolute Risk Adjusted Return
Measures
Relative Return
Measures

• Up Capture Ratio = (fund’s return when benchmark return increased) / (benchmark’s return when benchmark increased)
• Up Number Ratio = (number of period when fund’s return increased when benchmark return increased) / (number of periods when benchmark’s return increased)
• Up Percentage Ratio (Proficiency Ratio) = (number of period when fund’s return outperformed the benchmark when benchmark’s return increased) / (number of periods when benchmark’s return increased)
• Likewise Down Capture Ratio, Down Number Ratio, Down Percentage Ratio
11
Absolute Risk Adjusted Return
Measures
Relative Return Measures
Strategy Analysis
Position Sizing
• Ad hoc: trade no larger than lets you sleep at night
• Margin plus drawdown
• Fixed Fractional
• Fixed Ratio
• Kelly’s Criteria
Methods that Don’t Work
• Martingale methods: increase position size after a loss; decrease it after a win.
• Anti-Martingale methods.
• Equity curve methods: increase size when your equity curve falls below its moving average (“reversion to mean”), or increase size when you cross above the moving average (“trade the trend in equity curve”).
Why They Don’t Work
• Martingale and equity curve methods assume dependency between trades.
• In most cases, trades are independent of each other. The odds of the next trade being a win are not related to whether the last trade was a win or a loss.
• If trades are independent, you can’t determine the likelihood of the next trade being a win or a loss based on the previous trade.

Kelly’s Criterion for Portfolio Management
It is a formula used to determine the optimal size of a series of bets.
Focus : Long Term Capital Growth
Kelly % (f) = ((B + 1)*P -1)/B
Where,
f = optimal fixed fraction
P = Winning Probability
B = Win/Loss Rate
( Average Gain on +ve Trades/ Average Loss on –ve Trades)
15
Portfolio Management

Some Advice!

Thank you!
To Learn Automated Trading
Email: [email protected]
Connect With Us:
SINGAPORE
11 Collyer Quay,
#10-10, The Arcade,
Singapore - 049317
Phone: +65-6221-3654
INDIA
A-309, Boomerang,
Chandivali Farm Road, Powai,
Mumbai - 400 072
Phone: +91-022-61691400