Profit Announcement - CommBank Announcement For the full year ended 30 June 2017 Commonwealth Bank...
115
Profit Announcement For the full year ended 30 June 2017 Commonwealth Bank of Australia | ACN 123 123 124 | 9 August 2017
-
Upload
truongcong -
Category
Documents
-
view
214 -
download
0
Transcript of Profit Announcement - CommBank Announcement For the full year ended 30 June 2017 Commonwealth Bank...

Profit AnnouncementFor the full year ended 30 June 2017
Commonwealth Bank of Australia | ACN 123 123 124 | 9 August 2017

ASX Appendix 4E
Results for announcement to the market (1)
Report for the year ended 30 June 2017 $M
Revenue from ordinary activities 44,949 Up 1%
Profit/(loss) from ordinary activities after tax attributable to Equity holders 9,928 Up 8%
Net profit/(loss) for the period attributable to Equity holders 9,928 Up 8%
Dividends (distributions)
Final dividend - fully franked (cents per share) 230
Interim dividend - fully franked (cents per share) 199
Record date for determining entitlements to the dividend 17 August 2017 (1) Rule 4.3A.
This preliminary final report is provided to the ASX under Rule 4.3A. Refer to Appendix 18 ASX Appendix 4E for disclosures
required under ASX Listing Rules.
This report should be read in conjunction with the 30 June 2017 Annual Financial Report of the Commonwealth Bank of Australia
and any public announcements made in the period by the Group in accordance with the continuous disclosure requirements of
the Corporations Act 2001 and the ASX Listing Rules.
Important dates for shareholders
Full year results announcement 9 August 2017
Ex-dividend date 16 August 2017
Record date 17 August 2017
Last Date to change participation in DRP 18 August 2017
Final dividend payment date 29 September 2017
2018 interim results date 7 February 2018
For further information contact:
Investor Relations
Melanie Kirk
Phone: 02 9118 7166
Email: [email protected]
All figures relate to the full year ended 30 June 2017 and comparative information to the full year ended 30 June 2016 unless
stated otherwise. The term “prior year” refers to the full year ended 30 June 2016, while the term “prior half” refers to the half year
ended 31 December 2016.
Contents
Section 1 – Media Release i
Section 2 – Highlights 1
Section 3 – Group Performance Analysis 7
Section 4 – Group Operations and Business Settings 19
Section 5 – Divisional Performance 27
Section 6 – Financial Statements 49
Section 7 – Appendices 57

This page has been intentionally left blank

+3.8%
+2.4%
+4.8%
Positive jawsFY17 v FY16 underlying basis3
Media Release
CBA FY17 Results
CEO Comment: Ian Narev
“Commonwealth Bank’s performance this
year has again contributed to the financial
wellbeing of our customers, shareholders,
our people and the Australian economy.
This is the result of our consistent focus on
customer satisfaction, innovation and
financial strength.”
Commonwealth Bank of Australia | ACN 123 123 124 | 115/2017
Commonwealth Bank delivers for Australia
Strong operating performance
• Served 16.6 million customers
• Employed 51,800 people, including 41,600 in Australia
• Returned 75% of profits to 800,000+ shareholders, with almost 80%
of shareholders based in Australia
• Invested 25% of profits back into the business for growth
• Provided $197 billion in new lending, including 330,000 home loans
• Helped 1.8 million customers invest for the future
• $3.9 billion tax expense, Australia’s largest taxpayer
Returns and strength FY17 FY16
Dividend per share $4.29 $4.20
Earnings per share (cash) $5.74 $5.55
Return on equity (cash) 16.0% 16.5%
Common Equity Tier 1 - APRA 10.1% 10.6%
CET1 – International 15.6% 14.4%
Customer deposits as % funding 67% 66%
For the full year ended 30 June 2017¹
Reported 9 August 2017
¹ Unless otherwise indicated all comparisons are to the prior full year ended 30 June 2016. 2 For an explanation of and reconciliation between statutory and cash NPAT, refer to pages 2, 3 and 15 of the Group’s Profit Announcement for
the full year ended 30 June 2017, available at commbank.com.au/shareholder. 3 “Underlying basis” excludes a $397 million gain on sale of the Group’s remaining investment in Visa Inc. and a $393 million one-off expense for
acceleration of amortisation on certain software assets.
Income Expenses Operating
performance
• Operating income increased by 3.8%, ahead of operating expense
growth of 2.4%, delivering positive jaws on an underlying basis.3
• Banking income grew 4.3% due to volume growth in home lending,
business lending and deposits.3 Insurance income fell 1.1% due to
loss recognition of $143 million.
• Invested almost $1.3 billion whilst maintaining underlying expense
growth to 2.4%.3
• Higher wholesale funding costs and increased competition in home
and business lending more than offset asset repricing, resulting in a
3 basis point decline in the net interest margin to 2.11%.
Performance FY17 FY17 v FY16
Statutory NPAT 2 $9,928m 7.6%
Cash NPAT $9,881m 4.6%
Operating performance $14,862m 4.9%
Loan impairment expense $1,095m (12.8%)
Net interest margin 2.11% (3)bpts
Cost-to-income (underlying) 3 41.8% (60)bpts
Financial summary
i

1.20%
1.46%
1.41%
1.01%
0.99%1.03%
0.50%
0.54%
0.60%
0.49%
Jun 14 Dec 14 Jun 15 Dec 15 Jun 16 Dec 16 Jun 17
67%
Jun 17
Commonwealth Bank of Australia | ACN 123 123 124 | 115/2017
Sound credit quality
CapitalBasel III Common
Equity Tier 1
Deposit Funding
% of total funding
Wholesale Funding
Tenor
(years)
Jun 17
142
Liquidity
10.1% 10.5%
Jun 17 1 Jan 20
• The Group’s Common Equity Tier 1 (CET1) ratio was 10.1% on an APRA basis, and 15.6% on an internationally
comparable basis, maintaining CBA’s position in the top quartile of international peer banks for CET1.
• Our strong organic capital generation and commitment to financial strength, give us confidence that we will meet APRA’s
‘unquestionably strong’ CET1 ratio average benchmark of 10.5% or more by 1 January 2020.
• Customer deposits contributed 67% of total funding and the Net Stable Funding Ratio (NSFR) was 107%.
• The average tenor of the wholesale funding portfolio was 4.1 years and the average tenor of new issuance was 5.2 years.
• Liquid assets increased from $134 billion in 2016 to $142 billion, and the Liquidity Coverage Ratio was 129%.
• The Leverage Ratio was 5.1% on an APRA basis and 5.8% on an internationally comparable basis.
• Loan impairment expense (LIE) remained low, at 15 basis points of gross loans and acceptances. Consumer LIE was flat
at 18 basis points, while corporate LIE fell to 8 basis points from 20 basis points.
• Personal loan arrears were elevated in Western Australia and credit card arrears were seasonally higher in 2H17.
• Home loan arrears remained at low levels, despite higher arrears in Western Australia.
• Home lending growth is within regulatory benchmarks.
73
41
25
2120
16 16
19
15
FY09 FY10 FY11 FY12 FY13 FY14 FY15 FY16 FY17
Loan impairment expenseGroup (basis points) 90+ days
Consumer arrears
Pro Forma
Personal loans
Credit cards
Home loans
Capital, funding and liquidity
Excl. WA
LCR
4.1
5.2
Jun 17Portfolio
FY 17New issuance
129%
Liquid
assets
$bn
APRA benchmarkAPRA
ii
Commonwealth Bank of Australia | ACN 123 123 124 | 115/2017
4 Roy Morgan Research Retail Main Financial Institution Customer Satisfaction; DBM Business Financial Services Monitor.
Setting new customer service goals
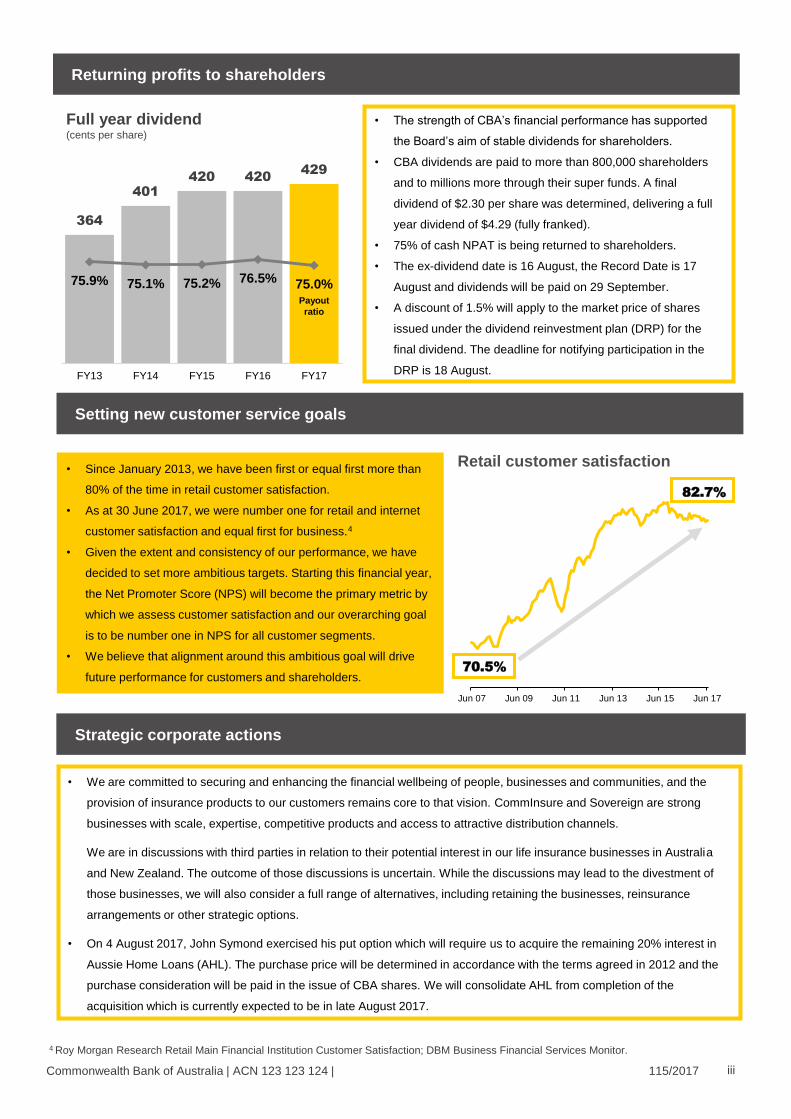
Returning profits to shareholders
• The strength of CBA’s financial performance has supported
the Board’s aim of stable dividends for shareholders.
• CBA dividends are paid to more than 800,000 shareholders
and to millions more through their super funds. A final
dividend of $2.30 per share was determined, delivering a full
year dividend of $4.29 (fully franked).
• 75% of cash NPAT is being returned to shareholders.
• The ex-dividend date is 16 August, the Record Date is 17
August and dividends will be paid on 29 September.
• A discount of 1.5% will apply to the market price of shares
issued under the dividend reinvestment plan (DRP) for the
final dividend. The deadline for notifying participation in the
DRP is 18 August.
364
401
420 420429
75.9% 75.1% 75.2% 76.5% 75.0%
FY13 FY14 FY15 FY16 FY17
Payout
ratio
Full year dividend (cents per share)
• We are committed to securing and enhancing the financial wellbeing of people, businesses and communities, and the
provision of insurance products to our customers remains core to that vision. CommInsure and Sovereign are strong
businesses with scale, expertise, competitive products and access to attractive distribution channels.
We are in discussions with third parties in relation to their potential interest in our life insurance businesses in Australia
and New Zealand. The outcome of those discussions is uncertain. While the discussions may lead to the divestment of
those businesses, we will also consider a full range of alternatives, including retaining the businesses, reinsurance
arrangements or other strategic options.
• On 4 August 2017, John Symond exercised his put option which will require us to acquire the remaining 20% interest in
Aussie Home Loans (AHL). The purchase price will be determined in accordance with the terms agreed in 2012 and the
purchase consideration will be paid in the issue of CBA shares. We will consolidate AHL from completion of the
acquisition which is currently expected to be in late August 2017.
Strategic corporate actions
• Since January 2013, we have been first or equal first more than
80% of the time in retail customer satisfaction.
• As at 30 June 2017, we were number one for retail and internet
customer satisfaction and equal first for business.4
• Given the extent and consistency of our performance, we have
decided to set more ambitious targets. Starting this financial year,
the Net Promoter Score (NPS) will become the primary metric by
which we assess customer satisfaction and our overarching goal
is to be number one in NPS for all customer segments.
• We believe that alignment around this ambitious goal will drive
future performance for customers and shareholders.
Retail customer satisfaction
Jun 07 Jun 09 Jun 11 Jun 13 Jun 15 Jun 17
70.5%
82.7%
iii

Commonwealth Bank of Australia | ACN 123 123 124 115/2017
CEO Comment: Ian Narev
“Headline indicators show that the Australian economy remains sound overall, albeit variable. However many households
are concerned about job security, wages and the cost of living. Cyclical investment in mining and construction has
underpinned our economy for some time. The next wave of more broad-based business investment that we need to secure
jobs and lift wages is important. Business balance sheets have the capacity, and we have a strong banking system. But
global caution remains high due to geopolitical change and less expansionist monetary policy. So all of us need to focus on
working together to create an environment where businesses continue to invest to create rewarding jobs.
For our part, we will continue to strengthen our balance sheet to ensure that we can support our customers through a
variety of economic scenarios. We will also maintain our focus on our long term sources of competitive advantage in our
customer base and in technology, while accelerating the focus on productivity that we need to remain competitive for the
long term, and listening more to our community to strengthen trust. And above all, we will continue to invest in our people,
who are the most critical determinant of long term success.”
Delivering great customer experience across channels
Outlook
• A strategic priority in FY17 was to enhance the home
loan experience for customers by better integrating our
branch, online and mobile channels.
• Customers’ needs and preferences were gathered
through smarter use of data and better conversations
across all channels.
• Using this information to serve customers better has
resulted in more customers choosing to take out a
mortgage through our proprietary channels.
MediaKate Abrahams
General Manager Communications
02 9118 6919
Investor Relations
Melanie Kirk
Head of Investor Relations
02 9118 7166
Shareholders
For more informationcommbank.com.au/results
54%
57%
62%
48%47%
46%*
Jun 16 Dec 16 Jun 17
Proprietary % of total flows
Market
• CommBank research on financial wellbeing shows one in
three Australian households would struggle to access $500
in an emergency, and more than a third of Australians are
spending more than they earn each month.
• To help our customers better manage their finances we
have developed new features in the CommBank app that
can help improve financial wellbeing at scale.
• Spend Tracker helps improve everyday spending habits.
• Savings Jar helps customers save for times of need.
• Savings Challenge encourages customers to save for
goals and tracks their progress.
Helping customers through technology
Spend
Tracker
Savings
Jar
Savings
Challenge
* Market as at Mar 17
Home lending (RBS)
iv

Commonwealth Bank of Australia | ACN 123 123 124 115/2017
Full year ended (1)
(cash basis)
Half year ended
(cash basis)
30 June 17 30 Jun 16 Jun 17 vs 30 Jun 17 31 Dec 16 Jun 17 vs
Group performance summary $M $M Jun 16 % $M $M Dec 16 %
Net interest income 17,600 16,935 4 8,857 8,743 1
Other banking income (2) 5,520 4,860 14 2,534 2,986 (15)
Total banking income 23,120 21,795 6 11,391 11,729 (3)
Funds management income 2,034 2,016 1 1,030 1,004 3
Insurance income 786 795 (1) 393 393 -
Total operating income 25,940 24,606 5 12,814 13,126 (2)
Investment experience 65 141 (54) 49 16 large
Total income 26,005 24,747 5 12,863 13,142 (2)
Operating expenses (3) (11,078) (10,434) 6 (5,401) (5,677) (5)
Loan impairment expense (1,095) (1,256) (13) (496) (599) (17)
Net profit before tax 13,832 13,057 6 6,966 6,866 1
Net profit after tax ("cash basis") 9,881 9,445 5 4,974 4,907 1
Net profit after tax ("statutory basis") 9,928 9,223 8 5,033 4,895 3
Cash net profit after tax, by division (1)
Retail Banking Services 4,964 4,540 9 2,498 2,466 1
Business and Private Banking 1,639 1,522 8 848 791 7
Institutional Banking and Markets 1,306 1,190 10 623 683 (9)
Wealth Management 553 612 (10) 304 249 22
New Zealand 973 881 10 502 471 7
Bankwest 702 778 (10) 347 355 (2)
IFS and Other (256) (78) large (148) (108) 37
Shareholder ratios & performance indicators
Earnings Per Share - "cash basis" - basic (cents) (1) 574.4 554.8 4 288.5 285.8 1
Return on equity - "cash basis" (%) (1) 16.0 16.5 (50)bpts 16.1 16.0 10 bpts
Return on average total assets - "cash basis" (%) (1) 1.0 1.0 - 1.0 1.0 -
Dividends per share - fully franked (cents) 429 420 2 230 199 16
Dividend payout ratio - "cash basis" (%) (1) 75.0 76.5 (150)bpts 80.0 69.9 large
Average interest earning assets ($M) (4) 834,741 790,596 6 846,619 823,058 3
Funds Under Administration - average ($M) (1) 152,999 144,913 6 155,855 150,134 4
Assets Under Management - average ($M) 210,929 202,000 4 214,446 206,996 4
Net interest margin (%) 2.11 2.14 (3)bpts 2.11 2.11 -
Operating expenses to total operating income (%) (5) 42.7 42.4 30 bpts 42.1 43.3 (120)bpts
(1) Comparative information has been restated to reflect refinements to the allocation of customer balances, revenue and expense methodology
including updated transfer pricing allocations, and changes to the recognition of Global Asset Management long-term incentives in Wealth
Management. (2) The half year ended 31 December 2016 includes a $397 million gain on sale of the Group’s remaining investment in Visa Inc.(3) The half year ended 31 December 2016 includes a $393 million one-off expense for acceleration of amortisation on certain software assets.(4) Net of average mortgage offset balances.(5) Excluding a $397 million gain on sale of the Group’s remaining investment in Visa Inc. and a $393 million one-off expense for acceleration of
amortisation on certain software assets, operating expenses to total operating income is 41.8% for the full year ended 30 June 2017.
Key financial information
v

This page has been intentionally left blank

Commonwealth Bank of Australia – Profit Announcement 1
Contents
Section 2 – Highlights
Group Performance Highlights 2
Group Performance Summary 3
Key Performance Indicators 4
Shareholder Summary 5
Market Share 5
Credit Ratings 5
Highlights
2 Commonwealth Bank of Australia – Profit Announcement
Group Performance Highlights
Jun 17 vs Jun 17 vs Jun 17 vs
30 Jun 17 Jun 16 % 30 Jun 17 30 Jun 16 Jun 16 % 30 Jun 17 31 Dec 16 Dec 16 %
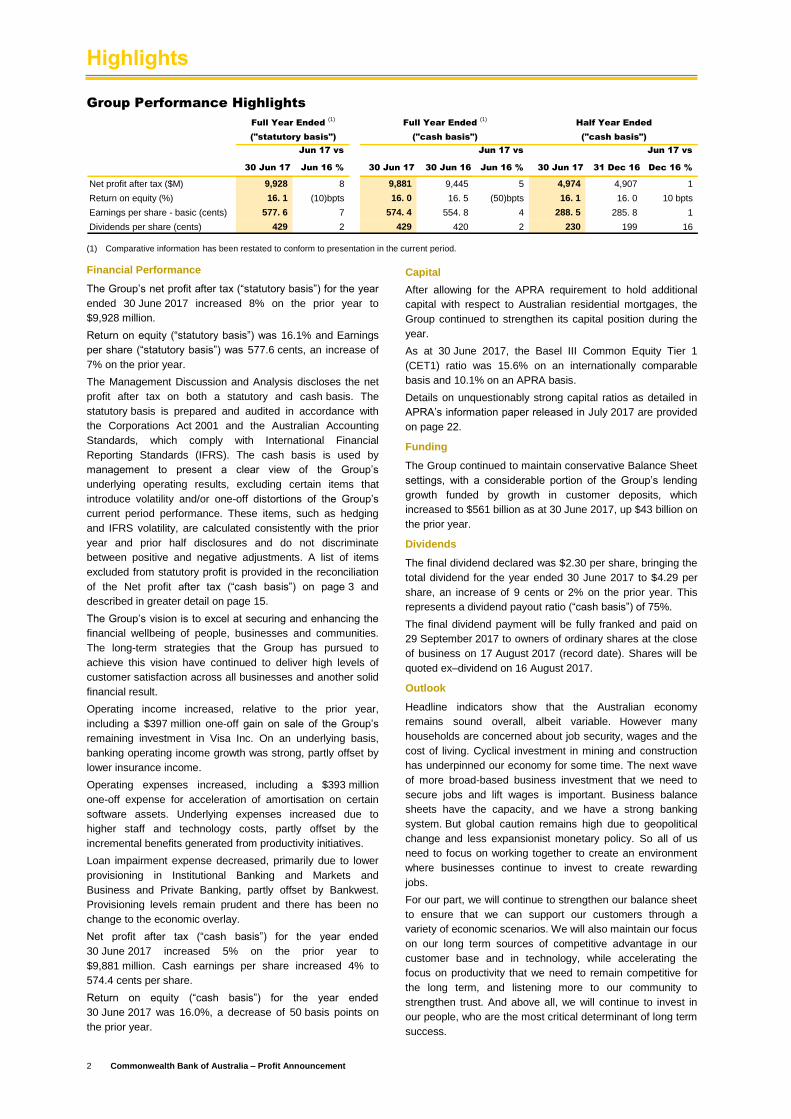
Net profit after tax ($M) 9,928 8 9,881 9,445 5 4,974 4,907 1
Return on equity (%) 16. 1 (10)bpts 16. 0 16. 5 (50)bpts 16. 1 16. 0 10 bpts
Earnings per share - basic (cents) 577. 6 7 574. 4 554. 8 4 288. 5 285. 8 1
Dividends per share (cents) 429 2 429 420 2 230 199 16
("statutory basis") ("cash basis") ("cash basis")
Full Year Ended (1)
Full Year Ended (1)
Half Year Ended
(1) Comparative information has been restated to conform to presentation in the current period.
Financial Performance
The Group’s net profit after tax (“statutory basis”) for the year
ended 30 June 2017 increased 8% on the prior year to
$9,928 million.
Return on equity (“statutory basis”) was 16.1% and Earnings
per share (“statutory basis”) was 577.6 cents, an increase of
7% on the prior year.
The Management Discussion and Analysis discloses the net
profit after tax on both a statutory and cash basis. The
statutory basis is prepared and audited in accordance with
the Corporations Act 2001 and the Australian Accounting
Standards, which comply with International Financial
Reporting Standards (IFRS). The cash basis is used by
management to present a clear view of the Group’s
underlying operating results, excluding certain items that
introduce volatility and/or one-off distortions of the Group’s
current period performance. These items, such as hedging
and IFRS volatility, are calculated consistently with the prior
year and prior half disclosures and do not discriminate
between positive and negative adjustments. A list of items
excluded from statutory profit is provided in the reconciliation
of the Net profit after tax (“cash basis”) on page 3 and
described in greater detail on page 15.
The Group’s vision is to excel at securing and enhancing the
financial wellbeing of people, businesses and communities.
The long-term strategies that the Group has pursued to
achieve this vision have continued to deliver high levels of
customer satisfaction across all businesses and another solid
financial result.
Operating income increased, relative to the prior year,
including a $397 million one-off gain on sale of the Group’s
remaining investment in Visa Inc. On an underlying basis,
banking operating income growth was strong, partly offset by
lower insurance income.
Operating expenses increased, including a $393 million
one-off expense for acceleration of amortisation on certain
software assets. Underlying expenses increased due to
higher staff and technology costs, partly offset by the
incremental benefits generated from productivity initiatives.
Loan impairment expense decreased, primarily due to lower
provisioning in Institutional Banking and Markets and
Business and Private Banking, partly offset by Bankwest.
Provisioning levels remain prudent and there has been no
change to the economic overlay.
Net profit after tax (“cash basis”) for the year ended
30 June 2017 increased 5% on the prior year to
$9,881 million. Cash earnings per share increased 4% to
574.4 cents per share.
Return on equity (“cash basis”) for the year ended
30 June 2017 was 16.0%, a decrease of 50 basis points on
the prior year.
Capital
After allowing for the APRA requirement to hold additional
capital with respect to Australian residential mortgages, the
Group continued to strengthen its capital position during the
year.
As at 30 June 2017, the Basel III Common Equity Tier 1
(CET1) ratio was 15.6% on an internationally comparable
basis and 10.1% on an APRA basis.
Details on unquestionably strong capital ratios as detailed in
APRA’s information paper released in July 2017 are provided
on page 22.
Funding
The Group continued to maintain conservative Balance Sheet
settings, with a considerable portion of the Group’s lending
growth funded by growth in customer deposits, which
increased to $561 billion as at 30 June 2017, up $43 billion on
the prior year.
Dividends
The final dividend declared was $2.30 per share, bringing the
total dividend for the year ended 30 June 2017 to $4.29 per
share, an increase of 9 cents or 2% on the prior year. This
represents a dividend payout ratio (“cash basis”) of 75%.
The final dividend payment will be fully franked and paid on
29 September 2017 to owners of ordinary shares at the close
of business on 17 August 2017 (record date). Shares will be
quoted ex–dividend on 16 August 2017.
Outlook
Headline indicators show that the Australian economy
remains sound overall, albeit variable. However many
households are concerned about job security, wages and the
cost of living. Cyclical investment in mining and construction
has underpinned our economy for some time. The next wave
of more broad-based business investment that we need to
secure jobs and lift wages is important. Business balance
sheets have the capacity, and we have a strong banking
system. But global caution remains high due to geopolitical
change and less expansionist monetary policy. So all of us
need to focus on working together to create an environment
where businesses continue to invest to create rewarding
jobs.
For our part, we will continue to strengthen our balance sheet
to ensure that we can support our customers through a
variety of economic scenarios. We will also maintain our focus
on our long term sources of competitive advantage in our
customer base and in technology, while accelerating the
focus on productivity that we need to remain competitive for
the long term, and listening more to our community to
strengthen trust. And above all, we will continue to invest in
our people, who are the most critical determinant of long term
success.

Highlights
Commonwealth Bank of Australia – Profit Announcement 3
Group Performance 30 Jun 17 30 Jun 16 Jun 17 vs 30 Jun 17 31 Dec 16 Jun 17 vs 30 Jun 17 Jun 17 vs
Summary $M $M Jun 16 % $M $M Dec 16 % $M Jun 16 %
Net interest income 17,600 16,935 4 8,857 8,743 1 17,600 4
Other banking income (2) 5,520 4,860 14 2,534 2,986 (15) 5,626 23
Total banking income 23,120 21,795 6 11,391 11,729 (3) 23,226 8
Funds management income 2,034 2,016 1 1,030 1,004 3 2,051 -
Insurance income 786 795 (1) 393 393 - 844 (16)
Total operating income 25,940 24,606 5 12,814 13,126 (2) 26,121 6
Investment experience 65 141 (54) 49 16 large n/a n/a
Total income 26,005 24,747 5 12,863 13,142 (2) 26,121 6
Operating expenses (3) (11,078) (10,434) 6 (5,401) (5,677) (5) (11,082) 6
Loan impairment expense (1,095) (1,256) (13) (496) (599) (17) (1,095) (13)
Net profit before tax 13,832 13,057 6 6,966 6,866 1 13,944 9
Corporate tax expense (4) (3,927) (3,592) 9 (1,977) (1,950) 1 (3,992) 11
Non-controlling interests (5) (24) (20) 20 (15) (9) 67 (24) 20
Net profit after tax
("cash basis") 9,881 9,445 5 4,974 4,907 1 n/a n/a
Hedging and IFRS volatility (6) 73 (199) large 65 8 large n/a n/a
Other non-cash items (6) (26) (23) 13 (6) (20) (70) n/a n/a
Net profit after tax
("statutory basis") 9,928 9,223 8 5,033 4,895 3 9,928 8
Represented by: (1)
Retail Banking Services 4,964 4,540 9 2,498 2,466 1
Business and Private Banking 1,639 1,522 8 848 791 7
Institutional Banking and Markets 1,306 1,190 10 623 683 (9)
Wealth Management 553 612 (10) 304 249 22
New Zealand 973 881 10 502 471 7
Bankwest 702 778 (10) 347 355 (2)
IFS and Other (256) (78) large (148) (108) 37
Net profit after tax ("cash basis") 9,881 9,445 5 4,974 4,907 1
Investment experience after tax (44) (100) (56) (35) (9) large
Net profit after tax
("underlying basis") 9,837 9,345 5 4,939 4,898 1
Full Year Ended (1)
Half Year Ended Full Year Ended (1)
("statutory basis")("cash basis") ("cash basis")
(1) Comparative information has been restated to reflect refinements to the allocation of customer balances, revenue and expense methodology including
updated transfer pricing allocations, and changes to the recognition of Global Asset Management long-term incentives in Wealth Management.
(2) The half year ended 31 December 2016 includes a $397 million gain on sale of the Group’s remaining investment in Visa Inc.
(3) The half year ended 31 December 2016 includes a $393 million one-off expense for acceleration of amortisation on certain software assets.
(4) For the purposes of presentation of Net profit after tax (“cash basis”), policyholder tax benefit/(expense) components of corporate tax expense are shown on a net basis (30 June 2017: $32 million expense and 30 June 2016: $101 million expense, and for the half years ended 30 June 2017: $56 million expense and 31 December 2016: $24 million benefit).
(5) Non-controlling interests include preference dividends paid to holders of preference shares in ASB Capital Limited and ASB Capital No.2 Limited.
(6) Refer to page 15 for details.
Group Return on Equity
Group Return on Assets
19.5%18.4% 18.2% 18.7% 18.2%
16.5% 16.0%
2011 2012 2013 2014 2015 2016 2017
RoE - Cash (%)
(1) (1)
668 719
754 791
873 933
976
6.8 7.07.8
8.79.1
9.4 9.9
1.0% 1.0%
0
0.0 02
0.0 04
0.0 06
0.0 08
0.0 1
0.0 12
-50
150
350
550
750
950
1,150
2011 2012 2013 2014 2015 2016 2017
Total Assets ($bn) Cash NPAT ($bn) RoA - Cash (%)
(1) (1)
(1) Comparative information has been restated to conform to presentation in the current period.

Highlights
4 Commonwealth Bank of Australia – Profit Announcement
Jun 17 vs Jun 17 vs
Key Performance Indicators 30 Jun 17 30 Jun 16 Jun 16 % 30 Jun 17 31 Dec 16 Dec 16 %
Group
Statutory net profit after tax ($M) 9,928 9,223 8 5,033 4,895 3
Cash net profit after tax ($M) 9,881 9,445 5 4,974 4,907 1
Net interest margin (%) 2. 11 2. 14 (3)bpts 2. 11 2. 11 -
Net interest margin excluding Treasury and Markets (%) 2. 09 2. 13 (4)bpts 2. 10 2. 08 2 bpts
Average interest earning assets ($M) (2) 834,741 790,596 6 846,619 823,058 3
Average interest bearing liabilities ($M) (2) (3) 755,612 733,754 3 764,126 747,236 2
Funds Under Administration (FUA) - average ($M) 152,999 144,913 6 155,855 150,134 4
Assets Under Management (AUM) - average ($M) 210,929 202,000 4 214,446 206,996 4
Average inforce premiums ($M) 3,434 3,401 1 3,402 3,475 (2)
Operating expenses to total operating income (%) (4) (5) 42. 7 42. 4 30 bpts 42. 1 43. 3 (120)bpts
Effective corporate tax rate ("cash basis") (%) 28. 4 27. 5 90 bpts 28. 4 28. 4 -
Profit after capital charge (PACC) ($M) (6) 6,525 6,187 5 3,270 3,255 -
Retail Banking Services
Cash net profit after tax ($M) 4,964 4,540 9 2,498 2,466 1
Operating expenses to total banking income (%) (5) 30. 8 32. 1 (130)bpts 30. 7 30. 8 (10)bpts
Business and Private Banking
Cash net profit after tax ($M) 1,639 1,522 8 848 791 7
Operating expenses to total banking income (%) (5) 39. 1 38. 8 30 bpts 38. 8 39. 3 (50)bpts
Institutional Banking and Markets
Cash net profit after tax ($M) 1,306 1,190 10 623 683 (9)
Operating expenses to total banking income (%) (5) 37. 6 37. 4 20 bpts 38. 5 36. 7 180 bpts
Wealth Management
Cash net profit after tax ($M) 553 612 (10) 304 249 22
FUA - average ($M) 141,005 134,233 5 143,838 138,146 4
AUM - average ($M) 205,910 197,569 4 209,469 201,967 4
Average inforce premiums ($M) 2,465 2,474 - 2,432 2,505 (3)
Operating expenses to total operating income (%) (5) 70. 9 70. 2 70 bpts 68. 4 73. 5 large
New Zealand
Cash net profit after tax ($M) 973 881 10 502 471 7
FUA - average ($M) 11,994 10,680 12 12,017 11,988 -
AUM - average ($M) 5,019 4,431 13 4,977 5,029 (1)
Average inforce premiums ($M) 715 672 6 716 715 -
Operating expenses to total operating income (%) (5) (7) 38. 4 39. 9 (150)bpts 38. 7 38. 0 70 bpts
Bankwest
Cash net profit after tax ($M) 702 778 (10) 347 355 (2)
Operating expenses to total banking income (%) (5) 42. 1 41. 2 90 bpts 42. 9 41. 3 160 bpts
Capital (Basel III)
Common Equity Tier 1 (Internationally Comparable) (%) (8) 15. 6 14. 4 120 bpts 15. 6 15. 4 20 bpts
Common Equity Tier 1 (APRA) (%) 10. 1 10. 6 (50)bpts 10. 1 9. 9 20 bpts
Leverage Ratio (Basel III)
Leverage Ratio (Internationally Comparable) (%) (9) 5. 8 5. 6 20 bpts 5. 8 5. 5 30 bpts
Leverage Ratio (APRA) (%) 5. 1 5. 0 10 bpts 5. 1 4. 9 20 bpts
Full Year Ended (1)
Half Year Ended
(1) Comparative information has been restated to reflect refinements to the allocation of customer balances, revenue and expense methodology including
updated transfer pricing allocations, and changes to the recognition of Global Asset Management long-term incentives in Wealth Management.
(2) Net of average mortgage offset balances.
(3) During the prior year, following a change in terms, Interest bearing transaction deposits of $18,314 million became Non-interest bearing and have been disclosed accordingly.
(4) The Group result includes a $397 million gain on sale of the Group’s remaining investment in Visa Inc. and a $393 million one-off expense for acceleration of amortisation on certain software assets. On an underlying basis the Operating expenses to total operating income is 41.8% for the full year ended 30 June 2017 and 41.5% for the half year ended 31 December 2016.
(5) Presented on a “cash basis”.
(6) The Group uses PACC, a risk-adjusted measure, as a key measure of financial performance. It takes into account the profit achieved, the risk to capital that was taken to achieve it, and other adjustments.
(7) Key financial metrics are calculated in New Zealand dollar terms.
(8) Analysis aligns with the 13 July 2015 APRA study titled “International capital comparison study”.
(9) The Tier 1 Capital included in the calculation of the internationally comparable leverage ratio aligns with the 13 July 2015 APRA study titled “International capital comparison study”, and includes Basel III non-compliant Tier 1 instruments that are currently subject to transitional rules.
Highlights
Commonwealth Bank of Australia – Profit Announcement 5
Jun 17 vs Jun 17 vs
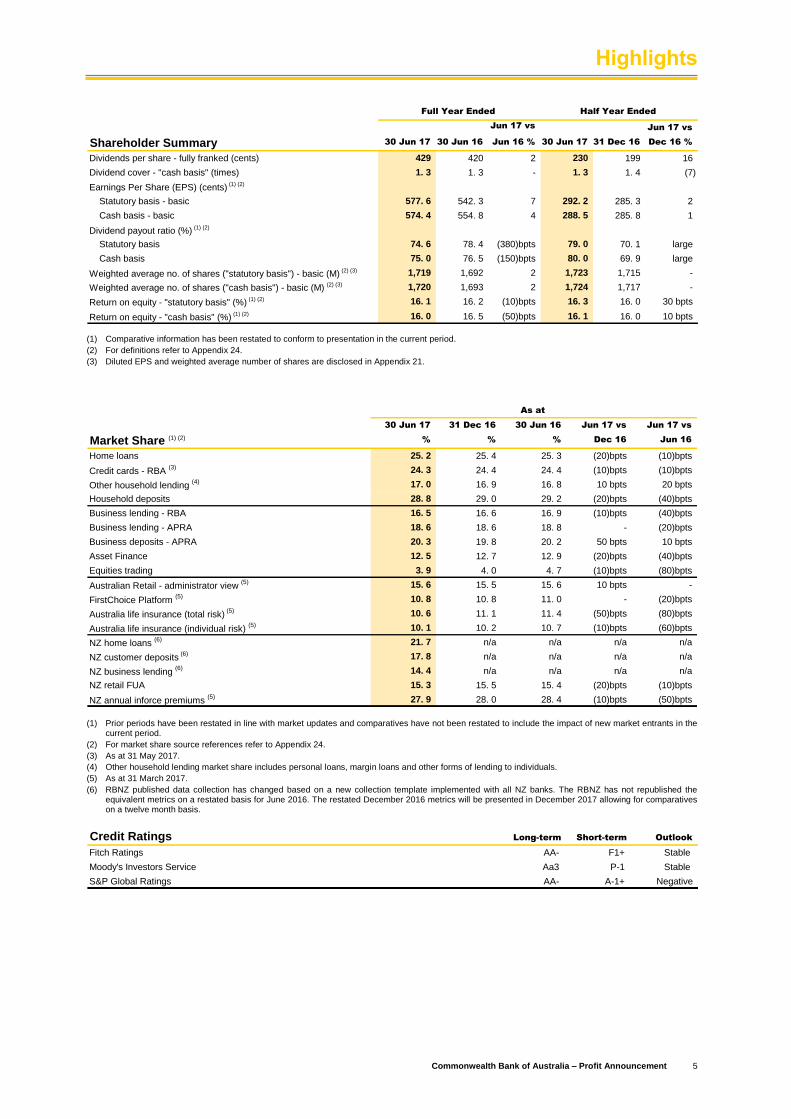
Shareholder Summary 30 Jun 17 30 Jun 16 Jun 16 % 30 Jun 17 31 Dec 16 Dec 16 %
Dividends per share - fully franked (cents) 429 420 2 230 199 16
Dividend cover - "cash basis" (times) 1. 3 1. 3 - 1. 3 1. 4 (7)
Earnings Per Share (EPS) (cents) (1) (2)
Statutory basis - basic 577. 6 542. 3 7 292. 2 285. 3 2
Cash basis - basic 574. 4 554. 8 4 288. 5 285. 8 1
Dividend payout ratio (%) (1) (2)
Statutory basis 74. 6 78. 4 (380)bpts 79. 0 70. 1 large
Cash basis 75. 0 76. 5 (150)bpts 80. 0 69. 9 large
Weighted average no. of shares ("statutory basis") - basic (M) (2) (3) 1,719 1,692 2 1,723 1,715 -
Weighted average no. of shares ("cash basis") - basic (M) (2) (3) 1,720 1,693 2 1,724 1,717 -
Return on equity - "statutory basis" (%) (1) (2) 16. 1 16. 2 (10)bpts 16. 3 16. 0 30 bpts
Return on equity - "cash basis" (%) (1) (2) 16. 0 16. 5 (50)bpts 16. 1 16. 0 10 bpts
Full Year Ended Half Year Ended
(1) Comparative information has been restated to conform to presentation in the current period.
(2) For definitions refer to Appendix 24.
(3) Diluted EPS and weighted average number of shares are disclosed in Appendix 21.
30 Jun 17 31 Dec 16 30 Jun 16 Jun 17 vs Jun 17 vs
Market Share (1) (2)% % % Dec 16 Jun 16
Home loans 25. 2 25. 4 25. 3 (20)bpts (10)bpts
Credit cards - RBA (3) 24. 3 24. 4 24. 4 (10)bpts (10)bpts
Other household lending (4) 17. 0 16. 9 16. 8 10 bpts 20 bpts
Household deposits 28. 8 29. 0 29. 2 (20)bpts (40)bpts
Business lending - RBA 16. 5 16. 6 16. 9 (10)bpts (40)bpts
Business lending - APRA 18. 6 18. 6 18. 8 - (20)bpts
Business deposits - APRA 20. 3 19. 8 20. 2 50 bpts 10 bpts
Asset Finance 12. 5 12. 7 12. 9 (20)bpts (40)bpts
Equities trading 3. 9 4. 0 4. 7 (10)bpts (80)bpts
Australian Retail - administrator view (5) 15. 6 15. 5 15. 6 10 bpts -
FirstChoice Platform (5) 10. 8 10. 8 11. 0 - (20)bpts
Australia life insurance (total risk) (5) 10. 6 11. 1 11. 4 (50)bpts (80)bpts
Australia life insurance (individual risk) (5) 10. 1 10. 2 10. 7 (10)bpts (60)bpts
NZ home loans (6) 21. 7 n/a n/a n/a n/a
NZ customer deposits (6) 17. 8 n/a n/a n/a n/a
NZ business lending (6) 14. 4 n/a n/a n/a n/a
NZ retail FUA 15. 3 15. 5 15. 4 (20)bpts (10)bpts
NZ annual inforce premiums (5) 27. 9 28. 0 28. 4 (10)bpts (50)bpts
As at
(1) Prior periods have been restated in line with market updates and comparatives have not been restated to include the impact of new market entrants in the
current period.
(2) For market share source references refer to Appendix 24.
(3) As at 31 May 2017.
(4) Other household lending market share includes personal loans, margin loans and other forms of lending to individuals.
(5) As at 31 March 2017.
(6) RBNZ published data collection has changed based on a new collection template implemented with all NZ banks. The RBNZ has not republished the equivalent metrics on a restated basis for June 2016. The restated December 2016 metrics will be presented in December 2017 allowing for comparatives on a twelve month basis.
Credit Ratings Long-term Short-term Outlook
Fitch Ratings AA- F1+ Stable
Moody's Investors Service Aa3 P-1 Stable
S&P Global Ratings AA- A-1+ Negative

6 Commonwealth Bank of Australia – Profit Announcement
This page has been intentionally left blank
Commonwealth Bank of Australia – Profit Announcement 7
Contents
Section 3 – Group Performance Analysis
Financial Performance and Business Review 8
Net Interest Income 9
Average Interest Earning Assets 9
Net Interest Margin 9
Other Banking Income 10
Funds Management Income 11
Insurance Income 12
Operating Expenses 12
Loan Impairment Expense 13
Taxation Expense 14
Non-Cash Items Included in Statutory Profit 15
Review of Group Assets and Liabilities 16

Group Performance Analysis
8 Commonwealth Bank of Australia – Profit Announcement
Financial Performance and Business Review
Year Ended June 2017 versus June 2016
The Group’s net profit after tax (“cash basis”) increased 5%
on the prior year to $9,881 million.
Earnings per share (“cash basis”) increased 4% on the prior
year to 574.4 cents per share and return on equity (“cash
basis”) decreased 50 basis points on the prior year to 16.0%.
The key components of the Group result were:
Net interest income increased 4% to $17,600 million,
reflecting 6% growth in average interest earning assets,
partly offset by a three basis point decrease in net
interest margin. Net interest margin excluding Treasury
and Markets decreased four basis points to 2.09%;
Other banking income increased 14% to $5,520 million,
including a $397 million gain on sale of the Group’s
remaining investment in Visa Inc. Underlying income
increased 5% driven by strong growth in fees and
commissions;
Funds management income increased 1% to
$2,034 million, including a 3% unfavourable impact from
the higher Australian dollar. This reflects a 6% increase
in average Funds Under Administration (FUA) and a 4%
increase in average Assets Under Management (AUM),
partly offset by lower FUA and AUM margins;
Insurance income decreased 1% to $786 million with
higher claims resulting in loss recognition of
$143 million, $78 million higher than the prior year, partly
offset by 1% growth in average inforce premiums;
Operating expenses increased 6% to $11,078 million,
including a $393 million one-off expense for acceleration
of amortisation on certain software assets. Underlying
expense growth of 2% was driven by increases in staff,
technology and investment spend, partly offset by the
continued realisation of incremental benefits from
productivity initiatives; and
Loan impairment expense decreased 13% to
$1,095 million, due to lower provisioning primarily in
Institutional Banking and Markets and Business and
Private Banking, partly offset by an increase in Bankwest.
Half Year Ended June 2017 versus December 2016
The Group’s net profit after tax (“cash basis”) increased 1%
on the prior half.
Earnings per share (“cash basis”) increased 1% on the prior
half to 288.5 cents per share, and return on equity (“cash
basis”) increased 10 basis points on the prior half to 16.1%.
It should be noted when comparing current half financial
performance to the prior half that there are three fewer
calendar days, impacting revenue in the current half. Key
points of note in the result included the following:
Net interest income increased 1%, reflecting 3%
growth in average interest earning assets, with net
interest margin remaining flat. Net interest margin
excluding Treasury and Markets increased two basis
points;
Other banking income decreased 15%, including a
$397 million gain on sale of the Group’s remaining
investment in Visa Inc. in the prior half. Underlying
income decreased 2% driven by lower trading income;
Funds management income increased 3%, reflecting a
4% increase in both average FUA and AUM;
Insurance income was flat, with lower wholesale life
claims and loss recognition of $53 million, $37 million
lower than the prior half, offset by higher weather event
claims and a 2% decrease in average inforce premiums;
Operating expenses decreased 5%, including a
$393 million one-off expense for acceleration of
amortisation on certain software assets in the prior half.
Underlying expense growth of 2% was driven by
investment spend and staff costs, partly offset by the
continued realisation of incremental benefits from
productivity initiatives; and
Loan impairment expense decreased 17% due to
lower provisioning in Business and Private Banking, New
Zealand and Institutional Banking and Markets.
665 263 9 397
24,606 25,543 25,940
Jun-16 Net InterestIncome
OBIunderlying
Funds&
Insurance
Jun-17underlying
Visa Sale Jun-17
5%
(1)
4%
123 67 15 46 393
10,434 10,685 11,078
Jun-16 Staff Technology Other InvestmentSpend
Jun-17underlying
AcceleratedAmortisation
Jun-17
6%
(3)(2)(3) (2)(4)
2%
(2)
114 26 (397) (55)
13,126 12,729 12,814
Dec-16Half
Visa Sale Dec-16underlying
Net InterestIncome
OBIunderlying
Funds&
Insurance
Jun-17Half
(2%)
(1)
1%
51 96 (393)
(23) (7)
5,677 5,284 5,401
Dec-16Half
AcceleratedAmortisation
Dec-16underlying
Staff Technology Other InvestmentSpend
Jun-17Half
(5%)
(3)
2%
(2)(4)(2)(3)(2)
(1) Represents a $397 million gain on sale of the Group’s remaining investment in Visa Inc.
(2) Excludes investment spend. Movements will not agree to the table on page 12.
(3) Technology excludes a $393 million one-off expense for accelerated amortisation on certain software assets which has been presented as a separate category.
(4) Other includes occupancy and equipment expense movement and other expense movement.
Total Operating Income Total Operating Income
Total Operating Expenses Total Operating Expenses

Group Performance Analysis
Commonwealth Bank of Australia – Profit Announcement 9
Net Interest Income
30 Jun 17 30 Jun 16 Jun 17 vs 30 Jun 17 31 Dec 16 Jun 17 vs
$M $M Jun 16 % $M $M Dec 16 %
Net interest income - "cash basis" 17,600 16,935 4 8,857 8,743 1
Average interest earning assets
Home loans (2) 435,448 409,669 6 440,572 430,408 2
Consumer Finance 23,518 23,722 (1) 23,577 23,460 -
Business and corporate loans 221,188 211,356 5 221,868 220,519 1
Total average lending interest earning assets 680,154 644,747 5 686,017 674,387 2
Non-lending interest earning assets 154,587 145,849 6 160,602 148,671 8
Total average interest earning assets 834,741 790,596 6 846,619 823,058 3
Net interest margin (%) 2. 11 2. 14 (3)bpts 2. 11 2. 11 -
Net interest margin excluding Treasury and Markets (%) 2. 09 2. 13 (4)bpts 2. 10 2. 08 2 bpts
Full Year Ended (1)
Half Year Ended
(1) Comparative information has been reclassified to conform to presentation in the current period.
(2) Net of average mortgage offset balances. Gross average home loans balance, excluding mortgage offset accounts is $470,773 million for the full year ended 30 June 2017 ($436,530 million for the full year ended 30 June 2016), $477,851 million for the half year ended 30 June 2017 ($463,811 million for the half year ended 31 December 2016).
Year Ended June 2017 versus June 2016
Net interest income increased 4% on the prior year to
$17,600 million. The result was driven by growth in average
interest earning assets of 6%, partly offset by a three basis
point decrease in net interest margin.
Average Interest Earning Assets
Average interest earning assets increased $44 billion on the
prior year to $835 billion, driven by:
Home loan average balances increased $26 billion or 6%
on the prior year to $435 billion. The growth in home loan
balances was largely driven by domestic banking growth;
Average balances for business and corporate loans
increased $10 billion or 5% on the prior year to
$221 billion, driven by growth in business banking
lending balances; and
Average non-lending interest earning assets increased
$8 billion or 6% on the prior year to $155 billion due to
higher liquid assets as a result of a reduction in the
Committed Liquidity Facility (CLF).
Net Interest Margin
The Group’s net interest margin decreased three basis points
on the prior year to 2.11%. The key drivers of the movement
were:
Asset pricing: Increased margin of five basis points with the
benefit from home loan repricing, partly offset by the impact of
competition on home and business lending.
Funding costs: Decreased margin of four basis points
reflecting an increase in wholesale funding costs due to
lengthening the mix and tenor of wholesale funding to assist
the Group in preparing for the Net Stable Funding Ratio which
applies from 1 January 2018. Deposit costs were flat with the
negative impact from the lower cash rate, offset by repricing.
Portfolio mix: Flat with favourable change in funding mix
from proportionally higher levels of transaction deposits,
offset by unfavourable change in lending mix.
Basis risk: Basis risk arises from funding assets which are
priced relative to the cash rate with liabilities priced relative to
the bank bill swap rate. The impact on margin was flat as a
result of minimal change in the spread between the cash rate
and the bank bill swap rate during the year.
Capital and Other: Decreased margin of five basis points
driven by the impact of the falling cash rate environment on
free equity funding and a two basis point reduction in the
contribution from New Zealand, partly offset by the positive
impact from higher capital.
Treasury and Markets: Increased margin of one basis point
driven by a higher contribution from Treasury and Markets,
partly offset by increased holdings of liquid assets.
NIM movement since June 2016 (1)
0.05% - -0.01%
(0.04%)(0.05%)
1.00%
1.20%
1.40%
1.60%
1.80%
2.00%
2.20%
Jun 16 Assetpricing
Fundingcosts
Portfoliomix
Basisrisk
Capitaland
Other
Treasuryand
Markets
Jun 17
2.09%
2.11%
Group NIM excluding Treasury and Markets decreased four basis points
2.13%
2.14%
Group NIM
Group NIM excluding Treasury and Markets
Group NIM (Half Year Ended) (1)
1.00%
1.20%
1.40%
1.60%
1.80%
2.00%
2.20%
Jun 15Half
Dec 15Half
Jun 16Half
Dec 16Half
Jun 17Half
2.11%2.14%2.15%2.13%
2.08% 2.10%2.13%2.13%2.10%
2.11%
Group NIM
Group NIM excluding Treasury and Markets
(1) Comparative information has been restated to conform to presentation in the current period.

Group Performance Analysis
10 Commonwealth Bank of Australia – Profit Announcement
Net Interest Income (continued)
Half Year Ended June 2017 versus December 2016
Net interest income increased 1% on the prior half, with
growth in average interest earning assets of 3%, partly offset
by three fewer calendar days than the prior half. Net interest
margin remained flat at 2.11%.
Average Interest Earning Assets
Average interest earning assets increased $24 billion on the
prior half to $847 billion, driven by:
Home loan average balances increased $10 billion or
2% on the prior half to $441 billion, primarily driven by
growth in the domestic banking business;
Average balances for business and corporate loans
increased $2 billion or 1% on the prior half to
$222 billion; and
Average non-lending interest earning assets increased
$12 billion or 8% on the prior half, primarily due to higher
cash and liquid assets.
Net Interest Margin
The Group’s net interest margin was flat on the prior half at
2.11%. The key drivers were:
Asset pricing: Decreased margin of one basis point,
reflecting the impact of competition on business lending.
Funding costs: Increased margin of three basis points,
reflecting the benefit from deposit repricing.
Portfolio mix: Increased margin of one basis point reflecting
a favourable change in funding mix from proportionally higher
levels of transaction deposits.
Basis risk: Basis risk arises from funding assets which are
priced relative to the cash rate with liabilities priced relative to
the bank bill swap rate. The margin increased one basis point
as a result of a decrease in the spread between the cash rate
and the bank bill swap rate during the half.
Capital and Other: Decreased margin of two basis points
driven by the impact of the falling cash rate environment on
free equity funding, and a one basis point reduction in the
contribution from New Zealand.
Treasury and Markets: Decreased margin of two basis
points driven by increased holdings of liquid assets, partly
offset by a higher contribution from Treasury and Markets.
NIM movement since December 2016
0.03%0.01% 0.01%
(0.01%)(0.02%)
(0.02%)
1.00%
1.20%
1.40%
1.60%
1.80%
2.00%
2.20%
Dec 16 Assetpricing
Fundingcosts
Portfoliomix
Basisrisk
Capitaland
Other
Treasuryand
Markets
Jun 17
2.11%
Group NIM excluding Treasury and Markets increased two basis points
2.08% 2.10%
2.11%
Group NIM
Group NIM excluding Treasury and Markets
Other Banking Income
30 Jun 17 30 Jun 16 Jun 17 vs 30 Jun 17 31 Dec 16 Jun 17 vs
$M $M Jun 16 % $M $M Dec 16 %
Commissions 2,482 2,215 12 1,228 1,254 (2)
Lending fees 1,078 1,010 7 545 533 2
Trading income 1,149 1,087 6 549 600 (9)
Other income (1) 811 548 48 212 599 (65)
Other banking income - "cash basis" (1) 5,520 4,860 14 2,534 2,986 (15)
Full Year Ended Half Year Ended
(1) The half year ended 31 December 2016 includes a $397 million gain on sale of the Group’s remaining investment in Visa Inc.
Year Ended June 2017 versus June 2016
Other banking income increased 14% on the prior year to
$5,520 million. Excluding the one-off impact of a gain on sale
of the Group’s remaining investment in Visa Inc. in the prior
half, other banking income increased 5%. The key drivers
were:
Commissions increased 12% on the prior year to
$2,482 million due to higher consumer finance income driven
by higher purchases and lower loyalty costs, and volume
driven deposit fee income;
Lending fees increased 7% on the prior year to
$1,078 million with volume driven growth, partly offset by
lower Institutional fees due to competitive pressures;
Trading income increased 6% on the prior year to
$1,149 million driven by favourable derivative valuation
adjustments, partly offset by lower Markets sales; and
Other income increased 48% on the prior year to
$811 million, driven by a gain on sale of the Group’s
remaining investment in Visa Inc., partly offset by a higher
realised loss on the hedge of New Zealand earnings.

Group Performance Analysis
Commonwealth Bank of Australia – Profit Announcement 11
Other Banking Income (continued)
Net Trading Income ($M)
357426
388346
206
172 233
171
(67)(7) (21)
32
496
591 600
549
Dec 15 Jun 16 Dec 16 Jun 17
Sales Trading Derivative valuation adjustment
Half Year Ended June 2017 versus December 2016
Other banking income decreased 15% on the prior half.
Excluding the one-off impact of a gain on sale of the Group’s
remaining investment in Visa Inc. in the prior half, other
banking income decreased 2%. The key drivers were:
Commissions decreased 2% on the prior half driven by
lower consumer finance income reflecting seasonally lower
purchases, higher loyalty costs and lower foreign exchange
income;
Lending fees increased 2% on the prior half with volume
driven growth in business lending, partly offset by lower
Institutional fees due to competitive pressures;
Trading income decreased 9% on the prior half due to lower
Markets sales and trading performance from lower volatility,
partly offset by favourable derivative valuation adjustments;
and
Other income decreased 65% on the prior half mainly driven
by a gain on sale of the Group’s remaining investment in Visa
Inc.
Funds Management Income
30 Jun 17 30 Jun 16 Jun 17 vs 30 Jun 17 31 Dec 16 Jun 17 vs
$M $M Jun 16 % $M $M Dec 16 %
Colonial First State (CFS) (1) 928 929 - 481 447 8
CFS Global Asset Management (CFSGAM) 837 842 (1) 412 425 (3)
CommInsure 121 120 1 60 61 (2)
New Zealand 92 80 15 47 45 4
Other 56 45 24 30 26 15
Funds management income - "cash basis" 2,034 2,016 1 1,030 1,004 3
Half Year EndedFull Year Ended
(1) Colonial First State incorporates the results of all Wealth Management Financial Planning businesses.
Year Ended June 2017 versus June 2016
Funds management income increased 1% on the prior year to
$2,034 million, driven by:
A 6% increase in average FUA reflecting strong
investment markets across the Australian and New
Zealand businesses and positive net flows in Australia;
and
A 4% increase in average AUM as a result of positive
net flows and strong investment markets in the
Australian and New Zealand businesses; partly offset by
A 3% unfavourable impact from the higher Australian
dollar;
A decline in FUA margins as a result of increased
customer remediation costs in CFS Advice; and
A decline in AUM margins as a result of a change in
investment mix in the Australian business.
Half Year Ended June 2017 versus December 2016
Funds management income increased 3% on the prior half,
driven by:
A 4% increase in average FUA reflecting positive net
flows and strong investment markets in CFS;
A 4% increase in average AUM reflecting strong
investment markets and positive net flows in the
Australian business; and
An improvement in FUA margins due to a decrease in
customer remediation costs in CFS Advice.
Group Performance Analysis
12 Commonwealth Bank of Australia – Profit Announcement
Insurance Income
30 Jun 17 30 Jun 16 Jun 17 vs 30 Jun 17 31 Dec 16 Jun 17 vs
$M $M Jun 16 % $M $M Dec 16 %
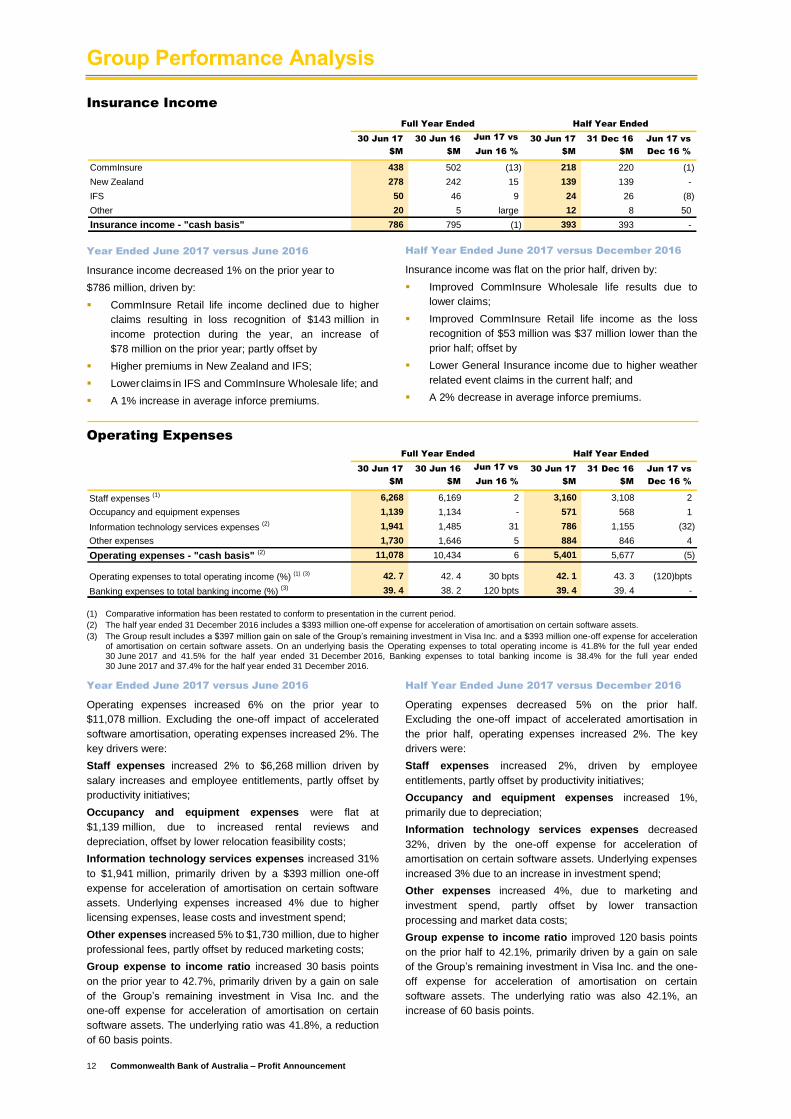
CommInsure 438 502 (13) 218 220 (1)
New Zealand 278 242 15 139 139 -
IFS 50 46 9 24 26 (8)
Other 20 5 large 12 8 50
Insurance income - "cash basis" 786 795 (1) 393 393 -
Full Year Ended Half Year Ended
Year Ended June 2017 versus June 2016
Insurance income decreased 1% on the prior year to
$786 million, driven by:
CommInsure Retail life income declined due to higher
claims resulting in loss recognition of $143 million in
income protection during the year, an increase of
$78 million on the prior year; partly offset by
Higher premiums in New Zealand and IFS;
Lower claims in IFS and CommInsure Wholesale life; and
A 1% increase in average inforce premiums.
Half Year Ended June 2017 versus December 2016
Insurance income was flat on the prior half, driven by:
Improved CommInsure Wholesale life results due to
lower claims;
Improved CommInsure Retail life income as the loss
recognition of $53 million was $37 million lower than the
prior half; offset by
Lower General Insurance income due to higher weather
related event claims in the current half; and
A 2% decrease in average inforce premiums.
Operating Expenses
30 Jun 17 30 Jun 16 Jun 17 vs 30 Jun 17 31 Dec 16 Jun 17 vs
$M $M Jun 16 % $M $M Dec 16 %
Staff expenses (1) 6,268 6,169 2 3,160 3,108 2
Occupancy and equipment expenses 1,139 1,134 - 571 568 1
Information technology services expenses (2) 1,941 1,485 31 786 1,155 (32)
Other expenses 1,730 1,646 5 884 846 4
Operating expenses - "cash basis" (2) 11,078 10,434 6 5,401 5,677 (5)
Operating expenses to total operating income (%) (1) (3) 42. 7 42. 4 30 bpts 42. 1 43. 3 (120)bpts
Banking expenses to total banking income (%) (3) 39. 4 38. 2 120 bpts 39. 4 39. 4 -
Full Year Ended Half Year Ended
(1) Comparative information has been restated to conform to presentation in the current period.
(2) The half year ended 31 December 2016 includes a $393 million one-off expense for acceleration of amortisation on certain software assets.
(3) The Group result includes a $397 million gain on sale of the Group’s remaining investment in Visa Inc. and a $393 million one-off expense for acceleration of amortisation on certain software assets. On an underlying basis the Operating expenses to total operating income is 41.8% for the full year ended 30 June 2017 and 41.5% for the half year ended 31 December 2016, Banking expenses to total banking income is 38.4% for the full year ended 30 June 2017 and 37.4% for the half year ended 31 December 2016.
Year Ended June 2017 versus June 2016
Operating expenses increased 6% on the prior year to
$11,078 million. Excluding the one-off impact of accelerated
software amortisation, operating expenses increased 2%. The
key drivers were:
Staff expenses increased 2% to $6,268 million driven by
salary increases and employee entitlements, partly offset by
productivity initiatives;
Occupancy and equipment expenses were flat at
$1,139 million, due to increased rental reviews and
depreciation, offset by lower relocation feasibility costs;
Information technology services expenses increased 31%
to $1,941 million, primarily driven by a $393 million one-off
expense for acceleration of amortisation on certain software
assets. Underlying expenses increased 4% due to higher
licensing expenses, lease costs and investment spend;
Other expenses increased 5% to $1,730 million, due to higher
professional fees, partly offset by reduced marketing costs;
Group expense to income ratio increased 30 basis points
on the prior year to 42.7%, primarily driven by a gain on sale
of the Group’s remaining investment in Visa Inc. and the
one-off expense for acceleration of amortisation on certain
software assets. The underlying ratio was 41.8%, a reduction
of 60 basis points.
Half Year Ended June 2017 versus December 2016
Operating expenses decreased 5% on the prior half.
Excluding the one-off impact of accelerated amortisation in
the prior half, operating expenses increased 2%. The key
drivers were:
Staff expenses increased 2%, driven by employee
entitlements, partly offset by productivity initiatives;
Occupancy and equipment expenses increased 1%,
primarily due to depreciation;
Information technology services expenses decreased
32%, driven by the one-off expense for acceleration of
amortisation on certain software assets. Underlying expenses
increased 3% due to an increase in investment spend;
Other expenses increased 4%, due to marketing and
investment spend, partly offset by lower transaction
processing and market data costs;
Group expense to income ratio improved 120 basis points
on the prior half to 42.1%, primarily driven by a gain on sale
of the Group’s remaining investment in Visa Inc. and the one-
off expense for acceleration of amortisation on certain
software assets. The underlying ratio was also 42.1%, an
increase of 60 basis points.

Group Performance Analysis
Commonwealth Bank of Australia – Profit Announcement 13
Operating Expenses (continued)
Investment Spend
30 Jun 17 30 Jun 16 Jun 17 vs 30 Jun 17 31 Dec 16 Jun 17 vs
$M $M Jun 16 % $M $M Dec 16 %
Expensed investment spend (1) 650 604 8 373 277 35
Capitalised investment spend 629 769 (18) 306 323 (5)
Investment spend 1,279 1,373 (7) 679 600 13
Comprising:
Productivity and growth 681 701 (3) 365 316 16
Risk and compliance 470 505 (7) 251 219 15
Branch refurbishment and other 128 167 (23) 63 65 (3)
Investment spend 1,279 1,373 (7) 679 600 13
Full Year Ended Half Year Ended
(1) Included within the Operating Expenses disclosure on page 12.
Year Ended June 2017 versus June 2016
The Group continued to invest to deliver on the strategic
priorities of the business with $1,279 million incurred in the
full year to 30 June 2017, a decrease of 7% on the prior year.
The decrease is due to timing, and the completion of key
phases of risk and compliance projects in the prior year
(including Future of Financial Advice (FOFA)), significant
progress made with branch transformation, the roll-out of
refreshed ATMs in the prior year, and the timing of spend on
productivity and growth initiatives.
Spend on productivity and growth continued to focus on
delivering further enhancements to the Group’s sales
management capabilities, digital channels and customer data
insights.
Significant spend on risk and compliance projects has
continued as systems are implemented to assist in satisfying
new regulatory obligations, including Stronger Super and
Common Reporting Standard requirements. In addition, the
Group continues to invest in safeguarding information security
to mitigate risks and provide greater stability for customers.
Loan Impairment Expense
30 Jun 17 30 Jun 16 Jun 17 vs 30 Jun 17 31 Dec 16 Jun 17 vs
$M $M Jun 16 % $M $M Dec 16 %
Retail Banking Services 699 663 5 349 350 -
Business and Private Banking 74 176 (58) 10 64 (84)
Institutional Banking and Markets 64 252 (75) 20 44 (55)
New Zealand 65 120 (46) 18 47 (62)
Bankwest 89 (10) large 46 43 7
IFS and Other 104 55 89 53 51 4
Loan impairment expense - "cash basis" 1,095 1,256 (13) 496 599 (17)
Full Year Ended (1)
Half Year Ended
(1) Comparative information has been restated to conform to presentation in the current period.
Year Ended June 2017 versus June 2016
Loan impairment expense decreased 13% on the prior year to
$1,095 million. Loan impairment expense annualised as a
percentage of Gross Loans and Acceptances (GLAAs)
decreased 4 basis points to 15 basis points. The decrease
was driven by:
Reduced individual provisions and lower collective
provisions in Business and Private Banking;
Lower collective provisions and fewer large individual
provisions in Institutional Banking and Markets; and
Lower collective provisioning in the New Zealand dairy
sector; partly offset by
An increase in Retail Banking Services as a result of
higher arrears and losses for home loans and consumer
finance, predominantly in Western Australia and
Queensland; and
An increase in Bankwest due to slower run-off of the
business troublesome book and higher home loan
losses, predominantly in Western Australia.

Group Performance Analysis
14 Commonwealth Bank of Australia – Profit Announcement
Loan Impairment Expense (continued)
Half Year Loan Impairment Expense (Annualised) as a % of Average GLAAs (bpts)
1714
17 1720
1714
Jun 14 Dec 14 Jun 15 Dec 15 Jun 16 Dec 16 Jun 17
(1) 16 basis points, including the Bell group write-back (non-cash item).
(1)
Half Year Ended June 2017 versus December 2016
Loan impairment expense decreased 17% on the prior half
mainly driven by:
Seasonally higher consumer finance arrears offset by
lower home loan losses in Retail Banking Services;
Lower collective provisions in Business and Private
Banking;
Reduced individual provisions in Institutional Banking
and Markets;
Lower provisioning primarily in the New Zealand dairy
sector; partly offset by
A small increase in business lending losses in Bankwest,
partly offset by lower home loan losses.
Taxation Expense
30 Jun 17 30 Jun 16 Jun 17 vs 30 Jun 17 31 Dec 16 Jun 17 vs
$M $M Jun 16 % $M $M Dec 16 %
Corporate tax expense ($M) 3,927 3,592 9 1,977 1,950 1
Effective tax rate - "cash basis" (%) 28. 4 27. 5 90 bpts 28. 4 28. 4 -
Full Year Ended Half Year Ended
Year Ended June 2017 versus June 2016
Corporate tax expense for the year ended 30 June 2017
increased 9% on the prior year representing a 28.4% effective
tax rate. This increase is primarily as a result of a change in
business mix, including the run-off of specialised financing
transactions.
The effective tax rate is below the Australian company tax
rate of 30% primarily as a result of the profit earned by the
offshore banking unit and offshore jurisdictions that have
lower corporate tax rates.
Half Year Ended June 2017 versus December 2016
Corporate tax expense for the half year ended 30 June 2017
was flat on the prior half representing a 28.4% effective tax
rate.

Group Performance Analysis
Commonwealth Bank of Australia – Profit Announcement 15
Non-Cash Items Included in Statutory Profit
30 Jun 17 30 Jun 16 Jun 17 vs 30 Jun 17 31 Dec 16 Jun 17 vs
$M $M Jun 16 % $M $M Dec 16 %
Hedging and IFRS volatility 73 (199) large 65 8 large
Bankwest non-cash items (3) (27) (89) (2) (1) large
Treasury shares valuation adjustment (23) 4 large (4) (19) (79)
Other non-cash items (26) (23) 13 (6) (20) (70)
Total non-cash items (after tax) 47 (222) large 59 (12) large
Full Year Ended (1)
Half Year Ended
(1) Comparative information has been restated to conform to presentation in the current period.
Non-cash items are excluded from net profit after tax
(“cash basis”), which is management’s preferred measure of
the Group’s financial performance, as they tend to be
non-recurring in nature or are not considered representative
of the Group’s ongoing financial performance. The impact of
these items on the Group’s net profit after tax
(“statutory basis”) is outlined below and treated consistently
with prior comparative period and prior half disclosures. Refer
to Appendix 19 for the detailed profit reconciliation.
Hedging and IFRS volatility
Hedging and IFRS volatility includes unrealised fair value
gains or losses on economic hedges that do not qualify for
hedge accounting under IFRS, including:
Cross currency interest rate swaps hedging foreign
currency denominated debt issues; and
Foreign exchange hedges relating to future New
Zealand earnings.
Hedging and IFRS volatility also includes unrealised fair value
gains or losses on the ineffective portion of economic hedges
that qualify for hedge accounting under IFRS.
Fair value gains or losses on all of these economic hedges
are excluded from cash profit, since the asymmetric
recognition of the gains or losses does not affect the Group’s
performance over the life of the hedge. A $73 million after tax
gain was recognised in statutory profit for the year ended
30 June 2017 (30 June 2016: $199 million after tax loss).
Bankwest non-cash items
The acquisition of Bankwest resulted in the recognition of
assets at fair value, representing certain financial instruments,
core deposits, customer lists and brand name totalling
$463 million. The core deposits and customer lists have been
amortising over their useful life, resulting in amortisation
charges of $3 million after tax in the year ended 30 June 2017
(30 June 2016: $27 million). As at 31 December 2015 the
core deposits have been fully amortised.
These items were not recognised in cash profit as they were
not representative of the Group’s expected ongoing financial
performance.
Treasury shares valuation adjustment
Under IFRS, Commonwealth Bank of Australia shares held by
the Group in the managed funds and life insurance
businesses are defined as treasury shares and are held at
cost. Distributions, realised and unrealised gains and losses
were recognised in cash profit representing the underlying
performance of the asset portfolio attributable to the wealth
and life insurance businesses. These distributions, gains and
losses are reversed as non-cash items for statutory reporting
purposes. A $23 million after tax loss was included in
statutory profit in the year ended 30 June 2017
(30 June 2016: $4 million after tax gain).
Policyholder tax
Policyholder tax is included in the Wealth Management and
New Zealand business results for statutory reporting
purposes. In the year ended 30 June 2017, tax expense of
$32 million (30 June 2016: $101 million), funds management
income of $30 million (30 June 2016: $8 million loss) and
insurance income of $2 million (30 June 2016: $109 million)
were recognised. The gross up of these items is excluded
from cash profit, as they do not reflect the underlying
performance of the business, which is measured on a net of
policyholder tax basis.
Investment experience
Investment experience primarily includes the returns on
shareholder capital invested in the wealth management and
insurance businesses, as well as the volatility generated
through the annuity portfolio held by the Group’s Wealth
Management division. This item is classified separately within
cash profit.

Group Performance Analysis
16 Commonwealth Bank of Australia – Profit Announcement
Review of Group Assets and Liabilities
30 Jun 17 31 Dec 16 30 Jun 16 Jun 17 vs Jun 17 vs
Total Group Assets and Liabilities $M $M $M Dec 16 % Jun 16 %
Interest earning assets
Home loans (1) 485,857 472,532 456,074 3 7
Consumer finance 23,577 23,895 23,862 (1) (1)
Business and corporate loans 226,484 221,707 220,611 2 3
Loans, bills discounted and other receivables (2) 735,918 718,134 700,547 2 5
Non-lending interest earning assets 163,665 159,767 137,838 2 19
Total interest earning assets 899,583 877,901 838,385 2 7
Other assets (2) (3) 76,791 93,818 94,616 (18) (19)
Total assets 976,374 971,719 933,001 - 5
Interest bearing liabilities
Transaction deposits (4) 98,884 93,641 89,780 6 10
Savings deposits (4) 191,245 191,406 191,313 - -
Investment deposits 220,530 211,711 197,085 4 12
Other demand deposits 70,313 67,652 71,293 4 (1)
Total interest bearing deposits 580,972 564,410 549,471 3 6
Debt issues 168,034 177,023 162,716 (5) 3
Other interest bearing liabilities 57,531 58,888 54,101 (2) 6
Total interest bearing liabilities 806,537 800,321 766,288 1 5
Non-interest bearing transaction deposits 44,032 39,786 37,000 11 19
Other non-interest bearing liabilities (3) 62,089 69,800 69,149 (11) (10)
Total liabilities 912,658 909,907 872,437 - 5
As at
(1) Gross of mortgage offset balances.
(2) Loans, bills discounted and other receivables exclude provisions for impairment which are included in Other assets.
(3) Comparative information has been restated to conform to presentation in the current period.
(4) Includes mortgage offset balances.
Year Ended June 2017 versus June 2016
Asset growth of $43 billion or 5% on the prior year was driven
by increased home lending, business and corporate lending,
and higher liquid asset balances.
The Group continued to satisfy a significant portion of lending
growth from customer deposits. Customer deposits represent
67% of total funding (30 June 2016: 66%).
Home loans
Home loan balances increased $30 billion to $486 billion,
reflecting a 7% increase on the prior year, driven by strong
growth in Retail Banking Services, New Zealand and Bankwest.
Consumer finance
Consumer finance, which includes personal loans, credit
cards and margin lending decreased 1% on the prior year to
$24 billion, broadly in line with system.
Business and corporate loans
Business and corporate loans increased $6 billion to
$226 billion, a 3% increase on the prior year. This was driven
by strong growth in business lending in Business and Private
Banking and New Zealand, partly offset by institutional
lending due to active portfolio management.
Non-lending interest earning assets
Non-lending interest earning assets increased $26 billion to
$164 billion, reflecting a 19% increase on the prior year. The
increase was driven by higher liquid asset balances held as a
result of Balance Sheet growth and a reduction in Committed
Liquidity Facility (CLF) effective 1 January 2017.
Other assets
Other assets, including derivative assets, insurance assets
and intangibles, decreased $18 billion to $77 billion, a 19%
decrease on the prior year, reflecting lower derivative asset
balances impacted by the higher Australian dollar.
Interest bearing deposits
Interest bearing deposits increased $32 billion to $581 billion,
a 6% increase on the prior year. This was driven by strong
growth of $23 billion in investment deposits and a $9 billion
increase in transaction deposits.
Debt issues
Debt issues increased $5 billion to $168 billion, a 3% increase
on the prior year. While deposits satisfied the majority of the
Group’s funding requirements, strong access was maintained
to both domestic and international wholesale debt markets.
Refer to page 26 for further information on debt programs and
issuance for the year ended 30 June 2017.
Other interest bearing liabilities
Other interest bearing liabilities, including loan capital,
liabilities at fair value through income statement and amounts
due to other financial institutions, increased $3 billion to
$58 billion, a 6% increase on the prior year.
Non-interest bearing transaction deposits
Non-interest bearing transaction deposits, including business
and personal transaction accounts, increased $7 billion to
$44 billion, driven by strong growth in Retail Banking
Services.
Other non-interest bearing liabilities
Other non-interest bearing liabilities, including derivative
liabilities and insurance policy liabilities, decreased $7 billion
to $62 billion, a 10% decrease on the prior year, reflecting
lower derivative liability balances impacted by the higher
Australian dollar.
Group Performance Analysis
Commonwealth Bank of Australia – Profit Announcement 17
Review of Group Assets and Liabilities (continued)
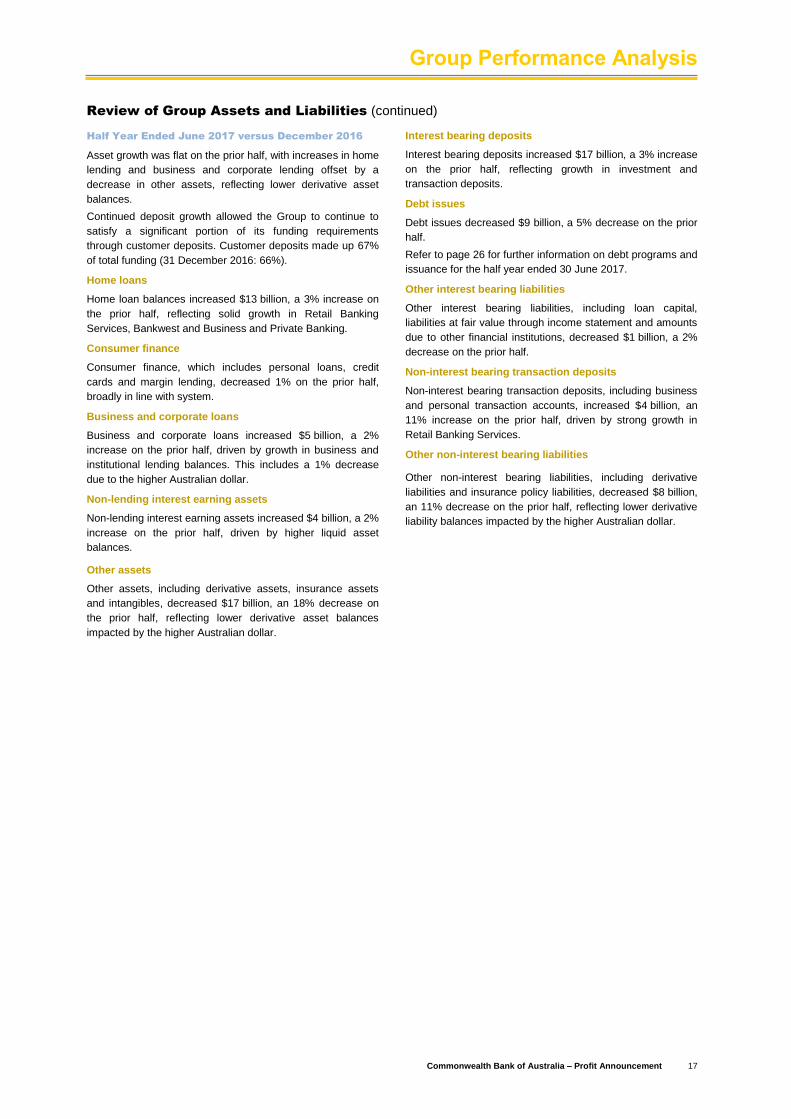
Half Year Ended June 2017 versus December 2016
Asset growth was flat on the prior half, with increases in home
lending and business and corporate lending offset by a
decrease in other assets, reflecting lower derivative asset
balances.
Continued deposit growth allowed the Group to continue to
satisfy a significant portion of its funding requirements
through customer deposits. Customer deposits made up 67%
of total funding (31 December 2016: 66%).
Home loans
Home loan balances increased $13 billion, a 3% increase on
the prior half, reflecting solid growth in Retail Banking
Services, Bankwest and Business and Private Banking.
Consumer finance
Consumer finance, which includes personal loans, credit
cards and margin lending, decreased 1% on the prior half,
broadly in line with system.
Business and corporate loans
Business and corporate loans increased $5 billion, a 2%
increase on the prior half, driven by growth in business and
institutional lending balances. This includes a 1% decrease
due to the higher Australian dollar.
Non-lending interest earning assets
Non-lending interest earning assets increased $4 billion, a 2%
increase on the prior half, driven by higher liquid asset
balances.
Other assets
Other assets, including derivative assets, insurance assets
and intangibles, decreased $17 billion, an 18% decrease on
the prior half, reflecting lower derivative asset balances
impacted by the higher Australian dollar.
Interest bearing deposits
Interest bearing deposits increased $17 billion, a 3% increase
on the prior half, reflecting growth in investment and
transaction deposits.
Debt issues
Debt issues decreased $9 billion, a 5% decrease on the prior
half.
Refer to page 26 for further information on debt programs and
issuance for the half year ended 30 June 2017.
Other interest bearing liabilities
Other interest bearing liabilities, including loan capital,
liabilities at fair value through income statement and amounts
due to other financial institutions, decreased $1 billion, a 2%
decrease on the prior half.
Non-interest bearing transaction deposits
Non-interest bearing transaction deposits, including business
and personal transaction accounts, increased $4 billion, an
11% increase on the prior half, driven by strong growth in
Retail Banking Services.
Other non-interest bearing liabilities
Other non-interest bearing liabilities, including derivative
liabilities and insurance policy liabilities, decreased $8 billion,
an 11% decrease on the prior half, reflecting lower derivative
liability balances impacted by the higher Australian dollar.

18 Commonwealth Bank of Australia – Profit Announcement
This page has been intentionally left blank
Commonwealth Bank of Australia – Profit Announcement 19
Contents
Section 4 – Group Operations and Business Settings
Loan Impairment Provisions and Credit Quality 20
Capital 22
Dividends 24
Leverage Ratio 24
Liquidity 25
Funding 26

Group Operations and Business Settings
20 Commonwealth Bank of Australia – Profit Announcement
Loan Impairment Provisions and Credit Quality
Provisions for Impairment
30 Jun 17 31 Dec 16 30 Jun 16 Jun 17 vs Jun 17 vs
$M $M $M Dec 16 % Jun 16 %
Provisions for impairment losses
Collective provision 2,747 2,807 2,818 (2) (3)
Individually assessed provisions 980 1,017 944 (4) 4
Total provisions for impairment losses 3,727 3,824 3,762 (3) (1)
Less: Provision for Off Balance Sheet exposures (34) (35) (44) (3) (23)
Total provisions for loan impairment 3,693 3,789 3,718 (3) (1)
As at
Year Ended June 2017 versus June 2016
Total provisions for impairment losses decreased 1% on the
prior year to $3,727 million. The movement in the level of
provisioning reflects:
Lower commercial collective provisions, mainly in
Institutional Banking and Markets; and
A reduction in Bankwest individually assessed
provisions; partly offset by
An increase in consumer collective provisions in home
loans and credit cards in Retail Banking Services;
Higher consumer individually assessed provisions
predominantly due to home loan impairments in Western
Australia; and
Economic overlays remain unchanged on the prior year.
Half Year Ended June 2017 versus December 2016
Total provisions for impairment losses decreased 3% on the
prior half. The movement in the level of provisioning reflects:
Reduction in management overlays, mainly due to model
factor updates. Economic overlays remain unchanged;
Lower commercial collective provisions, predominantly
due to model factor updates and improving dairy sector
in New Zealand; and
A reduction in commercial individually assessed
provisions in Institutional Banking and Markets; partly
offset by
An increase in consumer collective provisioning in Retail
Banking Services, predominantly due to higher home
loan provisions and seasonally higher consumer finance
arrears; and
Higher consumer individually assessed provisions
primarily due to home loan impairments in Western
Australia.
Collective Provisions ($M)
Individually Assessed Provisions ($M)
859 811 740
1,077 1,059 1,112
187 181 184
695 756 711
Jun 16 Dec 16 Jun 17
2,807 2,747
566 610 571
169 195 211 209 212 198
Jun 16 Dec 16 Jun 17
1,017 980
Overlay Bankwest Consumer Commercial
2,818
944

Group Operations and Business Settings
Commonwealth Bank of Australia – Profit Announcement 21
Loan Impairment Provisions and Credit Quality (continued)
Credit Quality
Jun 17 vs Jun 17 vs
Credit Quality Metrics 30 Jun 17 30 Jun 16 Jun 16 % 30 Jun 17 31 Dec 16 Dec 16 %
Gross loans and acceptances (GLAA) ($M) 737,002 701,730 5 737,002 719,250 2
Risk weighted assets (RWA) ($M) - Basel III 437,063 394,667 11 437,063 436,481 -
Credit RWA ($M) - Basel III 377,259 344,030 10 377,259 373,526 1
Gross impaired assets ($M) 3,187 3,116 2 3,187 3,375 (6)
Net impaired assets ($M) 2,038 1,989 2 2,038 2,193 (7)
Provision Ratios
Collective provision as a % of credit RWA - Basel III 0. 73 0. 82 (9)bpts 0. 73 0. 75 (2)bpts
Total provisions as a % of credit RWA - Basel III 0. 99 1. 09 (10)bpts 0. 99 1. 02 (3)bpts
Total provisions for impaired assets as a % of gross impaired
assets 36. 05 36. 17 (12)bpts 36. 05 35. 02 103 bpts
Total provisions for impairment losses as a % of GLAAs 0. 51 0. 54 (3)bpts 0. 51 0. 53 (2)bpts
Asset Quality Ratios
Gross impaired assets as a % of GLAAs 0. 43 0. 44 (1)bpt 0. 43 0. 47 (4)bpts
Loans 90+ days past due but not impaired as a % of GLAAs 0. 36 0. 33 3 bpts 0. 36 0. 33 3 bpts
Loan impairment expense ("cash basis") annualised as a % of
average GLAAs 0. 15 0. 19 (4)bpts 0. 14 0. 17 (3)bpts
Full Year Ended Half Year Ended
Provision Ratios
Provision coverage ratios remain prudent. The impaired asset
portfolio remains well provisioned with provision coverage of
36.05%.
Asset Quality
The asset quality ratios show improvement in the quality of
the book with the level of commercial troublesome and
impaired assets reducing over the half. The arrears for the
home loan and credit card portfolios remain relatively low,
however personal loan arrears continues to be elevated,
primarily in Western Australia.
Retail Portfolios – Arrears Rates
Home loan arrears increased over the year, with 30+ day
arrears increasing from 1.21% to 1.22%, and 90+ day arrears
increasing from 0.54% to 0.60%. Personal loan arrears
improved over the year with 30+ day arrears falling from
3.46% to 3.35%, and 90+ day arrears reducing from 1.46% to
1.41%. Credit card arrears deteriorated with 30+ day arrears
increasing from 2.41% to 2.52%, and 90+ day arrears
increasing from 0.99% to 1.03%.
30+ Days Arrears Ratios (%) (1)
1.0%
2.0%
3.0%
4.0%
Jun 15 Dec 15 Jun 16 Dec 16 Jun 17
Personal Loans
Home Loans
Credit Cards
(1) Includes retail portfolios of Retail Banking Services, Bankwest and New Zealand.
90+ Days Arrears Ratios (%) (1)
0.0%
1.0%
2.0%
Jun 15 Dec 15 Jun 16 Dec 16 Jun 17
Home Loans
Personal Loans
Credit Cards
Troublesome and Impaired Assets
Commercial troublesome assets decreased 5% during the
year to $3,313 million.
Gross impaired assets increased 2% on the prior year to
$3,187 million. Gross impaired assets as a proportion of
GLAAs of 0.43% decreased one basis point on the prior year.
Troublesome and Impaired Assets ($B)
3.6 3.1 3.1 3.1 3.5 3.4 3.3
3.43.4 2.9 2.8
3.1 3.4 3.2
Jun 14 Dec 14 Jun 15 Dec 15 Jun 16 Dec 16 Jun 17
Commercial Troublesome Gross Impaired
6.67.06.5
6.0 5.96.8 6.5

Group Operations and Business Settings
22 Commonwealth Bank of Australia – Profit Announcement
Capital
Regulatory Capital Framework
Background
The Basel Committee on Banking Supervision (BCBS) has
implemented a set of capital, liquidity and funding reforms
known as “Basel III”. The objectives of the reforms are to
increase the quality, consistency and transparency of capital,
to enhance the risk coverage framework, and to reduce
systemic and pro-cyclical risk. The major reforms are being
implemented on a phased approach to 1 January 2019.
The capital reforms were implemented in Australia from
1 January 2013. APRA has adopted a more conservative
approach than the minimum standards published by the
BCBS and also adopted an accelerated timetable for
implementation.
The APRA prudential standards require a minimum CET1
ratio of 4.5% effective from 1 January 2013. An additional
CET1 capital conservation buffer of 3.5%, inclusive of a
Domestic Systemically Important Bank (DSIB) requirement of
1% and a countercyclical capital buffer (CCyB)(1)
of 0%,
(effective from 1 January 2016), bringing the CET1
requirement to at least 8%.
Unquestionably Strong Capital Ratios
In December 2014, the Government released the Financial
Systems Inquiry’s final report. In response to the final report,
APRA undertook the following actions:
Increased the capital requirements under the Advanced
Internal Ratings Based (AIRB) approach for Australian
residential mortgages to an average of at least 25%
risk-weighting (effective from 1 July 2016) with the
change aimed at increasing mortgage competition
between the major banks and non-major banks; and
Released an information paper in July 2017 in relation to
establishing the quantum of additional capital required
for the Australian banking sector to have capital ratios
that are unquestionably strong.
APRA’s expectation in relation to the concept of
unquestionably strong is that the Australian major banks will
operate with a CET1 ratio average benchmark of 10.5% or
more by 1 January 2020.
APRA expects to release a discussion paper in 2017
covering:
Proposed revisions to the regulatory capital framework
required to support unquestionably strong capital ratios;
Domestic application of the various BCBS reforms;
Additional measures to address structural concentration
of Australian residential mortgages; and
Improving transparency and international comparability
of capital ratios.
Following the discussion paper, APRA expects to release
revised draft prudential standards in late 2018, with the
release of the final standards in 2019 and implementation by
1 January 2021.
Internationally Comparable Capital Position
The Group’s CET1 as measured on an internationally
comparable basis was 15.6% as at 30 June 2017, placing it
amongst the top quartile of international peer banks.
(1) In January 2017, APRA announced that the CCyB for Australian
exposures will remain at 0%. The Group has limited exposures to those offshore jurisdictions in which a CCyB in excess of 0% has been imposed.
International Peer Basel III CET1
20.0
15.6 15.3 15.2 14.9 14.7 14.514.2 14.1 14.0 14.0 14.0
13.5 13.4 13.2 13.0 13.0 13.0 12.9 12.8 12.5 12.4 12.412.1 12.0 11.9 11.6 11.5 11.3 11.3 11.2 11.2 10.9 10.8 10.7 10.6 10.5
No
rdea
CB
A
WB
C
AN
Z
HS
BC
ING
NA
B
De
uts
ch
e
RB
S
Sta
nd
ard
Ch
art
ere
d
Llo
yds
UB
S
Inte
sa S
an
pa
olo
Cre
dit S
uis
se
Ba
rcla
ys
Citi
Ch
ina
Co
nstr
uct.
Ba
nk
ICB
C
Un
iCre
dit
Cre
dit A
gricole
SA
JP
Mo
rga
n
Su
mitom
o M
itsu
i
Ch
ina
Me
rch
an
ts B
an
k
BN
P P
arib
as
So
cG
en
Mitsu
bis
hi U
FJ
We
lls F
arg
o
Ba
nk o
f A
meri
ca
Miz
uh
o
Scotiab
an
k
BB
VA
Ba
nk o
f C
hin
a
Ba
nk o
f C
om
m
To
ron
to D
om
inio
n
Sa
nta
nde
r
RB
C
Ag
ri.
Ba
nk o
f C
hin
a
3 2
APRA top quartile 1
2 2 3 33 33 3
33 3333 33 3
Source: Morgan Stanley and CBA. Based on last reported CET1 ratios up to 3 August 2017 assuming Basel III capital reforms fully implemented.
Peer group comprises listed commercial banks with total assets in excess of $750 billion and which have disclosed fully implemented Basel III ratios or provided sufficient disclosure for a Morgan Stanley estimate.
(1) APRA has estimated that the 75% percentile is likely to be in the order of 14 per cent as at end December 2016. APRA Information Paper “Strengthening banking system resilience – establishing unquestionably strong capital ratios” (19 July 2017).
(2) Domestic peer figures as at 31 March 2017.
(3) Deduction for accrued expected future dividends added back for comparability.

Group Operations and Business Settings
Commonwealth Bank of Australia – Profit Announcement 23
Capital (continued)
Capital Position
The Group’s CET1 ratio as measured on an APRA basis was
10.1% at 30 June 2017, compared with 9.9% at
31 December 2016 and 10.6% at 30 June 2016. The capital
ratios were maintained well in excess of regulatory minimum
requirements at all times throughout the year.
10.6%9.9% 10.1%
15.6%
Jun 16Basel III
Dec 16Basel III
Jun 17Basel III
Jun 17Basel III
CET1 Ratio (Internationally Comparable)
CET1 Ratio (APRA) (1) Analysis aligns with the APRA study titled “International capital
comparison study” (13 July 2015).
The Group’s CET1 (APRA) ratio increased 20 basis points for
the half year ended 30 June 2017. After allowing for further
increases in capital requirements with respect to Australian
residential mortgages, the underlying increase was
54 basis points on the prior half. This primarily reflected the
impact of capital generated from earnings and prudent
balance sheet management leading to lower risk weighted
assets, partly offset by the December 2016 interim dividend
(net of issuance of shares through the Dividend Reinvestment
Plan (DRP)) and the maturity of a further $1 billion of Colonial
debt.
The decrease in the Group’s CET1 ratio across the
June 2017 full year was driven by the APRA requirement to
hold additional capital with respect to Australian residential
mortgages, partly offset by continued sustained organic
capital generation.
APRA re-accredited the use of the AIRB approach for the
Bankwest non-retail portfolio, effective from
30 September 2016. This change had minimal impact on the
Group’s capital.
Capital Initiatives
The following significant CET1 capital initiatives were
undertaken during the year:
The DRP in respect of the 2016 final dividend was
satisfied by the issuance of $586 million of ordinary
shares, representing a participation rate of 15.4%; and
The DRP in respect of the 2017 interim dividend was
satisfied by the issuance of $558 million of ordinary
shares, representing a participation rate of 16.3%.
Further details on the Group’s current regulatory capital
position are included in Appendix 16.
Pillar 3 Disclosures
Details on the market disclosures required under Pillar 3 in
accordance with prudential standard APS 330 “Public
Disclosure”, are provided on the Group’s website at:
www.commbank.com.au/about-us/investors/shareholders.
Other Regulatory Changes
Basel Committee on Banking Supervision
The BCBS has issued a number of consultation documents
on:
Design of a framework for the application of capital floors
based on standardised approaches;
Revisions to the standardised approach for credit risk;
Implementation of constraints on the use of internal
credit risk models; and
Revisions to operational risk.
In addition, the BCBS completed a review of the trading book
requirements in January 2016 with an effective
implementation date of 1 January 2019. The review of
Interest Rate Risk in the Banking Book (IRRBB) was
completed in April 2016, with the BCBS concluding that there
will be no requirement to include this risk in the regulatory
capital calculation. However, additional disclosure
requirements will be implemented from 1 January 2018.
In March 2017, APRA advised that finalisation of the trading
book requirements for Australian regulatory purposes is not
expected until early 2020, with implementation 12 months
after the regulations have been finalised.
Following finalisation by the BCBS, APRA is expected to
incorporate these issues with the implementation of the
revised regulatory capital framework by 2021.
Composition of Level 2 ADI Groups
In May 2014, APRA provided more clarity on the definition of
the Level 2 Banking Group. Subsidiary intermediate holding
companies are considered part of the Level 2 Group,
regardless of the nature of any activity undertaken by their
operating subsidiaries. As a result, capital benefits arising
from the debt issued by the Colonial Group are being phased
out. As at 30 June 2017 there is $665 million in debt still
subject to transitional relief, all of which matures in the next
12 months.
A number of intermediate holding companies within the
Colonial Group were consolidated into the Level 2 Banking
Group from 31 December 2016. This change had minimal
impact on the Group’s capital.
Conglomerate Groups
APRA is extending its prudential supervision framework to
Conglomerate Groups that have material operations in more
than one APRA regulated industry and/or have one or more
material unregulated entities. In March 2016, APRA advised
that it was deferring finalisation of the capital requirements
with respect to conglomerates until after the completion of
other domestic and international policy initiatives. Non-capital
related requirements, which include such items as
governance, risk exposures and intra group exposures, are
effective from 1 July 2017 and have no impact on the Group’s
capital.
(1)

Group Operations and Business Settings
24 Commonwealth Bank of Australia – Profit Announcement
Dividends
Final Dividend for the Year Ended 30 June 2017
The final dividend declared was $2.30 per share, bringing the
total dividend for the year ended 30 June 2017 to $4.29 per
share, an increase of 9 cents or 2% on the prior year. This
represents a dividend payout ratio (“cash basis”) of 75%.
The final dividend will be fully franked and will be paid on
29 September 2017 to owners of ordinary shares at the close
of business on 17 August 2017 (record date). Shares will be
quoted ex-dividend on 16 August 2017.
Full Year Dividend History (cents per share)
320334
364
401420 420 429
73.2% 75.8% 75.9% 75.1% 75.2% 76.5% 75.0%
0%
20%
40%
60%
80%
100%
120%
140%
160%
180%
200%
-50
50
150
250
350
450
550
Jun 11 Jun 12 Jun 13 Jun 14 Jun 15 Jun 16 Jun 17DPS Payout Ratio ("cash basis")
80%
Target Range
70%
(1) (1)
(1) Comparative information has been restated to conform to presentation in the current period.
Dividend Reinvestment Plan (DRP)
The DRP will continue to be offered to shareholders and this
period a 1.5% discount will be applied to shares allocated
under the plan for the final dividend. Eligibility requirements
for participation in the DRP are detailed on page 92.
Dividend Policy
The Group will seek to:
Pay cash dividends at strong and sustainable levels;
Target a full year payout ratio of 70% to 80%; and
Maximise the use of its franking account by paying fully
franked dividends.
__________________________________________________________________________________________________
Leverage Ratio
30 Jun 17 31 Dec 16 30 Jun 16 Jun 17 vs Jun 17 vs
Summary Group Leverage Ratio Dec 16 % Jun 16 %
Tier 1 Capital ($M) 52,684 50,218 48,553 5 9
Total Exposures ($M) (1) 1,027,958 1,018,931 980,846 1 5
Leverage Ratio (APRA) (%) 5. 1 4. 9 5. 0 20 bpts 10 bpts
Leverage Ratio (Internationally Comparable) (%) (2) 5. 8 5. 5 5. 6 30 bpts 20 bpts
As at
(1) Total exposures is the sum of on Balance Sheet exposures, derivatives, Securities Financing Transactions (SFTs), and off Balance Sheet exposures, net
of any Tier 1 regulatory deductions, as outlined in APS 110 “Capital Adequacy”.
(2) The Tier 1 Capital included in the calculation of the internationally comparable leverage ratio aligns with the 13 July 2015 APRA study titled “International capital comparison study”, and includes Basel III non-compliant Tier 1 instruments that are currently subject to transitional rules.
The Group’s leverage ratio, defined as Tier 1 Capital as a
percentage of total exposures, was 5.1% at 30 June 2017 on
an APRA basis and 5.8% on an internationally comparable
basis.
The ratio increased across both the June 2017 half and full
year, reflecting an increase in capital levels, partly offset by
growth in exposures.
The BCBS has advised that the leverage ratio will migrate to
a Pillar 1 minimum capital requirement of 3% from
1 January 2018. The BCBS will confirm the final calibration in
2017.
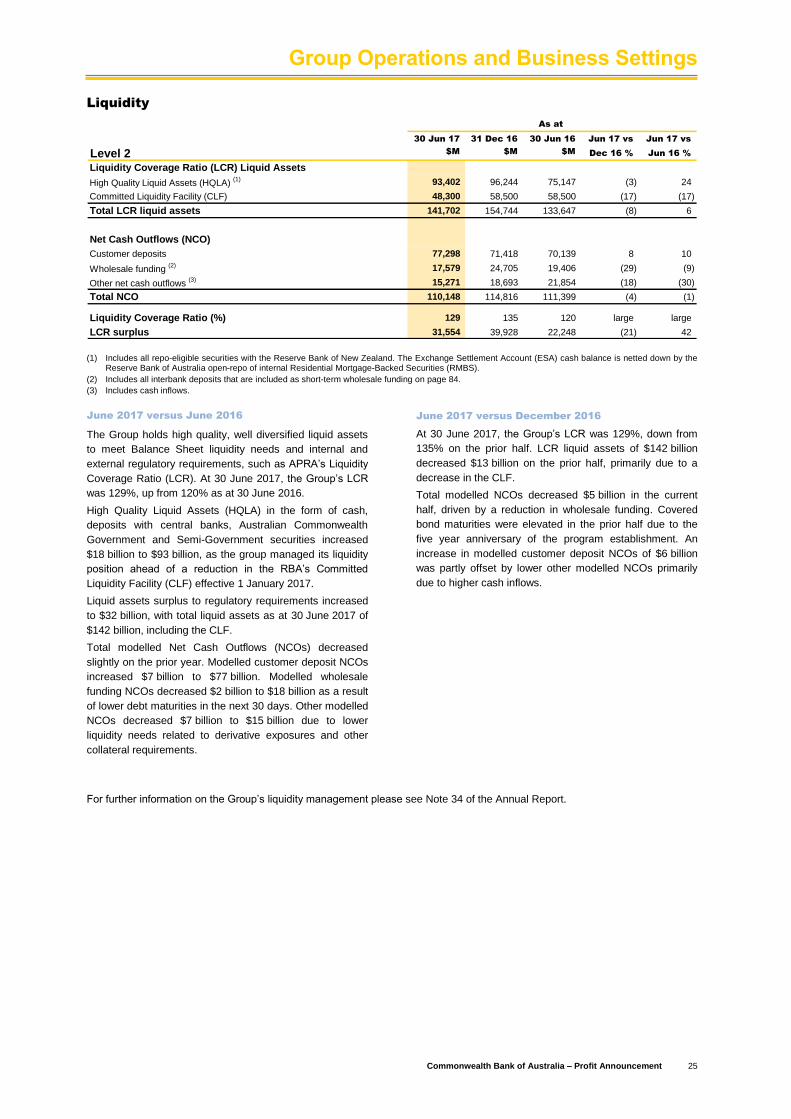
Group Operations and Business Settings
Commonwealth Bank of Australia – Profit Announcement 25
Liquidity
30 Jun 17 31 Dec 16 30 Jun 16 Jun 17 vs Jun 17 vs
Level 2 $M $M $M Dec 16 % Jun 16 %
Liquidity Coverage Ratio (LCR) Liquid Assets
High Quality Liquid Assets (HQLA) (1) 93,402 96,244 75,147 (3) 24
Committed Liquidity Facility (CLF) 48,300 58,500 58,500 (17) (17)
Total LCR liquid assets 141,702 154,744 133,647 (8) 6
Net Cash Outflows (NCO)
Customer deposits 77,298 71,418 70,139 8 10
Wholesale funding (2) 17,579 24,705 19,406 (29) (9)
Other net cash outflows (3) 15,271 18,693 21,854 (18) (30)
Total NCO 110,148 114,816 111,399 (4) (1)
Liquidity Coverage Ratio (%) 129 135 120 large large
LCR surplus 31,554 39,928 22,248 (21) 42
As at
(1) Includes all repo-eligible securities with the Reserve Bank of New Zealand. The Exchange Settlement Account (ESA) cash balance is netted down by the
Reserve Bank of Australia open-repo of internal Residential Mortgage-Backed Securities (RMBS).
(2) Includes all interbank deposits that are included as short-term wholesale funding on page 84.
(3) Includes cash inflows.
June 2017 versus June 2016
The Group holds high quality, well diversified liquid assets
to meet Balance Sheet liquidity needs and internal and
external regulatory requirements, such as APRA’s Liquidity
Coverage Ratio (LCR). At 30 June 2017, the Group’s LCR
was 129%, up from 120% as at 30 June 2016.
High Quality Liquid Assets (HQLA) in the form of cash,
deposits with central banks, Australian Commonwealth
Government and Semi-Government securities increased
$18 billion to $93 billion, as the group managed its liquidity
position ahead of a reduction in the RBA’s Committed
Liquidity Facility (CLF) effective 1 January 2017.
Liquid assets surplus to regulatory requirements increased
to $32 billion, with total liquid assets as at 30 June 2017 of
$142 billion, including the CLF.
Total modelled Net Cash Outflows (NCOs) decreased
slightly on the prior year. Modelled customer deposit NCOs
increased $7 billion to $77 billion. Modelled wholesale
funding NCOs decreased $2 billion to $18 billion as a result
of lower debt maturities in the next 30 days. Other modelled
NCOs decreased $7 billion to $15 billion due to lower
liquidity needs related to derivative exposures and other
collateral requirements.
June 2017 versus December 2016
At 30 June 2017, the Group’s LCR was 129%, down from
135% on the prior half. LCR liquid assets of $142 billion
decreased $13 billion on the prior half, primarily due to a
decrease in the CLF.
Total modelled NCOs decreased $5 billion in the current
half, driven by a reduction in wholesale funding. Covered
bond maturities were elevated in the prior half due to the
five year anniversary of the program establishment. An
increase in modelled customer deposit NCOs of $6 billion
was partly offset by lower other modelled NCOs primarily
due to higher cash inflows.
For further information on the Group’s liquidity management please see Note 34 of the Annual Report.

Group Operations and Business Settings
26 Commonwealth Bank of Australia – Profit Announcement
Funding
30 Jun 17 31 Dec 16 30 Jun 16 Jun 17 vs Jun 17 vs
Group Funding (1)
$M $M $M Dec 16 % Jun 16 %
Customer deposits 560,918 541,351 517,974 4 8
Short-term wholesale funding (2) 106,815 116,186 110,714 (8) (4)
Long-term wholesale funding - less than or equal to one year residual maturity 25,330 29,780 29,297 (15) (14)
Long-term wholesale funding - more than one year residual maturity (3) 131,950 126,062 118,121 5 12
IFRS MTM and derivative FX revaluations 1,150 1,489 4,149 (23) (72)
Total wholesale funding 265,245 273,517 262,281 (3) 1
Short-term collateral deposits (4) 6,135 9,813 8,323 (37) (26)
Total funding 832,298 824,681 788,578 1 6
As at
(1) Shareholders’ Equity is excluded from this view of funding sources.
(2) Short-term wholesale funding includes debt with an original maturity or call date of less than or equal to 12 months, and consists of certificates of deposit and bank acceptances, debt issued under the EMTN program and the domestic, Euro and US commercial paper programs of Commonwealth Bank of Australia and ASB. Short-term wholesale funding also includes deposits from banks and central banks as well as net repurchase agreements.
(3) Long-term wholesale funding includes debt with an original maturity or call date of greater than 12 months.
(4) Short-term collateral deposits includes net collateral received and the amount of internal RMBS pledged with the Reserve Bank to facilitate intra-day cash flows in the ESA.
June 2017 versus June 2016
Customer Deposits
Customer deposits accounted for 67% of total funding at
30 June 2017, compared to 66% in the prior year. Strong
deposit growth has seen the Group satisfy a significant
proportion of its funding requirements from retail, business
and institutional customer deposits.
Short-Term Wholesale Funding
Short-term wholesale funding accounted for 40% of total
wholesale funding at 30 June 2017, compared to 42% in the
prior year. Short-term wholesale funding decreased 4% given
strong customer funding growth and long term wholesale
funding.
Long-Term Wholesale Funding
Long-term wholesale funding (including an adjustment for
IFRS MTM and derivative FX revaluations) accounted for
60% of total wholesale funding at 30 June 2017, compared to
58% in the prior year.
During the period, the Group raised $43 billion of long-term
wholesale funding in multiple currencies including AUD, USD,
EUR and GBP. The cost of new long-term wholesale funding
decreased compared to the prior year given favourable global
credit market conditions.
Most issuance was in senior unsecured format, although the
Group used its covered bond and RMBS programs to provide
cost, tenor and diversification benefits. The Group also issued
Basel III compliant Tier 2 capital deals in the Japanese, US
and Hong Kong markets.
The Weighted Average Maturity (WAM) of new long-term
wholesale debt issued in the year to June 2017 was
5.2 years. The WAM of outstanding long-term wholesale debt
with a residual maturity greater than 12 months was 4.1 years
at 30 June 2017.
Improvement in the mix and tenor of funding has assisted the
Group in preparing for the Net Stable Funding Ratio which
applies from 1 January 2018.
Short-Term Collateral Deposits
Net collateral received decreased $2 billion largely due to the
impact of the stronger Australian dollar.
June 2017 versus December 2016
Customer Deposits
Customer deposits accounted for 67% of total funding at
30 June 2017, in line with the prior half. Strong deposit growth
has seen the Group satisfy a significant proportion of its
funding requirements from retail, business and institutional
customer deposits.
Short-Term Wholesale Funding
Short-term wholesale funding accounted for 40% of total
wholesale funding at 30 June 2017, compared to 42% in the
prior half. Short-term wholesale funding decreased 8% given
strong customer funding growth and long term wholesale
funding.
Long-Term Wholesale Funding
Long-term wholesale funding (including an adjustment for
IFRS MTM and derivative FX revaluations) accounted for
60% of total wholesale funding at 30 June 2017, compared to
58% in the prior half.
During the half, the Group raised $22 billion of long-term
wholesale funding. The cost of new long-term funding
improved marginally on the prior half as markets shrugged off
any potential negative sentiment associated with geopolitical
developments, unwinding of monetary stimulus and higher
global bond yields.
The WAM of new long-term wholesale debt issued in the
six months to June 2017 was 4.5 years.
Improvement in the mix and tenor of funding has assisted the
Group in preparing for the Net Stable Funding Ratio which
applies from 1 January 2018.
Short-Term Collateral Deposits
Net collateral received decreased $4 billion, largely due to the
impact of the stronger Australian dollar.
For further information on Funding risk, please refer to
Appendix 14.

Commonwealth Bank of Australia – Profit Announcement 27
Contents
Section 5 – Divisional Performance
Retail Banking Services 28
Business and Private Banking 30
Institutional Banking and Markets 32
Wealth Management 34
New Zealand 38
Bankwest 42
IFS and Other 44
Investment Experience 47
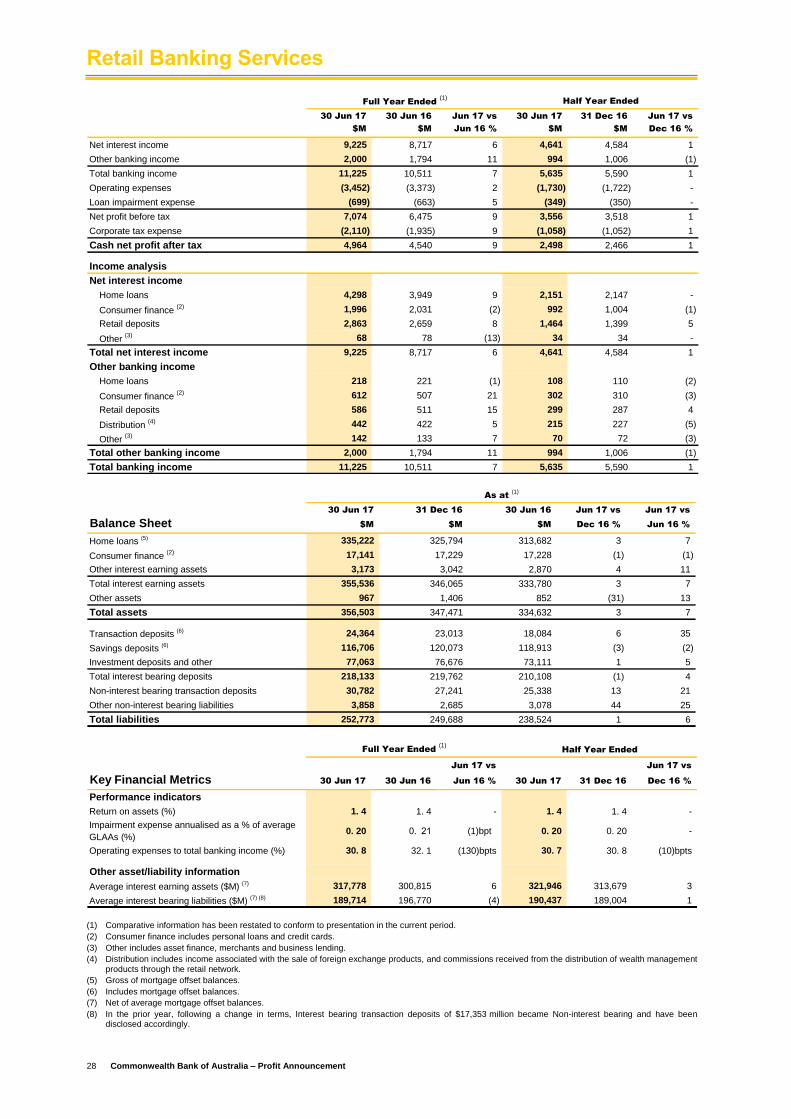
Retail Banking Services
28 Commonwealth Bank of Australia – Profit Announcement
30 Jun 17 30 Jun 16 Jun 17 vs 30 Jun 17 31 Dec 16 Jun 17 vs
$M $M Jun 16 % $M $M Dec 16 %
Net interest income 9,225 8,717 6 4,641 4,584 1
Other banking income 2,000 1,794 11 994 1,006 (1)
Total banking income 11,225 10,511 7 5,635 5,590 1
Operating expenses (3,452) (3,373) 2 (1,730) (1,722) -
Loan impairment expense (699) (663) 5 (349) (350) -
Net profit before tax 7,074 6,475 9 3,556 3,518 1
Corporate tax expense (2,110) (1,935) 9 (1,058) (1,052) 1
Cash net profit after tax 4,964 4,540 9 2,498 2,466 1
Income analysis
Net interest income
Home loans 4,298 3,949 9 2,151 2,147 -
Consumer finance (2) 1,996 2,031 (2) 992 1,004 (1)
Retail deposits 2,863 2,659 8 1,464 1,399 5
Other (3) 68 78 (13) 34 34 -
Total net interest income 9,225 8,717 6 4,641 4,584 1
Other banking income
Home loans 218 221 (1) 108 110 (2)
Consumer finance (2) 612 507 21 302 310 (3)
Retail deposits 586 511 15 299 287 4
Distribution (4) 442 422 5 215 227 (5)
Other (3) 142 133 7 70 72 (3)
Total other banking income 2,000 1,794 11 994 1,006 (1)
Total banking income 11,225 10,511 7 5,635 5,590 1
Full Year Ended (1)
Half Year Ended
30 Jun 17 31 Dec 16 30 Jun 16 Jun 17 vs Jun 17 vs
Balance Sheet $M $M $M Dec 16 % Jun 16 %
Home loans (5) 335,222 325,794 313,682 3 7
Consumer finance (2) 17,141 17,229 17,228 (1) (1)
Other interest earning assets 3,173 3,042 2,870 4 11
Total interest earning assets 355,536 346,065 333,780 3 7
Other assets 967 1,406 852 (31) 13
Total assets 356,503 347,471 334,632 3 7
Transaction deposits (6) 24,364 23,013 18,084 6 35
Savings deposits (6) 116,706 120,073 118,913 (3) (2)
Investment deposits and other 77,063 76,676 73,111 1 5
Total interest bearing deposits 218,133 219,762 210,108 (1) 4
Non-interest bearing transaction deposits 30,782 27,241 25,338 13 21
Other non-interest bearing liabilities 3,858 2,685 3,078 44 25
Total liabilities 252,773 249,688 238,524 1 6
As at (1)
Jun 17 vs Jun 17 vs
Key Financial Metrics 30 Jun 17 30 Jun 16 Jun 16 % 30 Jun 17 31 Dec 16 Dec 16 %
Performance indicators
Return on assets (%) 1. 4 1. 4 - 1. 4 1. 4 -
Impairment expense annualised as a % of average
GLAAs (%)0. 20 0. 21 (1)bpt 0. 20 0. 20 -
Operating expenses to total banking income (%) 30. 8 32. 1 (130)bpts 30. 7 30. 8 (10)bpts
Other asset/liability information
Average interest earning assets ($M) (7) 317,778 300,815 6 321,946 313,679 3
Average interest bearing liabilities ($M) (7) (8) 189,714 196,770 (4) 190,437 189,004 1
Full Year Ended (1)
Half Year Ended
(1) Comparative information has been restated to conform to presentation in the current period.
(2) Consumer finance includes personal loans and credit cards.
(3) Other includes asset finance, merchants and business lending.
(4) Distribution includes income associated with the sale of foreign exchange products, and commissions received from the distribution of wealth management products through the retail network.
(5) Gross of mortgage offset balances.
(6) Includes mortgage offset balances.
(7) Net of average mortgage offset balances.
(8) In the prior year, following a change in terms, Interest bearing transaction deposits of $17,353 million became Non-interest bearing and have been disclosed accordingly.

Retail Banking Services
Commonwealth Bank of Australia – Profit Announcement 29
Financial Performance and Business Review
Year Ended June 2017 versus June 2016
Retail Banking Services cash net profit after tax for the full
year ended 30 June 2017 was $4,964 million, an increase of
9% on the prior year. The result was driven by strong growth
in total banking income, partly offset by higher expenses and
increased loan impairment expense. As at June 2017, the
Retail bank ranked number one in customer satisfaction
amongst its peers(1)
.
Net Interest Income
Net interest income was $9,225 million, an increase of 6% on
the prior year. This reflected strong balance growth in home
lending and deposits, and stable net interest margin.
Balance Sheet growth included:
Home loan growth of 7%; and
Total deposit balance growth of 6%, resulting from
strong growth in transaction and investment accounts;
partly offset by
Consumer finance balance decrease of 1%, broadly in
line with system.
Net interest margin was stable, reflecting:
Strong competition in home loans and investment
deposits;
Higher funding costs; and
Unfavourable portfolio mix; offset by
Pricing changes in home loans and deposits.
Other Banking Income
Other banking income was $2,000 million, an increase of 11%
on the prior year, reflecting:
Higher consumer finance income, driven by higher
purchases, lower loyalty costs, and increased foreign
exchange income;
An increase in deposit fee income from higher
transaction volumes; and
Higher distribution income resulting from increased
foreign exchange transactions.
Operating Expenses
Operating expenses were $3,452 million, an increase of 2%
on the prior year. The key drivers were higher staff costs,
increased volume-related expenses and ongoing investment
in technology and digital capabilities, partly offset by the
benefit of productivity savings.
The operating expense to total banking income ratio was
30.8%, a decrease of 130 basis points on the prior year.
Loan Impairment Expense
Loan impairment expense was $699 million, an increase of
5% on the prior year. The increase was driven by higher
arrears and losses for home loans and consumer finance,
predominantly in Western Australia and Queensland.
Half Year Ended June 2017 versus December 2016
Cash net profit after tax for the half year ended 30 June 2017
was $2,498 million, an increase of 1% on the prior half. The
result was driven by higher total banking income, and flat
operating and loan impairment expenses.
Net Interest Income
Net interest income increased 1% on the prior half, reflecting
solid balance growth in home lending and deposits, and
higher net interest margin, partly offset by three fewer
calendar days than the prior half.
Balance Sheet growth included:
Home loan growth of 3%; and
Total deposit balance growth of 1%, with strong growth
in transaction accounts; partly offset by
Consumer finance balance decrease of 1%, broadly in
line with system.
Net interest margin improved, reflecting higher deposit margin
and stable lending margin, partly offset by unfavourable
portfolio mix.
Other Banking Income
Other banking income decreased 1% on the prior half,
reflecting:
Lower consumer finance income, driven by seasonally
lower purchases and higher loyalty costs; and
Lower distribution income, driven by decreased foreign
exchange transactions; partly offset by
Higher deposit fee income from higher transaction
volumes.
Operating Expenses
Operating expenses were flat on the prior half, with lower
amortisation, seasonally lower volume-related expenses, and
benefits from productivity initiatives, offset by continued
investment in technology and digital capabilities.
The operating expense to total banking income ratio was
30.7%, a decrease of 10 basis points on the prior half.
Loan Impairment Expense
Loan impairment expense was flat on the prior half, with
higher consumer finance arrears due to expected seasonal
trends, offset by lower home loan losses.
(1) Roy Morgan Research, Retail Main Financial Institution (MFI) Customer Satisfaction, Australians 14+, % “Very Satisfied” or “Fairly Satisfied” with relationship with that MFI. Six month rolling average to June 2017. Rank based on the major four Australian banks.

Business and Private Banking
30 Commonwealth Bank of Australia – Profit Announcement
30 Jun 17 30 Jun 16 Jun 17 vs 30 Jun 17 31 Dec 16 Jun 17 vs
$M $M Jun 16 % $M $M Dec 16 %
Net interest income 3,044 3,001 1 1,531 1,513 1
Other banking income 925 839 10 467 458 2
Total banking income 3,969 3,840 3 1,998 1,971 1
Operating expenses (1,551) (1,488) 4 (776) (775) -
Loan impairment expense (74) (176) (58) (10) (64) (84)
Net profit before tax 2,344 2,176 8 1,212 1,132 7
Corporate tax expense (705) (654) 8 (364) (341) 7
Cash net profit after tax 1,639 1,522 8 848 791 7
Income analysis
Net interest income
Corporate Financial Services 1,093 1,107 (1) 545 548 (1)
Business Banking SME 912 899 1 459 453 1
Regional and Agribusiness 562 544 3 281 281 -
Private Bank 317 303 5 164 153 7
CommSec 160 148 8 82 78 5
Total net interest income 3,044 3,001 1 1,531 1,513 1
Other banking income
Corporate Financial Services 368 305 21 187 181 3
Business Banking SME 182 172 6 91 91 -
Regional and Agribusiness 100 91 10 51 49 4
Private Bank 67 61 10 34 33 3
CommSec 208 210 (1) 104 104 -
Total other banking income 925 839 10 467 458 2
Total banking income 3,969 3,840 3 1,998 1,971 1
Income by product
Business products 2,329 2,243 4 1,171 1,158 1
Retail products 1,143 1,061 8 587 556 6
Equities and Margin Lending 308 329 (6) 153 155 (1)
Markets 131 138 (5) 62 69 (10)
Other 58 69 (16) 25 33 (24)
Total banking income 3,969 3,840 3 1,998 1,971 1
Full Year Ended (1)
Half Year Ended
30 Jun 17 31 Dec 16 30 Jun 16 Jun 17 vs Jun 17 vs
Balance Sheet $M $M $M Dec 16 % Jun 16 %
Home loans (2) 33,686 32,661 31,987 3 5
Consumer finance 603 643 630 (6) (4)
Business loans (3) 69,356 68,249 65,446 2 6
Margin loans 2,556 2,575 2,697 (1) (5)
Total interest earning assets 106,201 104,128 100,760 2 5
Non-lending interest earning assets 286 290 238 (1) 20
Other assets (4) 485 136 454 large 7
Total assets 106,972 104,554 101,452 2 5
Transaction deposits (3) (5) 14,535 12,714 12,024 14 21
Savings deposits (5) 33,504 32,409 30,812 3 9
Investment deposits and other 27,000 27,397 25,773 (1) 5
Total interest bearing deposits 75,039 72,520 68,609 3 9
Non-interest bearing transaction deposits 7,592 7,300 6,738 4 13
Other non-interest bearing liabilities 868 552 834 57 4
Total liabilities 83,499 80,372 76,181 4 10
As at (1)
(1) Comparative information has been restated to conform to presentation in the current period.
(2) Gross of mortgage offset balances.
(3) Business loans include $301 million of Cash Management Pooling Facilities (CMPF) (31 December 2016: $248 million; 30 June 2016: $281 million). Transaction Deposits include $916 million of CMPF liabilities (31 December 2016: $808 million; 30 June 2016: $778 million). These balances are required to be grossed up under accounting standards, but are netted for the calculation of customer interest and risk weighted assets.
(4) Other assets include Intangible assets.
(5) Includes mortgage offset balances.

Business and Private Banking
Commonwealth Bank of Australia – Profit Announcement 31
Jun 17 vs Jun 17 vs
Key Financial Metrics 30 Jun 17 30 Jun 16 Jun 16 % 30 Jun 17 31 Dec 16 Dec 16 %
Performance indicators
Return on assets (%) 1. 5 1. 5 - 1. 6 1. 5 10 bpts
Impairment expense annualised as a % of average GLAAs (%) 0. 07 0. 18 (11)bpts 0. 02 0. 12 (10)bpts
Operating expenses to total banking income (%) 39. 1 38. 8 30 bpts 38. 8 39. 3 (50)bpts
Other asset/liability information
Average interest earning assets ($M) (2) 100,008 94,187 6 100,746 99,282 1
Average interest bearing liabilities ($M) (2) (3) 69,854 64,270 9 71,283 68,450 4
Full Year Ended (1)
Half Year Ended
(1) Comparative information has been restated to conform to presentation in the current period.
(2) Net of average mortgage offset balances.
(3) In the prior year, following a change in terms, Interest bearing transaction deposits of $961 million became Non-interest bearing and have been disclosed accordingly.
Financial Performance and Business Review
Year Ended June 2017 versus June 2016
Business and Private Banking cash net profit after tax for the
full year ended 30 June 2017 was $1,639 million, an increase
of 8% on the prior year. The result was driven by growth in
total banking income and lower loan impairment expense,
partly offset by higher expenses.
Net Interest Income
Net interest income was $3,044 million, an increase of 1% on
the prior year. This was driven by strong balance growth,
partly offset by lower net interest margins.
Balance Sheet growth included:
Deposit growth of 10%, reflecting strong demand for
transaction and saving deposits;
Business lending growth of 6%, with growth diversified
across target industries; and
Home loan growth of 5%, driven by growth in owner
occupied loans.
Net interest margin decreased, reflecting lower business
lending margins due to competitive pricing pressure and a
mix shift towards products with a higher relative proportion of
fee income.
Other Banking Income
Other banking income was $925 million, an increase of 10%
on the prior year, reflecting:
Higher business lending fee income; partly offset by
Lower income from the sale of foreign exchange risk
management products.
Operating Expenses
Operating expenses were $1,551 million, an increase of 4%
on the prior year, reflecting investment in frontline staff and
product development initiatives.
Loan Impairment Expense
Loan impairment expense was $74 million, a decrease of
$102 million on the prior year. The decrease was driven by
lower individual and collective provisions, partly offset by a
lower level of write-backs.
Loan impairment expense as a percentage of average gross
loans and acceptances decreased by 11 basis points to
7 basis points.
Half Year Ended June 2017 versus December 2016
Cash net profit after tax for the half year ended 30 June 2017
was $848 million, an increase of 7% on the prior half. The
result was driven by growth in total banking income and a
lower loan impairment expense.
Net Interest Income
Net interest income increased 1% on the prior half, reflecting
higher margins and subdued balance growth, partly offset by
three fewer calendar days than the prior half.
Balance Sheet growth included:
Deposit growth of 4%, reflecting demand for transaction
and saving deposits;
Home loan growth of 3%; and
Business lending growth of 2%.
Net interest margin increased due to higher margins on
deposits and home lending, partly offset by continued
decrease in business lending margins due to diversification,
competitive pricing pressure and a mix shift towards fee-
based products.
Other Banking Income
Other banking income increased 2% on the prior half
reflecting:
Higher business lending fee income; partly offset by
Lower income from the sale of interest rate risk
management products.
Operating Expenses
Operating expenses remained flat on the prior half, driven by
investment in frontline staff and product development
initiatives, offset by lower amortisation.
Loan Impairment Expense
Loan impairment expense was $10 million, a reduction of
$54 million on the prior half reflecting lower collective
provisions.

Institutional Banking and Markets
32 Commonwealth Bank of Australia – Profit Announcement
30 Jun 17 30 Jun 16 Jun 17 vs 30 Jun 17 31 Dec 16 Jun 17 vs
$M $M Jun 16 % $M $M Dec 16 %
Net interest income 1,507 1,617 (7) 746 761 (2)
Other banking income 1,347 1,276 6 623 724 (14)
Total banking income 2,854 2,893 (1) 1,369 1,485 (8)
Operating expenses (1,072) (1,082) (1) (527) (545) (3)
Loan impairment expense (64) (252) (75) (20) (44) (55)
Net profit before tax 1,718 1,559 10 822 896 (8)
Corporate tax expense (412) (369) 12 (199) (213) (7)
Cash net profit after tax 1,306 1,190 10 623 683 (9)
Income analysis
Net interest income
Institutional Banking 1,384 1,441 (4) 692 692 -
Markets 123 176 (30) 54 69 (22)
Total net interest income 1,507 1,617 (7) 746 761 (2)
Other banking income
Institutional Banking 745 747 - 345 400 (14)
Markets 602 529 14 278 324 (14)
Total other banking income 1,347 1,276 6 623 724 (14)
Total banking income 2,854 2,893 (1) 1,369 1,485 (8)
Income by product
Institutional products 1,770 1,836 (4) 879 891 (1)
Asset leasing 284 287 (1) 126 158 (20)
Markets 720 776 (7) 301 419 (28)
Other 75 65 15 32 43 (26)
Total banking income excluding derivative
valuation adjustments2,849 2,964 (4) 1,338 1,511 (11)
Derivative valuation adjustments 5 (71) large 31 (26) large
Total banking income 2,854 2,893 (1) 1,369 1,485 (8)
Full Year Ended (1)
Half Year Ended
30 Jun 17 31 Dec 16 30 Jun 16 Jun 17 vs Jun 17 vs
Balance Sheet $M $M $M Dec 16 % Jun 16 %
Interest earning lending assets (2) 111,809 109,755 112,432 2 (1)
Non-lending interest earning assets 31,349 29,152 27,594 8 14
Other assets (3) 30,076 38,718 41,226 (22) (27)
Total assets 173,234 177,625 181,252 (2) (4)
Transaction deposits (2) 42,293 40,136 41,382 5 2
Savings deposits 7,371 4,115 6,350 79 16
Investment deposits 49,639 45,457 39,371 9 26
Certificates of deposit and other 15,070 14,290 14,435 5 4
Total interest bearing deposits 114,373 103,998 101,538 10 13
Due to other financial institutions 16,669 15,477 15,610 8 7
Debt issues and other (4) 9,358 8,458 9,064 11 3
Non-interest bearing liabilities (3) 21,407 27,120 28,307 (21) (24)
Total liabilities 161,807 155,053 154,519 4 5
As at (1)
Jun 17 vs Jun 17 vs
Key Financial Metrics 30 Jun 17 30 Jun 16 Jun 16 % 30 Jun 17 31 Dec 16 Dec 16 %
Performance indicators
Return on assets (%) 0. 7 0. 7 - 0. 7 0. 8 (10)bpts
Impairment expense annualised as a % of average
GLAAs (%)0. 06 0. 23 (17)bpts 0. 04 0. 08 (4)bpts
Operating expenses to total banking income (%) 37. 6 37. 4 20 bpts 38. 5 36. 7 180 bpts
Other asset/liability information
Average interest earning assets ($M) 138,788 136,845 1 139,183 138,398 1
Average interest bearing liabilities ($M) 129,443 120,209 8 134,593 124,377 8
Full Year Ended (1)
Half Year Ended
(1) Comparative information has been restated to conform to presentation in the current period.
(2) Interest earning lending assets include $21,260 million of Cash Management Pooling Facilities (CMPF) (31 Dec 2016: $20,036 million; 30 June 2016: $23,743 million). Transaction Deposits include $26,818 million of CMPF liabilities (31 Dec 2016: $25,744 million; 30 June 2016: $29,319 million). These balances are required to be grossed up under accounting standards, but are netted for the calculation of customer interest and risk weighted assets.
(3) Other assets include Intangible assets and Derivative assets. Non-interest bearing liabilities include Derivative liabilities.
(4) Debt issues and other includes Bank acceptances and Liabilities at fair value.

Institutional Banking and Markets
Commonwealth Bank of Australia – Profit Announcement 33
Financial Performance and Business Review
Year Ended June 2017 versus June 2016
Institutional Banking and Markets cash net profit after tax for
the full year ended 30 June 2017 was $1,306 million, an
increase of 10% on the prior year. The result was driven by
strong growth in deposit volumes, active management of the
lending portfolio, lower losses from derivative valuation
adjustments, and lower loan impairment expense.
Net Interest Income
Net interest income was $1,507 million, a decrease of 7% on
the prior year. This was driven by lower lending margins,
partly offset by strong growth in average deposit volumes.
Average balance growth included:
Flat average lending balances; and
22% growth in average transaction deposit volumes
excluding pooling facilities, and 22% growth in average
investment deposit volumes.
Net interest margin decreased, reflecting:
Lower lending margins driven by competition; partly offset
by
Favourable portfolio mix from higher deposit balances.
Other Banking Income
Other banking income was $1,347 million, an increase of 6%
on the prior year, reflecting:
Favourable derivative valuation adjustments of $5 million,
compared to a $71 million unfavourable adjustment in
the prior year; partly offset by
Lower lending fee income due to competitive pressures;
Weaker Markets sales performance due to lower volatility
in the second half; and
Timing of realised gains and losses on sale of assets.
Operating Expenses
Operating expenses were $1,072 million, a decrease of 1%
on the prior year, driven by ongoing realisation of productivity
benefits, partly offset by higher risk and compliance costs.
Loan Impairment Expense
Loan impairment expense was $64 million, a decrease of
$188 million on the prior year. The decrease was driven by
lower collective provisions and fewer large individual
provisions.
Loan impairment expense as a percentage of average gross
loans and acceptances decreased by 17 basis points to
6 basis points.
Corporate Tax Expense
The corporate tax expense was $412 million. The effective
tax rate of 24.0% was largely in line with the prior year.
Half Year Ended June 2017 versus December 2016
Cash net profit after tax for the half year ended 30 June 2017
was $623 million, a decrease of 9% on the prior half. The
result was driven by lower Institutional Banking fee revenue
and lower Markets revenue, partly offset by lower operating
expenses and lower loan impairment expense.
Net Interest Income
Net interest income decreased 2% on the prior half, reflecting
lower margins, partly offset by higher average lending and
deposit balances.
Average balance growth included:
2% growth in average lending balances; and
Higher average deposit balances, particularly in
transaction and investment deposits.
Net interest margin decreased, reflecting:
Lower leasing margins and Markets performance; partly
offset by
Active management of lending portfolio.
Other Banking Income
Other banking income decreased 14% on the prior half,
reflecting:
Weaker Markets sales and trading performance,
particularly in Fixed Income & Rates; and
Lower lending fees in Institutional Banking; partly offset
by
Favourable derivative valuation adjustments of
$31 million, compared to unfavourable adjustments of
$26 million in the prior half.
Operating Expenses
Operating expenses decreased 3% on the prior half. The
decrease was driven by the ongoing realisation of productivity
benefits, and lower amortisation.
Loan Impairment Expense
Loan impairment expense was $20 million, a decrease of
$24 million on the prior half reflecting lower individual
provisions.
Corporate Tax Expense
The corporate tax expense was $199 million. The effective
tax rate of 24.2% was largely in line with the prior half.

Wealth Management
34 Commonwealth Bank of Australia – Profit Announcement
30 Jun 17 30 Jun 16 Jun 17 vs 30 Jun 17 31 Dec 16 Jun 17 vs
$M $M Jun 16 % $M $M Dec 16 %
Funds management income 1,894 1,891 - 961 933 3
Insurance income 438 502 (13) 218 220 (1)
Total operating income 2,332 2,393 (3) 1,179 1,153 2
Operating expenses (1,653) (1,681) (2) (806) (847) (5)
Net profit before tax 679 712 (5) 373 306 22
Corporate tax expense (176) (183) (4) (96) (80) 20
Underlying profit after tax 503 529 (5) 277 226 23
Investment experience after tax 54 83 (35) 31 23 35
Non-controlling interests (2) (4) - large (4) - large
Cash net profit after tax 553 612 (10) 304 249 22
Represented by:
CFS Global Asset Management 229 224 2 104 125 (17)
Colonial First State (3) 191 230 (17) 99 92 8
CommInsure 202 274 (26) 96 106 (9)
Other (69) (116) (41) 5 (74) large
Cash net profit after tax 553 612 (10) 304 249 22
Full Year Ended (1)
Half Year Ended
Full Year Ended (1)
Jun 17 vs Jun 17 vs
Key Financial Metrics 30 Jun 17 30 Jun 16 Jun 16 % 30 Jun 17 31 Dec 16 Dec 16 %
Performance indicators
Operating expenses to total operating income (%) 70. 9 70. 2 70 bpts 68. 4 73. 5 large
FUA - average ($M) 141,005 134,233 5 143,838 138,146 4
FUA - spot ($M) 146,778 135,801 8 146,778 140,820 4
AUM - average ($M) (4) 205,910 197,569 4 209,469 201,967 4
AUM - spot ($M) (4) 219,427 199,735 10 219,427 203,223 8
Annual Inforce Premiums - average ($M) 2,465 2,474 - 2,432 2,505 (3)
Annual Inforce Premiums - spot ($M) 2,352 2,508 (6) 2,352 2,520 (7)
Half Year Ended
First State (3)
Jun 17 Jun 16 Jun 17 vs Jun 17 Jun 16 Jun 17 vs Jun 17 Jun 16 Jun 17 vs Jun 17 Jun 16 Jun 17 vs
$M $M Jun 16 % $M $M Jun 16 % $M $M Jun 16 % $M $M Jun 16 %
Funds management income 837 842 (1) 928 929 - 121 120 1 8 - large
Insurance income - - - - - - 438 502 (13) - - -
Total operating income 837 842 (1) 928 929 - 559 622 (10) 8 - large
Operating expenses (521) (572) (9) (668) (609) 10 (323) (339) (5) (141) (161) (12)
Net profit before tax 316 270 17 260 320 (19) 236 283 (17) (133) (161) (17)
Corporate tax (expense)/benefit (81) (49) 65 (78) (99) (21) (71) (80) (11) 54 45 20
Underlying profit after tax 235 221 6 182 221 (18) 165 203 (19) (79) (116) (32)
Investment experience after tax (6) 3 large 9 9 - 41 71 (42) 10 - large
Non-controlling interests (2) - - - - - - (4) - large - - -
Cash net profit/(loss) after tax 229 224 2 191 230 (17) 202 274 (26) (69) (116) (41)
Other
Full Year Ended (1)
CFS Colonial
Global Asset Management CommInsure
(1) Comparative information has been restated to conform to presentation in the current period.
(2) Relates to net profit attributable to non-controlling interests in a partly held infrastructure business.
(3) Colonial First State incorporates the results of all Wealth Management financial planning businesses.
(4) AUM excludes the Group’s interest in the First State Cinda Fund Management Company Limited.
Wealth Management
Commonwealth Bank of Australia – Profit Announcement 35
Financial Performance and Business Review
Year Ended June 2017 versus June 2016
Wealth Management cash net profit after tax for the full year
ended 30 June 2017 was $553 million, a decrease of 10% on
the prior year. The result was driven by lower insurance
income and lower investment experience, partly offset by
lower operating expenses. Insurance income declined 13%,
with growth in general insurance offset by a lower income
protection result in life insurance.
Funds Management Income
Funds management income was $1,894 million, flat on the
prior year.
Average Assets Under Management (AUM) increased 4% to
$206 billion reflecting strong investment markets, partly offset
by the impact of the higher Australian dollar. Investment
performance remained strong with 78% of CFS GAM assets
outperforming their three year benchmark. Emerging market
equities were impacted by higher net outflows with offsetting
strong inflows into fixed income investments. The
infrastructure business continued to grow, driven by the
acquisition of new investments. AUM margins declined over
the year due to continued investment mix shift to lower
margin products.
Average Funds Under Administration (FUA) increased 5% to
$141 billion. The FirstChoice and CFSWrap platforms
experienced continued growth in average FUA of 6% and
14% respectively, reflecting positive net flows and solid
investment markets. CFSWrap experienced positive net flows
as a result of new clients and superannuation legislation
changes. FUA margins declined as a result of increased
provisioning for Advice customer remediation costs, while
platform margins declined with a trend towards lower margin
products.
Insurance Income
Insurance income was $438 million, a 13% decrease on the
prior year. Wholesale life insurance income increased
reflecting lower claims and the benefit from member growth,
partly offset by the loss of some schemes resulting in a
decrease in inforce premiums.
Retail life income decreased significantly due to higher claims
resulting in loss recognition of $143 million in income
protection during the year, an increase of $78 million on the
prior year. Lower sales further contributed to the result.
General insurance income increased 9% on the prior year
due to growth in inforce premiums reflecting higher renewals,
partly offset by higher weather event claims.
Operating Expenses
Operating expenses were $1,653 million, a decrease of 2%
on the prior year. This was driven by ongoing productivity
initiatives, one-off provision releases and the favourable
impact of the higher Australian dollar, partly offset by
investment in technology and remediation program costs.
Investment Experience
Investment experience after tax decreased 35%, driven by a
favourable impact in the prior year from annual economic
assumption changes relating to the insurance business.
Half Year Ended June 2017 versus December 2016
Cash net profit after tax for the half year ended 30 June 2017
was $304 million, an increase of 22% on the prior half. The
result was driven by growth in funds management income,
lower operating expenses and higher investment experience,
partly offset by a 1% decline in insurance income.
Funds Management Income
Funds management income increased 3% on the prior half.
Average AUM increased 4%, reflecting strong investment
markets, positive net flows mainly in the infrastructure
business and fixed income investments, partly offset by the
impact of the higher Australian dollar. AUM margins
continued to decline due to investment mix shift to lower
margin products.
Average FUA increased 4% on the prior half driven by
continued positive net flows in FirstChoice and CFSWrap
platforms supported by strong investment markets. FUA
margins improved on the prior half due to lower Advice
customer remediation costs, partly offset by a decline in
platform margins.
Insurance Income
Insurance income decreased 1% on the prior half due to
significantly lower general insurance income, partly offset by
a stronger life insurance result.
Wholesale life results improved on the prior half due to claims
experience.
Retail life income improved as the loss recognition on income
protection of $53 million was $37 million lower than the prior
half. Lapse rates have remained flat through the half.
General insurance income declined significantly as a result of
higher weather event claims in the half. Inforce premiums
grew 2% on the prior half.
Operating Expenses
Operating expenses decreased 5% reflecting continued focus
on productivity, one-off provision releases and the higher
Australian dollar, partly offset by higher remediation program
costs.
Investment Experience
Investment experience after tax increased 35% on the prior
half due to higher returns on shareholder investments, partly
offset by changes to annual economic assumptions relating to
the insurance business.

Wealth Management
36 Commonwealth Bank of Australia – Profit Announcement
Assets Under 30 Jun 16 Inflows Outflows Net Flows Other (2)
30 Jun 17 31 Dec 16 Jun 17 vs Jun 17 vs
Management (AUM) (1)$M $M $M $M $M $M $M Jun 16 % Dec 16 %
Australian equities 27,240 9,866 (9,911) (45) 2,837 30,032 29,249 10 3
Global equities 90,900 18,277 (23,928) (5,651) 9,339 94,588 90,074 4 5
Fixed income (3) 74,670 58,426 (48,498) 9,928 1,943 86,541 76,479 16 13
Infrastructure 6,925 2,012 (806) 1,206 135 8,266 7,421 19 11
Total 199,735 88,581 (83,143) 5,438 14,254 219,427 203,223 10 8
Full Year Ended
Funds Under 30 Jun 16 Inflows Outflows Net Flows Other (2)
30 Jun 17 31 Dec 16 Jun 17 vs Jun 17 vs
Administration (FUA) $M $M $M $M $M $M $M Jun 16 % Dec 16 %
FirstChoice 75,694 16,234 (15,409) 825 5,863 82,382 79,104 9 4
CFSWrap (5) 22,890 8,333 (5,684) 2,649 2,208 27,747 25,197 21 10
CFS Non-Platform 15,054 8,752 (8,227) 525 172 15,751 15,171 5 4
CommInsure Investments 12,272 533 (1,944) (1,411) 470 11,331 11,867 (8) (5)
Other 9,891 1,417 (1,290) 127 (451) 9,567 9,481 (3) 1
Total 135,801 35,269 (32,554) 2,715 8,262 146,778 140,820 8 4
Full Year Ended (4)
30 Jun 16 Sales Lapses Net Flows Other 30 Jun 17 31 Dec 16 Jun 17 vs Jun 17 vs
Insurance Inforce $M $M $M $M $M $M $M Jun 16 % Dec 16 %
Life Insurance 1,773 226 (430) (204) - 1,569 1,752 (12) (10)
General Insurance 735 145 (97) 48 - 783 768 7 2
Total 2,508 371 (527) (156) - 2,352 2,520 (6) (7)
Full Year Ended
(1) AUM excludes the Group’s interest in the First State Cinda Fund Management Company Limited.
(2) Includes investment income and foreign exchange gains and losses from translation of internationally sourced business.
(3) Fixed income includes short-term investments and global credit.
(4) Comparative information has been restated to conform to presentation in the current period.
(5) CFSWrap, formerly Custom Solutions, includes FirstWrap product.

Commonwealth Bank of Australia – Profit Announcement 37
This page has been intentionally left blank

New Zealand
38 Commonwealth Bank of Australia – Profit Announcement
30 Jun 17 30 Jun 16 Jun 17 vs 30 Jun 17 31 Dec 16 Jun 17 vs
A$M A$M Jun 16 % A$M A$M Dec 16 %
Net interest income 1,654 1,581 5 821 833 (1)
Other banking income (2) 290 288 1 150 140 7
Total banking income 1,944 1,869 4 971 973 -
Funds management income 92 80 15 47 45 4
Insurance income 278 242 15 139 139 -
Total operating income 2,314 2,191 6 1,157 1,157 -
Operating expenses (909) (889) 2 (456) (453) 1
Loan impairment expense (65) (120) (46) (18) (47) (62)
Net profit before tax 1,340 1,182 13 683 657 4
Corporate tax expense (361) (311) 16 (184) (177) 4
Underlying profit after tax 979 871 12 499 480 4
Investment experience after tax (6) 10 large 3 (9) large
Cash net profit after tax 973 881 10 502 471 7
Full Year Ended (1)
Half Year Ended
30 Jun 17 30 Jun 16 Jun 17 vs 30 Jun 17 31 Dec 16 Jun 17 vs
NZ$M NZ$M Jun 16 % NZ$M NZ$M Dec 16 %
Net interest income 1,750 1,719 2 874 876 -
Other banking income 362 346 5 181 181 -
Total banking income 2,112 2,065 2 1,055 1,057 -
Funds management income 97 87 11 50 47 6
Insurance income 294 264 11 148 146 1
Total operating income 2,503 2,416 4 1,253 1,250 -
Operating expenses (960) (964) - (485) (475) 2
Loan impairment expense (69) (130) (47) (20) (49) (59)
Net profit before tax 1,474 1,322 11 748 726 3
Corporate tax expense (399) (349) 14 (201) (198) 2
Underlying profit after tax 1,075 973 10 547 528 4
Investment experience after tax (6) 11 large 3 (9) large
Cash net profit after tax 1,069 984 9 550 519 6
Represented by:
ASB 1,033 914 13 526 507 4
Sovereign 102 105 (3) 58 44 32
Other (3) (66) (35) 89 (34) (32) 6
Cash net profit after tax 1,069 984 9 550 519 6
Full Year Ended (1)
Half Year Ended
Jun 17 vs Jun 17 vs
Key Financial Metrics (4)30 Jun 17 30 Jun 16 Jun 16 % 30 Jun 17 31 Dec 16 Dec 16 %
Operating expenses to total operating income (%) 38. 4 39. 9 (150)bpts 38. 7 38. 0 70 bpts
FUA - average (NZ$M) 12,665 11,632 9 12,743 12,575 1
FUA - spot (NZ$M) 12,826 12,063 6 12,826 12,586 2
AUM - average (NZ$M) (5) 5,300 4,825 10 5,279 5,276 -
AUM - spot (NZ$M) (5) 5,575 5,222 7 5,575 4,980 12
Full Year Ended (1)
Half Year Ended
(1) Comparative information has been restated to conform to presentation in the current period.
(2) Other banking income disclosed in AUD includes realised gains or losses associated with the hedge of the New Zealand operations.
(3) Other includes ASB funding entities and elimination entries between New Zealand segment entities.
(4) Key financial metrics are calculated in New Zealand dollar terms.
(5) AUM excludes NZD7,212 million spot balances managed by CFS Global Asset Management (31 December 2016: NZD6,780 million: 30 June 2016: NZD5,918 million). These are included in the AUM balances reported by CFS Global Asset Management.
Financial Performance and Business Review
Year Ended June 2017 versus June 2016
New Zealand(1)
cash net profit after tax(2)
for the full year
ended 30 June 2017 was NZD1,069 million, an increase of
9% on the prior year, driven by a strong performance from
ASB, partly offset by lower profit in Sovereign.
(1) The New Zealand result incorporates ASB Bank and Sovereign Insurance businesses. The CBA New Zealand Branch results relating to the Institutional Banking and Markets business in New Zealand are not included.
(2) Includes allocated capital charges and other CBA costs.
Half Year Ended June 2017 versus December 2016
New Zealand cash net profit after tax increased 6% on the
prior half. ASB’s result increased 4% primarily reflecting a
lower loan impairment expense, while Sovereign’s profit
increased 32% reflecting higher investment experience.

New Zealand
Commonwealth Bank of Australia – Profit Announcement 39
30 Jun 17 30 Jun 16 Jun 17 vs 30 Jun 17 31 Dec 16 Jun 17 vs
ASB NZ$M NZ$M Jun 16 % NZ$M NZ$M Dec 16 %
Net interest income 1,837 1,763 4 920 917 -
Other banking income 404 383 5 202 202 -
Total banking income 2,241 2,146 4 1,122 1,119 -
Funds management income 97 85 14 50 47 6
Total operating income 2,338 2,231 5 1,172 1,166 1
Operating expenses (836) (829) 1 (422) (414) 2
Loan impairment expense (69) (130) (47) (20) (49) (59)
Net profit before tax 1,433 1,272 13 730 703 4
Corporate tax expense (400) (358) 12 (204) (196) 4
Cash net profit after tax 1,033 914 13 526 507 4
Full Year Ended (1)
Half Year Ended
30 Jun 17 31 Dec 16 30 Jun 16 Jun 17 vs Jun 17 vs
Balance Sheet NZ$M NZ$M NZ$M Dec 16 % Jun 16 %
Home loans 51,128 50,248 47,784 2 7
Business and rural lending 25,133 23,991 22,588 5 11
Other interest earning assets 2,087 2,084 1,951 - 7
Total lending interest earning assets 78,348 76,323 72,323 3 8
Non-lending interest earning assets 8,662 8,644 7,130 - 21
Other assets 1,572 1,974 2,106 (20) (25)
Total assets 88,582 86,941 81,559 2 9
Customer deposits 52,795 51,018 49,811 3 6
Debt issues 18,073 18,380 13,431 (2) 35
Other interest bearing liabilities (2) 2,716 2,614 3,972 4 (32)
Total interest bearing liabilities 73,584 72,012 67,214 2 9
Non-interest bearing liabilities 6,248 6,378 6,192 (2) 1
Total liabilities 79,832 78,390 73,406 2 9
As at
Jun 17 vs Jun 17 vs
Key Financial Metrics (3)30 Jun 17 30 Jun 16 Jun 16 % 30 Jun 17 31 Dec 16 Dec 16 %
Performance indicators
Return on assets (%) 1. 2 1. 2 - 1. 2 1. 2 -
Impairment expense annualised as a % of average
GLAAs (%)0. 09 0. 19 (10)bpts 0. 05 0. 13 (8)bpts
Operating expenses to total operating income (%) 35. 8 37. 2 (140)bpts 36. 0 35. 5 50 bpts
Other asset/liability information
Average interest earning assets (NZ$M) 84,091 75,554 11 85,753 82,455 4
Average interest bearing liabilities (NZ$M) 71,424 64,563 11 72,693 70,175 4
FUA - average (NZ$M) 12,665 11,632 9 12,743 12,575 1
FUA - spot (NZ$M) 12,826 12,063 6 12,826 12,586 2
AUM - average (NZ$M) (4) 4,631 4,120 12 4,635 4,584 1
AUM - spot (NZ$M) (4) 4,954 4,523 10 4,954 4,325 15
Full Year Ended (1)
Half Year Ended
(1) Comparative information has been restated to conform to presentation in the current period.
(2) Other interest bearing liabilities includes NZD33 million due to Group companies (31 December 2016: NZD14 million; 30 June 2016: NZD119 million).
(3) Key financial metrics are calculated in New Zealand dollar terms.
(4) AUM excludes NZD5,776 million spot balances managed by CFS Global Asset Management (31 December 2016: NZD5,336 million: 30 June 2016: NZD4,394 million). These are included in the AUM balances reported by CFS Global Asset Management.
New Zealand
40 Commonwealth Bank of Australia – Profit Announcement
Financial Performance and Business Review
Year Ended June 2017 versus June 2016
ASB cash net profit after tax for the full year ended
30 June 2017 was NZD1,033 million, an increase of 13% on
the prior year. The result was driven by operating income
growth of 5% and a lower loan impairment expense.
Net Interest Income
Net interest income was NZD1,837 million, an increase of 4%
on the prior year. Strong volume growth was partly offset by
continued margin pressure.
Balance Sheet growth included:
Home loan growth of 7%, with continued customer
preference for fixed rate borrowing;
Business and rural loan growth of 11%, which remained
above system following continued investment; and
Growth in customer deposits of 6%, with strong demand
in a slowing retail deposit market.
Net interest margin decreased, reflecting higher wholesale
funding costs and higher net fixed rate loan prepayment
expense, partly offset by an increase in lending margins.
Other Banking and Funds Management Income
Other banking income was NZD404 million, an increase of
5% on the prior year, primarily driven by higher card income.
Funds management income was NZD97 million, an increase
of 14% on the prior year, due to strong net flows and a solid
performance in investment markets.
Operating Expenses
Operating expenses were NZD836 million, an increase of 1%
on the prior year. This increase was driven by higher staff
costs, continued investment in frontline and technology
capabilities, partly offset by benefits from productivity
initiatives.
The operating expense to total operating income ratio for ASB
was 35.8%, an improvement of 140 basis points, reflecting a
continued focus on productivity.
Loan Impairment Expense
Loan impairment expense was NZD69 million, a decrease of
47% on the prior year, primarily due to lower collective
provisions in the dairy portfolio, partly offset by higher
collective provision expense in the home loan portfolio.
Half Year Ended June 2017 versus December 2016
Cash net profit after tax for the half year ended 30 June 2017
was NZD526 million, an increase of 4% on the prior half. This
result was driven by a decrease in loan impairment expense.
Net Interest Income
Net interest income was flat on the prior half with improved
lending portfolio margin and solid volume growth, offset by
three fewer calendar days than the prior half and higher
wholesale funding costs.
Balance Sheet growth included:
Home loan growth of 2%;
Business and rural loans growth of 5%, with growth
remaining above system; and
Customer deposit growth of 3%.
Net interest margin decreased, reflecting higher funding costs
and increased net fixed rate loan prepayment expense, partly
offset by an increase in lending margins.
Other Banking and Funds Management Income
Other banking income remained flat on the prior half, with
higher insurance commissions, offset by lower card income
and service fees.
Funds management income increased 6%, mainly due to net
inflows and performance of the ASB KiwiSaver scheme.
Operating Expenses
Operating expenses increased 2% on the prior half, with an
increase in staff and marketing costs, partly offset by benefits
from productivity initiatives.
The operating expense to total operating income ratio for ASB
was 36.0%, an increase of 50 basis points.
Loan Impairment Expense
Loan impairment expense was NZD20 million, a decrease of
59% on the prior half, primarily due to lower collective
provisions in the dairy portfolio, partly offset by higher home
loan collective provision expense.

New Zealand
Commonwealth Bank of Australia – Profit Announcement 41
30 Jun 17 30 Jun 16 Jun 17 vs 30 Jun 17 31 Dec 16 Jun 17 vs
Sovereign NZ$M NZ$M Jun 16 % NZ$M NZ$M Dec 16 %
Insurance income 252 230 10 125 127 (2)
Operating expenses (124) (135) (8) (62) (62) -
Net profit before tax 128 95 35 63 65 (3)
Corporate tax (expense)/benefit (23) (5) large (10) (13) (23)
Underlying profit after tax 105 90 17 53 52 2
Investment experience after tax (3) 15 large 5 (8) large
Cash net profit after tax 102 105 (3) 58 44 32
Represented by:
Planned profit margins 92 93 (1) 45 47 (4)
Experience variations 13 (3) large 8 5 60
Operating margins 105 90 17 53 52 2
Investment experience after tax (3) 15 large 5 (8) large
Cash net profit after tax 102 105 (3) 58 44 32
Full Year Ended Half Year Ended
Jun 17 vs Jun 17 vs
Key Financial Metrics 30 Jun 17 30 Jun 16 Jun 16 % 30 Jun 17 31 Dec 16 Dec 16 %
Performance indicators
Average inforce premiums - average (NZ$M) 755 732 3 759 750 1
Annual inforce premiums - spot (NZ$M) 757 744 2 757 758 -
Full Year Ended Half Year Ended
30 Jun 16 Sales Lapses Net Flows Other 30 Jun 17 31 Dec 16 Jun 17 vs Jun 17 vs
Insurance Inforce $M $M $M $M $M $M $M Jun 16 % Dec 16 %
Life Insurance 744 115 (102) 13 - 757 758 2 -
Total 744 115 (102) 13 - 757 758 2 -
Full Year Ended
Financial Performance and Business Review
Year Ended June 2017 versus June 2016
Sovereign cash net profit after tax for the full year ended
30 June 2017 was NZD102 million, a decrease of 3% on the
prior year. The result was driven by lower investment
experience, partly offset by higher insurance income and
lower operating expenses.
Insurance Income
Insurance income was NZD252 million, an increase of 10%
on the prior year, driven by annual inforce premium growth,
partly offset by higher claims expense.
Operating Expenses
Operating expenses were NZD124 million, a decrease of 8%
on the prior year, driven by lower marketing costs,
professional fees, and timing of technology spend.
Corporate Tax Expense
Corporate tax expense was NZD23 million, an increase from
the prior year, primarily due to timing differences in tax
provisions.
Investment Experience
Investment experience after tax was a loss of NZD3 million, a
decrease of NZD18 million from the prior year, driven by an
increase in discount rates negatively impacting policyholder
valuations.
Half Year Ended June 2017 versus December 2016
Cash net profit after tax for the half year ended 30 June 2017
was NZD58 million, an increase of 32% on the prior half. The
result was driven by higher investment experience, partly
offset by lower insurance income.
Insurance Income
Insurance income decreased 2% on the prior half, driven by
unfavourable changes to the valuation of policyholder
liabilities, partly offset by lower claims expense.
Investment Experience
Investment experience after tax was NZD5 million, an
increase of NZD13 million from the prior half, driven by a
decrease in discount rates positively impacting policyholder
valuations.

Bankwest
42 Commonwealth Bank of Australia – Profit Announcement
30 Jun 17 30 Jun 16 Jun 17 vs 30 Jun 17 31 Dec 16 Jun 17 vs
$M $M Jun 16 % $M $M Dec 16 %
Net interest income 1,644 1,657 (1) 825 819 1
Other banking income 243 217 12 122 121 1
Total banking income 1,887 1,874 1 947 940 1
Operating expenses (794) (773) 3 (406) (388) 5
Loan impairment (expense)/benefit (89) 10 large (46) (43) 7
Net profit before tax 1,004 1,111 (10) 495 509 (3)
Corporate tax expense (302) (333) (9) (148) (154) (4)
Cash net profit after tax 702 778 (10) 347 355 (2)
Full Year Ended (1)
Half Year Ended
30 Jun 17 31 Dec 16 30 Jun 16 Jun 17 vs Jun 17 vs
Balance Sheet $M $M $M Dec 16 % Jun 16 %
Home loans (2) 67,913 65,377 64,412 4 5
Other interest earning lending assets 17,998 17,996 18,184 - (1)
Total interest earning assets 85,911 83,373 82,596 3 4
Other assets 255 232 284 10 (10)
Total assets 86,166 83,605 82,880 3 4
Transaction deposits (3) 12,450 12,499 12,155 - 2
Savings deposits 9,383 9,802 10,569 (4) (11)
Investment deposits 32,120 27,122 26,152 18 23
Certificates of deposit and other 42 35 37 20 14
Total interest bearing deposits 53,995 49,458 48,913 9 10
Other interest bearing liabilities 69 33 66 large 5
Non-interest bearing transaction deposits 1,939 1,703 1,565 14 24
Other non-interest bearing liabilities 688 491 556 40 24
Total liabilities 56,691 51,685 51,100 10 11
As at
Jun 17 vs Jun 17 vs
Key Financial Metrics 30 Jun 17 30 Jun 16 Jun 16 % 30 Jun 17 31 Dec 16 Dec 16 %
Performance indicators
Return on assets (%) 0. 8 0. 9 (10)bpts 0. 8 0. 8 -
Impairment expense annualised as a % of average
GLAAs (%)0. 11 (0. 01) 12 bpts 0. 11 0. 10 1 bpt
Operating expenses to total banking income (%) 42. 1 41. 2 90 bpts 42. 9 41. 3 160 bpts
Other asset/liability information
Average interest earning assets ($M) (4) 79,384 76,860 3 80,121 78,659 2
Average interest bearing liabilities ($M) (4) 46,980 45,380 4 48,364 45,619 6
Full Year Ended (1)
Half Year Ended
(1) Comparative information has been restated to conform to presentation in the current period.
(2) Gross of mortgage offset balances.
(3) Includes mortgage offset balances.
(4) Net of average mortgage offset balances.
Bankwest
Commonwealth Bank of Australia – Profit Announcement 43
Financial Performance and Business Review
Year Ended June 2017 versus June 2016
Bankwest cash net profit after tax for the full year ended
30 June 2017 was $702 million, a decrease of 10% on the
prior year. The result was driven by a higher loan impairment
expense and a one-off cost for the integration of Bankwest’s
east coast business banking operation into Business and
Private Banking, partly offset by higher total banking income.
Excluding the one-off integration costs, underlying cash net
profit after tax decreased 7%.
Net Interest Income
Net interest income was $1,644 million, a decrease of 1% on
the prior year. The result was driven by a reduction in net
interest margins for business lending and investment deposit
accounts due to competitive pressures, partly offset by
volume growth in home lending and higher margins on home
lending and savings products.
Balance Sheet growth included:
Home loan growth of 5%, lower than system, reflecting
the Western Australian economy lagging national growth
rates;
Total deposit balance growth of 11%, resulting from
strong growth in transaction and investment accounts;
partly offset by
Flat growth in business lending also reflecting the weak
Western Australia economy; and
An 11% decrease in savings deposits reflecting
competition and customer preferences for investment
deposits.
Net interest margin decreased due to competitive pressures
in business lending, partly offset by higher margins on home
lending and savings products.
Other Banking Income
Other banking income was $243 million, an increase of 12%
on the prior year. The result was driven by an increase in
home loan package fees, business lending fees and higher
credit card scheme fees.
Operating Expenses
Operating expenses were $794 million, an increase of 3% on
the prior year, driven by the one-off cost for the integration of
Bankwest’s east coast business banking operation into
Business and Private Banking. Excluding this, underlying
operating expenses decreased 1%. This reflects a continued
focus on productivity and disciplined expense management,
partly offset by inflation.
Loan Impairment Expense
Loan impairment was an expense of $89 million compared to
a $10 million benefit in the prior year. This was driven by
slower run-off of the business troublesome portfolio, and
higher home loan losses, predominantly in Western Australia.
Half Year Ended June 2017 versus December 2016
Bankwest cash net profit after tax for the half year ended
30 June 2017 was $347 million, a decrease of 2% on the prior
half. The result was driven by a one-off cost for integrating
Bankwest’s east coast business banking operation into
Business and Private Banking and higher loan impairment
expense, partly offset by higher total banking income.
Excluding the one-off integration costs, underlying cash net
profit after tax increased 3%.
Net Interest Income
Net interest income increased 1%, reflecting volume growth
and higher margins in home lending, partly offset by three
fewer calendar days than the prior half.
Balance Sheet growth included:
Home loan growth of 4%, slightly above system,
reflecting east coast growth, partly offset by lagging
growth rates in the Western Australian economy;
Total deposit balance growth of 9%, resulting from
strong growth in investment accounts; partly offset by
A decrease of 4% in savings deposits reflecting
competition and customer preferences for investment
deposits.
Net interest margin remained flat with higher home lending
margins offset by lower deposit margins due to competitive
pressures.
Other Banking Income
Other banking income increased 1%, driven by higher home
loan package fees.
Operating Expenses
Operating expenses increased 5%, driven by the one-off cost
for integrating Bankwest’s east coast business banking
operation into Business and Private Banking. Excluding this,
underlying operating expenses decreased 2% reflecting a
continued focus on productivity combined with disciplined
expense management.
Loan Impairment Expense
Loan impairment expense of $46 million, an increase of 7%
on the prior half. This reflects an increase in business lending
losses, partly offset by reduced home loan losses.

IFS and Other
44 Commonwealth Bank of Australia – Profit Announcement
30 Jun 17 30 Jun 16 Jun 17 vs 30 Jun 17 31 Dec 16 Jun 17 vs
$M $M Jun 16 % $M $M Dec 16 %
IFS 93 52 79 62 31 large
Corporate Centre (272) (316) (14) (160) (112) 43
Eliminations/Unallocated (77) 186 large (50) (27) 85
Cash net profit/(loss) after tax (256) (78) large (148) (108) 37
Full Year Ended (1)
Half Year Ended
30 Jun 17 30 Jun 16 Jun 17 vs 30 Jun 17 31 Dec 16 Jun 17 vs
IFS (2) $M $M Jun 16 % $M $M Dec 16 %
Net interest income 133 157 (15) 64 69 (7)
Other banking income 297 281 6 140 157 (11)
Total banking income 430 438 (2) 204 226 (10)
Insurance income 50 46 9 24 26 (8)
Total operating income 480 484 (1) 228 252 (10)
Operating expenses (333) (382) (13) (165) (168) (2)
Loan impairment expense (64) (66) (3) (12) (52) (77)
Net profit before tax 83 36 large 51 32 59
Corporate tax expense (4) (5) (20) - (4) large
Non-controlling interests (8) (4) large (5) (3) 67
Underlying profit after tax 71 27 large 46 25 84
Investment experience after tax 22 25 (12) 16 6 large
Cash net profit after tax 93 52 79 62 31 large
Full Year Ended (1)
Half Year Ended
(1) Comparative information has been restated to conform to presentation in the current period.
(2) International Financial Services incorporates the Asian retail and business banking operations (Indonesia, China, Vietnam, and India), associate investments in China and Vietnam, the life insurance operations in Indonesia and a financial services technology business in South Africa. It does not include the Business and Private Banking, Institutional Banking and Markets and Colonial First State Global Asset Management businesses in Asia.
Financial Performance and Business Review
Year Ended June 2017 versus June 2016
International Financial Services (IFS) cash net profit after tax
for the full year ended 30 June 2017 was $93 million, an
increase of 79% on the prior year, including a 35% decrease
from the higher Australian dollar. The result was driven by
lower operating expenses and a one-off tax benefit, partly
offset by lower operating income.
The uncertain geo-political environment and challenging
economic conditions across our markets continued to
adversely impact business volume momentum. IFS has
continued to grow its small-medium enterprises and
consumer segment, while winding down the non-strategic
commercial segment. The strategic segment represents 93%
of the portfolio, up from 75% on the prior year.
The total number of direct customers grew 3% to over 511,000.
On 27 July 2017, the Bank entered into an agreement to
transfer CBA’s County Bank ownership in China to Qilu Bank,
subject to regulatory approvals.
Net Interest Income
Net interest income was $133 million, a decrease of 15% on
the prior year. This reflected the wind-down of the
non-strategic commercial lending portfolio which is down 71%
to $121 million, and funding costs associated with the South
Africa expansion.
Net interest margin remained stable despite competitive
pressures.
Other Banking Income
Other banking income was $297 million, an increase of 6% on
the prior year, including an 8% decrease from the higher
Australian dollar. This reflected strong contributions from
associates in China due to above system asset growth.
Insurance Income
Insurance income in PT Commonwealth Life (PTCL) was
$50 million, a 9% increase on the prior year. The result was
driven by net premium growth and lower claims.
Operating Expenses
Operating expenses were $333 million, a decrease of 13% on
the prior year, including a 2% benefit from the higher
Australian dollar. This reflected disciplined IFS-wide cost
management which created capacity to support ongoing
strategic investment in the business.
Loan Impairment Expense
Loan impairment expense was $64 million, a decrease of 3%
on the prior year. PT Bank Commonwealth (PTBC) continues
to take management action to run-off the commercial lending
portfolio.
Investment Experience
Investment experience after tax was $22 million, a decrease
of 12% on the prior year, due to a stronger contribution from
investments in the prior year.

IFS and Other
Commonwealth Bank of Australia – Profit Announcement 45
Half Year Ended June 2017 versus December 2016
Cash net profit after tax for the half year ended 30 June 2017
increased $31 million on the prior half. The result was driven
by lower loan impairment expense and a one-off tax benefit,
partly offset by lower operating income.
Net Interest Income
Net interest income decreased 7% on the prior half, reflecting
the wind-down of the non-strategic commercial lending
portfolio by $75 million, and funding costs associated with the
South Africa expansion.
Other Banking Income
Other banking income decreased 11% on the prior half,
reflecting lower contributions from associates in China.
Insurance Income
Insurance income in PTCL decreased 8% on the prior half
due to lower investment income.
Operating Expenses
Operating expenses decreased 2% on the prior half, driven
by continued disciplined cost management, partly offset by
targeted investment in digital banking capability.
Loan Impairment Expense
Loan impairment expense decreased 77% on the prior half,
driven by lower losses in the PTBC commercial lending
portfolio, which is in run-off.
Investment Experience
Investment experience after tax increased $10 million on the
prior half, driven by strong contributions from investments in
China.
30 Jun 17 30 Jun 16 Jun 17 vs 30 Jun 17 31 Dec 16 Jun 17 vs
Corporate Centre (2) $M $M Jun 16 % $M $M Dec 16 %
Net interest income 411 209 97 232 179 30
Other banking income 123 137 (10) 63 60 5
Total banking income 534 346 54 295 239 23
Operating expenses (921) (766) 20 (535) (386) 39
Net loss before tax (387) (420) (8) (240) (147) 63
Corporate tax benefit 115 104 11 80 35 large
Cash net loss after tax (272) (316) (14) (160) (112) 43
Full Year Ended (1)
Half Year Ended
(1) Comparative information has been restated to conform to presentation in the current period.
(2) Corporate Centre includes the results of unallocated Group support functions such as Investor Relations, Group Strategy, Marketing, Secretariat and Treasury.
Treasury is primarily focused on the management of the Group’s interest rate risk, funding and liquidity requirements, and management of the Group’s capital.
The Treasury function includes:
Portfolio Management: manages the interest rate risk of the Group’s non-traded Balance Sheet using transfer pricing to consolidate risk into Treasury
and hedging the residual mismatch between assets and liabilities using swaps, futures and options;
Group Funding & Liquidity: manages the Group’s long-term and short-term wholesale funding requirements and the Group’s prudential liquidity
requirements; and
Capital and Regulatory Strategy: manages the Group’s capital requirements.
Year Ended June 2017 versus June 2016
Corporate Centre cash net loss after tax for the full year
ended 30 June 2017 reduced $44 million on the prior year to
a loss of $272 million.
Total banking income increased 54% to $534 million,
reflecting higher Treasury income from management of
interest rate risk and increased capital.
Operating expenses were $921 million, an increase of 20%
on the prior year, driven by higher corporate technology
costs, professional fees, timing of employee entitlements and
investment spend. Significant corporate technology and
investment spend initiatives include:
Safeguarding information security to mitigate risks;
Common Reporting Standard requirements; and
Anti-Money Laundering.
Half Year Ended June 2017 versus December 2016
Cash net loss after tax for the half year ended 30 June 2017
increased $48 million on the prior half to a loss of
$160 million.
Total banking income increased 23%, reflecting higher
Treasury income from management of interest rate risk and
increased capital.
Operating expenses increased 39%, driven by higher
corporate technology costs, professional fees, timing of
employee entitlements, and investment spend including
Common Reporting Standard requirements.

IFS and Other
46 Commonwealth Bank of Australia – Profit Announcement
30 Jun 17 30 Jun 16 Jun 17 vs 30 Jun 17 31 Dec 16 Jun 17 vs
Eliminations/Unallocated (2) $M $M Jun 16 % $M $M Dec 16 %
Net interest income (18) (4) large (3) (15) (80)
Other banking income (3) 295 28 large (25) 320 large
Total banking income 277 24 large (28) 305 large
Funds management income 48 45 7 22 26 (15)
Insurance income 20 5 large 12 8 50
Total operating income 345 74 large 6 339 (98)
Operating expenses (4) (393) - large - (393) large
Loan impairment (expense)/benefit (40) 11 large (41) 1 large
Net profit before tax (88) 85 large (35) (53) (34)
Corporate tax benefit 49 135 (64) 6 43 (86)
Non-controlling interests (12) (16) (25) (6) (6) -
Underlying profit after tax (51) 204 large (35) (16) large
Investment experience after tax (26) (18) 44 (15) (11) 36
Cash net (loss)/profit after tax (77) 186 large (50) (27) 85
Full Year Ended (1)
Half Year Ended
(1) Comparative information has been restated to conform to presentation in the current period.
(2) Group wide Eliminations/Unallocated includes intra-group elimination entries arising on consolidation, centrally raised provisions and other unallocated revenue and expenses.
(3) The half year ended 31 December 2016 includes a $397 million gain on sale of the Group’s remaining investment in Visa Inc.
(4) The half year ended 31 December 2016 includes a $393 million one-off expense for acceleration of amortisation on certain software assets.
Year Ended June 2017 versus June 2016
Eliminations/Unallocated cash net loss after tax for the full
year ended 30 June 2017 was $77 million, a decrease of
$263 million on the prior year. This was primarily driven by a
one-off expense for acceleration of amortisation on certain
software assets, an increase in the centrally held loan
impairment provisions, and the timing of recognition of
unallocated revenue items and eliminations, partly offset by a
gain on sale of the Group’s remaining investment in Visa Inc.
Half Year Ended June 2017 versus December 2016
Cash net loss after tax was $50 million, an increase of
$23 million on the prior half. This was primarily driven by an
increase in the centrally held loan impairment provisions, a
gain on sale of the Group’s remaining investment in Visa Inc.,
and the timing of recognition of unallocated revenue items
and eliminations, partly offset by a one-off expense for
acceleration of amortisation on certain software assets.

Investment Experience
Commonwealth Bank of Australia – Profit Announcement 47
Investment Experience
Investment experience includes net returns from shareholder investments held within Wealth Management, and within the New
Zealand and Indonesian life insurance businesses.
30 Jun 17 30 Jun 16 Jun 17 vs 30 Jun 17 31 Dec 16 Jun 17 vs
Investment Experience $M $M Jun 16 % $M $M Dec 16 %
Wealth Management (1) 79 121 (35) 45 34 32
New Zealand (7) 16 large 5 (12) large
IFS and Other (1) (7) 4 large (1) (6) (83)
Investment experience before tax 65 141 (54) 49 16 large
Tax on Investment experience (21) (41) (49) (14) (7) large
Investment experience after tax 44 100 (56) 35 9 large
Full Year Ended Half Year Ended
(1) Comparative information has been restated to conform to presentation in the current period.
Shareholder Investment Asset Mix
The net tangible assets by investment asset class shown below represent shareholder investments held within Wealth
Management, and within the New Zealand and Indonesian life insurance businesses.
Australia (1)
New Zealand Asia Total
Shareholder Investment Asset Mix (%) % % % %
Equities - - - -
Fixed interest 1 58 92 19
Cash 95 42 8 78
Other 4 - - 3
Total 100 100 100 100
As at 30 June 2017
Australia (1)
New Zealand Asia Total
Shareholder Investment Asset Mix ($M) $M $M $M $M
Equities 5 3 - 8
Fixed interest 16 423 282 721
Cash 2,609 306 23 2,938
Other 121 - - 121
Total 2,751 732 305 3,788
As at 30 June 2017
(1) Includes Shareholders’ funds in the CFS Global Asset Management, Colonial First State and CommInsure businesses.

48 Commonwealth Bank of Australia – Profit Announcement
This page has been intentionally left blank

Commonwealth Bank of Australia – Profit Announcement 49
Contents
Section 6 – Financial Statements
Consolidated Income Statement 50
Consolidated Statement of Comprehensive Income 51
Consolidated Balance Sheet 52
Consolidated Statement of Changes in Equity 53
Consolidated Statement of Cash Flows 54

Financial Statements
50 Commonwealth Bank of Australia – Profit Announcement
Consolidated Income Statement
For the year ended 30 June 2017
30 Jun 17 30 Jun 16 30 Jun 17 31 Dec 16
Appendix $M $M $M $M
Interest income 1 33,293 33,817 16,619 16,674
Interest expense 1 (15,693) (16,882) (7,760) (7,933)
Net interest income 1 17,600 16,935 8,859 8,741
Other banking income 5 5,626 4,576 2,628 2,998
Net banking operating income 23,226 21,511 11,487 11,739
Funds management income 2,343 2,315 1,186 1,157
Investment revenue 514 283 246 268
Claims, policyholder liability and commission expense (806) (537) (372) (434)
Net funds management operating income 2,051 2,061 1,060 991
Premiums from insurance contracts 2,949 2,921 1,439 1,510
Investment revenue/(expense) 224 467 238 (14)
Claims, policyholder liability and commission expense from insurance contracts (2,329) (2,382) (1,211) (1,118)
Net insurance operating income 844 1,006 466 378
Total net operating income before impairment and operating expenses 26,121 24,578 13,013 13,108
Loan impairment expense 10 (1,095) (1,256) (496) (599)
Operating expenses 7 (11,082) (10,473) (5,403) (5,679)
Net profit before income tax 13,944 12,849 7,114 6,830
Corporate tax expense 8 (3,960) (3,505) (2,010) (1,950)
Policyholder tax (expense)/benefit 8 (32) (101) (56) 24
Net profit after income tax 9,952 9,243 5,048 4,904
Non-controlling interests (24) (20) (15) (9)
Net profit attributable to Equity holders of the Bank 9,928 9,223 5,033 4,895
Full Year Ended (1)
Half Year Ended
The above Consolidated Income Statement should be read in conjunction with the accompanying appendices.
30 Jun 17 30 Jun 16 30 Jun 17 31 Dec 16
Earnings per share:
Basic 577. 6 542. 3 292. 2 285. 3
Diluted 559. 1 529. 2 283. 4 276. 7
Full Year Ended (1)
Half Year Ended
Cents per Share
(1) Comparative information has been restated to conform to presentation in the current period.
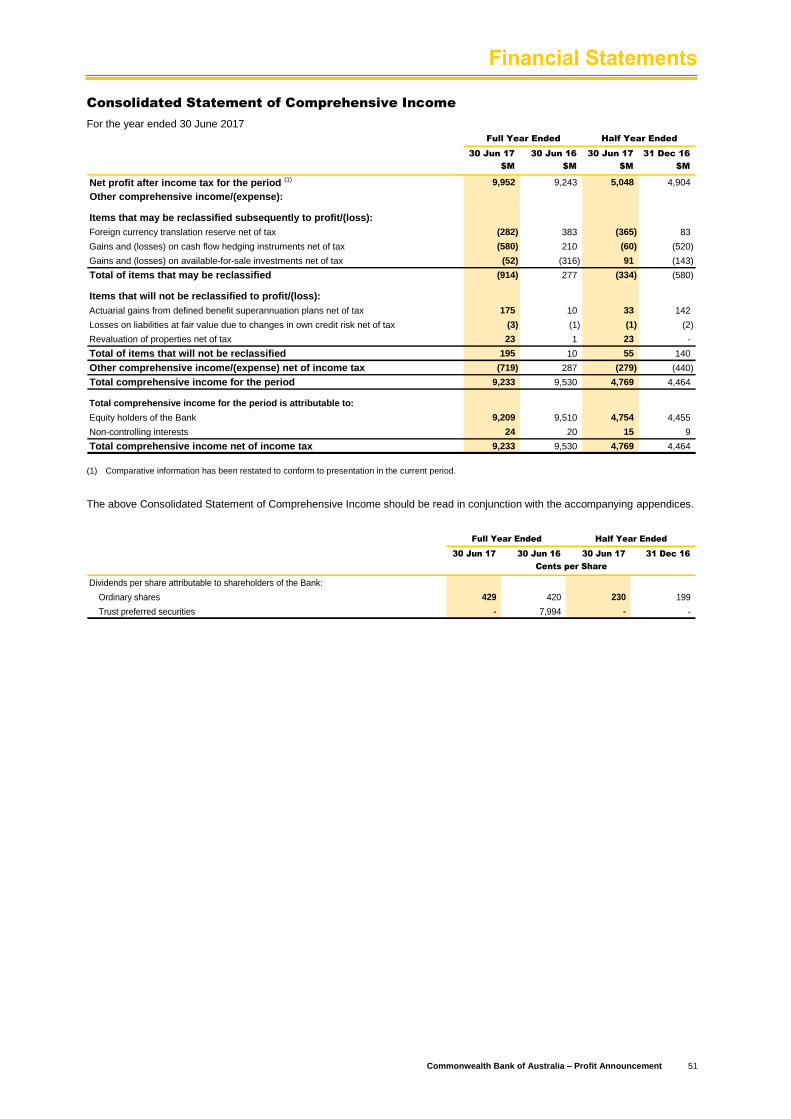
Financial Statements
Commonwealth Bank of Australia – Profit Announcement 51
Consolidated Statement of Comprehensive Income
For the year ended 30 June 2017
30 Jun 17 30 Jun 16 30 Jun 17 31 Dec 16
$M $M $M $M
Net profit after income tax for the period (1) 9,952 9,243 5,048 4,904
Other comprehensive income/(expense):
Items that may be reclassified subsequently to profit/(loss):
Foreign currency translation reserve net of tax (282) 383 (365) 83
Gains and (losses) on cash flow hedging instruments net of tax (580) 210 (60) (520)
Gains and (losses) on available-for-sale investments net of tax (52) (316) 91 (143)
Total of items that may be reclassified (914) 277 (334) (580)
Items that will not be reclassified to profit/(loss):
Actuarial gains from defined benefit superannuation plans net of tax 175 10 33 142
Losses on liabilities at fair value due to changes in own credit risk net of tax (3) (1) (1) (2)
Revaluation of properties net of tax 23 1 23 -
Total of items that will not be reclassified 195 10 55 140
Other comprehensive income/(expense) net of income tax (719) 287 (279) (440)
Total comprehensive income for the period 9,233 9,530 4,769 4,464
Total comprehensive income for the period is attributable to:
Equity holders of the Bank 9,209 9,510 4,754 4,455
Non-controlling interests 24 20 15 9
Total comprehensive income net of income tax 9,233 9,530 4,769 4,464
Full Year Ended Half Year Ended
(1) Comparative information has been restated to conform to presentation in the current period.
The above Consolidated Statement of Comprehensive Income should be read in conjunction with the accompanying appendices.
30 Jun 17 30 Jun 16 30 Jun 17 31 Dec 16
Dividends per share attributable to shareholders of the Bank:
Ordinary shares 429 420 230 199
Trust preferred securities - 7,994 - -
Full Year Ended Half Year Ended
Cents per Share

Financial Statements
52 Commonwealth Bank of Australia – Profit Announcement
Consolidated Balance Sheet
As at 30 June 2017
30 Jun 17 31 Dec 16 30 Jun 16
Assets Appendix $M $M $M
Cash and liquid assets 45,850 44,709 23,372
Receivables due from other financial institutions 10,037 10,612 11,591
Assets at fair value through Income Statement:
Trading 32,704 34,199 34,067
Insurance 13,669 13,795 13,547
Other 1,111 803 1,480
Derivative assets 31,724 45,837 46,567
Available-for-sale investments 83,535 81,675 80,898
Loans, bills discounted and other receivables 9 731,762 712,905 695,398
Bank acceptances of customers 463 1,440 1,431
Property, plant and equipment 3,873 4,094 3,940
Investment in associates and joint ventures 2,778 2,842 2,776
Intangible assets 11 10,024 10,000 10,384
Deferred tax assets (1) 962 782 389
Other assets (1) 7,882 8,026 7,161
Total assets 976,374 971,719 933,001
As at
Liabilities
Deposits and other public borrowings 12 626,655 606,091 588,045
Payables due to other financial institutions 28,432 34,031 28,771
Liabilities at fair value through Income Statement 10,392 8,404 10,292
Derivative liabilities 30,330 38,042 39,921
Bank acceptances 463 1,440 1,431
Current tax liabilities 1,450 1,012 1,022
Deferred tax liabilities 332 332 340
Other provisions 1,780 1,625 1,656
Insurance policy liabilities 12,018 12,388 12,636
Debt issues 167,571 175,583 161,284
Managed funds units on issue 2,577 2,362 1,606
Bills payable and other liabilities (1) 11,932 11,600 9,889
893,932 892,910 856,893
Loan capital 18,726 16,997 15,544
Total liabilities 912,658 909,907 872,437
Net assets 63,716 61,812 60,564
Shareholders' Equity
Ordinary share capital 17 34,971 34,455 33,845
Reserves 17 1,869 2,144 2,734
Retained profits (1) 17 26,330 24,662 23,435
Shareholders' Equity attributable to Equity holders of the Bank 63,170 61,261 60,014
Non-controlling interests 17 546 551 550
Total Shareholders' Equity 63,716 61,812 60,564 (1) Comparative information has been restated to conform to presentation in the current period.
The above Consolidated Balance Sheet should be read in conjunction with the accompanying appendices.

Financial Statements
Commonwealth Bank of Australia – Profit Announcement 53
Consolidated Statement of Changes in Equity
For the year ended 30 June 2017
Shareholders'
Equity
attributable
Ordinary Other to Equity Non- Total
share equity Retained holders controlling Shareholders'
capital instruments Reserves profits of the Bank interests Equity
$M $M $M $M $M $M $M
As at 31 December 2015 (1) 33,252 939 2,554 22,365 59,110 554 59,664
Net profit after income tax (1) - - - 4,600 4,600 9 4,609
Net other comprehensive income - - 119 (120) (1) - (1)
Total comprehensive income for the
period - - 119 4,480 4,599 9 4,608
Transactions with Equity holders in
their capacity as Equity holders:
Dividends paid on ordinary shares - - - (3,381) (3,381) - (3,381)
Dividends paid on other equity
instruments- - - (18) (18) - (18)
Dividend reinvestment plan (net of
issue costs)552 - - - 552 - 552
Issue of shares (net of issue costs) - - - - - - -
Share-based payments - - 47 - 47 - 47
Purchase of treasury shares (9) - - - (9) - (9)
Sale and vesting of treasury shares 50 - - - 50 - 50
Redemptions - (939) - - (939) - (939)
Other changes - - 14 (11) 3 (13) (10)
As at 30 June 2016 33,845 - 2,734 23,435 60,014 550 60,564
Net profit after income tax - - - 4,895 4,895 9 4,904
Net other comprehensive income - - (580) 140 (440) - (440)
Total comprehensive income for the
period - - (580) 5,035 4,455 9 4,464
Transactions with Equity holders in
their capacity as Equity holders:
Dividends paid on ordinary shares - - - (3,808) (3,808) - (3,808)
Dividends paid on other equity
instruments- - - - - - -
Dividend reinvestment plan (net of
issue costs) 586 - - - 586 - 586
Issue of shares (net of issue costs) (6) - - - (6) - (6)
Share-based payments - - (25) - (25) - (25)
Purchase of treasury shares (27) - - - (27) - (27)
Sale and vesting of treasury shares 57 - - - 57 - 57
Redemptions - - - - - - -
Other changes - - 15 - 15 (8) 7
As at 31 December 2016 34,455 - 2,144 24,662 61,261 551 61,812
Net profit after income tax - - - 5,033 5,033 15 5,048
Net other comprehensive income - - (311) 32 (279) - (279)
Total comprehensive income for the
period - - (311) 5,065 4,754 15 4,769
Transactions with Equity holders in
their capacity as Equity holders:
Dividends paid on ordinary shares - - - (3,429) (3,429) - (3,429)
Dividends paid on other equity
instruments- - - - - - -
Dividend reinvestment plan (net of
issue costs)557 - - - 557 - 557
Issue of shares (net of issue costs) - - - - - - -
Share-based payments - - 57 - 57 - 57
Purchase of treasury shares (65) - - - (65) - (65)
Sale and vesting of treasury shares 24 - - - 24 - 24
Redemptions - - - - - - -
Other changes - - (21) 32 11 (20) (9)
As at 30 June 2017 34,971 - 1,869 26,330 63,170 546 63,716
(1) Comparative information has been restated to conform to presentation in the current period.
The above Consolidated Statement of Changes in Equity should be read in conjunction with the accompanying appendices.

Financial Statements
54 Commonwealth Bank of Australia – Profit Announcement
Consolidated Statement of Cash Flows (1)
For the year ended 30 June 2017
30 Jun 17 30 Jun 16
Appendix $M $M
Cash flows from operating activities
Interest received 33,536 34,047
Interest paid (15,006) (16,285)
Other operating income received 5,556 5,688
Expenses paid (9,763) (9,981)
Income taxes paid (3,976) (3,071)
Net inflows/(outflows) from assets at fair value through Income Statement (excluding life insurance) 4,220 (2,642)
Net inflows/(outflows) from liabilities at fair value through Income Statement:
Insurance:
Investment income 186 (362)
Premiums received (2) 3,366 3,114
Policy payments and commission expense (2) (3,854) (3,301)
Other liabilities at fair value through Income Statement 156 1,872
Cash flows from operating activities before changes in operating assets and liabilities 14,421 9,079
Changes in operating assets and liabilities arising from cash flow movements
Movement in available-for-sale investments:
Purchases (54,608) (50,233)
Proceeds 49,392 46,150
Net increase in loans, bills discounted and other receivables (38,744) (52,825)
Net decrease/(increase) in receivables due from other financial institutions and regulatory authorities 1,100 803
Net (increase)/decrease in securities purchased under agreements to resell (13,993) 4,574
Insurance business:
Purchase of insurance assets at fair value through Income Statement (1,789) (2,020)
Proceeds from sale/maturity of insurance assets at fair value through Income Statement 3,152 4,276
Net increase in other assets (174) (108)
Net increase in deposits and other public borrowings 39,821 37,783
Net increase/(decrease) in payables due to other financial institutions 666 (6,323)
Net (increase)/decrease in securities sold under agreements to repurchase (853) 4,148
Net increase in other liabilities 802 135
Changes in operating assets and liabilities arising from cash flow movements (15,228) (13,640)
Net cash used in operating activities 20 (a) (807) (4,561)
Cash flows from investing activities
Payments for acquisition of controlled entities 20 (d) (31) (857)
Net proceeds from disposal of entities and businesses (net of cash disposals) 1 110
Dividends received 94 78
Proceeds from sale of property, plant and equipment 381 405
Purchases of property, plant and equipment (602) (1,259)
Payments for acquisitions of investments in associates/joint ventures (25) -
Net purchase of intangible assets (495) (509)
Net cash used in investing activities (677) (2,032)
Full Year Ended
(1) It should be noted that the Group does not use this accounting Statement of Cash Flows in the internal management of its liquidity positions.
(2) Represents gross premiums and policy payments before splitting between policyholders and shareholders.

Financial Statements
Commonwealth Bank of Australia – Profit Announcement 55
Consolidated Statement of Cash Flows (1)
(continued)
For the year ended 30 June 2017
30 Jun 17 30 Jun 16
Appendix $M $M
Cash flows from financing activities
Dividends paid (excluding Dividend Reinvestment Plan) (6,084) (5,827)
Redemption of other equity instruments (net of costs) - (939)
Proceeds from issuance of debt securities 94,560 98,958
Redemption of issued debt securities (81,758) (97,740)
Purchase of treasury shares (92) (108)
Sale of treasury shares 34 50
Issue of loan capital 3,757 3,949
Redemption of loan capital - (1,678)
Proceeds from issuance of shares (net of issue costs) (6) 5,022
Other 61 (67)
Net cash provided by financing activities 10,472 1,620
Net increase/(decrease) in cash and cash equivalents 8,988 (4,973)
Effect of foreign exchange rates on cash and cash equivalents (318) 150
Cash and cash equivalents at beginning of year 14,447 19,270
Cash and cash equivalents at end of year 20 (b) 23,117 14,447
Full Year Ended
(1) It should be noted that the Group does not use this accounting Statement of Cash Flows in the internal management of its liquidity positions.
The above Consolidated Statement of Cash Flows should be read in conjunction with the accompanying appendices.

56 Commonwealth Bank of Australia – Profit Announcement
This page has been intentionally left blank

Commonwealth Bank of Australia – Profit Announcement 57
Section 7 - Appendices
1 Net Interest Income 58
2 Net Interest Margin 59
3 Average Balances and Related Interest 60
4 Interest Rate and Volume Analysis 64
5 Other Banking Income 68
6 CommInsure and Sovereign Sources of Profit 69
7 Operating Expenses 70
8 Income Tax Expense 71
9 Loans, Bills Discounted and Other Receivables 71
10 Provisions for Impairment and Asset Quality 72
11 Intangible Assets 75
12 Deposits and Other Public Borrowings 76
13 Financial Reporting by Segments 77
14 Integrated Risk Management 81
15 Counterparty and Other Credit Risk Exposures 85
16 Capital 87
17 Shareholders’ Equity 90
18 ASX Appendix 4E 93
19 Profit Reconciliation 95
20 Notes to the Statement of Cash Flows 98
21 Analysis Template 100
22 Summary 104
23 Foreign Exchange Rates 105
24 Definitions 105
Contents

Appendices
58 Commonwealth Bank of Australia – Profit Announcement
1. Net Interest Income
30 Jun 17 30 Jun 16 Jun 17 vs 30 Jun 17 31 Dec 16 Jun 17 vs
$M $M Jun 16 % $M $M Dec 16 %
Interest Income
Loans and bills discounted 30,723 30,966 (1) 15,277 15,446 (1)
Other financial institutions 152 137 11 93 59 58
Cash and liquid assets 321 291 10 203 118 72
Assets at fair value through Income Statement 490 576 (15) 260 230 13
Available-for-sale investments 1,607 1,847 (13) 786 821 (4)
Total interest income - "statutory basis" 33,293 33,817 (2) 16,619 16,674 -
Interest Expense
Deposits 10,453 11,685 (11) 5,179 5,274 (2)
Other financial institutions 300 277 8 174 126 38
Liabilities at fair value through Income Statement 102 211 (52) 35 67 (48)
Debt issues 4,159 4,125 1 2,014 2,145 (6)
Loan capital 679 584 16 358 321 12
Total interest expense - "statutory basis" 15,693 16,882 (7) 7,760 7,933 (2)
Net interest income - "statutory basis" 17,600 16,935 4 8,859 8,741 1
Full Year Ended (1)
Half Year Ended
(1) Comparative information has been restated to conform to presentation in the current period.
Net Interest Income – Reconciliation of Cash to Statutory Basis
The table below sets out the accounting impacts arising from the application of Australian Accounting Standard 139 “Financial
Instruments: Recognition and Measurement” to the Group’s derivative hedging activities and other non-cash items.
30 Jun 17 30 Jun 16 Jun 17 vs 30 Jun 17 31 Dec 16 Jun 17 vs
$M $M Jun 16 % $M $M Dec 16 %
Total interest income - "cash basis" 33,293 33,817 (2) 16,617 16,676 -
Hedging and IFRS volatility - - - 2 (2) large
Total interest income - "statutory basis" 33,293 33,817 (2) 16,619 16,674 -
Total interest expense - "cash basis" 15,693 16,882 (7) 7,760 7,933 (2)
Hedging and IFRS volatility - - - - - -
Total interest expense - "statutory basis" 15,693 16,882 (7) 7,760 7,933 (2)
Full Year Ended (1)
Half Year Ended
(1) Comparative information has been restated to conform to presentation in the current period.

Appendices
Commonwealth Bank of Australia – Profit Announcement 59
2. Net Interest Margin
30 Jun 17 30 Jun 16 30 Jun 17 31 Dec 16
% % % %
Australia
Interest spread (2) 2. 00 2. 08 2. 04 2. 01
Benefit of interest-free liabilities, provisions and equity (3) 0. 21 0. 15 0. 21 0. 21
Net interest margin (4) 2. 21 2. 23 2. 25 2. 22
New Zealand
Interest spread (2) 1. 64 1. 81 1. 63 1. 66
Benefit of interest-free liabilities, provisions and equity (3) 0. 33 0. 36 0. 32 0. 34
Net interest margin (4) 1. 97 2. 17 1. 95 2. 00
Other Overseas
Interest spread (2) 0. 58 0. 70 0. 60 0. 57
Benefit of interest-free liabilities, provisions and equity (3) 0. 04 0. 03 0. 04 0. 03
Net interest margin (4) 0. 62 0. 73 0. 64 0. 60
Total Group
Interest spread (2) 1. 91 1. 98 1. 91 1. 91
Benefit of interest-free liabilities, provisions and equity (3) 0. 20 0. 16 0. 20 0. 20
Net interest margin (4) 2. 11 2. 14 2. 11 2. 11
Full Year Ended (1)
Half Year Ended
(1) Comparative information has been restated to conform to presentation in the current period.
(2) Difference between the average interest rate earned and the average interest rate paid on funds.
(3) A portion of the Group’s interest earning assets is funded by net interest-free liabilities and Shareholders’ Equity. The benefit to the Group of these interest-free funds is the amount it would cost to replace them at the average cost of funds.
(4) Net interest income divided by average interest earning assets for the year or the half year annualised.

Appendices
60 Commonwealth Bank of Australia – Profit Announcement
3. Average Balances and Related Interest
The following tables list the major categories of interest earning assets and interest bearing liabilities of the Group together with
the respective interest earned or paid and the average interest rate for the years ended 30 June 2017 and 30 June 2016, as well
as half years ended 30 June 2017, 31 December 2016 and 30 June 2016. Averages used were predominantly daily averages.
Interest is accounted for based on product yield.
Where assets or liabilities are hedged, the interest amounts are shown net of the hedge, however individual items not separately
hedged may be affected by movements in exchange rates.
The New Zealand and Other Overseas components comprise overseas branches of the Bank and overseas domiciled controlled
entities.
Non-accrual loans are included in interest earning assets under Loans, bills discounted and other receivables.
The official cash rate in Australia decreased 25 basis points, while rates in New Zealand decreased 50 basis points during the
year.
Avg Bal Interest Yield Avg Bal Interest Yield
$M $M % $M $M %
Home loans (2) 435,448 19,000 4. 36 409,669 19,283 4. 71
Consumer Finance (3) 23,518 2,857 12. 15 23,722 2,922 12. 32
Business and corporate loans 221,188 8,866 4. 01 211,356 8,761 4. 15
Loans, bills discounted and other
receivables 680,154 30,723 4. 52 644,747 30,966 4. 80
Cash and other liquid assets 48,476 473 0. 98 44,092 428 0. 97
Assets at fair value through Income Statement
(excluding life insurance) 25,626 490 1. 91 22,444 576 2. 57
Available-for-sale investments 80,485 1,607 2. 00 79,313 1,847 2. 33
Non-lending interest earning assets 154,587 2,570 1. 66 145,849 2,851 1. 95
Total interest earning assets (4) 834,741 33,293 3. 99 790,596 33,817 4. 28
Non-interest earning assets (2) 137,648 125,724
Total average assets 972,389 916,320
Interest Earning Assets
Full Year Ended 30 Jun 17 Full Year Ended 30 Jun 16 (1)
Avg Bal Interest Yield Avg Bal Interest Yield
$M $M % $M $M %
Transaction deposits (5) (6) 69,831 547 0. 78 74,258 606 0. 82
Savings deposits (5) 180,192 2,415 1. 34 177,200 3,394 1. 92
Investment deposits 212,143 5,302 2. 50 196,024 5,421 2. 77
Certificates of deposit and other 68,984 2,189 3. 17 66,470 2,264 3. 41
Total interest bearing deposits 531,150 10,453 1. 97 513,952 11,685 2. 27
Payables due to other financial institutions 30,333 300 0. 99 37,031 277 0. 75
Liabilities at fair value through Income Statement 8,516 102 1. 20 6,865 211 3. 07
Debt issues 168,921 4,159 2. 46 162,017 4,125 2. 55
Loan capital 16,692 679 4. 07 13,889 584 4. 20
Total interest bearing liabilities 755,612 15,693 2. 08 733,754 16,882 2. 30
Non-interest bearing liabilities (5) (6) 154,746 124,887
Total average liabilities 910,358 858,641
Interest Bearing Liabilities
Full Year Ended 30 Jun 17 Full Year Ended 30 Jun 16 (1)
(1) Comparative information has been restated to conform to presentation in the current period. (2) Net of average mortgage offset balances that were reclassified as Non-interest earning assets. Gross average home loans balance, excluding mortgage
offset accounts is $470,773 million (30 June 2016: $436,530 million). (3) Consumer finance includes personal loans, credit cards and margin loans. (4) Used for calculating Net interest margin.
(5) Deposits exclude average mortgage offset balances that were reclassified as Non-interest bearing liabilities.
(6) In the prior year, following a change in terms, Interest bearing transaction deposits of $18,314 million became Non-interest bearing and have been disclosed accordingly.
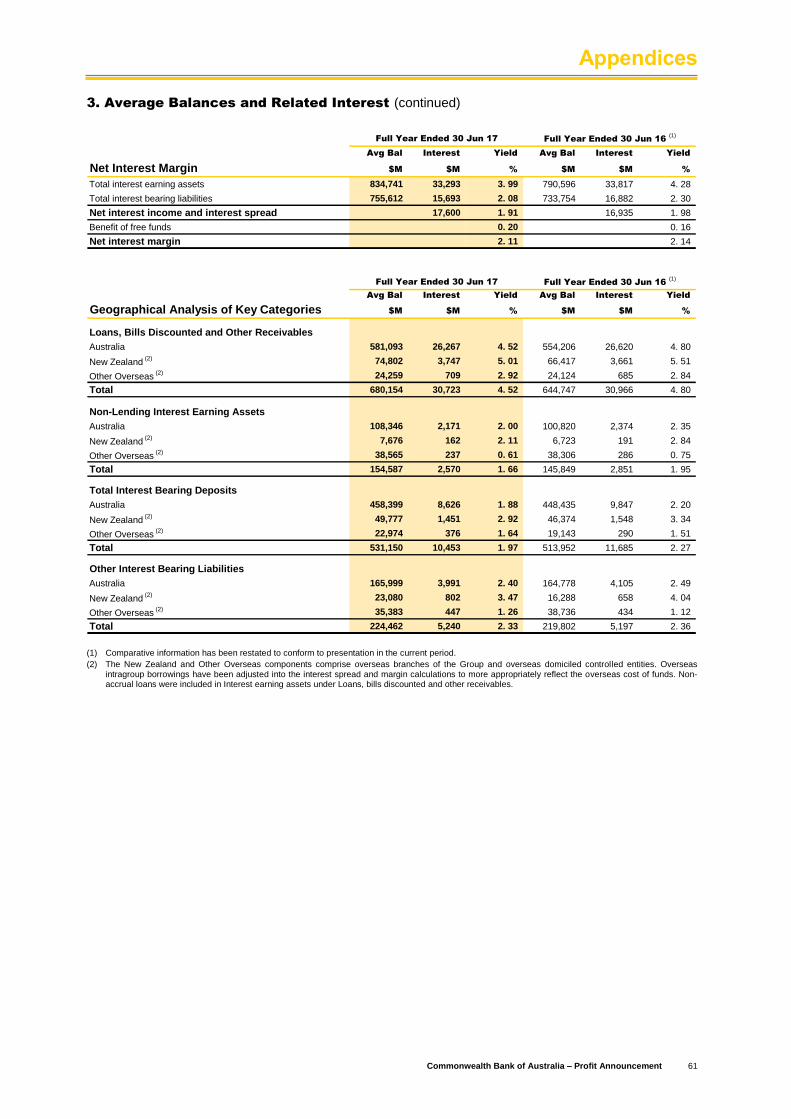
Appendices
Commonwealth Bank of Australia – Profit Announcement 61
3. Average Balances and Related Interest (continued)
Avg Bal Interest Yield Avg Bal Interest Yield
Net Interest Margin $M $M % $M $M %
Total interest earning assets 834,741 33,293 3. 99 790,596 33,817 4. 28
Total interest bearing liabilities 755,612 15,693 2. 08 733,754 16,882 2. 30
Net interest income and interest spread 17,600 1. 91 16,935 1. 98
Benefit of free funds 0. 20 0. 16
Net interest margin 2. 11 2. 14
Full Year Ended 30 Jun 17 Full Year Ended 30 Jun 16 (1)
Avg Bal Interest Yield Avg Bal Interest Yield
Geographical Analysis of Key Categories $M $M % $M $M %
Loans, Bills Discounted and Other Receivables
Australia 581,093 26,267 4. 52 554,206 26,620 4. 80
New Zealand (2) 74,802 3,747 5. 01 66,417 3,661 5. 51
Other Overseas (2) 24,259 709 2. 92 24,124 685 2. 84
Total 680,154 30,723 4. 52 644,747 30,966 4. 80
Non-Lending Interest Earning Assets
Australia 108,346 2,171 2. 00 100,820 2,374 2. 35
New Zealand (2) 7,676 162 2. 11 6,723 191 2. 84
Other Overseas (2) 38,565 237 0. 61 38,306 286 0. 75
Total 154,587 2,570 1. 66 145,849 2,851 1. 95
Total Interest Bearing Deposits
Australia 458,399 8,626 1. 88 448,435 9,847 2. 20
New Zealand (2) 49,777 1,451 2. 92 46,374 1,548 3. 34
Other Overseas (2) 22,974 376 1. 64 19,143 290 1. 51
Total 531,150 10,453 1. 97 513,952 11,685 2. 27
Other Interest Bearing Liabilities
Australia 165,999 3,991 2. 40 164,778 4,105 2. 49
New Zealand (2) 23,080 802 3. 47 16,288 658 4. 04
Other Overseas (2) 35,383 447 1. 26 38,736 434 1. 12
Total 224,462 5,240 2. 33 219,802 5,197 2. 36
Full Year Ended 30 Jun 17 Full Year Ended 30 Jun 16 (1)
(1) Comparative information has been restated to conform to presentation in the current period.
(2) The New Zealand and Other Overseas components comprise overseas branches of the Group and overseas domiciled controlled entities. Overseas intragroup borrowings have been adjusted into the interest spread and margin calculations to more appropriately reflect the overseas cost of funds. Non-accrual loans were included in Interest earning assets under Loans, bills discounted and other receivables.

Appendices
62 Commonwealth Bank of Australia – Profit Announcement
3. Average Balances and Related Interest (continued)
Interest Earning Avg Bal Interest Yield Avg Bal Interest Yield Avg Bal Interest Yield
Assets $M $M % $M $M % $M $M %
Home loans (2) 440,572 9,459 4. 33 430,408 9,541 4. 40 414,749 9,637 4. 67
Consumer Finance (3) 23,577 1,424 12. 18 23,460 1,433 12. 12 23,838 1,464 12. 35
Business and corporate loans 221,868 4,394 3. 99 220,519 4,472 4. 02 215,027 4,406 4. 12
Loans, bills discounted and other
receivables 686,017 15,277 4. 49 674,387 15,446 4. 54 653,614 15,507 4. 77
Cash and other liquid assets 54,246 296 1. 10 42,801 177 0. 82 42,328 253 1. 20
Assets at fair value through Income
Statement (excluding life insurance) 26,006 260 2. 02 25,252 230 1. 81 24,246 279 2. 31
Available-for-sale investments 80,350 784 1. 97 80,618 823 2. 03 80,191 936 2. 35
Non-lending interest earning
assets 160,602 1,340 1. 68 148,671 1,230 1. 64 146,765 1,468 2. 01
Total interest earning assets (4) 846,619 16,617 3. 96 823,058 16,676 4. 02 800,379 16,975 4. 27
Non-interest earning assets (2) 141,233 134,122 123,061
Total average assets 987,852 957,180 923,440
Half Year Ended 30 Jun 17 Half Year Ended 31 Dec 16 Half Year Ended 30 Jun 16 (1)
Interest Bearing Avg Bal Interest Yield Avg Bal Interest Yield Avg Bal Interest Yield
Liabilities $M $M % $M $M % $M $M %
Transaction deposits (5) (6) 71,061 281 0. 80 68,620 266 0. 77 68,664 303 0. 89
Savings deposits (5) 180,279 1,113 1. 24 180,106 1,302 1. 43 180,815 1,578 1. 76
Investment deposits 217,852 2,683 2. 48 206,527 2,619 2. 52 195,980 2,674 2. 74
Certificates of deposit and other 69,256 1,102 3. 21 68,717 1,087 3. 14 68,315 1,127 3. 32
Total interest bearing deposits 538,448 5,179 1. 94 523,970 5,274 2. 00 513,774 5,682 2. 22
Payables due to other financial
institutions 30,487 174 1. 15 30,182 126 0. 83 32,390 146 0. 91
Liabilities at fair value through
Income Statement 8,934 35 0. 79 8,105 67 1. 64 7,583 107 2. 84
Debt issues 168,446 2,014 2. 41 169,388 2,145 2. 51 161,879 2,230 2. 77
Loan capital 17,811 358 4. 05 15,591 321 4. 08 14,620 302 4. 15
Total interest bearing liabilities 764,126 7,760 2. 05 747,236 7,933 2. 11 730,246 8,467 2. 33
Non-interest bearing liabilities (5) (6) 160,838 148,756 134,057
Total average liabilities 924,964 895,992 864,303
Half Year Ended 30 Jun 17 Half Year Ended 31 Dec 16 Half Year Ended 30 Jun 16 (1)
(1) Comparative information has been restated to conform to presentation in the current period. (2) Net of average mortgage offset balances that were reclassified as Non-interest earning assets. Gross average home loans balance, excluding mortgage offset
accounts is $477,851 million (31 December 2016: $463,811 million, 30 June 2016: $443,497 million). (3) Consumer finance includes personal loans, credit cards and margin loans. (4) Used for calculating Net interest margin.
(5) Deposits exclude average mortgage offset balances that were reclassified as Non-interest bearing liabilities.
(6) In the prior year, following a change in terms, Interest bearing transaction deposits of $18,314 million became Non-interest bearing and have been disclosed accordingly.

Appendices
Commonwealth Bank of Australia – Profit Announcement 63
3. Average Balances and Related Interest (continued)
Avg Bal Interest Yield Avg Bal Interest Yield Avg Bal Interest Yield
Net Interest Margin $M $M % $M $M % $M $M %
Total interest earning assets 846,619 16,617 3. 96 823,058 16,676 4. 02 800,379 16,975 4. 27
Total interest bearing liabilities 764,126 7,760 2. 05 747,236 7,933 2. 11 730,246 8,467 2. 33
Net interest income and
interest spread 8,857 1. 91 8,743 1. 91 8,508 1. 94
Benefit of free funds 0. 20 0. 20 0. 20
Net interest margin 2. 11 2. 11 2. 14
Half Year Ended 30 Jun 17 Half Year Ended 31 Dec 16 Half Year Ended 30 Jun 16 (1)
Geographical Analysis Avg Bal Interest Yield Avg Bal Interest Yield Avg Bal Interest Yield
of Key Categories $M $M % $M $M % $M $M %
Loans, Bills Discounted and
Other Receivables
Australia 586,145 13,049 4. 49 576,123 13,218 4. 55 560,995 13,369 4. 79
New Zealand (2) 75,488 1,858 4. 96 74,127 1,889 5. 06 68,358 1,787 5. 26
Other Overseas (2) 24,384 370 3. 06 24,137 339 2. 79 24,261 351 2. 91
Total 686,017 15,277 4. 49 674,387 15,446 4. 54 653,614 15,507 4. 77
Non-Lending Interest
Earning Assets
Australia 112,226 1,126 2. 02 104,530 1,045 1. 98 102,338 1,197 2. 35
New Zealand (2) 7,693 77 2. 02 7,659 85 2. 20 7,058 90 2. 56
Other Overseas (2) 40,683 137 0. 68 36,482 100 0. 54 37,369 181 0. 97
Total 160,602 1,340 1. 68 148,671 1,230 1. 64 146,765 1,468 2. 01
Total Interest Bearing
Deposits
Australia 464,944 4,241 1. 84 451,960 4,385 1. 92 446,216 4,829 2. 18
New Zealand (2) 50,375 735 2. 94 49,188 716 2. 89 46,935 720 3. 08
Other Overseas (2) 23,129 203 1. 77 22,822 173 1. 50 20,623 133 1. 30
Total 538,448 5,179 1. 94 523,970 5,274 2. 00 513,774 5,682 2. 22
Other Interest Bearing
Liabilities
Australia 167,478 1,984 2. 39 164,546 2,007 2. 42 161,790 2,200 2. 73
New Zealand (2) 23,750 386 3. 28 22,420 416 3. 68 17,828 347 3. 91
Other Overseas (2) 34,450 211 1. 24 36,300 236 1. 29 36,854 238 1. 30
Total 225,678 2,581 2. 31 223,266 2,659 2. 36 216,472 2,785 2. 59
Half Year Ended 30 Jun 17 Half Year Ended 31 Dec 16 Half Year Ended 30 Jun 16 (1)
(1) Comparative information has been restated to conform to presentation in the current period.
(2) The New Zealand and Other Overseas components comprise overseas branches of the Group and overseas domiciled controlled entities. Overseas intragroup borrowings have been adjusted into the interest spread and margin calculations to more appropriately reflect the overseas cost of funds. Non-accrual loans were included in Interest earning assets under Loans, bills discounted and other receivables.

Appendices
64 Commonwealth Bank of Australia – Profit Announcement
4. Interest Rate and Volume Analysis
The following tables show the movement in interest income and expense due to changes in volume and interest rates. Volume
variances reflect the change in interest from the prior year due to movement in the average balance. Rate variance reflects the
change in interest from the prior year due to changes in interest rates.
Volume Rate Total Volume Rate Total
Interest Earning Assets (2)$M $M $M $M $M $M
Home loans 1,169 (1,452) (283) 926 (1,206) (280)
Consumer Finance (25) (40) (65) 30 5 35
Business and corporate loans 401 (296) 105 925 (1,191) (266)
Loans, bills discounted and other
receivables 1,650 (1,893) (243) 2,008 (2,519) (511)
Cash and other liquid assets 43 2 45 27 60 87
Assets at fair value through Income Statement
(excluding life insurance) 71 (157) (86) 11 47 58
Available-for-sale investments 25 (265) (240) 271 (237) 34
Non-lending interest earning assets 158 (439) (281) 285 (106) 179
Total interest earning assets 1,824 (2,348) (524) 2,427 (2,759) (332)
Full Year Ended Jun 17 vs Jun 16 (1)
Full Year Ended Jun 16 vs Jun 15 (1)
Volume Rate Total Volume Rate Total
Interest Bearing Liabilities (2)$M $M $M $M $M $M
Transaction deposits (35) (24) (59) 27 (30) (3)
Savings deposits 49 (1,028) (979) 534 (917) (383)
Investment deposits 424 (543) (119) (113) (771) (884)
Certificates of deposit and other 83 (158) (75) 31 (12) 19
Total interest bearing deposits 365 (1,597) (1,232) 606 (1,857) (1,251)
Payables due to other financial institutions (58) 81 23 39 18 57
Liabilities at fair value through Income Statement 35 (144) (109) (7) (4) (11)
Debt issues 173 (139) 34 222 (469) (247)
Loan capital 116 (21) 95 111 (99) 12
Total interest bearing liabilities 478 (1,667) (1,189) 998 (2,438) (1,440)
Full Year Ended Jun 17 vs Jun 16 (1)
Full Year Ended Jun 16 vs Jun 15 (1)
Jun 17 vs Jun 16 Jun 16 vs Jun 15
Increase/(Decrease) Increase/(Decrease)
Change in Net Interest Income (3)$M $M
Due to changes in average volume of interest earning assets 938 1,168
Due to changes in interest margin (273) (60)
Change in net interest income 665 1,108
Full Year Ended (1)
(1) Comparative information has been restated to conform to presentation in the current period.
(2) The volume and rate variances for Total interest earning assets and Total interest bearing liabilities have been calculated separately (rather than being the sum of the individual categories).
(3) “Volume” reflects the change in net interest income over the period due to balance growth (assuming the average of the rates across the two periods), and “Rate” reflects the change due to movements in yield (assuming the average of the volumes across the two periods).

Appendices
Commonwealth Bank of Australia – Profit Announcement 65
4. Interest Rate and Volume Analysis (continued)
Geographical Analysis of Key Volume Rate Total Volume Rate Total
Categories (2)$M $M $M $M $M $M
Loans, Bills Discounted and Other
Receivables
Australia 1,253 (1,606) (353) 1,588 (2,086) (498)
New Zealand 441 (355) 86 272 (342) (70)
Other Overseas 4 20 24 108 (51) 57
Total 1,650 (1,893) (243) 2,008 (2,519) (511)
Non-Lending Interest Earning Assets
Australia 164 (367) (203) 313 (188) 125
New Zealand 24 (53) (29) 8 (63) (55)
Other Overseas 2 (51) (49) 8 101 109
Total 158 (439) (281) 285 (106) 179
Total Interest Bearing Deposits
Australia 203 (1,424) (1,221) 447 (1,861) (1,414)
New Zealand 106 (203) (97) 151 (168) (17)
Other Overseas 60 26 86 19 161 180
Total 365 (1,597) (1,232) 606 (1,857) (1,251)
Other Interest Bearing Liabilities
Australia 30 (144) (114) 245 (511) (266)
New Zealand 255 (111) 144 74 (153) (79)
Other Overseas (40) 53 13 47 109 156
Total 109 (66) 43 394 (583) (189)
Full Year Ended Jun 17 vs Jun 16 (1)
Full Year Ended Jun 16 vs Jun 15 (1)
(1) Comparative information has been restated to conform to presentation in the current period.
(2) The volume and rate variances for Loans, bills discounted and other receivables, Non-lending interest earning assets, Total interest bearing deposits and Other interest bearing liabilities have been calculated separately (rather than being the sum of the individual categories).

Appendices
66 Commonwealth Bank of Australia – Profit Announcement
4. Interest Rate and Volume Analysis (continued)
Volume Rate Total Volume Rate Total
Interest Earning Assets (2)$M $M $M $M $M $M
Home loans 222 (304) (82) 577 (755) (178)
Consumer Finance 7 (16) (9) (16) (24) (40)
Business and corporate loans 27 (105) (78) 138 (150) (12)
Loans, bills discounted and other receivables 263 (432) (169) 745 (975) (230)
Cash and other liquid assets 55 64 119 68 (25) 43
Assets at fair value through Income Statement
(excluding life insurance) 7 23 30 19 (38) (19)
Available-for-sale investments (3) (36) (39) 2 (154) (152)
Non-lending interest earning assets 99 11 110 127 (255) (128)
Total interest earning assets 470 (529) (59) 944 (1,302) (358)
Half Year Ended Jun 17 vs Dec 16 Half Year Ended Jun 17 vs Jun 16 (1)
Volume Rate Total Volume Rate Total
Interest Bearing Liabilities (2)$M $M $M $M $M $M
Transaction deposits 10 5 15 10 (32) (22)
Savings deposits 1 (190) (189) (4) (461) (465)
Investment deposits 142 (78) 64 284 (275) 9
Certificates of deposit and other 9 6 15 15 (40) (25)
Total interest bearing deposits 142 (237) (95) 255 (758) (503)
Payables due to other financial institutions 2 46 48 (10) 38 28
Liabilities at fair value through Income Statement 5 (37) (32) 12 (84) (72)
Debt issues (12) (119) (131) 84 (300) (216)
Loan capital 45 (8) 37 65 (9) 56
Total interest bearing liabilities 175 (348) (173) 368 (1,075) (707)
Half Year Ended Jun 17 vs Dec 16 Half Year Ended Jun 17 vs Jun 16 (1)
Jun 17 vs Dec 16 Jun 17 vs Jun 16
Increase/(Decrease) Increase/(Decrease)
Change in Net Interest Income (3)$M $M
Due to changes in average volume of interest earning assets 246 486
Due to changes in interest margin 10 (91)
Due to variation in time periods (142) (46)
Change in net interest income 114 349
Half Year Ended (1)
(1) Comparative information has been restated to conform to presentation in the current period.
(2) The volume and rate variances for Total interest earning assets and Total interest bearing liabilities have been calculated separately (rather than being the sum of the individual categories).
(3) “Volume” reflects the change in net interest income over the period due to balance growth (assuming the average of the rates across the two periods), and “Rate” reflects the change due to movements in yield (assuming the average of the volumes across the two periods).

Appendices
Commonwealth Bank of Australia – Profit Announcement 67
4. Interest Rate and Volume Analysis (continued)
Geographical analysis of key Volume Rate Total Volume Rate Total
categories (2)$M $M $M $M $M $M
Loans, Bills Discounted and Other
Receivables
Australia 227 (396) (169) 580 (900) (320)
New Zealand 34 (65) (31) 181 (110) 71
Other Overseas 4 27 31 2 17 19
Total 263 (432) (169) 745 (975) (230)
Non-Lending Interest Earning Assets
Australia 77 4 81 107 (178) (71)
New Zealand - (8) (8) 7 (20) (13)
Other Overseas 13 24 37 14 (58) (44)
Total 99 11 110 127 (255) (128)
Total Interest Bearing Deposits
Australia 122 (266) (144) 187 (775) (588)
New Zealand 17 2 19 51 (36) 15
Other Overseas 3 27 30 19 51 70
Total 142 (237) (95) 255 (758) (503)
Other Interest Bearing Liabilities
Australia 35 (58) (23) 72 (288) (216)
New Zealand 23 (53) (30) 106 (67) 39
Other Overseas (12) (13) (25) (15) (12) (27)
Total 28 (106) (78) 112 (316) (204)
Half Year Ended Jun 17 vs Dec 16 Half Year Ended Jun 17 vs Jun 16 (1)
(1) Comparative information has been restated to conform to presentation in the current period.
(2) The volume and rate variances for Loans, bills discounted and other receivables, Non-lending interest earning assets, Total interest bearing deposits and Other interest bearing liabilities have been calculated separately (rather than being the sum of the individual categories).

Appendices
68 Commonwealth Bank of Australia – Profit Announcement
5. Other Banking Income
30 Jun 17 30 Jun 16 Jun 17 vs 30 Jun 17 31 Dec 16 Jun 17 vs
$M $M Jun 16 % $M $M Dec 16 %
Lending fees 1,078 1,010 7 545 533 2
Commissions 2,482 2,215 12 1,228 1,254 (2)
Trading income 1,149 1,087 6 549 600 (9)
Net gain/(loss) on non-trading financial instruments (1)
(2) 433 (27) large 59 374 (84)
Net gain/(loss) on sale of property, plant and equipment 6 (21) large (1) 7 large
Net gain/(loss) from hedging ineffectiveness 62 (72) large 23 39 (41)
Dividends 10 12 (17) 5 5 -
Share of profit of associates and joint ventures net of impairment 292 289 1 138 154 (10)
Other 114 83 37 82 32 large
Total other banking income - "statutory basis" 5,626 4,576 23 2,628 2,998 (12)
Full Year Ended Half Year Ended
(1) Inclusive of non-trading derivatives that are held for risk management purposes.
(2) The half year ended 31 December 2016 includes a $397 million gain on sale of the Group’s remaining investment in Visa Inc.
Other Banking Income – Reconciliation of Cash and Statutory Basis
The table below sets out various accounting impacts arising from the application of AASB 139 “Financial Instruments: Recognition
and Measurement” to the Group’s derivative hedging activities and other non-cash items.
30 Jun 17 30 Jun 16 Jun 17 vs 30 Jun 17 31 Dec 16 Jun 17 vs
$M $M Jun 16 % $M $M Dec 16 %
Other banking income - "cash basis" 5,520 4,860 14 2,534 2,986 (15)
Revenue hedge of New Zealand operations -
unrealised 35 (197) large 37 (2) large
Hedging and IFRS volatility 71 (87) large 57 14 large
Other banking income - "statutory basis" 5,626 4,576 23 2,628 2,998 (12)
Full Year Ended Half Year Ended
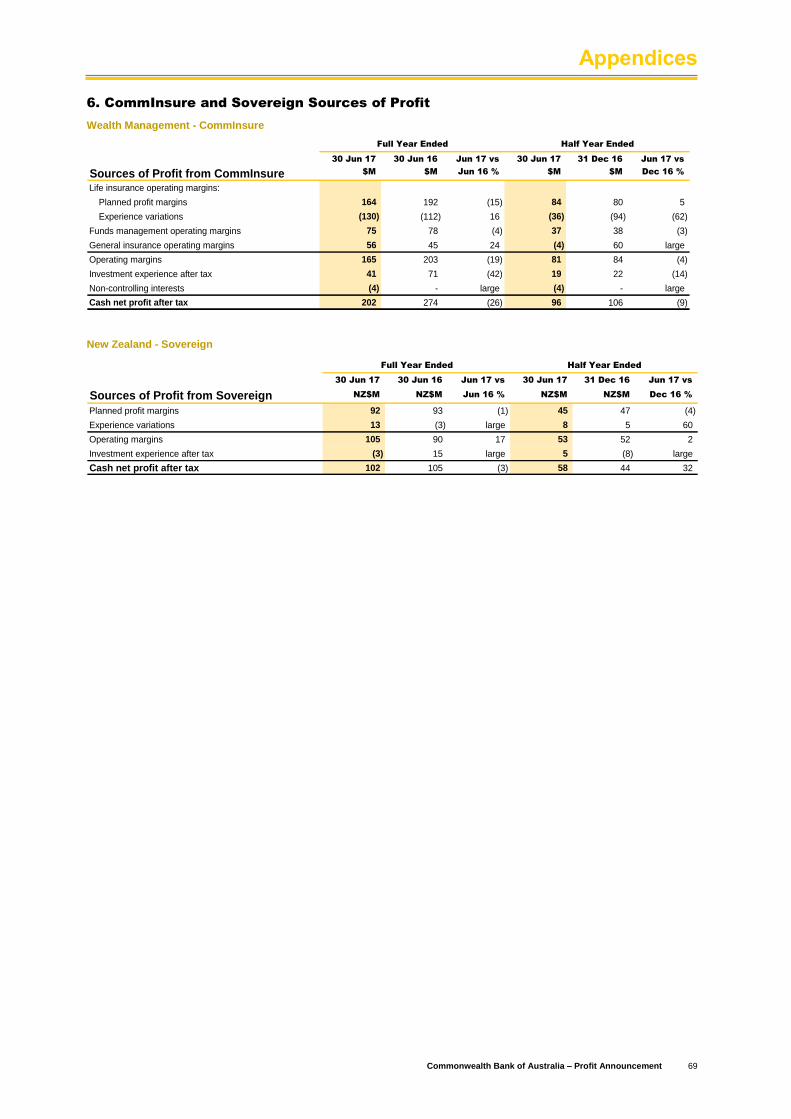
Appendices
Commonwealth Bank of Australia – Profit Announcement 69
6. CommInsure and Sovereign Sources of Profit
Wealth Management - CommInsure
30 Jun 17 30 Jun 16 Jun 17 vs 30 Jun 17 31 Dec 16 Jun 17 vs
Sources of Profit from CommInsure $M $M Jun 16 % $M $M Dec 16 %
Life insurance operating margins:
Planned profit margins 164 192 (15) 84 80 5
Experience variations (130) (112) 16 (36) (94) (62)
Funds management operating margins 75 78 (4) 37 38 (3)
General insurance operating margins 56 45 24 (4) 60 large
Operating margins 165 203 (19) 81 84 (4)
Investment experience after tax 41 71 (42) 19 22 (14)
Non-controlling interests (4) - large (4) - large
Cash net profit after tax 202 274 (26) 96 106 (9)
Full Year Ended Half Year Ended
New Zealand - Sovereign
30 Jun 17 30 Jun 16 Jun 17 vs 30 Jun 17 31 Dec 16 Jun 17 vs
Sources of Profit from Sovereign NZ$M NZ$M Jun 16 % NZ$M NZ$M Dec 16 %
Planned profit margins 92 93 (1) 45 47 (4)
Experience variations 13 (3) large 8 5 60
Operating margins 105 90 17 53 52 2
Investment experience after tax (3) 15 large 5 (8) large
Cash net profit after tax 102 105 (3) 58 44 32
Full Year Ended Half Year Ended

Appendices
70 Commonwealth Bank of Australia – Profit Announcement
7. Operating Expenses
30 Jun 17 30 Jun 16 Jun 17 vs 30 Jun 17 31 Dec 16 Jun 17 vs
$M $M Jun 16 % $M $M Dec 16 %
Staff Expenses
Salaries and related on-costs (1) 5,652 5,657 - 2,826 2,826 -
Share-based compensation 122 102 20 61 61 -
Superannuation 494 410 20 273 221 24
Total staff expenses 6,268 6,169 2 3,160 3,108 2
Occupancy and Equipment Expenses
Operating lease rentals 661 650 2 331 330 -
Depreciation of property, plant and equipment 288 266 8 145 143 1
Other occupancy expenses 190 218 (13) 95 95 -
Total occupancy and equipment expenses 1,139 1,134 - 571 568 1
Information Technology Services
Application maintenance and development 512 511 - 290 222 31
Data processing 210 197 7 105 105 -
Desktop 188 143 31 89 99 (10)
Communications 193 203 (5) 100 93 8
Amortisation of software assets (2) 779 379 large 166 613 (73)
Software write-offs 6 1 large 6 - large
IT equipment depreciation 53 51 4 30 23 30
Total information technology services 1,941 1,485 31 786 1,155 (32)
Other Expenses
Postage and stationery 187 192 (3) 90 97 (7)
Transaction processing and market data 186 179 4 88 98 (10)
Fees and commissions:
Professional fees 404 247 64 229 175 31
Other 76 93 (18) 33 43 (23)
Advertising, marketing and loyalty 437 491 (11) 240 197 22
Amortisation of intangible assets (excluding software
and merger related amortisation)11 14 (21) 4 7 (43)
Non-lending losses 125 103 21 71 54 31
Other 304 327 (7) 129 175 (26)
Total other expenses 1,730 1,646 5 884 846 4
Total operating expenses - "cash basis" 11,078 10,434 6 5,401 5,677 (5)
Investment and Restructuring
Merger related amortisation (3) 4 39 (90) 2 2 -
Total investment and restructuring 4 39 (90) 2 2 -
Total operating expenses - "statutory basis" 11,082 10,473 6 5,403 5,679 (5)
Full Year Ended Half Year Ended
(1) Comparative information has been restated to reflect the changes to the recognition of Global Asset Management long-term incentives in Wealth
Management.
(2) The half year ended 31 December 2016 includes a $393 million one-off expense for acceleration of amortisation on certain software assets.
(3) Merger related amortisation relates to Bankwest core deposits and customer lists.
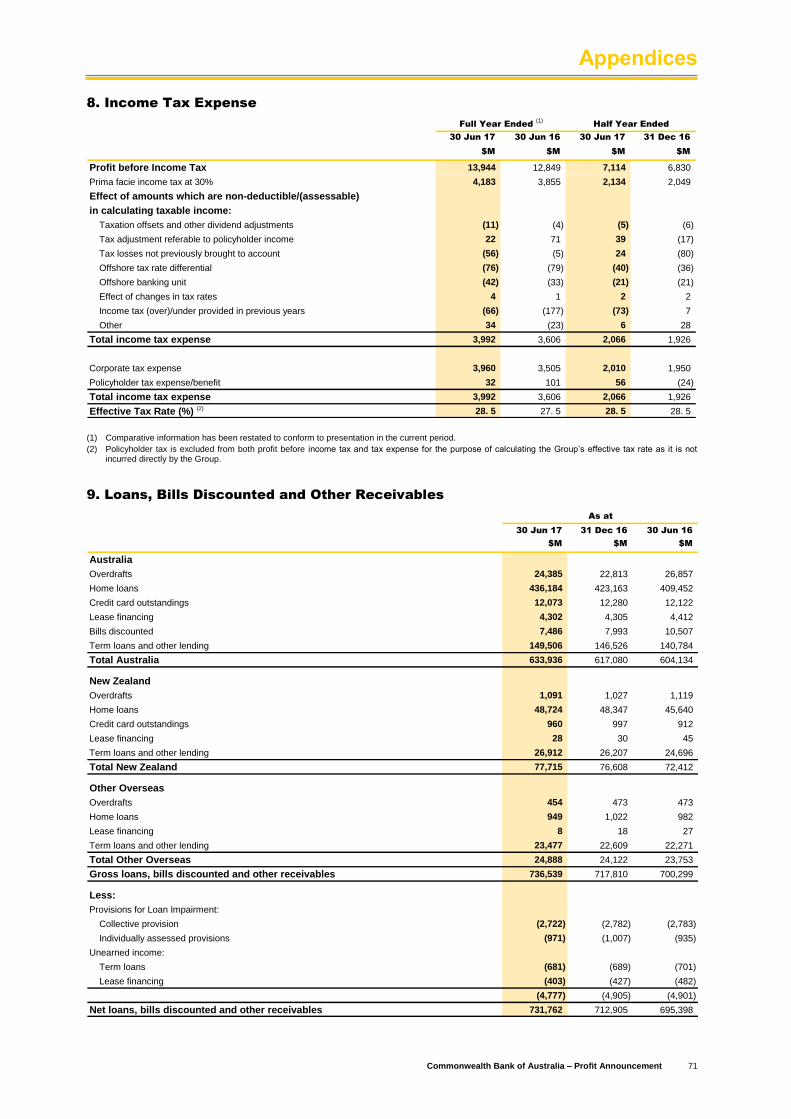
Appendices
Commonwealth Bank of Australia – Profit Announcement 71
8. Income Tax Expense
30 Jun 17 30 Jun 16 30 Jun 17 31 Dec 16
$M $M $M $M
Profit before Income Tax 13,944 12,849 7,114 6,830
Prima facie income tax at 30% 4,183 3,855 2,134 2,049
Effect of amounts which are non-deductible/(assessable)
in calculating taxable income:
Taxation offsets and other dividend adjustments (11) (4) (5) (6)
Tax adjustment referable to policyholder income 22 71 39 (17)
Tax losses not previously brought to account (56) (5) 24 (80)
Offshore tax rate differential (76) (79) (40) (36)
Offshore banking unit (42) (33) (21) (21)
Effect of changes in tax rates 4 1 2 2
Income tax (over)/under provided in previous years (66) (177) (73) 7
Other 34 (23) 6 28
Total income tax expense 3,992 3,606 2,066 1,926
Corporate tax expense 3,960 3,505 2,010 1,950
Policyholder tax expense/benefit 32 101 56 (24)
Total income tax expense 3,992 3,606 2,066 1,926
Effective Tax Rate (%) (2) 28. 5 27. 5 28. 5 28. 5
Half Year EndedFull Year Ended (1)
(1) Comparative information has been restated to conform to presentation in the current period.
(2) Policyholder tax is excluded from both profit before income tax and tax expense for the purpose of calculating the Group’s effective tax rate as it is not incurred directly by the Group.
9. Loans, Bills Discounted and Other Receivables
30 Jun 17 31 Dec 16 30 Jun 16
$M $M $M
Australia
Overdrafts 24,385 22,813 26,857
Home loans 436,184 423,163 409,452
Credit card outstandings 12,073 12,280 12,122
Lease financing 4,302 4,305 4,412
Bills discounted 7,486 7,993 10,507
Term loans and other lending 149,506 146,526 140,784
Total Australia 633,936 617,080 604,134
New Zealand
Overdrafts 1,091 1,027 1,119
Home loans 48,724 48,347 45,640
Credit card outstandings 960 997 912
Lease financing 28 30 45
Term loans and other lending 26,912 26,207 24,696
Total New Zealand 77,715 76,608 72,412
Other Overseas
Overdrafts 454 473 473
Home loans 949 1,022 982
Lease financing 8 18 27
Term loans and other lending 23,477 22,609 22,271
Total Other Overseas 24,888 24,122 23,753
Gross loans, bills discounted and other receivables 736,539 717,810 700,299
Less:
Provisions for Loan Impairment:
Collective provision (2,722) (2,782) (2,783)
Individually assessed provisions (971) (1,007) (935)
Unearned income:
Term loans (681) (689) (701)
Lease financing (403) (427) (482)
(4,777) (4,905) (4,901)
Net loans, bills discounted and other receivables 731,762 712,905 695,398
As at
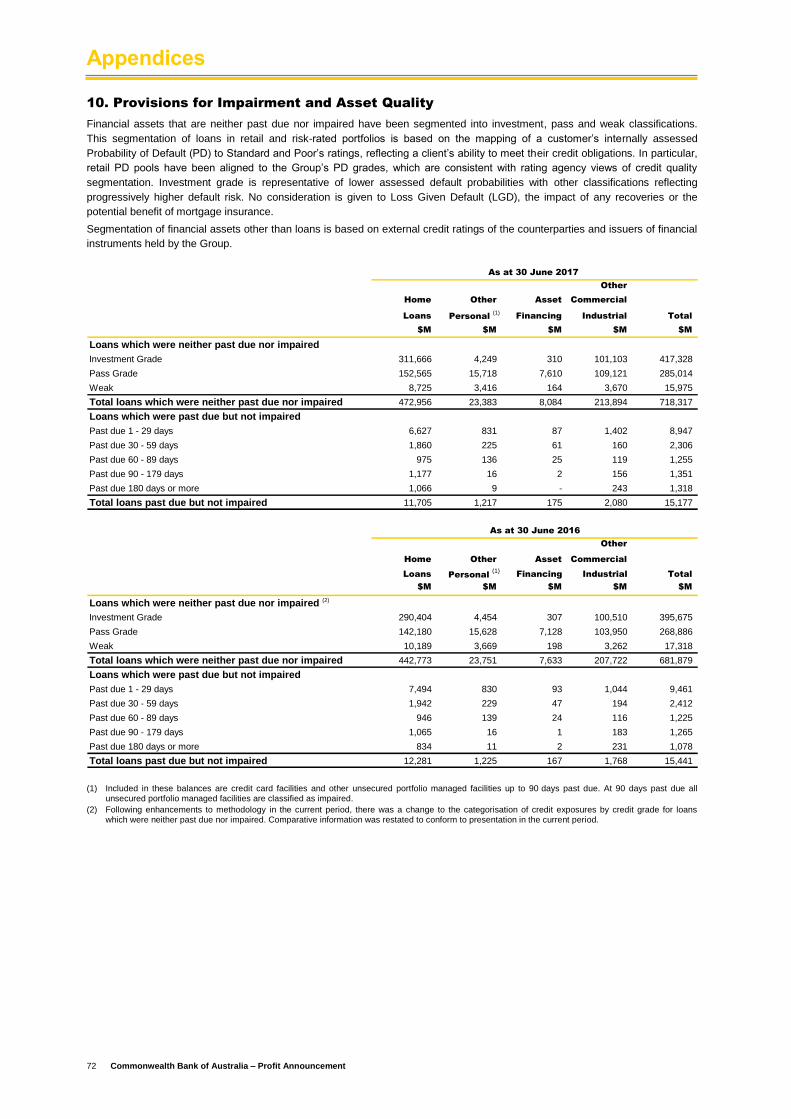
Appendices
72 Commonwealth Bank of Australia – Profit Announcement
10. Provisions for Impairment and Asset Quality
Financial assets that are neither past due nor impaired have been segmented into investment, pass and weak classifications.
This segmentation of loans in retail and risk-rated portfolios is based on the mapping of a customer’s internally assessed
Probability of Default (PD) to Standard and Poor’s ratings, reflecting a client’s ability to meet their credit obligations. In particular,
retail PD pools have been aligned to the Group’s PD grades, which are consistent with rating agency views of credit quality
segmentation. Investment grade is representative of lower assessed default probabilities with other classifications reflecting
progressively higher default risk. No consideration is given to Loss Given Default (LGD), the impact of any recoveries or the
potential benefit of mortgage insurance.
Segmentation of financial assets other than loans is based on external credit ratings of the counterparties and issuers of financial
instruments held by the Group.
Other
Home Other Asset Commercial
Loans Personal (1)
Financing Industrial Total
$M $M $M $M $M
Loans which were neither past due nor impaired
Investment Grade 311,666 4,249 310 101,103 417,328
Pass Grade 152,565 15,718 7,610 109,121 285,014
Weak 8,725 3,416 164 3,670 15,975
Total loans which were neither past due nor impaired 472,956 23,383 8,084 213,894 718,317
Loans which were past due but not impaired
Past due 1 - 29 days 6,627 831 87 1,402 8,947
Past due 30 - 59 days 1,860 225 61 160 2,306
Past due 60 - 89 days 975 136 25 119 1,255
Past due 90 - 179 days 1,177 16 2 156 1,351
Past due 180 days or more 1,066 9 - 243 1,318
Total loans past due but not impaired 11,705 1,217 175 2,080 15,177
As at 30 June 2017
Other
Home Other Asset Commercial
Loans Personal (1)
Financing Industrial Total
$M $M $M $M $M
Loans which were neither past due nor impaired (2)
Investment Grade 290,404 4,454 307 100,510 395,675
Pass Grade 142,180 15,628 7,128 103,950 268,886
Weak 10,189 3,669 198 3,262 17,318
Total loans which were neither past due nor impaired 442,773 23,751 7,633 207,722 681,879
Loans which were past due but not impaired
Past due 1 - 29 days 7,494 830 93 1,044 9,461
Past due 30 - 59 days 1,942 229 47 194 2,412
Past due 60 - 89 days 946 139 24 116 1,225
Past due 90 - 179 days 1,065 16 1 183 1,265
Past due 180 days or more 834 11 2 231 1,078
Total loans past due but not impaired 12,281 1,225 167 1,768 15,441
As at 30 June 2016
(1) Included in these balances are credit card facilities and other unsecured portfolio managed facilities up to 90 days past due. At 90 days past due all
unsecured portfolio managed facilities are classified as impaired.
(2) Following enhancements to methodology in the current period, there was a change to the categorisation of credit exposures by credit grade for loans which were neither past due nor impaired. Comparative information was restated to conform to presentation in the current period.
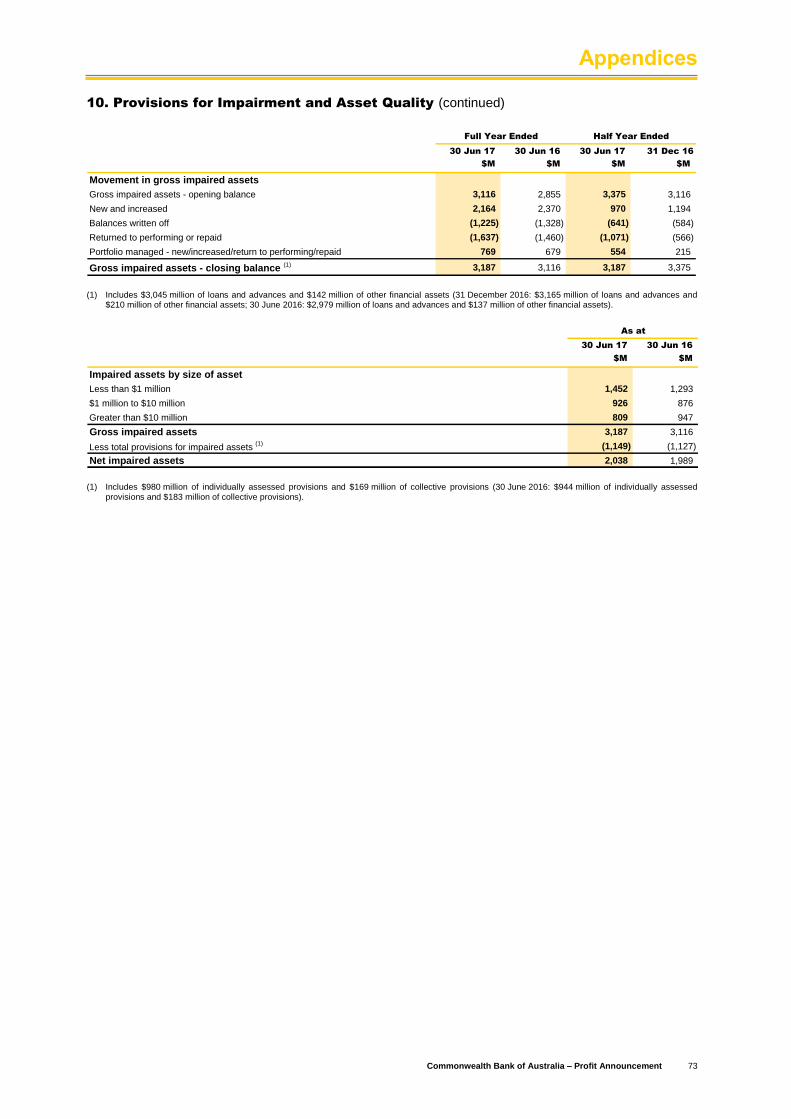
Appendices
Commonwealth Bank of Australia – Profit Announcement 73
10. Provisions for Impairment and Asset Quality (continued)
30 Jun 17 30 Jun 16 30 Jun 17 31 Dec 16
$M $M $M $M
Movement in gross impaired assets
Gross impaired assets - opening balance 3,116 2,855 3,375 3,116
New and increased 2,164 2,370 970 1,194
Balances written off (1,225) (1,328) (641) (584)
Returned to performing or repaid (1,637) (1,460) (1,071) (566)
Portfolio managed - new/increased/return to performing/repaid 769 679 554 215
Gross impaired assets - closing balance (1) 3,187 3,116 3,187 3,375
Full Year Ended Half Year Ended
(1) Includes $3,045 million of loans and advances and $142 million of other financial assets (31 December 2016: $3,165 million of loans and advances and
$210 million of other financial assets; 30 June 2016: $2,979 million of loans and advances and $137 million of other financial assets).
30 Jun 17 30 Jun 16
$M $M
Impaired assets by size of asset
Less than $1 million 1,452 1,293
$1 million to $10 million 926 876
Greater than $10 million 809 947
Gross impaired assets 3,187 3,116
Less total provisions for impaired assets (1) (1,149) (1,127)
Net impaired assets 2,038 1,989
As at
(1) Includes $980 million of individually assessed provisions and $169 million of collective provisions (30 June 2016: $944 million of individually assessed
provisions and $183 million of collective provisions).

Appendices
74 Commonwealth Bank of Australia – Profit Announcement
10. Provisions for Impairment and Asset Quality (continued)
Provisioning Policy
Provisions for impairment are maintained at an amount adequate to cover incurred credit related losses.
For loans and other receivables, the Group assesses at each Balance Sheet date whether there is any objective evidence of
impairment. Individually assessed provisions are made against financial assets that are individually significant, or which have
been individually assessed as impaired. All loans and other receivables that do not have an individually assessed provision are
assessed collectively for impairment. If there is objective evidence of impairment, the amount of the loss is measured as the
difference between the asset’s carrying amount and the present value of the expected future cash flows (excluding future cred it
losses that have not been incurred), discounted at the financial asset’s original effective interest rate. Short-term balances are not
discounted.
30 Jun 17 30 Jun 16 30 Jun 17 31 Dec 16
$M $M $M $M
Provision for impairment losses
Collective provision
Opening balance 2,818 2,762 2,807 2,818
Net collective provision funding 617 664 293 324
Impairment losses written off (894) (846) (451) (443)
Impairment losses recovered 210 225 103 107
Other (4) 13 (5) 1
Closing balance 2,747 2,818 2,747 2,807
Individually assessed provisions
Opening balance 944 887 1,017 944
Net new and increased individual provisioning 670 788 300 370
Write-back of provisions no longer required (192) (196) (97) (95)
Discount unwind to interest income (31) (27) (15) (16)
Impairment losses written off (454) (571) (247) (207)
Other 43 63 22 21
Closing balance 980 944 980 1,017
Total provisions for impairment losses 3,727 3,762 3,727 3,824
Less: Provision for Off Balance Sheet exposures (34) (44) (34) (35)
Total provisions for loan impairment 3,693 3,718 3,693 3,789
Full Year Ended Half Year Ended
30 Jun 17 30 Jun 16 30 Jun 17 31 Dec 16
% % % %
Provision ratios
Total provisions for impaired assets as a % of gross impaired assets 36. 05 36. 17 36. 05 35. 02
Total provisions for impairment losses as a % of gross loans and acceptances 0. 51 0. 54 0. 51 0. 53
Full Year Ended Half Year Ended
30 Jun 17 30 Jun 16 30 Jun 17 31 Dec 16
$M $M $M $M
Loan impairment expense
Net collective provisioning funding 617 664 293 324
Net new and increased individual provisioning 670 788 300 370
Write-back of individually assessed provisions (192) (196) (97) (95)
Total loan impairment expense 1,095 1,256 496 599
Full Year Ended Half Year Ended
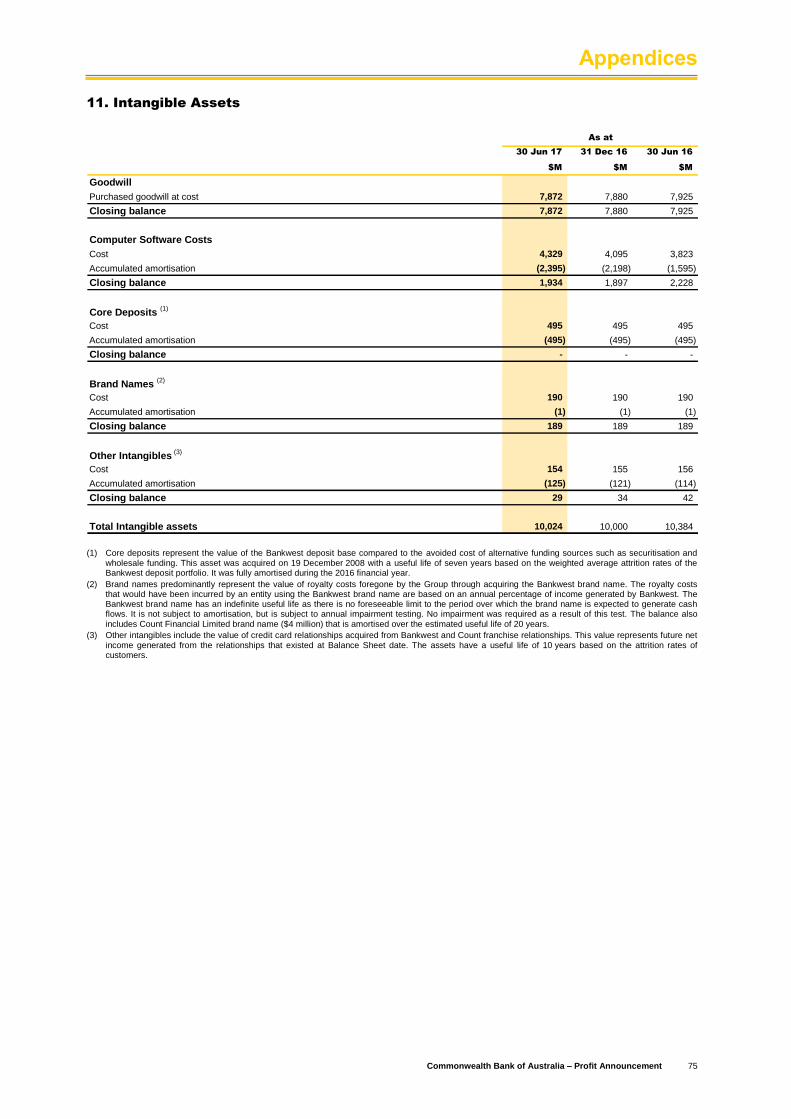
Appendices
Commonwealth Bank of Australia – Profit Announcement 75
11. Intangible Assets
30 Jun 17 31 Dec 16 30 Jun 16
$M $M $M
Goodwill
Purchased goodwill at cost 7,872 7,880 7,925
Closing balance 7,872 7,880 7,925
Computer Software Costs
Cost 4,329 4,095 3,823
Accumulated amortisation (2,395) (2,198) (1,595)
Closing balance 1,934 1,897 2,228
Core Deposits (1)
Cost 495 495 495
Accumulated amortisation (495) (495) (495)
Closing balance - - -
Brand Names (2)
Cost 190 190 190
Accumulated amortisation (1) (1) (1)
Closing balance 189 189 189
Other Intangibles (3)
Cost 154 155 156
Accumulated amortisation (125) (121) (114)
Closing balance 29 34 42
Total Intangible assets 10,024 10,000 10,384
As at
(1) Core deposits represent the value of the Bankwest deposit base compared to the avoided cost of alternative funding sources such as securitisation and
wholesale funding. This asset was acquired on 19 December 2008 with a useful life of seven years based on the weighted average attrition rates of the Bankwest deposit portfolio. It was fully amortised during the 2016 financial year.
(2) Brand names predominantly represent the value of royalty costs foregone by the Group through acquiring the Bankwest brand name. The royalty costs that would have been incurred by an entity using the Bankwest brand name are based on an annual percentage of income generated by Bankwest. The Bankwest brand name has an indefinite useful life as there is no foreseeable limit to the period over which the brand name is expected to generate cash flows. It is not subject to amortisation, but is subject to annual impairment testing. No impairment was required as a result of this test. The balance also includes Count Financial Limited brand name ($4 million) that is amortised over the estimated useful life of 20 years.
(3) Other intangibles include the value of credit card relationships acquired from Bankwest and Count franchise relationships. This value represents future net income generated from the relationships that existed at Balance Sheet date. The assets have a useful life of 10 years based on the attrition rates of customers.

Appendices
76 Commonwealth Bank of Australia – Profit Announcement
12. Deposits and Other Public Borrowings
30 Jun 17 31 Dec 16 30 Jun 16
$M $M $M
Australia
Certificates of deposit 39,854 41,018 43,762
Term deposits 158,453 151,263 138,443
On-demand and short-term deposits 293,579 286,407 281,648
Deposits not bearing interest 41,787 37,833 35,164
Securities sold under agreements to repurchase 16,175 13,015 17,124
Total Australia 549,848 529,536 516,141
New Zealand
Certificates of deposit 2,409 2,521 2,779
Term deposits 27,396 24,560 22,060
On-demand and short-term deposits 21,530 23,082 23,752
Deposits not bearing interest 3,847 3,784 3,345
Total New Zealand 55,182 53,947 51,936
Other Overseas
Certificates of deposit 10,087 9,343 6,319
Term deposits 8,912 10,694 10,009
On-demand and short-term deposits 2,482 2,507 3,575
Deposits not bearing interest 49 64 65
Securities sold under agreements to repurchase 95 - -
Total Other Overseas 21,625 22,608 19,968
Total deposits and other public borrowings 626,655 606,091 588,045
As at

Appendices
Commonwealth Bank of Australia – Profit Announcement 77
13. Financial Reporting by Segments
Retail Business and Institutional
Banking Private Banking and Wealth New IFS and
Services Banking Markets Management Zealand Bankwest Other Total
$M $M $M $M $M $M $M $M
Net interest income 9,225 3,044 1,507 - 1,654 1,644 526 17,600
Other banking income (1) 2,000 925 1,347 - 290 243 715 5,520
Total banking income 11,225 3,969 2,854 - 1,944 1,887 1,241 23,120
Funds management income - - - 1,894 92 - 48 2,034
Insurance income - - - 438 278 - 70 786
Total operating income 11,225 3,969 2,854 2,332 2,314 1,887 1,359 25,940
Investment experience (2) - - - 79 (7) - (7) 65
Total income 11,225 3,969 2,854 2,411 2,307 1,887 1,352 26,005
Operating expenses (3) (3,452) (1,551) (1,072) (1,653) (909) (794) (1,647) (11,078)
Loan impairment expense (699) (74) (64) - (65) (89) (104) (1,095)
Net profit before tax 7,074 2,344 1,718 758 1,333 1,004 (399) 13,832
Corporate tax (expense)/benefit (2,110) (705) (412) (201) (360) (302) 163 (3,927)
Non-controlling interests - - - (4) - - (20) (24)
Net profit after tax - "cash basis" (4) 4,964 1,639 1,306 553 973 702 (256) 9,881
Hedging and IFRS volatility - - - - 27 - 46 73
Other non-cash items - - - (23) - (3) - (26)
Net profit after tax - "statutory basis" 4,964 1,639 1,306 530 1,000 699 (210) 9,928
Additional information
Amortisation and depreciation (220) (114) (109) (38) (81) (27) (546) (1,135)
Balance Sheet
Total assets 356,503 106,972 173,234 22,014 86,784 86,166 144,701 976,374
Total liabilities 252,773 83,499 161,807 27,455 80,625 56,691 249,808 912,658
Full Year Ended 30 June 2017
(1) The current year includes a $397 million gain on sale of the Group’s remaining investment in Visa Inc.
(2) Investment experience is presented on a pre-tax basis.
(3) The current year includes a $393 million one-off expense for acceleration of amortisation on certain software assets.
(4) This balance excludes non-cash items, including unrealised gains and losses relating to hedging and IFRS volatility ($73 million gain), Bankwest non-cash items ($3 million expense) and treasury shares valuation adjustment ($23 million expense).

Appendices
78 Commonwealth Bank of Australia – Profit Announcement
13. Financial Reporting by Segments (continued)
Retail Business and Institutional
Banking Private Banking and Wealth New IFS and
Services Banking Markets Management Zealand Bankwest Other Total
$M $M $M $M $M $M $M $M
Net interest income 8,717 3,001 1,617 - 1,581 1,657 362 16,935
Other banking income 1,794 839 1,276 - 288 217 446 4,860
Total banking income 10,511 3,840 2,893 - 1,869 1,874 808 21,795
Funds management income - - - 1,891 80 - 45 2,016
Insurance income - - - 502 242 - 51 795
Total operating income 10,511 3,840 2,893 2,393 2,191 1,874 904 24,606
Investment experience (2) - - - 121 16 - 4 141
Total income 10,511 3,840 2,893 2,514 2,207 1,874 908 24,747
Operating expenses (3,373) (1,488) (1,082) (1,681) (889) (773) (1,148) (10,434)
Loan impairment expense (663) (176) (252) - (120) 10 (55) (1,256)
Net profit before tax 6,475 2,176 1,559 833 1,198 1,111 (295) 13,057
Corporate tax (expense)/benefit (1,935) (654) (369) (221) (317) (333) 237 (3,592)
Non-controlling interests - - - - - - (20) (20)
Net profit after tax - "cash basis" (3) 4,540 1,522 1,190 612 881 778 (78) 9,445
Hedging and IFRS volatility - - - - (139) - (60) (199)
Other non-cash items - - - 4 - (27) - (23)
Net profit after tax - "statutory basis" 4,540 1,522 1,190 616 742 751 (138) 9,223
Additional information
Amortisation and depreciation (214) (112) (87) (39) (77) (60) (160) (749)
Balance Sheet
Total assets 334,632 101,452 181,252 21,003 80,386 82,880 131,396 933,001
Total liabilities 238,524 76,181 154,519 26,234 73,831 51,100 252,048 872,437
Full Year Ended 30 June 2016 (1)
(1) Comparative information has been restated to reflect refinements to the allocation of customer balances, revenue and expense methodology including updated transfer pricing allocations, and changes to the recognition of Global Asset Management
long-term incentives in Wealth Management.
(2) Investment experience is presented on a pre-tax basis.
(3) This balance excludes non-cash items, including unrealised gains and losses relating to hedging and IFRS volatility ($199 million expense), Bankwest non-cash items ($27 million expense) and treasury shares valuation adjustment ($4 million gain).

Appendices
Commonwealth Bank of Australia – Profit Announcement 79
13. Financial Reporting by Segments (continued)
Retail Business and Institutional
Banking Private Banking and Wealth New IFS and
Services Banking Markets Management Zealand Bankwest Other Total
$M $M $M $M $M $M $M $M
Net interest income 4,641 1,531 746 - 821 825 293 8,857
Other banking income 994 467 623 - 150 122 178 2,534
Total banking income 5,635 1,998 1,369 - 971 947 471 11,391
Funds management income - - - 961 47 - 22 1,030
Insurance income - - - 218 139 - 36 393
Total operating income 5,635 1,998 1,369 1,179 1,157 947 529 12,814
Investment experience (1) - - - 45 5 - (1) 49
Total income 5,635 1,998 1,369 1,224 1,162 947 528 12,863
Operating expenses (1,730) (776) (527) (806) (456) (406) (700) (5,401)
Loan impairment expense (349) (10) (20) - (18) (46) (53) (496)
Net profit before tax 3,556 1,212 822 418 688 495 (225) 6,966
Corporate tax (expense)/benefit (1,058) (364) (199) (110) (186) (148) 88 (1,977)
Non-controlling interests - - - (4) - - (11) (15)
Net profit after tax - "cash basis" (2) 2,498 848 623 304 502 347 (148) 4,974
Hedging and IFRS volatility - - - - 25 - 40 65
Other non-cash items - - - (4) - (2) - (6)
Net profit after tax - "statutory basis" 2,498 848 623 300 527 345 (108) 5,033
Additional information
Amortisation and depreciation (99) (55) (46) (19) (42) (14) (72) (347)
Balance Sheet
Total assets 356,503 106,972 173,234 22,014 86,784 86,166 144,701 976,374
Total liabilities 252,773 83,499 161,807 27,455 80,625 56,691 249,808 912,658
Half Year Ended 30 June 2017
(1) Investment experience is presented on a pre-tax basis.
(2) This balance excludes non-cash items, including unrealised gains and losses relating to hedging and IFRS volatility ($65 million gain), Bankwest non-cash items ($2 million expense) and treasury shares valuation adjustment ($4 million expense).

Appendices
80 Commonwealth Bank of Australia – Profit Announcement
13. Financial Reporting by Segments (continued)
Geographical Information 30 Jun 17 30 Jun 17 30 Jun 16 30 Jun 16
Financial Performance and Position $M % $M %
Income
Australia 37,304 83. 0 36,721 82. 7
New Zealand 5,099 11. 3 5,015 11. 3
Other locations (1) 2,546 5. 7 2,643 6. 0
Total income 44,949 100. 0 44,379 100. 0
Non-Current Assets
Australia 15,301 91. 8 15,687 91. 7
New Zealand 1,045 6. 2 1,087 6. 4
Other locations (1) 329 2. 0 326 1. 9
Total non-current assets (2) 16,675 100. 0 17,100 100. 0
Full Year Ended
(1) Other locations include: United Kingdom, United States, Japan, Singapore, Malta, Hong Kong, Indonesia, China, India, Vietnam and South Africa.
(2) Non-current assets include Property, plant and equipment, Investments in associates and joint ventures, and Intangibles.
The geographical segment represents the location in which the transaction was recognised.
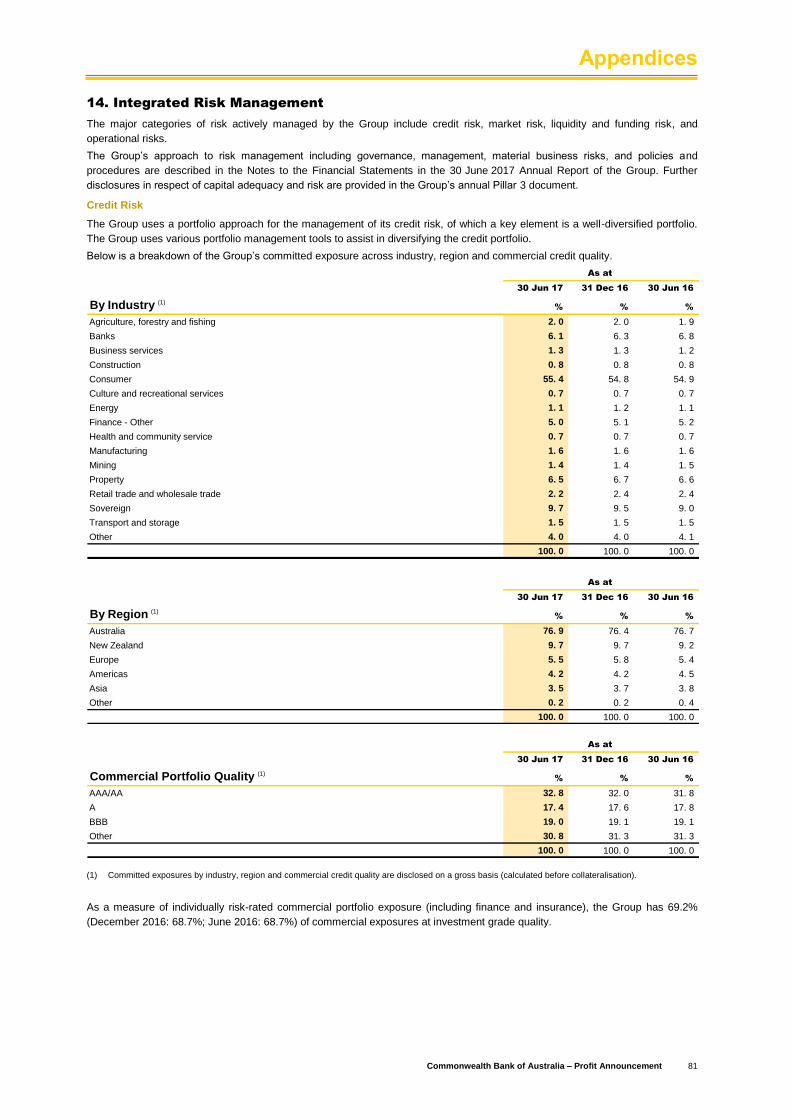
Appendices
Commonwealth Bank of Australia – Profit Announcement 81
14. Integrated Risk Management
The major categories of risk actively managed by the Group include credit risk, market risk, liquidity and funding risk, and
operational risks.
The Group’s approach to risk management including governance, management, material business risks, and policies and
procedures are described in the Notes to the Financial Statements in the 30 June 2017 Annual Report of the Group. Further
disclosures in respect of capital adequacy and risk are provided in the Group’s annual Pillar 3 document.
Credit Risk
The Group uses a portfolio approach for the management of its credit risk, of which a key element is a well-diversified portfolio.
The Group uses various portfolio management tools to assist in diversifying the credit portfolio.
Below is a breakdown of the Group’s committed exposure across industry, region and commercial credit quality.
30 Jun 17 31 Dec 16 30 Jun 16
By Industry (1)% % %
Agriculture, forestry and fishing 2. 0 2. 0 1. 9
Banks 6. 1 6. 3 6. 8
Business services 1. 3 1. 3 1. 2
Construction 0. 8 0. 8 0. 8
Consumer 55. 4 54. 8 54. 9
Culture and recreational services 0. 7 0. 7 0. 7
Energy 1. 1 1. 2 1. 1
Finance - Other 5. 0 5. 1 5. 2
Health and community service 0. 7 0. 7 0. 7
Manufacturing 1. 6 1. 6 1. 6
Mining 1. 4 1. 4 1. 5
Property 6. 5 6. 7 6. 6
Retail trade and wholesale trade 2. 2 2. 4 2. 4
Sovereign 9. 7 9. 5 9. 0
Transport and storage 1. 5 1. 5 1. 5
Other 4. 0 4. 0 4. 1
100. 0 100. 0 100. 0
As at
30 Jun 17 31 Dec 16 30 Jun 16
By Region (1)
% % %
Australia 76. 9 76. 4 76. 7
New Zealand 9. 7 9. 7 9. 2
Europe 5. 5 5. 8 5. 4
Americas 4. 2 4. 2 4. 5
Asia 3. 5 3. 7 3. 8
Other 0. 2 0. 2 0. 4
100. 0 100. 0 100. 0
As at
30 Jun 17 31 Dec 16 30 Jun 16
Commercial Portfolio Quality (1)% % %
AAA/AA 32. 8 32. 0 31. 8
A 17. 4 17. 6 17. 8
BBB 19. 0 19. 1 19. 1
Other 30. 8 31. 3 31. 3
100. 0 100. 0 100. 0
As at
(1) Committed exposures by industry, region and commercial credit quality are disclosed on a gross basis (calculated before collateralisation).
As a measure of individually risk-rated commercial portfolio exposure (including finance and insurance), the Group has 69.2%
(December 2016: 68.7%; June 2016: 68.7%) of commercial exposures at investment grade quality.
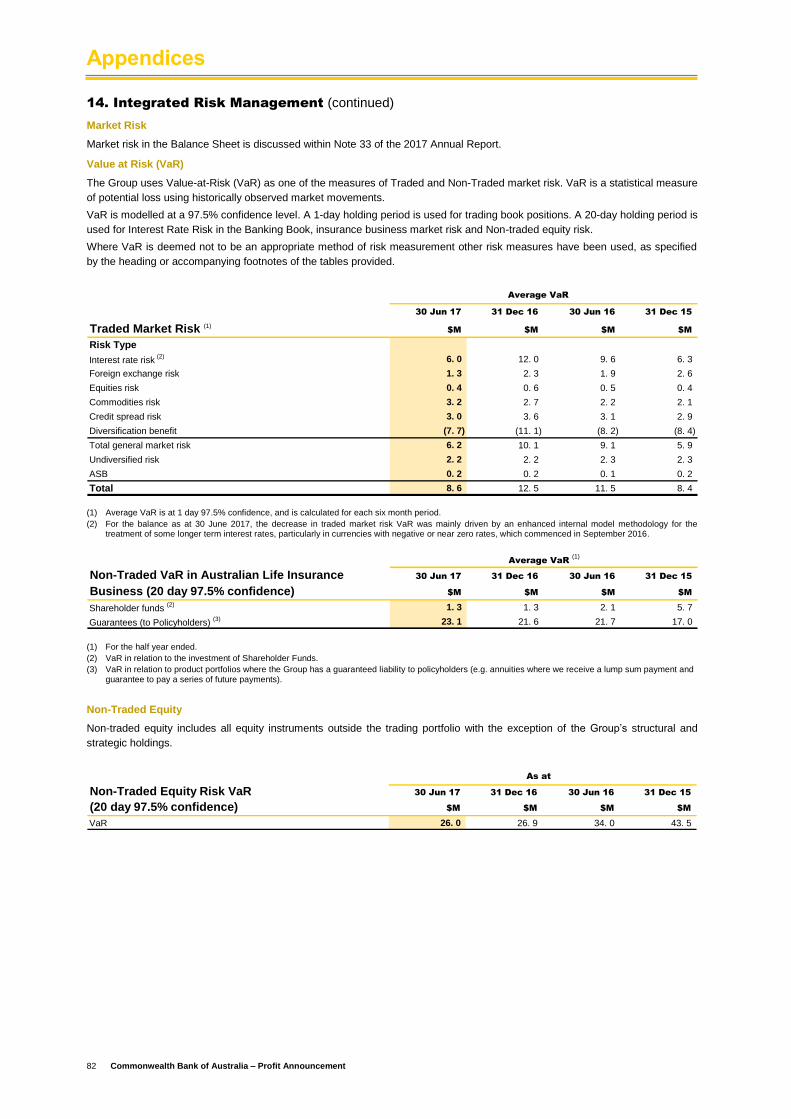
Appendices
82 Commonwealth Bank of Australia – Profit Announcement
14. Integrated Risk Management (continued)
Market Risk
Market risk in the Balance Sheet is discussed within Note 33 of the 2017 Annual Report.
Value at Risk (VaR)
The Group uses Value-at-Risk (VaR) as one of the measures of Traded and Non-Traded market risk. VaR is a statistical measure
of potential loss using historically observed market movements.
VaR is modelled at a 97.5% confidence level. A 1-day holding period is used for trading book positions. A 20-day holding period is
used for Interest Rate Risk in the Banking Book, insurance business market risk and Non-traded equity risk.
Where VaR is deemed not to be an appropriate method of risk measurement other risk measures have been used, as specified
by the heading or accompanying footnotes of the tables provided.
30 Jun 17 31 Dec 16 30 Jun 16 31 Dec 15
Traded Market Risk (1) $M $M $M $M
Risk Type
Interest rate risk (2) 6. 0 12. 0 9. 6 6. 3
Foreign exchange risk 1. 3 2. 3 1. 9 2. 6
Equities risk 0. 4 0. 6 0. 5 0. 4
Commodities risk 3. 2 2. 7 2. 2 2. 1
Credit spread risk 3. 0 3. 6 3. 1 2. 9
Diversification benefit (7. 7) (11. 1) (8. 2) (8. 4)
Total general market risk 6. 2 10. 1 9. 1 5. 9
Undiversified risk 2. 2 2. 2 2. 3 2. 3
ASB 0. 2 0. 2 0. 1 0. 2
Total 8. 6 12. 5 11. 5 8. 4
Average VaR
(1) Average VaR is at 1 day 97.5% confidence, and is calculated for each six month period.
(2) For the balance as at 30 June 2017, the decrease in traded market risk VaR was mainly driven by an enhanced internal model methodology for the treatment of some longer term interest rates, particularly in currencies with negative or near zero rates, which commenced in September 2016.
Non-Traded VaR in Australian Life Insurance 30 Jun 17 31 Dec 16 30 Jun 16 31 Dec 15
Business (20 day 97.5% confidence) $M $M $M $M
Shareholder funds (2) 1. 3 1. 3 2. 1 5. 7
Guarantees (to Policyholders) (3) 23. 1 21. 6 21. 7 17. 0
Average VaR (1)
(1) For the half year ended.
(2) VaR in relation to the investment of Shareholder Funds.
(3) VaR in relation to product portfolios where the Group has a guaranteed liability to policyholders (e.g. annuities where we receive a lump sum payment and guarantee to pay a series of future payments).
Non-Traded Equity
Non-traded equity includes all equity instruments outside the trading portfolio with the exception of the Group’s structural and
strategic holdings.
Non-Traded Equity Risk VaR 30 Jun 17 31 Dec 16 30 Jun 16 31 Dec 15
(20 day 97.5% confidence) $M $M $M $M
VaR 26. 0 26. 9 34. 0 43. 5
As at

Appendices
Commonwealth Bank of Australia – Profit Announcement 83
14. Integrated Risk Management (continued)
Interest Rate Risk in the Banking Book
Interest Rate Risk in the Banking Book is discussed within Note 33 of the 2017 Annual Report.
(a) Next 12 Months’ Earnings
The potential unfavourable change to the Group’s net interest earnings based on 100 basis point parallel rate shock is as follows:
30 Jun 17 31 Dec 16 30 Jun 16 31 Dec 15
Net Interest Earnings at Risk (1)$M $M $M $M
Average monthly exposure AUD 284. 6 284. 9 307. 6 324. 6
NZD 23. 0 27. 9 31. 0 29. 5
High month exposure AUD 352. 3 309. 7 338. 5 408. 7
NZD 31. 9 33. 5 38. 9 37. 7
Low month exposure AUD 248. 9 260. 7 286. 5 227. 1
NZD 17. 4 21. 4 16. 5 23. 9 (1) For the half year ended. NZD amounts are presented in NZD.
(b) Economic Value
A 20 day 97.5% VaR measure is used to capture the economic impact of adverse changes in interest rates on all banking book
assets and liabilities.
30 Jun 17 31 Dec 16 30 Jun 16 31 Dec 15
$M $M $M $M
AUD Interest rate risk 92. 9 99. 3 79. 5 51. 8
NZD Interest rate risk (2) 4. 4 4. 7 3. 3 3. 8
Non-Traded Interest Rate Risk
(20 day 97.5% confidence)
Average VaR (1)
(1) For the half year ended. NZD amounts are presented in NZD.
(2) Relates specifically to ASB data as at month end.
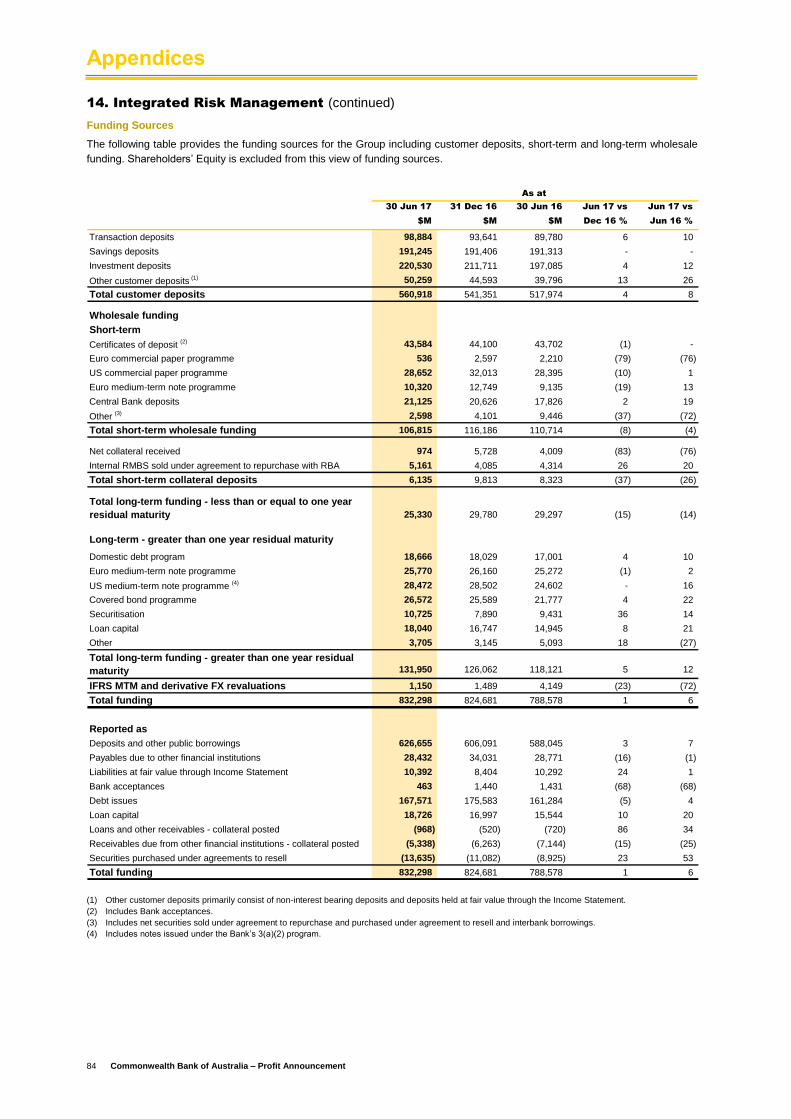
Appendices
84 Commonwealth Bank of Australia – Profit Announcement
14. Integrated Risk Management (continued)
Funding Sources
The following table provides the funding sources for the Group including customer deposits, short-term and long-term wholesale
funding. Shareholders’ Equity is excluded from this view of funding sources.
30 Jun 17 31 Dec 16 30 Jun 16 Jun 17 vs Jun 17 vs
$M $M $M Dec 16 % Jun 16 %
Transaction deposits 98,884 93,641 89,780 6 10
Savings deposits 191,245 191,406 191,313 - -
Investment deposits 220,530 211,711 197,085 4 12
Other customer deposits (1) 50,259 44,593 39,796 13 26
Total customer deposits 560,918 541,351 517,974 4 8
Wholesale funding
Short-term
Certificates of deposit (2) 43,584 44,100 43,702 (1) -
Euro commercial paper programme 536 2,597 2,210 (79) (76)
US commercial paper programme 28,652 32,013 28,395 (10) 1
Euro medium-term note programme 10,320 12,749 9,135 (19) 13
Central Bank deposits 21,125 20,626 17,826 2 19
Other (3) 2,598 4,101 9,446 (37) (72)
Total short-term wholesale funding 106,815 116,186 110,714 (8) (4)
Net collateral received 974 5,728 4,009 (83) (76)
Internal RMBS sold under agreement to repurchase with RBA 5,161 4,085 4,314 26 20
Total short-term collateral deposits 6,135 9,813 8,323 (37) (26)
Total long-term funding - less than or equal to one year
residual maturity 25,330 29,780 29,297 (15) (14)
Long-term - greater than one year residual maturity
Domestic debt program 18,666 18,029 17,001 4 10
Euro medium-term note programme 25,770 26,160 25,272 (1) 2
US medium-term note programme (4) 28,472 28,502 24,602 - 16
Covered bond programme 26,572 25,589 21,777 4 22
Securitisation 10,725 7,890 9,431 36 14
Loan capital 18,040 16,747 14,945 8 21
Other 3,705 3,145 5,093 18 (27)
Total long-term funding - greater than one year residual
maturity 131,950 126,062 118,121 5 12
IFRS MTM and derivative FX revaluations 1,150 1,489 4,149 (23) (72)
Total funding 832,298 824,681 788,578 1 6
Reported as
Deposits and other public borrowings 626,655 606,091 588,045 3 7
Payables due to other financial institutions 28,432 34,031 28,771 (16) (1)
Liabilities at fair value through Income Statement 10,392 8,404 10,292 24 1
Bank acceptances 463 1,440 1,431 (68) (68)
Debt issues 167,571 175,583 161,284 (5) 4
Loan capital 18,726 16,997 15,544 10 20
Loans and other receivables - collateral posted (968) (520) (720) 86 34
Receivables due from other financial institutions - collateral posted (5,338) (6,263) (7,144) (15) (25)
Securities purchased under agreements to resell (13,635) (11,082) (8,925) 23 53
Total funding 832,298 824,681 788,578 1 6
As at
(1) Other customer deposits primarily consist of non-interest bearing deposits and deposits held at fair value through the Income Statement.
(2) Includes Bank acceptances.
(3) Includes net securities sold under agreement to repurchase and purchased under agreement to resell and interbank borrowings.
(4) Includes notes issued under the Bank’s 3(a)(2) program.

Appendices
Commonwealth Bank of Australia – Profit Announcement 85
15. Counterparty and Other Credit Risk Exposures
Securitisation Vehicles
Reason for establishment – The Group conducts an asset
securitisation program that transfers assets to a Special
Purpose Vehicle (SPV) and issues asset-backed securities to
investors. The Group securitises modest amounts of
residential home loans to issue residential mortgage-backed
securities and covered bonds to diversify the Group’s
wholesale funding.
Control factors – The Group manages these securitisation
vehicles, services assets in the SPV, provides hedging and
provides other facilities such as liquidity facilities. The Group
retains the risks associated with the provision of these
services. The Group is also entitled to any residual income
from the SPVs after all payments due to investors and costs
of the program have been met.
Asset-backed Securities
Asset-backed securities are debt securities where the cash
flow is dependent on the performance of the assets assigned
to the SPV, which may consist of residential mortgages,
commercial mortgages or other types of receivables. The
Group has acquired asset-backed securities primarily as part
of its trading activities (classified as Trading assets), liquidity
management (classified as Available-for-sale investments), or
through investments in SPVs.
The primary source of repayment of the debt instruments is
the cash flow from the underlying assets. Investors in the debt
instruments have no recourse to the general assets of the
sponsor (except in the case of covered bonds where
investors have recourse to both the underlying pool and the
sponsor for repayment of principal and interest). The majority
of the Group’s asset-backed securities portfolio consists of
notes externally rated AAA that are carried at fair value on the
Balance Sheet.
Special Purpose Vehicles
The Group invests in or establishes SPVs in the ordinary
course of business, primarily to provide funding and financial
services for its customers. These SPVs are consolidated in
the Financial Statements whenever they meet the criteria of
control as outlined in Note 36 to the Financial Statements of
the 2017 Annual Report. The definition of control depends
upon substance rather than form and accordingly,
determination of the existence of control involves
management judgement. The Group assesses, at inception
and periodically, whether a SPV should be consolidated
based on the power the Group has over relevant activities of
the entity, and the significance of the Group’s exposure to
variable returns of the structured entity.
The lending and investment arrangements are entered into
under the Group’s approved lending criteria and are subject
to appropriate credit approval processes. The assets arising
from these financing activities are generally included in
Receivables due from other financial institutions, Available-
for-sale investments or Loans, bills discounted and other
receivables. Exposures in the form of guarantees or undrawn
credit lines are included within contingent liabilities and credit
related commitments.
Control factors – The Group may manage these vehicles,
hold minor amounts of capital, provide financing or transact
derivatives with these entities. These entities are generally
consolidated by the Group.
Other Exposures
Leveraged Finance
The Group provides debt financing to companies acquired or
owned by private equity firms which can be highly leveraged.
The businesses are primarily domiciled in Australia and New
Zealand with stable and established earnings and the ability
to reduce borrowing levels.
The Group’s exposure is well diversified across industries and
private equity sponsors. All highly leveraged debt facilities
provided are senior with first ranking security over the cash
flows and assets of the businesses.
Hedge Funds
There were no material movements in exposures to hedge
funds since 30 June 2016 and these exposures are not
considered to be material.
Collateralised Debt Obligations (CDOs) and Credit Linked Notes
The Group has no material direct or indirect exposure to
CDOs or credit linked notes.

Appendices
86 Commonwealth Bank of Australia – Profit Announcement
15. Counterparty and Other Credit Risk Exposures (continued)
Securitisation Vehicles
An analysis of the assets of, and exposures to, consolidated securitisation and covered bond vehicles which the Group has
established or manages is outlined in the tables below.
Covered Bonds Securitisation
30 Jun 17 30 Jun 16 30 Jun 17 30 Jun 16
$M $M $M $M
Carrying amount of transferred assets 31,796 36,770 15,108 13,863
Carrying amount of associated liabilities 28,984 31,802 13,771 12,106
Net position (1) 2,812 4,968 1,337 1,757 (1) Net position on covered bonds excludes hedging derivatives and cash received.
Asset-backed Securities
An analysis of the exposure to non-Group originated asset-backed securities and related facilities is outlined in the tables below.
Carrying Amount
30 Jun 17 30 Jun 16
Summary of Asset-backed Securities $M $M
Commercial mortgage-backed securities 76 35
Residential mortgage-backed securities 6,830 7,118
Other asset-backed securities 624 836
Total 7,530 7,989
Asset-backed Securities by Underlying Asset
Trading Portfolio AFS Portfolio (1)
Other Total
30 Jun 17 30 Jun 16 30 Jun 17 30 Jun 16 30 Jun 17 30 Jun 16 30 Jun 17 30 Jun 16
$M $M $M $M $M $M $M $M
Sub-prime - - - - - - - -
Non-conforming - - 351 355 - - 351 355
Prime mortgages 10 4 6,469 6,759 - - 6,479 6,763
Consumer receivables - - - - - - - -
Other assets - - 700 871 - - 700 871
Total 10 4 7,520 7,985 - - 7,530 7,989 (1) Available-for-sale investments (AFS).
Asset-backed Securities by Credit Rating and Geography
30 Jun 17 30 Jun 16 30 Jun 17 30 Jun 16 30 Jun 17 30 Jun 16 30 Jun 17 30 Jun 16 30 Jun 17 30 Jun 16
$M $M $M $M $M $M $M $M $M $M
Australia 7,484 7,922 1 5 3 3 13 24 7,501 7,954
UK - - 29 35 - - - - 29 35
Total 7,484 7,922 30 40 3 3 13 24 7,530 7,989
AAA & AA A BBB including not rated
BB and below
Total
30 Jun 17 30 Jun 16 30 Jun 17 30 Jun 16 30 Jun 17 30 Jun 16
Warehousing Financing Facilities $M $M $M $M $M $M
Australia 3,544 3,664 1,696 1,408 5,240 5,072
New Zealand 387 362 1,147 121 1,534 483
UK 232 11 71 260 303 271
Total 4,163 4,037 2,914 1,789 7,077 5,826
Funded Commitments Unfunded Commitments Total

Appendices
Commonwealth Bank of Australia – Profit Announcement 87
16. Capital
The tables below show the APRA Basel III capital adequacy calculation at 30 June 2017 together with prior period comparatives.
30 Jun 17 31 Dec 16 30 Jun 16
Risk Weighted Capital Ratios % % %
Common Equity Tier 1 10. 1 9. 9 10. 6
Tier 1 12. 1 11. 5 12. 3
Tier 2 2. 1 2. 2 2. 0
Total Capital 14. 2 13. 7 14. 3
30 Jun 17 31 Dec 16 30 Jun 16
$M $M $M
Ordinary Share Capital and Treasury Shares
Ordinary Share Capital 34,971 34,455 33,845
Treasury Shares (1) 295 254 284
Ordinary Share Capital and Treasury Shares 35,266 34,709 34,129
Reserves
Reserves 1,869 2,144 2,734
Reserves related to non-consolidated subsidiaries (2) (81) (152) (143)
Total Reserves 1,788 1,992 2,591
Retained Earnings and Current Period Profits (3)
Retained earnings and current period profits 26,330 24,662 23,435
Retained earnings adjustment from non-consolidated subsidiaries (4) (537) (505) (259)
Net Retained Earnings 25,793 24,157 23,176
Non-controlling interests
Non-controlling interests (5) 546 551 550
Less ASB perpetual preference shares (505) (505) (505)
Less other non-controlling interests not eligible for inclusion in regulatory capital (41) (46) (45)
Non-controlling interests - - -
Common Equity Tier 1 Capital before regulatory adjustments 62,847 60,858 59,896 (1) Represents shares held by the Group's life insurance operations ($96 million) and employee share scheme trusts ($199 million).
(2) Represents equity reserve balances associated with the insurance and funds management entities, and those entities through which securitisation of the Group's assets are conducted. These entities are classified as non-consolidated subsidiaries by APRA and are excluded from the Level 2 Regulatory Consolidated Banking Group.
(3) Comparative information has been restated to conform to presentation in the current period.
(4) Cumulative current period profit and retained earnings adjustments for subsidiaries not consolidated for regulatory purposes.
(5) Non-controlling interests predominantly comprise ASB Perpetual Preference Shares of NZD550 million issued by a New Zealand subsidiary entity. These are non-redeemable and carry limited voting rights. These are classified as Additional Tier 1 Capital.

Appendices
88 Commonwealth Bank of Australia – Profit Announcement
16. Capital (continued)
30 Jun 17 31 Dec 16 30 Jun 16
$M $M $M
Common Equity Tier 1 regulatory adjustments
Goodwill (1) (7,620) (7,624) (7,603)
Other intangibles (including software) (2) (2,144) (2,104) (2,313)
Capitalised costs and deferred fees (707) (696) (535)
Defined benefit superannuation plan surplus (3) (298) (299) (183)
General reserve for credit losses (4) (412) (372) (386)
Deferred tax asset (1,683) (1,524) (1,443)
Cash flow hedge reserve 107 47 (473)
Employee compensation reserve (164) (107) (132)
Equity investments (5) (2,626) (2,741) (3,120)
Equity investments in non-consolidated subsidiaries (1) (6) (2,673) (1,632) (1,458)
Shortfall of provisions to expected losses (7) (218) (220) (314)
Gain due to changes in own credit risk on fair valued liabilities (128) (147) (161)
Other (122) (114) (112)
Common Equity Tier 1 regulatory adjustments (18,688) (17,533) (18,233)
Common Equity Tier 1 44,159 43,325 41,663
Additional Tier 1 Capital
Basel III complying instruments (8) 8,090 6,450 6,450
Basel III non-complying instruments net of transitional amortisation (9) 635 643 640
Holding of Additional Tier 1 Capital (10) (200) (200) (200)
Additional Tier 1 Capital 8,525 6,893 6,890
Tier 1 Capital 52,684 50,218 48,553
Tier 2 Capital
Basel III complying instruments (11) 7,744 7,639 5,834
Basel III non-complying instruments net of transitional amortisation (12) 1,495 1,580 1,934
Holding of Tier 2 Capital (29) (34) (25)
Prudential general reserve for credit losses (13) 182 188 181
Total Tier 2 Capital 9,392 9,373 7,924
Total Capital 62,076 59,591 56,477 (1) Goodwill excludes $252 million which is included in equity investments in non-consolidated subsidiaries.
(2) Other intangibles (including capitalised software costs), net of any associated deferred tax liability.
(3) In accordance with APRA regulations, the surplus in the Group’s defined benefit superannuation fund, net of any deferred tax liability, must be deducted from Common Equity Tier 1.
(4) Adjustment to ensure the Group has sufficient provisions and capital to cover credit losses estimated to arise over the full life of individual facilities, as required by APRA Prudential Standard APS 220.
(5) Represents the Group’s non-controlling interests in other entities.
(6) Non-consolidated subsidiaries primarily represent the insurance and funds management companies operating within the Colonial Group. The adjustment at 30 June 2017 is net of $665 million of Colonial non-recourse debt and subordinated notes that are subject to APRA approved transitional relief for regulatory capital purposes. Effective 31 December 2016 a number of intermediate holding companies within the Colonial Group were consolidated into the Level 2 Banking Group. The Group’s insurance and fund management companies held $1,322 million of capital in excess of minimum regulatory requirements at 30 June 2017.
(7) Regulatory Expected Loss (pre-tax) using stressed loss given default assumptions associated with the loan portfolio in excess of eligible credit provisions (pre-tax).
(8) As at 30 June 2017, comprises PERLS IX $1,640 million issued March 2017, PERLS VIII $1,450 million issued March 2016, PERLS VII $3,000 million issued in October 2014 and PERLS VI $2,000 million issued in October 2012.
(9) Represents APRA Basel III non-compliant Additional Tier 1 Capital Instruments that are eligible for Basel III transitional relief.
(10) Represents holdings of Additional Tier 1 capital instruments issued by the Colonial Mutual Life Assurance Society Limited.
(11) In the June 17 half year, the Group issued JPY13.3 billion and HKD608 million (December 16 half year issued: USD750 million, NZD400 million (issued through ASB, the Group’s New Zealand subsidiary) and three separate JPY notes totalling JPY40 billion).
(12) Includes both perpetual and term instruments subordinated to depositors and general creditors, having an original maturity of at least five years. APRA require these to be included as if they were unhedged. Term instruments are amortised 20% of the original amount during each of the last five years to maturity. These instruments are eligible for Basel III transitional relief.
(13) Represents the collective provision and general reserve for credit losses for exposures in the Group which are measured for capital purposes under the Standardised approach to credit risk.

Appendices
Commonwealth Bank of Australia – Profit Announcement 89
16. Capital (continued)
30 Jun 17 31 Dec 16 30 Jun 16
Risk Weighted Assets $M $M $M
Credit Risk
Subject to AIRB approach (1)
Corporate (2) 74,663 79,392 71,682
SME corporate (2) 33,067 35,239 29,957
SME retail 4,838 4,747 4,953
SME retail secured by residential mortgage 2,766 2,812 2,813
Sovereign 2,154 6,742 6,622
Bank 12,598 13,481 13,098
Residential mortgage (3) 134,969 115,647 83,758
Qualifying revolving retail 9,414 9,413 9,897
Other retail 15,101 14,970 15,102
Total RWA subject to AIRB approach 289,570 282,443 237,882
Specialised lending exposures subject to slotting criteria (2) 58,752 60,504 56,795
Subject to Standardised approach
Corporate (2) 1,202 1,128 10,982
SME corporate (2) 510 596 4,133
SME retail 6,172 6,089 6,122
Sovereign 271 242 268
Bank 136 192 224
Residential mortgage (2) 5,017 4,788 7,428
Other retail 2,925 2,776 2,750
Other assets 5,291 5,385 5,360
Total RWA subject to Standardised approach 21,524 21,196 37,267
Securitisation 1,584 1,572 1,511
Credit valuation adjustment 4,958 6,332 8,273
Central counterparties 871 1,479 2,302
Total RWA for Credit Risk Exposures 377,259 373,526 344,030
Traded market risk 4,650 5,707 9,439
Interest rate risk in the banking book 21,404 23,498 7,448
Operational risk 33,750 33,750 33,750
Total risk weighted assets 437,063 436,481 394,667
(1) Pursuant to APRA requirements, RWA amounts derived from AIRB risk weight functions have been multiplied by a scaling factor of 1.06. Comparatives
have been restated to conform to presentation in the current period.
(2) APRA has re-accredited the use of the AIRB approach for the Bankwest non-retail portfolio, effective 30 September 2016.
(3) Includes APRA requirements to increase the average risk weight applied to Australian residential mortgages using the AIRB approach (30 June 2017: $15.0 billion, 31 December 2016: $32.0 billion).
Risk Weighted Assets
Total Group RWA increased $0.6 billion or 0.1% on the
prior half to $437.1 billion.
Credit Risk RWA
After allowing for an increase in risk weighted assets of
$15.0 billion to meet APRA requirements for Australian
residential mortgages, there was a decrease of $11.3 billion
on the prior half. This was primarily due to:
Refresh of credit risk estimates across non-retail
portfolios;
Improved credit quality across most non-retail
portfolios;
Foreign currency movements; and
Reduction of exposure across corporate portfolios.
These decreases were partly offset by:
A seasonal increase in retail arrears; and
An increase in RWA for New Zealand residential
mortgages due to changes in prudential requirements.
Traded Market Risk RWA
Traded market risk RWA decreased by $1.1 billion or
18.5%. The decrease resulted from reduced risk exposures
measured under the Internal Model Approach and
improved efficiency in capital management.
Interest Rate Risk in the Banking Book (IRRBB) RWA
IRRBB RWA decreased $2.1 billion or 8.9%. This is a result
of interest rate risk management activity and model
enhancements offset by increased structural hedging.
Operational Risk RWA
Operational Risk RWA remained unchanged over the prior
half, representing the regulatory minimum threshold.

Appendices
90 Commonwealth Bank of Australia – Profit Announcement
17. Shareholders’ Equity
30 Jun 17 30 Jun 16 30 Jun 17 31 Dec 16
$M $M $M $M
Ordinary Share Capital
Shares on issue:
Opening balance 34,129 27,898 34,709 34,129
Issue of shares (net of issue costs) (6) 5,022 - (6)
Dividend reinvestment plan (net of issue costs) (1) 1,143 1,209 557 586
35,266 34,129 35,266 34,709
Less treasury shares:
Opening balance (284) (279) (254) (284)
Purchase of treasury shares (2) (92) (108) (65) (27)
Sale and vesting of treasury shares (2) 81 103 24 57
(295) (284) (295) (254)
Closing balance 34,971 33,845 34,971 34,455
Other Equity Instruments
Opening balance - 939 - -
Redemptions (3) - (939) - -
Closing balance - - - -
Retained Profits
Opening balance (4) 23,435 21,340 24,662 23,435
Actuarial gains from defined benefit superannuation plans 175 10 33 142
Losses on liabilities at fair value due to changes in own credit risk (3) (1) (1) (2)
Realised gains and dividend income on treasury shares 26 20 11 15
Operating profit attributable to Equity holders of the Bank (4) 9,928 9,223 5,033 4,895
Total available for appropriation 33,561 30,592 29,738 28,485
Net loss on sale/redemption of other equity (5) - (10) - -
Transfers from/(to) general reserve 33 (120) 54 (21)
Transfers from asset revaluation reserve (27) 19 (33) 6
Transfers to employee compensation reserve - (2) - -
Interim dividend - cash component (2,871) (2,829) (2,871) -
Interim dividend - dividend reinvestment plan (1) (558) (552) (558) -
Final dividend - cash component (3,222) (2,958) - (3,222)
Final dividend - dividend reinvestment plan (1) (586) (655) - (586)
Other dividends - (50) - -
Closing balance 26,330 23,435 26,330 24,662
Full Year Ended Half Year Ended
(1) The determined dividend includes an amount attributable to Dividend Reinvestment Plan (DRP) of $558 million (interim 2016/2017), $586 million (final
2015/2016), $552 million (interim 2015/2016) and $655 million (final 2014/2015) with $557 million, $586 million, $552 million and $657 million ordinary shares being issued under plan rules, which include the carry forward of DRP balance from previous dividends.
(2) Relates to the movement in treasury shares held within Life Insurance Statutory Funds and the employee share scheme trust.
(3) Redemption of Trust Preferred Securities (TPS 2006) on 15 March 2016.
(4) Comparative information has been restated to conform to presentation in the current period.
(5) Includes other equity instruments and non-controlling interests.

Appendices
Commonwealth Bank of Australia – Profit Announcement 91
17. Shareholders’ Equity (continued)
30 Jun 17 30 Jun 16 30 Jun 17 31 Dec 16
$M $M $M $M
Reserves
General Reserve
Opening balance 939 819 960 939
Appropriation (to)/from retained profits (33) 120 (54) 21
Closing balance 906 939 906 960
Asset Revaluation Reserve
Opening balance 173 191 167 173
Revaluation of properties 32 2 32 -
Transfer to retained profits 27 (19) 33 (6)
Tax on revaluation of properties (9) (1) (9) -
Closing balance 223 173 223 167
Foreign Currency Translation Reserve
Opening balance 739 356 822 739
Currency translation adjustments of foreign operations (315) 389 (384) 69
Currency translation on net investment hedge 14 (12) 5 9
Tax on translation adjustments 19 6 14 5
Closing balance 457 739 457 822
Cash Flow Hedge Reserve
Opening balance 473 263 (47) 473
Gains and losses on cash flow hedging instruments:
Recognised in other comprehensive income (1,282) 250 (251) (1,031)
Transferred to Income Statement:
Interest income (1,241) (968) (563) (678)
Interest expense 1,684 1,018 724 960
Tax on cash flow hedging instruments 259 (90) 30 229
Closing balance (107) 473 (107) (47)
Employee Compensation Reserve
Opening balance 132 122 107 132
Current period movement 32 10 57 (25)
Closing balance 164 132 164 107
Available-for-sale Investments Reserve
Opening balance 278 594 135 278
Net gains and (losses) on revaluation of available-for-sale investments 414 (236) 173 241
Net (gains) and losses on available-for-sale investments transferred to Income
Statement on disposal (464) (222) (27) (437)
Tax on available-for-sale investments (2) 142 (55) 53
Closing balance 226 278 226 135
Total Reserves 1,869 2,734 1,869 2,144
Shareholders' Equity attributable to Equity holders of the Bank 63,170 60,014 63,170 61,261
Shareholders' Equity attributable to Non-controlling interests 546 550 546 551
Total Shareholders' Equity 63,716 60,564 63,716 61,812
Full Year Ended Half Year Ended
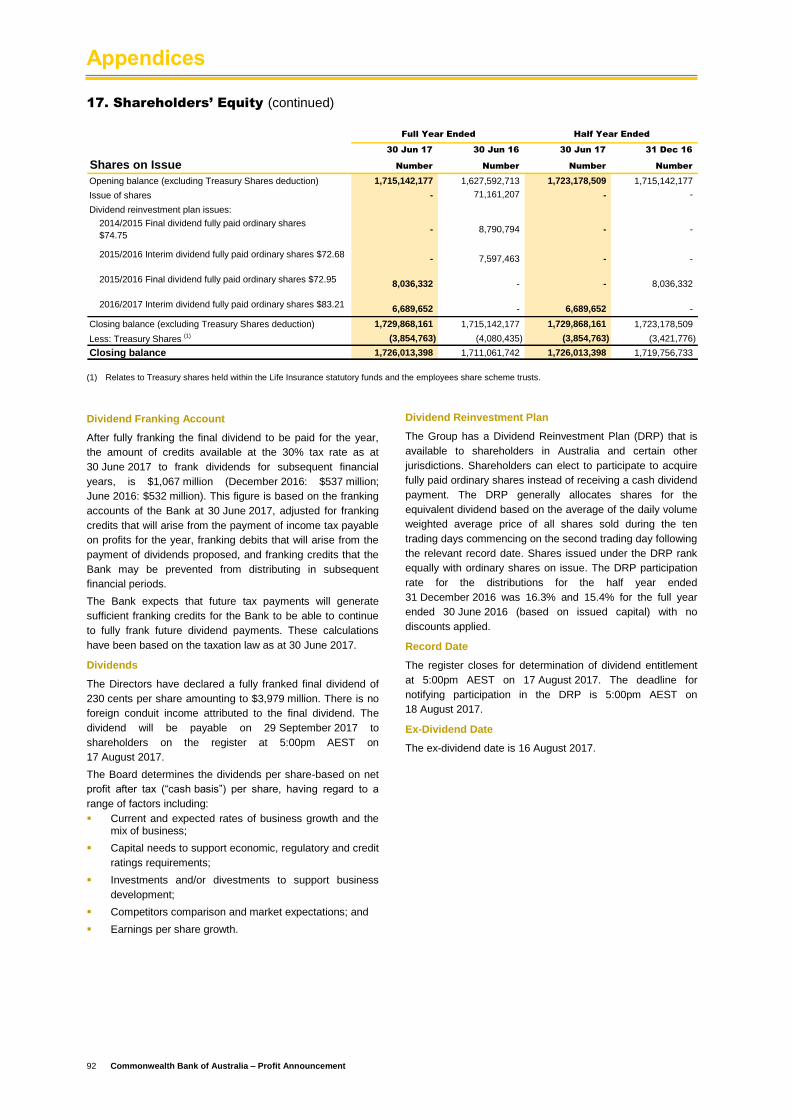
Appendices
92 Commonwealth Bank of Australia – Profit Announcement
17. Shareholders’ Equity (continued)
30 Jun 17 30 Jun 16 30 Jun 17 31 Dec 16
Shares on Issue Number Number Number Number
Opening balance (excluding Treasury Shares deduction) 1,715,142,177 1,627,592,713 1,723,178,509 1,715,142,177
Issue of shares - 71,161,207 - -
Dividend reinvestment plan issues:
2014/2015 Final dividend fully paid ordinary shares
$74.75 - 8,790,794 - -
2015/2016 Interim dividend fully paid ordinary shares $72.68- 7,597,463 - -
2015/2016 Final dividend fully paid ordinary shares $72.958,036,332 - - 8,036,332
2016/2017 Interim dividend fully paid ordinary shares $83.216,689,652 - 6,689,652 -
Closing balance (excluding Treasury Shares deduction) 1,729,868,161 1,715,142,177 1,729,868,161 1,723,178,509
Less: Treasury Shares (1) (3,854,763) (4,080,435) (3,854,763) (3,421,776)
Closing balance 1,726,013,398 1,711,061,742 1,726,013,398 1,719,756,733
Full Year Ended Half Year Ended
(1) Relates to Treasury shares held within the Life Insurance statutory funds and the employees share scheme trusts.
(2)
Dividend Franking Account
After fully franking the final dividend to be paid for the year,
the amount of credits available at the 30% tax rate as at
30 June 2017 to frank dividends for subsequent financial
years, is $1,067 million (December 2016: $537 million;
June 2016: $532 million). This figure is based on the franking
accounts of the Bank at 30 June 2017, adjusted for franking
credits that will arise from the payment of income tax payable
on profits for the year, franking debits that will arise from the
payment of dividends proposed, and franking credits that the
Bank may be prevented from distributing in subsequent
financial periods.
The Bank expects that future tax payments will generate
sufficient franking credits for the Bank to be able to continue
to fully frank future dividend payments. These calculations
have been based on the taxation law as at 30 June 2017.
Dividends
The Directors have declared a fully franked final dividend of
230 cents per share amounting to $3,979 million. There is no
foreign conduit income attributed to the final dividend. The
dividend will be payable on 29 September 2017 to
shareholders on the register at 5:00pm AEST on
17 August 2017.
The Board determines the dividends per share-based on net
profit after tax (“cash basis”) per share, having regard to a
range of factors including:
Current and expected rates of business growth and the mix of business;
Capital needs to support economic, regulatory and credit
ratings requirements;
Investments and/or divestments to support business
development;
Competitors comparison and market expectations; and
Earnings per share growth.
Dividend Reinvestment Plan
The Group has a Dividend Reinvestment Plan (DRP) that is
available to shareholders in Australia and certain other
jurisdictions. Shareholders can elect to participate to acquire
fully paid ordinary shares instead of receiving a cash dividend
payment. The DRP generally allocates shares for the
equivalent dividend based on the average of the daily volume
weighted average price of all shares sold during the ten
trading days commencing on the second trading day following
the relevant record date. Shares issued under the DRP rank
equally with ordinary shares on issue. The DRP participation
rate for the distributions for the half year ended
31 December 2016 was 16.3% and 15.4% for the full year
ended 30 June 2016 (based on issued capital) with no
discounts applied.
Record Date
The register closes for determination of dividend entitlement
at 5:00pm AEST on 17 August 2017. The deadline for
notifying participation in the DRP is 5:00pm AEST on
18 August 2017.
Ex-Dividend Date
The ex-dividend date is 16 August 2017.

Appendices
Commonwealth Bank of Australia – Profit Announcement 93
18. ASX Appendix 4E
Cross Reference Index Page
Details of Reporting Period and Previous Period (Rule 4.3A Item No. 1) Inside front cover
Results for Announcement to the Market (Rule 4.3A Item No. 2) Inside front cover
Income Statement and Statement of Comprehensive Income (Rule 4.3A Item No. 3) 50
Balance Sheets (Rule 4.3A Item No. 4) 52
Statement of Cash Flows (Rule 4.3A Item No. 5) 54
Statement of Changes in Equity (Rule 4.3A Item No. 6) 53
Consolidated Retained Profits Reconciliation (Rule 4.3A Item No. 6) 90
Dividends (Rule 4.3A Item No. 7) 92
Dividend Dates (Rule 4.3A Item No. 7) Inside front cover
Dividend Reinvestment Plan (Rule 4.3A Item No. 8) 92
Net Tangible Assets per Security (Rule 4.3A Item No. 9) 103
Details of Entities over which Control was Gained or Lost during the Year (Rule 4.3A Item No. 10) 99
Details of Associates and Joint Ventures (Rule 4.3A Item No. 11) 93
Other Significant Information (Rule 4.3A Item No. 12) 94
Foreign Entities (Rule 4.3A Item No. 13) 94
Commentary on Results (Rule 4.3A Item No. 14) 2
Details of Associates and Joint Ventures (Rule 4.3A Item No. 11)
As at 30 June 2017 Ownership Interest Held (%)
AHL Holdings Pty Limited (1) 80%
Aegis Correctional Partnership Pty Limited 50%
Aegis Correctional Partnership Trust 50%
Aegis Securitisation Nominees Pty Limited 50%
Aegis Securitisation Trust 50%
equigroup Holdings Pty Limited 50%
First State Cinda Fund Management Co. Ltd. 46%
BoCommLife Insurance Company Limited 38%
Countplus Limited 36%
Vipro Pty Limited 33%
Cardlink Services Limited 25%
Paymark Limited (2) 25%
Qilu Bank Co., Ltd. (3) 20%
Vietnam International Commercial Joint Stock Bank 20%
Payments NZ Limited 19%
A.C.N 619 102 608 Pty Ltd. (4) 19%
Bank of Hangzhou Co., Ltd. (3) 18%
Property Exchange Australia Ltd 13%
First State European Diversified Infrastructure Fund FCP-SIF 3%
First State European Diversified Infrastructure Fund II 3%
(1) The Group’s 80% interest in AHL Holdings Pty Limited (trading as Aussie Home Loans) is jointly controlled as the key financial and operating decisions
require the unanimous consent of all directors.
(2) Formerly known as Electronic Transaction Services Limited.
(3) Ownership interest held refers to ordinary shares.
(4) This associate operates in quantum computing in partnership with the University of New South Wales.

Appendices
94 Commonwealth Bank of Australia – Profit Announcement
18. ASX Appendix 4E (continued)
Other Significant Information (Rule 4.3A Item No. 12)
The Bank expects the DRP for the final dividend for the year ended 30 June 2017 will be satisfied by the issue of shares of
approximately $1.4 billion.
AUSTRAC Civil Proceedings
On 3 August 2017, Australian Transaction Reports and Analysis Centre (AUSTRAC) commenced civil penalty proceedings
against CBA. CBA takes the allegations made by AUSTRAC very seriously and will file a defence in relation to this matter, which
will take significant time to prepare. The actual outcome in this matter will be determined by a Court in accordance with
established legal principles.
The AUSTRAC statement of claim relates to alleged past and ongoing contraventions of four provisions of the Anti-Money
Laundering and Counter-Terrorism Financing Act 2006 (Cth). To the extent that contraventions may be established, a Court will
ordinarily take into account a range of factors in setting penalties. One factor is the extent to which any contraventions arise from
a single course of conduct. For example, AUSTRAC alleges that approximately 53,000 threshold transaction reports were lodged
late. Late lodgement carries a penalty of up to $18 million. However, these alleged contraventions could be considered to arise
from a single course of conduct to the extent that they emanated from the same systems error. Ultimately, a Court will seek to
ensure that, overall, any civil penalties are just and appropriate and do not exceed what is proper having regard to the totality of
established contraventions. Under the Act, the only mechanism available to AUSTRAC to secure a pecuniary penalty from CBA is
by taking court action.
What we can say about these proceedings is limited until they have run their course. CBA is reviewing the allegations in the 580
page statement of claim and at this time it is not possible to reliably estimate the possible financial effect on the Group. It is not
appropriate to disclose any detailed information about the subject matter of the claims as court proceedings are on foot and such
information would be highly likely to be prejudicial to our position.
Aussie Home Loan Acquisition
On 4 August 2017, John Symond exercised his put option, which will require the Group to acquire a 20% interest in AHL. The
purchase price for the remaining 20% interest will be determined in accordance with the terms agreed in 2012. The purchase
consideration will be paid in the issue of CBA shares. The Group will consolidate AHL from completion of the acquisition which is
currently expected to be in late August 2017.
Strategic Corporate Actions
We are committed to securing and enhancing the financial wellbeing of people, businesses and communities, and the provision of
insurance products to our customers remains core to that vision. CommInsure and Sovereign are strong businesses with scale,
expertise, competitive products and access to attractive distribution channels. We are in discussions with third parties in relation
to their potential interest in our life insurance businesses in Australia and New Zealand. The outcome of those discussions is
uncertain. While the discussions may lead to the divestment of those businesses, we will also consider a full range of alternatives,
including retaining the businesses, reinsurance arrangements or other strategic options.
Foreign Entities (Rule 4.3A Item No. 13)
Not Applicable.
Compliance Statement
This preliminary final report for the year ended 30 June 2017 is prepared in accordance with the ASX listing rules. It should be
read in conjunction with any announcements to the market made by the Group during the year.
The preliminary final report has been prepared in accordance with Accounting Standards in Australia.
PricewaterhouseCoopers has audited the financial statements contained within the Commonwealth Bank of Australia Annual
Report and has issued an unmodified audit report. The Annual Report is currently being finalised in publishable form and will be
available, including a copy of the PricewaterhouseCoopers report, on 14 August 2017. This preliminary final report has not been
subject to audit by PricewaterhouseCoopers. The preceding financial information contained in the Financial Statements section of
this preliminary final report includes financial information extracted from the audited financial statements together with financial
information that has not been audited.
Taryn Morton
Company Secretary
8 August 2017

Appendices
Commonwealth Bank of Australia – Profit Announcement 95
19. Profit Reconciliation
Treasury Net profit
Net profit Hedging Bankwest shares after tax
after tax and IFRS non-cash valuation Policyholder Investment "statutory
"cash basis" volatility items (1)
adjustment tax experience basis"
Profit Reconciliation $M $M $M $M $M $M $M
Group
Interest income 33,293 - - - - - 33,293
Interest expense (15,693) - - - - - (15,693)
Net interest income 17,600 - - - - - 17,600
Other banking income 5,520 106 - - - - 5,626
Total banking income 23,120 106 - - - - 23,226
Funds management income 2,034 - - (22) 30 9 2,051
Insurance income 786 - - - 2 56 844
Total operating income 25,940 106 - (22) 32 65 26,121
Investment experience 65 - - - - (65) -
Total income 26,005 106 - (22) 32 - 26,121
Operating expenses (11,078) - (4) - - - (11,082)
Loan impairment expense (1,095) - - - - - (1,095)
Net profit before tax 13,832 106 (4) (22) 32 - 13,944
Corporate tax (expense)/benefit (3,927) (33) 1 (1) (32) - (3,992)
Non-controlling interests (24) - - - - - (24)
Net profit after tax 9,881 73 (3) (23) - - 9,928
Full Year Ended 30 June 2017
(1) Includes merger related amortisation through operating expenses of $4 million, and an income tax benefit of $1 million.

Appendices
96 Commonwealth Bank of Australia – Profit Announcement
19. Profit Reconciliation (continued)
Treasury Net profit
Net profit Hedging Bankwest shares after tax
after tax and IFRS non-cash valuation Policyholder Investment "statutory
"cash basis" volatility items (2)
adjustment tax experience basis"
Profit Reconciliation $M $M $M $M $M $M $M
Group
Interest income 33,817 - - - - - 33,817
Interest expense (16,882) - - - - - (16,882)
Net interest income 16,935 - - - - - 16,935
Other banking income 4,860 (284) - - - - 4,576
Total banking income 21,795 (284) - - - - 21,511
Funds management income 2,016 - - 14 (8) 39 2,061
Insurance income 795 - - - 109 102 1,006
Total operating income 24,606 (284) - 14 101 141 24,578
Investment experience 141 - - - - (141) -
Total income 24,747 (284) - 14 101 - 24,578
Operating expenses (10,434) - (39) - - - (10,473)
Loan impairment expense (1,256) - - - - - (1,256)
Net profit before tax 13,057 (284) (39) 14 101 - 12,849
Corporate tax (expense)/benefit (3,592) 85 12 (10) (101) - (3,606)
Non-controlling interests (20) - - - - - (20)
Net profit after tax 9,445 (199) (27) 4 - - 9,223
Full Year Ended 30 June 2016 (1)
(1) Comparative information has been restated to conform to presentation in the current period.
(2) Includes merger related amortisation through operating expenses of $39 million, and an income tax benefit of $12 million.
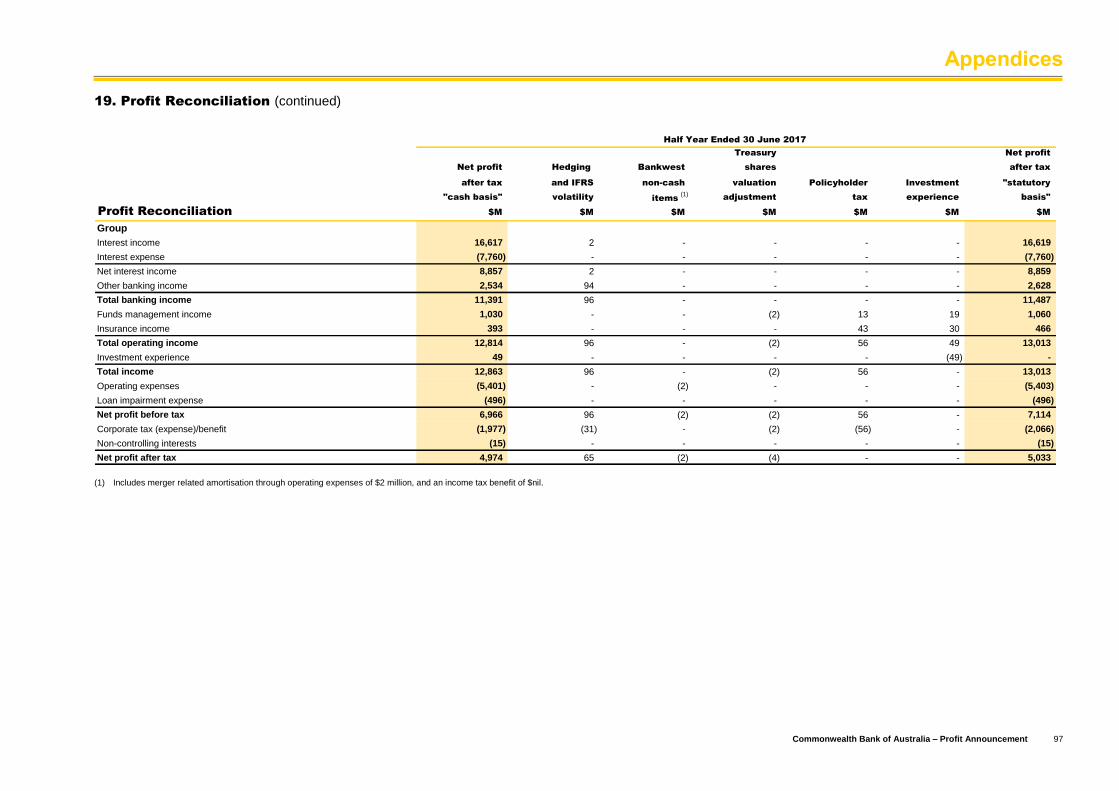
Appendices
Commonwealth Bank of Australia – Profit Announcement 97
19. Profit Reconciliation (continued)
Treasury Net profit
Net profit Hedging Bankwest shares after tax
after tax and IFRS non-cash valuation Policyholder Investment "statutory
"cash basis" volatility items (1)
adjustment tax experience basis"
Profit Reconciliation $M $M $M $M $M $M $M
Group
Interest income 16,617 2 - - - - 16,619
Interest expense (7,760) - - - - - (7,760)
Net interest income 8,857 2 - - - - 8,859
Other banking income 2,534 94 - - - - 2,628
Total banking income 11,391 96 - - - - 11,487
Funds management income 1,030 - - (2) 13 19 1,060
Insurance income 393 - - - 43 30 466
Total operating income 12,814 96 - (2) 56 49 13,013
Investment experience 49 - - - - (49) -
Total income 12,863 96 - (2) 56 - 13,013
Operating expenses (5,401) - (2) - - - (5,403)
Loan impairment expense (496) - - - - - (496)
Net profit before tax 6,966 96 (2) (2) 56 - 7,114
Corporate tax (expense)/benefit (1,977) (31) - (2) (56) - (2,066)
Non-controlling interests (15) - - - - - (15)
Net profit after tax 4,974 65 (2) (4) - - 5,033
Half Year Ended 30 June 2017
(1) Includes merger related amortisation through operating expenses of $2 million, and an income tax benefit of $nil.

Appendices
98 Commonwealth Bank of Australia – Profit Announcement
20. Notes to the Statement of Cash Flows
(a) Reconciliation of Net Profit after Income Tax to Net Cash used in Operating Activities
30 Jun 17 30 Jun 16
$M $M
Net profit after income tax (1) 9,952 9,243
Increase in interest receivable (14) (148)
Decrease in interest payable (26) (312)
Net decrease/(increase) in assets at fair value through Income Statement (excluding life insurance) 2,788 (8,538)
Net gain on sale of controlled entities and associates (2) -
Net movement in derivative assets/liabilities (492) 5,988
Net (gain)/loss on sale of property, plant and equipment (6) 21
Equity accounting profit (292) (289)
Loan impairment expense 1,095 1,256
Depreciation and amortisation (including asset write downs) 1,229 857
Increase in liabilities at fair value through Income Statement (excluding life insurance) 121 1,651
Increase/(decrease) in other provisions 114 (78)
Increase in income taxes payable 603 486
Decrease in deferred tax liabilities (14) (162)
(Increase)/decrease in deferred tax assets (1) (573) 66
(Increase)/decrease in accrued fees/reimbursements receivable (238) 137
Increase/(decrease) in accrued fees and other items payable (1) 18 (150)
Decrease in life insurance contract policy liabilities (1,240) (991)
Cash flow hedge ineffectiveness (20) 5
Loss/(gains) on changes in fair value of hedged items 799 (642)
Changes in operating assets and liabilities arising from cash flow movements (15,228) (13,640)
Other (1) 619 679
Net cash used in operating activities (807) (4,561)
Full Year Ended
(1) Comparative information has been restated to conform to presentation in the current period.
(b) Reconciliation of Cash
For the purposes of the Statement of Cash Flows, cash includes cash and money at short call.
30 Jun 17 30 Jun 16
$M $M
Notes, coins and cash at banks 14,635 12,103
Other short term liquid assets 8,482 2,344
Cash and cash equivalents at end of year 23,117 14,447
As at
(c) Non-Cash Financing and Investing Activities
30 Jun 17 30 Jun 16
$M $M
Shares issued under the Dividend Reinvestment Plan (1) 1,143 1,209
Full Year Ended
(1) No part of the Dividend Reinvestment Plan paid out in the 2017 financial year was satisfied through the on-market purchase and transfer of shares to
participating shareholders (June 2016: $nil million).
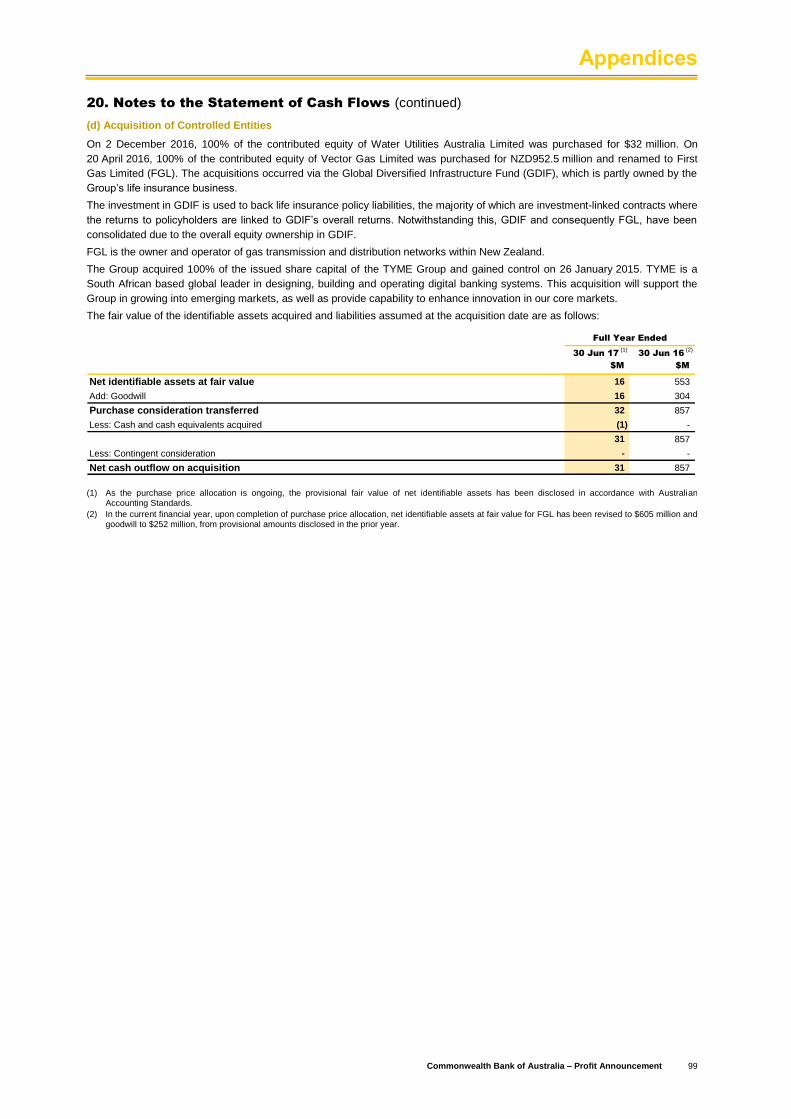
Appendices
Commonwealth Bank of Australia – Profit Announcement 99
20. Notes to the Statement of Cash Flows (continued)
(d) Acquisition of Controlled Entities
On 2 December 2016, 100% of the contributed equity of Water Utilities Australia Limited was purchased for $32 million. On
20 April 2016, 100% of the contributed equity of Vector Gas Limited was purchased for NZD952.5 million and renamed to First
Gas Limited (FGL). The acquisitions occurred via the Global Diversified Infrastructure Fund (GDIF), which is partly owned by the
Group’s life insurance business.
The investment in GDIF is used to back life insurance policy liabilities, the majority of which are investment-linked contracts where
the returns to policyholders are linked to GDIF’s overall returns. Notwithstanding this, GDIF and consequently FGL, have been
consolidated due to the overall equity ownership in GDIF.
FGL is the owner and operator of gas transmission and distribution networks within New Zealand.
The Group acquired 100% of the issued share capital of the TYME Group and gained control on 26 January 2015. TYME is a
South African based global leader in designing, building and operating digital banking systems. This acquisition will support the
Group in growing into emerging markets, as well as provide capability to enhance innovation in our core markets.
The fair value of the identifiable assets acquired and liabilities assumed at the acquisition date are as follows:
30 Jun 17 (1)
30 Jun 16 (2)
$M $M
Net identifiable assets at fair value 16 553
Add: Goodwill 16 304
Purchase consideration transferred 32 857
Less: Cash and cash equivalents acquired (1) -
31 857
Less: Contingent consideration - -
Net cash outflow on acquisition 31 857
Full Year Ended
(1) As the purchase price allocation is ongoing, the provisional fair value of net identifiable assets has been disclosed in accordance with Australian
Accounting Standards.
(2) In the current financial year, upon completion of purchase price allocation, net identifiable assets at fair value for FGL has been revised to $605 million and goodwill to $252 million, from provisional amounts disclosed in the prior year.
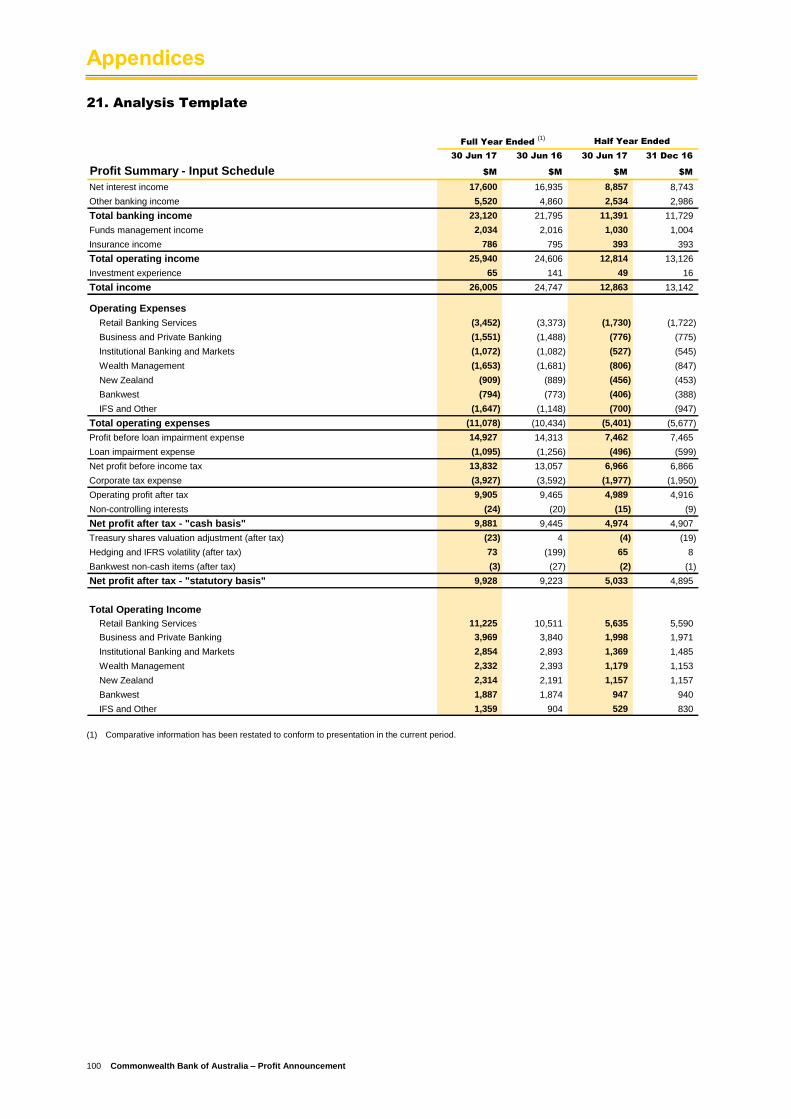
Appendices
100 Commonwealth Bank of Australia – Profit Announcement
21. Analysis Template
30 Jun 17 30 Jun 16 30 Jun 17 31 Dec 16
Profit Summary - Input Schedule $M $M $M $M
Net interest income 17,600 16,935 8,857 8,743
Other banking income 5,520 4,860 2,534 2,986
Total banking income 23,120 21,795 11,391 11,729
Funds management income 2,034 2,016 1,030 1,004
Insurance income 786 795 393 393
Total operating income 25,940 24,606 12,814 13,126
Investment experience 65 141 49 16
Total income 26,005 24,747 12,863 13,142
Operating Expenses
Retail Banking Services (3,452) (3,373) (1,730) (1,722)
Business and Private Banking (1,551) (1,488) (776) (775)
Institutional Banking and Markets (1,072) (1,082) (527) (545)
Wealth Management (1,653) (1,681) (806) (847)
New Zealand (909) (889) (456) (453)
Bankwest (794) (773) (406) (388)
IFS and Other (1,647) (1,148) (700) (947)
Total operating expenses (11,078) (10,434) (5,401) (5,677)
Profit before loan impairment expense 14,927 14,313 7,462 7,465
Loan impairment expense (1,095) (1,256) (496) (599)
Net profit before income tax 13,832 13,057 6,966 6,866
Corporate tax expense (3,927) (3,592) (1,977) (1,950)
Operating profit after tax 9,905 9,465 4,989 4,916
Non-controlling interests (24) (20) (15) (9)
Net profit after tax - "cash basis" 9,881 9,445 4,974 4,907
Treasury shares valuation adjustment (after tax) (23) 4 (4) (19)
Hedging and IFRS volatility (after tax) 73 (199) 65 8
Bankwest non-cash items (after tax) (3) (27) (2) (1)
Net profit after tax - "statutory basis" 9,928 9,223 5,033 4,895
Total Operating Income
Retail Banking Services 11,225 10,511 5,635 5,590
Business and Private Banking 3,969 3,840 1,998 1,971
Institutional Banking and Markets 2,854 2,893 1,369 1,485
Wealth Management 2,332 2,393 1,179 1,153
New Zealand 2,314 2,191 1,157 1,157
Bankwest 1,887 1,874 947 940
IFS and Other 1,359 904 529 830
Full Year Ended (1)
Half Year Ended
(1) Comparative information has been restated to conform to presentation in the current period.

Appendices
Commonwealth Bank of Australia – Profit Announcement 101
21. Analysis Template (continued)
30 Jun 17 30 Jun 16 30 Jun 17 31 Dec 16
Profit Summary - Input Schedule $M $M $M $M
Other Data
Net interest income 17,600 16,935 8,857 8,743
Average interest earning assets 834,741 790,596 846,619 823,058
Average net assets (2) 62,031 57,678 62,764 61,188
Average non-controlling interests (2) 549 555 549 551
Average other equity instruments (2) - 626 - -
Average treasury shares (2) (277) (296) (274) (269)
Distributions - other equity instruments - 50 - -
Interest expense (after tax) - PERLS III - 16 - -
Interest expense (after tax) - PERLS VI 83 89 41 42
Interest expense (after tax) - PERLS VII 71 76 35 36
Interest expense (after tax) - PERLS VIII 52 14 26 26
Interest expense (after tax) - PERLS IX 12 - 12 -
Weighted average number of shares - statutory basic (M) 1,719 1,692 1,723 1,715
Weighted average number of shares - statutory diluted (M) 1,815 1,771 1,816 1,806
Weighted average number of shares - cash basic (M) 1,720 1,693 1,724 1,717
Weighted average number of shares - cash diluted (M) 1,816 1,772 1,817 1,808
Weighted average number of shares - PERLS III (M) - 11 - -
Weighted average number of shares - PERLS VI (M) 27 24 25 27
Weighted average number of shares - PERLS VII (M) 41 37 37 41
Weighted average number of shares - PERLS VIII (M) 20 4 18 20
Weighted average number of shares - PERLS IX (M) 5 - 10 -
Weighted average number of shares - Employee share plans (M) 3 3 3 3
Dividends per share (cents) - fully franked 429 420 230 199
No. of shares at end of period excluding Treasury shares deduction (M) 1,730 1,715 1,730 1,723
Funds Under Administration (FUA) - average 152,999 144,913 155,855 150,134
Assets Under Management (AUM) - average 210,929 202,000 214,446 206,996
Average inforce premiums 3,434 3,401 3,402 3,475
Net assets 63,716 60,564 63,716 61,812
Total intangible assets 10,024 10,384 10,024 10,000
Non-controlling interests 546 550 546 551
Full Year Ended (1)
Half Year Ended
(1) Comparative information has been restated to conform to presentation in the current period.
(2) The simple average of closing reporting period balances.

Appendices
102 Commonwealth Bank of Australia – Profit Announcement
21. Analysis Template (continued)
30 Jun 17 30 Jun 16 30 Jun 17 31 Dec 16
Ratios - Output Summary $M $M $M $M
Earnings Per Share (EPS)
Net profit after tax - "cash basis" 9,881 9,445 4,974 4,907
Less distribution - other equity instruments - (50) - -
Adjusted profit for EPS calculation 9,881 9,395 4,974 4,907
Average number of shares (M) - "cash basis" 1,720 1,693 1,724 1,717
Earnings Per Share basic - "cash basis" (cents) 574. 4 554. 8 288. 5 285. 8
Net profit after tax - "statutory basis" 9,928 9,223 5,033 4,895
Less distribution - other equity instruments - (50) - -
Adjusted profit for EPS calculation 9,928 9,173 5,033 4,895
Average number of shares (M) - "statutory basis" 1,719 1,692 1,723 1,715
Earnings Per Share basic - "statutory basis" (cents) 577. 6 542. 3 292. 2 285. 3
Interest expense (after tax) - PERLS III - 16 - -
Interest expense (after tax) - PERLS VI 83 89 41 42
Interest expense (after tax) - PERLS VII 71 76 35 36
Interest expense (after tax) - PERLS VIII 52 14 26 26
Interest expense (after tax) - PERLS IX 12 - 12 -
Profit impact of assumed conversions (after tax) 218 195 114 104
Weighted average number of shares - PERLS III (M) - 11 - -
Weighted average number of shares - PERLS VI (M) 27 24 25 27
Weighted average number of shares - PERLS VII (M) 41 37 37 41
Weighted average number of shares - PERLS VIII (M) 20 4 18 20
Weighted average number of shares - PERLS IX (M) 5 - 10 -
Weighted average number of shares - Employee share plans (M) 3 3 3 3
Weighted average number of shares - dilutive securities (M) 96 79 93 91
Adjusted cash profit for EPS calculation 9,881 9,395 4,974 4,907
Add back profit impact of assumed conversions (after tax) 218 195 114 104
Adjusted diluted profit for EPS calculation 10,099 9,590 5,088 5,011
Average number of shares (M) - "cash basis" 1,720 1,693 1,724 1,717
Add back weighted average number of shares (M) 96 79 93 91
Diluted average number of shares (M) 1,816 1,772 1,817 1,808
Earnings Per Share diluted - "cash basis" (cents) 556. 1 541. 2 279. 9 277. 2
Adjusted statutory profit for EPS calculation 9,928 9,173 5,033 4,895
Add back profit impact of assumed conversions (after tax) 218 195 114 104
Adjusted diluted profit for EPS calculation 10,146 9,368 5,147 4,999
Average number of shares (M) - "statutory basis" 1,719 1,692 1,723 1,715
Add back weighted average number of shares (M) 96 79 93 91
Diluted average number of shares (M) 1,815 1,771 1,816 1,806
Earnings Per Share diluted - "statutory basis" (cents) 559. 1 529. 2 283. 4 276. 7
Dividends Per Share (DPS)
Dividends
Dividends per share (cents) - fully franked 429 420 230 199
No. of shares at end of period excluding Treasury shares deduction (M) 1,730 1,715 1,730 1,723
Total dividends 7,408 7,189 3,979 3,429
Dividend payout ratio - "cash basis"
Net profit after tax - "cash basis" 9,881 9,445 4,974 4,907
Net profit after tax - attributable to ordinary shareholders 9,881 9,395 4,974 4,907
Total dividends 7,408 7,189 3,979 3,429
Payout ratio - "cash basis" (%) 75. 0 76. 5 80. 0 69. 9
Dividend cover
Net profit after tax - attributable to ordinary shareholders 9,881 9,395 4,974 4,907
Total dividends 7,408 7,189 3,979 3,429
Dividend cover - "cash basis" (times) 1. 3 1. 3 1. 3 1. 4
Full Year Ended (1) (2)
Half Year Ended (2)
(1) Comparative information has been restated to conform to presentation in the current period.
(2) Calculations are based on actual numbers prior to rounding to the nearest million.
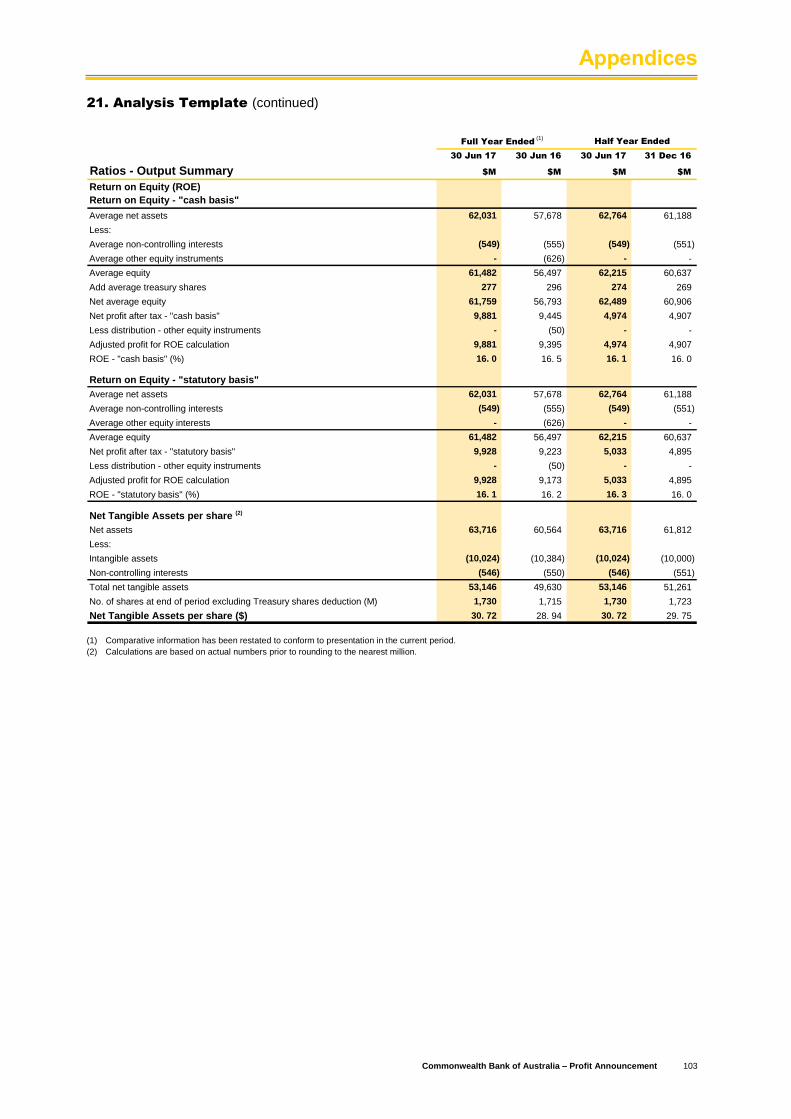
Appendices
Commonwealth Bank of Australia – Profit Announcement 103
21. Analysis Template (continued)
30 Jun 17 30 Jun 16 30 Jun 17 31 Dec 16
Ratios - Output Summary $M $M $M $M
Return on Equity (ROE)
Return on Equity - "cash basis"
Average net assets 62,031 57,678 62,764 61,188
Less:
Average non-controlling interests (549) (555) (549) (551)
Average other equity instruments - (626) - -
Average equity 61,482 56,497 62,215 60,637
Add average treasury shares 277 296 274 269
Net average equity 61,759 56,793 62,489 60,906
Net profit after tax - "cash basis" 9,881 9,445 4,974 4,907
Less distribution - other equity instruments - (50) - -
Adjusted profit for ROE calculation 9,881 9,395 4,974 4,907
ROE - "cash basis" (%) 16. 0 16. 5 16. 1 16. 0
Return on Equity - "statutory basis"
Average net assets 62,031 57,678 62,764 61,188
Average non-controlling interests (549) (555) (549) (551)
Average other equity interests - (626) - -
Average equity 61,482 56,497 62,215 60,637
Net profit after tax - "statutory basis" 9,928 9,223 5,033 4,895
Less distribution - other equity instruments - (50) - -
Adjusted profit for ROE calculation 9,928 9,173 5,033 4,895
ROE - "statutory basis" (%) 16. 1 16. 2 16. 3 16. 0
Net Tangible Assets per share (2)
Net assets 63,716 60,564 63,716 61,812
Less:
Intangible assets (10,024) (10,384) (10,024) (10,000)
Non-controlling interests (546) (550) (546) (551)
Total net tangible assets 53,146 49,630 53,146 51,261
No. of shares at end of period excluding Treasury shares deduction (M) 1,730 1,715 1,730 1,723
Net Tangible Assets per share ($) 30. 72 28. 94 30. 72 29. 75
Full Year Ended (1)
Half Year Ended
(1) Comparative information has been restated to conform to presentation in the current period.
(2) Calculations are based on actual numbers prior to rounding to the nearest million.

Appendices
104 Commonwealth Bank of Australia – Profit Announcement
22. Summary
Jun 17 vs Jun 17 vs
Group 30 Jun 17 30 Jun 16 Jun 16 % 30 Jun 17 31 Dec 16 Dec 16 %
Net profit after tax - "cash basis" $M 9,881 9,445 5 4,974 4,907 1
Treasury shares valuation adjustment (after tax) $M (23) 4 large (4) (19) (79)
Hedging and IFRS volatility (after tax) $M 73 (199) large 65 8 large
Bankwest non-cash items (after tax) $M (3) (27) (89) (2) (1) large
Net profit after tax - "statutory basis" $M 9,928 9,223 8 5,033 4,895 3
Earnings per share basic - "cash basis" cents 574. 4 554. 8 4 288. 5 285. 8 1
Dividends per share (fully franked) cents 429 420 2 230 199 16
Dividend payout ratio - "cash basis" % 75. 0 76. 5 (150)bpts 80. 0 69. 9 large
Common Equity Tier 1 (Internationally Comparable) -
Basel III (2) % 15. 6 14. 4 120 bpts 15. 6 15. 4 20 bpts
Common Equity Tier 1 (APRA) - Basel III % 10. 1 10. 6 (50)bpts 10. 1 9. 9 20 bpts
Leverage ratio (Internationally Comparable) (3) % 5. 8 5. 6 20 bpts 5. 8 5. 5 30 bpts
Leverage ratio (APRA) % 5. 1 5. 0 10 bpts 5. 1 4. 9 20 bpts
Number of full time equivalent staff No. 45,614 45,129 1 45,614 45,271 1
Return on equity - "cash basis" % 16. 0 16. 5 (50)bpts 16. 1 16. 0 10 bpts
Return on equity - "statutory basis" % 16. 1 16. 2 (10)bpts 16. 3 16. 0 30 bpts
Weighted average no. of shares - "statutory basis" -
basicM 1,719 1,692 2 1,723 1,715 -
Net tangible assets per share $ 30. 72 28. 94 6 30. 72 29. 75 3
Net interest income - "cash basis" $M 17,600 16,935 4 8,857 8,743 1
Net interest margin % 2. 11 2. 14 (3)bpts 2. 11 2. 11 -
Net interest margin excluding Treasury and Markets % 2. 09 2. 13 (4)bpts 2. 10 2. 08 2 bpts
Other banking income - "cash basis" $M 5,520 4,860 14 2,534 2,986 (15)
Other banking income to total banking income - "cash
basis"% 23. 9 22. 3 160 bpts 22. 2 25. 5 (330)bpts
Operating expenses to total operating income - "cash
basis"% 42. 7 42. 4 30 bpts 42. 1 43. 3 (120)bpts
Average interest earning assets $M 834,741 790,596 6 846,619 823,058 3
Average interest bearing liabilities $M 755,612 733,754 3 764,126 747,236 2
Loan impairment expense - "cash basis" $M 1,095 1,256 (13) 496 599 (17)
Loan impairment expense - "cash basis" annualised
as a % of average gross loans and acceptances%
0. 15 0. 19 (4)bpts 0. 14 0. 17 (3)bpts
Total provisions for impaired assets as a % of gross
impaired assets% 36. 05 36. 17 (12)bpts 36. 05 35. 02 103 bpts
Risk weighted assets (APRA) - Basel III $M 437,063 394,667 11 437,063 436,481 -
Retail Banking Services
Cash net profit after tax $M 4,964 4,540 9 2,498 2,466 1
Operating expenses to total banking income % 30. 8 32. 1 (130)bpts 30. 7 30. 8 (10)bpts
Effective tax rate - "cash basis" % 29. 8 29. 9 (10)bpts 29. 8 29. 9 (10)bpts
Business and Private Banking
Cash net profit after tax $M 1,639 1,522 8 848 791 7
Operating expenses to total banking income % 39. 1 38. 8 30 bpts 38. 8 39. 3 (50)bpts
Effective tax rate - "cash basis" % 30. 1 30. 1 - 30. 0 30. 1 (10)bpts
Institutional Banking and Markets
Cash net profit after tax $M 1,306 1,190 10 623 683 (9)
Operating expenses to total banking income % 37. 6 37. 4 20 bpts 38. 5 36. 7 180 bpts
Effective tax rate - "cash basis" % 24. 0 23. 7 30 bpts 24. 2 23. 8 40 bpts
Full Year Ended (1)
Half Year Ended
(1) Comparative information has been restated to conform to presentation in the current period.
(2) Analysis aligns with the 13 July 2015 APRA study titled “International capital comparison study”.
(3) The Tier 1 Capital included in the calculation of the internationally comparable leverage ratio aligns with the 13 July 2015 APRA study titled “International capital comparison study” and includes Basel III non-compliant Tier 1 instruments that are currently subject to transitional rules.

Appendices
Commonwealth Bank of Australia – Profit Announcement 105
22. Summary (continued)
Jun 17 vs Jun 17 vs
30 Jun 17 30 Jun 16 Jun 16 % 30 Jun 17 31 Dec 16 Dec 16 %
Wealth Management
Cash net profit after tax $M 553 612 (10) 304 249 22
Underlying profit after tax $M 503 529 (5) 277 226 23
Investment experience after tax $M 54 83 (35) 31 23 35
FUA - average $M 141,005 134,233 5 143,838 138,146 4
FUA - spot $M 146,778 135,801 8 146,778 140,820 4
AUM - average $M 205,910 197,569 4 209,469 201,967 4
AUM - spot $M 219,427 199,735 10 219,427 203,223 8
Annual inforce premiums - average $M 2,465 2,474 - 2,432 2,505 (3)
Annual inforce premiums - spot $M 2,352 2,508 (6) 2,352 2,520 (7)
Operating expenses to total operating income % 70. 9 70. 2 70 bpts 68. 4 73. 5 large
Effective tax rate - "cash basis" % 26. 5 26. 5 - 26. 3 26. 8 (50)bpts
New Zealand
Cash net profit after tax $M 973 881 10 502 471 7
Underlying profit after tax $M 979 871 12 499 480 4
FUA - average $M 11,994 10,680 12 12,017 11,988 -
FUA - spot $M 12,223 11,522 6 12,223 12,110 1
AUM - average $M 5,019 4,431 13 4,977 5,029 (1)
AUM - spot $M 5,313 4,988 7 5,313 4,792 11
Annual inforce premiums - average $M 715 672 6 716 715 -
Annual inforce premiums - spot $M 721 710 2 721 729 (1)
Operating expenses to total operating income (2) % 38. 4 39. 9 (150)bpts 38. 7 38. 0 70 bpts
Effective tax rate - "cash basis" (2) % 27. 1 26. 6 50 bpts 27. 0 27. 3 (30)bpts
Bankwest
Cash net profit after tax $M 702 778 (10) 347 355 (2)
Operating expenses to total banking income % 42. 1 41. 2 90 bpts 42. 9 41. 3 160 bpts
Effective tax rate - "cash basis" % 30. 1 30. 0 10 bpts 29. 9 30. 3 (40)bpts
Full Year Ended (1)
Half Year Ended
(1) Comparative information has been restated to conform to presentation in the current period.
(2) Key financial metrics are calculated in New Zealand dollar terms.
23. Foreign Exchange Rates
Exchange Rates Utilised (1)
Currency 30 Jun 17 31 Dec 16 30 Jun 16
AUD 1.00 = USD 0. 7684 0. 7236 0. 7431
EUR 0. 6720 0. 6883 0. 6689
GBP 0. 5903 0. 5899 0. 5534
NZD 1. 0493 1. 0393 1. 0470
JPY 86. 1110 84. 6897 76. 2441
As at
(1) End of day, Sydney time.
24. Definitions
The definitions of terms used throughout this Profit Announcement, including market share definitions, can be found on:
www.commbank.com.au/about-us/shareholders/financial-information/results.html.