PROfit 3 - TradeNetworksdownload.tradenetworks.com/PDF/1/manual.pdf · 9.4 Andrews Pitchfork...
183
PROfit 3.7 User Manual 2014
Transcript of PROfit 3 - TradeNetworksdownload.tradenetworks.com/PDF/1/manual.pdf · 9.4 Andrews Pitchfork...
PROfit 3.7User Manual
2014
Copyright 2014 © Internovus Bulgaria. All rights reserved.
Table of Contents1. Introduction ............................................................................................................................................4
1.1 Major financial instruments ...........................................................................................................51.2 About PROfit .................................................................................................................................61.3 About the manual ..........................................................................................................................7
2. Getting started .......................................................................................................................................82.1 Installing PROfit ...........................................................................................................................92.2 LogIn ............................................................................................................................................112.3 Welcome to PROfit ......................................................................................................................13
2.3.1 Funding your PROfit account .............................................................................................14Account packages ................................................................................................................23
2.3.2 Beginner Mode ...................................................................................................................242.3.3 Trader mode .......................................................................................................................252.3.5 My Portfolio panel ..............................................................................................................26
2.3.4 Quotes panel ................................................................................................................272.3.6 Log panel ............................................................................................................................362.3.7 Charts Panel .......................................................................................................................382.3.8 Sidebar panel .....................................................................................................................402.3.9 Navigation bar ....................................................................................................................45
3. Opening Positions and Placing Orders ...............................................................................................463.1 Opening positions in the Confirm Mode .....................................................................................473.2 Opening positions in 1 -Click Mode ............................................................................................503.3 Placing an Entry Order ...............................................................................................................523.4 Limiting your Positions with SL/TP Orders .................................................................................54
3.4.1Placing a SL/TP to Market order .........................................................................................553.4.2Placing a SL/TP to Entry order ...........................................................................................573.4.3 Protecting the Entry order with OCO ................................................................................60
4. Managing existing positions ...............................................................................................................624.1 Modify an open position ..............................................................................................................634.2 Modify an entry order ..................................................................................................................66
5. Closing positions .................................................................................................................................696. Withdrawal ...........................................................................................................................................747. Charts .................................................................................................................................................76
7.1 Chart types ..................................................................................................................................777.2 Change the Chart type ................................................................................................................817.3 Displaying a symbol in the Chart panel ......................................................................................837.4 Time frames .................................................................................................................................867.5 Chart world option .......................................................................................................................897.6 Indicative Charts ..........................................................................................................................90
8. Additional Chart Options .....................................................................................................................928.1 Displaying the Percentage Price Scale .......................................................................................938.2 Displaying the Trading Volume ...................................................................................................958.3 Displaying the Maximum and the Minimum Values ....................................................................998.4 Displaying the Grid Lines ..........................................................................................................1018.5 Displaying the Data Information Box ........................................................................................1038.6 Displaying Last Value ................................................................................................................1048.7 Displaying the Crosshair Tool ...................................................................................................1058.8 Displaying the Chart History .....................................................................................................1068.9 Zoom ..........................................................................................................................................108
9. Drawing on the Chart ........................................................................................................................1099.1 Adding Lines to a Chart ............................................................................................................110

Copyright 2014 © Internovus Bulgaria. All rights reserved.
9.1.1 Add a Line ......................................................................................................................1129.2 Adding Geometric Shapes to a Chart .......................................................................................113
9.2.1 Add a geometric shape ....................................................................................................1159.3 Fibonacci Drawing Tools ...........................................................................................................116
9.3.1 Add a Fibonacci Line .......................................................................................................1199.4 Andrews Pitchfork Drawing Tool ...............................................................................................1209.5 Standard Deviation Channel tool ..............................................................................................1229.6 Adding Arrows to a Chart .........................................................................................................1249.7 Adding Text to a Chart ..............................................................................................................1259.8 Removing Drawings from the Chart ..........................................................................................1279.9 Changing the Color of the Chart Elements ...............................................................................128
10. Trading from the Chart ....................................................................................................................13110.1 Show/Hide positions ................................................................................................................13310.2 Modify Positions via the Chart ...............................................................................................134
11. Managing Indicators in the Chart ...................................................................................................13512. Moving and Resizing Chart Elements .............................................................................................13813. Managing Chart Templates .............................................................................................................13914. Saving Your Chart ...........................................................................................................................14115. Tradency ..........................................................................................................................................143
15.1. What is Copy Trading ............................................................................................................14415.1.1. Tradency ........................................................................................................................145
15.1.1.1. Integration with Web PROfit .................................................................................14615.1.1.1.1. Login to PROfit ............................................................................................14715.1.1.1.2. Open Mirror Trader ......................................................................................15015.1.1.1.3. Open a position ..........................................................................................154
15.1.1.2. Live Chart .............................................................................................................15915.1.1.3. Open Position Mirror Trader .................................................................................16215.1.1.4. Strategies ..............................................................................................................16415.1.1.5. History ...................................................................................................................16815.1.1.6. Live Signals ..........................................................................................................17015.1.1.7. Portfolio .................................................................................................................17415.1.1.8. Rates ....................................................................................................................17815.1.1.9. Account Activities .................................................................................................180
16. Frequently Asked Questions ...........................................................................................................182

Copyright 2014 © Internovus Bulgaria. All rights reserved.
1. Introduction
People exchange currencies since ancient times. The original form of trade was the direct exchangeof goods and services. After the World War II, United States dollar became sharply outlinedcurrency for the entire globe. Today, currencies all over the world are generally quoted against theU.S. dollar. “The variation in the value of money, however great, makes no difference in the rate of profits;...”
― David Ricardo
Chapter I, On Value, p. 32 - The Principles of Political Economy and Taxation (1821) (Third Edition)

Copyright 2014 © Internovus Bulgaria. All rights reserved.
1.1 Major financial instruments
PROfit provides you with various ways to manage your trades. You can use PROfit tools to quicklyopen positions, place and modify orders. Once you become an experienced trader, you can alsouse advanced chart tools and different reports to better analyze the forex market and yourpersonal trading strategy. Profit allows you to trade with two types of Symbols:
• Forex (FX) – is a Currency Pair. For example, AUD/CAD is one FX symbol
• CFD – is a Contract for Difference, derivative instruments. For example, APPLE is one CFDsymbol. In a contract for difference a buyer and a seller agree that the seller will, uponexpiration of the contract, pay the buyer the difference between the value of the asset at thetime the contract is agreed and the value at the time it expires. The CFD offers the possibilityto trade with leverage and also offer the trader the possibility to limit risk. This can be done byplacing a stop loss order.
Note:
Symbol is a tradable asset.
Some of the assets, like oil, have an expiration date. An open position will be closed automatically. Major currencies : The U.S. Dollar The United States dollar is the world's main currency. All currencies are generally quoted in UnitedStates dollar terms. The major currencies traded against the U.S. dollar are the Euro, Japaneseyen, British pound, Swiss franc and Australian dollar. The Euro The euro is the currency used by the Institutions of the European Union and is the official currencyof the euro zone. The euro is the second largest reserve currency as well as the second mosttraded currency in the world after the United States dollar. The Japanese Yen Japan is one of the largest economies in the world, with very high GDP (Gross domestic product)among other nations and is one of the largest exporters, in dollar terms. The Japanese yen isthe third most traded currency in the world. It has a smaller international presence than the U.S.dollar or the Euro. The British Pound The British Pound (the pound sterling) is the currency used in the United Kingdom. It is one of thehighest value currencies in the world.
Copyright 2014 © Internovus Bulgaria. All rights reserved.
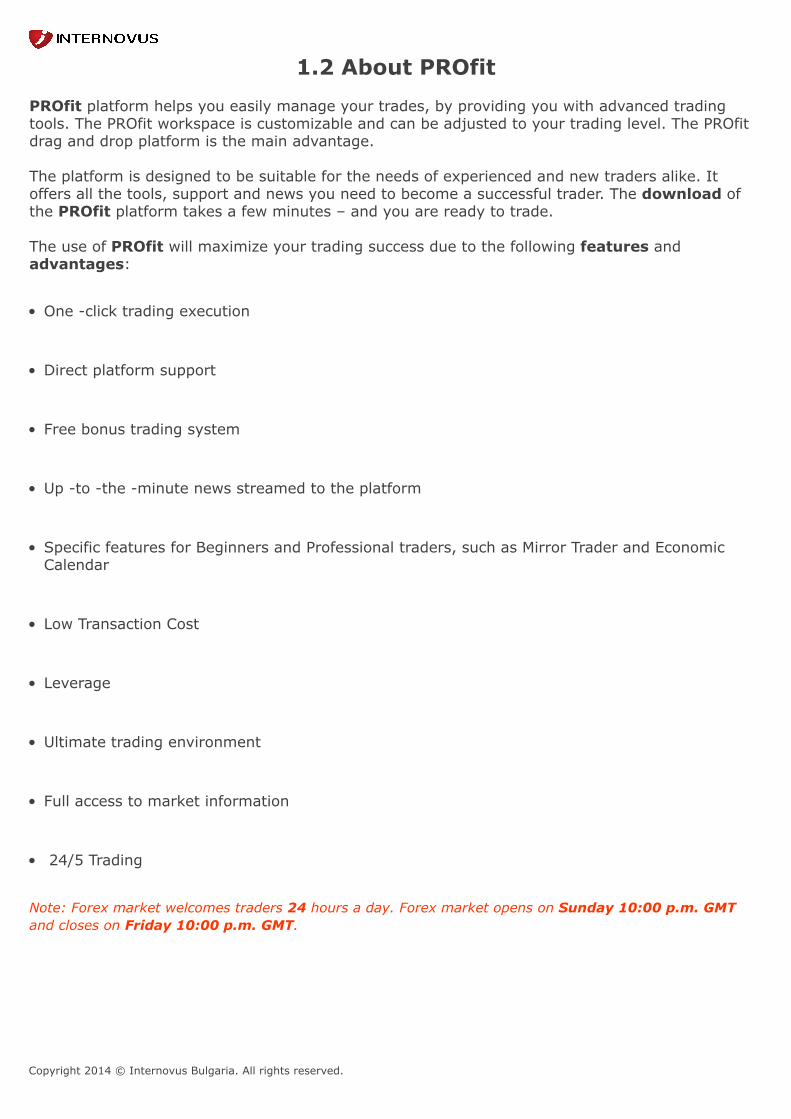
1.2 About PROfit
PROfit platform helps you easily manage your trades, by providing you with advanced tradingtools. The PROfit workspace is customizable and can be adjusted to your trading level. The PROfitdrag and drop platform is the main advantage. The platform is designed to be suitable for the needs of experienced and new traders alike. Itoffers all the tools, support and news you need to become a successful trader. The download ofthe PROfit platform takes a few minutes – and you are ready to trade. The use of PROfit will maximize your trading success due to the following features andadvantages:
• One -click trading execution
• Direct platform support
• Free bonus trading system
• Up -to -the -minute news streamed to the platform
• Specific features for Beginners and Professional traders, such as Mirror Trader and EconomicCalendar
• Low Transaction Cost
• Leverage
• Ultimate trading environment
• Full access to market information
• 24/5 Trading
Note: Forex market welcomes traders 24 hours a day. Forex market opens on Sunday 10:00 p.m. GMTand closes on Friday 10:00 p.m. GMT.
Copyright 2014 © Internovus Bulgaria. All rights reserved.
1.3 About the manual Whether you are a beginner or an expert, you can use this manual as a guideline for usingPROfit. The following notes are used in this manual: Additional Options Describes additional operational instructions related to a particularfeature. Note Indicates information that can be helpful in performing a particularprocedure. This manual provides information on the PROfit platform. To get a general overview about forextrading principals, please refer to the Forex Academy at www.bforex.com/Forex-Academy/
Copyright 2014 © Internovus Bulgaria. All rights reserved.
2. Getting started The current chapter provides information on basic steps you need to perform, before actuallystarting to trade with PROfit:
1. Installing PROfit.
2 .Logging in to PROfit.
3. Funding your PROfit account.
4. Getting familiar with the PROfit workspace.
Copyright 2014 © Internovus Bulgaria. All rights reserved.
2.1 Installing PROfit
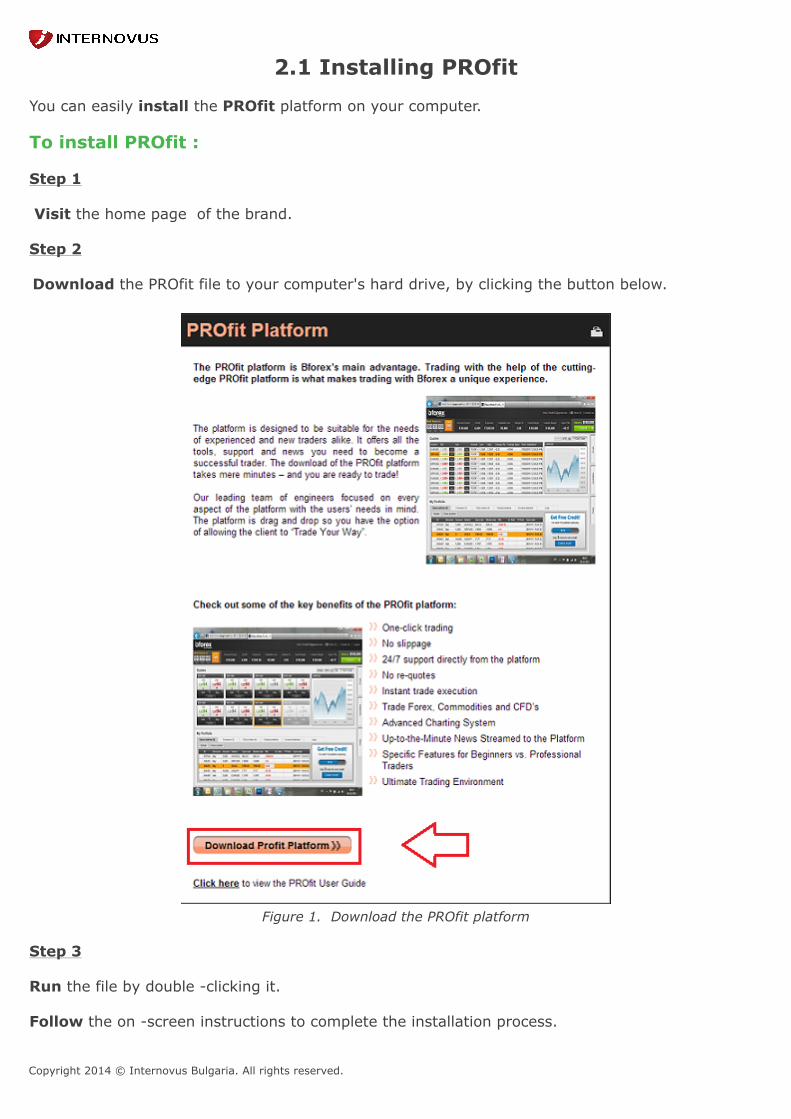
You can easily install the PROfit platform on your computer. To install PROfit : Step 1 Visit the home page of the brand. Step 2 Download the PROfit file to your computer's hard drive, by clicking the button below.
Figure 1. Download the PROfit platform Step 3 Run the file by double -clicking it. Follow the on -screen instructions to complete the installation process.
Copyright 2014 © Internovus Bulgaria. All rights reserved.
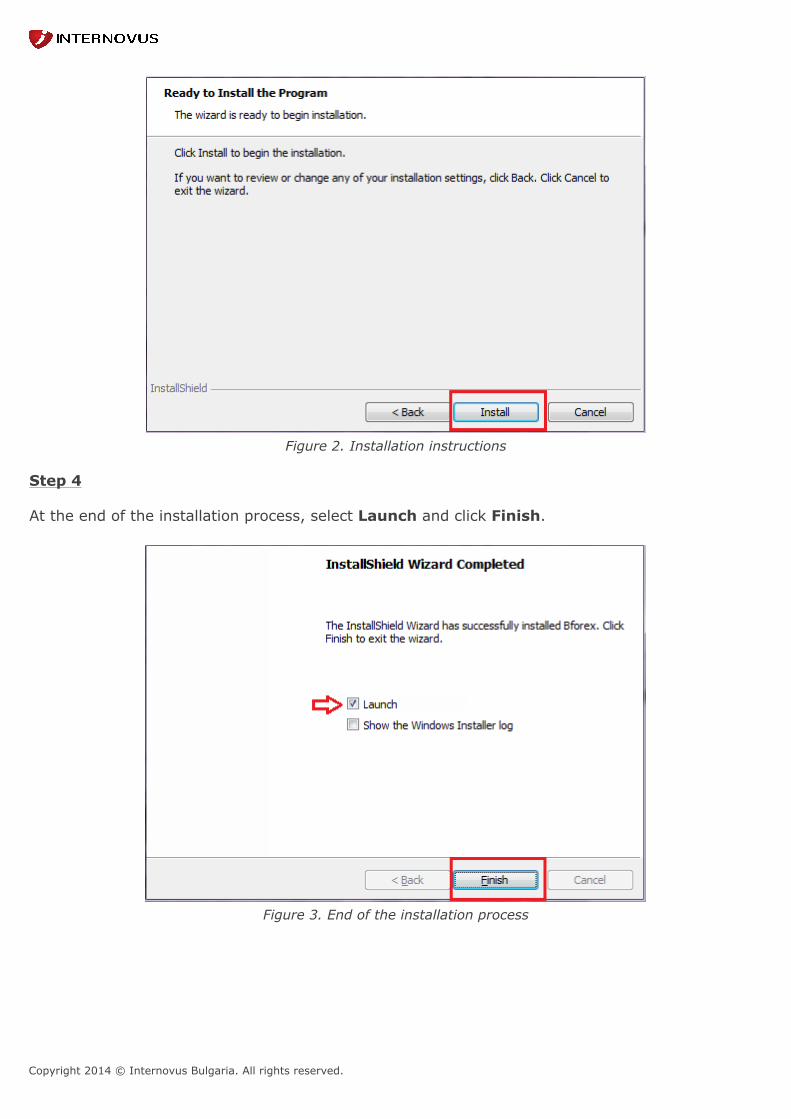
Figure 2. Installation instructions Step 4 At the end of the installation process, select Launch and click Finish.
Figure 3. End of the installation process

Copyright 2014 © Internovus Bulgaria. All rights reserved.
2.2 LogIn Step 1 Double -click the PROfit desktop icon or select the PROfit link from the Windows Start menu. Ifa new version is available, PROfit prompts you to install new updates. Next, the PROfit LauncherLogin window is displayed.
Figure 1. Login window.Step 2 Enter your user name and password, and select your language from the dropdown menu. Note:
If a password is forgotten or lost, it can be reset by selecting the "Forgot your password?"option from the login screen. The user name or email address for the account is requested to beginthe password reset process.
If you want an easy and fast Login to your account, you may check the box "Remember me onthis computer". "Change password" : It should be very important priority to keep your account secure. Werecommend that you change passwords quarterly.
Step 3 Click OK. Step 4 The list of your PROfit accounts is displayed. You can select the desired account and click OpenAccount or double -click on the account.
Copyright 2014 © Internovus Bulgaria. All rights reserved.
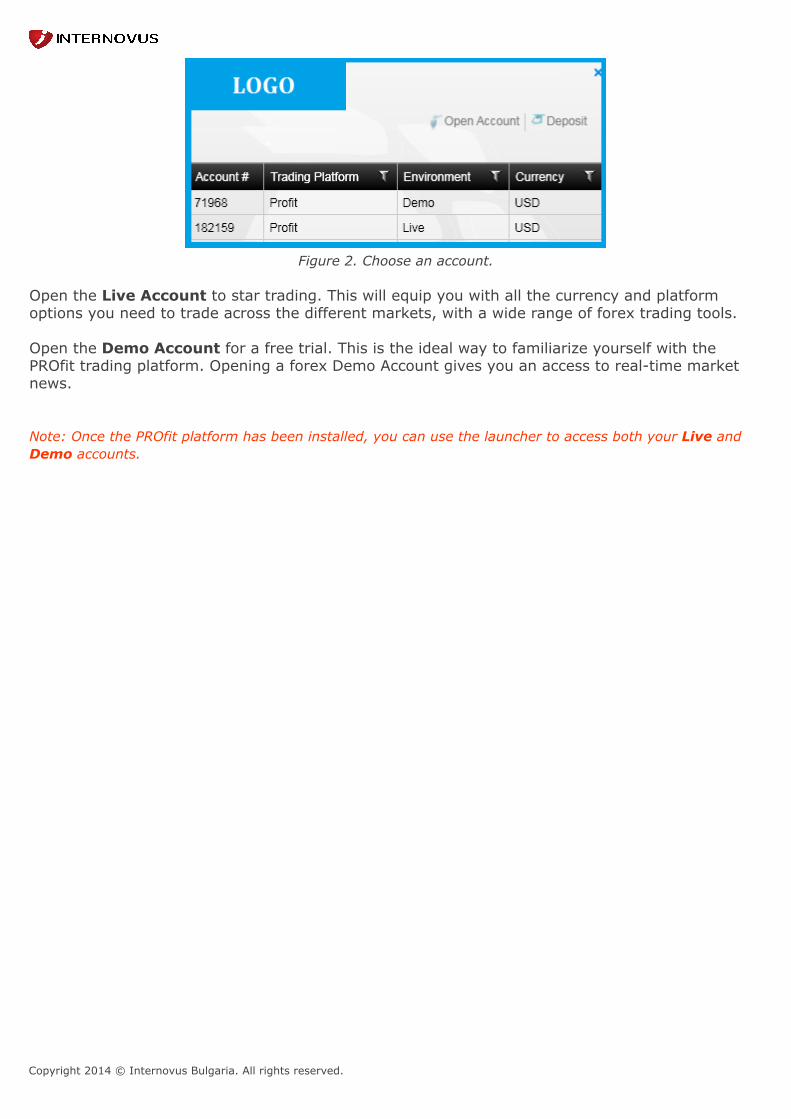
Figure 2. Choose an account.
Open the Live Account to star trading. This will equip you with all the currency and platformoptions you need to trade across the different markets, with a wide range of forex trading tools. Open the Demo Account for a free trial. This is the ideal way to familiarize yourself with thePROfit trading platform. Opening a forex Demo Account gives you an access to real-time marketnews. Note: Once the PROfit platform has been installed, you can use the launcher to access both your Live andDemo accounts.

Copyright 2014 © Internovus Bulgaria. All rights reserved.
2.3 Welcome to PROfit
To see how to fund your account, navigate to the following link: Make a Deposit
Copyright 2014 © Internovus Bulgaria. All rights reserved.
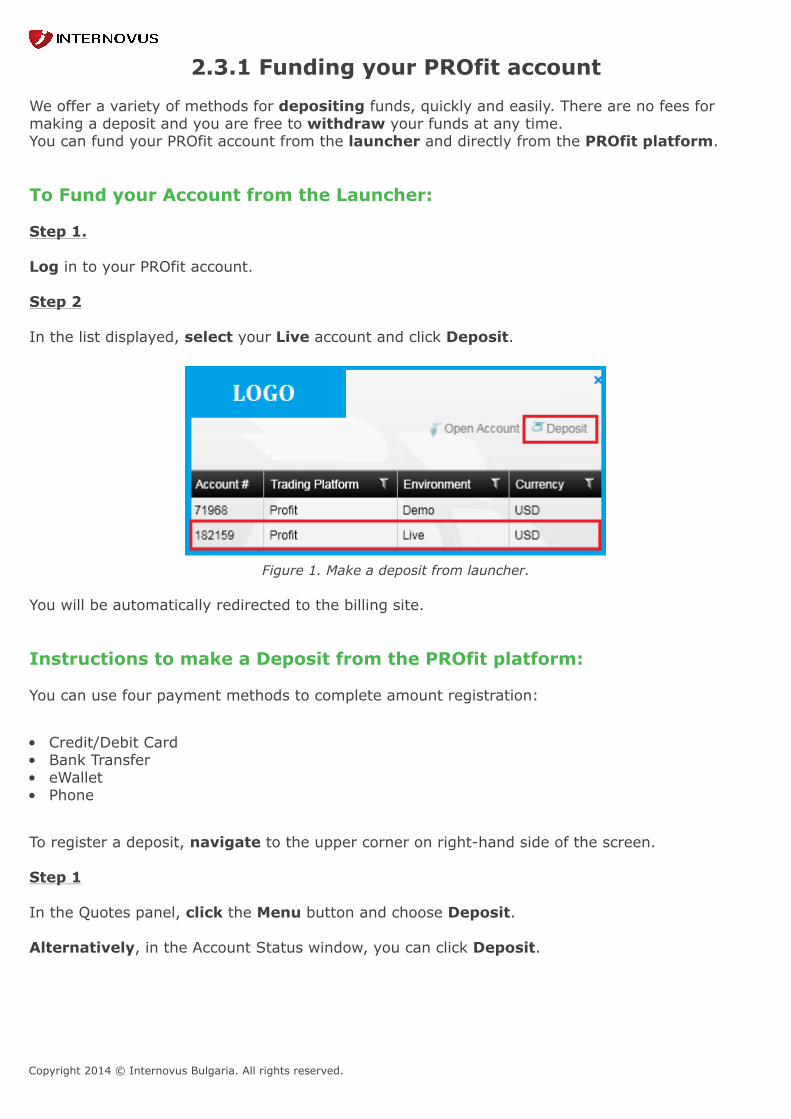
2.3.1 Funding your PROfit account We offer a variety of methods for depositing funds, quickly and easily. There are no fees formaking a deposit and you are free to withdraw your funds at any time.You can fund your PROfit account from the launcher and directly from the PROfit platform. To Fund your Account from the Launcher: Step 1. Log in to your PROfit account. Step 2 In the list displayed, select your Live account and click Deposit.
Figure 1. Make a deposit from launcher. You will be automatically redirected to the billing site. Instructions to make a Deposit from the PROfit platform: You can use four payment methods to complete amount registration:
• Credit/Debit Card• Bank Transfer• eWallet• Phone
To register a deposit, navigate to the upper corner on right-hand side of the screen. Step 1 In the Quotes panel, click the Menu button and choose Deposit. Alternatively, in the Account Status window, you can click Deposit.

Copyright 2014 © Internovus Bulgaria. All rights reserved.
Figure 2. Deposit.
You will be automatically redirected to the billing pop -up screen.
Step 2
Initially, the screen is blank, therefore press Select drop -down list menu.
As mentioned earlier, there are four secure payment methods to fund your account. Choose one,which best fits your needs. Below you can find description of the four methods.
Copyright 2014 © Internovus Bulgaria. All rights reserved.
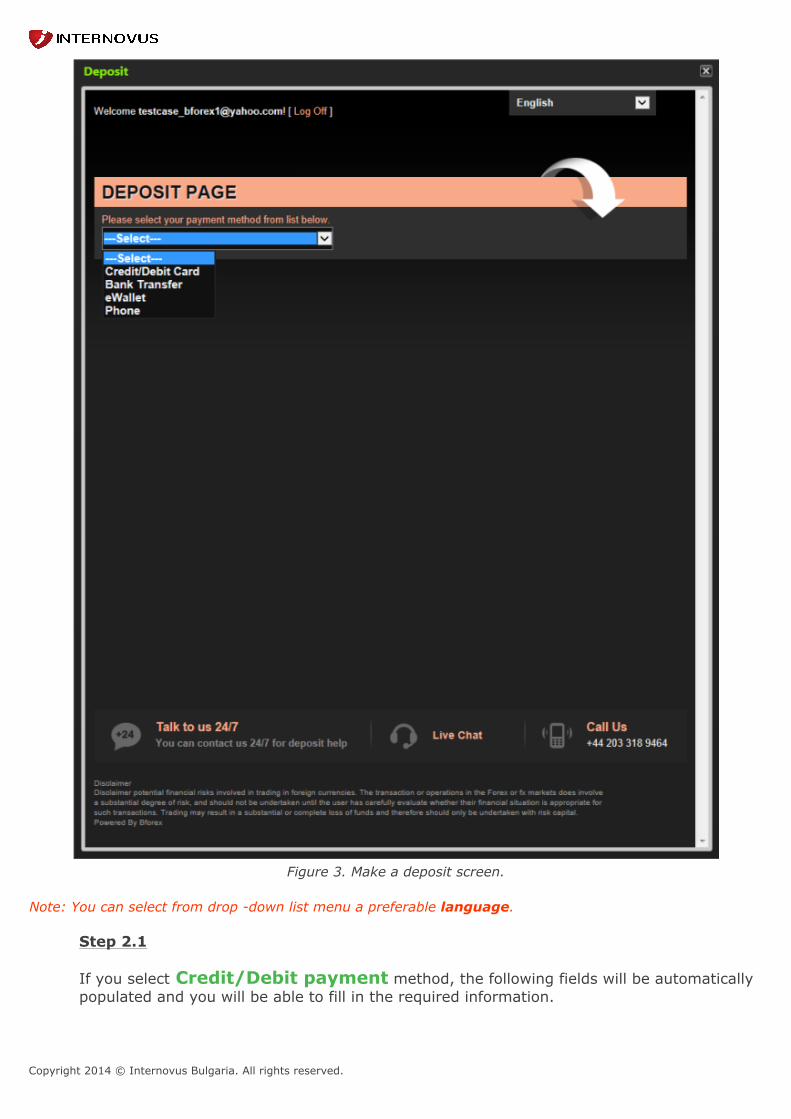
Figure 3. Make a deposit screen. Note: You can select from drop -down list menu a preferable language.
Step 2.1 If you select Credit/Debit payment method, the following fields will be automaticallypopulated and you will be able to fill in the required information.
Copyright 2014 © Internovus Bulgaria. All rights reserved.
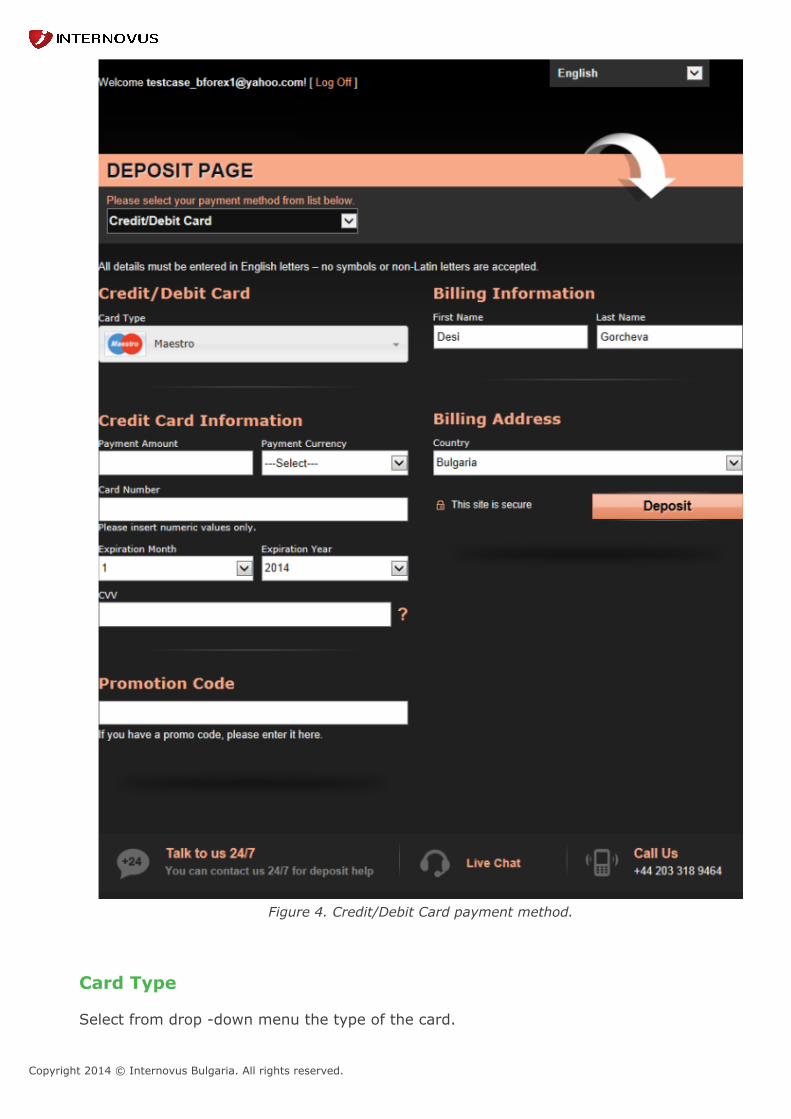
Figure 4. Credit/Debit Card payment method.
Card Type Select from drop -down menu the type of the card.
Copyright 2014 © Internovus Bulgaria. All rights reserved.
Note: The following cards are accepted:
•
•
•
•
•
•
Billing Information Enter your First and Last name. Credit Card Information Payment Amount: Fill in the amount you would like to withdraw from your card. Payment Currency: Select the currency from drop -down menu. You can choose amongtwo currencies -EUR and USD. Card Number : Fill in your card number. Most major cardshave 16 digits on them. Expiration month and year: Select from drop -down menu the month and the year ofexpiration.CVV: Enter the three digit security code located on the back of your credit card. Promotion Code If you have a promo code, please enter it here. Step 2.2 If you select Bank Transfer as a payment method, please follow the instructions givenin the red circle:
Copyright 2014 © Internovus Bulgaria. All rights reserved.
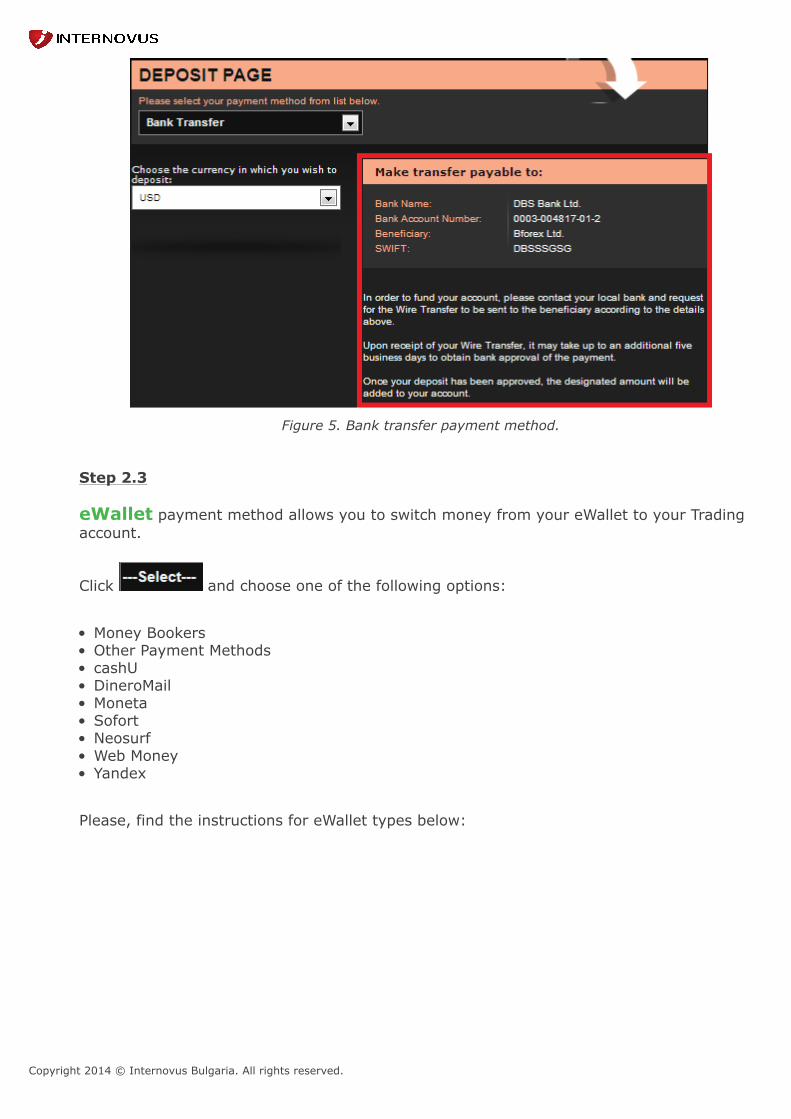
Figure 5. Bank transfer payment method.
Step 2.3 eWallet payment method allows you to switch money from your eWallet to your Tradingaccount.
Click and choose one of the following options:
• Money Bookers• Other Payment Methods• cashU• DineroMail• Moneta• Sofort• Neosurf• Web Money• Yandex
Please, find the instructions for eWallet types below:

Copyright 2014 © Internovus Bulgaria. All rights reserved.
Figure 6. eWallet payment method.
Step 2.3.1 Upon selecting Money Bookers as a payment method, Payment Amount and Payment Currency will be required in order to transfer money. Once youenter the details,
please click button, to complete the transaction.
Figure 7. Money Bookers. All methods, except Money Bookers, require common information:
• Payment Details

Copyright 2014 © Internovus Bulgaria. All rights reserved.
Payment Amount: Fill in the amount you would like to withdraw from you card.Payment Currency: Select the currency from drop -down menu.
• Personal Information
Enter your First and Last name, Phone and E-mail address.
• Payment Address
Enter your Address, City, Postal Code and select your Country.
Figure 8. Other eWallet payment methods.
Once you enter all details, please click button to complete the payment.
Step 2.4
The last of the given payment methods is over Phone. If you prefer to fund your accountover your phone, please follow the instructions given below:

Copyright 2014 © Internovus Bulgaria. All rights reserved.
Figure 9. Phone payment method.
Note : The minimum amount for FTD (First time deposit) is $200. To see the account packetsprivileges, navigate to the following link:Account packages

Copyright 2014 © Internovus Bulgaria. All rights reserved.
Account packages
Figure 1. Account packages
Copyright 2014 © Internovus Bulgaria. All rights reserved.
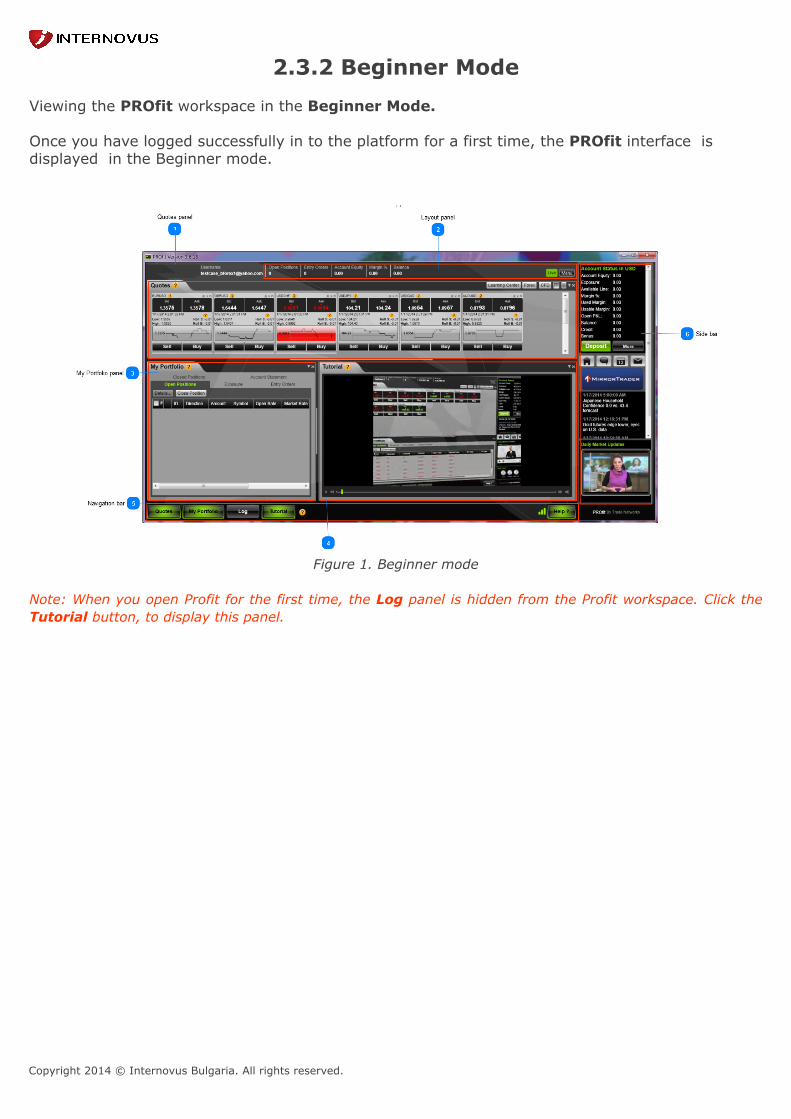
2.3.2 Beginner Mode Viewing the PROfit workspace in the Beginner Mode. Once you have logged successfully in to the platform for a first time, the PROfit interface isdisplayed in the Beginner mode.
Figure 1. Beginner mode
Note: When you open Profit for the first time, the Log panel is hidden from the Profit workspace. Click theTutorial button, to display this panel.
Copyright 2014 © Internovus Bulgaria. All rights reserved.
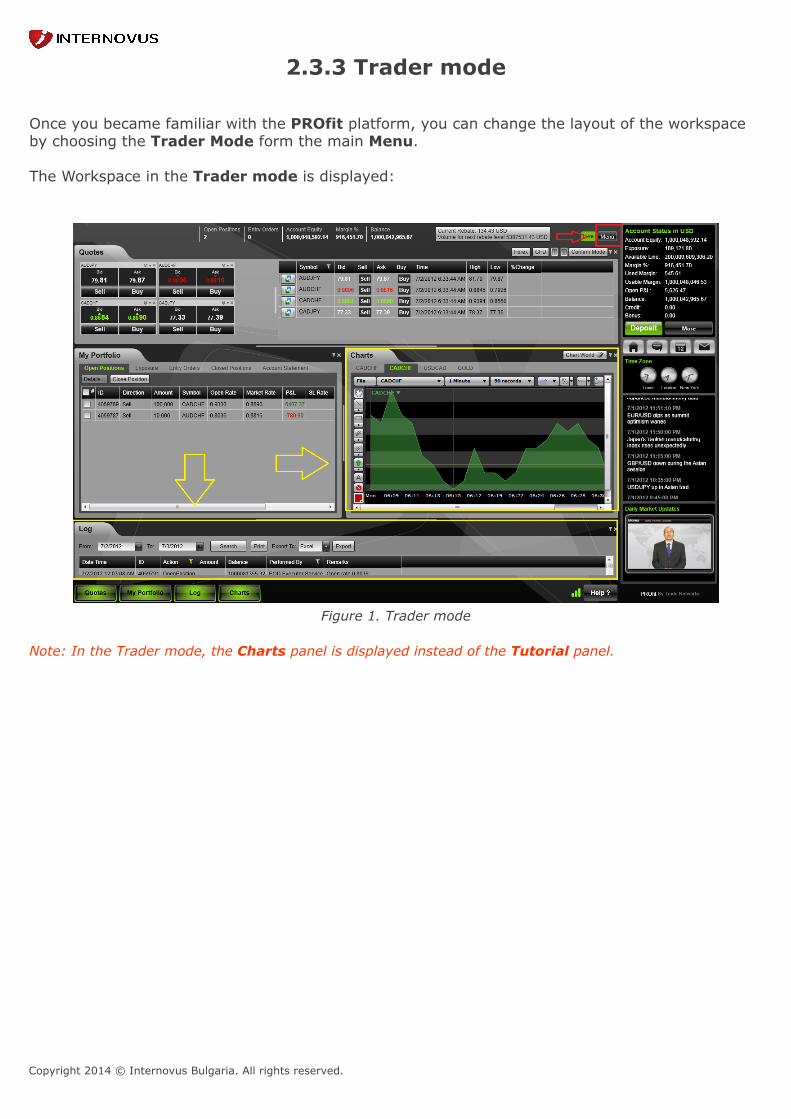
2.3.3 Trader mode Once you became familiar with the PROfit platform, you can change the layout of the workspaceby choosing the Trader Mode form the main Menu. The Workspace in the Trader mode is displayed:
Figure 1. Trader mode
Note: In the Trader mode, the Charts panel is displayed instead of the Tutorial panel.
Copyright 2014 © Internovus Bulgaria. All rights reserved.
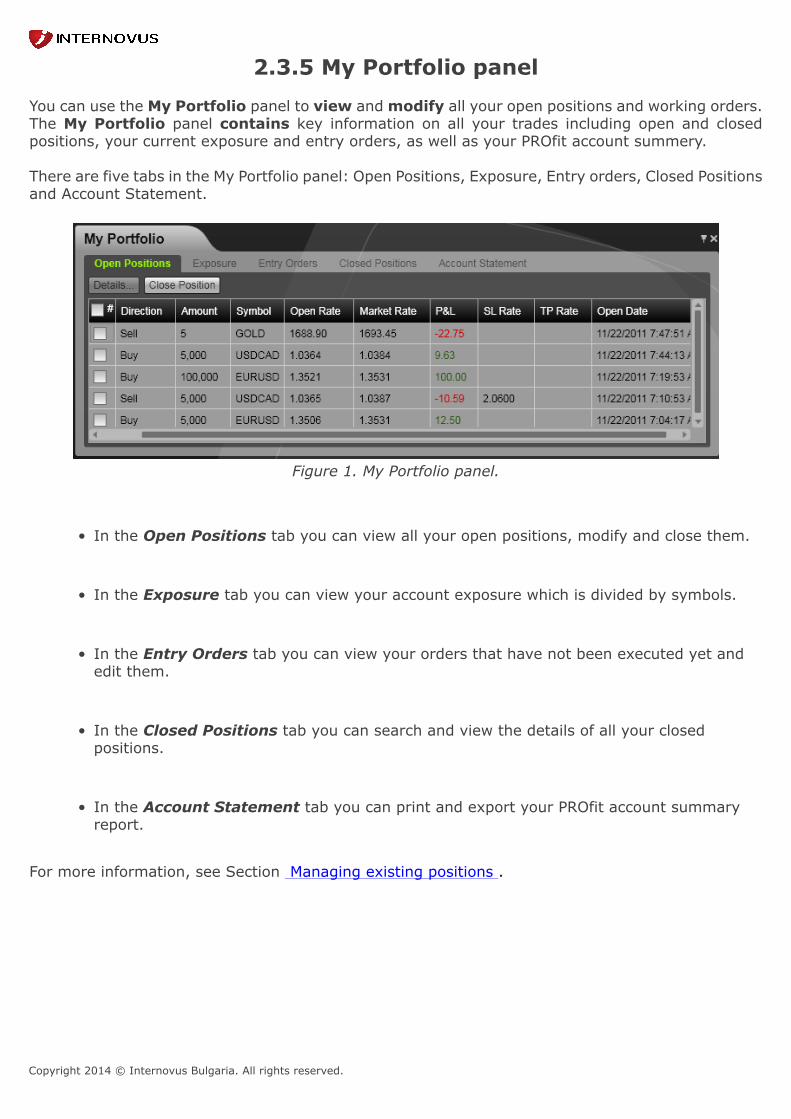
2.3.5 My Portfolio panel You can use the My Portfolio panel to view and modify all your open positions and working orders.The My Portfolio panel contains key information on all your trades including open and closedpositions, your current exposure and entry orders, as well as your PROfit account summery.
There are five tabs in the My Portfolio panel: Open Positions, Exposure, Entry orders, Closed Positionsand Account Statement.
Figure 1. My Portfolio panel.
• In the Open Positions tab you can view all your open positions, modify and close them.
• In the Exposure tab you can view your account exposure which is divided by symbols.
• In the Entry Orders tab you can view your orders that have not been executed yet andedit them.
• In the Closed Positions tab you can search and view the details of all your closedpositions.
• In the Account Statement tab you can print and export your PROfit account summaryreport.
For more information, see Section Managing existing positions .

Copyright 2014 © Internovus Bulgaria. All rights reserved.
2.3.4 Quotes panel You can use the Quotes panel to:
• View forex Symbols available for trading• To open positions• To place different order types.
The Quotes panel reflects streaming real-time prices which are updated automatically with theslightest market movement. The Quotes panel contains Quotes Layout Toolbar, Status bar, Quotesboxes area and Quotes list.
Figure 1. Quotes panel. 1. Menu options button
The Menu button is on the top right side of the Quotes Panel. The Menu options allow you to deposit money to your PROfit account, define your Trading level,send an error message, Live Chat, Contact us, view the PROfit manual and forex EBook.
Figure 2. Drop -down menu options.
For example:
To select your trading level, click the Menu button, choose Layout and then choose one of the twooptions provided: beginner or trader.
Copyright 2014 © Internovus Bulgaria. All rights reserved.
The Live/Demo icons indicate whether your current PROfit account is set to Demo or Live.
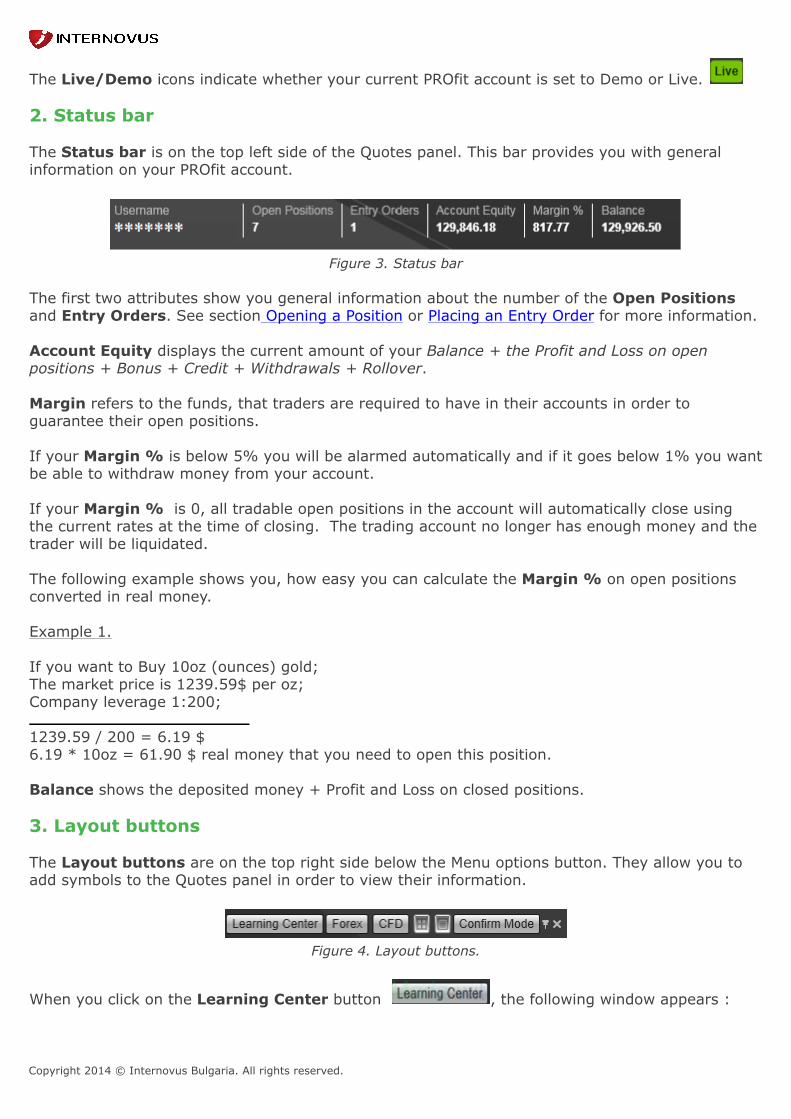
2. Status bar The Status bar is on the top left side of the Quotes panel. This bar provides you with generalinformation on your PROfit account.
Figure 3. Status bar
The first two attributes show you general information about the number of the Open Positionsand Entry Orders. See section Opening a Position or Placing an Entry Order for more information. Account Equity displays the current amount of your Balance + the Profit and Loss on openpositions + Bonus + Credit + Withdrawals + Rollover. Margin refers to the funds, that traders are required to have in their accounts in order toguarantee their open positions. If your Margin % is below 5% you will be alarmed automatically and if it goes below 1% you wantbe able to withdraw money from your account. If your Margin % is 0, all tradable open positions in the account will automatically close usingthe current rates at the time of closing. The trading account no longer has enough money and thetrader will be liquidated. The following example shows you, how easy you can calculate the Margin % on open positionsconverted in real money. Example 1. If you want to Buy 10oz (ounces) gold; The market price is 1239.59$ per oz;Company leverage 1:200;
1239.59 / 200 = 6.19 $6.19 * 10oz = 61.90 $ real money that you need to open this position. Balance shows the deposited money + Profit and Loss on closed positions. 3. Layout buttons The Layout buttons are on the top right side below the Menu options button. They allow you toadd symbols to the Quotes panel in order to view their information.
Figure 4. Layout buttons.
When you click on the Learning Center button , the following window appears :

Copyright 2014 © Internovus Bulgaria. All rights reserved.
Figure 5. Learning Center
The Learning Center is split in two categories: Beginners and Advanced. The Video Tutorialscover technical analysis, Forex basics, chart reading and more.
The Beginners videos are designed to prepare a complete beginner for the challenges of tradingon the currency market.
The Advanced videos increase your Forex knowledge with new trading techniques.
When you open PROfit for the first time, the following symbols appear in the Quotes panel: EUR/USD, GBP/USD, USD/CHF, USD/JPY and USD/CAD. You can use the Layout Toolbar options to add,
modify and remove symbols from the Quotes panel. Use the and buttons to open a Forexor CFD tab accordingly, containing all related symbols available for trading.
Note: For more information about Forex and CFD see section Major financial instruments.
For example, if you click Forex, the Select Symbols window appears when the FX tab is selected andthe list of all available FX symbols is displayed.

Copyright 2014 © Internovus Bulgaria. All rights reserved.
Figure 6. Forex Select Symbols
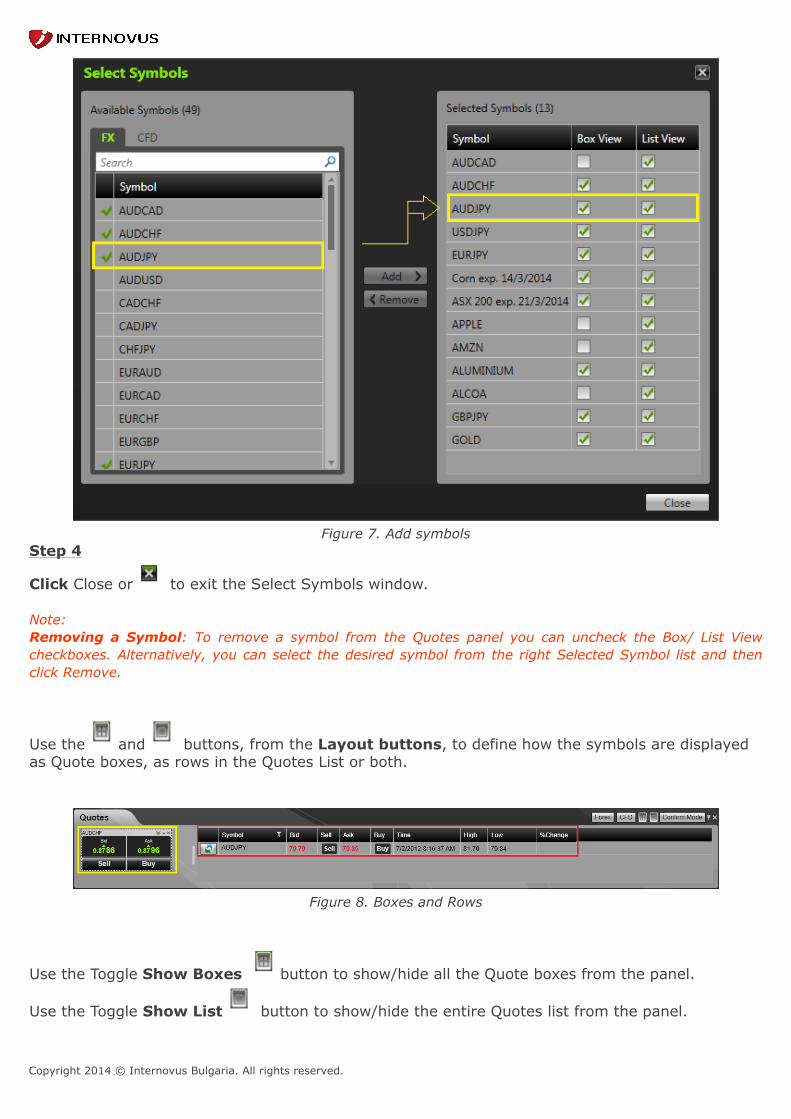
To display a symbol in the Quotes panel: Step 1 In the Quotes toolbar, click Forex or CFD. Step 2 In the Available Symbols list find the symbol you want to add, by using the scroll bar.Alternatively, you can simply type the first letter of the symbols name into the Search text box. The list of all symbols starting with the typed letter is displayed. Step 3 Double click the symbol you want to add to the Quotes panel or left click the symbol and thenclick Add. The selected Symbol is added to the right Selected Symbol list. By default, the BoxView and the List View checkboxes are checked, so the symbol appears both as a row in theQuotes list and as a Quote box.
Copyright 2014 © Internovus Bulgaria. All rights reserved.
Figure 7. Add symbolsStep 4
Click Close or to exit the Select Symbols window.
Note:Removing a Symbol: To remove a symbol from the Quotes panel you can uncheck the Box/ List Viewcheckboxes. Alternatively, you can select the desired symbol from the right Selected Symbol list and thenclick Remove.
Use the and buttons, from the Layout buttons, to define how the symbols are displayedas Quote boxes, as rows in the Quotes List or both.
Figure 8. Boxes and Rows
Use the Toggle Show Boxes button to show/hide all the Quote boxes from the panel.
Use the Toggle Show List button to show/hide the entire Quotes list from the panel.

Copyright 2014 © Internovus Bulgaria. All rights reserved.
4. Quotes boxes area Each Symbol box in the Quotes Boxes Aria, displays live dealing rates of the current symbol. Inthe Quotes Boxes Area, each symbol appears as a separate Quotes box.
Figure 9. Quotes boxes are.
Clicking the option will open the Symbol menu. You can use this menu to place positions andentry orders, as well as to view the quote details and close it.
Clicking the option will expand the Quote box, displaying additional information:
Figure 10. Expended quotes box. The Bid Graph displays the real-time bid price of a symbol and provides a snapshot of marketmovements over a particular period of time. The graph is updated every 0.5 seconds. The Low and High prices show the lowest ask price and the highest bid price recorded since thestart of the trading day. Roll S displays the interest paid or earned for holding a Sell position overnight. Roll B displays the interest paid or earned for holding a Buy position overnight. RolloverRollover is the interest paid or earned for holding a position overnight. Each currency has an interestrate associated with it and because forex is traded in pairs, every trade involves not only two different

Copyright 2014 © Internovus Bulgaria. All rights reserved.
currencies, but their two different interest rates. If the interest rate on the currency you bought ishigher than the interest rate of the currency you sold, then you will earn rollover (positive roll). If theinterest rate on the currency you bought is lower than the interest rate on the currency you sold, thenyou will pay rollover (negative roll). Rollover can add a significant extra cost or profit to your trade.Example
When you buy the EUR/USD pair, you are buying the euro, and selling the U.S. dollar to pay for it.If the euro interest rate is 4.20%, and the U.S. rate is 2.25%, you are buying the currency with thehigher interest rate, and you will earn rollover -- about 1.95% on an annual basis. If you sell theEUR/USD pair, you are selling the currency with the higher interest rate, and you will pay rollover-- about 1.95% on an annual basis, since you are paying the euro interest rate and earning theU.S. interest rate.
10:00 p.m. GMT is considered the beginning and end of the forex trading day. Any positions thatare open at 10:00 p.m. GMT sharp are considered to be held overnight, and are subject to rollover.A position opened at 10:01 p.m. GMT is not subject to rollover until the next day, while a positionopened at 9:59 p.m. GMT is subject to rollover at 10 p.m. GMT.
Hovering the symbols name will open the following floating rectangle:
Figure 11. Expended quotes box 2.
You can use the Sell/Buy buttons to open positions. See section Opening a Position or Placing anEntry Order for more information.
Figure 12. Quotes box.
Currency PairCurrency Pair is displayed on the top left side of the Quotes box. Currencies on Forex are tradedin pairs – one currency value either drops or rises in comparison to another. Currencies arerepresented by a three -letter abbreviation such as: USD, JPY or EUR. In the currency pair the firstcurrency is called the base currency and the trailing is called the quote currency. The price at anygiven moment shows how much of the quote currency is needed to equal one unit of the leading orbase currency. So if EUR/USD is currently trading at 1.35 then this means that $1.35 is required topurchase €1.The value of the leading or base Forex currency is not the only factor in determining the value of aparticular currency pair. Any change in the value of the trailing or quote currency also affects thisrelationship.Market prices are quoted in pairs known as bid/ask.
Copyright 2014 © Internovus Bulgaria. All rights reserved.
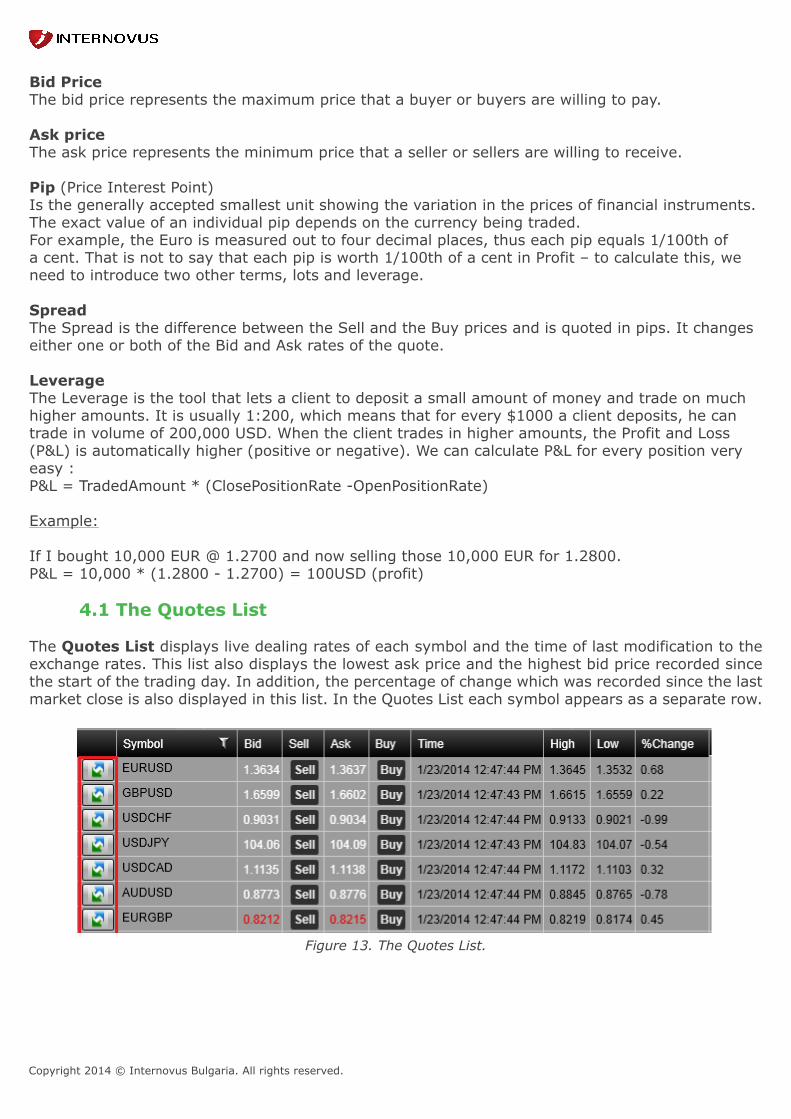
Bid PriceThe bid price represents the maximum price that a buyer or buyers are willing to pay. Ask priceThe ask price represents the minimum price that a seller or sellers are willing to receive. Pip (Price Interest Point)Is the generally accepted smallest unit showing the variation in the prices of financial instruments.The exact value of an individual pip depends on the currency being traded.For example, the Euro is measured out to four decimal places, thus each pip equals 1/100th ofa cent. That is not to say that each pip is worth 1/100th of a cent in Profit – to calculate this, weneed to introduce two other terms, lots and leverage. SpreadThe Spread is the difference between the Sell and the Buy prices and is quoted in pips. It changeseither one or both of the Bid and Ask rates of the quote. LeverageThe Leverage is the tool that lets a client to deposit a small amount of money and trade on muchhigher amounts. It is usually 1:200, which means that for every $1000 a client deposits, he cantrade in volume of 200,000 USD. When the client trades in higher amounts, the Profit and Loss(P&L) is automatically higher (positive or negative). We can calculate P&L for every position veryeasy :P&L = TradedAmount * (ClosePositionRate -OpenPositionRate) Example: If I bought 10,000 EUR @ 1.2700 and now selling those 10,000 EUR for 1.2800.P&L = 10,000 * (1.2800 - 1.2700) = 100USD (profit)
4.1 The Quotes List The Quotes List displays live dealing rates of each symbol and the time of last modification to theexchange rates. This list also displays the lowest ask price and the highest bid price recorded sincethe start of the trading day. In addition, the percentage of change which was recorded since the lastmarket close is also displayed in this list. In the Quotes List each symbol appears as a separate row.
Figure 13. The Quotes List.
Copyright 2014 © Internovus Bulgaria. All rights reserved.
You can use the Sell/Buy buttons to open positions. See section Opening a Position or Placing anEntry Order for more information.
Clicking the Trading Central icon will automatically log you into the Mirror site. The Mirror sitepage will open in a new window, displaying analysis regarding the particular symbol the clicked iconis located next to.
If you have not registered into the Mirror site yet or if your registration date has been expired, clickingthe Trading Central icon will open an Information window with the relevant instructions. Filtering Symbols
To filter the display of your Quotes list by symbols, click the filter icon which is next to the“Symbol” title. In the pop up window displayed, choose the desired symbols. The Quotes list isautomatically updated.
Click to close the pop up window.
Copyright 2014 © Internovus Bulgaria. All rights reserved.
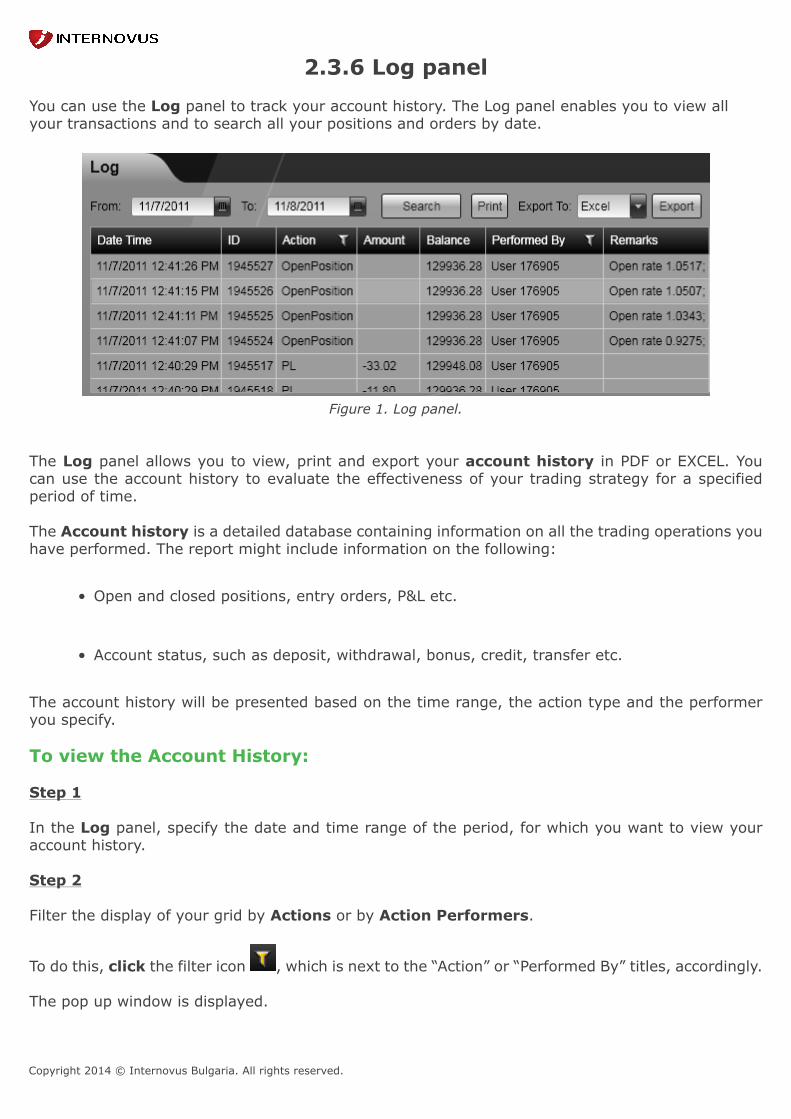
2.3.6 Log panel You can use the Log panel to track your account history. The Log panel enables you to view allyour transactions and to search all your positions and orders by date.
Figure 1. Log panel.
The Log panel allows you to view, print and export your account history in PDF or EXCEL. Youcan use the account history to evaluate the effectiveness of your trading strategy for a specifiedperiod of time.
The Account history is a detailed database containing information on all the trading operations youhave performed. The report might include information on the following:
• Open and closed positions, entry orders, P&L etc.
• Account status, such as deposit, withdrawal, bonus, credit, transfer etc.
The account history will be presented based on the time range, the action type and the performeryou specify.
To view the Account History:
Step 1
In the Log panel, specify the date and time range of the period, for which you want to view youraccount history.
Step 2
Filter the display of your grid by Actions or by Action Performers.
To do this, click the filter icon , which is next to the “Action” or “Performed By” titles, accordingly.
The pop up window is displayed.

Copyright 2014 © Internovus Bulgaria. All rights reserved.
Step 3
Choose the desired filter criteria in the provided filtering options and click Search.
The selected symbols are displayed in the grid.
Step 4
Click to close the pop up window.
Step 5
Click Print, if desired.
Step 6
If you want to export the report, select the desired format from the Export to dropdown list, andthen click Export.
Copyright 2014 © Internovus Bulgaria. All rights reserved.
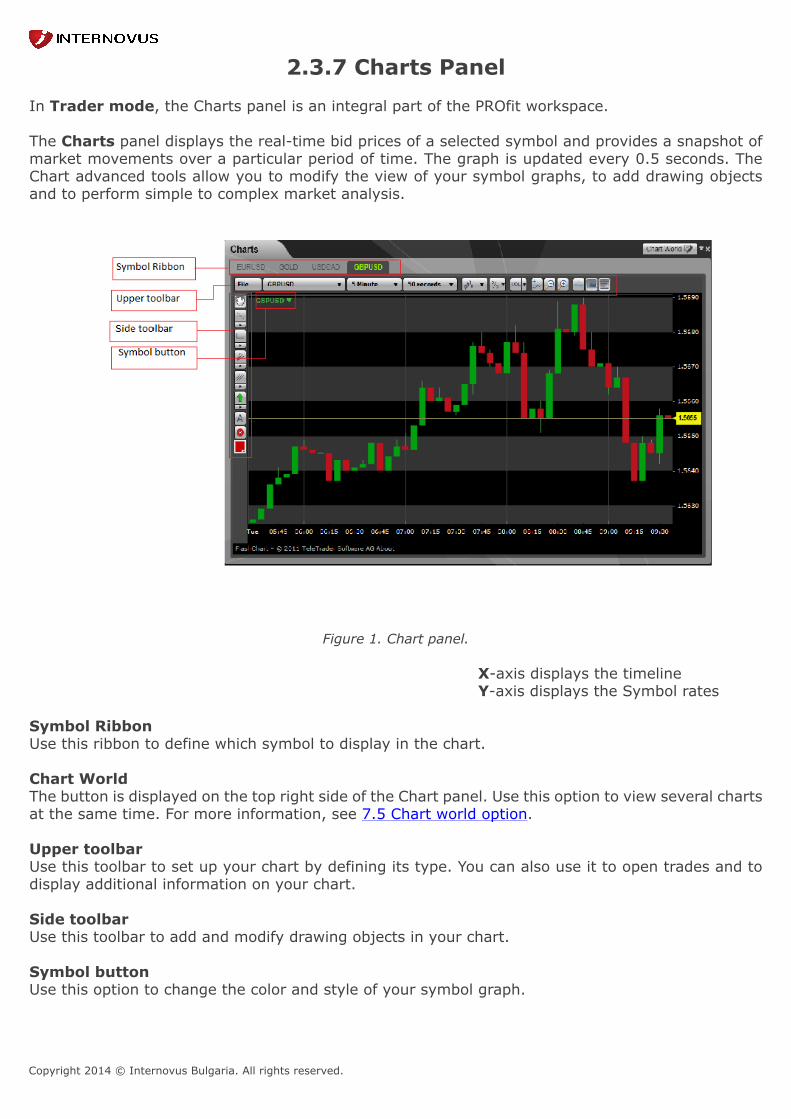
2.3.7 Charts Panel In Trader mode, the Charts panel is an integral part of the PROfit workspace.
The Charts panel displays the real-time bid prices of a selected symbol and provides a snapshot ofmarket movements over a particular period of time. The graph is updated every 0.5 seconds. TheChart advanced tools allow you to modify the view of your symbol graphs, to add drawing objectsand to perform simple to complex market analysis.
Figure 1. Chart panel.
X-axis displays the timelineY-axis displays the Symbol rates
Symbol RibbonUse this ribbon to define which symbol to display in the chart.
Chart WorldThe button is displayed on the top right side of the Chart panel. Use this option to view several chartsat the same time. For more information, see 7.5 Chart world option.
Upper toolbarUse this toolbar to set up your chart by defining its type. You can also use it to open trades and todisplay additional information on your chart.
Side toolbarUse this toolbar to add and modify drawing objects in your chart.
Symbol buttonUse this option to change the color and style of your symbol graph.

Copyright 2014 © Internovus Bulgaria. All rights reserved.
Copyright 2014 © Internovus Bulgaria. All rights reserved.
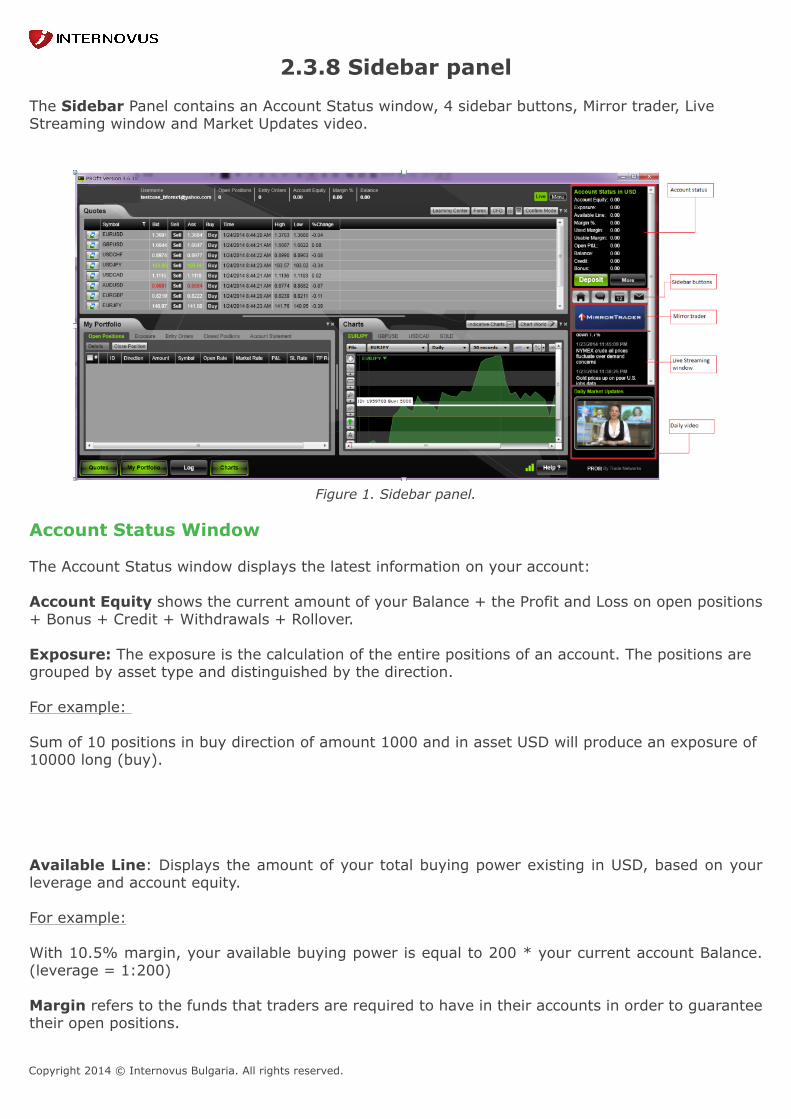
2.3.8 Sidebar panel The Sidebar Panel contains an Account Status window, 4 sidebar buttons, Mirror trader, LiveStreaming window and Market Updates video.
Figure 1. Sidebar panel.
Account Status Window
The Account Status window displays the latest information on your account:
Account Equity shows the current amount of your Balance + the Profit and Loss on open positions+ Bonus + Credit + Withdrawals + Rollover.
Exposure: The exposure is the calculation of the entire positions of an account. The positions aregrouped by asset type and distinguished by the direction. For example: Sum of 10 positions in buy direction of amount 1000 and in asset USD will produce an exposure of10000 long (buy).
Available Line: Displays the amount of your total buying power existing in USD, based on yourleverage and account equity.
For example:
With 10.5% margin, your available buying power is equal to 200 * your current account Balance.(leverage = 1:200)
Margin refers to the funds that traders are required to have in their accounts in order to guaranteetheir open positions.
Copyright 2014 © Internovus Bulgaria. All rights reserved.
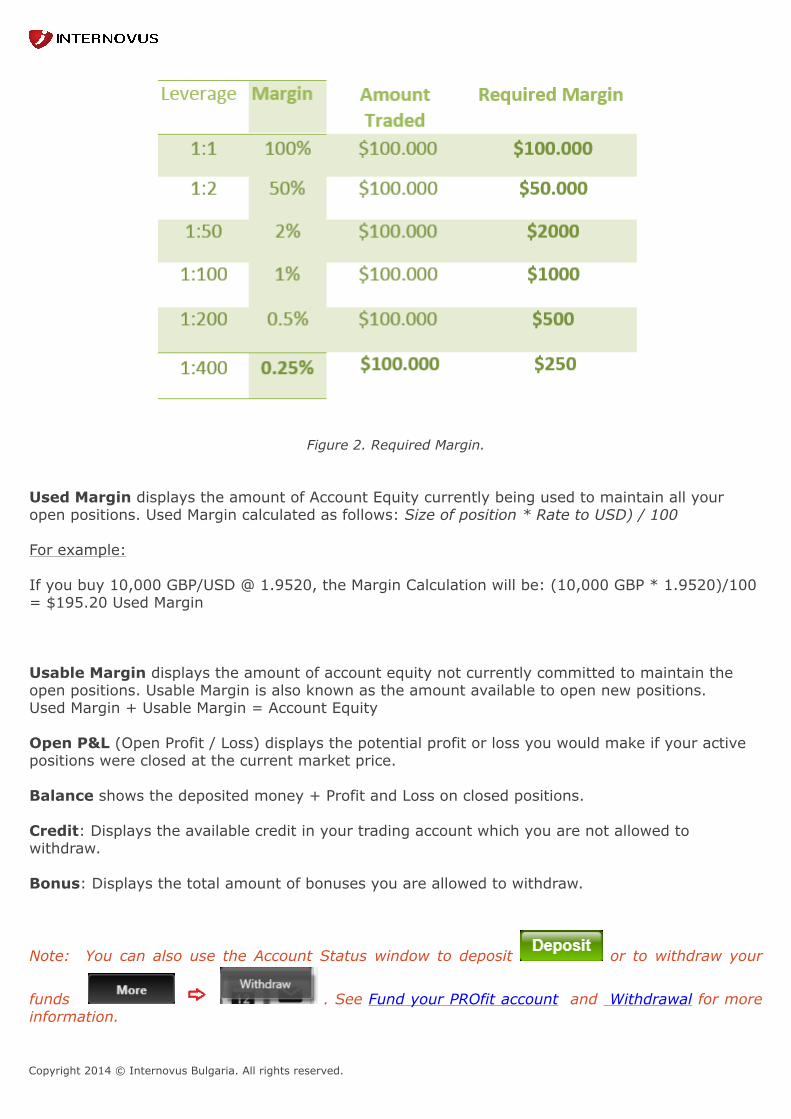
Figure 2. Required Margin.
Used Margin displays the amount of Account Equity currently being used to maintain all youropen positions. Used Margin calculated as follows: Size of position * Rate to USD) / 100 For example: If you buy 10,000 GBP/USD @ 1.9520, the Margin Calculation will be: (10,000 GBP * 1.9520)/100= $195.20 Used Margin
Usable Margin displays the amount of account equity not currently committed to maintain theopen positions. Usable Margin is also known as the amount available to open new positions.Used Margin + Usable Margin = Account Equity Open P&L (Open Profit / Loss) displays the potential profit or loss you would make if your activepositions were closed at the current market price. Balance shows the deposited money + Profit and Loss on closed positions. Credit: Displays the available credit in your trading account which you are not allowed towithdraw. Bonus: Displays the total amount of bonuses you are allowed to withdraw.
Note: You can also use the Account Status window to deposit or to withdraw your
funds . See Fund your PROfit account and Withdrawal for moreinformation.
Copyright 2014 © Internovus Bulgaria. All rights reserved.
Sidebar buttons
There are four sidebar buttons: Home, Chat, Event Calendar and Contact Us.
Use the Home option to access the homepage.
Use the Chat option to initiate Live Chat.
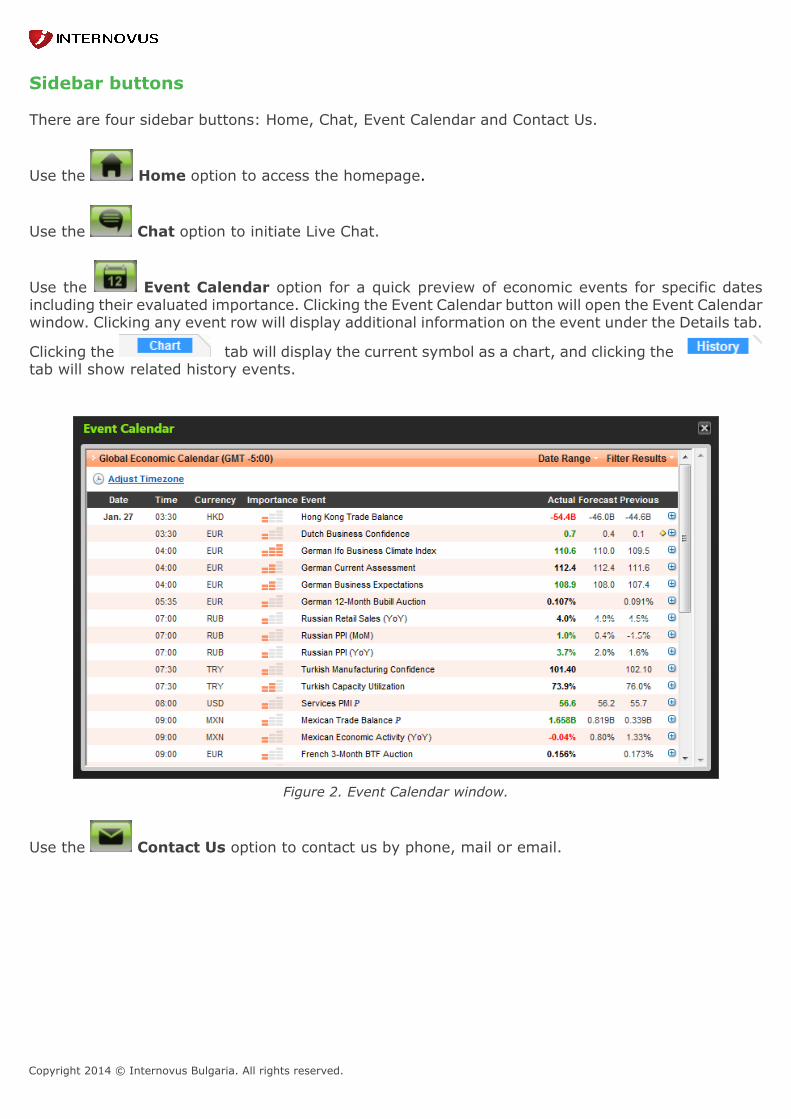
Use the Event Calendar option for a quick preview of economic events for specific datesincluding their evaluated importance. Clicking the Event Calendar button will open the Event Calendarwindow. Clicking any event row will display additional information on the event under the Details tab.
Clicking the tab will display the current symbol as a chart, and clicking thetab will show related history events.
Figure 2. Event Calendar window.
Use the Contact Us option to contact us by phone, mail or email.

Copyright 2014 © Internovus Bulgaria. All rights reserved.
Figure 3. Contact Us. Mirror trader
The Mirror Trader allows you to follow the strategies and signals of other traders, and to automatically“mirror” them. No intervention is required by the client, all the account activity is controlled by theplatform. With Mirror Trader, you can follow and copy strategies, each one developed by professionaltraders around the world.
Live Streaming Window
The Live Streaming Window provides you with streaming market updates. To view the complete newsstory, simply click on the running headline and the News Details window appears. Use the Previous,Next and Close buttons to navigate the window.
Figure 4. News Details.
Daily Video

Copyright 2014 © Internovus Bulgaria. All rights reserved.
You can watch a daily video report specifically added to provide you with forex tips. To watch up -to -the -minute news updates click Play in the control panel.
Figure 5. Daily Video

Copyright 2014 © Internovus Bulgaria. All rights reserved.
2.3.9 Navigation bar The Navigation bar is displayed below the Log panel and consists of four toggle buttons. You canuse these buttons to show or hide the PROfit panels in the main display area. When the panel isvisible the related customization button appears in green. When you hide the panel the customizationbutton appears in grey.
The layout of the navigation buttons is changed according to the Trading Level. See Section 2.3.2Beginner Mode for more information on the trading levels. Beginner level
Figure 1. Beginner navigation.Trader level
Figure 2. Trader mode.
The icon indicates the strength of your internet connection to PROfit. Three Green bars meanyou have a full connectivity.
Use the option to get more information on PROfit features. Clicking this option, displays marks in theworkspace, next to feature titles. Clicking one of these question marks will open a floating bubble,containing brief explanation about the current PROfit feature.
See an example below:
Figure 3. Help option.
Copyright 2014 © Internovus Bulgaria. All rights reserved.
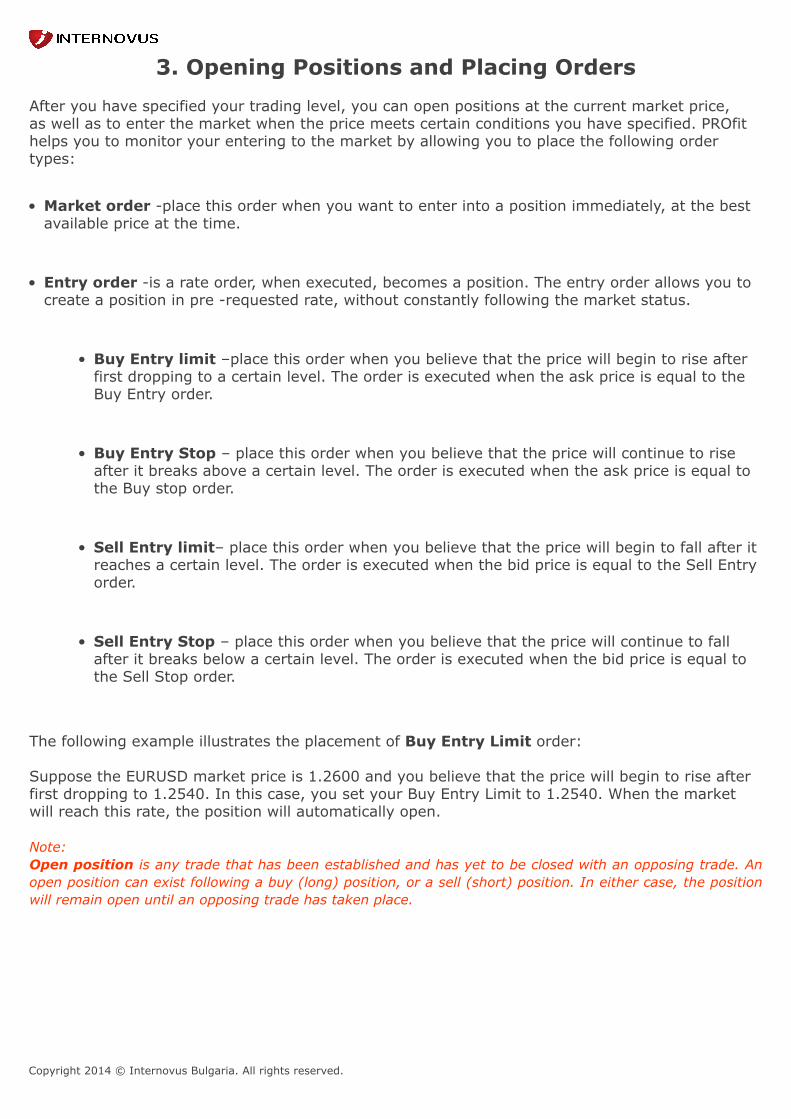
3. Opening Positions and Placing Orders After you have specified your trading level, you can open positions at the current market price,as well as to enter the market when the price meets certain conditions you have specified. PROfithelps you to monitor your entering to the market by allowing you to place the following ordertypes:
• Market order -place this order when you want to enter into a position immediately, at the bestavailable price at the time.
• Entry order -is a rate order, when executed, becomes a position. The entry order allows you tocreate a position in pre -requested rate, without constantly following the market status.
• Buy Entry limit –place this order when you believe that the price will begin to rise afterfirst dropping to a certain level. The order is executed when the ask price is equal to theBuy Entry order.
• Buy Entry Stop – place this order when you believe that the price will continue to riseafter it breaks above a certain level. The order is executed when the ask price is equal tothe Buy stop order.
• Sell Entry limit– place this order when you believe that the price will begin to fall after itreaches a certain level. The order is executed when the bid price is equal to the Sell Entryorder.
• Sell Entry Stop – place this order when you believe that the price will continue to fallafter it breaks below a certain level. The order is executed when the bid price is equal tothe Sell Stop order.
The following example illustrates the placement of Buy Entry Limit order: Suppose the EURUSD market price is 1.2600 and you believe that the price will begin to rise afterfirst dropping to 1.2540. In this case, you set your Buy Entry Limit to 1.2540. When the marketwill reach this rate, the position will automatically open. Note:Open position is any trade that has been established and has yet to be closed with an opposing trade. Anopen position can exist following a buy (long) position, or a sell (short) position. In either case, the positionwill remain open until an opposing trade has taken place.

Copyright 2014 © Internovus Bulgaria. All rights reserved.
3.1 Opening positions in the Confirm Mode The Confirm Mode enables you to confirm each position you open before the final execution.Market orders can be placed via the Quotes box button or Quotes list.
• Quote box button option:
Figure 1. Quote box
• Quote list option:
Figure 2. Quote list
To place a Market Order, follow the steps:
Step 1 Click Buy or Sell to execute the market order at the current price. The Open Position window isdisplayed.
Figure 3. Open position window (Market order)

Copyright 2014 © Internovus Bulgaria. All rights reserved.
Step 2 Enter the required data. In this mode you can use the Open Position window to place positions at the best available marketprice. The Open Position window allows you to define your trading amount, to change the directionof your position and to limit it, if desired. Symbol: displays the selected Currency Pair. Direction: shows the direction of your position. You have the option to change the Sell or Buyorder. In the Amount list, select or type the size of your trade. The Ask / Bid button which represents the current direction of your position appears highlighted. By default, the Limit Type field is set to None. For more information on limiting your position andplacing a SL/TP, navigate to the following link:Limiting your Positions with SL/TP Orders The Type field is set to Market Order, allowing you to open a position at the current market price.To set Entry order, navigate to the link:3.3 Placing an Entry Order
This shield symbol shows that the position will be protected. Protected positions: When you open new account, after your FTD, the first five open positionswill be protected and allow you to trade with lower risk and loss. This means, that:
• Any funds lost from the first five trades will be credited back to the account.
• Any funds gained from the first five trades belong to the client.
• Any lost funds resulting from the first five protected trades, are credited back into thetrading account and may be withdrawn by the client at any time.
Note 2: The first five protected positions must be closed within two working days of the openingdate. These are the days between Sunday at 22:00 GMT and until Friday 22:00 GMT. A positionopened for more than two working days will be automatically closed.
The leverage for this positions is 1:50, instead of 1:200 for forex assets. Step 3
Click to confirm.
Copyright 2014 © Internovus Bulgaria. All rights reserved.
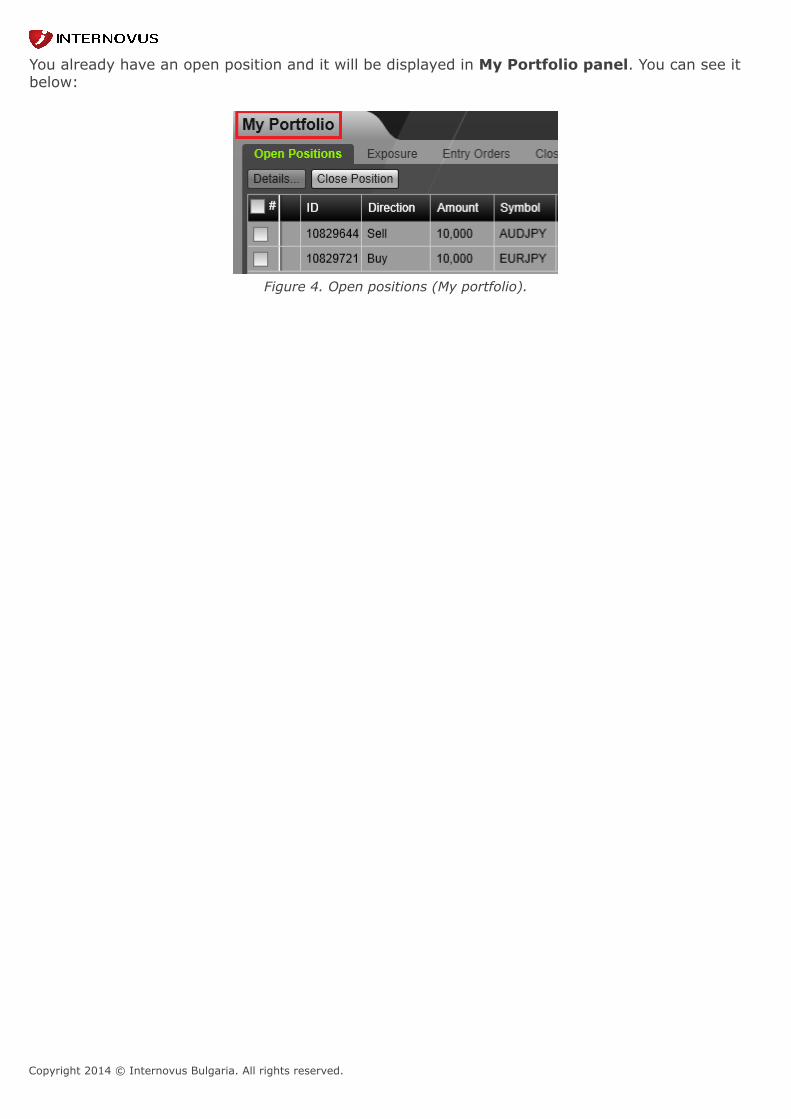
You already have an open position and it will be displayed in My Portfolio panel. You can see itbelow:
Figure 4. Open positions (My portfolio).

Copyright 2014 © Internovus Bulgaria. All rights reserved.
3.2 Opening positions in 1 -Click Mode When you want to monitor market movement and make trades quickly, you can use the 1-ClickTrade mode. The 1-Click Trade mode allows you to open a position without confirmation, in oneclick. To Turn On the 1-Click Trade Mode, click the Confirm Mode button at the top right side of theLayout buttons , as displayed:
Figure 1. Turn on 1 -Click mode.
The button will be shown, instead of Confirm Mode button. After you define your trading mode as the 1-Click trade mode the Quotes panel is modified asfollows:
• In the Quotes List, a new Amount column appears.
Figure 2. 1 -Click mode (Quotes List)
• In the Quotes boxes, a new drop -down button appears in the middle of the Buy and Sellbuttons.
Figure 4. 1 -Click mode (Quote boxes)
Copyright 2014 © Internovus Bulgaria. All rights reserved.
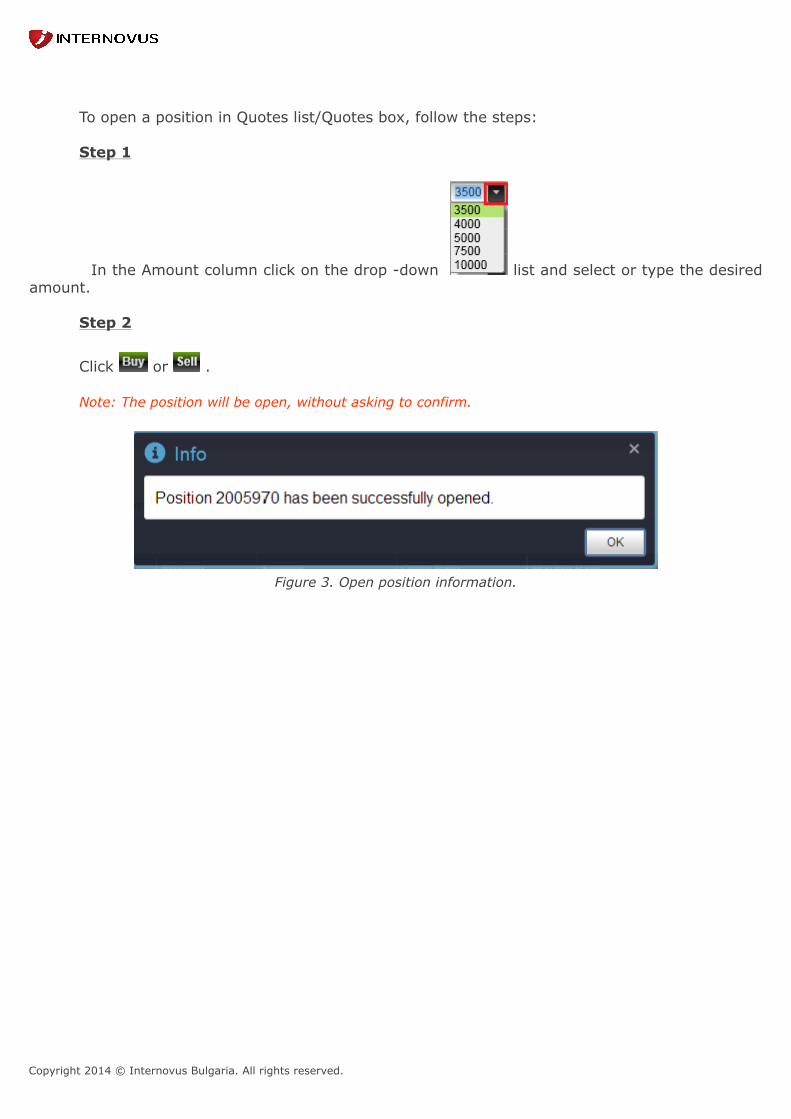
To open a position in Quotes list/Quotes box, follow the steps:
Step 1
In the Amount column click on the drop -down list and select or type the desiredamount.
Step 2
Click or .
Note: The position will be open, without asking to confirm.
Figure 3. Open position information.
Copyright 2014 © Internovus Bulgaria. All rights reserved.
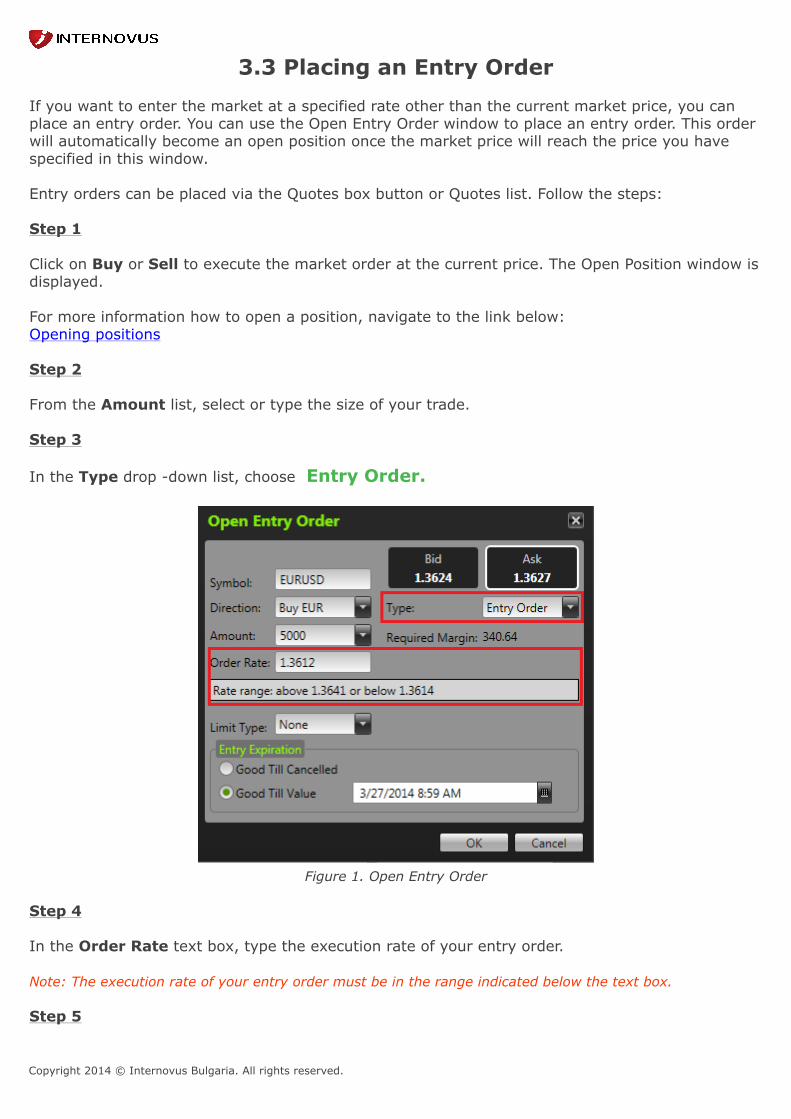
3.3 Placing an Entry Order If you want to enter the market at a specified rate other than the current market price, you canplace an entry order. You can use the Open Entry Order window to place an entry order. This orderwill automatically become an open position once the market price will reach the price you havespecified in this window. Entry orders can be placed via the Quotes box button or Quotes list. Follow the steps: Step 1 Click on Buy or Sell to execute the market order at the current price. The Open Position window isdisplayed. For more information how to open a position, navigate to the link below:Opening positions Step 2 From the Amount list, select or type the size of your trade. Step 3 In the Type drop -down list, choose Entry Order.
Figure 1. Open Entry Order Step 4 In the Order Rate text box, type the execution rate of your entry order. Note: The execution rate of your entry order must be in the range indicated below the text box. Step 5
Copyright 2014 © Internovus Bulgaria. All rights reserved.
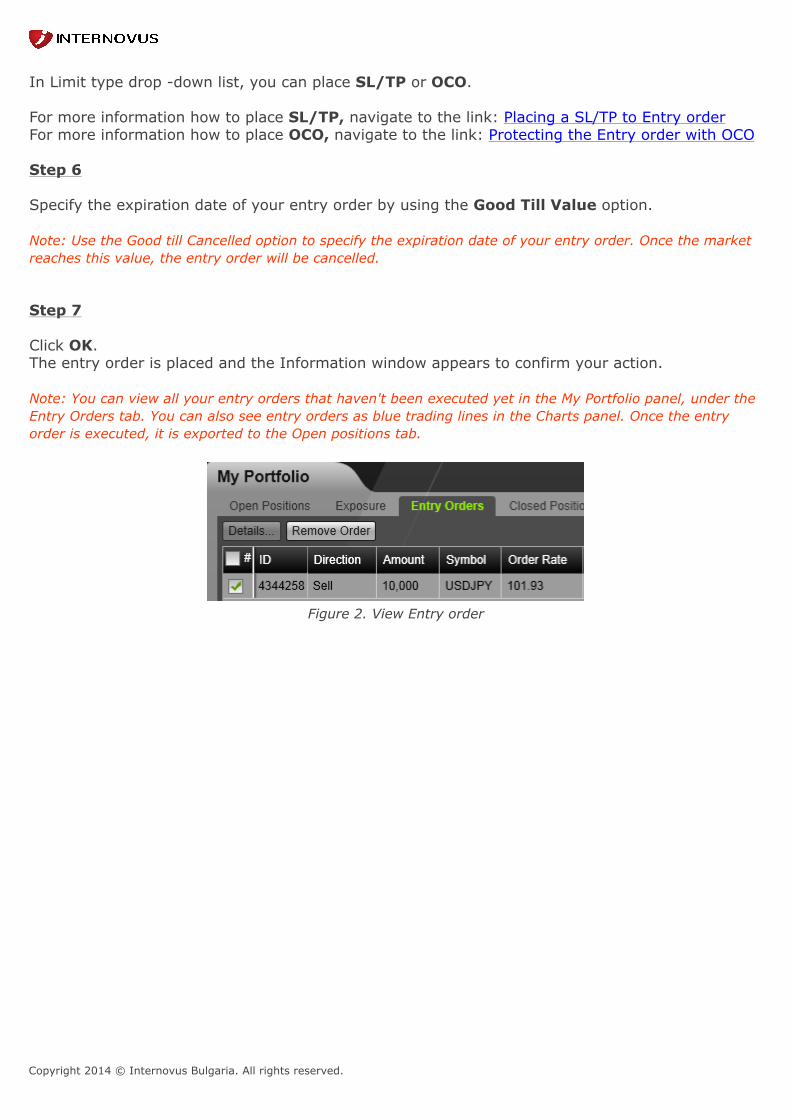
In Limit type drop -down list, you can place SL/TP or OCO. For more information how to place SL/TP, navigate to the link: Placing a SL/TP to Entry orderFor more information how to place OCO, navigate to the link: Protecting the Entry order with OCO Step 6 Specify the expiration date of your entry order by using the Good Till Value option. Note: Use the Good till Cancelled option to specify the expiration date of your entry order. Once the marketreaches this value, the entry order will be cancelled. Step 7 Click OK.The entry order is placed and the Information window appears to confirm your action. Note: You can view all your entry orders that haven't been executed yet in the My Portfolio panel, under theEntry Orders tab. You can also see entry orders as blue trading lines in the Charts panel. Once the entryorder is executed, it is exported to the Open positions tab.
Figure 2. View Entry order
Copyright 2014 © Internovus Bulgaria. All rights reserved.
3.4 Limiting your Positions with SL/TP Orders Stop Loss Order To close a position automatically at a specific rate and to prevent further loss, use Stop LossOrder . This is done by, automatically closing an open trade when the price reaches a levelpredefined by the trader. You can place a stop loss order to close your trade at a specified amountor at a specified rate which is different than the current market price. Take Profit Order To close a position at a specific rate and to capture a specific profit, use Take Profit Order. Thishelps you manage your risk even when you are not available, or when the price reaches the targettoo quickly for you to react. The SL&TP can be set in both rates and amounts. Placing SL/TP orders allow you to manage your risk on any open position. You can place the SL/TPfor both a Market Order and Entry Order. A SL&TP on an entry order will not be active and it willnot execute before the entry order was executed and become an active position. Example: If you buy USDCHF at 1.2220. To limit your maximum loss, you set a Stop -Loss order at 1.2200.This means, if USD/CHF drops to 1.2200 instead of moving up, your account system wouldautomatically execute a SL order at 1.2200 and close out your losing position for a 20 pip loss. To place a SL/TP to Market order, navigate to the following link:Placing a SL/TP to Market order To place a SL/TP to Entry order, navigate to the following link:Placing a SL/TP to Entry order
Copyright 2014 © Internovus Bulgaria. All rights reserved.
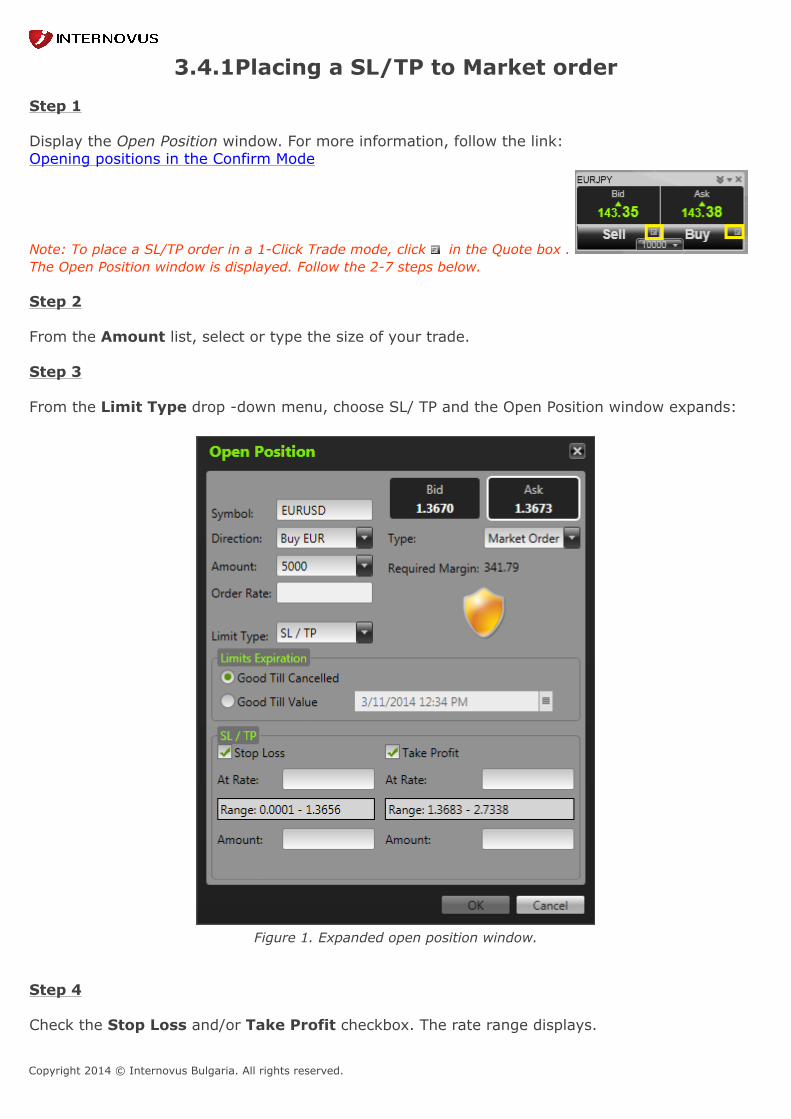
3.4.1Placing a SL/TP to Market order Step 1 Display the Open Position window. For more information, follow the link:Opening positions in the Confirm Mode
Note: To place a SL/TP order in a 1-Click Trade mode, click in the Quote box . The Open Position window is displayed. Follow the 2-7 steps below. Step 2 From the Amount list, select or type the size of your trade. Step 3 From the Limit Type drop -down menu, choose SL/ TP and the Open Position window expands:
Figure 1. Expanded open position window. Step 4 Check the Stop Loss and/or Take Profit checkbox. The rate range displays.
Copyright 2014 © Internovus Bulgaria. All rights reserved.
Step 5 You can specify the Limits Expiration date of your SL/TP, if desired. By default the field is set to
. Step 6 To define your SL/TP Rates you can choose one of the following options:
• In the At Rate text box enter your SL/ TP rate. The Amount value is automaticallymodified to fit the entered rate.
• Alternatively, in the Amount text box enter the approximate amount, which will trigger theSL/ TP order. The At Rate value is automatically modified.
Note: When entering an Amount value, the modified At Rate value must fall inside the range indicated in theRange text box below.
Step 7
Click . The SL/TP order is placed!
Copyright 2014 © Internovus Bulgaria. All rights reserved.
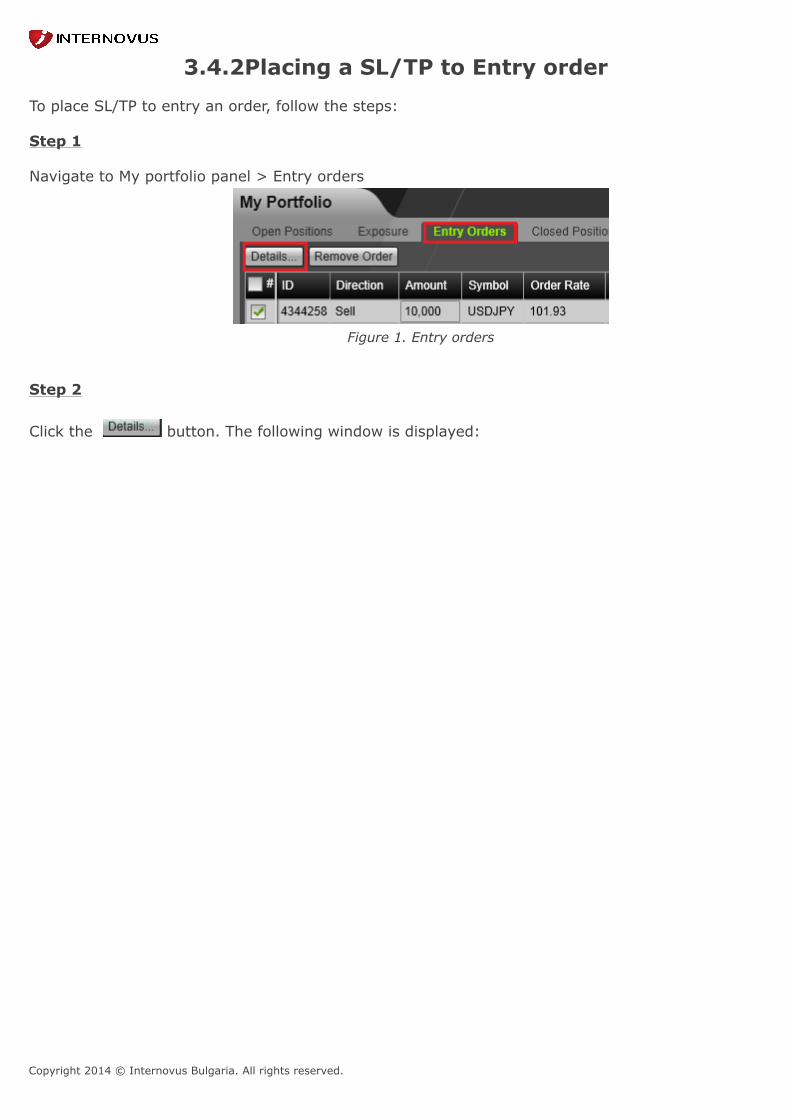
3.4.2Placing a SL/TP to Entry order To place SL/TP to entry an order, follow the steps: Step 1 Navigate to My portfolio panel > Entry orders
Figure 1. Entry orders Step 2 Click the button. The following window is displayed:

Copyright 2014 © Internovus Bulgaria. All rights reserved.
Figure 2. Entry Order Details
Step 3
In this window you have the option to change the size of your trade, from the Amount list and theOrder Rate as well.
Step 4
Check the Stop Loss and/or Take Profit check box. The Rate range is displayed.
Step 5
Define your SL/TP rates.
For more information, follow the link:Placing a SL/TP to Market order
Step 6
Specify the Expiration date of your Entry order, if desired.
Copyright 2014 © Internovus Bulgaria. All rights reserved.
Step 7
Click OK.The SL/TP order is placed and the Information window appears.
Note: In the Entry order details window you can also set an OCO order. For more information about OCOorders, follow the link: Protecting Entry order with OCO order
Copyright 2014 © Internovus Bulgaria. All rights reserved.
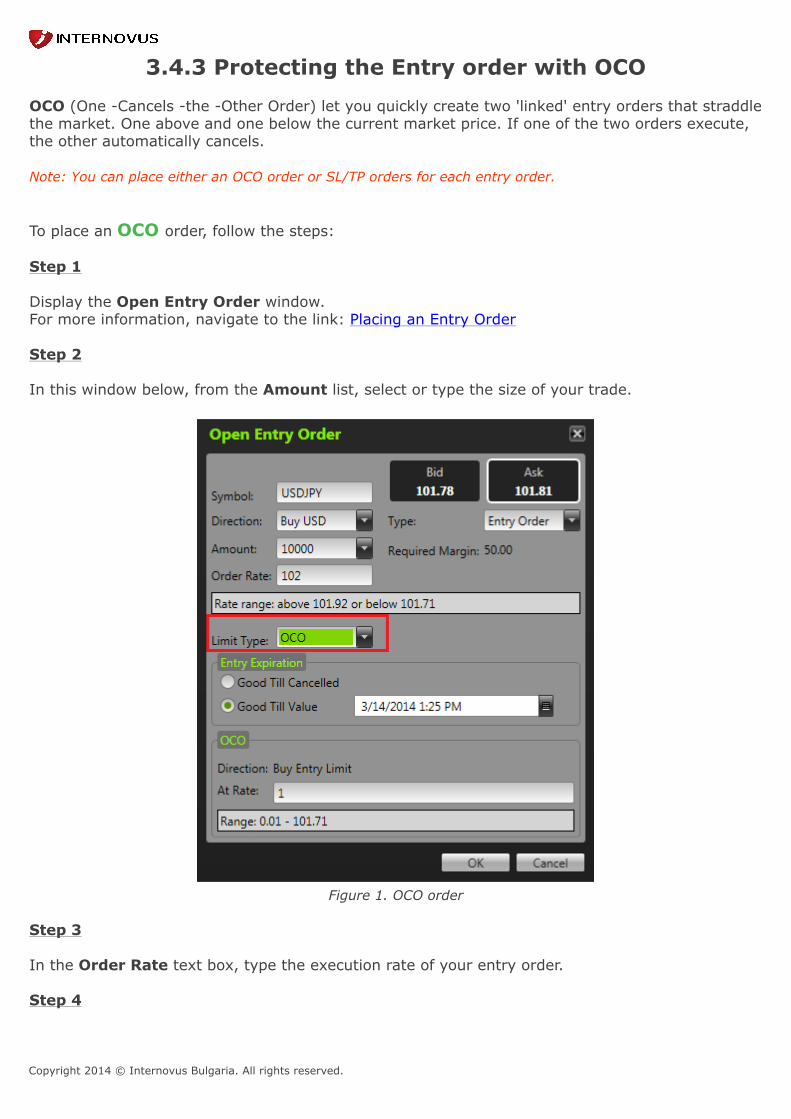
3.4.3 Protecting the Entry order with OCO OCO (One -Cancels -the -Other Order) let you quickly create two 'linked' entry orders that straddlethe market. One above and one below the current market price. If one of the two orders execute,the other automatically cancels. Note: You can place either an OCO order or SL/TP orders for each entry order. To place an OCO order, follow the steps: Step 1 Display the Open Entry Order window.For more information, navigate to the link: Placing an Entry Order Step 2 In this window below, from the Amount list, select or type the size of your trade.
Figure 1. OCO order
Step 3
In the Order Rate text box, type the execution rate of your entry order.
Step 4
Copyright 2014 © Internovus Bulgaria. All rights reserved.
From the Limit Type drop down list choose OCO. The Open Entry Order window expands.
Step 5
Specify the Expiration date of your OCO entry order, if applicable.
Step 6
In the At Rate text box, enter the rate of your OCO order execution.
Note: The entered OCO rate must fall in the range displayed below.
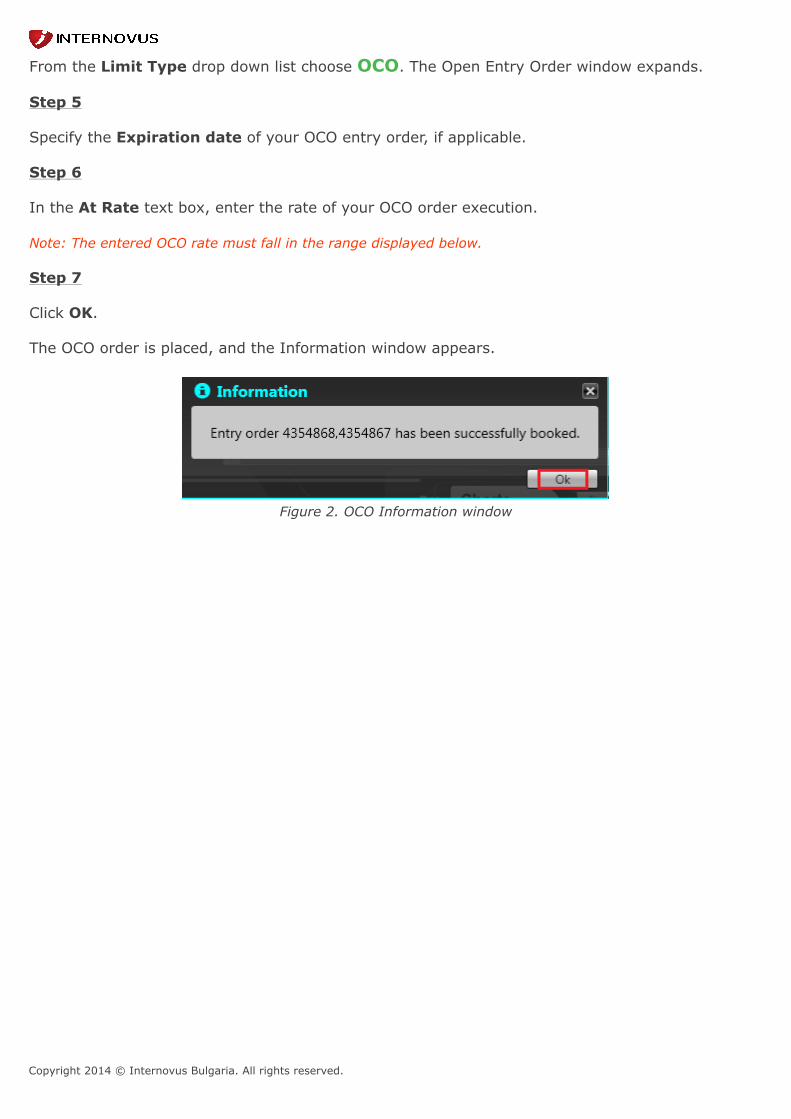
Step 7
Click OK.
The OCO order is placed, and the Information window appears.
Figure 2. OCO Information window
Copyright 2014 © Internovus Bulgaria. All rights reserved.
4. Managing existing positions
After opening a position or placing an entry order, you can still react to dynamic marketmovements by changing the values of orders you have placed. You can use the My Portfolio panel to view, edit and close all your open positions at any time.You can also protect your trades by changing their amounts and modifying the rates of SL/TP ordersyou have placed.
You can also use the My Portfolio panel to modify your entry orders. You can update their valuessuch as amount, entry rate and OCO rate, until the entry orders are executed. All entry orders canbe cancelled as long as they have not reached the execution rate you defined.
The Log panel is another effective tool you can use to manage your trades. This panel allows you toview, print and export your Trading History. This way, you can track all your activities and analyzeyour trading strategy.
Copyright 2014 © Internovus Bulgaria. All rights reserved.
4.1 Modify an open position To manage your open positions you can use the Position Details window. It provides you withseveral ways to modify open positions. You can:
• Place new SL/TP orders.
• Change the values of the existing SL/TP orders.
• Update the expiration date and time of the placed SL/TP orders.
• Remove SL/TP orders.
• Close a position.
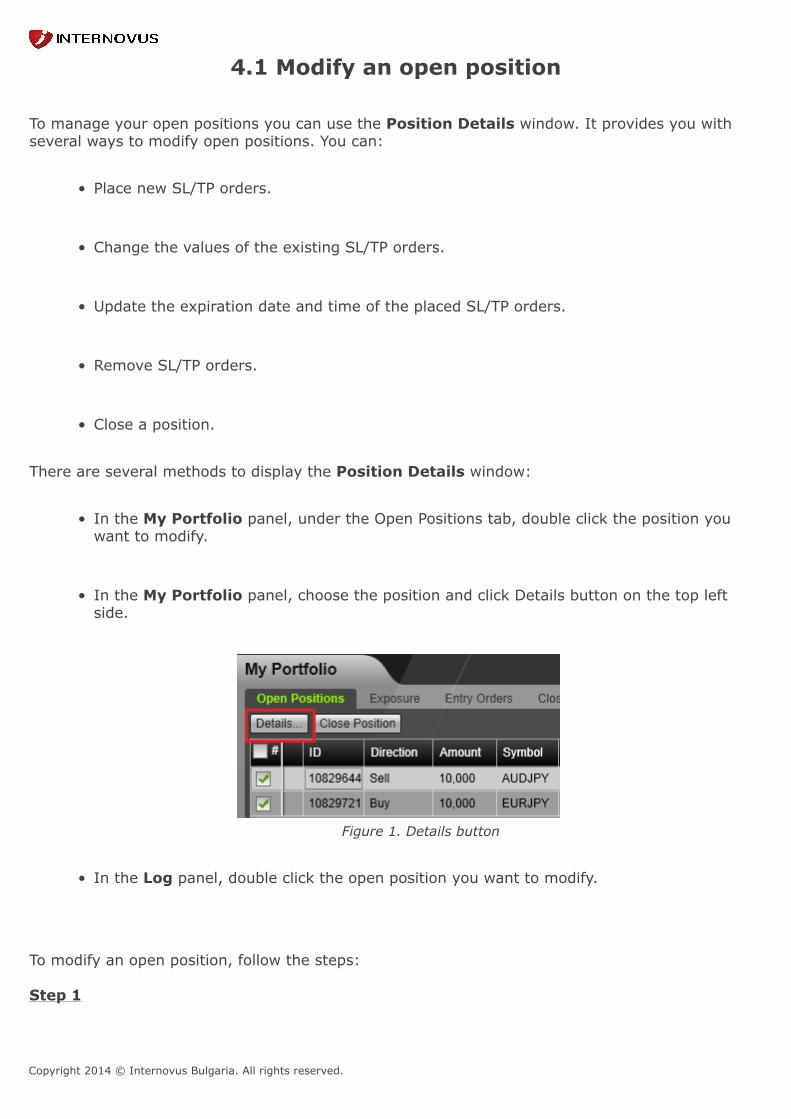
There are several methods to display the Position Details window:
• In the My Portfolio panel, under the Open Positions tab, double click the position youwant to modify.
• In the My Portfolio panel, choose the position and click Details button on the top leftside.
Figure 1. Details button
• In the Log panel, double click the open position you want to modify.
To modify an open position, follow the steps:
Step 1
Copyright 2014 © Internovus Bulgaria. All rights reserved.
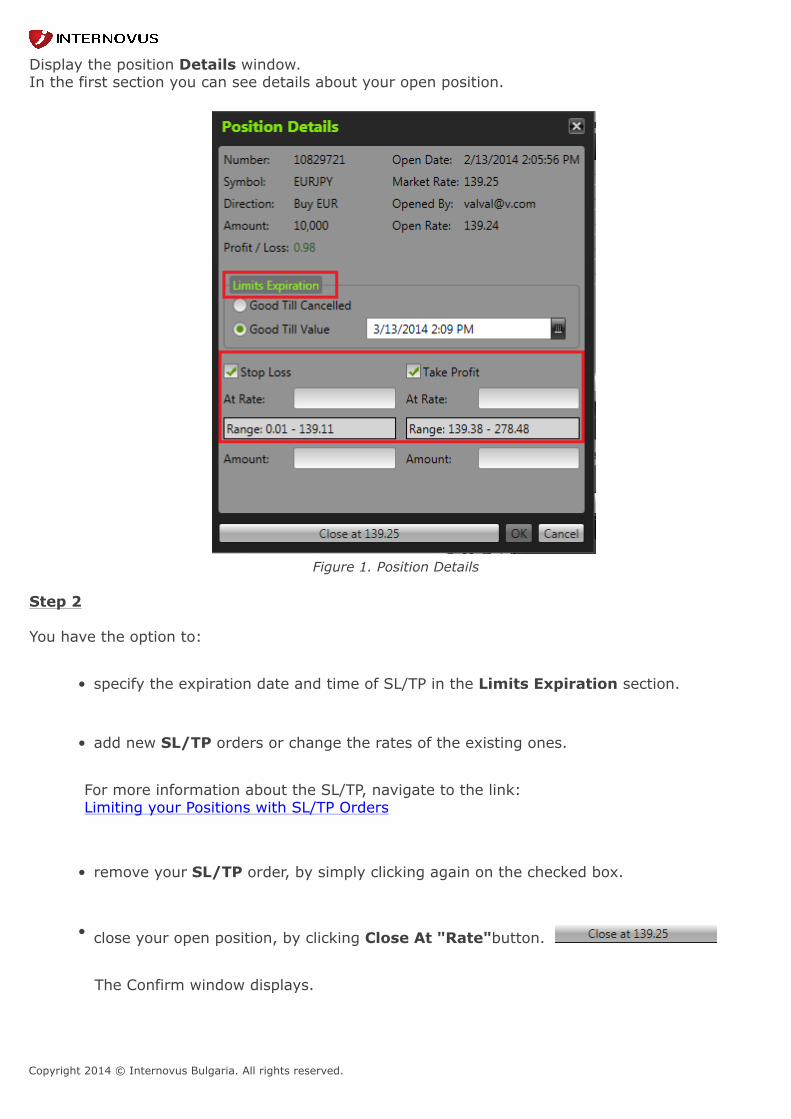
Display the position Details window.In the first section you can see details about your open position.
Figure 1. Position Details
Step 2
You have the option to:
• specify the expiration date and time of SL/TP in the Limits Expiration section.
• add new SL/TP orders or change the rates of the existing ones.
For more information about the SL/TP, navigate to the link: Limiting your Positions with SL/TP Orders
• remove your SL/TP order, by simply clicking again on the checked box.
• close your open position, by clicking Close At "Rate"button.
The Confirm window displays.

Copyright 2014 © Internovus Bulgaria. All rights reserved.
Figure 2. Confirm window
Step 3
Click OK.
The Information window appears to confirm your action: the open rate window
Figure 3. Information window

Copyright 2014 © Internovus Bulgaria. All rights reserved.
4.2 Modify an entry order You can follow the market movement also by modifying entry orders. To do this, you can use theEntry Order Details window, which provides you with several ways to modify entry orders. Youcan:
• Change the amount of your trade.
• Change entry order execution rate.
• Specify the entry order expiration date and time.
• Place, edit and remove SL/TP or OCO orders.
• Cancel an entry order.
There are two methods to display the Entry Order Details window:
• In the My Portfolio panel, under the Entry Order tab, double click the order you want tomodify. The Entry Order Details window opens.
• In the My Portfolio panel, choose the position and click Details button on the top leftside. The Entry Order Details window opens.
Figure 1. Entry orders
To modify an Entry order, follow the steps:
Step 1
Display the Entry order details window.In the first section you can see details about your open position.

Copyright 2014 © Internovus Bulgaria. All rights reserved.
Figure 1. Entry Order Details window
Step 2
You can use section to change the Amount and enter a new execution rate into the OrderRate text field.
Step 3
You can use section to update the Expiration date and time of the entry order you placed.
Step 4
You can use section to place new SL/TP orders or change the rates of the existing ones, aswell as to update and cancel them.
Step 5

Copyright 2014 © Internovus Bulgaria. All rights reserved.
You can use section to place/remove OCO orders. For more information about OCO orders,navigate to the following link:Protecting Entry order with OCO
Step 6
Click OK.The entry order is modified and the Information window appears confirming your action.

Copyright 2014 © Internovus Bulgaria. All rights reserved.
5. Closing positions PROfit provides you with several ways to close your positions. You can close positions one by one,or several positions at once. You can also close all your positions in one action. In addition, PROfit enables you more advanced options. You can specify the exact positions tobe closed for a selected symbol: you can close Only Sell symbol positions, Only Buy symbolpositions or All symbol positions. To close a position, follow the steps: Method 1
Step 1
In My Portfolio panel, under the Open Positions tab all open positions are visible. Selectthe checkbox next to the position/s you want to close.
Figure 1. Close position
Note: To close all your open positions at once, In the My Portfolio panel, under the Open Positions
tab, select the checkbox, as displayed: .
Step 2
Click the Close Position button. The Question window displays.

Copyright 2014 © Internovus Bulgaria. All rights reserved.
Figure 2. Question window
Step 3
Click Yes. The selected position/s to be closed and the Information window appears toconfirm your action.
Note: Click No, if you want to cancel the closing position procedure.
Figure 3. Information window
Click OK. Method 2
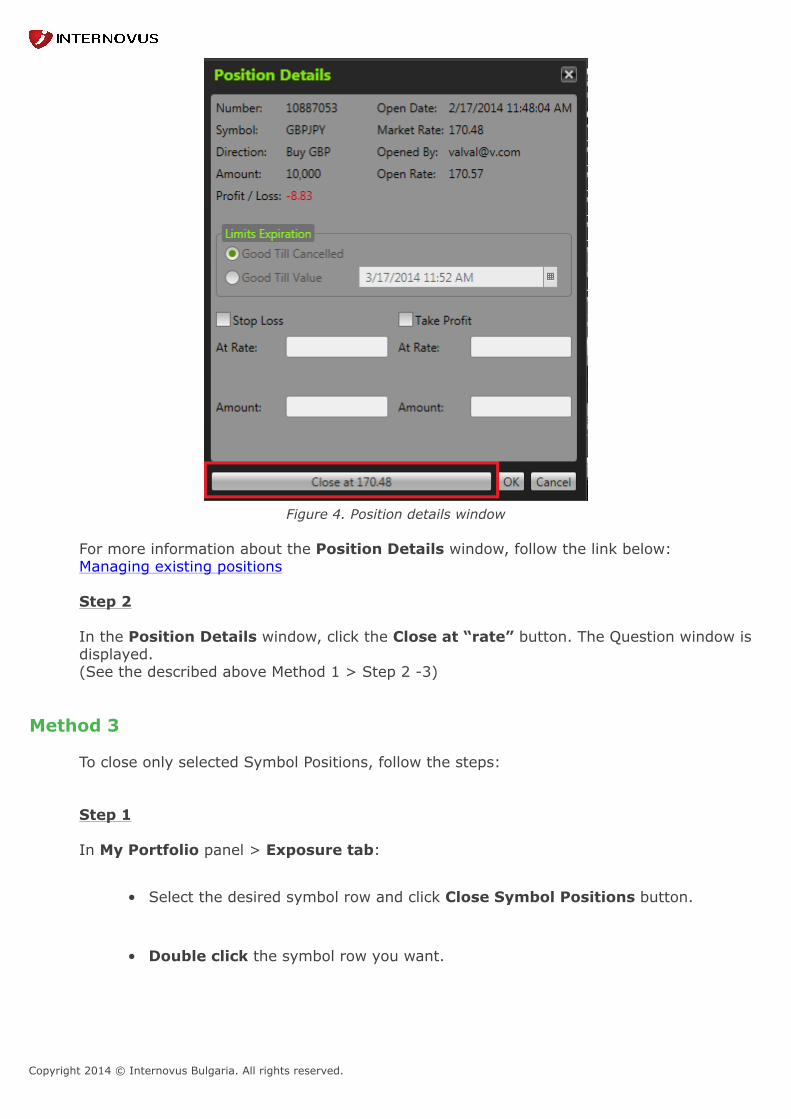
Step 1 In My Portfolio panel, under the Open Positions tab, double click on the position you wantto modify. Alternatively, you can select the desired position and click the Details button.The Position Details window opens.
Copyright 2014 © Internovus Bulgaria. All rights reserved.
Figure 4. Position details window
For more information about the Position Details window, follow the link below:Managing existing positions
Step 2 In the Position Details window, click the Close at “rate” button. The Question window isdisplayed.(See the described above Method 1 > Step 2 -3)
Method 3
To close only selected Symbol Positions, follow the steps:
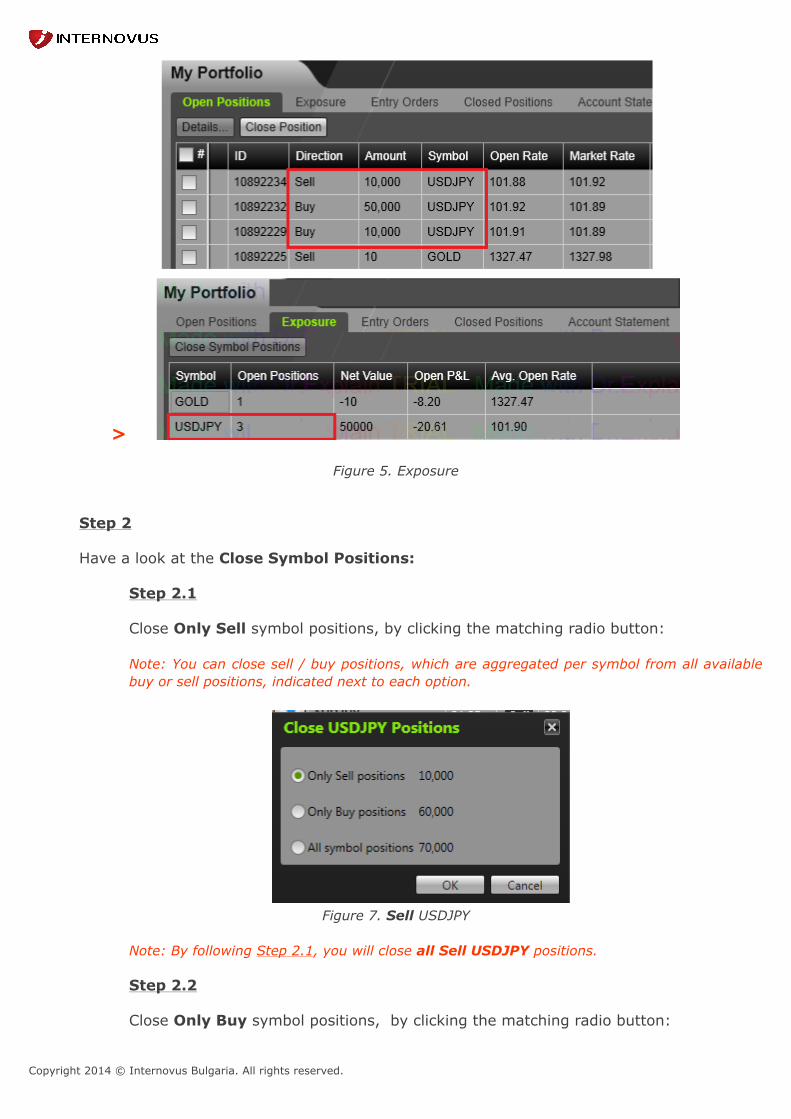
Step 1 In My Portfolio panel > Exposure tab:
• Select the desired symbol row and click Close Symbol Positions button.
• Double click the symbol row you want.
Copyright 2014 © Internovus Bulgaria. All rights reserved.
>
Figure 5. Exposure
Step 2
Have a look at the Close Symbol Positions:
Step 2.1 Close Only Sell symbol positions, by clicking the matching radio button: Note: You can close sell / buy positions, which are aggregated per symbol from all availablebuy or sell positions, indicated next to each option.
Figure 7. Sell USDJPY
Note: By following Step 2.1, you will close all Sell USDJPY positions.
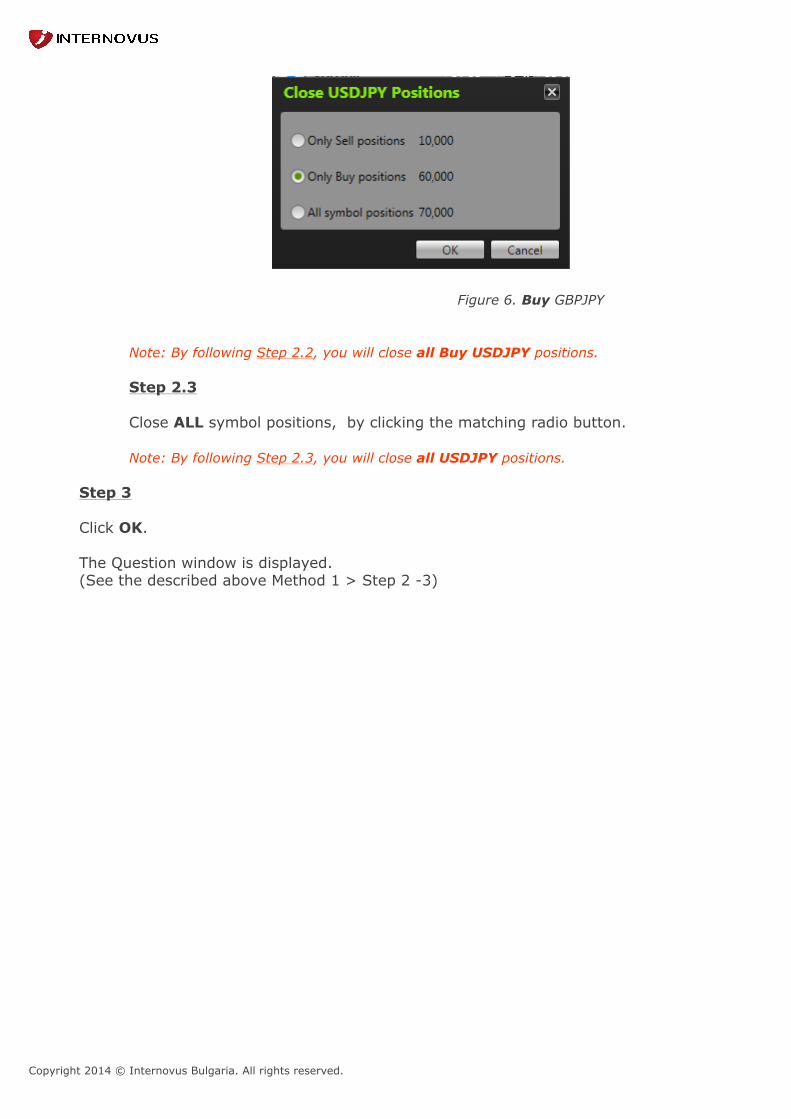
Step 2.2
Close Only Buy symbol positions, by clicking the matching radio button:
Copyright 2014 © Internovus Bulgaria. All rights reserved.
Figure 6. Buy GBPJPY
Note: By following Step 2.2, you will close all Buy USDJPY positions.
Step 2.3
Close ALL symbol positions, by clicking the matching radio button. Note: By following Step 2.3, you will close all USDJPY positions.
Step 3
Click OK.
The Question window is displayed.(See the described above Method 1 > Step 2 -3)

Copyright 2014 © Internovus Bulgaria. All rights reserved.
6. Withdrawal
Note: Your withdrawal request passes through several stages. You will receive a phone call within 24 hoursfrom a customer service agent. Until five business days the withdrawal process will be completed. Step 1 Navigate to Sidebar > Account status . Step 2
Click button . Step 3 Click Withdraw from the drop -down menu .
Figure 1. Withdraw button
Step 4 The following window below appears. Read the guidelines and fill in the requested information.

Copyright 2014 © Internovus Bulgaria. All rights reserved.
Figure 2. Withdraw window
Step 4
Click button.
Upon clicking the Submit button , your request of withdrawal is sent to a customer service agent andyou will receive a call from him/her to confirm your withdrawal.
Copyright 2014 © Internovus Bulgaria. All rights reserved.
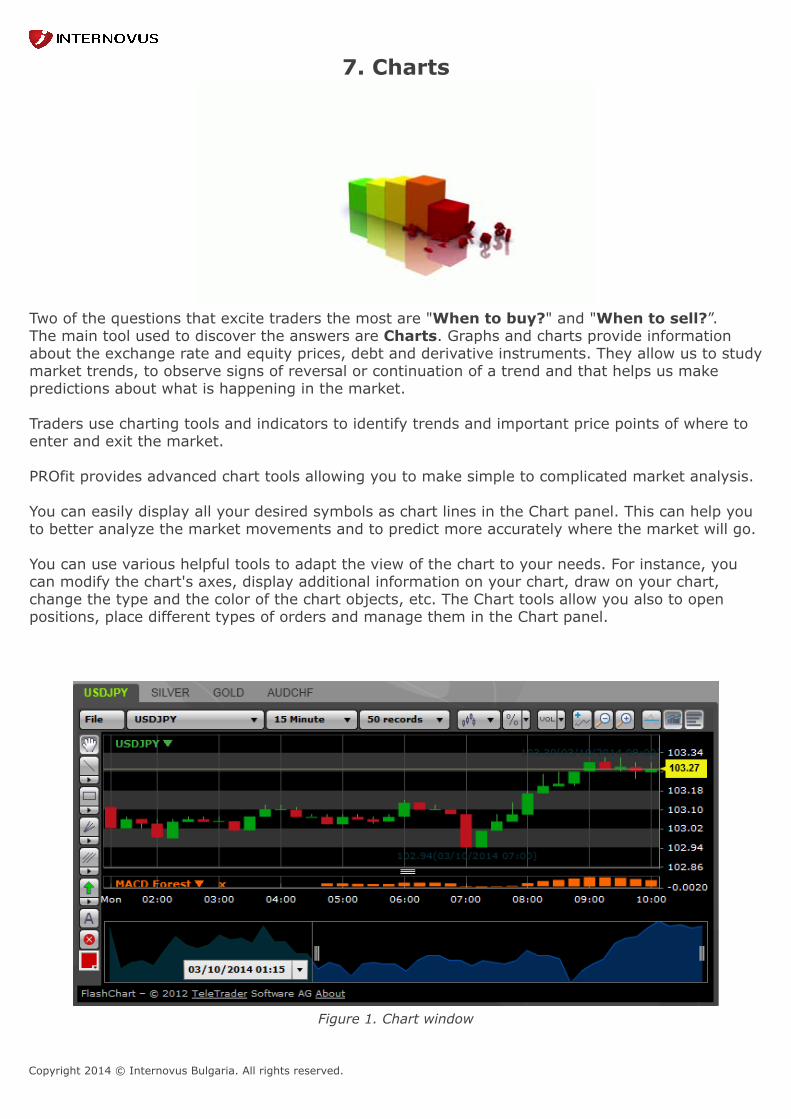
7. Charts
Two of the questions that excite traders the most are "When to buy?" and "When to sell?”.The main tool used to discover the answers are Charts. Graphs and charts provide informationabout the exchange rate and equity prices, debt and derivative instruments. They allow us to studymarket trends, to observe signs of reversal or continuation of a trend and that helps us makepredictions about what is happening in the market. Traders use charting tools and indicators to identify trends and important price points of where toenter and exit the market. PROfit provides advanced chart tools allowing you to make simple to complicated market analysis. You can easily display all your desired symbols as chart lines in the Chart panel. This can help youto better analyze the market movements and to predict more accurately where the market will go. You can use various helpful tools to adapt the view of the chart to your needs. For instance, youcan modify the chart's axes, display additional information on your chart, draw on your chart,change the type and the color of the chart objects, etc. The Chart tools allow you also to openpositions, place different types of orders and manage them in the Chart panel.
Figure 1. Chart window
Copyright 2014 © Internovus Bulgaria. All rights reserved.
7.1 Chart types The most used types of charts are “Candlestick chart”, "Line chart" and "Bar chart". They provideinformation about the prices of opening and closing trends, as well as the highest and lowest pricesfor the reference period.
The default chart type is the "Candlestick chart". This chart type is used frequently in the forexmarket.
You can change the view of your main symbol chart by choosing one of the following chart types:
• Line chart
• Candlestick chart
•OHLC Bar chart
•HLC Bar chart
• Mountains chart
•Histogram chart
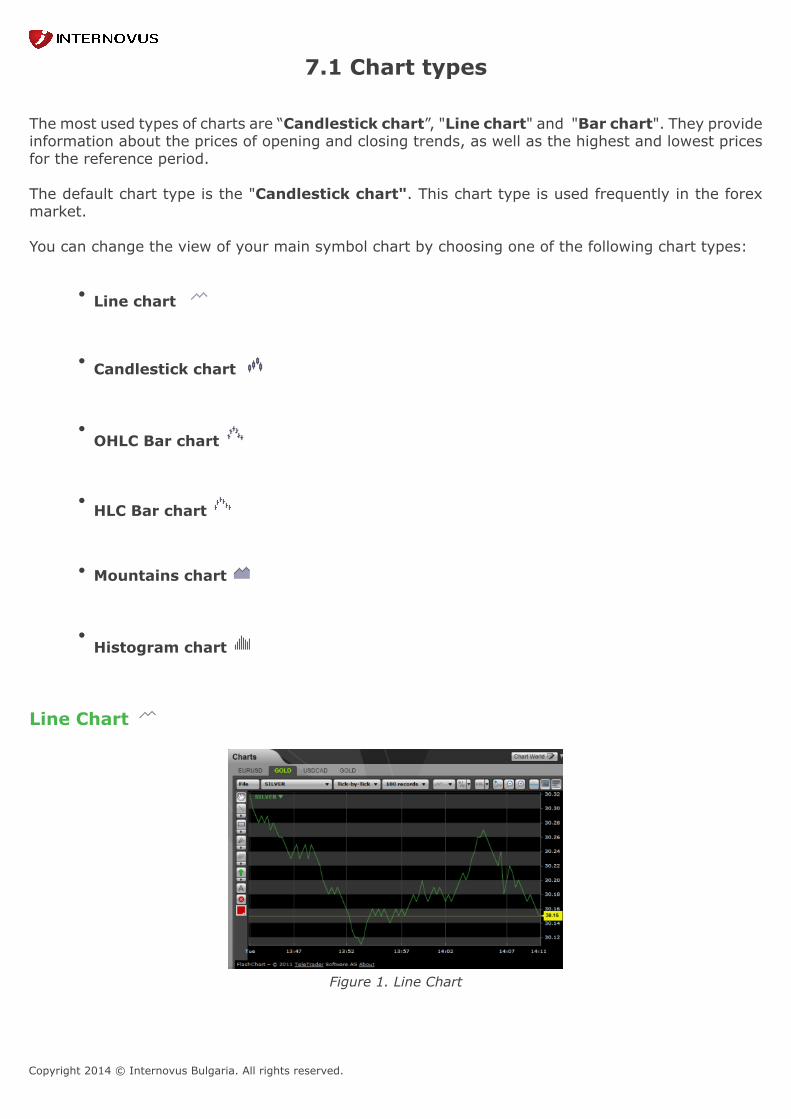
Line Chart
Figure 1. Line Chart

Copyright 2014 © Internovus Bulgaria. All rights reserved.
The Line Chart is the simplest form of charting and it depicts the changes in the price fixed at regularintervals. Values are placed in a coordinate system. It also displays the closing price for any giventime period. However, it does not tell you very much about the opening price or price fluctuationsduring that period.
The disadvantage of Line Charts is that they provide information averaged for the specified periodof time. Analysis of Forex trading requires data on the behavior of prices during the time period. Tothis end, much more useful are "bar charts", and "candlestick charts."
Candlestick chart
Figure 2. Candlestick Chart In this type of charts information is provided by figures that look like candles. Each candle is madeof a rectangular body (called jittai) and upper and lower wick. Upper wick is called the upper shadowand the bottom - lower shadow.
The wick depicts the extremes, that is, the highest and lowest prices during that period. The candlebody displays the opening and closing prices. Additionally, the color of the candle depicts whoultimately won. Green candles represent a higher close than open, while red candles represent adecline in the closing price from the open.
Example:
You can see that the most recent candle opened at 1.4830, then dropped aslow as 1.4820. It then went on to rise as high as 1.4860, and finally settled at the present closingprice of 1.4850. This is 20 pips above where it started its journey.
In this manner, each candlestick tells us a complete story of what happened in the power strugglebetween bulls and bears during that particular period of time. Also, candlestick charts give us cluesabout who is growing stronger and who is weakening.
Copyright 2014 © Internovus Bulgaria. All rights reserved.
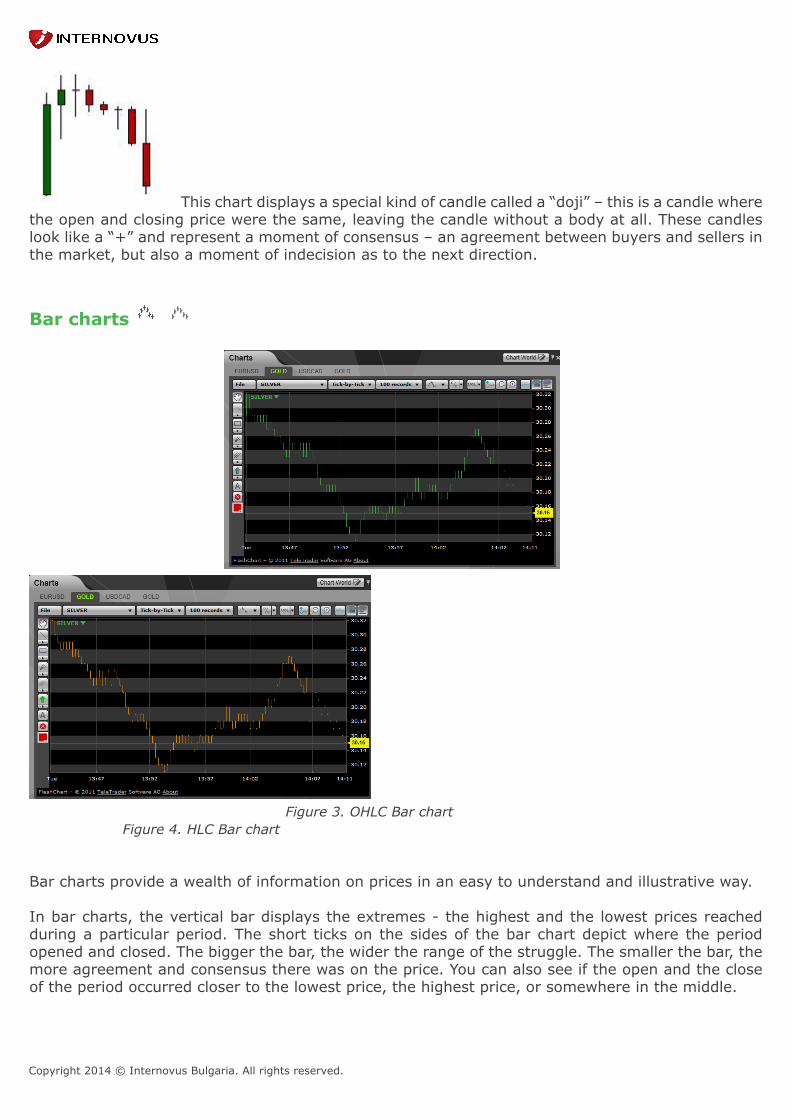
This chart displays a special kind of candle called a “doji” – this is a candle wherethe open and closing price were the same, leaving the candle without a body at all. These candleslook like a “+” and represent a moment of consensus – an agreement between buyers and sellers inthe market, but also a moment of indecision as to the next direction.
Bar charts
Figure 3. OHLC Bar chart Figure 4. HLC Bar chart Bar charts provide a wealth of information on prices in an easy to understand and illustrative way.
In bar charts, the vertical bar displays the extremes - the highest and the lowest prices reachedduring a particular period. The short ticks on the sides of the bar chart depict where the periodopened and closed. The bigger the bar, the wider the range of the struggle. The smaller the bar, themore agreement and consensus there was on the price. You can also see if the open and the closeof the period occurred closer to the lowest price, the highest price, or somewhere in the middle.

Copyright 2014 © Internovus Bulgaria. All rights reserved.
HLC bar chart type is almost identical to the OHLC bar chart, except that it doesn't show the openprices.
Mountains chart
Figure 5. Mountains chart
In this chart, the close prices of the symbol are plotted as a continuous line. The area between theprice line and the zero line of the chart is filled with a transparent color.
Histogram chart
Figure 6. Histogram chart
In this chart, the close prices of a symbol are plotted as vertical columns. This chart type offersthe same information as a line chart, in a different visualization. In addition, if the open and closeprices are equal, the body is coloured with blue. To change the chart type, navigate to the link below:Change the Chart type
Copyright 2014 © Internovus Bulgaria. All rights reserved.
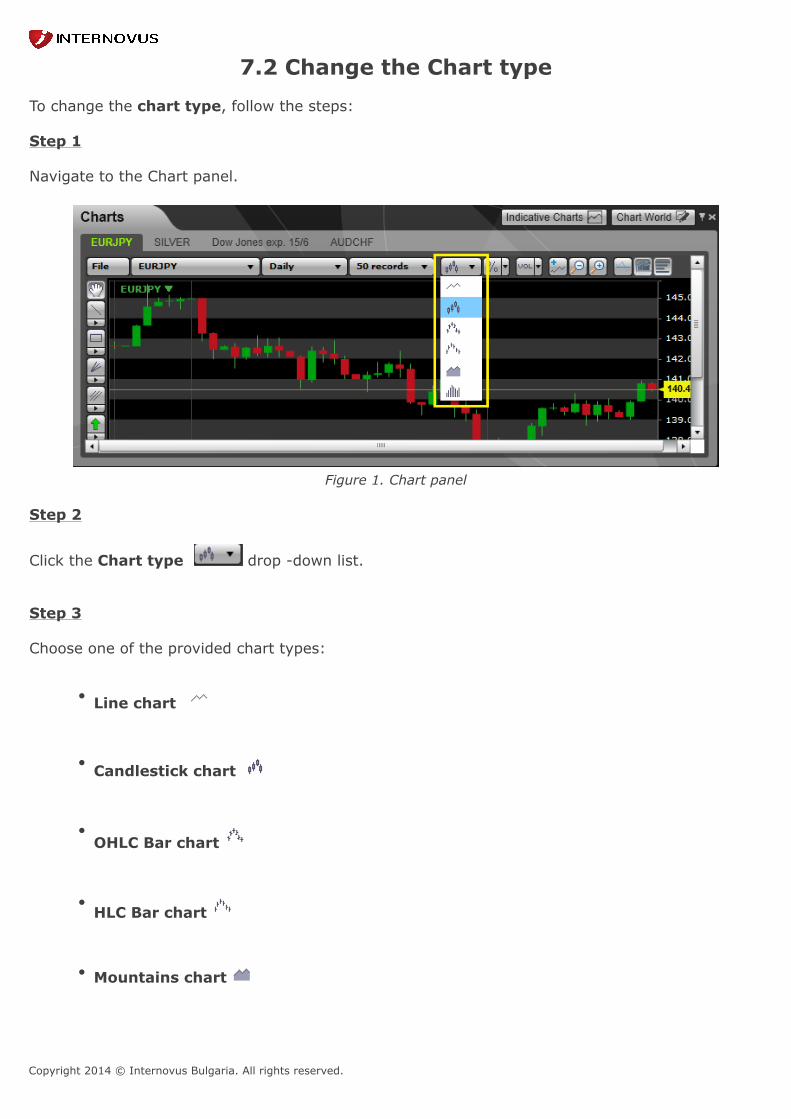
7.2 Change the Chart type To change the chart type, follow the steps: Step 1 Navigate to the Chart panel.
Figure 1. Chart panel
Step 2
Click the Chart type drop -down list.
Step 3
Choose one of the provided chart types:
• Line chart
• Candlestick chart
•OHLC Bar chart
•HLC Bar chart
• Mountains chart

Copyright 2014 © Internovus Bulgaria. All rights reserved.
•Histogram chart
Copyright 2014 © Internovus Bulgaria. All rights reserved.
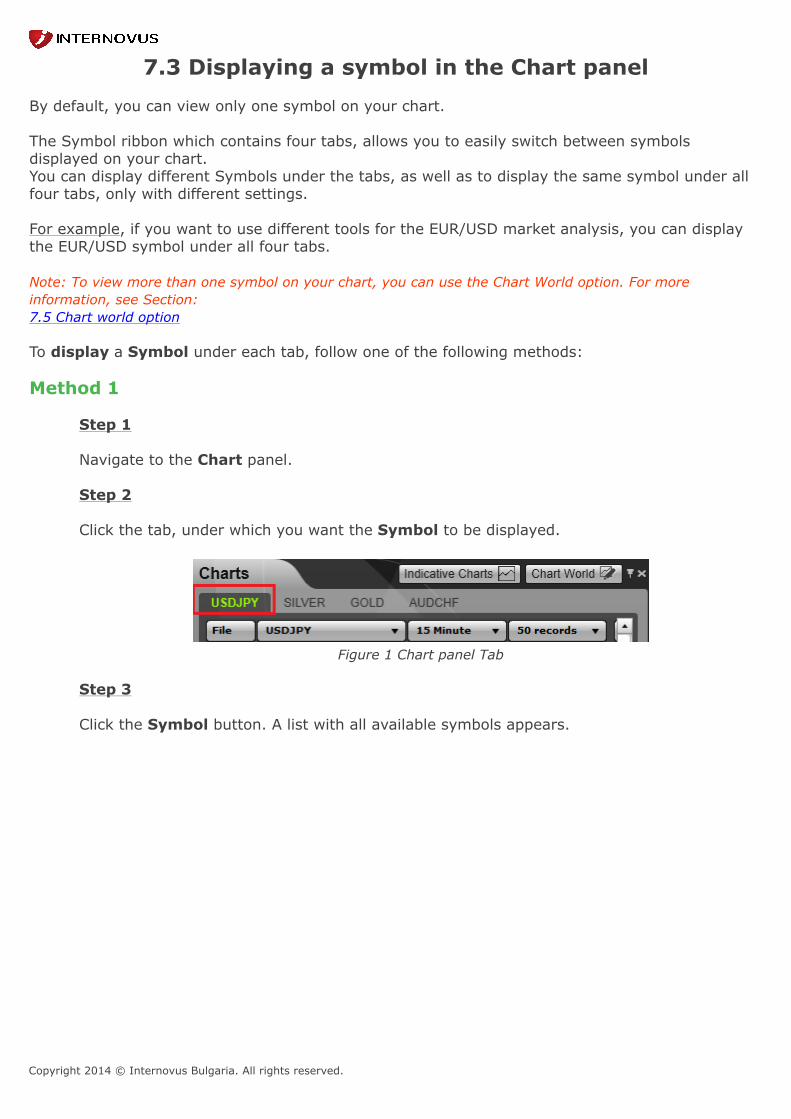
7.3 Displaying a symbol in the Chart panel By default, you can view only one symbol on your chart. The Symbol ribbon which contains four tabs, allows you to easily switch between symbolsdisplayed on your chart.You can display different Symbols under the tabs, as well as to display the same symbol under allfour tabs, only with different settings. For example, if you want to use different tools for the EUR/USD market analysis, you can displaythe EUR/USD symbol under all four tabs. Note: To view more than one symbol on your chart, you can use the Chart World option. For moreinformation, see Section:7.5 Chart world option To display a Symbol under each tab, follow one of the following methods: Method 1
Step 1 Navigate to the Chart panel. Step 2 Click the tab, under which you want the Symbol to be displayed.
Figure 1 Chart panel Tab
Step 3 Click the Symbol button. A list with all available symbols appears.
Copyright 2014 © Internovus Bulgaria. All rights reserved.
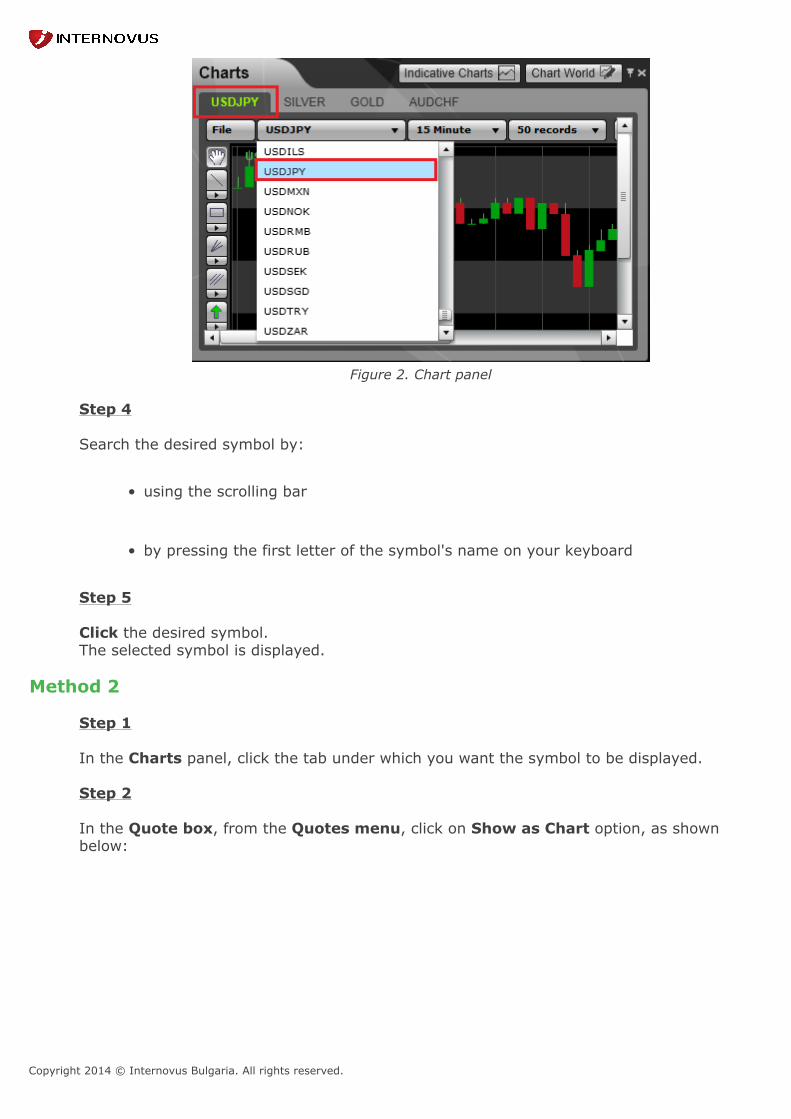
Figure 2. Chart panel
Step 4
Search the desired symbol by:
• using the scrolling bar
• by pressing the first letter of the symbol's name on your keyboard
Step 5
Click the desired symbol.The selected symbol is displayed.
Method 2 Step 1 In the Charts panel, click the tab under which you want the symbol to be displayed.
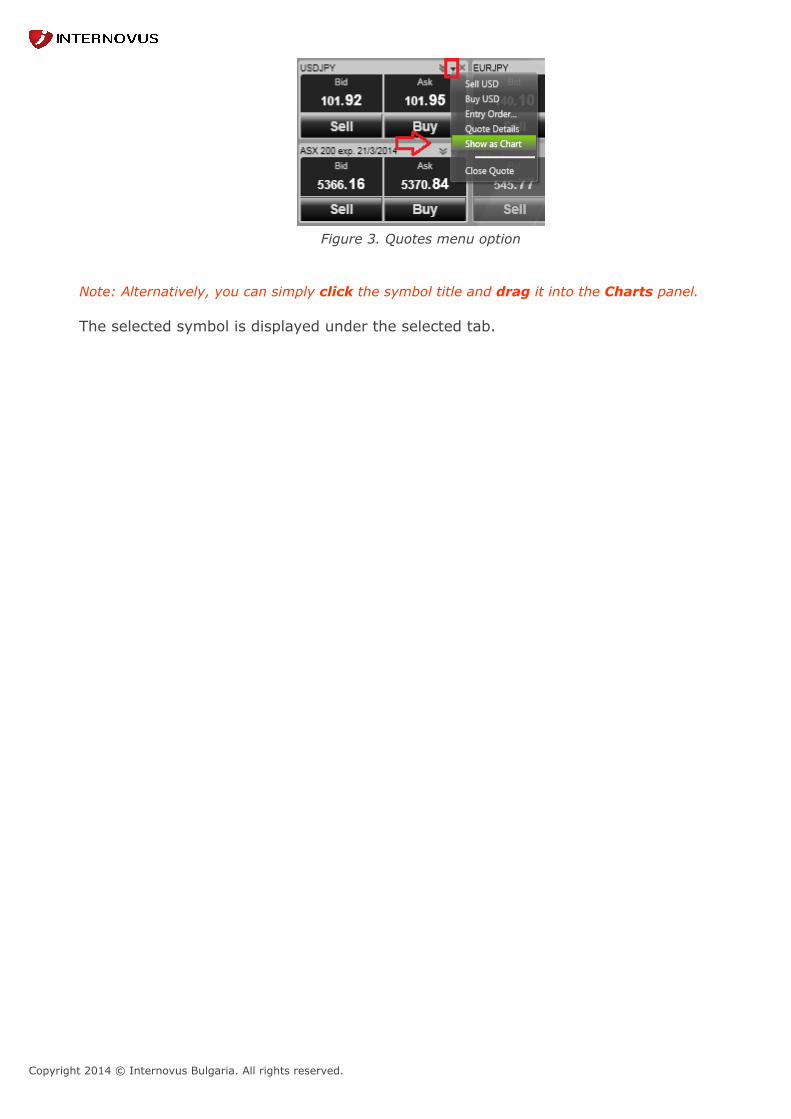
Step 2 In the Quote box, from the Quotes menu, click on Show as Chart option, as shownbelow:
Copyright 2014 © Internovus Bulgaria. All rights reserved.
Figure 3. Quotes menu option Note: Alternatively, you can simply click the symbol title and drag it into the Charts panel.
The selected symbol is displayed under the selected tab.
Copyright 2014 © Internovus Bulgaria. All rights reserved.
7.4 Time frames Each candle or bar on a chart represents a specific time period - 1 minute, 5 minutes, 15 minutes,30 minutes, an hour, 4 hours, a day, week, or an entire month. The time frame refers to the amountof time it takes to print one candlestick on your chart.
• 1-, 5-, 10-, 15-, 30- minutes charts
Displays the selected trading period. As example: a 15 minute chart will generate data fromthe ticks (trades) done within the given 15 minute period. An OHLC chart will therefore displaythe Open (first) trade within the 15 minute period. The Bar will display the range within whichthe prices moved in the 15 minute period, and the Close price will represent the last tradein the 15 minute period.
Note: The given Minute -periods sum up to one hour. It is therefore not possible to see a 13 minuteperiod, or to ex. see the 15 minute period between the time 14.49 and 15.04 on a given day.
• 1-, 2-, 4-, 8- hours charts
Works from the same principles as the Minute charts. Again: the hours will sum up to a 24hour period. It will therefore not be possible to see ex. the 8-our period from the hour 22.00one day to the hour 06.00 on the next day.
• Daily, Weekly, Monthly Charts
Same principles as for Minutes and Hours. Daily charts represent 24 hour trading from 00.00to 23.59.
Note: Please note that “Daily” charts will not include non -trading days (like Weekends, bank holidays),The “Weekly” data will display data the data for the entire week, displayed with 7 day intervals, so thedata -stamp will be a “Monday”.
The time frame you choose to use depends on the type of trade you want to execute. A long -termtrend follower is likely to use a longer time frame, a swing trader something in the middle, and a daytrader or scalper more likely to choose one of the shorter time frames. For example, the following graphs provide a snapshot of symbol movements over different periodsof time. The number of records remains unchanged (50 records).

Copyright 2014 © Internovus Bulgaria. All rights reserved.
Figure 1. Time frame (4h) Figure 2. Time frame (15min)
Note: Periods are displaying the number of data points used in the selected chart.
To change the time frame:
Step 1
Navigate to the Chart panel.
Step 2
Click on the Period type menu.
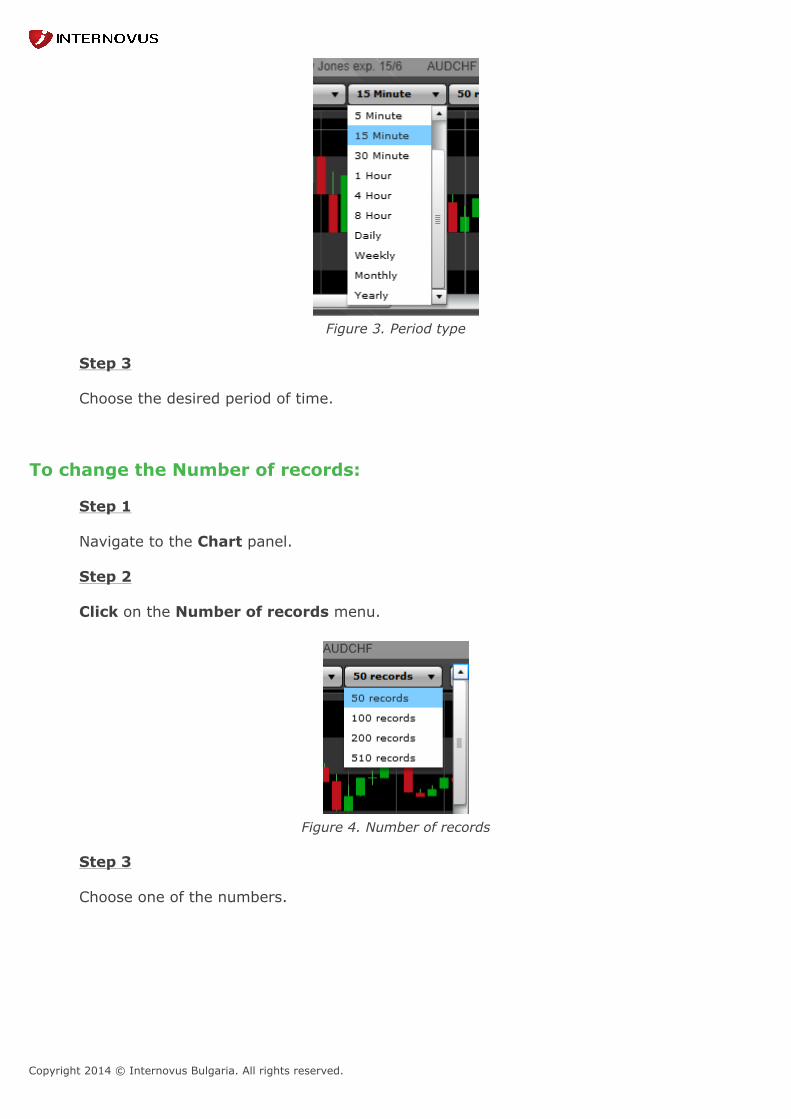
Copyright 2014 © Internovus Bulgaria. All rights reserved.
Figure 3. Period type
Step 3
Choose the desired period of time.
To change the Number of records:
Step 1
Navigate to the Chart panel.
Step 2
Click on the Number of records menu.
Figure 4. Number of records
Step 3
Choose one of the numbers.

Copyright 2014 © Internovus Bulgaria. All rights reserved.
7.5 Chart world option
The Chart World button is at the top right side of the Chart panel. You can use this option to viewall of your charts in four separate windows.
Figure 1. Chart world button
To display all four charts in new windows, click the Chart World button in the Charts panel.
The following screen will appear:
Figure 2. Chart world option
Note: Generally, you can use the Chart World option to display unlimited amount of symbols as charts inseparate windows at the same time. To switch between them, simply click the desired symbol chart tab atthe taskbar.

Copyright 2014 © Internovus Bulgaria. All rights reserved.
7.6 Indicative Charts FinanceChart 3.1.9 contains live forex charts with more than 2100 currency pairs, as well asthousands of stocks, indices and commodities. The Indicative Charts button is at the top right side of the Chart panel.
Figure 1. Indicative Charts Button
To view the Indicative Charts, click on the button.
The following window will be displayed:
Figure 2. FinanceChart 3.1.9

Copyright 2014 © Internovus Bulgaria. All rights reserved.
To see a detailed information, how to use the Indicative Charts, navigate to the link:Indicative Charts User's manual
Or Click button. From the following drop -down menu , navigate to User'sGuide.

Copyright 2014 © Internovus Bulgaria. All rights reserved.
8. Additional Chart Options Profit allows you to display additional information regarding the symbol which is displayed onyour chart. This can help you to better understand the symbol movements as well as to comparebetween different symbols. List with additional Chart options:
• Displaying the Percentage Price Scale
• Displaying the Trading Volume
• Displaying the Maximum and the Minimum Values
• Displaying the Grid Lines
• Displaying the Data Information Box
• Displaying the Crosshair Tool
• Displaying the Chart History
• Zoom
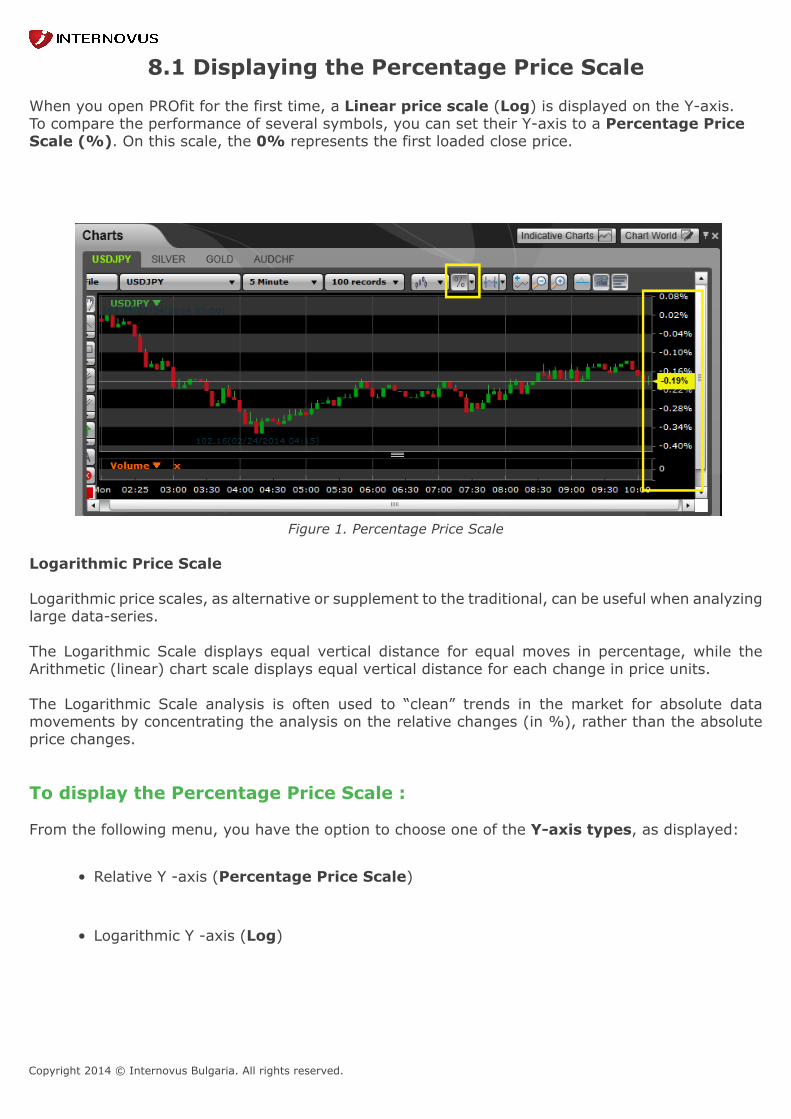
Copyright 2014 © Internovus Bulgaria. All rights reserved.
8.1 Displaying the Percentage Price Scale When you open PROfit for the first time, a Linear price scale (Log) is displayed on the Y-axis.To compare the performance of several symbols, you can set their Y-axis to a Percentage PriceScale (%). On this scale, the 0% represents the first loaded close price.
Figure 1. Percentage Price Scale
Logarithmic Price Scale
Logarithmic price scales, as alternative or supplement to the traditional, can be useful when analyzinglarge data-series.
The Logarithmic Scale displays equal vertical distance for equal moves in percentage, while theArithmetic (linear) chart scale displays equal vertical distance for each change in price units.
The Logarithmic Scale analysis is often used to “clean” trends in the market for absolute datamovements by concentrating the analysis on the relative changes (in %), rather than the absoluteprice changes.
To display the Percentage Price Scale :
From the following menu, you have the option to choose one of the Y-axis types, as displayed:
• Relative Y -axis (Percentage Price Scale)
• Logarithmic Y -axis (Log)
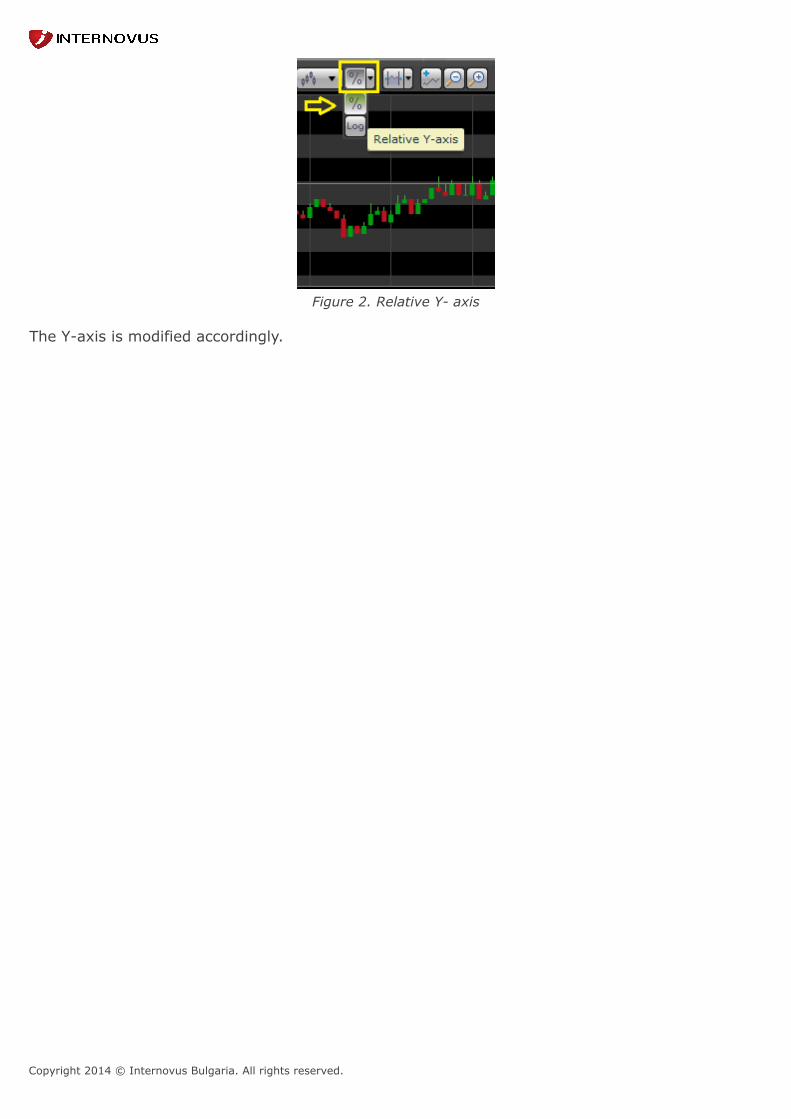
Copyright 2014 © Internovus Bulgaria. All rights reserved.
Figure 2. Relative Y- axis
The Y-axis is modified accordingly.
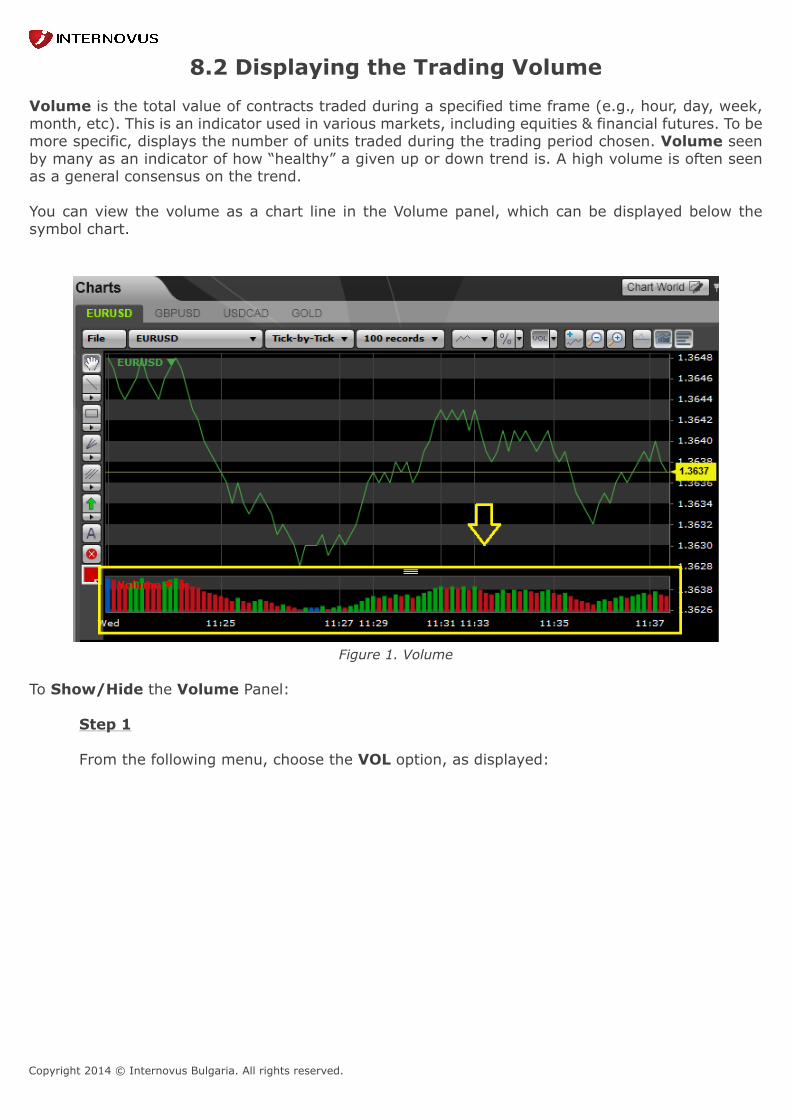
Copyright 2014 © Internovus Bulgaria. All rights reserved.
8.2 Displaying the Trading Volume Volume is the total value of contracts traded during a specified time frame (e.g., hour, day, week,month, etc). This is an indicator used in various markets, including equities & financial futures. To bemore specific, displays the number of units traded during the trading period chosen. Volume seenby many as an indicator of how “healthy” a given up or down trend is. A high volume is often seenas a general consensus on the trend.
You can view the volume as a chart line in the Volume panel, which can be displayed below thesymbol chart.
Figure 1. Volume
To Show/Hide the Volume Panel:
Step 1
From the following menu, choose the VOL option, as displayed:

Copyright 2014 © Internovus Bulgaria. All rights reserved.
Figure 2. Show/Hide Volume
Step 2
Click Show Volume button.
The Volume panel is shown/hidden from the chart.
You can use the Volume box to indicate in which panel the Volume will be inserted. The Volume canbe shown in the main panel together with the main symbol, or in a new panel below the mainsymbol panel. In addition, the Volume box allows you to modify the view of your volume line in thepanel by adjusting its colour and type. You can also define the volume's parameter within this box.
Note: To remove the Volume panel from the chart, simply click the X button, next to the Volume
arrow, as displayed:
To modify the volume line, follow the steps:
Step 1
On the Charts panel, click the Volume arrow, as displayed:
Figure 3. Modify the volume line
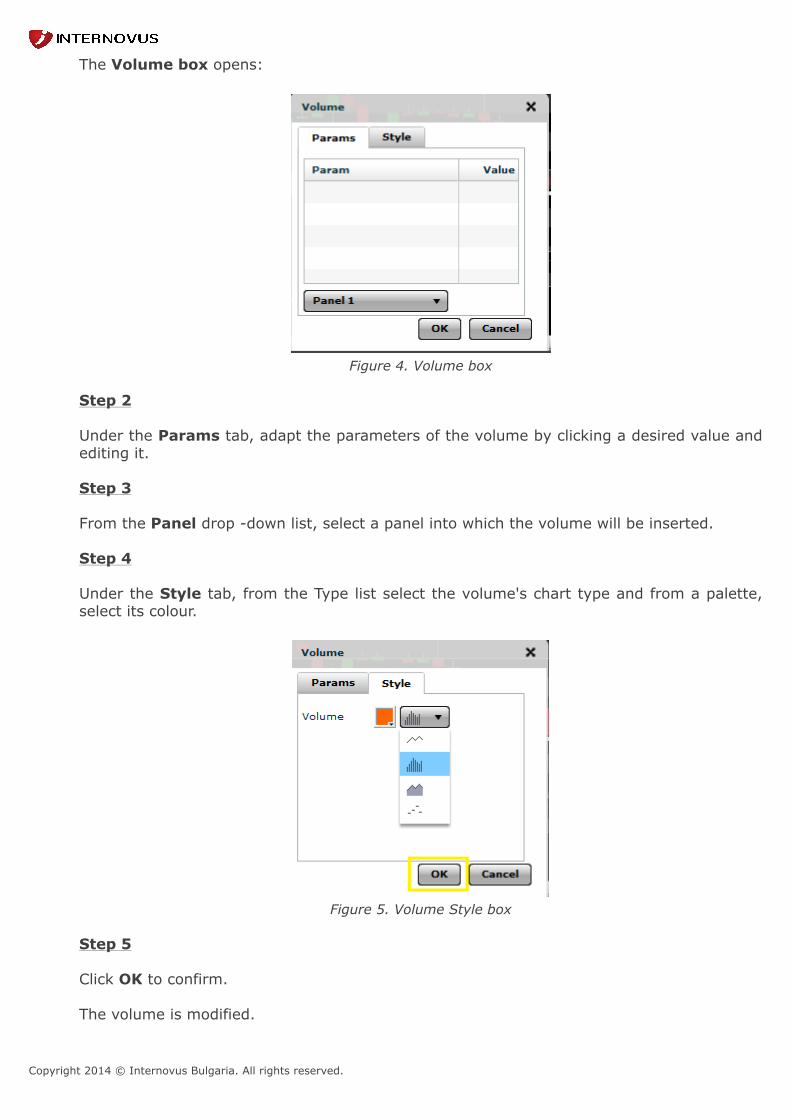
Copyright 2014 © Internovus Bulgaria. All rights reserved.
The Volume box opens:
Figure 4. Volume box
Step 2
Under the Params tab, adapt the parameters of the volume by clicking a desired value andediting it.
Step 3
From the Panel drop -down list, select a panel into which the volume will be inserted.
Step 4
Under the Style tab, from the Type list select the volume's chart type and from a palette,select its colour.
Figure 5. Volume Style box
Step 5
Click OK to confirm.
The volume is modified.

Copyright 2014 © Internovus Bulgaria. All rights reserved.
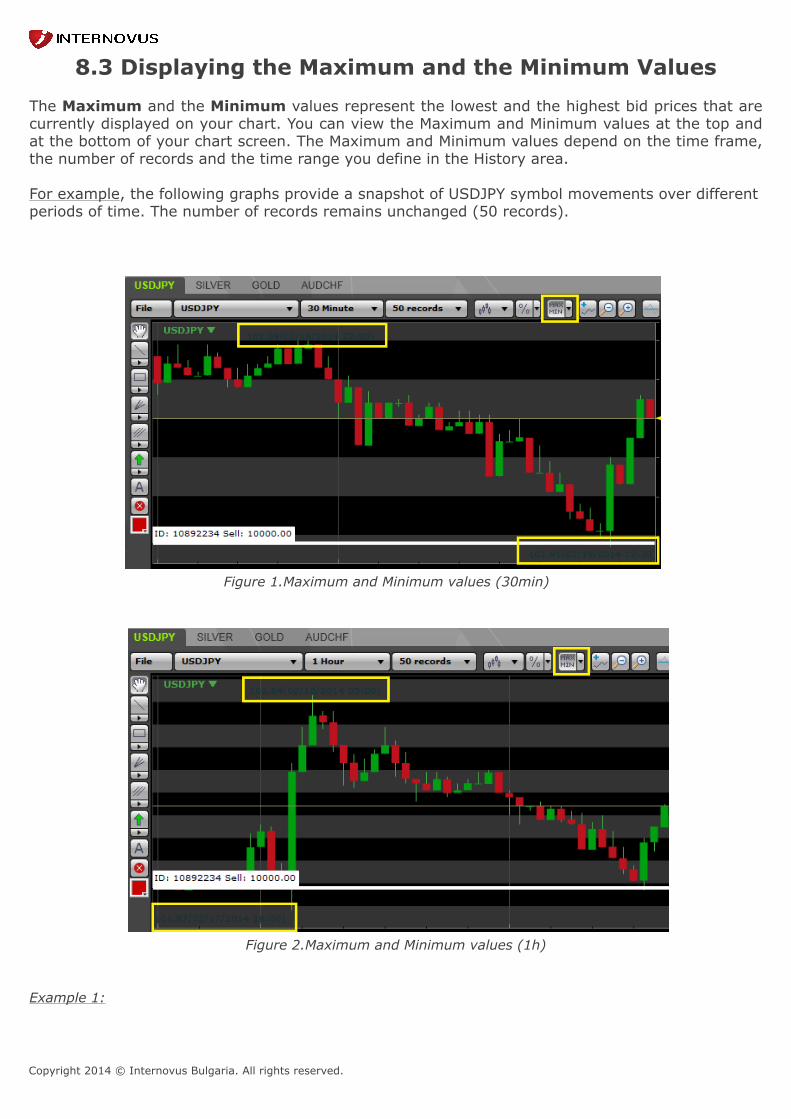
Copyright 2014 © Internovus Bulgaria. All rights reserved.
8.3 Displaying the Maximum and the Minimum Values The Maximum and the Minimum values represent the lowest and the highest bid prices that arecurrently displayed on your chart. You can view the Maximum and Minimum values at the top andat the bottom of your chart screen. The Maximum and Minimum values depend on the time frame,the number of records and the time range you define in the History area. For example, the following graphs provide a snapshot of USDJPY symbol movements over differentperiods of time. The number of records remains unchanged (50 records).
Figure 1.Maximum and Minimum values (30min)
Figure 2.Maximum and Minimum values (1h)
Example 1:
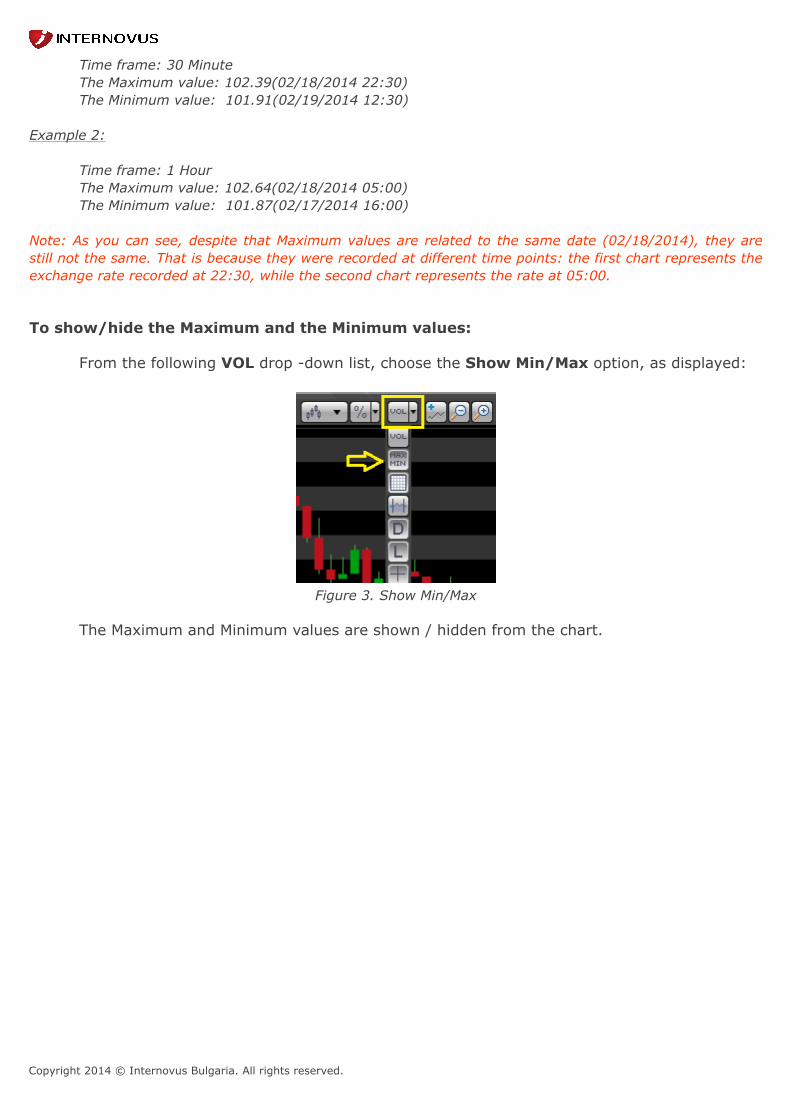
Copyright 2014 © Internovus Bulgaria. All rights reserved.
Time frame: 30 Minute The Maximum value: 102.39(02/18/2014 22:30)The Minimum value: 101.91(02/19/2014 12:30)
Example 2:
Time frame: 1 Hour The Maximum value: 102.64(02/18/2014 05:00)The Minimum value: 101.87(02/17/2014 16:00)
Note: As you can see, despite that Maximum values are related to the same date (02/18/2014), they arestill not the same. That is because they were recorded at different time points: the first chart represents theexchange rate recorded at 22:30, while the second chart represents the rate at 05:00.
To show/hide the Maximum and the Minimum values:
From the following VOL drop -down list, choose the Show Min/Max option, as displayed:
Figure 3. Show Min/Max
The Maximum and Minimum values are shown / hidden from the chart.
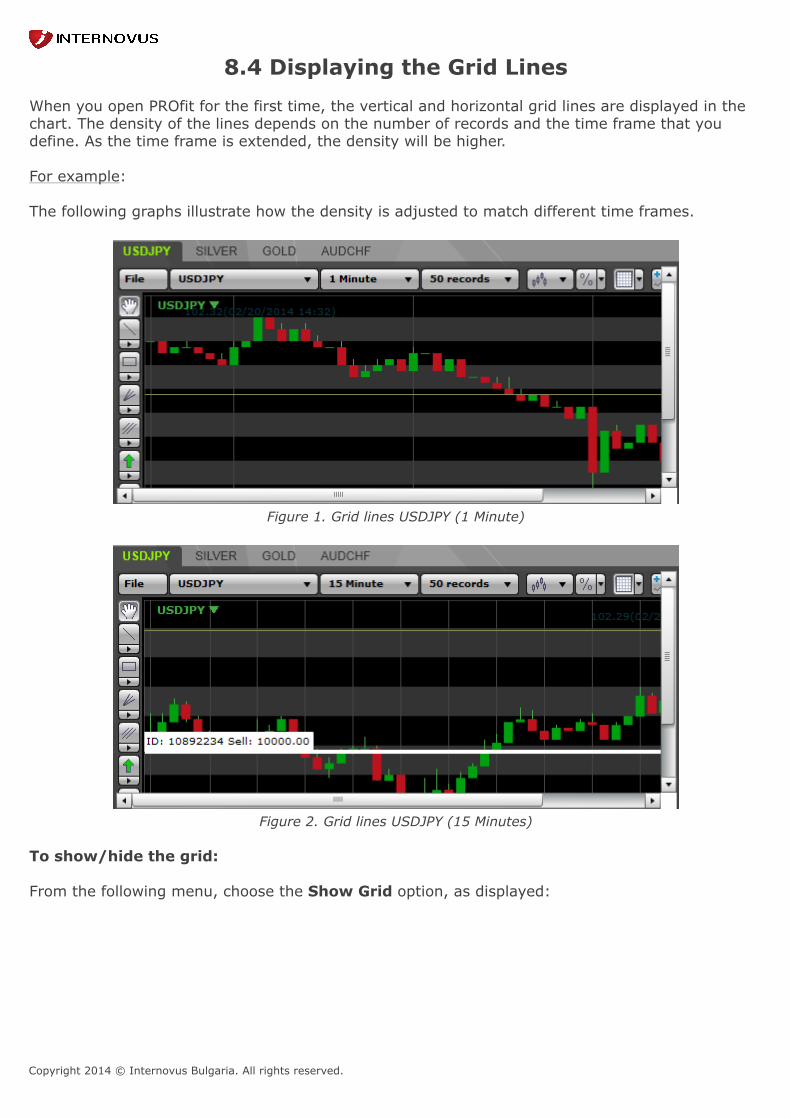
Copyright 2014 © Internovus Bulgaria. All rights reserved.
8.4 Displaying the Grid Lines When you open PROfit for the first time, the vertical and horizontal grid lines are displayed in thechart. The density of the lines depends on the number of records and the time frame that youdefine. As the time frame is extended, the density will be higher. For example: The following graphs illustrate how the density is adjusted to match different time frames.
Figure 1. Grid lines USDJPY (1 Minute)
Figure 2. Grid lines USDJPY (15 Minutes)
To show/hide the grid:
From the following menu, choose the Show Grid option, as displayed:

Copyright 2014 © Internovus Bulgaria. All rights reserved.
Figure 3. Show Grid
The Grid is shown/hidden from the chart.

Copyright 2014 © Internovus Bulgaria. All rights reserved.
8.5 Displaying the Data Information Box A Data Information box is a flowing box, which contains additional details regarding symbolsand indicators that appear in the chart. When hovering the mouse over a data point on a chart, therelevant information will be displayed in the Data Information box.
Figure 1. Data Information box
To show/hide a Data Information box:
From the following menu, choose the Show Data Info option, as displayed:
Figure 2. Show Data Info
The data info box is shown/hidden from the chart.
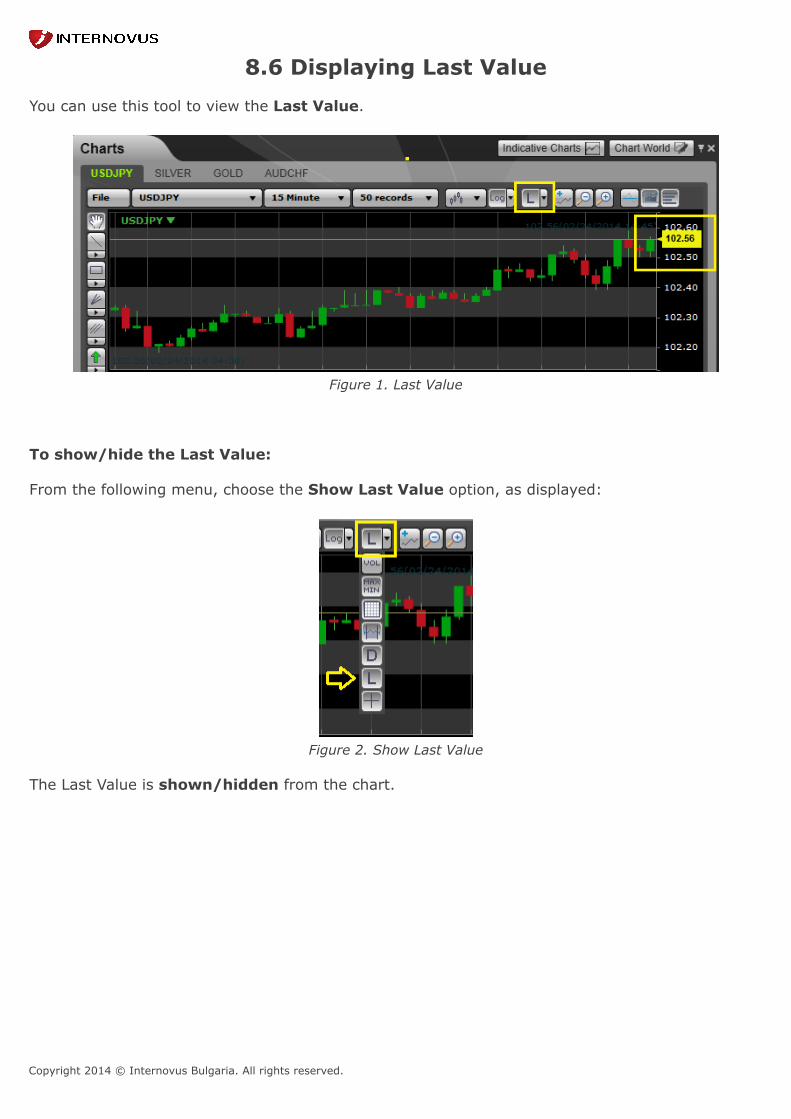
Copyright 2014 © Internovus Bulgaria. All rights reserved.
8.6 Displaying Last Value You can use this tool to view the Last Value.
Figure 1. Last Value
To show/hide the Last Value:
From the following menu, choose the Show Last Value option, as displayed:
Figure 2. Show Last Value
The Last Value is shown/hidden from the chart.
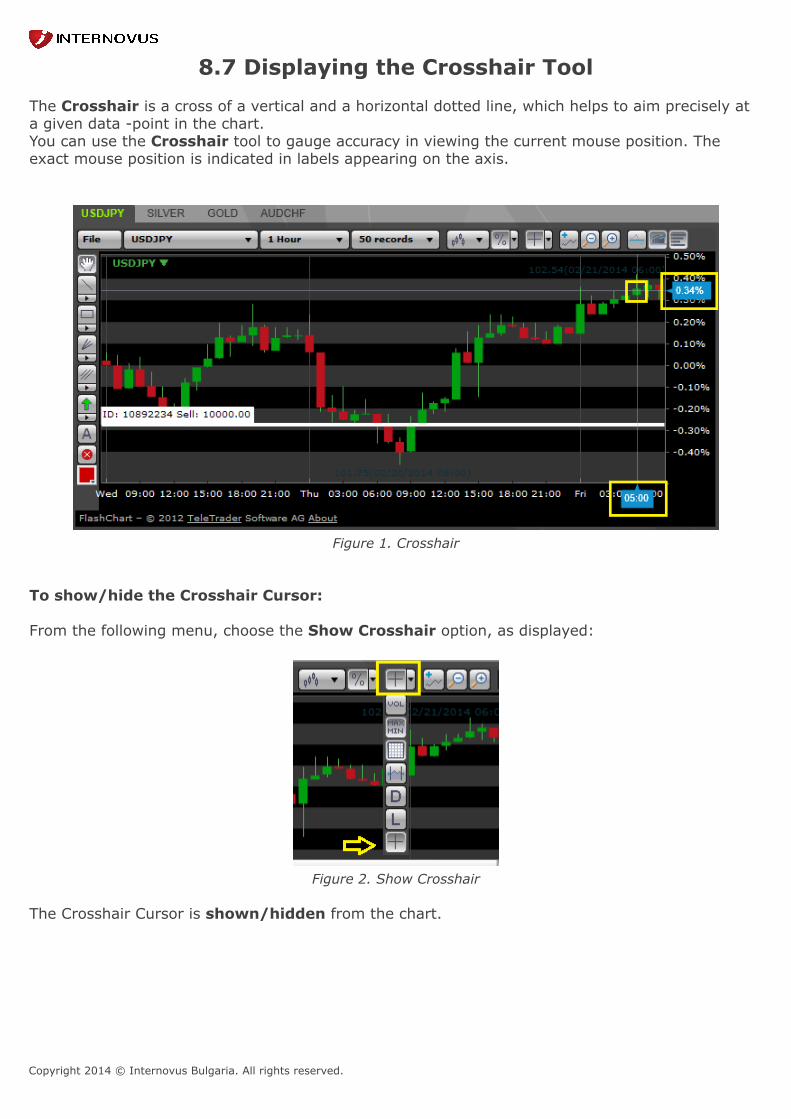
Copyright 2014 © Internovus Bulgaria. All rights reserved.
8.7 Displaying the Crosshair Tool The Crosshair is a cross of a vertical and a horizontal dotted line, which helps to aim precisely ata given data -point in the chart.You can use the Crosshair tool to gauge accuracy in viewing the current mouse position. Theexact mouse position is indicated in labels appearing on the axis.
Figure 1. Crosshair
To show/hide the Crosshair Cursor:
From the following menu, choose the Show Crosshair option, as displayed:
Figure 2. Show Crosshair
The Crosshair Cursor is shown/hidden from the chart.

Copyright 2014 © Internovus Bulgaria. All rights reserved.
8.8 Displaying the Chart History
Technical analysis used in order to forecast future price movements. The market is often analyzedusing charts. Historical data is needed to carry out technical analysis.Using the History Panel, you can view a symbol's movement by defining a period of time withinthe panel.
Figure 1. History Panel
To open the History panel and view your chart history:
Step 1
From the following menu choose the Show History option, as displayed:
Figure 2 . Show History
The History panel appears along the bottom of the chart screen, displaying the section that is currentlyvisible in the main symbol chart.The range, which is about to be displayed on the chart, is coloured in blue, while the rest of therange, is coloured in steel blue.
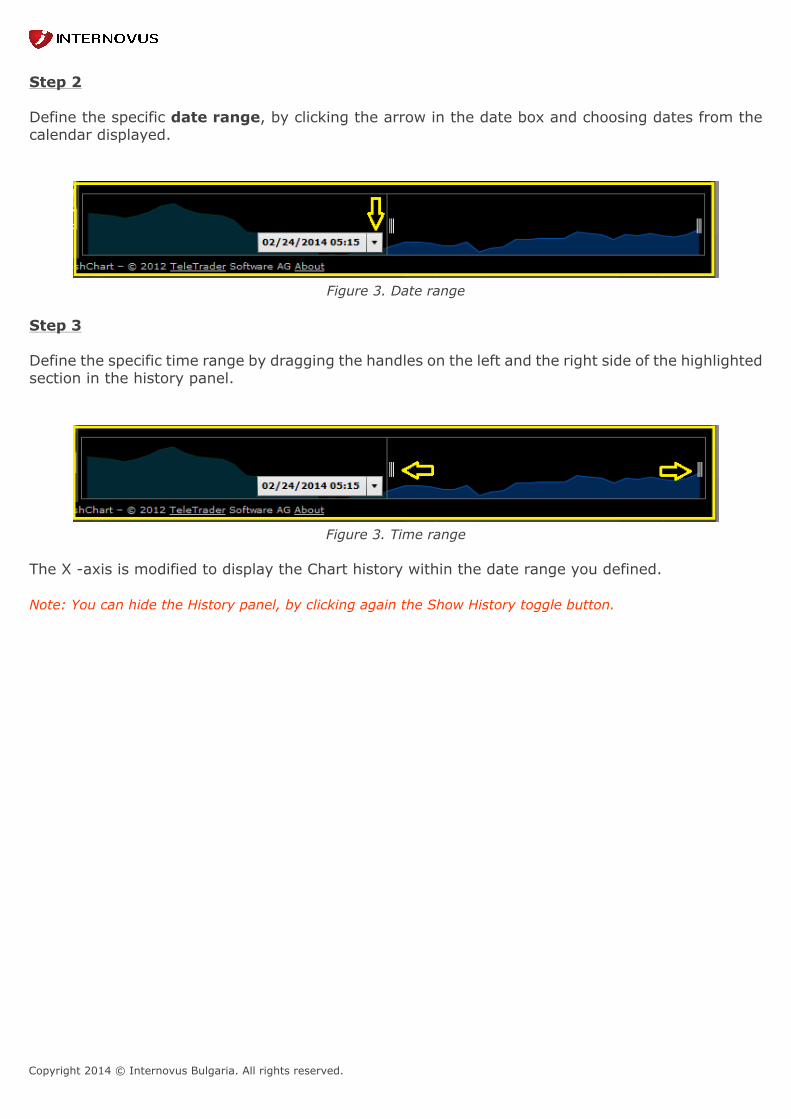
Copyright 2014 © Internovus Bulgaria. All rights reserved.
Step 2
Define the specific date range, by clicking the arrow in the date box and choosing dates from thecalendar displayed.
Figure 3. Date range
Step 3
Define the specific time range by dragging the handles on the left and the right side of the highlightedsection in the history panel.
Figure 3. Time range
The X -axis is modified to display the Chart history within the date range you defined.
Note: You can hide the History panel, by clicking again the Show History toggle button.
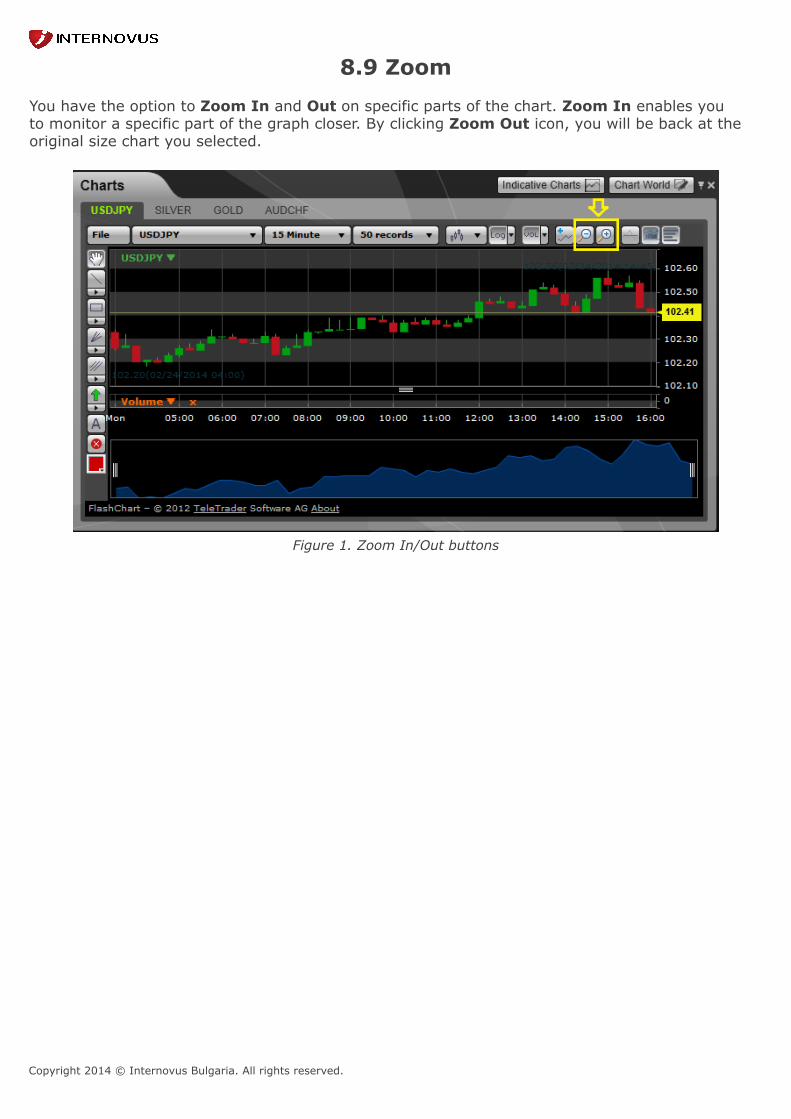
Copyright 2014 © Internovus Bulgaria. All rights reserved.
8.9 Zoom You have the option to Zoom In and Out on specific parts of the chart. Zoom In enables youto monitor a specific part of the graph closer. By clicking Zoom Out icon, you will be back at theoriginal size chart you selected.
Figure 1. Zoom In/Out buttons

Copyright 2014 © Internovus Bulgaria. All rights reserved.
9. Drawing on the Chart As you trade, you will want to examine the chart, looking for possible patterns and trends inthe price movements. You can use the Drawing tools in the chart window to plot support andresistance levels, identify simple and complex patterns and create other notations on the chart. PROfit provides you with various drawing tools which help you analyze symbol movement. Youcan draw on your chart using different types of lines, geometric shapes and other effective tools.You can also add notes to your chart in order to indicate important turning points in marketmovement. All drawing tools can be easily accessed via the chart’s Sidebar. The menus in thissidebar contain simple to advanced options allowing matching the chart to your personal needs.You can use these options to modify the view of your drawing by changing their colour and width,as well as location and size.
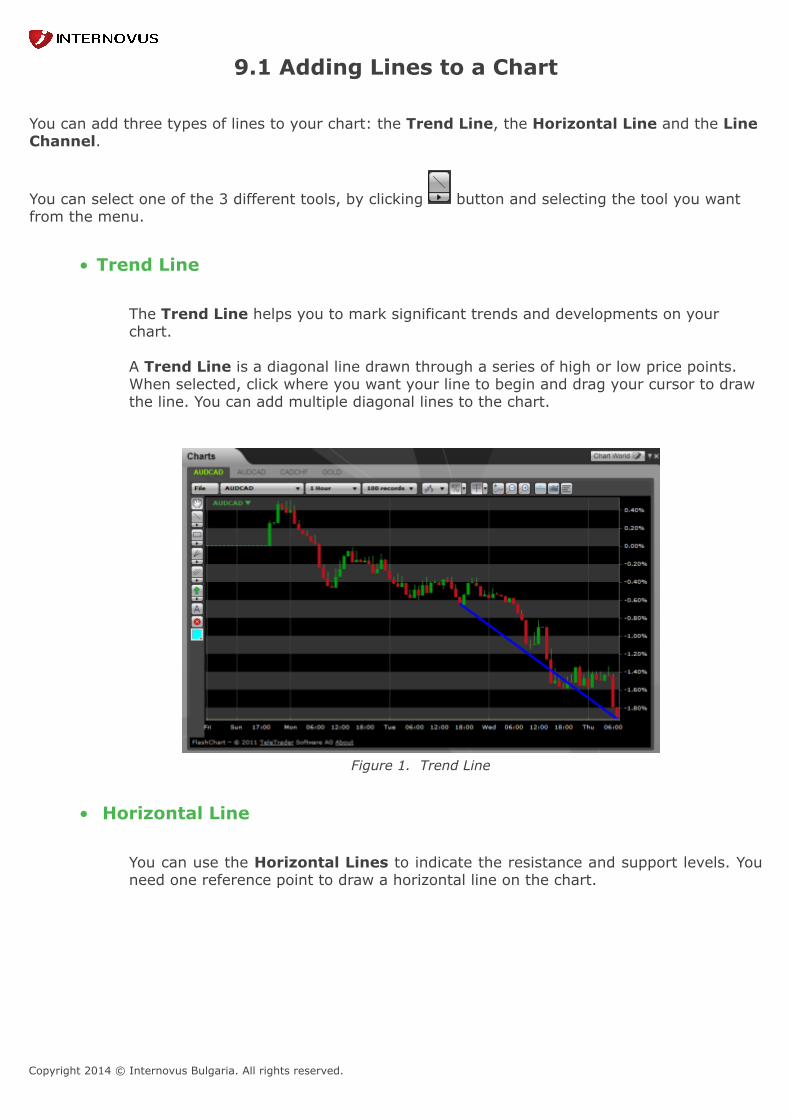
Copyright 2014 © Internovus Bulgaria. All rights reserved.
9.1 Adding Lines to a Chart You can add three types of lines to your chart: the Trend Line, the Horizontal Line and the LineChannel.
You can select one of the 3 different tools, by clicking button and selecting the tool you wantfrom the menu.
• Trend Line
The Trend Line helps you to mark significant trends and developments on yourchart.
A Trend Line is a diagonal line drawn through a series of high or low price points.When selected, click where you want your line to begin and drag your cursor to drawthe line. You can add multiple diagonal lines to the chart.
Figure 1. Trend Line
• Horizontal Line
You can use the Horizontal Lines to indicate the resistance and support levels. Youneed one reference point to draw a horizontal line on the chart.
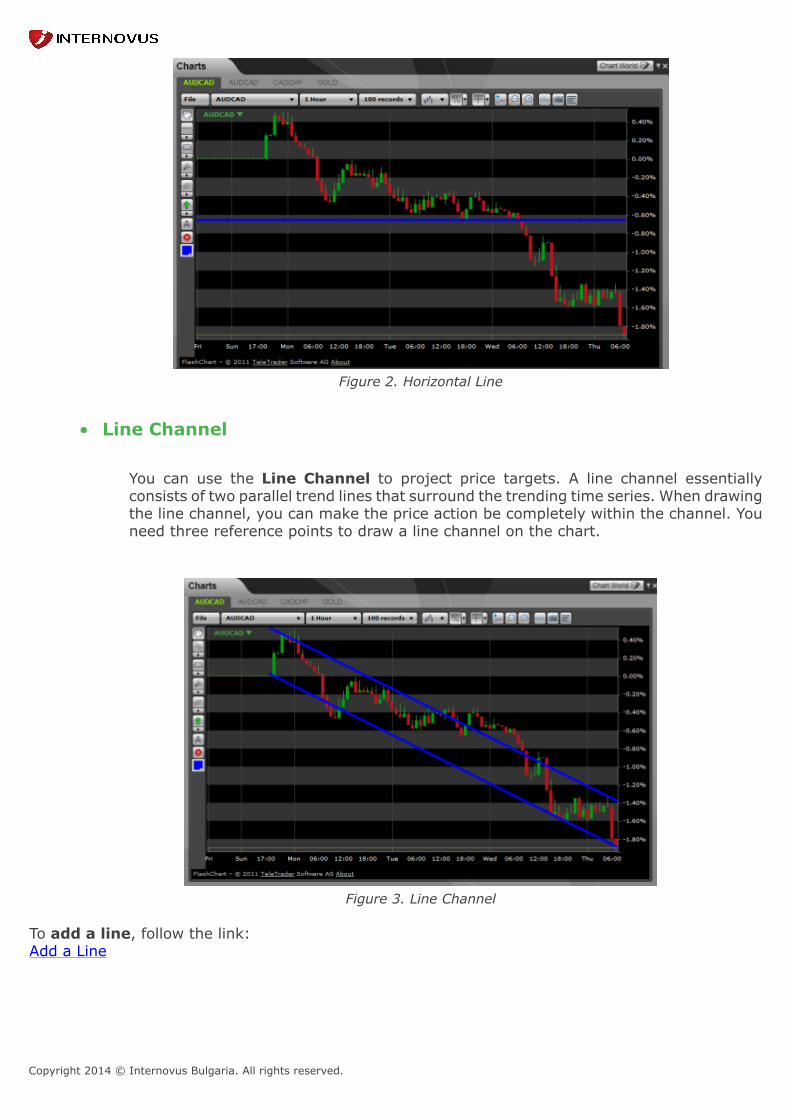
Copyright 2014 © Internovus Bulgaria. All rights reserved.
Figure 2. Horizontal Line
• Line Channel
You can use the Line Channel to project price targets. A line channel essentiallyconsists of two parallel trend lines that surround the trending time series. When drawingthe line channel, you can make the price action be completely within the channel. Youneed three reference points to draw a line channel on the chart.
Figure 3. Line Channel
To add a line, follow the link:Add a Line
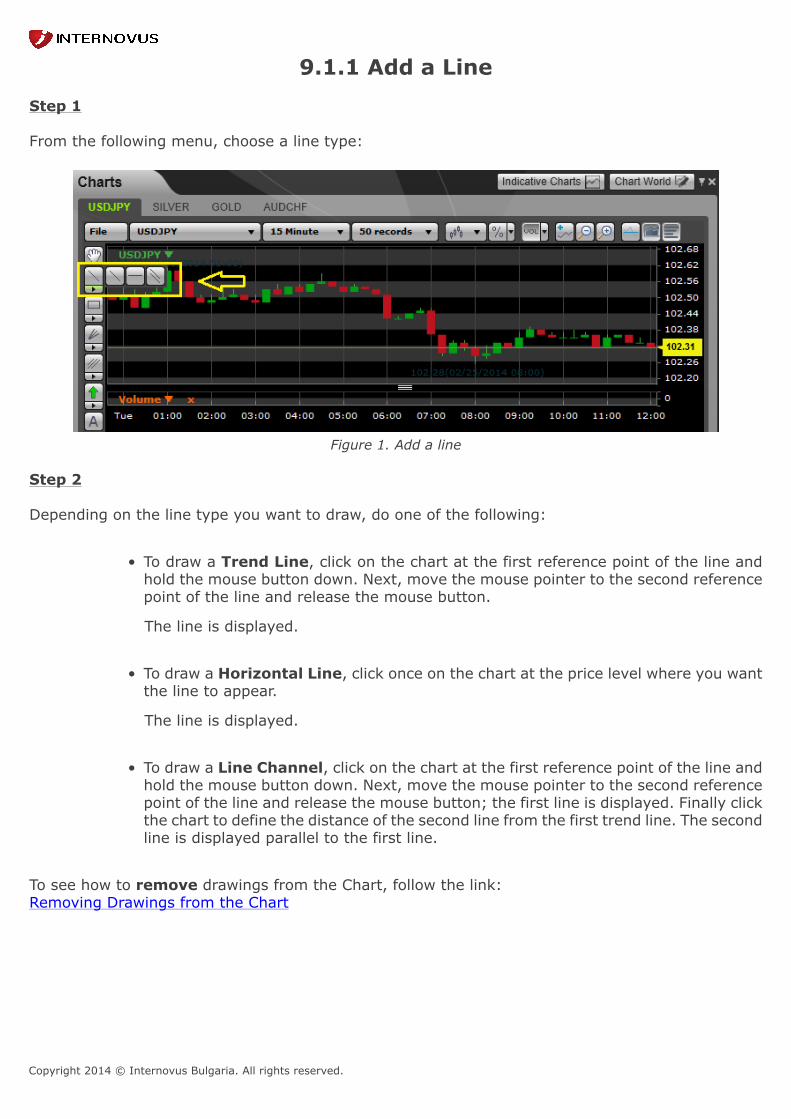
Copyright 2014 © Internovus Bulgaria. All rights reserved.
9.1.1 Add a Line Step 1 From the following menu, choose a line type:
Figure 1. Add a line
Step 2
Depending on the line type you want to draw, do one of the following:
• To draw a Trend Line, click on the chart at the first reference point of the line andhold the mouse button down. Next, move the mouse pointer to the second referencepoint of the line and release the mouse button.
The line is displayed.
• To draw a Horizontal Line, click once on the chart at the price level where you wantthe line to appear.
The line is displayed.
• To draw a Line Channel, click on the chart at the first reference point of the line andhold the mouse button down. Next, move the mouse pointer to the second referencepoint of the line and release the mouse button; the first line is displayed. Finally clickthe chart to define the distance of the second line from the first trend line. The secondline is displayed parallel to the first line.
To see how to remove drawings from the Chart, follow the link:Removing Drawings from the Chart
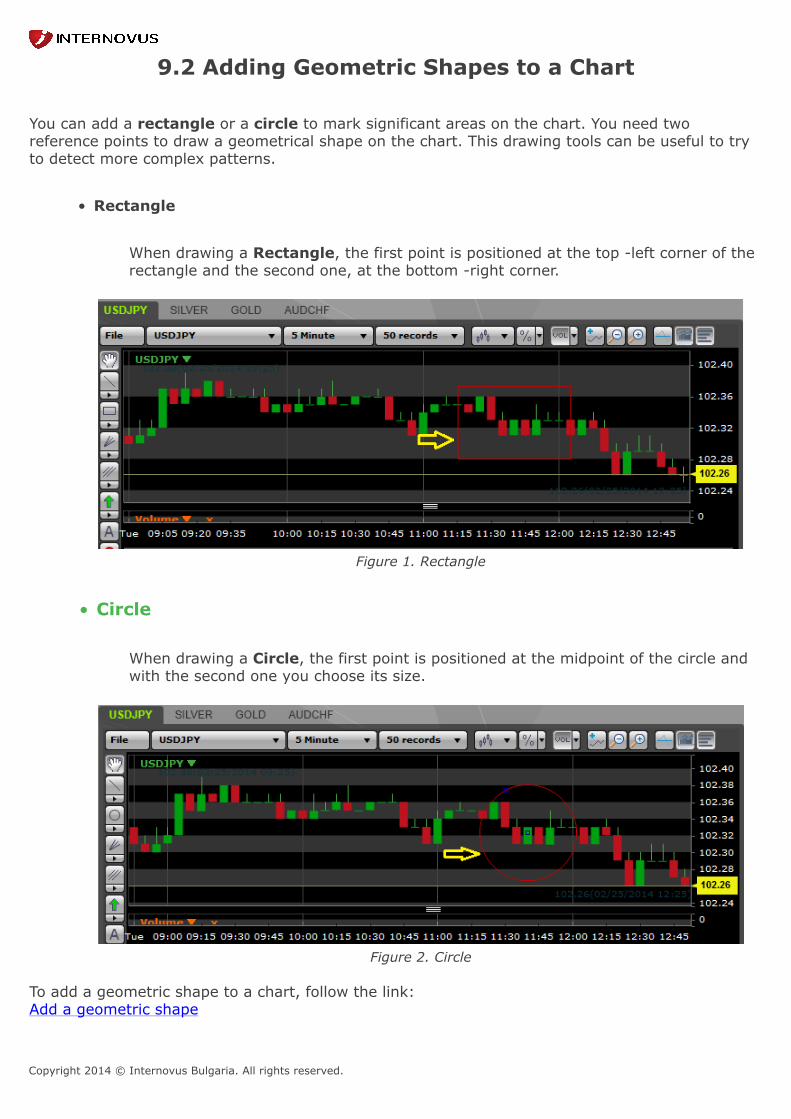
Copyright 2014 © Internovus Bulgaria. All rights reserved.
9.2 Adding Geometric Shapes to a Chart You can add a rectangle or a circle to mark significant areas on the chart. You need tworeference points to draw a geometrical shape on the chart. This drawing tools can be useful to tryto detect more complex patterns.
• Rectangle
When drawing a Rectangle, the first point is positioned at the top -left corner of therectangle and the second one, at the bottom -right corner.
Figure 1. Rectangle
• Circle
When drawing a Circle, the first point is positioned at the midpoint of the circle andwith the second one you choose its size.
Figure 2. Circle
To add a geometric shape to a chart, follow the link:Add a geometric shape

Copyright 2014 © Internovus Bulgaria. All rights reserved.
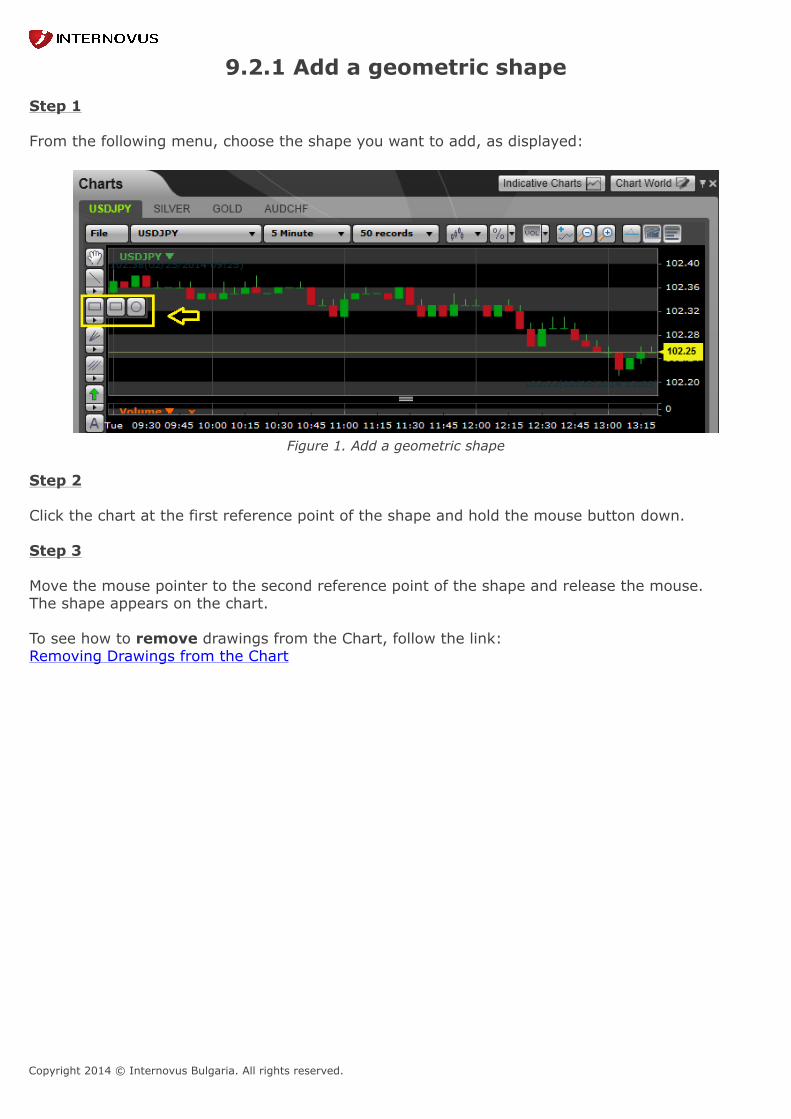
Copyright 2014 © Internovus Bulgaria. All rights reserved.
9.2.1 Add a geometric shape Step 1 From the following menu, choose the shape you want to add, as displayed:
Figure 1. Add a geometric shape Step 2 Click the chart at the first reference point of the shape and hold the mouse button down. Step 3 Move the mouse pointer to the second reference point of the shape and release the mouse.The shape appears on the chart. To see how to remove drawings from the Chart, follow the link:Removing Drawings from the Chart
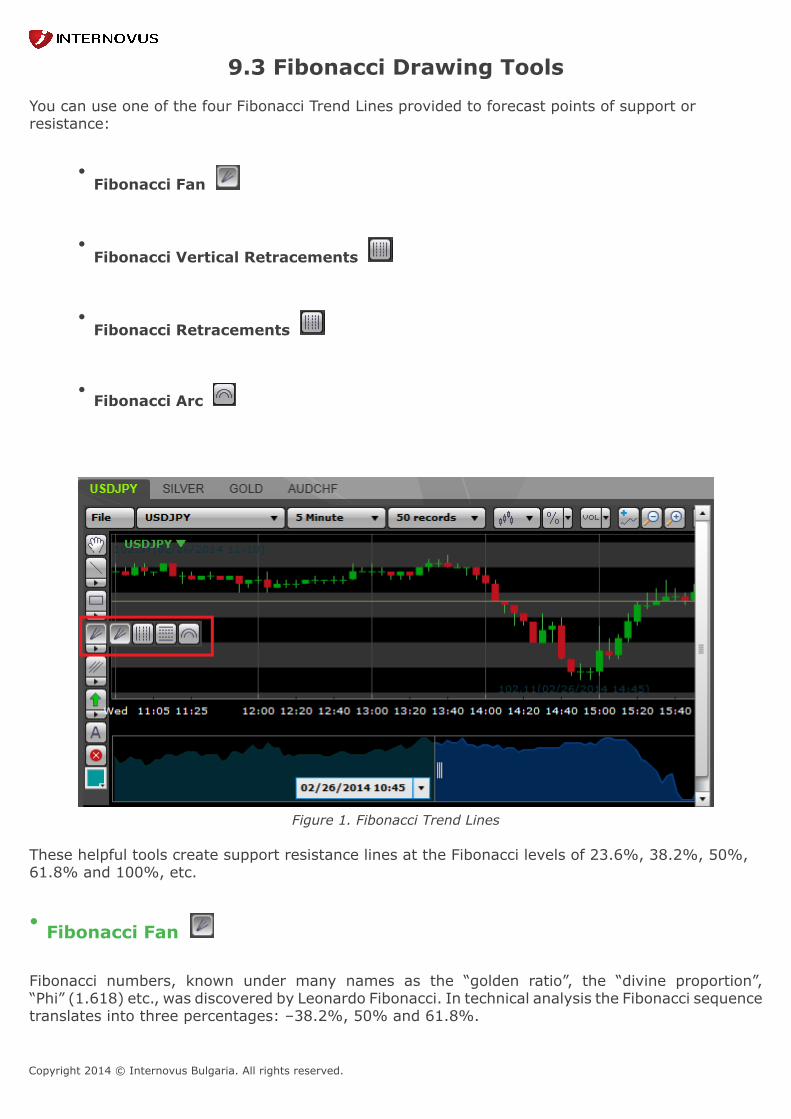
Copyright 2014 © Internovus Bulgaria. All rights reserved.
9.3 Fibonacci Drawing Tools You can use one of the four Fibonacci Trend Lines provided to forecast points of support orresistance:
•Fibonacci Fan
•Fibonacci Vertical Retracements
•Fibonacci Retracements
•Fibonacci Arc
Figure 1. Fibonacci Trend Lines
These helpful tools create support resistance lines at the Fibonacci levels of 23.6%, 38.2%, 50%,61.8% and 100%, etc.
• Fibonacci Fan
Fibonacci numbers, known under many names as the “golden ratio”, the “divine proportion”,“Phi” (1.618) etc., was discovered by Leonardo Fibonacci. In technical analysis the Fibonacci sequencetranslates into three percentages: –38.2%, 50% and 61.8%.
Copyright 2014 © Internovus Bulgaria. All rights reserved.
The Fibonacci Fans function enables 3 diagonal trend -lines to be drawn automatically from anygiven data -point. Chose an extreme data -point (an extreme Close or an extreme High or Low value)in the chart.
From the chosen data point, you draw a vertical line to another extreme in the chart. This line willremain invisible, but the values of the Fibonacci Fans will be calculated from the line drawn.
From the (invisible) line, 3 trend -lines will be drawn (visible) representing respectively 38.2%, 50%and 61.8% of the data -points which make up the invisible line. Fibonacci chartists use these 3 trend-lines as indications for, where the market has areas of support and resistance.
Using the Fibonacci Fan can help you to forecast support levels or a possible descending trend.
• Fibonacci Retracements
Fibonacci Retracements is a tool, used by some traders to calculate the scope of a retracement(temporary price reversals), which does not indicate a reversal in the market trend as such. A“retracement” should therefore be distinguished from a “reversal”.
After a significant price movement up or down, you can use the Fibonacci Retracement to forecastwhere stops or losses may be placed.
A trend -line is drawn from the top to the bottom of the latest “impulse wave” (a strong move in pricecoinciding with the main direction of the markets trend). When a trend -line is thus drawn betweenextreme data points (either extreme Close data or extreme High/Low data), three horizontal linesare created: the first at 61.8% of the highest point in the trend -line, the second at 50%, the third at38.2%. Many traders use these levels to monitor support/resistance levels of the underlying trend.
After a significant price movement up or down, the new /resistance levels are often at or near theFibonacci levels.
• Fibonacci Vertical Retracements
This tool is extremely useful when the market experiences a significant amount of movement. You canuse the Fibonacci Vertical Retracements to project a certain base period of time into the future.
• Fibonacci Arc
It is used for predicting resistance levels as well as key support. It is created by first drawing a trendline between two extreme points, usually high and low (from high to low). Fibonacci arcs are thethree curves that intersect the trend line at the retracement levels. The retracement levels can beconfigured within "Fibonacci Arcs" window that is displayed after drawing the trend line. The chosenvalues can be saved ("Save to General Settings" button) so next time Fibonacci Arcs are drawn,the saved values will be used as default. The arcs are estimations for support.
To add a Fibonacci Trend Line follow the link:

Copyright 2014 © Internovus Bulgaria. All rights reserved.
Add a Fibonacci Line
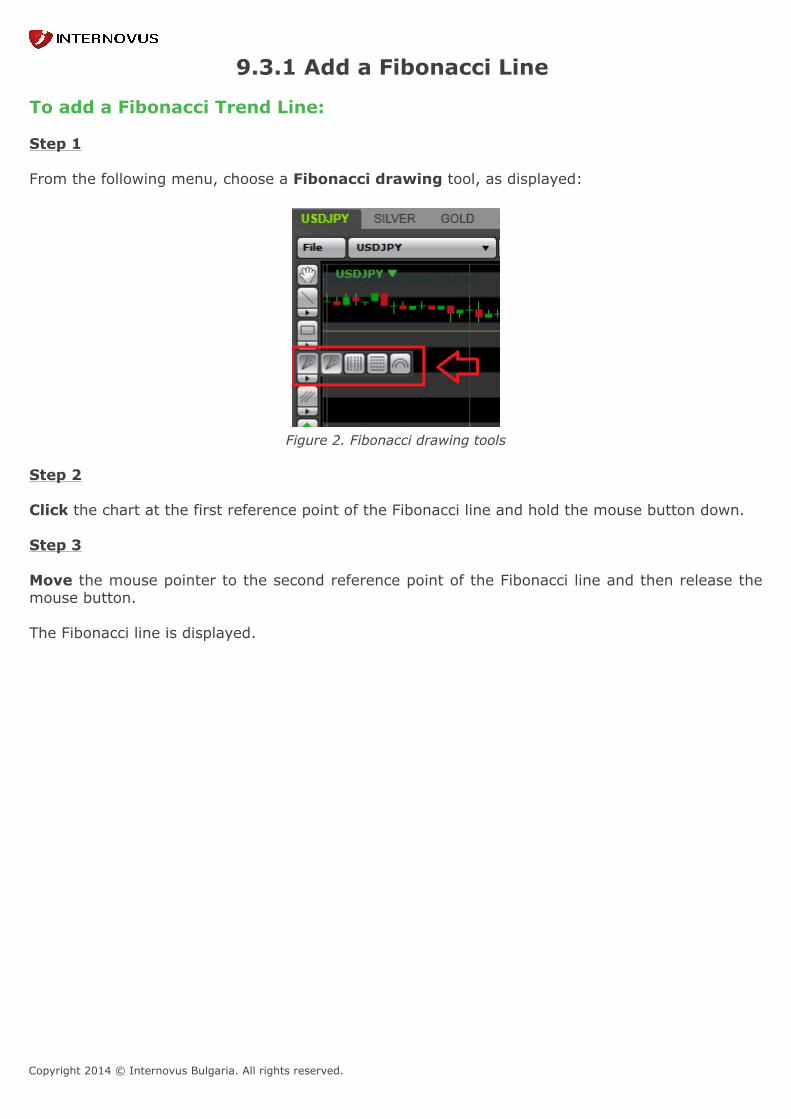
Copyright 2014 © Internovus Bulgaria. All rights reserved.
9.3.1 Add a Fibonacci Line To add a Fibonacci Trend Line:
Step 1
From the following menu, choose a Fibonacci drawing tool, as displayed:
Figure 2. Fibonacci drawing tools
Step 2
Click the chart at the first reference point of the Fibonacci line and hold the mouse button down.
Step 3
Move the mouse pointer to the second reference point of the Fibonacci line and then release themouse button.
The Fibonacci line is displayed.
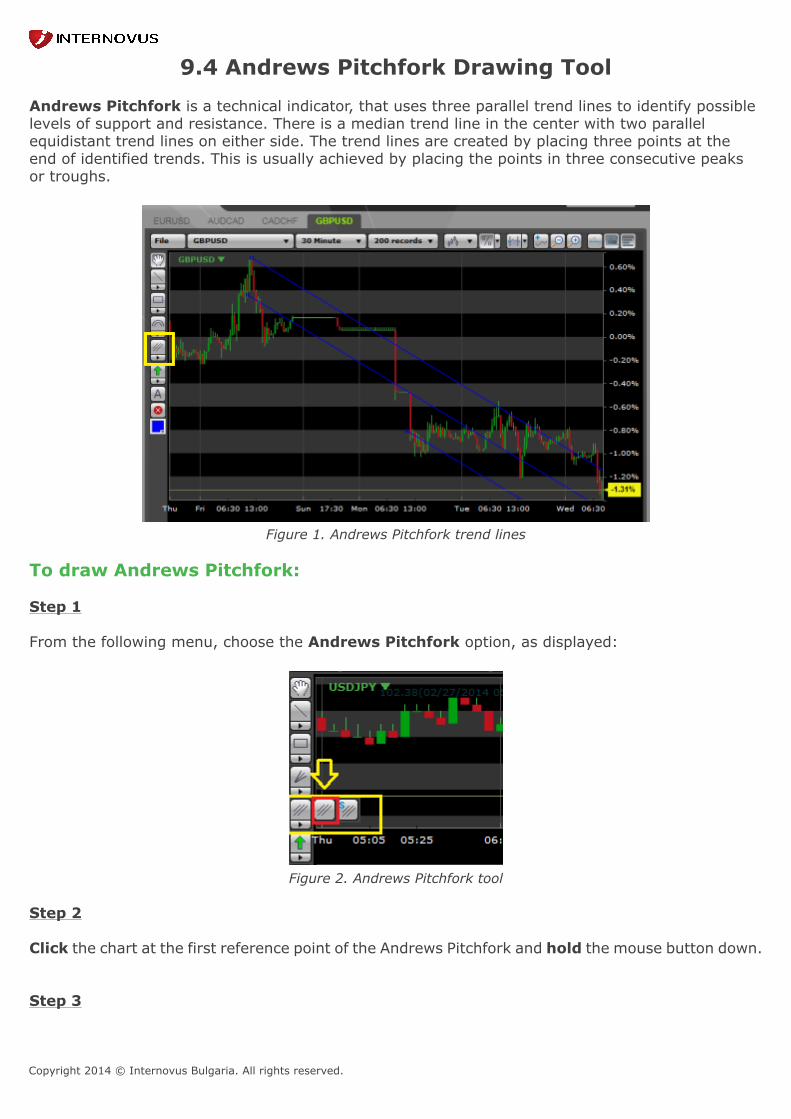
Copyright 2014 © Internovus Bulgaria. All rights reserved.
9.4 Andrews Pitchfork Drawing Tool Andrews Pitchfork is a technical indicator, that uses three parallel trend lines to identify possiblelevels of support and resistance. There is a median trend line in the center with two parallelequidistant trend lines on either side. The trend lines are created by placing three points at theend of identified trends. This is usually achieved by placing the points in three consecutive peaksor troughs.
Figure 1. Andrews Pitchfork trend lines
To draw Andrews Pitchfork:
Step 1
From the following menu, choose the Andrews Pitchfork option, as displayed:
Figure 2. Andrews Pitchfork tool
Step 2
Click the chart at the first reference point of the Andrews Pitchfork and hold the mouse button down.
Step 3

Copyright 2014 © Internovus Bulgaria. All rights reserved.
Move the mouse pointer to the second reference point of the Andrews Pitchfork and release themouse button.
The Andrews Pitchfork is displayed.

Copyright 2014 © Internovus Bulgaria. All rights reserved.
9.5 Standard Deviation Channel tool You can use the Standard Deviation Channel to determine where a "balancing point" lies. The "balancing point" is the point towards which the prices tend to be drawn. The StandardDeviation Channel consists of three parallel lines. The middle line shows the linear regressiontrend between two reference points. The other two lines are drawn at the distance of one standarddeviation away from the linear regression trend line.
Figure 1. Standard Deviation Channel lines
To add the Standard Deviation Channel:
Step 1
From the following menu, choose the Standard Deviation Channel option, as displayed:
Figure 2. Standard Deviation Channel tool
Step 2
Click the chart at the first reference point of the Standard Deviation Channel and hold the mousebutton down.
Step 3
Move the mouse pointer to the second reference point of the Standard Deviation Channel andrelease the mouse button.

Copyright 2014 © Internovus Bulgaria. All rights reserved.
The Standard Deviation Channel is displayed.

Copyright 2014 © Internovus Bulgaria. All rights reserved.
9.6 Adding Arrows to a Chart Adding up and down arrows to a chart can help you highlight rises and declines in market rates. Bydefault, the up arrows appear in green while the down arrows appear in red.
Figure 1. Adding Arrows
To add an arrow to a chart, follow the steps:
Step 1
From the Arrow menu, choose the Up or Down arrow option, as displayed:
Figure 2. Up/Down Arrow
Step 2
Click the chart, where you want to place the arrow.Consequently, the arrow is displayed.
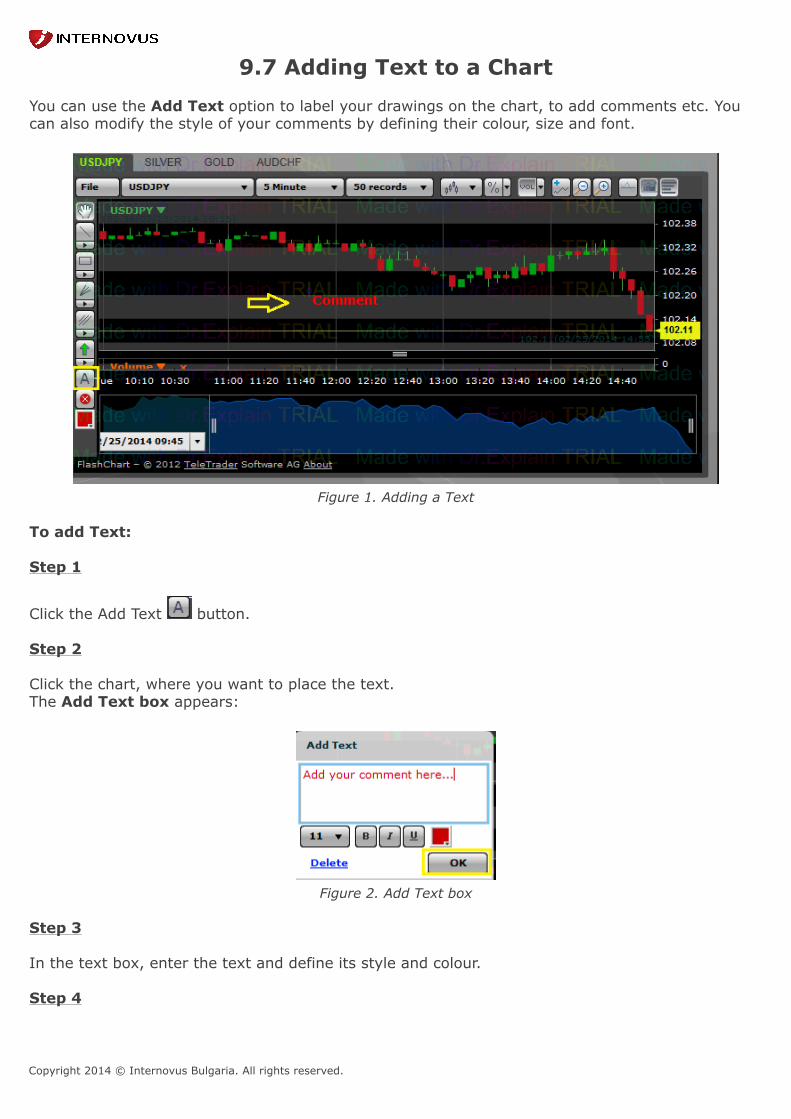
Copyright 2014 © Internovus Bulgaria. All rights reserved.
9.7 Adding Text to a Chart You can use the Add Text option to label your drawings on the chart, to add comments etc. Youcan also modify the style of your comments by defining their colour, size and font.
Figure 1. Adding a Text
To add Text:
Step 1
Click the Add Text button.
Step 2
Click the chart, where you want to place the text.The Add Text box appears:
Figure 2. Add Text box
Step 3
In the text box, enter the text and define its style and colour.
Step 4

Copyright 2014 © Internovus Bulgaria. All rights reserved.
Click OK to confirm.The text appears on the chart.
Notes:
Changing the Style of the TextYou can change the style of the text, by clicking it and changing it's style definitions in the displayed AddText box.
Removing a TextYou can remove the text from the chart, by clicking Delete in the Add Text box.
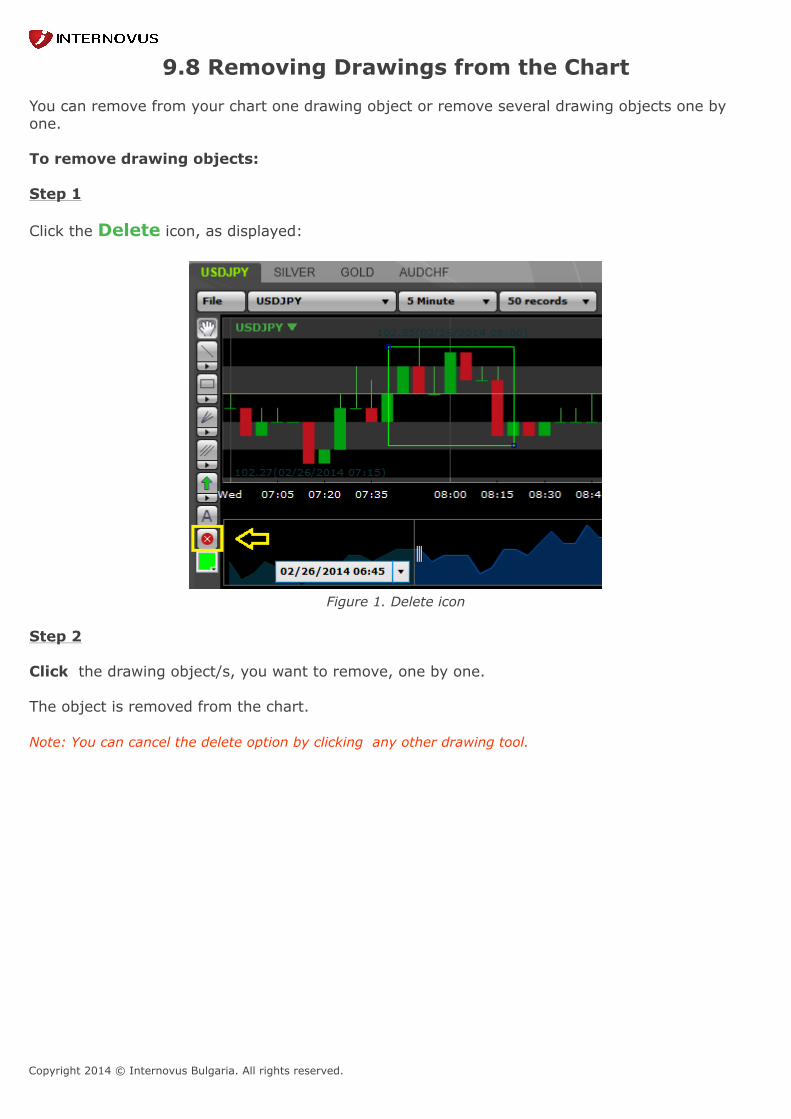
Copyright 2014 © Internovus Bulgaria. All rights reserved.
9.8 Removing Drawings from the Chart You can remove from your chart one drawing object or remove several drawing objects one byone. To remove drawing objects: Step 1 Click the Delete icon, as displayed:
Figure 1. Delete icon
Step 2
Click the drawing object/s, you want to remove, one by one.
The object is removed from the chart.
Note: You can cancel the delete option by clicking any other drawing tool.
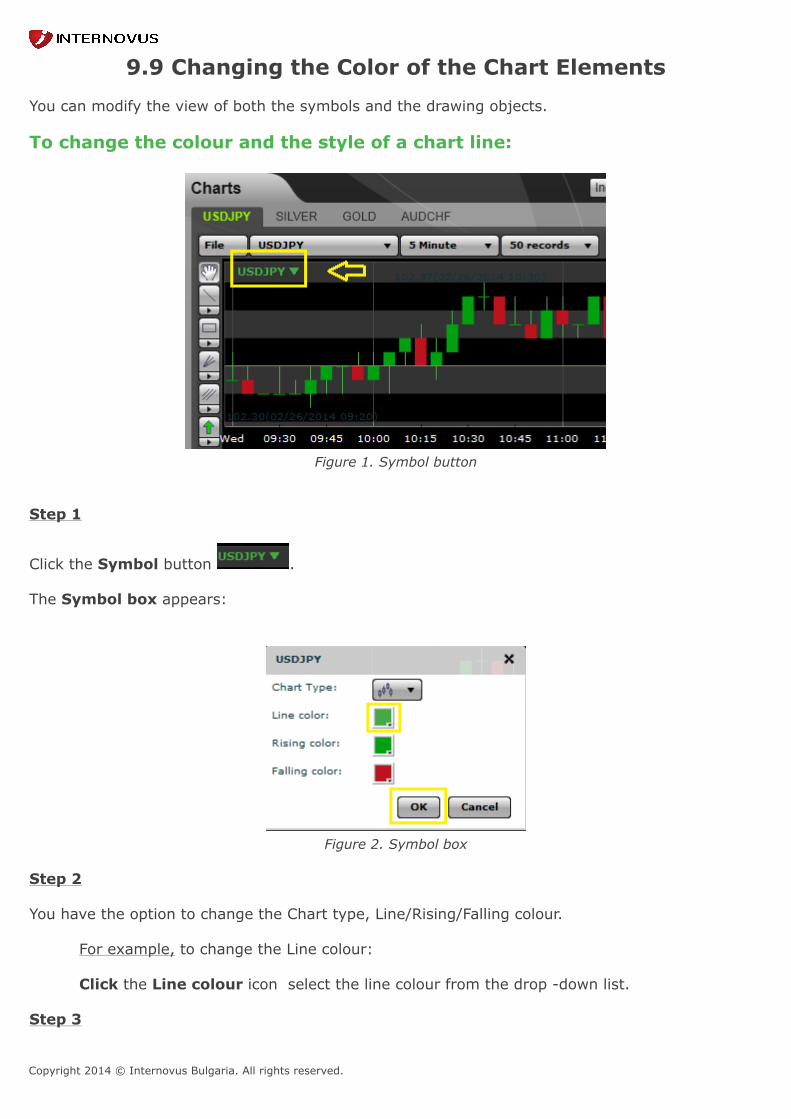
Copyright 2014 © Internovus Bulgaria. All rights reserved.
9.9 Changing the Color of the Chart Elements You can modify the view of both the symbols and the drawing objects. To change the colour and the style of a chart line:
Figure 1. Symbol button
Step 1
Click the Symbol button . The Symbol box appears:
Figure 2. Symbol box
Step 2
You have the option to change the Chart type, Line/Rising/Falling colour.
For example, to change the Line colour:
Click the Line colour icon select the line colour from the drop -down list.
Step 3
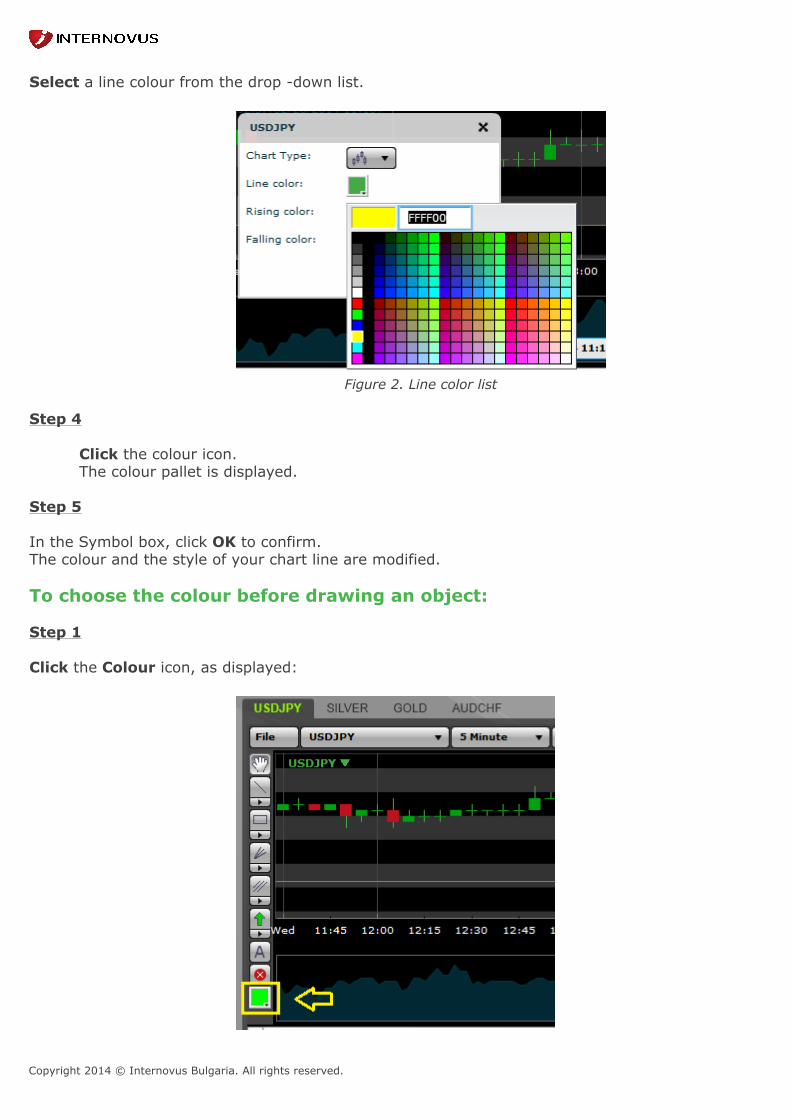
Copyright 2014 © Internovus Bulgaria. All rights reserved.
Select a line colour from the drop -down list.
Figure 2. Line color list
Step 4
Click the colour icon.The colour pallet is displayed.
Step 5
In the Symbol box, click OK to confirm.The colour and the style of your chart line are modified.
To choose the colour before drawing an object:
Step 1
Click the Colour icon, as displayed:

Copyright 2014 © Internovus Bulgaria. All rights reserved.
Figure 3. Color icon
The colour pallet appears.
Step 2
In the colour pallet choose the colour you want.
The pallet is hidden. From now on, each object you draw will appear coloured with the colour youchose.
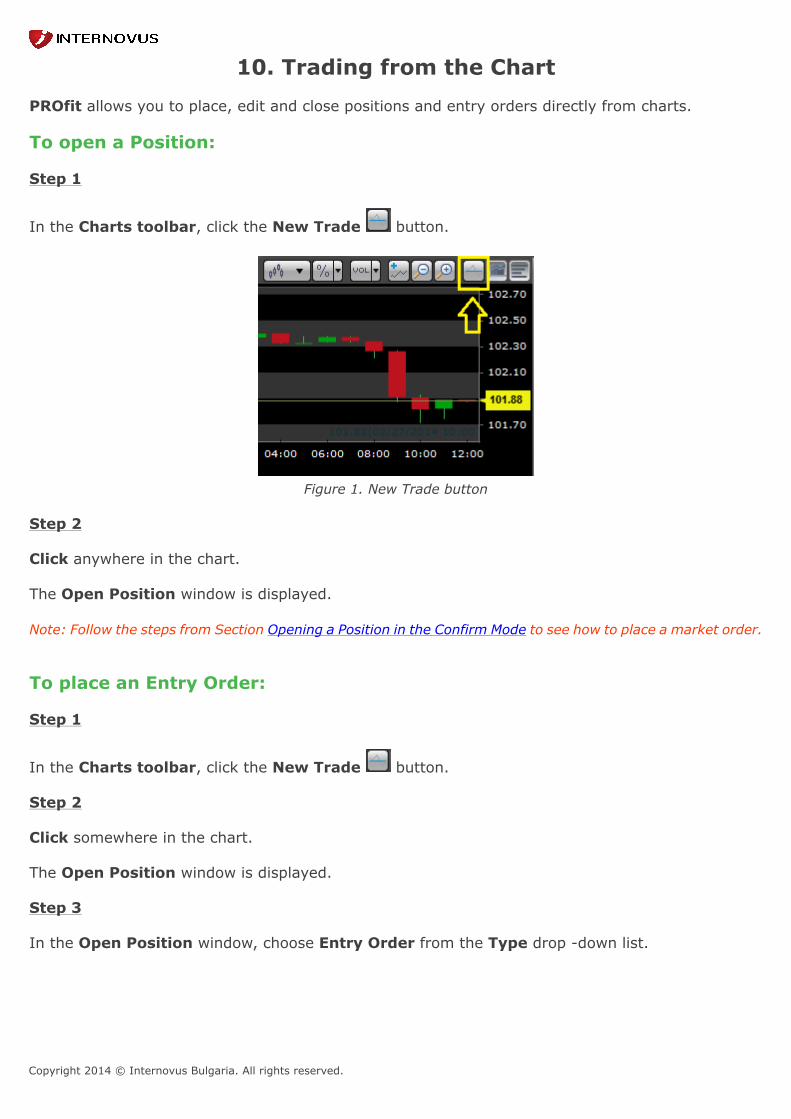
Copyright 2014 © Internovus Bulgaria. All rights reserved.
10. Trading from the Chart PROfit allows you to place, edit and close positions and entry orders directly from charts. To open a Position: Step 1
In the Charts toolbar, click the New Trade button.
Figure 1. New Trade button
Step 2
Click anywhere in the chart.
The Open Position window is displayed.
Note: Follow the steps from Section Opening a Position in the Confirm Mode to see how to place a market order.
To place an Entry Order:
Step 1
In the Charts toolbar, click the New Trade button. Step 2
Click somewhere in the chart.
The Open Position window is displayed.
Step 3
In the Open Position window, choose Entry Order from the Type drop -down list.
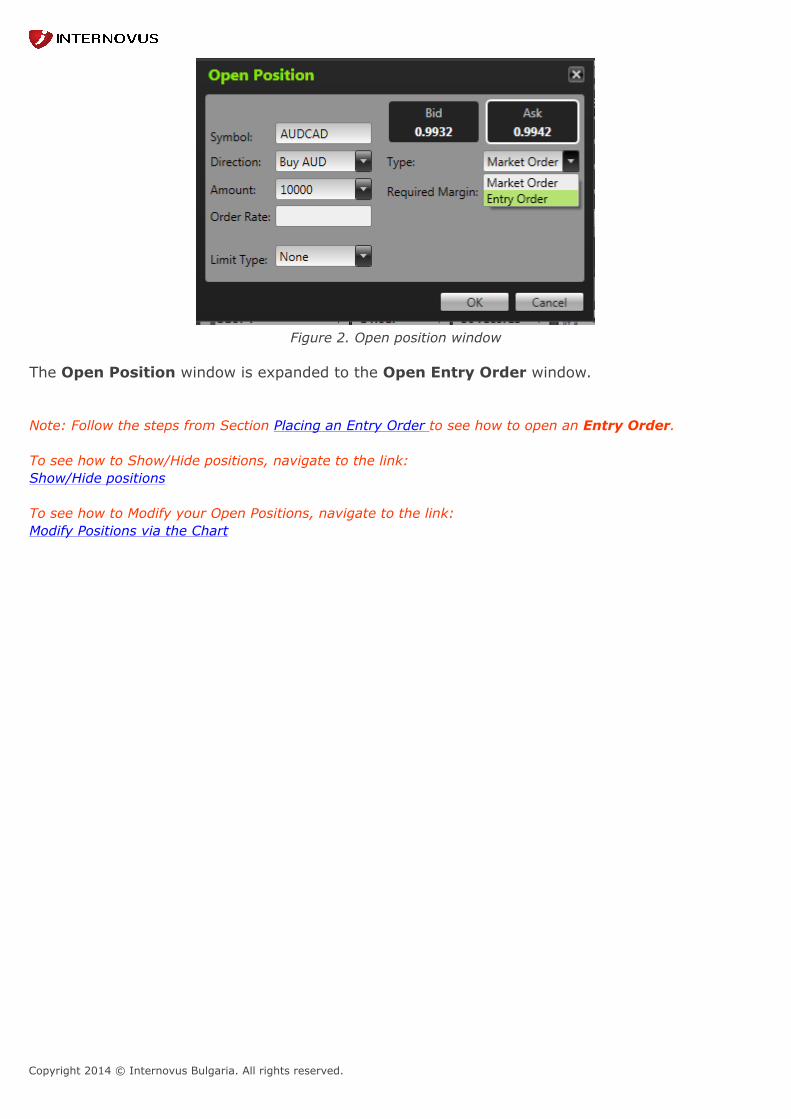
Copyright 2014 © Internovus Bulgaria. All rights reserved.
Figure 2. Open position window
The Open Position window is expanded to the Open Entry Order window.
Note: Follow the steps from Section Placing an Entry Order to see how to open an Entry Order.
To see how to Show/Hide positions, navigate to the link:Show/Hide positions
To see how to Modify your Open Positions, navigate to the link:Modify Positions via the Chart
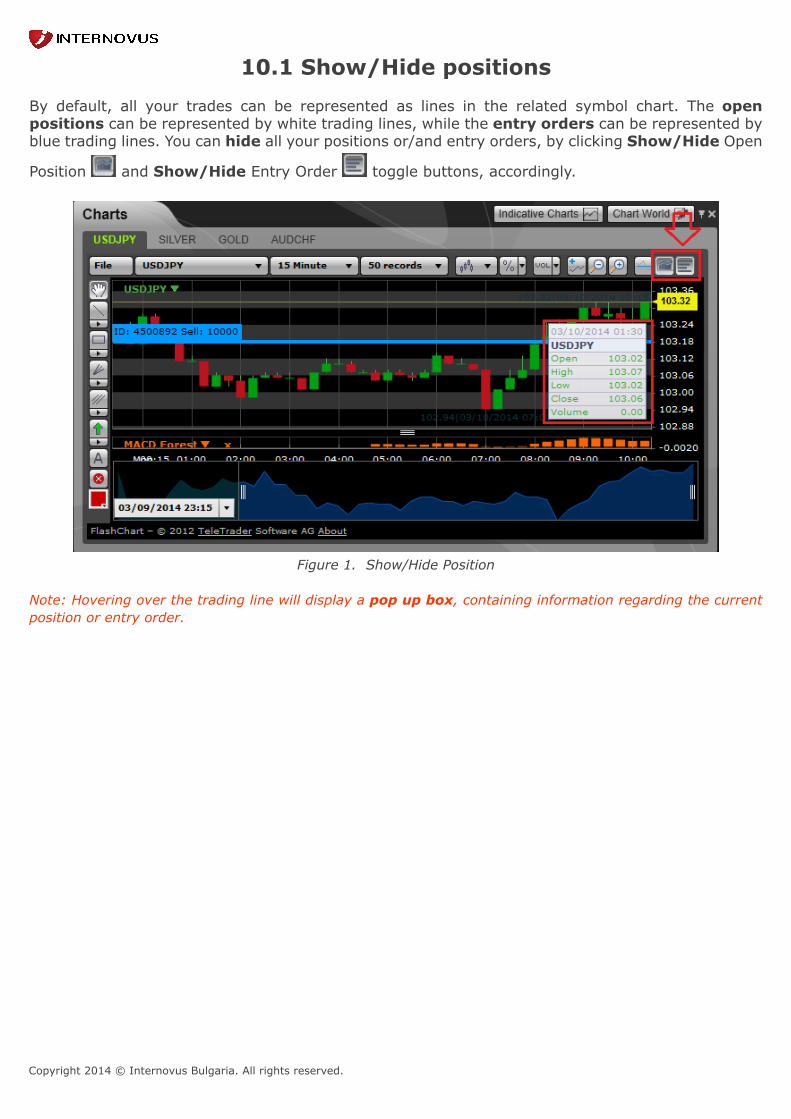
Copyright 2014 © Internovus Bulgaria. All rights reserved.
10.1 Show/Hide positions By default, all your trades can be represented as lines in the related symbol chart. The openpositions can be represented by white trading lines, while the entry orders can be represented byblue trading lines. You can hide all your positions or/and entry orders, by clicking Show/Hide Open
Position and Show/Hide Entry Order toggle buttons, accordingly.
Figure 1. Show/Hide Position
Note: Hovering over the trading line will display a pop up box, containing information regarding the currentposition or entry order.

Copyright 2014 © Internovus Bulgaria. All rights reserved.
10.2 Modify Positions via the Chart To Modify your Open Positions via the Chart:
Step 1
Double click the white trading line (open position).
The Position Details window is displayed.
Step 2.
Follow the steps from Section Modifying Open Positions. To Modify your Entry Order via the Chart:
Step 1
Double click the blue trading line (entry order).
The Position Details window is displayed.
Step 2
Follow the steps from Section Modifying Entry Orders.
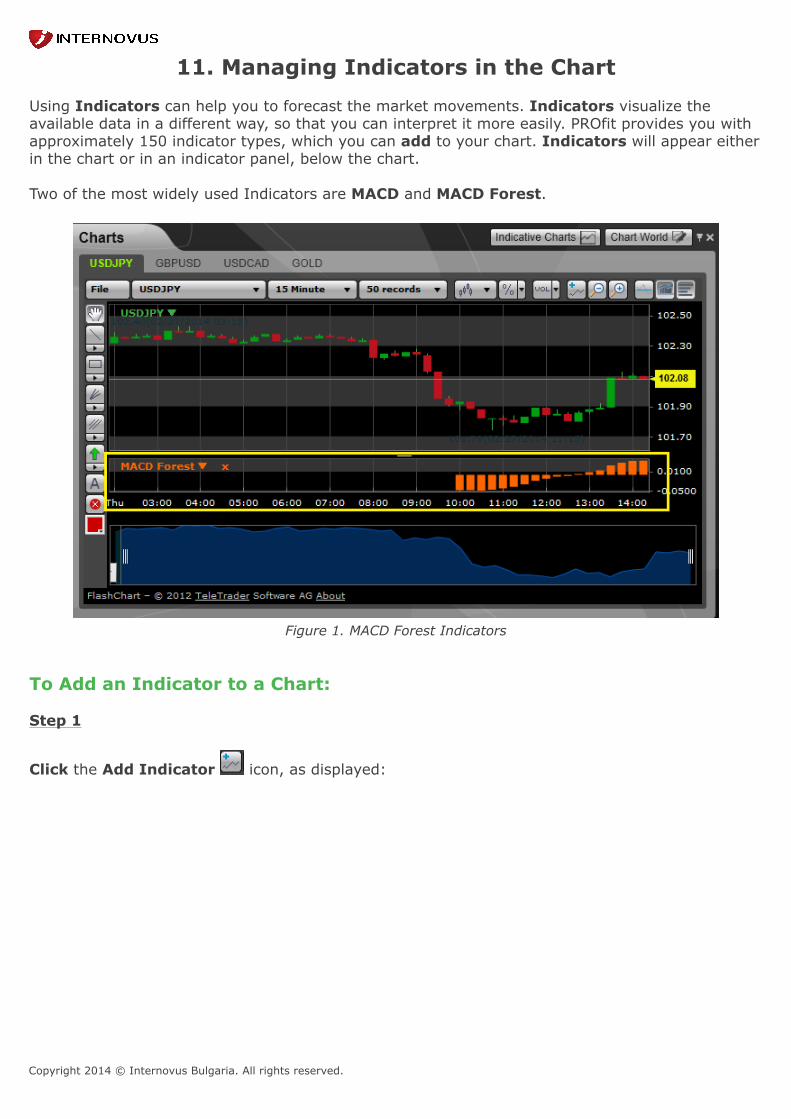
Copyright 2014 © Internovus Bulgaria. All rights reserved.
11. Managing Indicators in the Chart Using Indicators can help you to forecast the market movements. Indicators visualize theavailable data in a different way, so that you can interpret it more easily. PROfit provides you withapproximately 150 indicator types, which you can add to your chart. Indicators will appear eitherin the chart or in an indicator panel, below the chart. Two of the most widely used Indicators are MACD and MACD Forest.
Figure 1. MACD Forest Indicators
To Add an Indicator to a Chart:
Step 1
Click the Add Indicator icon, as displayed:
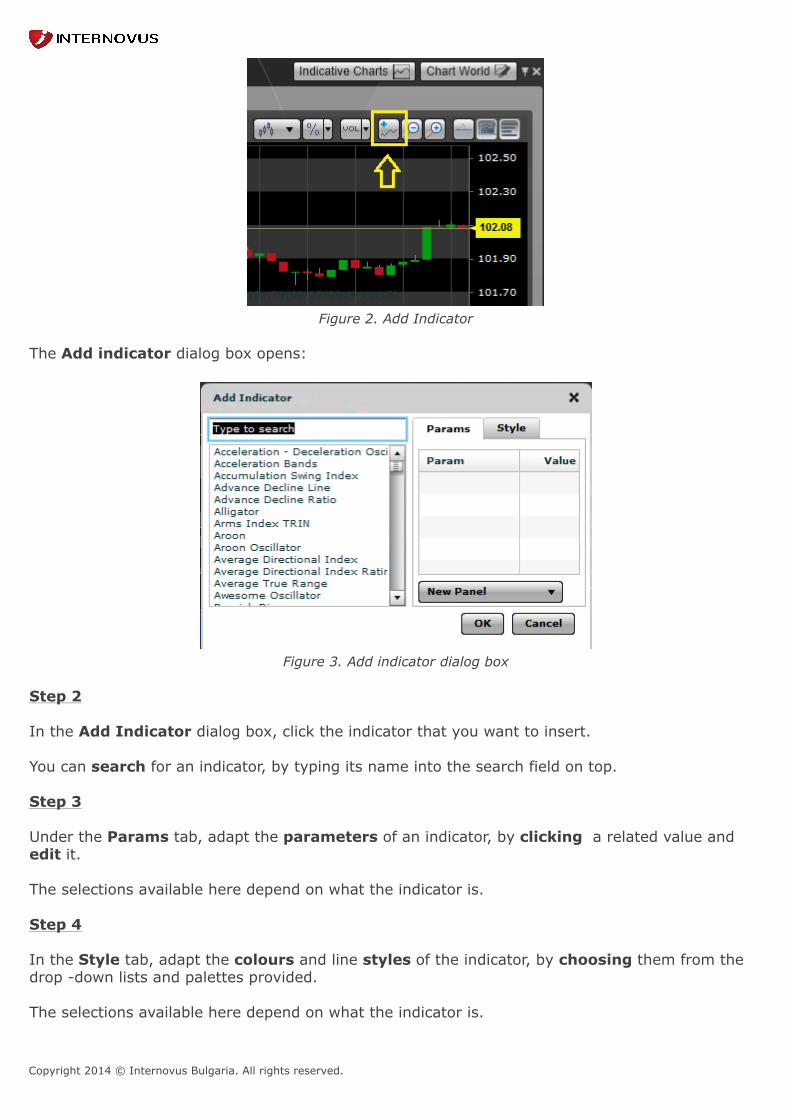
Copyright 2014 © Internovus Bulgaria. All rights reserved.
Figure 2. Add Indicator
The Add indicator dialog box opens:
Figure 3. Add indicator dialog box Step 2 In the Add Indicator dialog box, click the indicator that you want to insert. You can search for an indicator, by typing its name into the search field on top. Step 3 Under the Params tab, adapt the parameters of an indicator, by clicking a related value andedit it. The selections available here depend on what the indicator is. Step 4 In the Style tab, adapt the colours and line styles of the indicator, by choosing them from thedrop -down lists and palettes provided. The selections available here depend on what the indicator is.
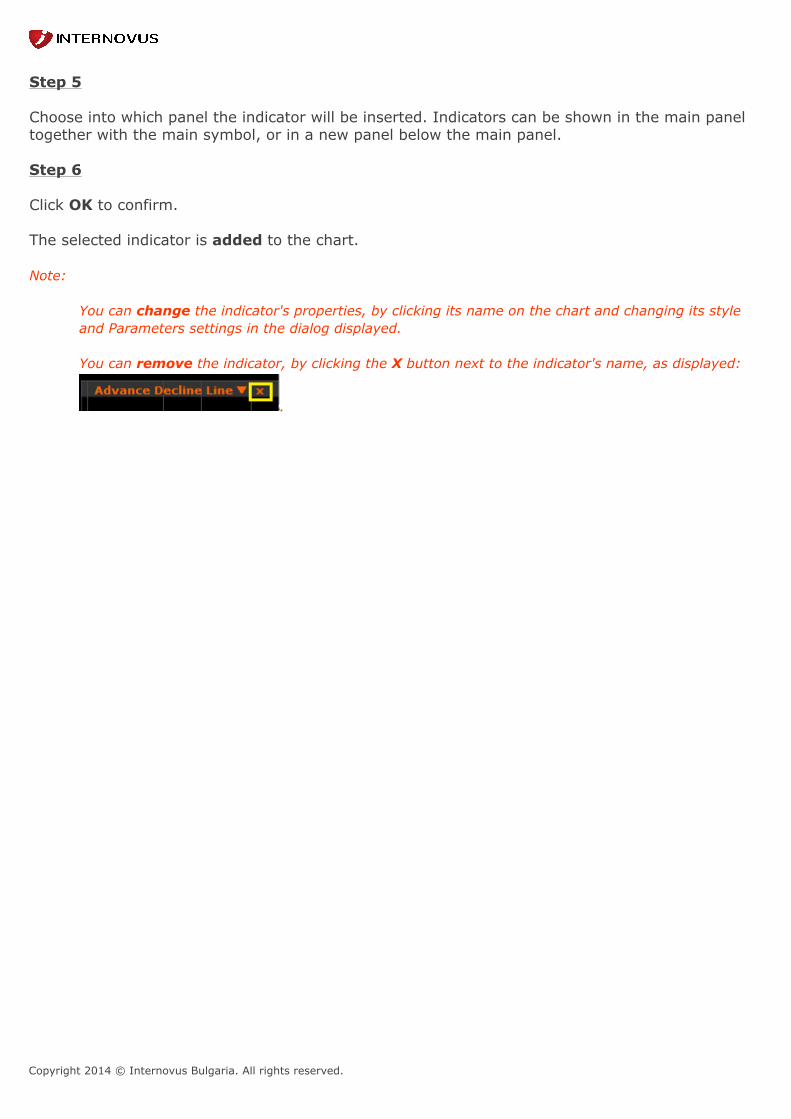
Copyright 2014 © Internovus Bulgaria. All rights reserved.
Step 5 Choose into which panel the indicator will be inserted. Indicators can be shown in the main paneltogether with the main symbol, or in a new panel below the main panel. Step 6 Click OK to confirm. The selected indicator is added to the chart. Note:
You can change the indicator's properties, by clicking its name on the chart and changing its styleand Parameters settings in the dialog displayed.
You can remove the indicator, by clicking the X button next to the indicator's name, as displayed:
.
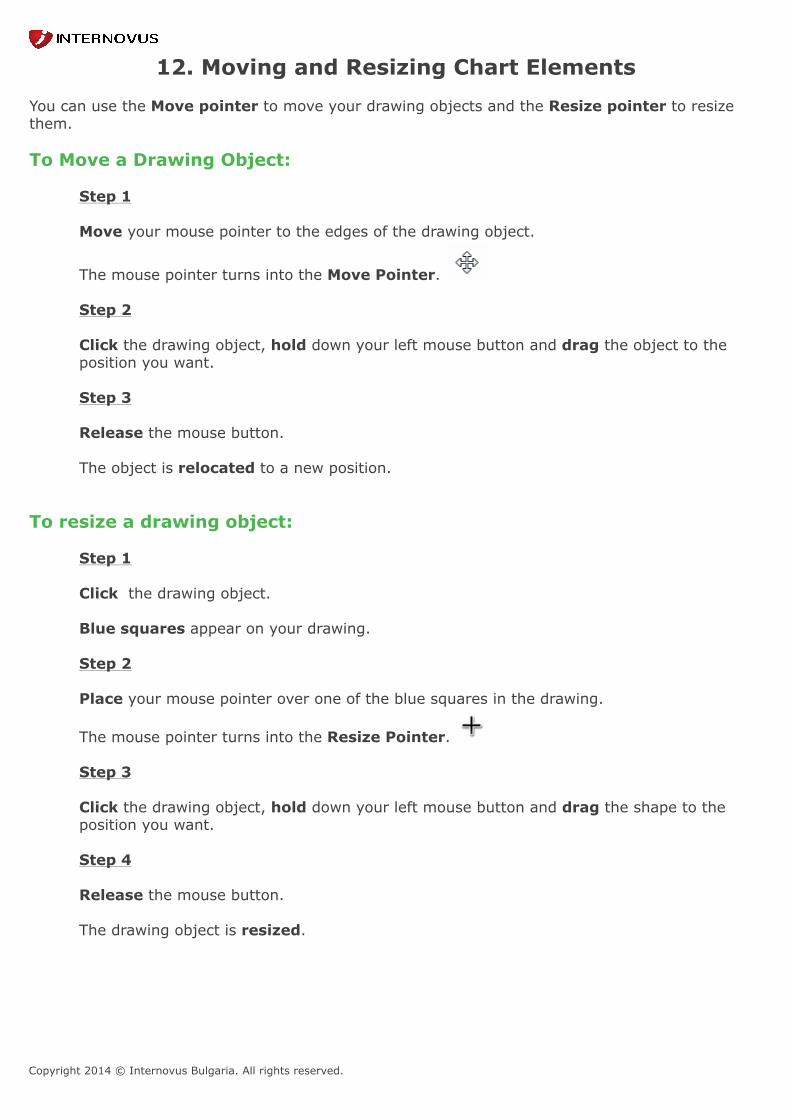
Copyright 2014 © Internovus Bulgaria. All rights reserved.
12. Moving and Resizing Chart Elements You can use the Move pointer to move your drawing objects and the Resize pointer to resizethem. To Move a Drawing Object:
Step 1
Move your mouse pointer to the edges of the drawing object.
The mouse pointer turns into the Move Pointer.
Step 2
Click the drawing object, hold down your left mouse button and drag the object to theposition you want.
Step 3
Release the mouse button.
The object is relocated to a new position.
To resize a drawing object:
Step 1
Click the drawing object. Blue squares appear on your drawing.
Step 2
Place your mouse pointer over one of the blue squares in the drawing.
The mouse pointer turns into the Resize Pointer.
Step 3
Click the drawing object, hold down your left mouse button and drag the shape to theposition you want.
Step 4
Release the mouse button. The drawing object is resized.
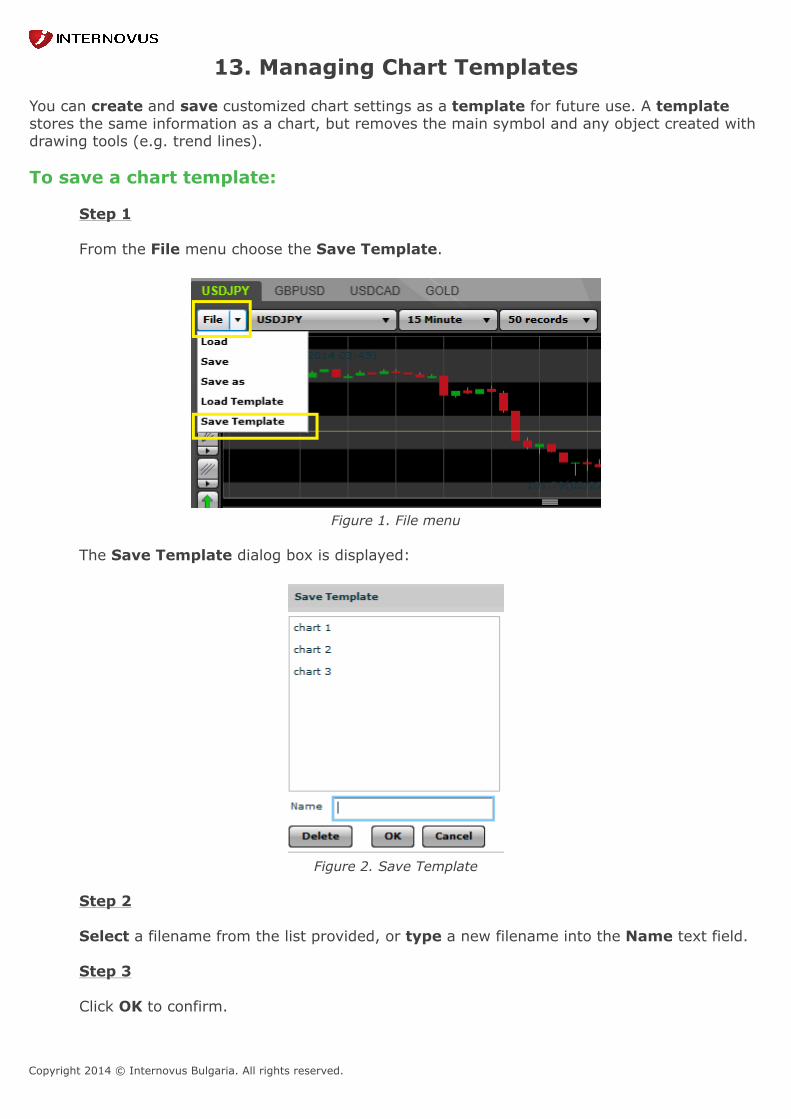
Copyright 2014 © Internovus Bulgaria. All rights reserved.
13. Managing Chart Templates You can create and save customized chart settings as a template for future use. A templatestores the same information as a chart, but removes the main symbol and any object created withdrawing tools (e.g. trend lines). To save a chart template:
Step 1
From the File menu choose the Save Template.
Figure 1. File menu
The Save Template dialog box is displayed:
Figure 2. Save Template
Step 2
Select a filename from the list provided, or type a new filename into the Name text field.
Step 3
Click OK to confirm.
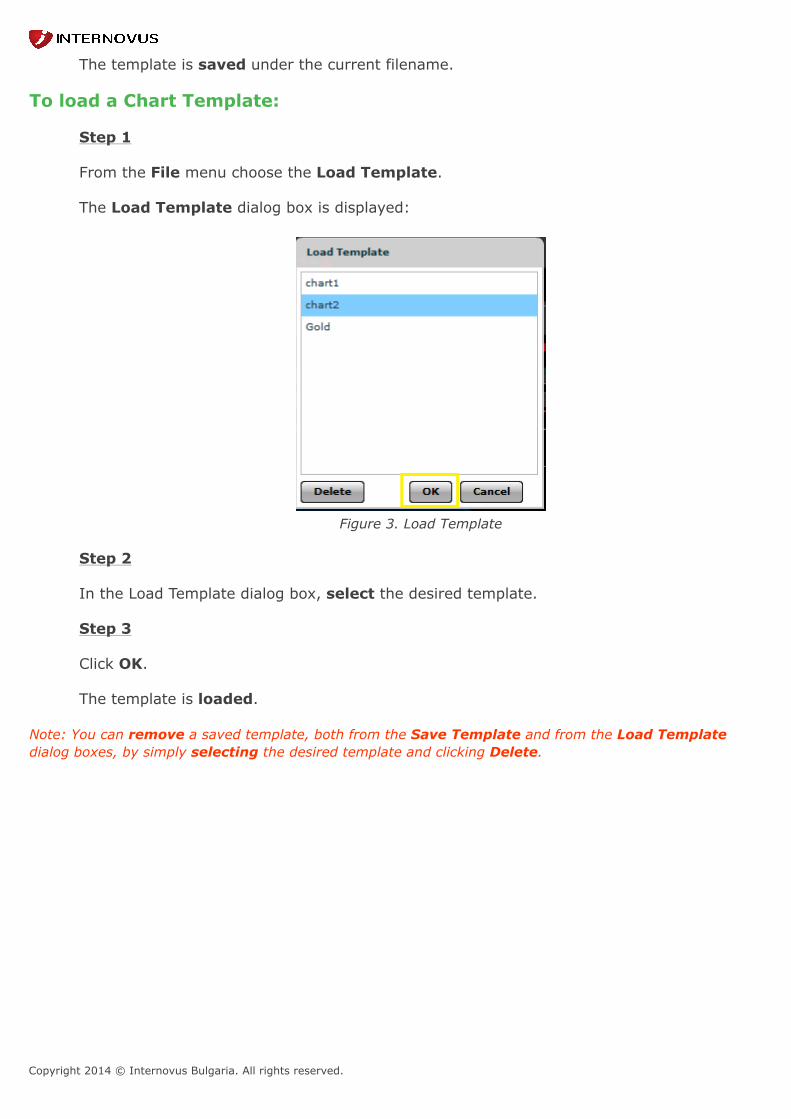
Copyright 2014 © Internovus Bulgaria. All rights reserved.
The template is saved under the current filename.
To load a Chart Template:
Step 1
From the File menu choose the Load Template. The Load Template dialog box is displayed:
Figure 3. Load Template
Step 2
In the Load Template dialog box, select the desired template. Step 3 Click OK. The template is loaded.
Note: You can remove a saved template, both from the Save Template and from the Load Templatedialog boxes, by simply selecting the desired template and clicking Delete.
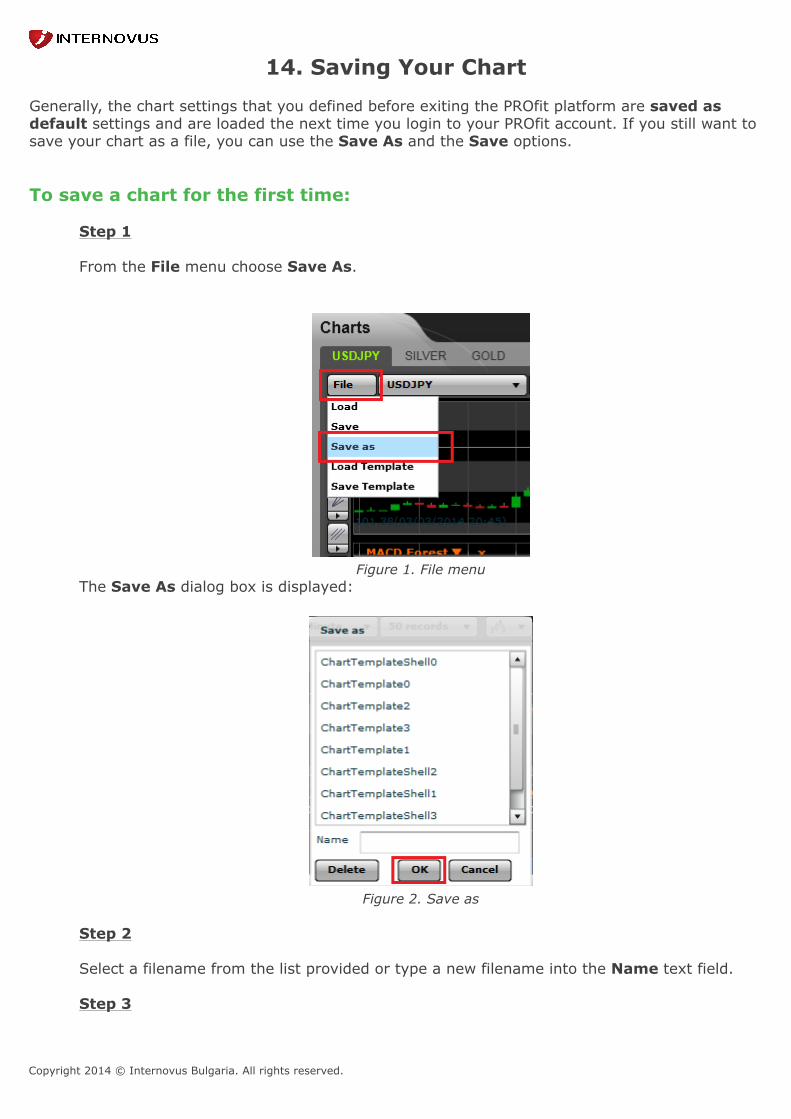
Copyright 2014 © Internovus Bulgaria. All rights reserved.
14. Saving Your Chart Generally, the chart settings that you defined before exiting the PROfit platform are saved asdefault settings and are loaded the next time you login to your PROfit account. If you still want tosave your chart as a file, you can use the Save As and the Save options. To save a chart for the first time:
Step 1
From the File menu choose Save As.
Figure 1. File menuThe Save As dialog box is displayed:
Figure 2. Save as Step 2
Select a filename from the list provided or type a new filename into the Name text field.
Step 3
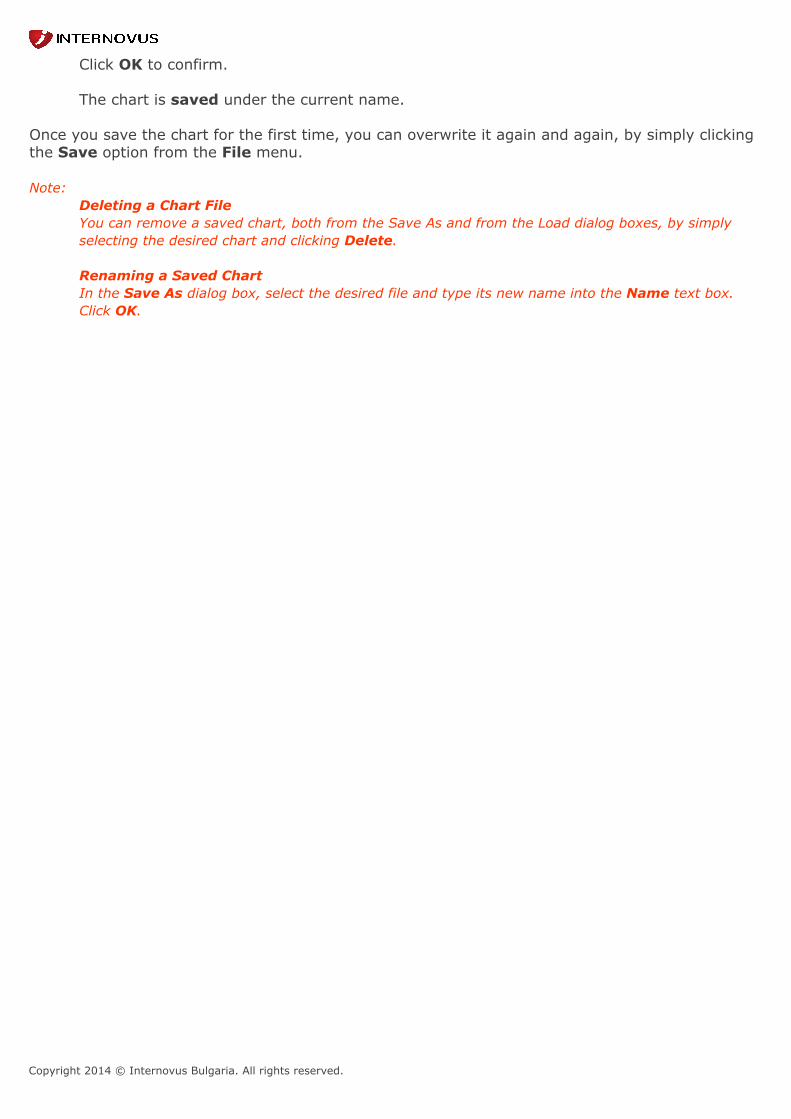
Copyright 2014 © Internovus Bulgaria. All rights reserved.
Click OK to confirm. The chart is saved under the current name.
Once you save the chart for the first time, you can overwrite it again and again, by simply clickingthe Save option from the File menu. Note:
Deleting a Chart FileYou can remove a saved chart, both from the Save As and from the Load dialog boxes, by simplyselecting the desired chart and clicking Delete.
Renaming a Saved ChartIn the Save As dialog box, select the desired file and type its new name into the Name text box.Click OK.

Copyright 2014 © Internovus Bulgaria. All rights reserved.
15. Tradency

Copyright 2014 © Internovus Bulgaria. All rights reserved.
15.1. What is Copy Trading
Copy trading, also known as mirror trading, is an off shoot of the automated trading world and part ofthe growing social trading scene. Automated trading and algorithmic trading seek to take the burdenof trade decisions off the shoulders of the average investor and relies on computer generated signalsto automatically place trades in investor accounts. Social trading seeks to build community so thattraders can follow and learn from each other. Copy trading is similar to both; it relies on real peopleexecuting their own proven strategies and allows others to automatically follow those trades.Copy trading began to emerge in the early 2000’s when online Forex trading began to gain massappeal. It started with a few independent traders and businesses. These first copy trading servicesutilized special agreements with Forex brokers to create large “Master Accounts” so that other traderscould link to them. Once linked and funded all trades made by the Master Account were also made byeach individual account linked to it. Since then the industry has evolved, now you can find specializedbrokers and services combining copy trading accounts with their other services. It seems reasonablethat an inexperienced trader or investor would seek out a more experienced trader, copy tradingtakes that to a whole new level.
Copyright 2014 © Internovus Bulgaria. All rights reserved.
Tradency
1. Introduction Mirror Trader is a comprehensive trading platform, providing you with unique tools for knowledge-based trading:
• Live signals• Sentiments• Market charts• Oscillators• Chart studies
Mirror Trader features a database of trading strategies created by worldwide strategy developers. With the Mirror Trader you can use streams of information for manual trading, follow selected signalsfor your trades or automatically mirror trades by your selected strategies.
The Mirror Trader allows you to:
• Use Manual Trading, Semi -Automatic Mirroring and Automatic Mirroring in one platform• Benefit from experienced traders’ knowledge • Control and manage real-time signals generated by worldwide strategy developers• Back up your trading decision with market trends from strategies and users• Take advantage of exclusive features such as: Live signals and strategies detailed analysis, as
well as popular trading tools: charts, indicators, oscillators, rates and market sentiments
The Mirror Trader do not allows you currently to:
• The customer will have to login with his username and password in order to fund his account(instead of being redirected directly to the deposit page and logging in automatically)
• When changing spreads for a symbol, the updated spread will not be showing on Tradencysystem.
• Protected positions do not have a shield icon as in the Profit system.• Trading definitions do not reflect on Tradency system.• Cannot cancel SL/TP rate for Entry Orders through Tradency.• When a user cancels an entry order, the cancellation reason is 'Expired', while it should be 'User
request'. This will be fixed in a later phase.• OCO (One Cancels the Other) is a special feature of Profit, therefore it acts differently between
the 2 systems. In Tradency, an OCO appears as 2 entry orders.• When update amount to entry order it does not reflect in Tradency.• When clicking the Tradency icon from Profit, the user will get to the login page of Tradency
system and will have to insert his username and password (the same credentials as Profit).

Copyright 2014 © Internovus Bulgaria. All rights reserved.
15.1.1.1. Integration with Web PROfit
1. Overview
The integration of Web Profit with Tradency enables you to follow leaders' trends using one and thesame account.
Note: This feature is available only for the web platform of PROfit.
Mirror Trader is one of all the tools that PROfit offers to its clients. It is a trading platform whichoffers 3 major features:
• Strategy and mirror trading – a client can decide to let the trading platform perform actions onhis behalf according to a specific strategy. He chooses a strategy (he can also decide to “follow”an expert trader) and the mirror trader opens and closes positions and entry orders according tothe selected strategy.
• Strategy signals – these signals allow users to get an indication whenever a certain strategy takesaction and decide whether they want to mirror it or not. In this case whenever a selected strategy“decides” to open a position, the user is informed and can decide if he wants to open an identicalposition or not.
• Knowledge DB and sentiments analysis – the trading platform allows users to see what othertraders are doing and to understand how many Buy or Sell positions are opened for each symbol(for example: 60% of EUR\USD positions are Buy and 40% Sell)

Copyright 2014 © Internovus Bulgaria. All rights reserved.
15.1.1.1.1. Login to PROfit
Step 1
Click the button.
Step 2
The following window appears.Enter you User Name and Password.
Figure 1. Login window
Note: If a password is forgotten or lost, it can be reset by selecting the "Forgot password?" option fromthe login screen. The user name or email address for the account is requested to begin the password resetprocess. "Change password" : It should be very important priority to keep your account secure. We recommendthat you change passwords quarterly. If you don't have WebProfit account, click "New User".
Step 3
Click .

Copyright 2014 © Internovus Bulgaria. All rights reserved.
To start a Live chat with a highly skilled Forex expert, click the button. The followingwindow appears :
Figure 2. Live chat window
Fill in the required information and click the button.
To Contact by phone a highly skilled Forex expert, click the button. The following screenappears :

Copyright 2014 © Internovus Bulgaria. All rights reserved.
Figure 3. Call me back window
Fill in the required information and click the button. You will receive a phone callfrom an agent within 48 hours.
Note: Select a preferred contact time from the drop -down list.
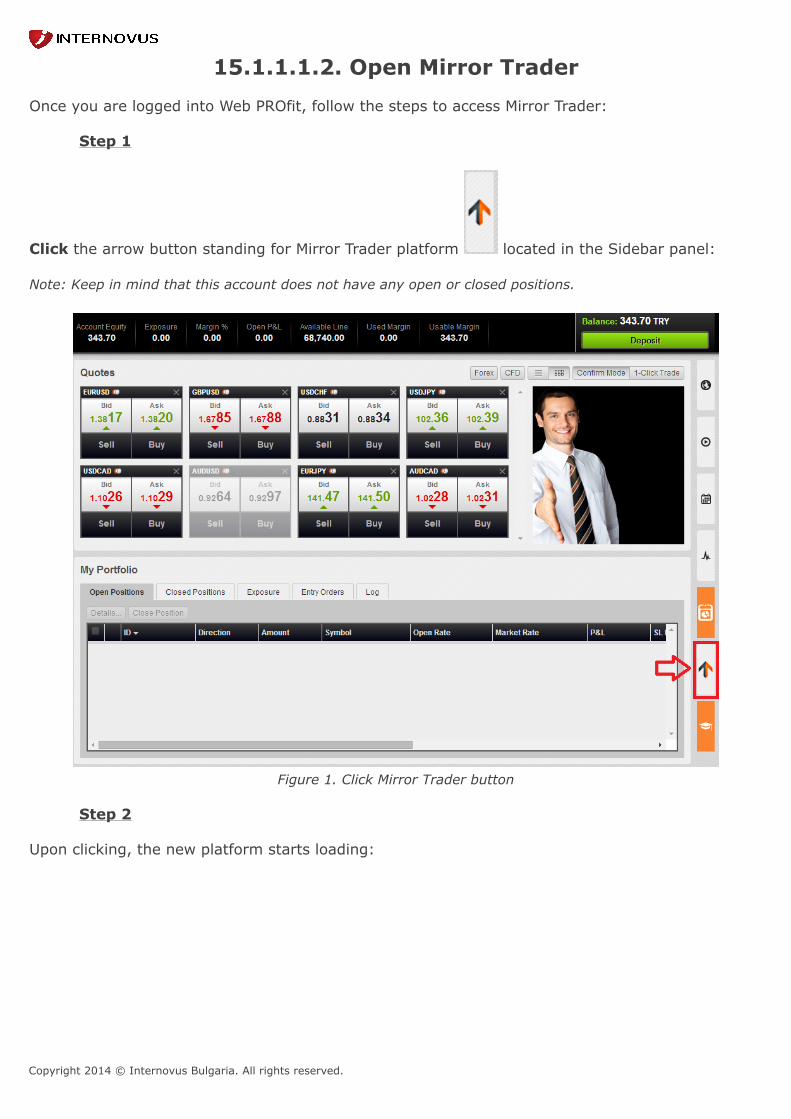
Copyright 2014 © Internovus Bulgaria. All rights reserved.
15.1.1.1.2. Open Mirror Trader Once you are logged into Web PROfit, follow the steps to access Mirror Trader:
Step 1
Click the arrow button standing for Mirror Trader platform located in the Sidebar panel: Note: Keep in mind that this account does not have any open or closed positions.
Figure 1. Click Mirror Trader button
Step 2
Upon clicking, the new platform starts loading:
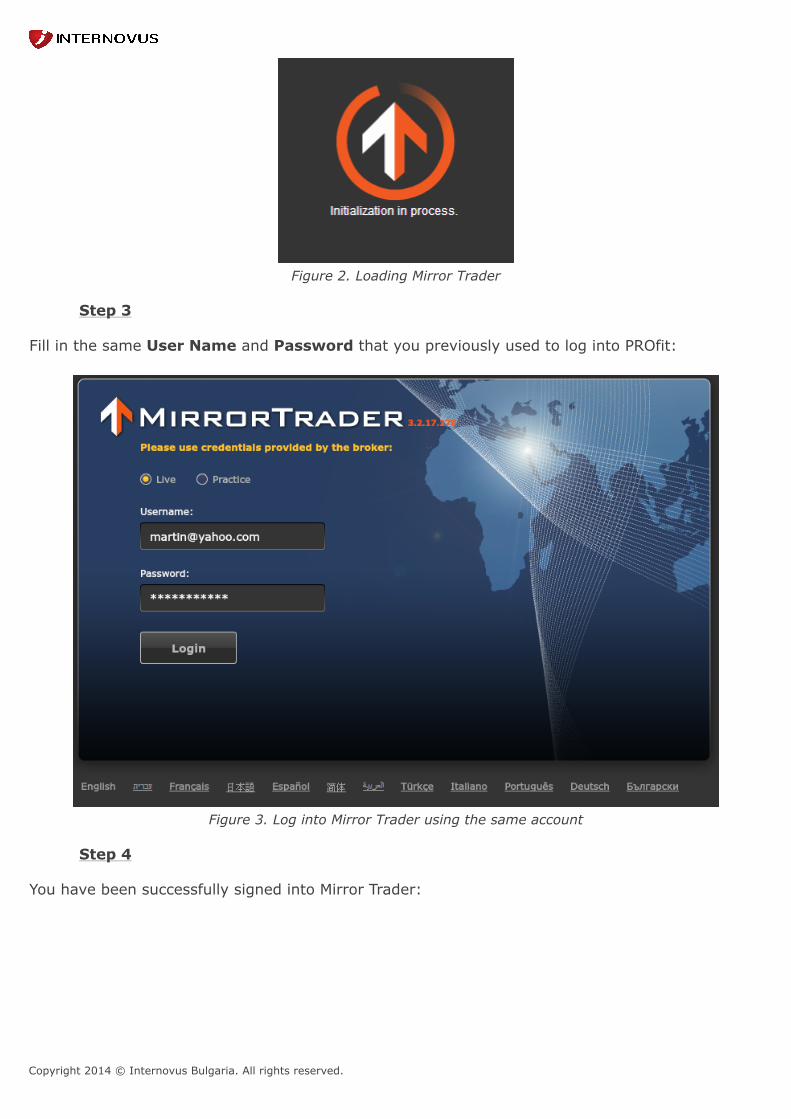
Copyright 2014 © Internovus Bulgaria. All rights reserved.
Figure 2. Loading Mirror Trader
Step 3 Fill in the same User Name and Password that you previously used to log into PROfit:
Figure 3. Log into Mirror Trader using the same account
Step 4
You have been successfully signed into Mirror Trader:
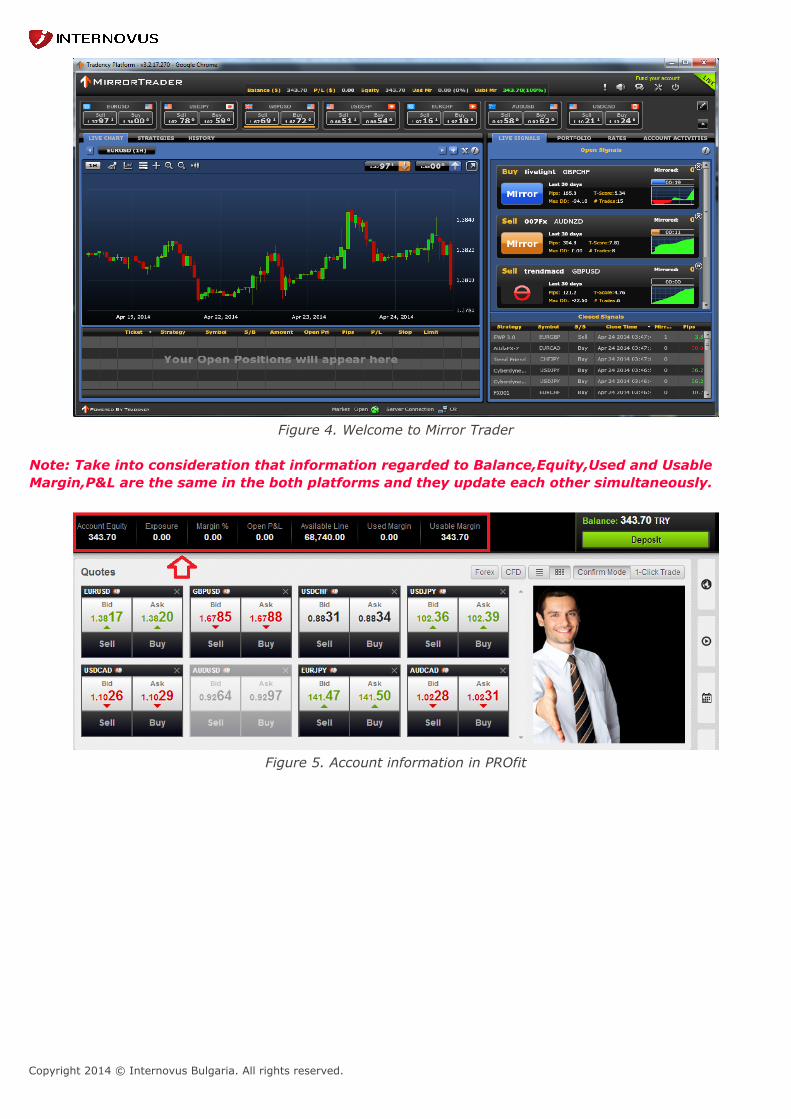
Copyright 2014 © Internovus Bulgaria. All rights reserved.
Figure 4. Welcome to Mirror Trader
Note: Take into consideration that information regarded to Balance,Equity,Used and UsableMargin,P&L are the same in the both platforms and they update each other simultaneously.
Figure 5. Account information in PROfit
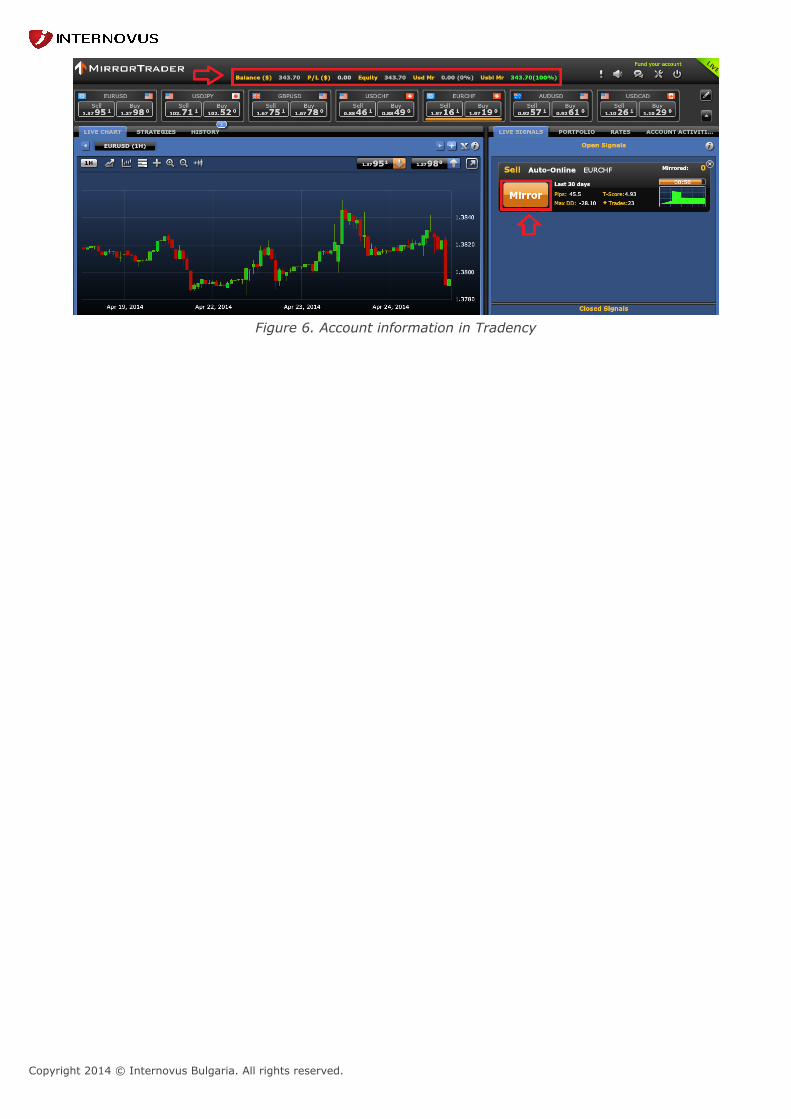
Copyright 2014 © Internovus Bulgaria. All rights reserved.
Figure 6. Account information in Tradency
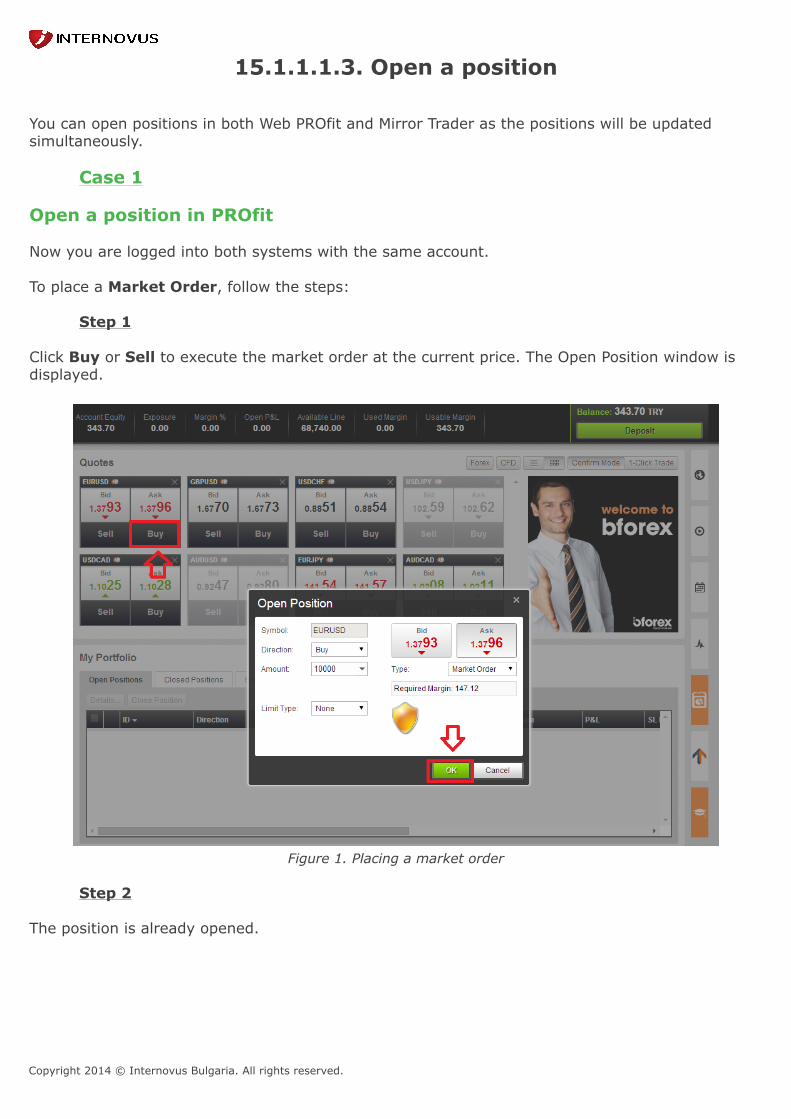
Copyright 2014 © Internovus Bulgaria. All rights reserved.
15.1.1.1.3. Open a position You can open positions in both Web PROfit and Mirror Trader as the positions will be updatedsimultaneously.
Case 1 Open a position in PROfit Now you are logged into both systems with the same account. To place a Market Order, follow the steps:
Step 1 Click Buy or Sell to execute the market order at the current price. The Open Position window isdisplayed.
Figure 1. Placing a market order
Step 2 The position is already opened.

Copyright 2014 © Internovus Bulgaria. All rights reserved.
Figure 2. Open a position
Step 3
Have a look at the Open Positions tab where the new position is shown:
Figure 3. Open positions
Consequently, navigate to Mirror Trader and notice that the same position is visible there as well: Note: Position ID and Ticket are identical.
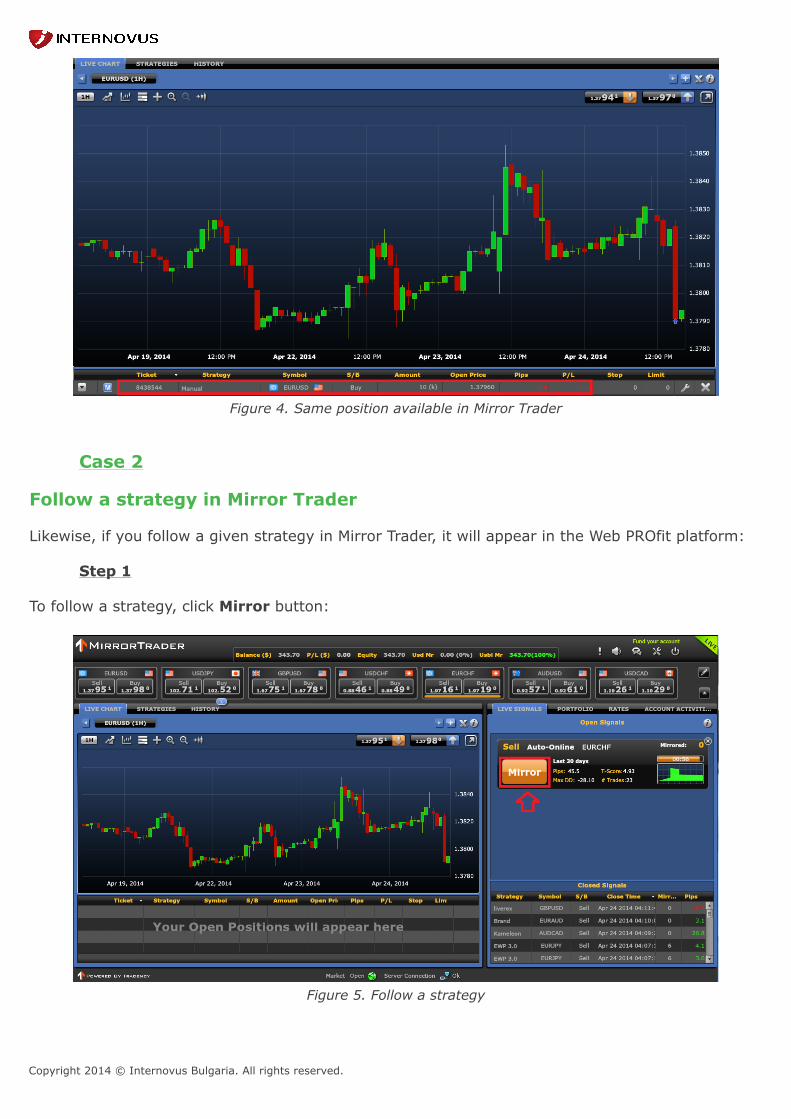
Copyright 2014 © Internovus Bulgaria. All rights reserved.
Figure 4. Same position available in Mirror Trader
Case 2
Follow a strategy in Mirror Trader Likewise, if you follow a given strategy in Mirror Trader, it will appear in the Web PROfit platform:
Step 1
To follow a strategy, click Mirror button:
Figure 5. Follow a strategy

Copyright 2014 © Internovus Bulgaria. All rights reserved.
Step 2
Set the amount you would like to trade:
Figure 6. Set an amount
Then, the market order is sent to execution:
Figure 7. Order execution
Step 3
Have a look at the position details:
Figure 8. Position details
Step 4
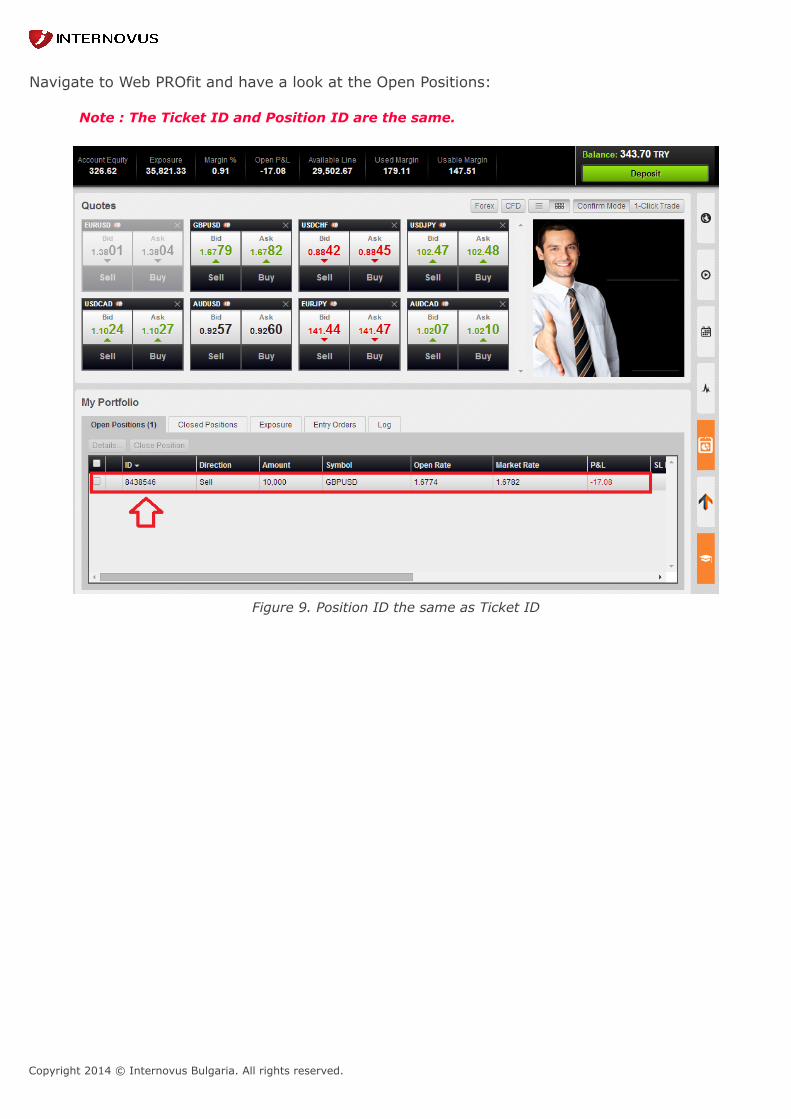
Copyright 2014 © Internovus Bulgaria. All rights reserved.
Navigate to Web PROfit and have a look at the Open Positions:
Note : The Ticket ID and Position ID are the same.
Figure 9. Position ID the same as Ticket ID
Copyright 2014 © Internovus Bulgaria. All rights reserved.
15.1.1.2. Live Chart
Note: Live Chart section is the equivalent of Open Positions in Web PROfit. The "Live Chart" section provides a complete trading workspace, with live charts of varioussymbols and advanced analysis tools. You can switch time frames, select your preferred chart typeand use oscillators and chart studies. You can open and view live charts of all the currency ratesavailable in the Mirror Trader and easily switch between one pair to another. You may open manualpositions by clicking on the rate box at top right hand corner of the chart area.
The Mirror Trader provides traders with various analytic tools for analyzing the charts:
• Time Frames: choose the time frames of the candlesticks in the chart
• Oscillators and chart studies
• Different chart types: Candlestick, line and OHCL
• Sentiments
• Drag chart / Cross
• Zoom in / out
• Glue to right – move the chart to the right (current time)
You can also see the “buy” and “sell” rates of the symbol .You can open a manual position by clicking the rates on the chart area, or on the one of the ratesin the Mirror Trader’s header.
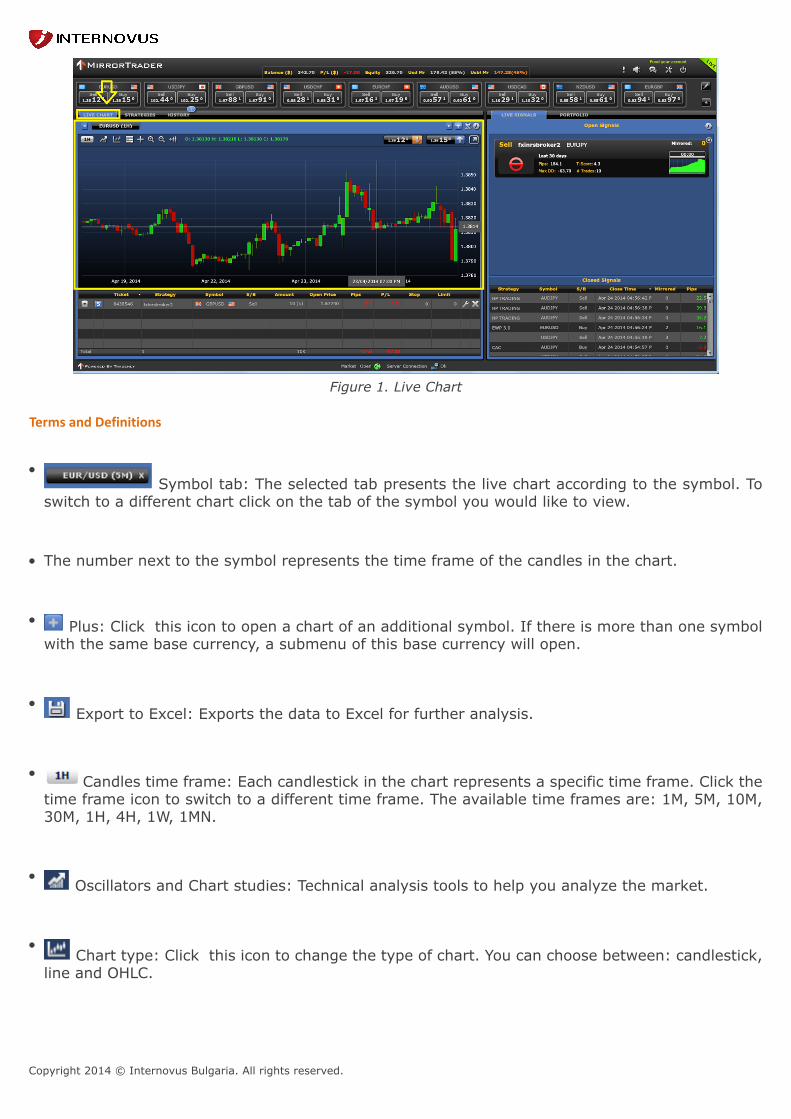
Copyright 2014 © Internovus Bulgaria. All rights reserved.
Figure 1. Live Chart
Terms and Definitions
• Symbol tab: The selected tab presents the live chart according to the symbol. To
switch to a different chart click on the tab of the symbol you would like to view.
• The number next to the symbol represents the time frame of the candles in the chart.
• Plus: Click this icon to open a chart of an additional symbol. If there is more than one symbolwith the same base currency, a submenu of this base currency will open.
• Export to Excel: Exports the data to Excel for further analysis.
• Candles time frame: Each candlestick in the chart represents a specific time frame. Click thetime frame icon to switch to a different time frame. The available time frames are: 1M, 5M, 10M,30M, 1H, 4H, 1W, 1MN.
• Oscillators and Chart studies: Technical analysis tools to help you analyze the market.
• Chart type: Click this icon to change the type of chart. You can choose between: candlestick,
line and OHLC.
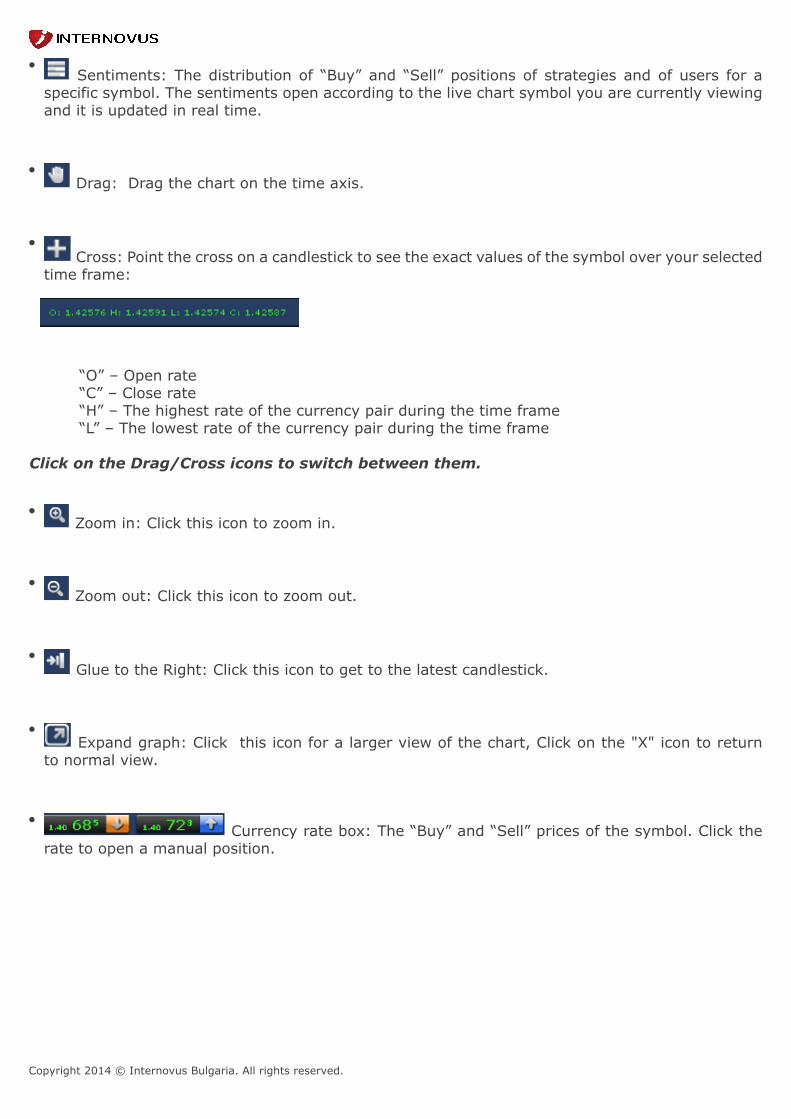
Copyright 2014 © Internovus Bulgaria. All rights reserved.
• Sentiments: The distribution of “Buy” and “Sell” positions of strategies and of users for a
specific symbol. The sentiments open according to the live chart symbol you are currently viewingand it is updated in real time.
• Drag: Drag the chart on the time axis.
• Cross: Point the cross on a candlestick to see the exact values of the symbol over your selected
time frame:
“O” – Open rate“C” – Close rate“H” – The highest rate of the currency pair during the time frame“L” – The lowest rate of the currency pair during the time frame
Click on the Drag/Cross icons to switch between them.
• Zoom in: Click this icon to zoom in.
• Zoom out: Click this icon to zoom out.
• Glue to the Right: Click this icon to get to the latest candlestick.
• Expand graph: Click this icon for a larger view of the chart, Click on the "X" icon to return
to normal view.
• Currency rate box: The “Buy” and “Sell” prices of the symbol. Click the
rate to open a manual position.

Copyright 2014 © Internovus Bulgaria. All rights reserved.
15.1.1.3. Open Position Mirror TraderThe Open Positions list contains details of all the open positions and entry orders in your tradingaccount.
Notes:When you mirror a signal of a strategy and the strategy provider closed the signal, an envelope
will be added to the “ ” icon, to indicate that the strategy provider already closed the signal youhave mirrored.
You can drag the upper border of the open positions section, to increase or decrease its area.(Increasing the open positions area will decrease the live chart area and vice versa)
The stop and limit values can be modified after the position is opened by you or by the strategyprovider. The more conservative stop or limit value will be honored (for Stops, this is the lowerpips delta; for Limits, this is the higher pips delta).
If you close a position that was sent by a strategy provider, before the strategy provider sends anorder to close the position, your closing order will be honored. The strategy provider'sclosing orderwill not open a new trade in the opposite direction.
Figure 1. Open Positions
• Position Type: This icon represents whether the position was opened automatically by a strategy
( ), Mirrored from a signal ( ) or opened manually ( ).
• Ticket: A trade’s identification number.
• Strategy: Generic strategy name. When a manual position is opened, its name is “Manual.”
• Symbol: Traded currency pair.
• S/B: A ”Sell” or “Buy” order. For entry orders: “Sell limit”, “Sell stop”, “Buy limit” and “Buy stop”.
• Amount (k): A trade’s size in multiples of 1,000 currency units (e.g. 100k= 100,000 currencyunits=1 lot; 10k= 10,000 currency units=1 mini lot).

Copyright 2014 © Internovus Bulgaria. All rights reserved.
• Open Price: The price received when a position was opened.
• Pips: Net pips accumulated for each open position.
• P/L: Profit or Loss (in account currency terms) accumulated for each open position.
• Stop: The price level at which a trade will be sent to market and closed (to protect it from furtherlosses).
• Limit: The price level at which a trade will be sent to market and closed (to lock in profits).
• Modify position: Click on this icon to set stop and limit values to the position.
• Close position: Click on this icon to close the position manually.
• Arrow icon: Click on this icon to view a position's rollover, commission, last price and open
time.
• Rollover: The amount credited or debited to your account for trades held overnight (5:00 p.m.EST) due to different interest rates between the currencies.
• Last Price: The current updated price of the open position.
• Open Time: The date and time when a position was opened.
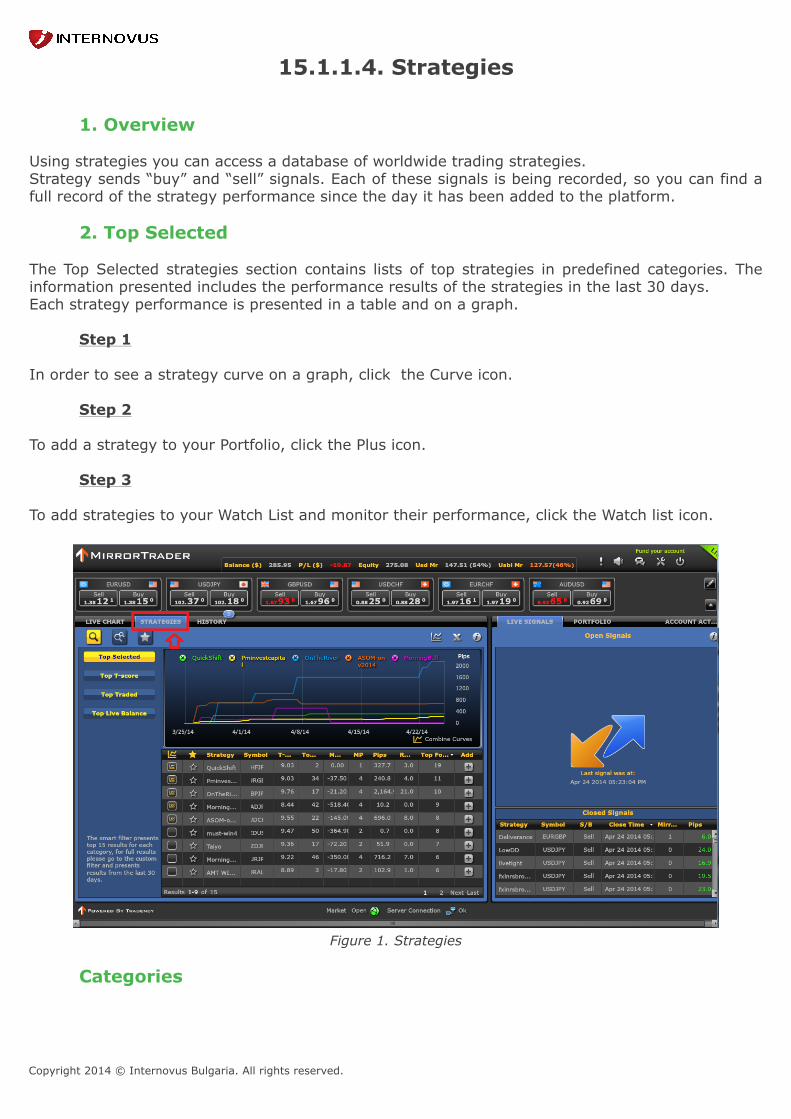
Copyright 2014 © Internovus Bulgaria. All rights reserved.
15.1.1.4. Strategies
1. Overview
Using strategies you can access a database of worldwide trading strategies.Strategy sends “buy” and “sell” signals. Each of these signals is being recorded, so you can find afull record of the strategy performance since the day it has been added to the platform.
2. Top Selected
The Top Selected strategies section contains lists of top strategies in predefined categories. Theinformation presented includes the performance results of the strategies in the last 30 days.Each strategy performance is presented in a table and on a graph.
Step 1
In order to see a strategy curve on a graph, click the Curve icon.
Step 2
To add a strategy to your Portfolio, click the Plus icon.
Step 3
To add strategies to your Watch List and monitor their performance, click the Watch list icon.
Figure 1. Strategies
Categories
Copyright 2014 © Internovus Bulgaria. All rights reserved.
Top Selected: Top 15 strategies which has the highest number of followers (live+ demo) over the last 30 days.
Top T-Score: Top 15 strategies with the highest T-Score over the last 30 days.
Top Traded: Top 15 strategies which had the highest number of live Trades (live+ demo) during the last 30 days.
Top Balance: Top 15 strategies which had the highest amount of balance placedby users (live) during the last 30 days.
Table Columns
“Curve” Icon: A Strategy's P/L Curve (Profits and Losses Curve) displays a graph plot of totaltrading performance for the selected time frame. You can place up to 5 strategies on the graph. Toremove a strategy curve from the graph, click on the left hand icon associated with the strategy.To add a strategy curve to graph, simply click on the “Curve” icon.
“Watch list” Icon: Click on this icon to add strategies to your “Watch List” for future reference. Strategy: Generic strategy name. Symbol: Traded currency pair.
T-score Rating System: The T-score is a number between 0 and 10 summarizes a strategy’sperformance over time, while taking into account to the strategy's current momentum. The T-scorehas 3 building blocks: Long term stability, short term momentum and activity. A Strategy’s T-score appears as ‘N/A’ when it has not yet reached 50 trades—that is, when Tradency does not yethave enough information to rate it. Total trades: The total number of trades opened and closed during the selected time frame.MDD%: Maximum “Draw Down” in percentage terms, calculated using your "Start Balance,"“Trade Size” and “Time Frame.” The strategies shown here have not had losses greater than youracceptable trading criteria. MP (Max Positions): The number of open positions that a strategy may trade simultaneouslyfor a currency pair. The MP is determined by the strategy. For example, an MP of 4 means thatthe strategy may trade 4 positions at the same time. Hence, if your trade size is 10k you mightactually have 4 positions trading 10K each, for a total of 40k. Pips: Net pips earned or lost by the strategy during the selected time frame. Followers: The number of users (live + demo) that added the strategy to their portfolio in the last30 days. Balance: The amount of balance placed on a strategy by users (live) during the last 30 days.
Add Strategy: Click on the “Plus” icon to add a strategy to your portfolio.
Copyright 2014 © Internovus Bulgaria. All rights reserved.
When adding a strategy, you should set the amount (k) which determines the lot size of the positionsopened by this strategy from now on.
Advanced
Pause Strategy: A price level (in account currency terms) in which a strategy will be automaticallyinactivated, when the sum of its losses (based on close positions only) meets your comfort level. Stop: A price level (in pips) in which each of the strategy’s positions will be automatically closed,to protect it from further losses. Limit: A price level (in pips) in which each of the strategy’s positions will be automatically closed,to lock in profits.
Additional Functions
Export to Excel: Exports the data to Excel for further analysis.
Display Mode: Allows you to change the display mode to table only, graph only, or both. Notes & Tips
The period of time that the graph and past performance table refers to is last 30 Days and cannotbe changed. Max Positions have a direct effect on your portfolio exposure, as a strategy may hold several openpositions and therefore increase your actual trading leverage (exposure). Clicking the strategy name opens the strategy card, where you can find detailed information aboutits trading history. You can view a combination of up to 5 strategies in the Graph display. Use this feature in order tofind the best strategies and/or combinations for your portfolio. As soon as a strategy is added to your portfolio, its new trades will be automatically placed inyour account. It might take some time for a strategy to open a trade after being added to yourportfolio. Positions opened by the strategies will be closed by the strategy as well. However you can closeeach position manually from the “open positions” list (in the live chart section). When the strategy reaches the Pause level you provided, it is automatically inactivated. Thestrategy will stay in the portfolio, but new positions opened by it will not be executed in theaccount. Other open positions remain open until a closing signal is sent by the strategy or yourself. The Pause level is an approximate value, since it only takes into account the closed positions of thestrategy, while open positions remain open. When the strategy closes the open positions, they willnot necessarily meet the exact value set as the ‘Pause’ level. The Pause level refers to the sum of all the strategy’s positions, while the ‘Stop’ and ‘Limit’ valuesrefers to each single position of the strategy. Use Custom Filter to filter and sort the strategies by your chosen criteria.

Copyright 2014 © Internovus Bulgaria. All rights reserved.
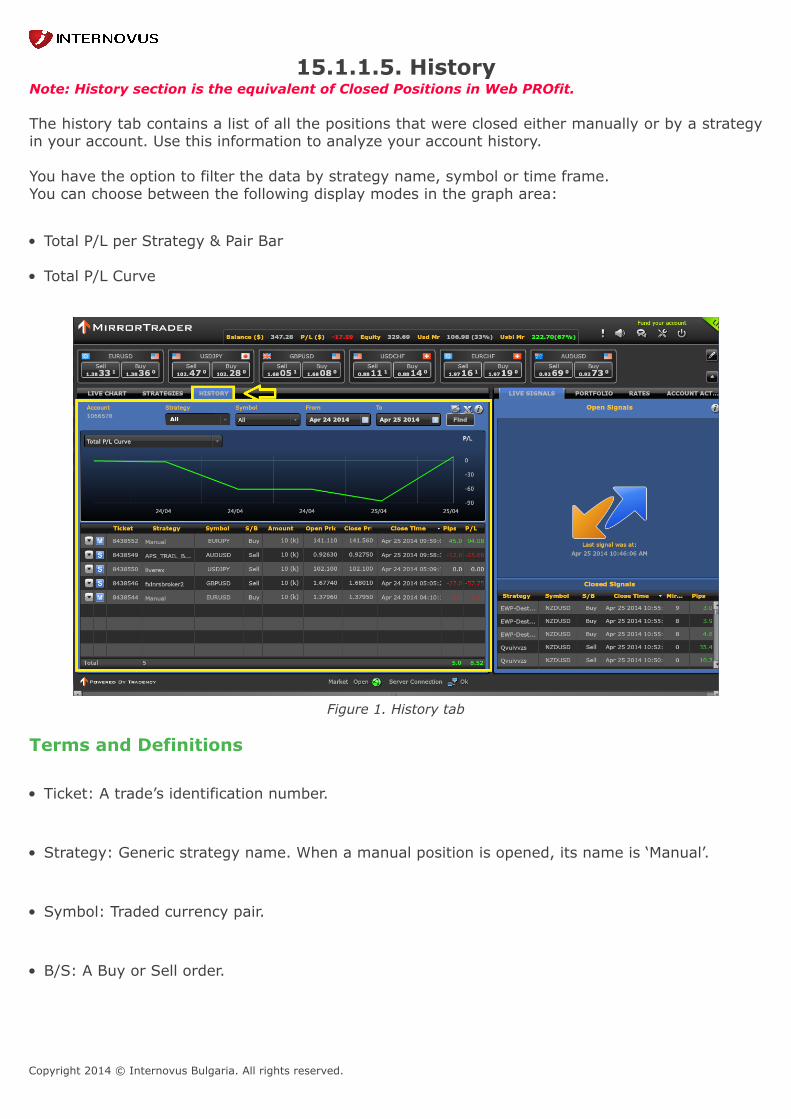
Copyright 2014 © Internovus Bulgaria. All rights reserved.
15.1.1.5. HistoryNote: History section is the equivalent of Closed Positions in Web PROfit. The history tab contains a list of all the positions that were closed either manually or by a strategyin your account. Use this information to analyze your account history.
You have the option to filter the data by strategy name, symbol or time frame.You can choose between the following display modes in the graph area:
• Total P/L per Strategy & Pair Bar
• Total P/L Curve
Figure 1. History tab
Terms and Definitions
• Ticket: A trade’s identification number.
• Strategy: Generic strategy name. When a manual position is opened, its name is ‘Manual’.
• Symbol: Traded currency pair.
• B/S: A Buy or Sell order.
Copyright 2014 © Internovus Bulgaria. All rights reserved.
• Amount (k): A trade’s size in multiples of 1,000 currency units (e.g. 100k= 100,000 currencyunits=1 lot; 10k= 10,000 currency units=1 mini lot).
• Open Price: The price received when a position has been opened.
• Close price: The price received when the position has been closed.
• Close Time: The date and time when a position has been closed.
• Pips: The Net pips accumulated for each closed position.
• P/L: Profit or Loss (in account currency terms) accumulated for each closed position.
• Arrow icon: Click this icon to view a position's rollover, commission, last price and open time.
• Rollover: The Amount credited or debited to your account for trades held overnight (5:00 p.m.EST) due to different interest rates between the currencies.
• Stop: A price level at which a trade will be automatically closed, to protect it from further losses.
• Limit: A price level at which a trade will be automatically closed, to lock in profits.
• Commission: The commission fee for each closed position.
• Open Time: The date and time when a position was opened.
Additional Functions
Export to Excel: Exports the data to excel for further analysis.
Publisher: Publish your history link to Facebook , Linkedin and Twitter or copy its URL.
Notes & Tips
Use “Closed Positions” data to analyze your account history. You can filter the data by strategiesand find out which strategy worked best for you.To change the display mode, choose the preferred display from the left hand corner of the graph.
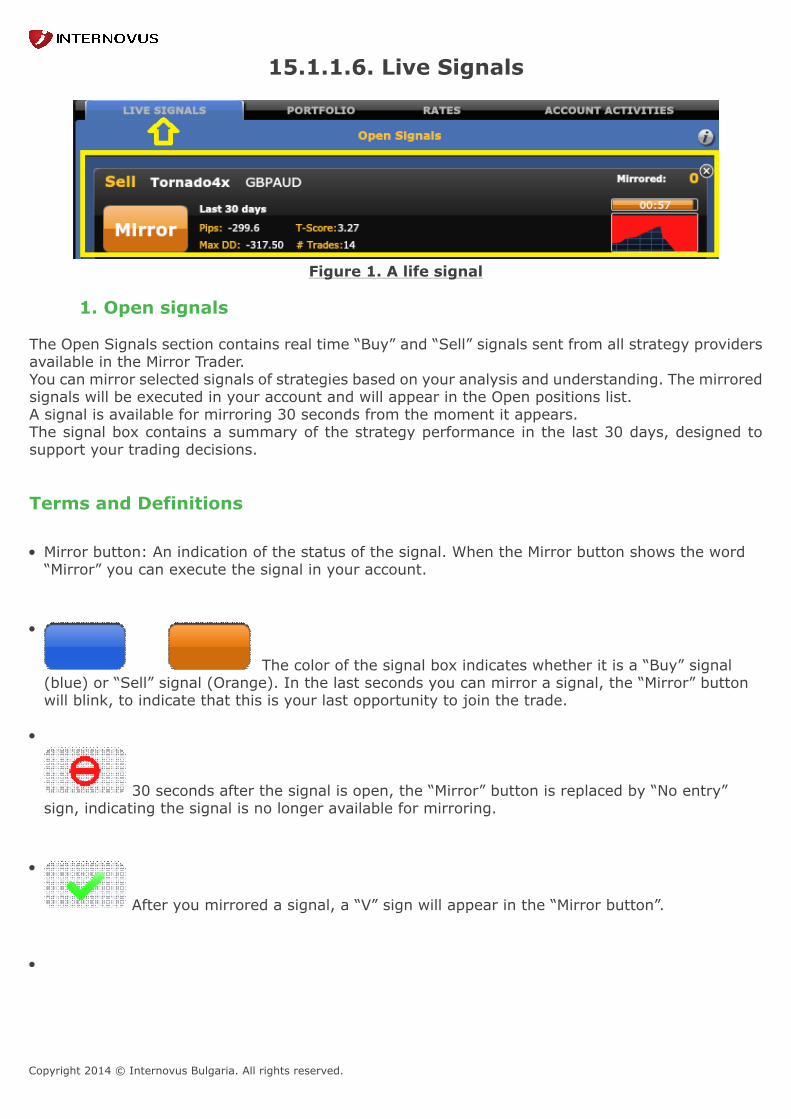
Copyright 2014 © Internovus Bulgaria. All rights reserved.
15.1.1.6. Live Signals
Figure 1. A life signal
1. Open signals The Open Signals section contains real time “Buy” and “Sell” signals sent from all strategy providersavailable in the Mirror Trader.You can mirror selected signals of strategies based on your analysis and understanding. The mirroredsignals will be executed in your account and will appear in the Open positions list.A signal is available for mirroring 30 seconds from the moment it appears.The signal box contains a summary of the strategy performance in the last 30 days, designed tosupport your trading decisions. Terms and Definitions
• Mirror button: An indication of the status of the signal. When the Mirror button shows the word“Mirror” you can execute the signal in your account.
•
The color of the signal box indicates whether it is a “Buy” signal(blue) or “Sell” signal (Orange). In the last seconds you can mirror a signal, the “Mirror” buttonwill blink, to indicate that this is your last opportunity to join the trade.
•
30 seconds after the signal is open, the “Mirror” button is replaced by “No entry”sign, indicating the signal is no longer available for mirroring.
•
After you mirrored a signal, a “V” sign will appear in the “Mirror button”.
•

Copyright 2014 © Internovus Bulgaria. All rights reserved.
If a signal is opened by a strategy that is already active in your portfolio, the signalbox will display the automation icon (A) with a “V” sign to indicate the specific signal wasexecuted automatically in your account.
•
In the times no new signals are opened by the strategies, the “Open Signals” sectionwill be empty and you will see the time and date of the latest signal.
• Buy / Sell: A Buy or Sell order.
• Strategy: Generic name of the strategy that opened the signal.
• Symbol: The currency pair the signal refers to.
• Time frame: The period of time that the graph and past performance results refer to. (The timeframe is Last 30 Days and it cannot be changed.)
• Pips: The number of pips gained or lost by a strategy during the last 30 days.•
T-score Rating System: A unique Tradency scoring method, operating on a scale of 1 to10, which indicates strategies’ stability and relevance to current market conditions and takesinto consideration strategies’ risk and reward. A Strategy’s T-score is zero when it has not yetreached 50 trades—that is, when Tradency does not yet have enough information to rate it.
• *The T-Score displayed in the “Signal box” is the current T-Score of the strategy.
• Max DD: (Maximum Draw Down): The worst losing sequence of the strategy in pips (the largestdrop from net balance peak to net balance valley).
• Countdown bar: An indication of the time left to mirror the signal.
• Number of “followers”: The number of users who “Mirrored” the signal (Whetherin automatic or semi automatic mode). This number is updated in real time during the time thesignal is available for mirroring
•
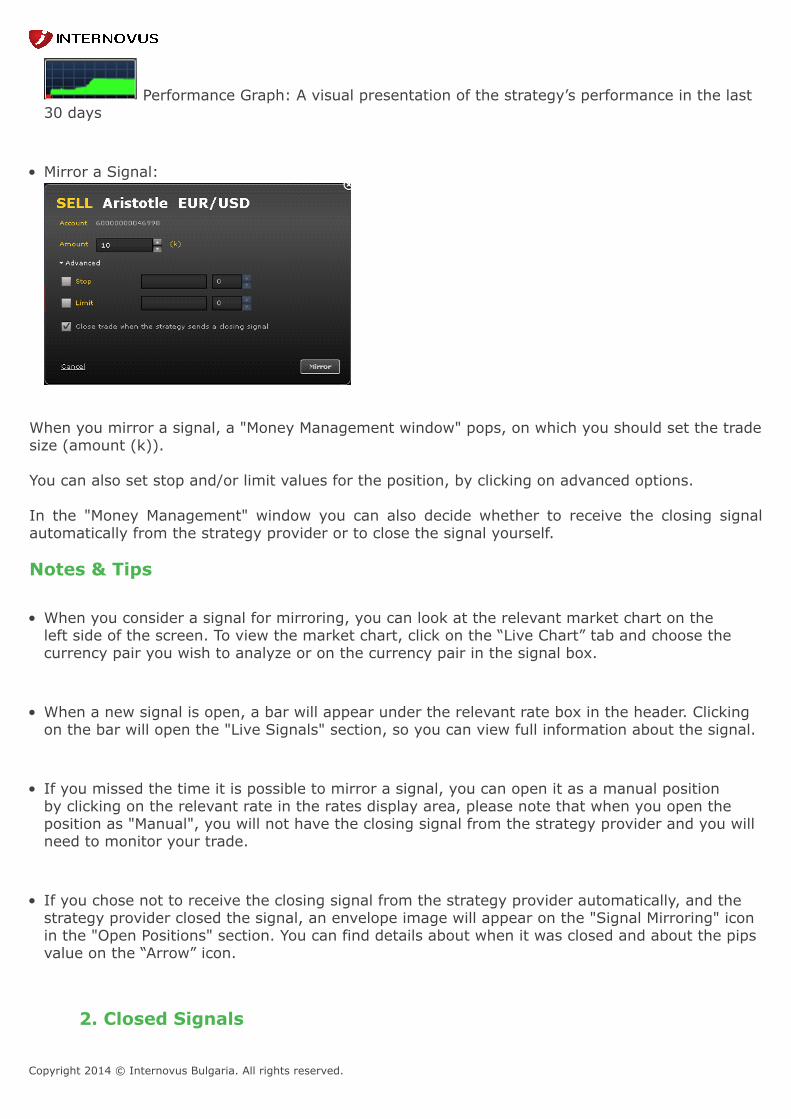
Copyright 2014 © Internovus Bulgaria. All rights reserved.
Performance Graph: A visual presentation of the strategy’s performance in the last30 days
• Mirror a Signal:
When you mirror a signal, a "Money Management window" pops, on which you should set the tradesize (amount (k)). You can also set stop and/or limit values for the position, by clicking on advanced options. In the "Money Management" window you can also decide whether to receive the closing signalautomatically from the strategy provider or to close the signal yourself.
Notes & Tips
• When you consider a signal for mirroring, you can look at the relevant market chart on theleft side of the screen. To view the market chart, click on the “Live Chart” tab and choose thecurrency pair you wish to analyze or on the currency pair in the signal box.
• When a new signal is open, a bar will appear under the relevant rate box in the header. Clickingon the bar will open the "Live Signals" section, so you can view full information about the signal.
• If you missed the time it is possible to mirror a signal, you can open it as a manual positionby clicking on the relevant rate in the rates display area, please note that when you open theposition as "Manual", you will not have the closing signal from the strategy provider and you willneed to monitor your trade.
• If you chose not to receive the closing signal from the strategy provider automatically, and thestrategy provider closed the signal, an envelope image will appear on the "Signal Mirroring" iconin the "Open Positions" section. You can find details about when it was closed and about the pipsvalue on the “Arrow” icon.
2. Closed Signals
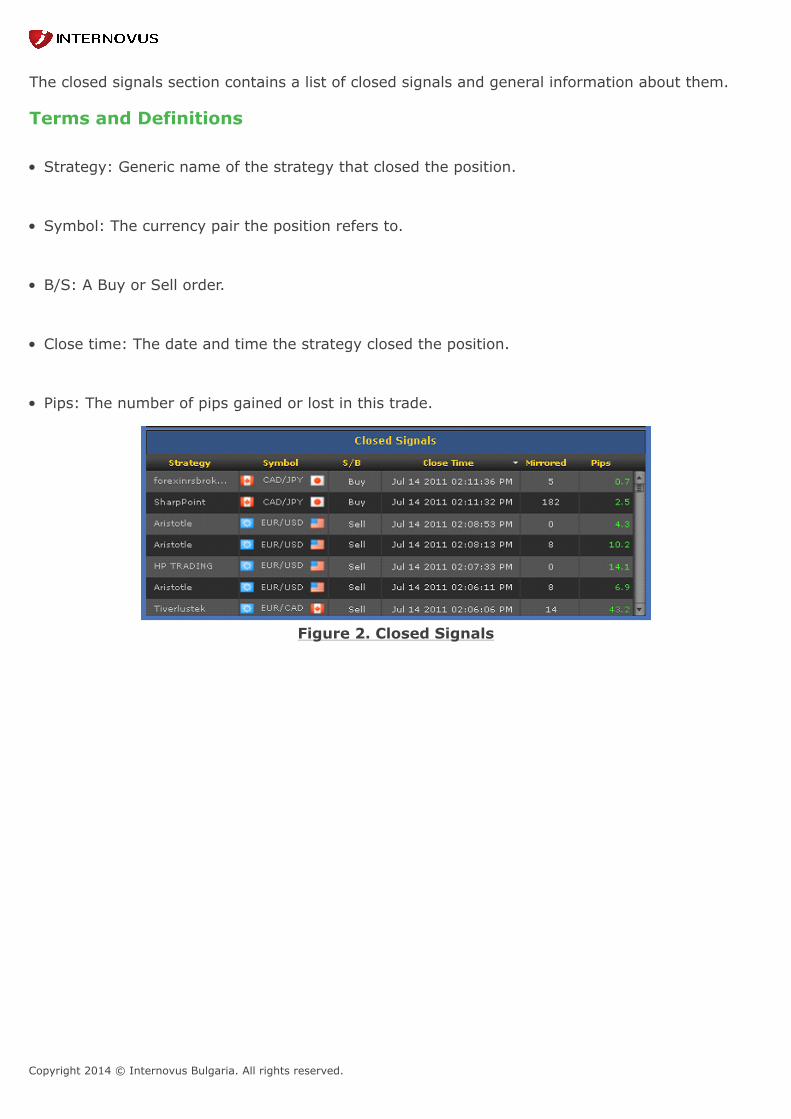
Copyright 2014 © Internovus Bulgaria. All rights reserved.
The closed signals section contains a list of closed signals and general information about them. Terms and Definitions
• Strategy: Generic name of the strategy that closed the position.
• Symbol: The currency pair the position refers to.
• B/S: A Buy or Sell order.
• Close time: The date and time the strategy closed the position.
• Pips: The number of pips gained or lost in this trade.
Figure 2. Closed Signals

Copyright 2014 © Internovus Bulgaria. All rights reserved.
15.1.1.7. Portfolio
1. Overview Your Trading Portfolio consists all the strategies you have chosen to trade in your account. Thestrategies providers send “buy” and “sell” signals according to their rules and understanding of themarket. When a strategy is added to your portfolio, every signal it sends (open, close or modify) willbe automatically executed in your account.
Step 1
Control the activation of a strategy by checking and checking out the box next to the strategy name.
Step 2
Once you have a strategy, by clicking the modify icon you can:
• Edit the trade size
• Pause level
• Stop and limit levels
Step 3
To remove a strategy from your portfolio, click the “X” sign.
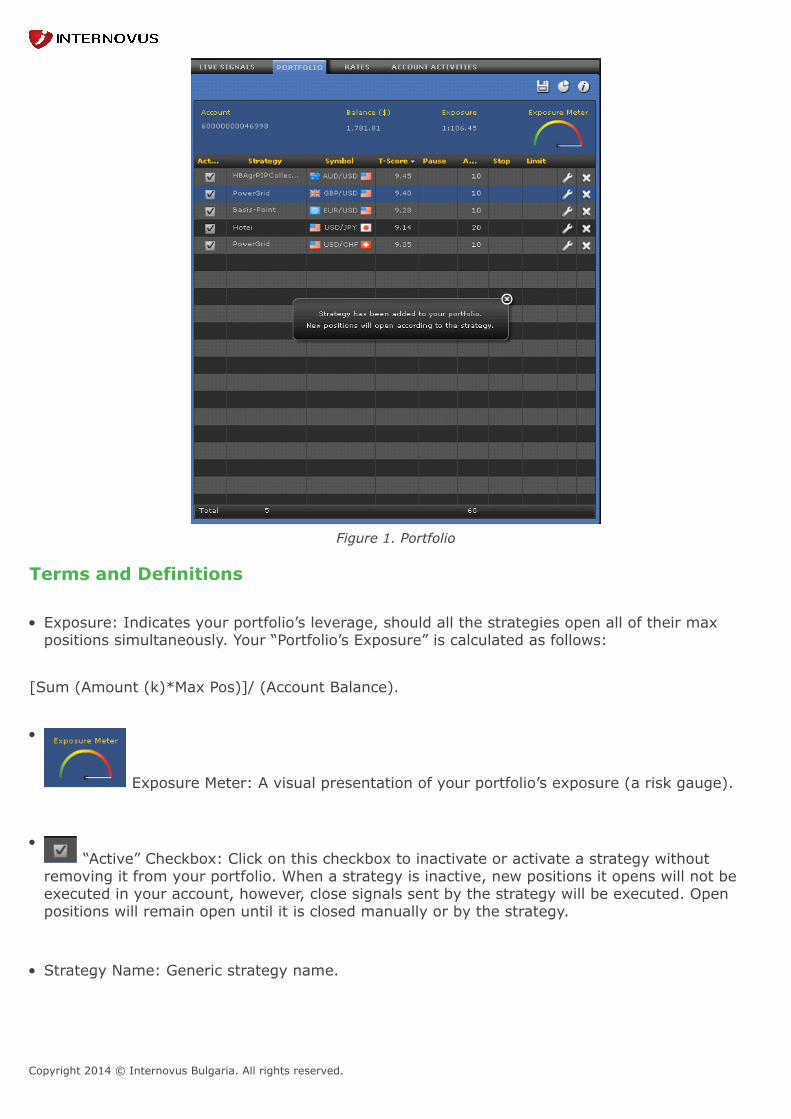
Copyright 2014 © Internovus Bulgaria. All rights reserved.
Figure 1. Portfolio
Terms and Definitions
• Exposure: Indicates your portfolio’s leverage, should all the strategies open all of their maxpositions simultaneously. Your “Portfolio’s Exposure” is calculated as follows:
[Sum (Amount (k)*Max Pos)]/ (Account Balance).
•
Exposure Meter: A visual presentation of your portfolio’s exposure (a risk gauge).
• “Active” Checkbox: Click on this checkbox to inactivate or activate a strategy without
removing it from your portfolio. When a strategy is inactive, new positions it opens will not beexecuted in your account, however, close signals sent by the strategy will be executed. Openpositions will remain open until it is closed manually or by the strategy.
• Strategy Name: Generic strategy name.
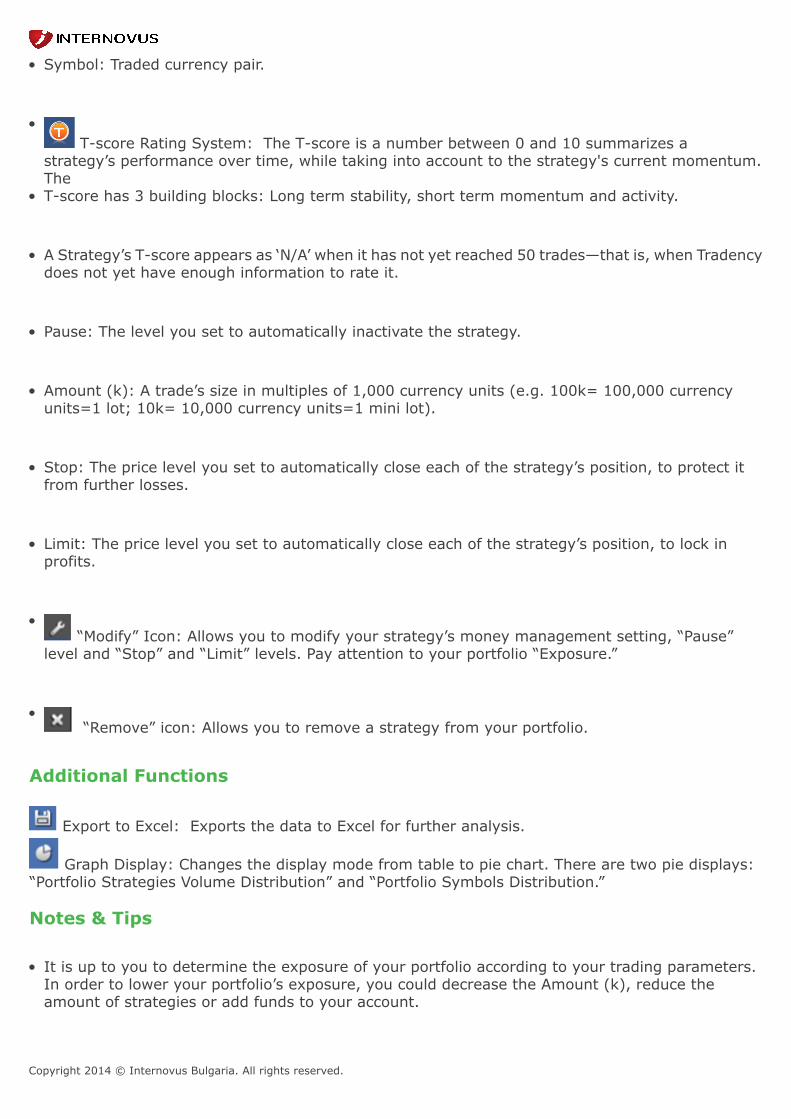
Copyright 2014 © Internovus Bulgaria. All rights reserved.
• Symbol: Traded currency pair.
• T-score Rating System: The T-score is a number between 0 and 10 summarizes a
strategy’s performance over time, while taking into account to the strategy's current momentum.The
• T-score has 3 building blocks: Long term stability, short term momentum and activity.
• A Strategy’s T-score appears as ‘N/A’ when it has not yet reached 50 trades—that is, when Tradencydoes not yet have enough information to rate it.
• Pause: The level you set to automatically inactivate the strategy.
• Amount (k): A trade’s size in multiples of 1,000 currency units (e.g. 100k= 100,000 currencyunits=1 lot; 10k= 10,000 currency units=1 mini lot).
• Stop: The price level you set to automatically close each of the strategy’s position, to protect itfrom further losses.
• Limit: The price level you set to automatically close each of the strategy’s position, to lock inprofits.
• “Modify” Icon: Allows you to modify your strategy’s money management setting, “Pause”
level and “Stop” and “Limit” levels. Pay attention to your portfolio “Exposure.”
• “Remove” icon: Allows you to remove a strategy from your portfolio.
Additional Functions
Export to Excel: Exports the data to Excel for further analysis.
Graph Display: Changes the display mode from table to pie chart. There are two pie displays:“Portfolio Strategies Volume Distribution” and “Portfolio Symbols Distribution.”
Notes & Tips
• It is up to you to determine the exposure of your portfolio according to your trading parameters.In order to lower your portfolio’s exposure, you could decrease the Amount (k), reduce theamount of strategies or add funds to your account.

Copyright 2014 © Internovus Bulgaria. All rights reserved.
• Do not confuse your “Portfolio Exposure” with the maximum amount of leverage that your brokeris willing to offer.
• Pay attention to the “Exposure Meter.” This risk gauge operates on a scale of 0-100, withanything over 80 (red zone) considered excessive.
• As soon as a strategy is added to your portfolio, its new trades will be automatically placed inyour account. It might take some time for a strategy to open a trade after being added to yourportfolio.
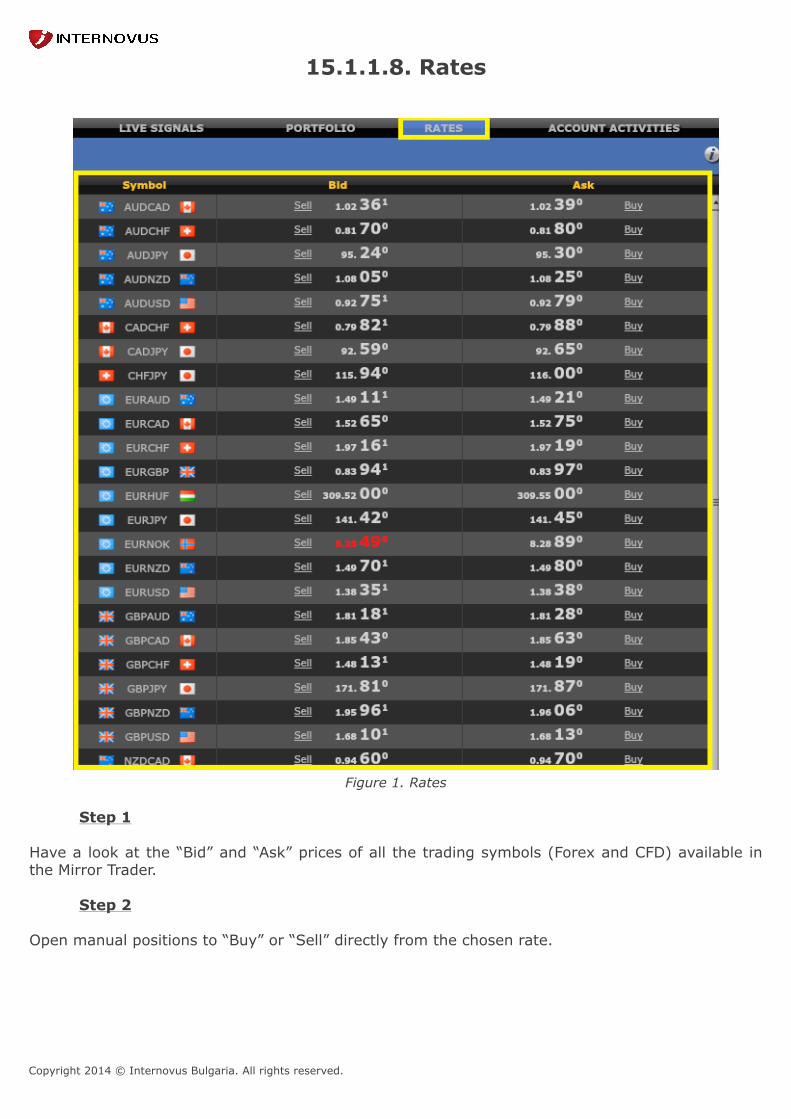
Copyright 2014 © Internovus Bulgaria. All rights reserved.
15.1.1.8. Rates
Figure 1. Rates
Step 1
Have a look at the “Bid” and “Ask” prices of all the trading symbols (Forex and CFD) available inthe Mirror Trader.
Step 2
Open manual positions to “Buy” or “Sell” directly from the chosen rate.

Copyright 2014 © Internovus Bulgaria. All rights reserved.
Figure 2. Sell Manual
Step 3
To view a live chart of a symbol, simply click the symbol you wish to see.
Step 4
You can also open a manual position by clicking a rate in the rates display at the header or the ratebox in the live chart area.
Notes & Tips
• You can choose which rates will be shown in the rates display (on the top of the screen) byclicking on the “Rates Setting” icon. The number of rates you can display is determined by yourscreen resolution.
• Stops and Limits can be placed while opening a position. In addition, you may modify the Stopsand Limits for any “Order” or “Open Position" by clicking on the "modify" icon. When modifyingStops or Limits for a strategy's position the more conservative modification will be honored (forStops, this is the lower pips delta; for Limits, this the higher pips delta).
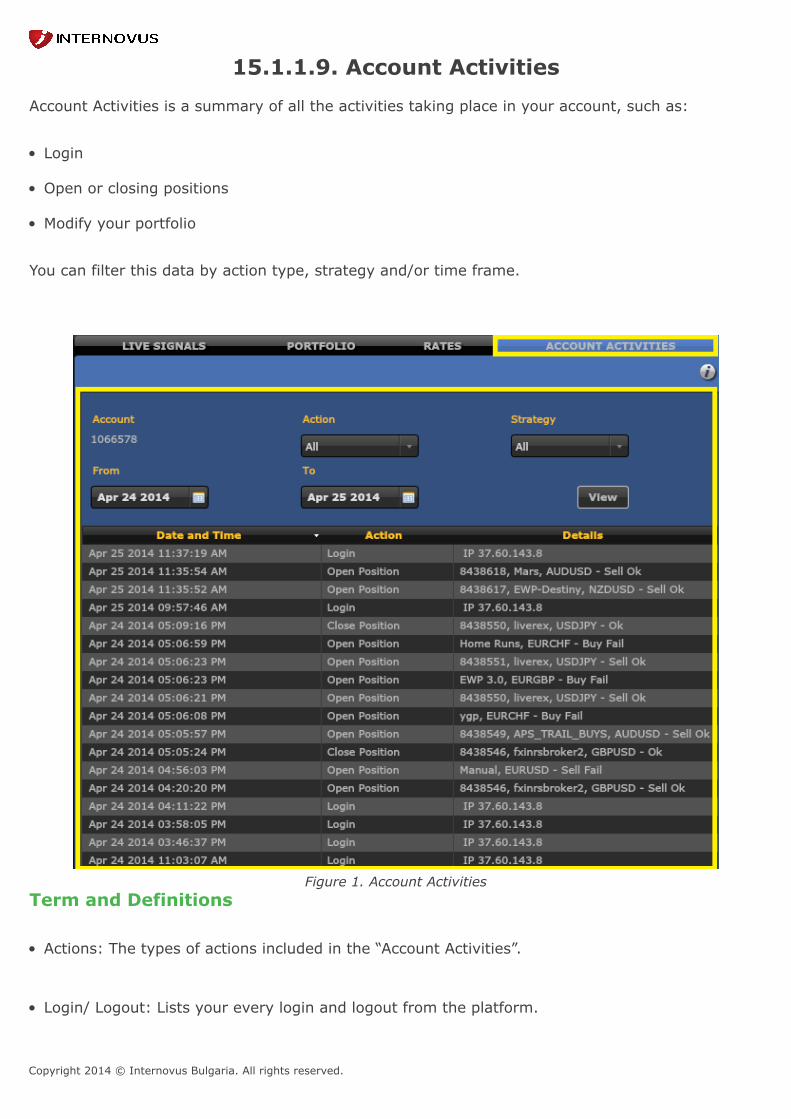
Copyright 2014 © Internovus Bulgaria. All rights reserved.
15.1.1.9. Account Activities Account Activities is a summary of all the activities taking place in your account, such as:
• Login
• Open or closing positions
• Modify your portfolio
You can filter this data by action type, strategy and/or time frame.
Figure 1. Account ActivitiesTerm and Definitions
• Actions: The types of actions included in the “Account Activities”.
• Login/ Logout: Lists your every login and logout from the platform.
Copyright 2014 © Internovus Bulgaria. All rights reserved.
• Modify Portfolio: Lists the addition and removal of strategies to and from your portfolio, or yourmodification of a strategy’s “Money Management.”
• Open Position/Order: Lists each position and order opened in your account (opened either bystrategy or manually).
• Close Position/Order: Lists closed positions and orders in your account (closed either by strategyor manually).
• Modify Position/Order: Lists Stop and Limit modifications to each position or order opened inyour account.
Notes & Tips
You can also subscribe to a “Notifications” service (from the ‘SETTINGS’ tab on the top right handcorner) and receive notifications by email for every position opened and closed in your account(demo accounts cannot receive notifications for positions opening).
Copyright 2014 © Internovus Bulgaria. All rights reserved.
16. Frequently Asked Questions Q: What is Forex? A: Forex, short for Foreign Exchange, is the synchronized buying of one currency and selling ofanother. It is the largest market in the world, trading on average US$3.4 trillion daily. The market'sparticipants include. Central banks, commercial banks, multinational corporations, governments,institutional and private investors. Q: What are your commissions and fees? A: We do not charge any commissions or a fee to trade on our platform. We make money throughthe 'spread' this is the difference between the buy and sell price for a currency pair. This meanswe make money only when you open a trade, the spread is charged once on opening and then anyprofit you make is yours. Q: What is the minimum amount needed to open an account? •
A: The minimum initial deposit required is $200. Click here to find more details in regards to ouraccounts types and their related minimum deposit requirements. Q: What is trendline? A: A trendline is is line, that follows the current trend in a currency pair. While the science of usingtrendlines is often not exact, it gives you an idea of the approximate future actions of a trendingcurrency pair. Trendlines are a basic part of technical analysis. Q: What does it mean to "go long"? A: When you "go long" you are simply placing a buy order on a currency pair. Q: What does it mean to "go short"? A: When you "go short" you are simply placing a sell order on a currency pair. Q: What happens to my open positions at the end of the trading day? A: PROfit automatically rolls forward all open positions at 22:00 GMT sharp. The amount paidor earned depends on the direction of the open position and the interest rate differential betweenthe two currencies involved. For example, assuming UK interest rates are significantly higher thanJapan's, a trader long GBP/JPY, is paid interest upon rollover. Conversely, if a trader is short GBP/JPY, interest will be debited upon the rollover. Rollover credits or debits are applied daily to thecustomer's account reflecting interest paid or earned on each open position held overnight.

Copyright 2014 © Internovus Bulgaria. All rights reserved.
Q: Forex Market Jargon A: Every discipline has its own jargon and the currency market is no different. Here are someterms to know, that will make you sound like a seasoned currency trader:
Cable, sterling, pound - alternative names for the GBP Greenback, buck - nicknames for the U.S. dollar Swissie - nickname for the Swiss franc Aussie - nickname for the Australian dollar Kiwi - nickname for the New Zealand dollar Loonie, the little dollar - nicknames for the Canadian dollar Figure - FX term connoting a round number like 1.2000 Yard - a billion units, as in "I sold a couple of yards of sterling." Q: Am I subject to Tax? A: PROfit does not deduct or pay any tax on our client's behalf. It is the clients' ownresponsibility to take care of his/her own tax obligations.