Profilo Climatico Locale - Kyoto Club · Profilo Climatico Locale ... ARPA E-R Servizio...
34
Profilo Climatico Locale Rodica Tomozeiu Lucio Botarelli [email protected] , [email protected] ARPA E-R Servizio IdroMeteoClima www.arpa.emr.it webinar 20 Marzo 2014
Transcript of Profilo Climatico Locale - Kyoto Club · Profilo Climatico Locale ... ARPA E-R Servizio...
Profilo Climatico Locale
Rodica Tomozeiu Lucio Botarelli
[email protected], [email protected]
ARPA E-R
Servizio IdroMeteoClima www.arpa.emr.it
webinar 20 Marzo 2014

Observed global climate changes
Increase of the global temperature is more significant from the 90‘s
Decrease of precipitation in Europe

-1.5
-1
-0.5
0
0.5
1
1.5
2
2.5
3
3.5
19
60
19
65
19
70
19
75
19
80
19
85
19
90
19
95
20
00
20
05
20
10
An
om
alia
Tm
ed
Anomalia di temperatura media annuale
T_globale
T_Italia
T_Bologna
Anomaly of the yearly mean temperature (vs 1961-1990)
Observed climate variability

(http://www.arpa.emr.it/sim/?clima)
Precipitation anomaly 1991-2008 vs 1961-1990
Temperature anomaly 1991-2008 vs 1961-1990 Observed climate variability at regional level
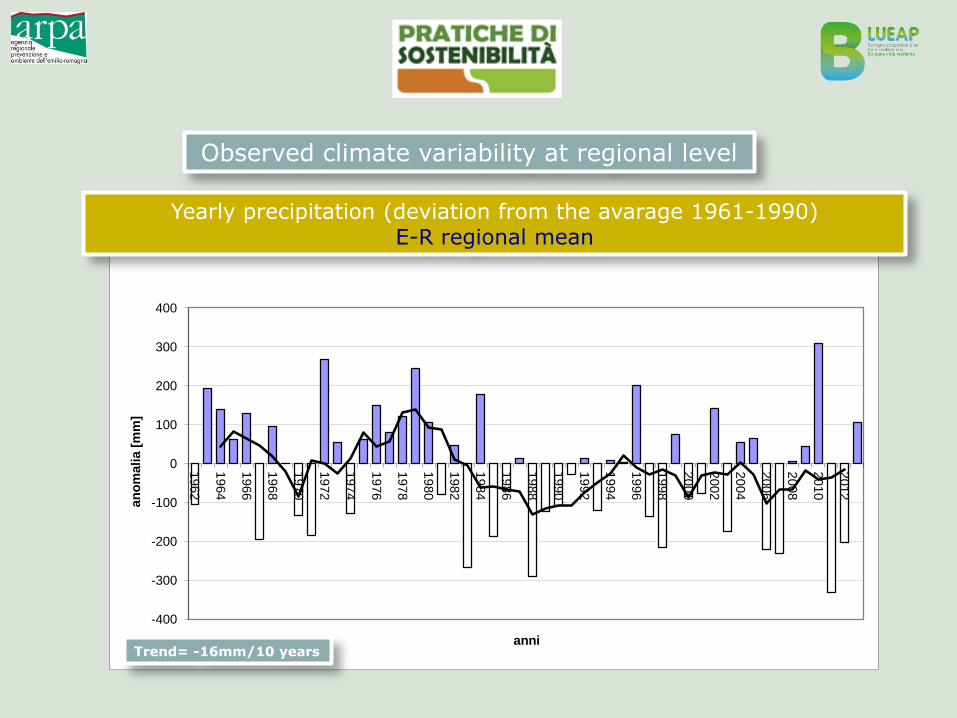
Observed climate variability at regional level
-400
-300
-200
-100
0
100
200
300
400
1962
1964
1966
1968
1970
1972
1974
1976
1978
1980
1982
1984
1986
1988
1990
1992
1994
1996
1998
2000
2002
2004
2006
2008
2010
2012
an
om
ali
a [
mm
]
anni Trend= -16mm/10 years
Yearly precipitation (deviation from the avarage 1961-1990) E-R regional mean

Observed climate variability at regional level
-400,0
-300,0
-200,0
-100,0
0,0
100,0
200,0
300,0
400,0
19
61
19
63
19
65
19
67
19
69
19
71
19
73
19
75
19
77
19
79
19
81
19
83
19
85
19
87
19
89
19
91
19
93
19
95
19
97
19
99
20
01
20
03
20
05
20
07
20
09
20
11
20
13
mm
anni
Andamento BIC medio annuale su Emilia-Romagna Yearly climatic water balance (E-R region)

Observed climate variability at regional level
strongest signal during summer -1,00
-0,50
0,00
0,50
1,00
1,50
2,00
19
61
19
63
19
65
19
67
19
69
19
71
19
73
19
75
19
77
19
79
19
81
19
83
19
85
19
87
19
89
19
91
19
93
19
95
19
97
19
99
20
01
20
03
20
05
20
07
20
09
20
11
20
13
C
°
anni
Scarto medio annuale della Tmed in Emilia-Romagna clima di riferimento 1961-1990
Anomaly of summer Tmax (JJA) E-R regional mean
Increase of 0,5°C/10 years
(from 1986 always over mean climate reference value)

Temperatura massima S. P. Capofiume (pianura BO)
20
22.5
25
27.5
30
32.5
35
37.5
40
01/06/1
2
06/06/1
2
11/06/1
2
16/06/1
2
21/06/1
2
26/06/1
2
01/07/1
2
06/07/1
2
11/07/1
2
16/07/1
2
21/07/1
2
26/07/1
2
31/07/1
2
05/08/1
2
10/08/1
2
15/08/1
2
20/08/1
2
25/08/1
2
30/08/1
2
giorni
°C
Tmax2012
Tmax2003
Tmax clima giugno
Tmax clima luglio
Tmax clima agosto
Heat waves (>35°C) summer 2012 vs summer 2003 (regional central plan)
Observed climate variability
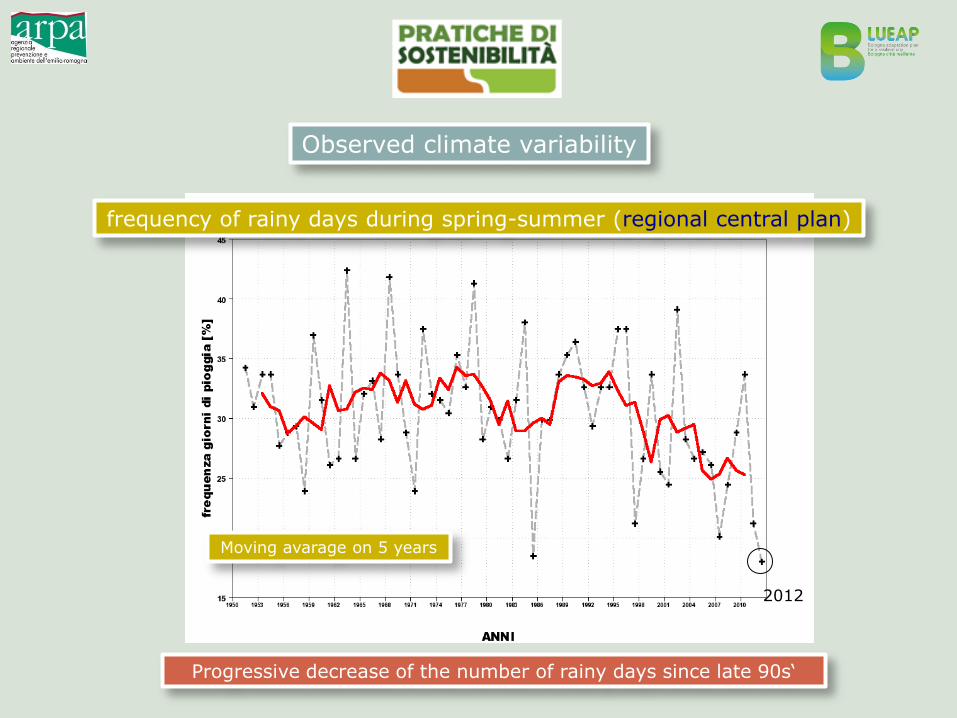
Progressive decrease of the number of rainy days since late 90s‘
2012
Moving avarage on 5 years
frequency of rainy days during spring-summer (regional central plan)
Observed climate variability

Consecutive dry days, summer 2012
Consecutive dry days, summer 2003
Observed climate variability at regional level

Summer climatic water balance 2012 vs 2003
Observed climate variability at regional level

Soil humidity
2003 2007
2012
Observed climate variability at regional level
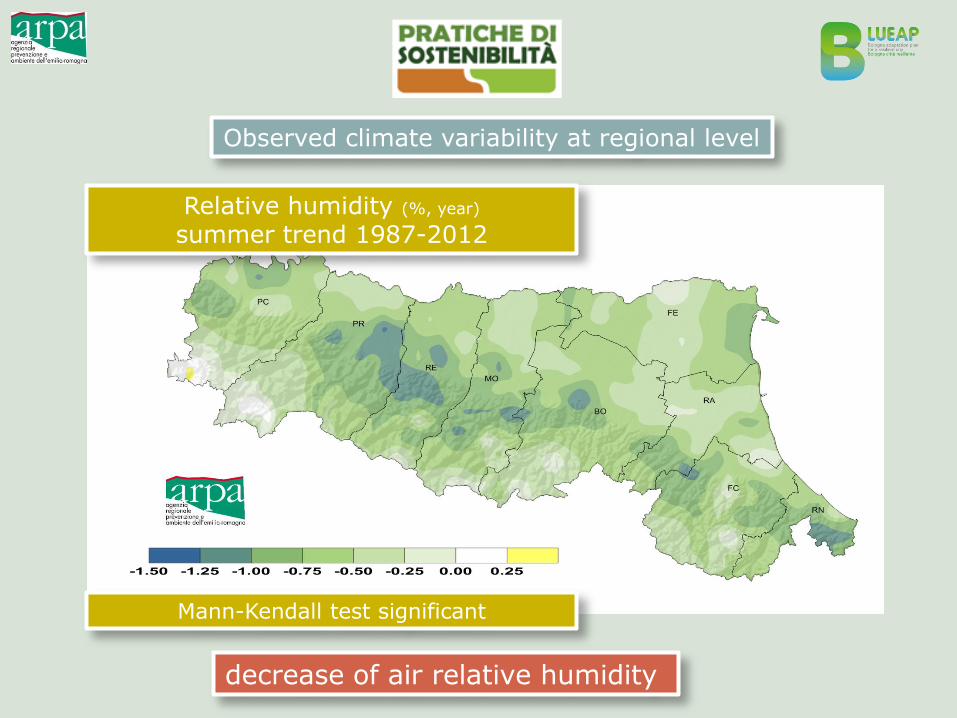
decrease of air relative humidity
Mann-Kendall test significant
Relative humidity (%, year)
summer trend 1987-2012
Observed climate variability at regional level
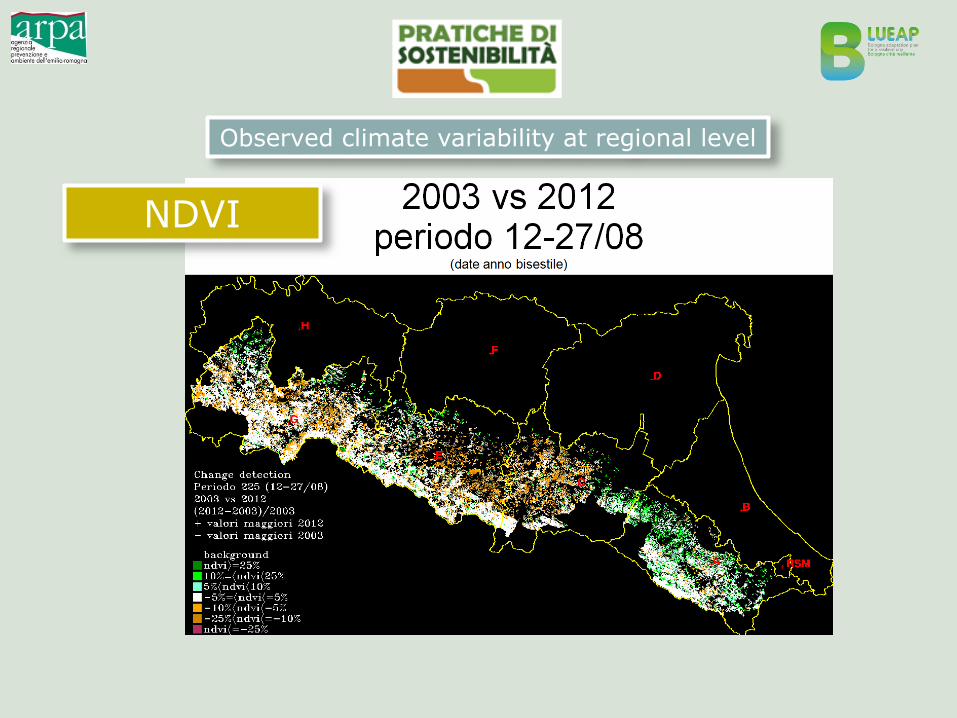
NDVI
Observed climate variability at regional level
Extending seasonal (warmer autumns)
Advance in seasonality (early spring)
Longer growing season (limited by water availability)
Warm winters (2006-2007, 2013-2014)
Observed climate variability

Observed climate variability at regional level
severe rains and floods
heat waves and drought
heavy snowfalls
Increase of extreme events
strong anomalies

Observed climate variability at urban scale

• Decrease of frost days during winter
• Increase of heat waves
• Increase of the consecutive dry days
Ondate di calore (HWD) estive e il valore climatico di riferimento(linea tratteggiata) a
Bologna
0
2
4
6
8
10
12
14
1951 1956 1961 1966 1971 1976 1981 1986 1991 1996 2001 2006 2011
anni
gm
ax
.gio
rni c
on
se
cu
tiv
i
HWD clima_HWD
Winter temporal variability of frost days- bologna
0
10
20
30
40
50
60
1950 1955 1960 1965 1970 1975 1980 1985 1990 1995 2000 2005 2010
Years
No
.of
days
Observed climate variability in Bologna
Heat waves
Frost days
0
10
20
30
40
50
60
1951 1956 1961 1966 1971 1976 1981 1986 1991 1996 2001 2006 2011
gio
rni
anni
Andamento temporale del numero massimo di giorni consecutivi senza precipitazione-stagione estiva, Bologna (periodo 1951-2011)
Consecutive dry days

Aim
Climate change scenarios of
seasonal minimum and maximum temperature
periods 2021-2050 and 2070-2099
Emission scenario A1B
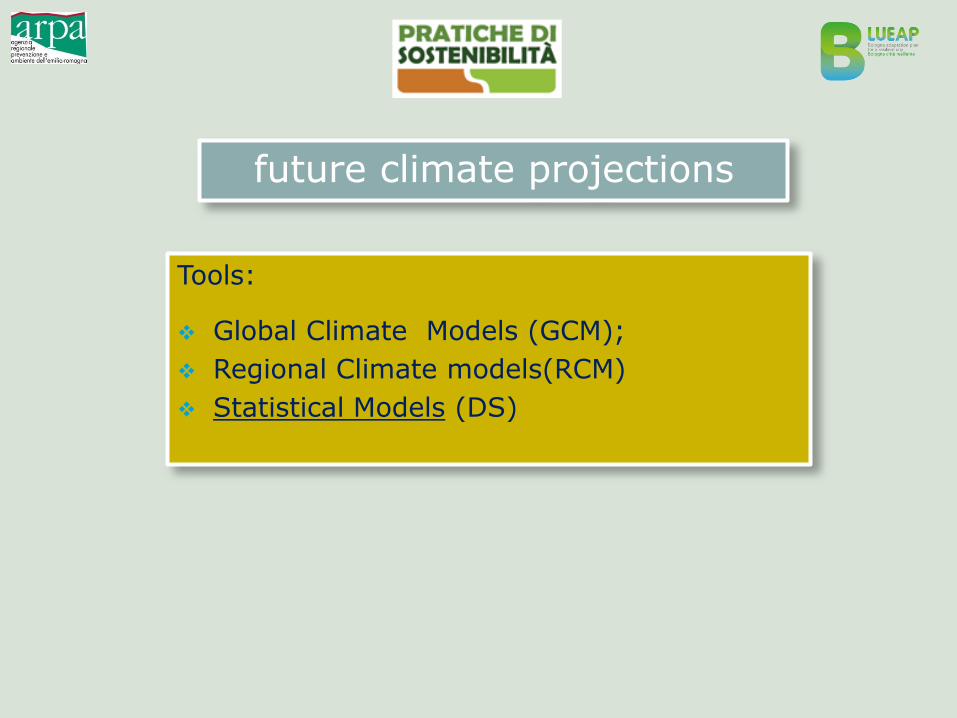
future climate projections
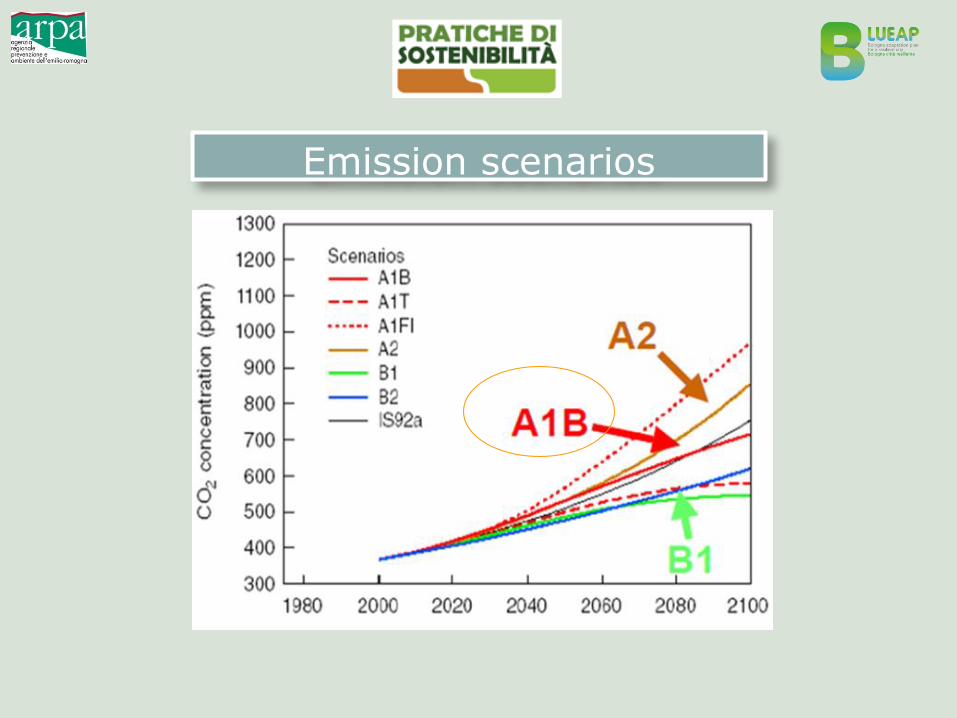
Emission scenarios
future climate projections
Tools:
Global Climate Models (GCM);
Regional Climate models(RCM)
Statistical Models (DS)

Statistical Downscaling (SD): based on the statistical relationship between local climate variables and large scale atmospheric variables.
Regional Climate Models (RCM) or Dynamical Downscaling (DD): nested into the global model
AOGCM
RCM
Developed by
ARPA-SIMC
…from CGCMs to RCMs and SDs

Global Continental
Regional
Local
National
Climate projection from global to local

24
CORDEX, Brussels 4-7 November 2013
information at station (or grid point) level; derive variables not always available from
RCMs/GCM (i.e. extremes); SD is simple and computationally
inexpensive.
Strengths
Weakness
need long and homogeneous observational time series for fitting and validating the statistical relationship;
link between predictors and predictands have to be stable in time…
Statistical downscaling
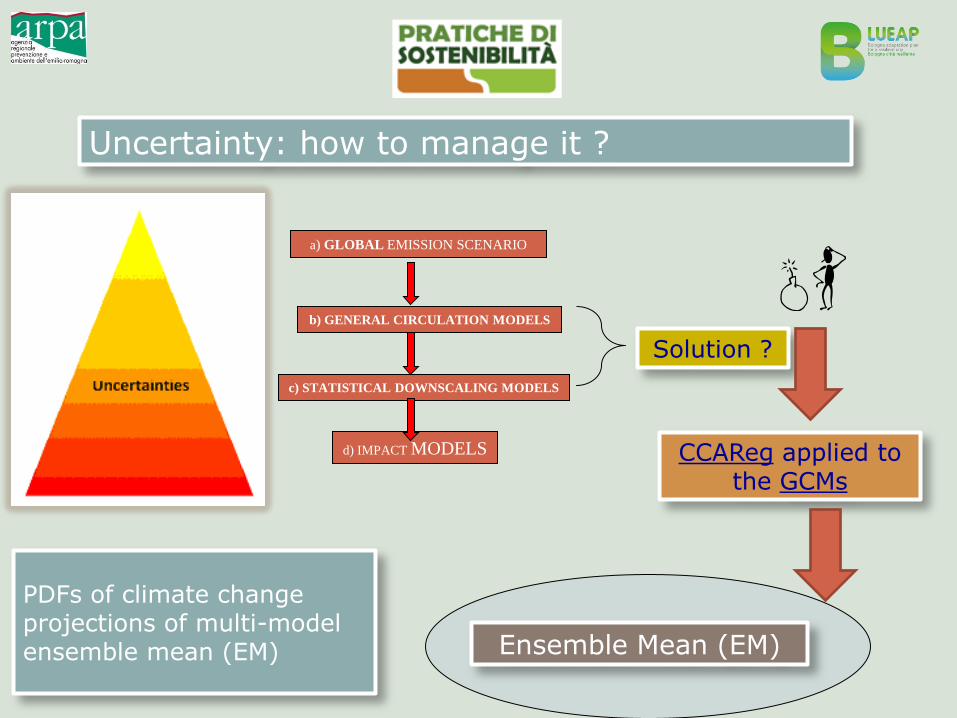
Solution ?
CCAReg applied to the GCMs
Ensemble Mean (EM)
a) GLOBAL EMISSION SCENARIO
b) GENERAL CIRCULATION MODELS
c) STATISTICAL DOWNSCALING MODELS
d) IMPACT MODELS
Uncertainty: how to manage it ?
PDFs of climate change projections of multi-model ensemble mean (EM)

Tmin
Tmax
DJF
DJF
Climate projections: temperature winter (DJF) Tmin and Tmax in Northern Italy
2021-2050

Tmin
Tmax
Note: warming in all seasons with mean values up to 1.8°C (summer) significant shits in the tails of the distributions
…other seasons 2021-2050

Tmin
Tmax
Note: Peak of warming during summer
All the seasons 2070-2099

Seasonal observational data from 75 stations, over Northern Italy (source (http://www.scia.sinanet.apat.it/);
Daily minimum and maximum temperature from 25 observational stations in Emilia-Romagna region
Period: 1960-2002
Data

30
DTmin_DJF (°C) DTmax_JJA(°C)
2021-2050
2070-2099
DTmin_DJF(°C) DTmax_JJA (°C)
Spatial patterns of projected changes in temperature EM 2021-2050 and 2070-2099, A1B
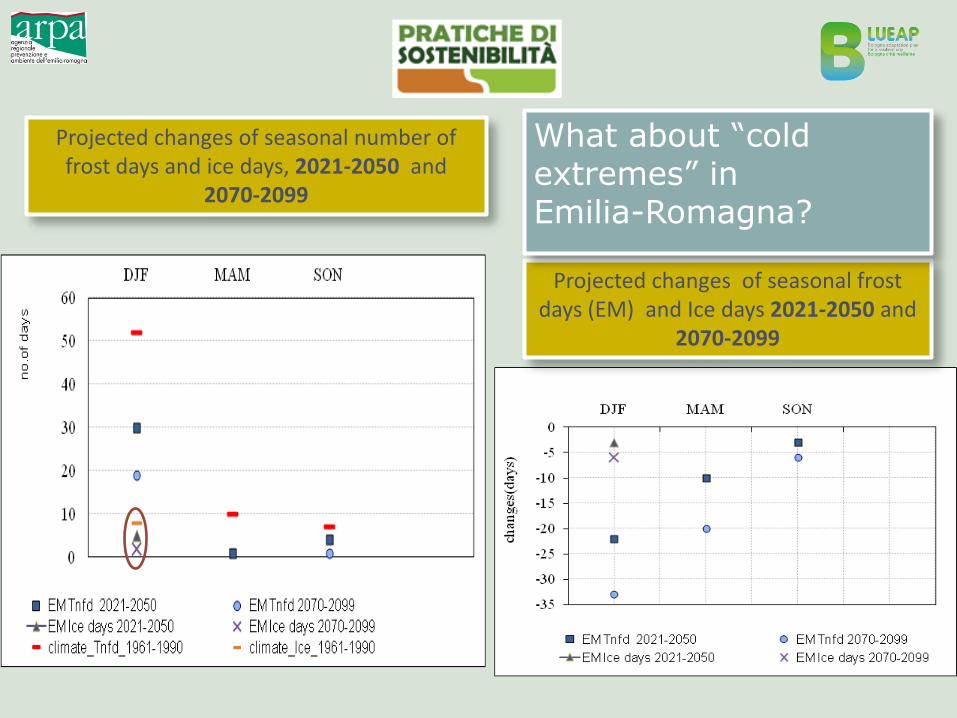
Projected changes of seasonal frost days (EM) and Ice days 2021-2050 and
2070-2099
Projected changes of seasonal number of frost days and ice days, 2021-2050 and
2070-2099
What about “cold extremes” in Emilia-Romagna?

Conclusions
significant increases are projected to occur in minimum and maximum temperature over Northern Italy in all seasons, during the period 2021-2050. The Ensemble Mean computed using all runs (8 runs for each season) projects for each season, a change in the mean of the PDFs of minimum and maximum temperature around 1.5- 2°C over N-Italy;
the magnitude of changes is greater to the end of the century, namely for the period 2070-2099, when the mean of the distributions of EM showed an increase around 3°C (mean over all the stations) during winter, spring and autumn;
the peak of changes is projected to occur during summer season, for both minimum and maximum temperature, with an increase in the mean around 4°C (mean over the stations from N-Italy), with respect to present climate 1961-1990;

…
the warming is projected to be more intense in the Po Valley, especially to the end of the century;
the lower and upper tail of the PDFs of minimum and maximum temperatures are projected to shift to warmer values, with increases up to 2°C in lower and up to 6°C;
a significant decrease of the seasonal number of frost days and winter ice days is projected to occur over Emilia-Romagna, more intense to the end of the century ( for example during spring could disappear).
Conclusions

Thanks for your kind attention