Profiling Tools In Ranger Carlos Rosales, Kent Milfeld and Yaakoub Y. El Kharma...
67
-
Upload
joleen-dorsey -
Category
Documents
-
view
219 -
download
0
Transcript of Profiling Tools In Ranger Carlos Rosales, Kent Milfeld and Yaakoub Y. El Kharma...

SCALABILITY IN MPI APPLICATIONSmpiP and IPM

About mpiPmpiP is an MPI Profiling library mpip.sourceforge.net
• Scalable & Lightweight
• Multiplatform – Linux IA32/IA64/x86_64/MPIS64– IBM POWER 4/5– Cray XT3/XT4/X1E
• Does not require manual code instrumentation– collects statistics of MPI functions (wraps original MPI function calls)– less overhead than tracing tools– less data than tracing tools
• Easy to use (requires linking but not compilation)
Using mpiPLoad the mpiP module:% module load mpiP
Link the static library before any others:% mpicc -g -L$TACC_MPIP_LIB -lmpiP -lbfd -liberty ./srcFile.c
Set environmental variables controlling the mpiP output:% setenv MPIP ‘-t 10 -k 2’
In this case:-t 10 only callsites with time > 10% MPI time included in report-k 2 set callsite stack traceback depth to 2
Run program through the queue as usual.

mpiP runtime options
option description default
-c generate concise report no callsite process-specific detail
-k n set callsite stack traceback depth to <n> 1
-o disable profiling at initialization
-t x set print threshold, <x> is MPI % of time for each callsite 0.0
-v generate both concise and verbose reports
-x exe specify the full path to the executable
(csh)% setenv MPIP ‘option1 option2 …’(bash)% export MPIP=‘option1 option2 …’

mpiP calls from C/FortranGenerate arbitrary reports using the function call MPI_Pcontrol() with different arguments
Useful to:– profile specific sections of the code– obtain individual profiles of multiple function calls
Argument Output behavior
0 Disable profiling (default)
1 Enable profiling
2 Reset all callsite data
3 Generate verbose report
4 Generate concise report

MPI_Pcontrol examples
Scope limitation
switch(i) { case 5: MPI_Pcontrol(1);// enable profiling break; case 6: MPI_Pcontrol(0);// disable profiling break; default: break; } /* ... do something for one timestep ... */
Individual reportsswitch(i) { case 5: MPI_Pcontrol(2); // reset profile data MPI_Pcontrol(1); // enable profiling break; case 6: MPI_Pcontrol(3); // generate verbose report MPI_Pcontrol(4); // generate concise report MPI_Pcontrol(0); // disable profiling break; default: break; } /* ... do something for one timestep ... */

mpiP outputAfter running the executable a file with the extension .mpiP will be generated with:
– MPI Time (MPI time for all MPI calls)– MPI callsites– Aggregate message size– Aggregate time
For scalability analysis it is important to compare the total MPI time to the total running time of the application.
Detailed function call data can be used to identify communication hotspots.

mpiP output: MPI Time---------------------------------------------------------------------------@--- MPI Time (seconds) ------------------------------------------------------------------------------------------------------------------------------Task AppTime MPITime MPI% 0 4.83 4.4 91.12 1 4.83 0.332 6.87 2 4.83 0.31 6.42 3 4.83 0.316 6.54 4 4.83 0.328 6.79 5 4.83 0.34 7.04 6 4.83 0.33 6.84 7 4.83 0.342 7.08 8 4.83 0.324 6.71 9 4.83 0.323 6.69 10 4.83 0.346 7.17 11 4.83 0.328 6.79 12 4.83 0.341 7.06 13 4.83 0.32 6.63 14 4.83 0.345 7.15 15 4.83 0.344 7.13 * 77.2 9.36 12.13

mpiP output: MPI Time---------------------------------------------------------------------------@--- MPI Time (seconds) ------------------------------------------------------------------------------------------------------------------------------Task AppTime MPITime MPI% 0 4.83 4.4 91.12 1 4.83 0.332 6.87 2 4.83 0.31 6.42 3 4.83 0.316 6.54 4 4.83 0.328 6.79 5 4.83 0.34 7.04 6 4.83 0.33 6.84 7 4.83 0.342 7.08 8 4.83 0.324 6.71 9 4.83 0.323 6.69 10 4.83 0.346 7.17 11 4.83 0.328 6.79 12 4.83 0.341 7.06 13 4.83 0.32 6.63 14 4.83 0.345 7.15 15 4.83 0.344 7.13 * 77.2 9.36 12.13
This process seems to be controlling all MPI exchanges

mpiP output: MPI callsites
----------------------------------------------------------------------@--- Callsites: 9 -------------------------------------------------------------------------------------------------------------------------- ID Lev File/Address Line Parent_Funct MPI_Call 1 0 matmultc.c 60 main Send 2 0 matmultc.c 52 main Bcast 3 0 matmultc.c 103 main Barrier 4 0 matmultc.c 78 main Send 5 0 matmultc.c 65 main Recv 6 0 matmultc.c 74 main Send 7 0 matmultc.c 98 main Send 8 0 matmultc.c 92 main Recv 9 0 matmultc.c 88 main Bcast

mpiP output: Aggregate time
----------------------------------------------------------------------@--- Aggregate Time (top twenty, descending, milliseconds) ---------------------------------------------------------------------------------Call Site Time App% MPI% COVRecv 5 4.19e+03 5.42 44.70 0.00Bcast 9 4.12e+03 5.34 44.03 0.00Recv 8 412 0.53 4.40 0.11Barrier 3 229 0.30 2.45 0.79Send 7 203 0.26 2.17 0.44Bcast 2 174 0.23 1.86 0.00Send 6 37 0.05 0.39 0.00Send 1 0.473 0.00 0.01 0.00Send 4 0.023 0.00 0.00 0.00

mpiP output: Message Size
----------------------------------------------------------------------@--- Aggregate Sent Message Size (top twenty, descending, bytes) ---------------------------------------------------------------------------Call Site Count Total Avrg Sent%Bcast 9 30000 4.8e+08 1.6e+04 83.33Send 7 2000 3.2e+07 1.6e+04 5.56Bcast 2 2000 3.2e+07 1.6e+04 5.56Send 6 1985 3.18e+07 1.6e+04 5.51Send 1 15 2.4e+05 1.6e+04 0.04Send 4 15 120 8 0.00

About IPMIPM is an Integrated Performance Monitoring toolhttp://ipm-hpc.sourceforge.net/
• Portable profiling infrastructure for parallel codes• Low-overhead performance summary of computing and communication• IPM is a quick, easy and concise profiling tool• Requires no manual instrumentation, just adding the -g option to the
compilation• Produces XML output that is parsed by scripts to generate browser-
readable html pages• The level of detail it reports is lower than TAU, PAPI, HPCToolkit or Scalasca
but higher than mpiP

Using IPM• Available on Ranger for both intel and pgi compilers, with mvapich
and mvapich2
• Create ipm environment with module command before running code: % module load ipm
• In your job script, set up the following ipm environment before the ibrun command:module load ipmexport LD_PRELOAD=$TACC_IPM_LIB/libipm.soexport IPM_REPORT=full
ibrun <my executable> <my arguments>

Using IPM• export LD_PRELOAD=$TACC_IPM_LIB/libipm.so
– must be inside job script to ensure the IPM wrappers for MPI calls are loaded properly
• IPM_REPORT: controls the level of information collected– full– terse– none
• IPM_MPI_THRESHOLD: Reports only routines using this percentage (or more) of MPI time. – e.g. “IPM_MPI_THRESHOLD 0.3” report subroutines that consume more
than 30% of the total MPI time.
• Important details:% module help ipm

Output from IPM• When your code has finished running IPM will create an XML file with a
name like: username.1231369287.321103.0
• Get basic or full information in text mode using: % ipm_parse username.1231369287.321103.0 % ipm_parse -full username.1231369287.321103.0
• You can also transform this XML file into standard HTML files : % ipm_parse -html username.1231369287.321103.0
• This generates a directory which contains an index.html file readable by any web browser
• Tar this directory and scp the file to your own local computer to visualize the results

IPM: Text Output##IPMv0.922################################################ # command : /work/01125/yye00/ICAC/cactus_SandTank SandTank.par # host : i101-309/x86_64_Linux mpi_tasks : 32 on 2 nodes# start : 05/26/09/11:49:06 wallclock : 2.758892 sec# stop : 05/26/09/11:49:09 %comm : 2.01 # gbytes : 4.38747e+00 total gflop/sec : 9.39108e-02 total############################################################ region : * [ntasks] = 32
#
# [total] <avg> min max
# entries 32 1 1 1
# wallclock 88.2742 2.75857 2.75816 2.75889
# user 5.51634 0.172386 0.148009 0.200012
# system 1.771 0.0553438 0.0536683 0.056717
# %comm 2.00602 1.94539 2.05615
# gflop/sec 0.0939108 0.00293471 0.00293338 0.002952
# gbytes 4.38747 0.137109 0.136581 0.144985
#
# PAPI_FP_OPS 2.5909e+08 8.09655e+06 8.09289e+06 8.14685e+06# PAPI_TOT_CYC 6.80291e+09 2.12591e+08 2.02236e+08 2.19109e+08# PAPI_VEC_INS 5.95596e+08 1.86124e+07 1.85964e+07 1.8756e+07# PAPI_TOT_INS 4.16377e+09 1.30118e+08 1.0987e+08 1.35676e+08## [time] [calls] <%mpi> <%wall>
# MPI_Allreduce 0.978938 53248 55.28 1.11
# MPI_Comm_rank 0.316355 6002 17.86 0.36
# MPI_Barrier 0.247135 3680 13.95 0.28
# MPI_Allgatherv 0.16621 2848 9.39 0.19
# MPI_Bcast 0.0217298 576 1.23 0.02
# MPI_Allgather 0.0216982 672 1.23 0.02
# MPI_Recv 0.0186796 32 1.05 0.02
# MPI_Comm_size 0.000139921 2112 0.01 0.00
# MPI_Send 0.000115622 32 0.01 0.00
###########################################################

IPM: HTML Output

IPM: Load Balance

IPM: Communication balancing, by task

IPM: Integrated Performance Monitoring

IPM: Connectivity, Buffer-size Distribution

IPM: Buffer-Size Distribution

IPM: Memory Usage

BASIC PROFILING TOOLStimers, gprof

Timers: Command Line• The command time is available in most Unix systems. • It is simple to use (no code instrumentation required).• Gives total execution time of a process and all its children in seconds.
% /usr/bin/time -p ./exeFile real 9.95 user 9.86 sys 0.06
Leave out the -p option to get additional information:% time ./exeFile% 9.860u 0.060s 0:09.95 99.9% 0+0k 0+0io 0pf+0w
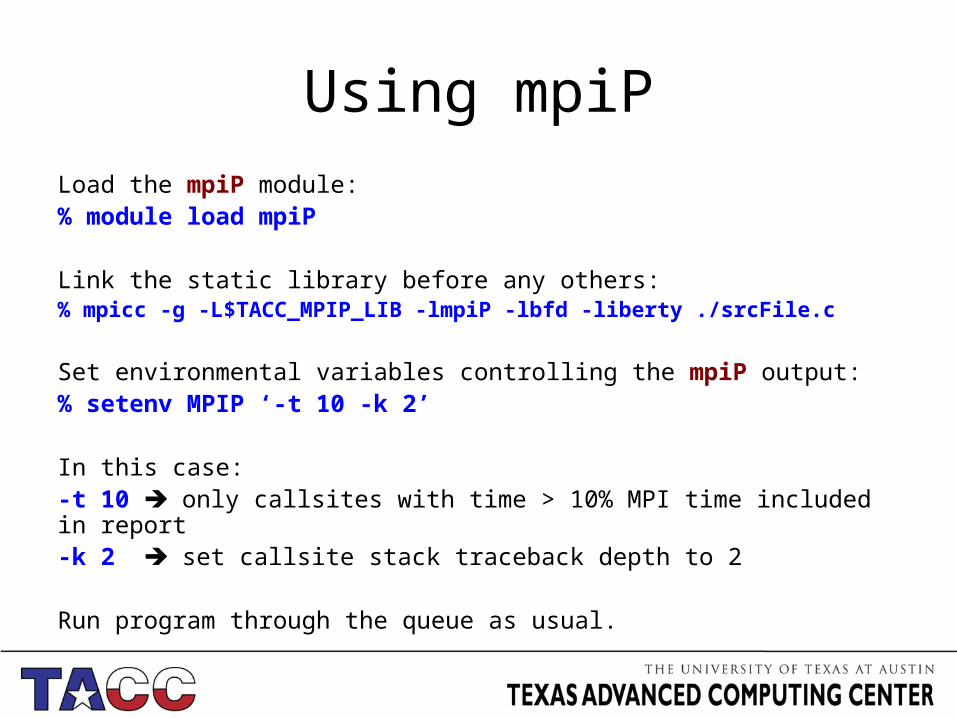
Timers: Code Section INTEGER :: rate, start, stop REAL :: time
CALL SYSTEM_CLOCK(COUNT_RATE = rate) CALL SYSTEM_CLOCK(COUNT = start)
! Code to time here
CALL SYSTEM_CLOCK(COUNT = stop) time = REAL( ( stop - start )/ rate )
#include <time.h>
double start, stop, time; start = (double)clock()/CLOCKS_PER_SEC;
/* Code to time here */
stop = (double)clock()/CLOCKS_PER_SEC; time = stop - start;

About GPROFGPROF is the GNU Project PROFiler. gnu.org/software/binutils/
•Requires recompilation of the code.
•Compiler options and libraries provide wrappers for each routine call and periodic sampling of the program.
•A default gmon.out file is produced with the function call information.
•GPROF links the symbol list in the executable with the data in gmon.out.

Types of Profiles• Flat Profile
– CPU time spend in each function (self and cumulative) – Number of times a function is called– Useful to identify most expensive routines
• Call Graph– Number of times a function was called by other functions– Number of times a function called other functions– Useful to identify function relations– Suggests places where function calls could be eliminated
• Annotated Source– Indicates number of times a line was executed

Profiling with gprof
Use the -pg flag during compilation:% gcc -g -pg ./srcFile.c% icc -g -p ./srcFile.c% pgcc -g -pg ./srcFile.c
Run the executable. An output file gmon.out will be generated with the profiling information.
Execute gprof and redirect the output to a file:% gprof ./exeFile gmon.out > profile.txt% gprof –l ./exeFile gmon.out > profile_line.txt% gprof -A ./exeFile gmon.out > profile_anotated.txt

Flat profileIn the flat profile we can identify the most expensive parts of the code (in this case, the calls to matSqrt, matCube, and sysCube).
% cumulative self self total
time seconds seconds calls s/call s/call name
50.00 2.47 2.47 2 1.24 1.24 matSqrt
24.70 3.69 1.22 1 1.22 1.22 matCube
24.70 4.91 1.22 1 1.22 1.22 sysCube
0.61 4.94 0.03 1 0.03 4.94 main
0.00 4.94 0.00 2 0.00 0.00 vecSqrt
0.00 4.94 0.00 1 0.00 1.24 sysSqrt
0.00 4.94 0.00 1 0.00 0.00 vecCube

Call Graph Profileindex % time self children called name 0.00 0.00 1/1 <hicore> (8)[1] 100.0 0.03 4.91 1 main [1] 0.00 1.24 1/1 sysSqrt [3] 1.24 0.00 1/2 matSqrt [2] 1.22 0.00 1/1 sysCube [5] 1.22 0.00 1/1 matCube [4] 0.00 0.00 1/2 vecSqrt [6] 0.00 0.00 1/1 vecCube [7]----------------------------------------------- 1.24 0.00 1/2 main [1] 1.24 0.00 1/2 sysSqrt [3][2] 50.0 2.47 0.00 2 matSqrt [2]----------------------------------------------- 0.00 1.24 1/1 main [1][3] 25.0 0.00 1.24 1 sysSqrt [3] 1.24 0.00 1/2 matSqrt [2] 0.00 0.00 1/2 vecSqrt [6]-----------------------------------------------

Visual Call Graph
mainmain
matSqrtmatSqrt vecSqrtvecSqrt matCubematCube vecCubevecCubesysSqrtsysSqrt sysCubesysCube

Call Graph Profileindex % time self children called name 0.00 0.00 1/1 <hicore> (8)[1] 100.0 0.03 4.91 1 main [1] 0.00 1.24 1/1 sysSqrt [3] 1.24 0.00 1/2 matSqrt [2] 1.22 0.00 1/1 sysCube [5] 1.22 0.00 1/1 matCube [4] 0.00 0.00 1/2 vecSqrt [6] 0.00 0.00 1/1 vecCube [7]----------------------------------------------- 1.24 0.00 1/2 main [1] 1.24 0.00 1/2 sysSqrt [3][2] 50.0 2.47 0.00 2 matSqrt [2]----------------------------------------------- 0.00 1.24 1/1 main [1][3] 25.0 0.00 1.24 1 sysSqrt [3] 1.24 0.00 1/2 matSqrt [2] 0.00 0.00 1/2 vecSqrt [6]-----------------------------------------------

Visual Call Graph
mainmain
matSqrtmatSqrt
vecSqrtvecSqrt matCubematCube vecCubevecCubesysSqrtsysSqrt sysCubesysCube

Call Graph Profileindex % time self children called name 0.00 0.00 1/1 <hicore> (8)[1] 100.0 0.03 4.91 1 main [1] 0.00 1.24 1/1 sysSqrt [3] 1.24 0.00 1/2 matSqrt [2] 1.22 0.00 1/1 sysCube [5] 1.22 0.00 1/1 matCube [4] 0.00 0.00 1/2 vecSqrt [6] 0.00 0.00 1/1 vecCube [7]----------------------------------------------- 1.24 0.00 1/2 main [1] 1.24 0.00 1/2 sysSqrt [3][2] 50.0 2.47 0.00 2 matSqrt [2]----------------------------------------------- 0.00 1.24 1/1 main [1][3] 25.0 0.00 1.24 1 sysSqrt [3] 1.24 0.00 1/2 matSqrt [2] 0.00 0.00 1/2 vecSqrt [6]-----------------------------------------------

Visual Call Graph
mainmain
matSqrtmatSqrt
vecSqrtvecSqrt
matCubematCube vecCubevecCubesysSqrtsysSqrt sysCubesysCube

ADVANCED PROFILING TOOLSPerfExpert, Tau

Advanced Profiling Tools• Can be intimidating:
– Difficult to install– Many dependences– Require kernel patches
• Useful for serial and parallel programs
• Extensive profiling and scalability information
• Analyze code using:– Timers– Hardware registers (PAPI)– Function wrappers
Not your problem!!

PAPIPAPI is a Performance Application Programming Interfaceicl.cs.utk.edu/papi
• API to use hardware counters• Behind Tau, HPCToolkit• Multiplatform:
– Most Intel & AMD chips– IBM POWER 4/5/6– Cray X/XD/XT– Sun UltraSparc I/II/III– MIPS– SiCortex– Cell
• Available as a module in Ranger

PAPI: Available EventsCounter/Event Name
Meaning
PAPI_L1_DCM Level 1 data cache misses
PAPI_L1_ICM Level 1 instruction cache misses
PAPI_L2_DCM Level 2 data cache misses
PAPI_L2_ICM Level 2 instruction cache misses
PAPI_L2_TCM Level 2 cache misses
PAPI_L3_TCM Level 3 cache misses
PAPI_FPU_IDL Cycles floating point units are idle
PAPI_TLB_DM Data translation lookaside buffer misses
PAPI_TLB_IMInstruction translation lookaside buffer misses
PAPI_STL_ICY Cycles with no instruction issue
PAPI_HW_INT Hardware interrupts
PAPI_BR_TKN Conditional branch instructions taken
PAPI_BR_MSPConditional branch instructions mispredicted
PAPI_TOT_INS Instructions completed
PAPI_FP_INS Floating point instructions
PAPI_BR_INS Branch instructions
Counter/Event Name
Meaning
PAPI_VEC_INS Vector/SIMD instructions
PAPI_RES_STL Cycles stalled on any resource
PAPI_TOT_CYC Total cycles
PAPI_L1_DCA Level 1 data cache accesses
PAPI_L2_DCA Level 2 data cache accesses
PAPI_L2_ICH Level 2 instruction cache hits
PAPI_L1_ICA Level 1 instruction cache accesses
PAPI_L2_ICA Level 2 instruction cache accesses
PAPI_L1_ICR Level 1 instruction cache reads
PAPI_L2_TCA Level 2 total cache accesses
PAPI_L3_TCR Level 3 total cache reads
PAPI_FML_INS Floating point multiply instructions
PAPI_FAD_INSFloating point add instructions (Also includes subtract instructions)
PAPI_FDV_INSFloating point divide instructions (Counts both divide and square root instructions)
PAPI_FSQ_INS
Floating point square root instructions (Counts both divide and square root instructions)
PAPI_FP_OPS Floating point operations

About PerfExpert• Brand new tool, locally developed at UT
• Easy to use and understand
• Great for quick profiling and for beginners
• Provides recommendation on “what to fix” in a subroutine
• Collects information from PAPI using HPCToolkit
• No MPI specific profiling, no 3D visualization, no elaborate metrics
• Combines ease of use with useful interpretation of gathered performance data

Using PerfExpert• Load the papi and java modules:
% module load papi% module load java
• Copy the PerfExpert.sge submission script (for editing):cp /share/home/00976/burtsche/PerfExpert/PerfExpert.sge ./
• Edit the PerfExpert.sge script to ensure the correct executable name, correct directory, correct project name and so on.
• Submit your job:% qsub PerfExpert.sge
• To analyze results:/share/home/00976/burtsche/PerfExpert/PerfExpert <threshold> ./hpctoolkit-….
Typical value for threshold is 0.1


About TauTAU is a suite of Tuning and Analysis Utilitieswww.cs.uoregon.edu/research/tau
• 11+ year project involving– University of Oregon Performance Research Lab– LANL Advanced Computing Laboratory– Research Centre Julich at ZAM, Germany
• Integrated toolkit– Performance instrumentation– Measurement– Analysis– Visualization
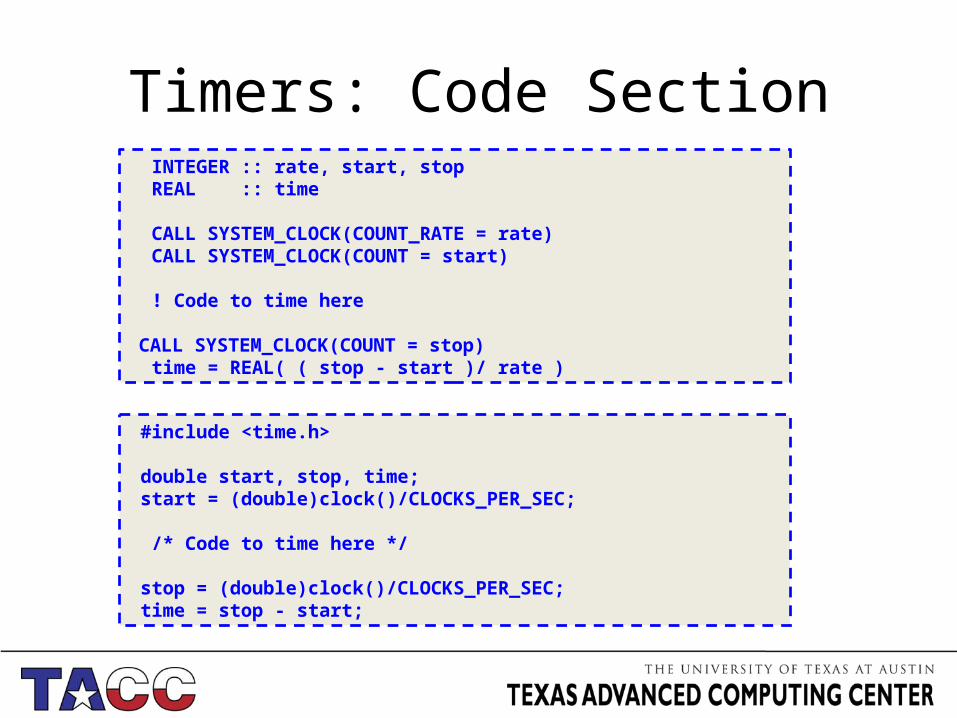
Using Tau• Load the papi and tau modules
• Gather information for the profile run:– Type of run (profiling/tracing, hardware counters, etc…)– Programming Paradigm (MPI/OMP)– Compiler (Intel/PGI/GCC…)
• Select the appropriate TAU_MAKEFILE based on your choices ($TAU/Makefile.*)
• Set up the selected PAPI counters in your submission script
• Run as usual & analyze using paraprof – You can transfer the database to your own PC to do the analysis

TAU Performance System Architecture
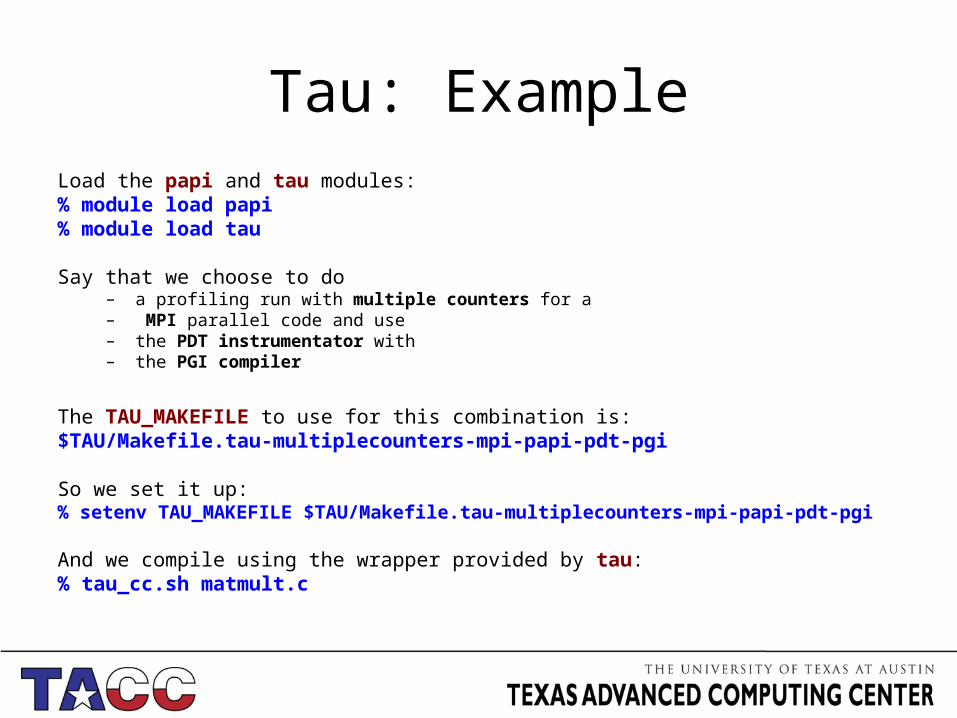
Tau: ExampleLoad the papi and tau modules:% module load papi% module load tau
Say that we choose to do– a profiling run with multiple counters for a – MPI parallel code and use– the PDT instrumentator with– the PGI compiler
The TAU_MAKEFILE to use for this combination is:$TAU/Makefile.tau-multiplecounters-mpi-papi-pdt-pgi
So we set it up:% setenv TAU_MAKEFILE $TAU/Makefile.tau-multiplecounters-mpi-papi-pdt-pgi
And we compile using the wrapper provided by tau:% tau_cc.sh matmult.c
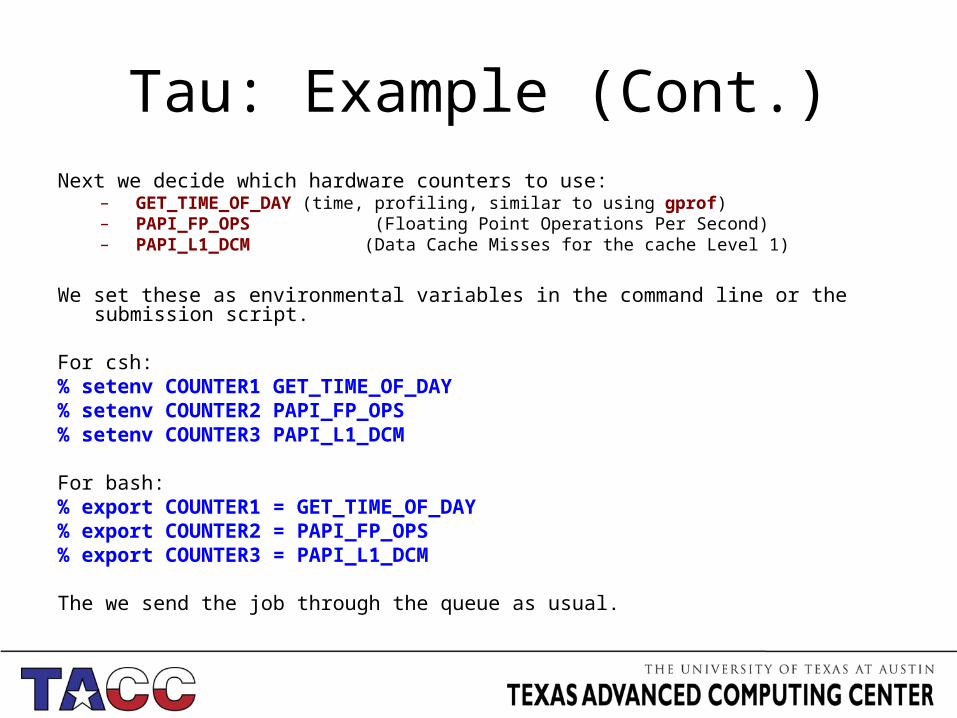
Tau: Example (Cont.)Next we decide which hardware counters to use:
– GET_TIME_OF_DAY (time, profiling, similar to using gprof)– PAPI_FP_OPS (Floating Point Operations Per Second)– PAPI_L1_DCM (Data Cache Misses for the cache Level 1)
We set these as environmental variables in the command line or the submission script.
For csh:% setenv COUNTER1 GET_TIME_OF_DAY% setenv COUNTER2 PAPI_FP_OPS% setenv COUNTER3 PAPI_L1_DCM
For bash:% export COUNTER1 = GET_TIME_OF_DAY% export COUNTER2 = PAPI_FP_OPS% export COUNTER3 = PAPI_L1_DCM
The we send the job through the queue as usual.

Tau: Example (Cont.)When the program finishes running one new directory will be created for each hardware counter we specified:
– MULTI__GET_TIME_OF_DAY– MULTI__PAPI_FP_OPS– MULTI__PAPI_L1_DCM
Analize the results with paraprof:% paraprof

TAU: ParaProf Manager
Counters we asked for
Provides Machine DetailsOrganizes Runs as: Applications, Experiments and Trials.

Tau: Metric View
Information includes Mean and Standard Deviation
Windows->Function Legend
Profile Information is in “GET_TIME_OF_DAY” metric
Mean and Standard Deviation Statistics given.

Tau: Metric ViewUnstack the bars for clarity: Options -> Stack Bars Together

Tau: Function Data WindowClick on any of the bars corresponding to function multiply_matrices. This opens the Function Data Window, which gives a closer look at a single function.

Tau: Float Point OPSHardware Counters provide Floating Point Operations (Function Data view).

Tau: L1 Cache Data Misses

Derived MetricsSelect Argument 1 (green ball); Select Argument 2 (green ball);Select Operation; then Apply. Derived Metric will appear as a new trial.

Derived Metrics (Cont.)• Select a Function• Function Data Window -> Options -> Select Metric -> Exclusive -> …

DerivedMetrics
Be careful even thoughratios are constant, coresmay do different amountsof work/operations per call.
Since FP/Missratios are constant– mustbe memoryaccess problem.

Callpath• To find out about function calls within the program, follow
the same process but using the following TAU_MAKEFILE:
Makefile.tau-callpath-mpi-pdt-pgi
• In the Metric View Window two new options will be available under:– Windows -> Thread -> Call Graph– Windows -> Thread -> Call Path Relations
63

CallpathCall Graph Paths (Must select through “thread” menu.)

Call Path

Profiling dos and don’ts
DO
• Test every change you make
• Profile typical cases• Compile with
optimization flags• Test for scalability
DO NOT
• Assume a change will be an improvement
• Profile atypical cases• Profile ad infinitum
– Set yourself a goal or– Set yourself a time limit
Other Profiling Tools In Ranger
• Scalasca scalasca.org– Scalable all-in-one profiling package.– Requires re-compilation of source to instrument, like Tau.– Accessible by loading the scalasca module:– module load scalasca
• HPCToolkit hpctoolkit.org– All-in-one package similar to Tau and Scalasca but of more recent development– Uses binary instrumentation, so recompilation of the code is not required– Accessible via developer’s installation under:/scratch/projects/hpctoolkit/pkgs/hpctoolkit/bin/