Profilers and Debuggers - Computer Sciencecs415/lectures/weimer-pl-19.pdf · •Debuggers allow you...
39
#1 Profilers and Debuggers Profilers and Debuggers
Transcript of Profilers and Debuggers - Computer Sciencecs415/lectures/weimer-pl-19.pdf · •Debuggers allow you...

#1
Profilers and DebuggersProfilers and Debuggers

#2
Introductory Material
• First, who doesn’t feel comfortable with assembly language?– You’ll get to answer all the assembly questions.
Yes, really.
• Lecture Style:– “Sit on the table” and pose questions. So, wake
up!• Lecture Goal:
– After the lecture you’ll think, “Wow, that was all really obvious. I could have done that.”

#3
One-Slide Summary• A debugger helps to detect the source of a
program error by single-stepping through the program and inspecting variable values.
• Breakpoints are the fundamental building block of debuggers. Breakpoints can be implemented with signals and special OS support.
• A profiler is a performance analysis tool that measures the frequency and duration of function calls as a program runs.
• Profilers can be event- or sampling-based.

#4
Lecture Outline
• Debugging– Signals– How Debuggers Works– Breakpoints– Advanced Tools
• Profiling– Event-based– Statistical
#5
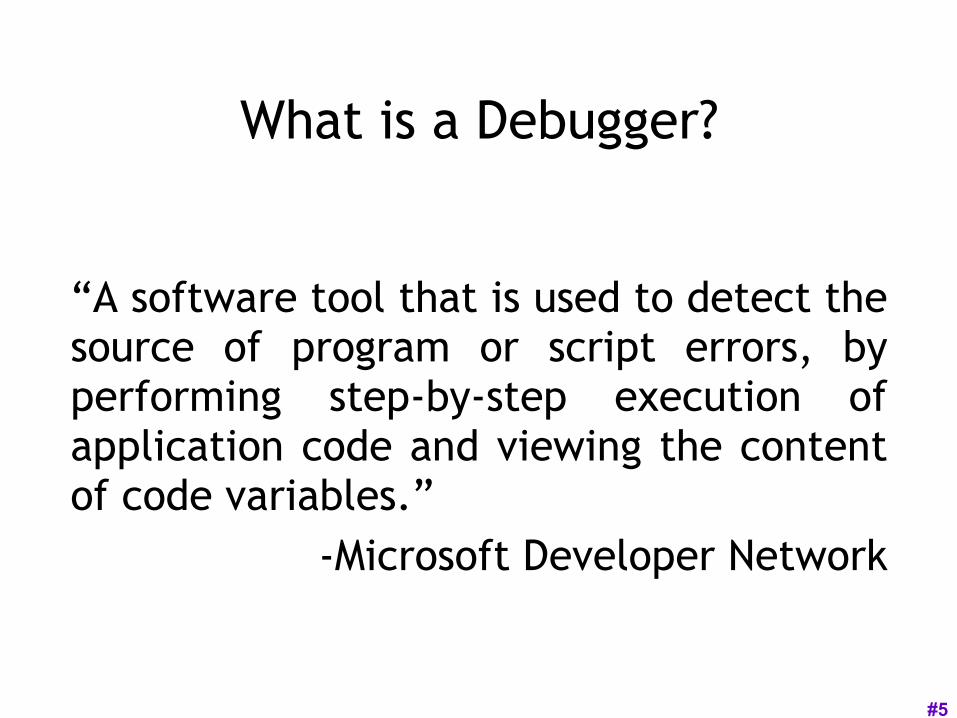
What is a Debugger?
“A software tool that is used to detect the source of program or script errors, by performing step-by-step execution of application code and viewing the content of code variables.”
-Microsoft Developer Network

#6
Machine-Language Debugger
• Only concerned with assembly code• Show instructions via disassembly• Inspect the values of registers, memory• Key Features (we’ll explain all of them)
– Attach to process– Single-stepping– Breakpoints– Conditional Breakpoints– Watchpoints

#7
Signals• A signal is an asynchronous notification sent
to a process about an event:– User pressed Ctrl-C (or did kill %pid)
• Or asked the Windows Task Manager to terminate it
– Exceptions (divide by zero, null pointer)
– From the OS (SIGPIPE)
• You can install a signal handler – a procedure that will be executed when the signal occurs. – Signal handlers are vulnerable to race conditions.
Why?

#8
Signal Example#include <stdio.h>#include <signal.h>
int global = 11;
int my_handler() { printf("In signal handler, global = %d\n",
global); exit(1); }
void main() { int * pointer = NULL;
signal(SIGSEGV, my_handler) ;
global = 33;
* pointer = 0;
global = 55;
printf("Outside, global = %d\n", global); }
• What does this program print?

#9
Attaching A Debugger
• Requires operating system support• There is a special system call that allows
one process to act as a debugger for a target– What are the security concerns?
• Once this is done, the debugger can basically “catch signals” delivered to the target– This isn’t exactly what happens, but it’s a good
explanation …

#10
Building a Debugger#include <stdio.h>#include <signal.h>
#define BREAKPOINT *(0)=0
int global = 11;
int debugger_signal_handler() { printf(“debugger prompt: \n”); // debugger code goes here!}
void main() { signal(SIGSEGV, debugger_signal_handler) ;
global = 33;
BREAKPOINT;
global = 55;
printf("Outside, global = %d\n", global); }
• We can then get breakpoints and interactive debugging– Attach to target– Set up signal
handler– Add in exception-
causing instructions
– Inspect globals, etc.

#11
Reality• We’re not really changing the
source code• Instead, we modify the
assembly• We can’t insert instructions
– Because labels are already set at known constant offsets
• Instead we change them
.file "example.c".globl _global .data .align 4_global: .long 11 .def ___main .section .rdata,"dr"LC0: .ascii "Outside, global = %d\12\0" .text.globl _main .def _main _main: pushl %ebp movl %esp, %ebp subl $24, %esp andl $-16, %esp movl $0, %eax addl $15, %eax addl $15, %eax shrl $4, %eax sall $4, %eax movl %eax, -4(%ebp) movl -4(%ebp), %eax call __alloca call ___main movl $33, _global movl $55, _global movl _global, %eax movl %eax, 4(%esp) movl $LC0, (%esp) call _printf leave ret .def _printf
One of the class goalsis to expose you to
new languages:thus x86 ASM instead
of COOL-ASM.

#12
Adding A Breakpoint
Add a breakpoint just after “global = 33;”
.file "example.c".globl _global .data .align 4_global: .long 11 .def ___main .section .rdata,"dr"LC0: .ascii "Outside, global = %d\12\0" .text.globl _main .def _main _main: pushl %ebp movl %esp, %ebp subl $24, %esp andl $-16, %esp movl $0, %eax addl $15, %eax addl $15, %eax shrl $4, %eax sall $4, %eax movl %eax, -4(%ebp) movl -4(%ebp), %eax call __alloca call ___main movl $33, _global movl $55, _global movl _global, %eax movl %eax, 4(%esp) movl $LC0, (%esp) call _printf leave ret .def _printf
.file "example.c".globl _global .data .align 4_global: .long 11 .def ___main .section .rdata,"dr"LC0: .ascii "Outside, global = %d\12\0" .text.globl _main .def _main _main: pushl %ebp movl %esp, %ebp subl $24, %esp andl $-16, %esp movl $0, %eax addl $15, %eax addl $15, %eax shrl $4, %eax sall $4, %eax movl %eax, -4(%ebp) movl -4(%ebp), %eax call __alloca call ___main movl $33, _global movl $0, 0 movl _global, %eax movl %eax, 4(%esp) movl $LC0, (%esp) call _printf leave ret .def _printf
Storage Cell:
movl $55, _global
_main + 14

#13
Software Breakpoint Recipe
• Debugger has already attached and set up its signal handler
• User wants a breakpoint at instruction X• Store (X, old_instruction_at_X)• Replace instruction at X with “*0=0”
– Pick something illegal that’s 1 byte long
• Signal handler replaces instruction at X with stored old_instruction_at_X
• Give user interactive debugging prompt

#14
Advanced Breakpoints• Get register and local values by walking the stack• Optimization: hardware breakpoints
– Special register: if PC value = HBP register value, signal an exception
– Faster than software, works on ROMs, only limited number of breakpoints, etc.
• Feature: condition breakpoint: “break at instruction X if some_variable = some_value”
• As before, but signal handler checks to see if some_variable = some_value– If so, present interactive debugging prompt– If not, return to program immediately– Is this fast or slow?

#15
Single-Stepping
• Debuggers allow you to advance through code on instruction at a time
• To implement this, put a breakpoint at the first instruction (= at program start)
• The “single step” or “next” interactive command is equal to:– Put a breakpoint at the next instruction
• +1 for COOL-ASM, +4 bytes for RISC, +X bytes for CISC, etc.
– Resume execution


#17
Watchpoint Implementation
• Software Watchpoints– Put a breakpoint at every instruction (ouch!)– Check the current value of L against a stored
value– If different, give interactive debugging prompt– If not, set next breakpoint and continue (i.e.,
single-step)
• Hardware Watchpoints– Special register holds L: if the value at address L
ever changes, the CPU raises an exception

Q: Movies (284 / 842)
• Name the movie described below and either the general scientific theory that Malcolm invokes or the ambushing cold-blooded killers. In this Oscar-winning 1993 Spielberg/Crichton extravaganza involving cloning and theme parks, Dr. Ian Malcolm correctly predicts that things will not turn out well.

Q: Advertising (799 / 842)
•Name the brand most associated with instant-print self-developing photographic film and cameras. The technology was invented in 1947 by corporation founder Edwin H. Land.

Q: Cartoons (671 / 842)
•Name all five main characters and the primary automobile from Scooby Doo, Where Are You!

Video Game History(nd2ga memorial)
• This 1979-1980 Atari 2600 video game introduced the first widely-known Easter egg. At the time, Atari did not allow game designers or programmers to credit themselves in any way (games were marketed and branded as produced by Atari overall). Warren Robinett included a secret room crediting himself as the designer. When a 15-year-old from Utah discovered it and wrote to Atari for an explanation, they tasked Brad Stewart with fixing it, but he said he would only change it to “Fixed by Brad Stewart”. Atari decided to leave it in game, dubbing such hidden features Easter eggs and saying they would include more in the future. The game itself involves carrying items around three castles to defeat three dragons.

Real-World Languages• This Northern European language boasts
5 million speakers (including Linus Torvalds). Its original writing system was devised in the 16th century from Swedish, German and Latin. Its eight vowels have powerful lexical and grammatical roles; doubled vowels do not become dipthongs.

#23
Source-Level Debugging
• What if we want to …– Put a breakpoint at a source-level location (e.g.,
breakpoint at main.c line 20)– Single-step through source-level instructions
(e.g., from main.c:20 to main.c:21) – Inspect source-level variables (e.g., inspect
local_var, not register AX)
• We’ll need the compiler’s help• How can we do it?
#24
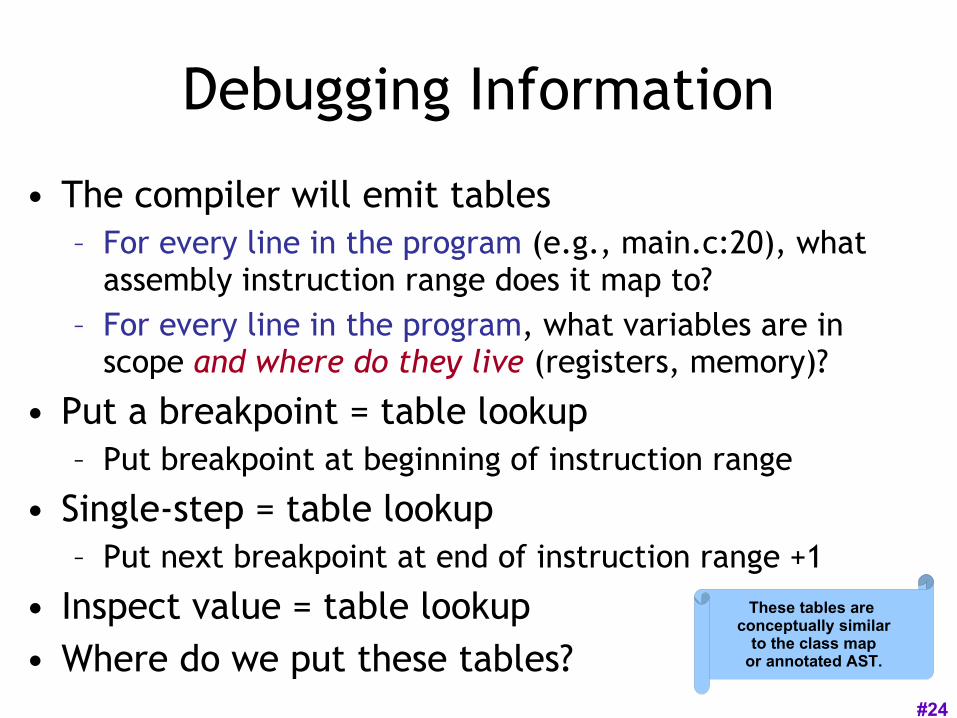
Debugging Information
• The compiler will emit tables– For every line in the program (e.g., main.c:20), what
assembly instruction range does it map to?– For every line in the program, what variables are in
scope and where do they live (registers, memory)?
• Put a breakpoint = table lookup – Put breakpoint at beginning of instruction range
• Single-step = table lookup– Put next breakpoint at end of instruction range +1
• Inspect value = table lookup• Where do we put these tables?
These tables are conceptually similar
to the class mapor annotated AST.

#25
How Big Are Those Tables?/* example.c */#include <stdio.h>#include <signal.h>
int my_global_var = 11;
void main() {
int my_local_var = 22;
my_local_var += my_global_var;
printf("Outside, my_local_var = %d\n", my_local_var); }
“gcc example.c” 9418 bytes“gcc –g example.c” 23790 bytes

#26
Debugging vs. Optimizing
• We said: the compiler will emit tables– For every line in the program (e.g., main.c:20),
what assembly instruction range does it map to?– For every line in the program, what variables are
in scope and where do they live (registers, memory)?
• What can go wrong if we optimize the program?

#27
Replay Debugging• Running and single-stepping are handy• But wouldn’t it be nice to go back in time?• That is, from the current breakpoint, undo
instructions in reverse order• Intuition: functional + single assignment
x = 11; let x0 = 11 in x = x + 22; let x1 = x0 + 22 in
breakpoint ; breakpoint ;x = x + 33; let x2 = x1 + 33 in
print x print x

#28
Time Travel• Store the state at various times
– time t=0 at program start– time t=88 after 88 instructions– … why does this work?
• When the user asks you to go back one step, you actually go back to the last stored state and run the program forward again with a breakpoint– e.g., to go back from t=150, put breakpoint at
instruction 149 and re-run from t=88’s state• ocamldebug has this power – try it!

#29
Valgrind• Valgrind is a suite of free tools for
debugging and profiling – Finds memory errors, profiles cache
times, call graphs, profiles heap space
• It does so via dynamic binary translation– Fancy words for “it is an interpreter” – No need to modify, recompile or relink– Works with any language
• Can attach gdb to your process, etc. • Problem: slowdown of 5x-100x
– Rational Purify (commercial) is similar– Check out Strata by Jack Davidson

#30
Valgrind Exampleint main() { int some_var = 55; int array[10]; int i; for (i=0;i<=10;i++) array[i] = i; printf("some_var = %d\n",
some_var); }
What’s the output?

#31
Valgrind Exampleint main() { int some_var = 55; int array[10]; int i; for (i=0;i<=10;i++) array[i] = i; printf("some_var = %d\n",
some_var); }
[weimer@weimer-laptop ~]$ ./a.out some_var = 10
Sadly, valgrind won’t help you here. Psych!

#32
DDD• Gnu Data
Display Debugger– Similar in
spirit to Visual Studio’s built-in debugger
– But for gdb, the Java debugger, the perl debugger, the python debugger, etc.
• How does this work? You tell me!
#33
Profiling
• A profiler is a performance analysis tool that measures the frequency and duration of function calls as a program runs.
• Flat profile– Computes the average call times for functions
but does not break times down based on context
• Call-Graph profile– Computes call times for functions and also the
call-chains involved
#34
Event-Based Profiling
• Interpreted languages provide special hooks for profiling– Java: JVM-Profile Interface, JVM API– Python: sys.set_profile() module– Ruby: profile.rb, etc.
• You register a function that will get called whenever the target program calls a method, loads a class, allocates an object, etc.– You could do this for PA5: count the number of
object allocations, etc.– (And we do some profiling for you in CA5.)

#35
JVM Profiling Interface• VM notifies profiler agent of various events
(heap allocation, thread start, method invocation, etc.)
• Profiler agent issues control commands to the JVM and communicates with a GUI
#36
Statistical Profiling
• You can arrange for the operating system to send you a signal (just like before) every X seconds (see alarm(2))
• In the signal handler you determine the value of the target program counter– And append it to a growing list file– This is called sampling
• Later, you use that debug information table to map the PC values to procedure names– Sum up to get amount of time in each procedure

#37
Sampling Analysis• Advantages
– Simple and cheap – the instrumentation is unlikely to disturb the program too much
– No big slowdown
• Disadvantages– Can completely miss periodic behavior (e.g., you
sample every k seconds but do a network send at times 0.5 + nk seconds)
– High error rate: if a value is n times the sampling period, the expected error in it is sqrt(n) sampling periods
• Read the gprof paper for midterm2

#38
While Derivation On The Board?
• If we have time, let's do this together ...• E = [ x → a ]• S = [ a → 0 ] • S' = [ a → 1 ]
while x < 1 loop x <- x + 1 pool

#39
Homework• Midterm 2 – Wed April 15th In Class
– Covers Lectures “Code Generation” to “Linking, Loading and Shared Libraries” (i.e., everything after Midterm 1) plus each WA and PA done during that time
– Everything after Earley parsing
• Midterm 2 Review Session?– Post on the forum!