Profile of Intimate Partner Violence Cases in Large … Profile of Intimate Partner Violence Cases...
12
U.S. Department of Justice Office of Justice Programs Bureau of Justice Statistics Bureau of Justice Statistics October 2009, NCJ 228193 Highlights SPECIAL REPORT State Court Processing Statistics Profile of Intimate Partner Violence Cases in Large Urban Counties Erica L. Smith and Donald J. Farole, Jr., Ph.D. BJS Statisticians n the state courts of 16 large urban counties, 3,750 cases of intimate partner violence (IPV) were filed in May 2002. These cases represent 83% of the 4,562 domestic violence cases filed in the 16 counties. 1 A case was defined as intimate partner violence if it involved an allegation of intentional physical violence committed, attempted, or threatened between spouses, ex-spouses, common-law spouses, boy- friends or girlfriends, present or past. For more information on the definitions of domestic vio- lence and intimate partner violence used in this report, see the Methodology . More than half of IPV defendants were con- victed, and of those convicted, more than 80% were sentenced to incarceration in either prison or jail. This report examines the case characteris- tics that are associated with an increased likeli- hood of conviction. 1 See appendix table 1 for distribution of victim-offender rela- tionships for all 4,562 domestic violence cases in the study. This report is based on data collected in the study Processing of Domestic Violence Cases in State Courts, conducted by the Bureau of Justice Statistics (BJS). Findings are based on informa- tion documented in prosecutor files and court records of 3,750 intimate partner violence cases. Cases were tracked for one year following the defendant’s first court appearance in May 2002. Most cases of intimate partner violence involved a female victim and a male defendant Victims in intimate partner violence cases were generally female (86%), while defendants were generally male (86%) (table 1). The majority of IPV cases (84%) involved a male defendant and a female victim. Twelve percent of cases involved a female defendant and a male victim (not shown in table). In 4% of IPV cases, the defendant and victim were of the same gender. I Among 3,750 cases of intimate partner violence filed in the state courts of 16 large urban counties in May 2002: • Most involved a female victim and a male defendant (84%). • Most involved a charge of assault, either aggravated (12%) or simple (78%); an additional 5% were charged with intimida- tion, including stalking. • Nearly half (46%) involved a defendant with a prior history of abuse toward the same victim. • Approximately 1 in 4 cases involved the use of a weapon, such as a gun, a knife, or other blunt object. • Defendants charged with a felony (44%) were twice as likely to have used a weapon as defendants charged with a misde- meanor (22%). • A witness to the incident was present in nearly half of intimate partner violence cases; half of those witnesses were children. • A history of abuse between the victim and defendant, among other characteristics, was associated with a higher likelihood that the case resulted in a conviction.
Transcript of Profile of Intimate Partner Violence Cases in Large … Profile of Intimate Partner Violence Cases...

U.S. Department of JusticeOffice of Justice ProgramsBureau of Justice Statistics
Bureau of Justice Statistics
October 2009, NCJ 228193
Highlights
SPECIAL REPORT
State Court Processing Statistics
Profile of Intimate Partner Violence Cases in Large Urban CountiesErica L. Smith and Donald J. Farole, Jr., Ph.D.BJS Statisticians
n the state courts of 16 large urban counties,3,750 cases of intimate partner violence(IPV) were filed in May 2002. These cases
represent 83% of the 4,562 domestic violencecases filed in the 16 counties.1 A case wasdefined as intimate partner violence if it involvedan allegation of intentional physical violencecommitted, attempted, or threatened betweenspouses, ex-spouses, common-law spouses, boy-friends or girlfriends, present or past. For moreinformation on the definitions of domestic vio-lence and intimate partner violence used in thisreport, see the Methodology.
More than half of IPV defendants were con-victed, and of those convicted, more than 80%were sentenced to incarceration in either prisonor jail. This report examines the case characteris-tics that are associated with an increased likeli-hood of conviction.1See appendix table 1 for distribution of victim-offender rela-tionships for all 4,562 domestic violence cases in the study.
This report is based on data collected in thestudy Processing of Domestic Violence Cases inState Courts, conducted by the Bureau of JusticeStatistics (BJS). Findings are based on informa-tion documented in prosecutor files and courtrecords of 3,750 intimate partner violence cases.Cases were tracked for one year following thedefendant’s first court appearance in May 2002.
Most cases of intimate partner violence involved a female victim and a male defendantVictims in intimate partner violence cases weregenerally female (86%), while defendants weregenerally male (86%) (table 1). The majority ofIPV cases (84%) involved a male defendant and afemale victim. Twelve percent of cases involved afemale defendant and a male victim (not shownin table). In 4% of IPV cases, the defendant andvictim were of the same gender.
I
Among 3,750 cases of intimate partner violence filed in the state courts of 16 large urban counties in May 2002:• Most involved a female victim and a male defendant (84%).
• Most involved a charge of assault, either aggravated (12%) or simple (78%); an additional 5% were charged with intimida-tion, including stalking.
• Nearly half (46%) involved a defendant with a prior history of abuse toward the same victim.
• Approximately 1 in 4 cases involved the use of a weapon, such as a gun, a knife, or other blunt object.
• Defendants charged with a felony (44%) were twice as likely to have used a weapon as defendants charged with a misde-meanor (22%).
• A witness to the incident was present in nearly half of intimate partner violence cases; half of those witnesses were children.
• A history of abuse between the victim and defendant, among other characteristics, was associated with a higher likelihood that the case resulted in a conviction.

2 Profile of Intimate Partner Violence Cases in Large Urban Counties2 Profile of Intimate Partner Violence Cases in Large Urban Counties
IPV victims and defendants had similar race andethnic profiles. Roughly equal percentages ofvictims and defendants were white, black, andHispanic. This was comparable to the distribu-tion of race and Hispanic origin across all violentfelony defendants in the 16 counties in 2002.2
Fifty-nine percent of defendants and 58% of vic-tims in IPV cases were between the ages of 18and 34 at the time of the incident. Intimate part-ner violence involving victims age 55 or olderaccounted for less than 3% of cases. Becausethese cases were processed in adult courts, veryfew defendants (0.2%) were under age 18.
The majority of IPV defendants were charged with a misdemeanorA misdemeanor was the most serious chargefiled against the majority of defendants in inti-mate partner violence cases. Most misdemeanorcharges (96%) were for simple assault (table 2).Intimidation made up most of the remainingmisdemeanor IPV charges.
Aggravated assault made up two-thirds (66%) offelony IPV charges. About 9% of felony IPVcharges were for rape or sexual assault and about1% were for murder. Together, 9 in 10 defendantsin intimate partner violence cases were chargedwith either simple (78%) or aggravated (12%)assault.
Most intimate partner violence incidents occurred in the victim’s residenceProsecutor files indicated that 58% of IPV inci-dents occurred in a residence shared by the vic-tim and defendant (table 3). Another 21% of IPVincidents occurred in a residence occupied bythe victim, but not by the defendant. A greaterpercentage of misdemeanor (60%) than felonycases (49%) arose from incidents that occurredin a shared residence. Less than 2% of felony ormisdemeanor cases occurred in the workplace.2See Felony Defendants in Large Urban Counties, 2002, February 2006, NCJ 210818, available at http://www.ojp.usdoj.gov/bjs/abstract/fdluc02.htm. (Last accessed September 24, 2009.)
Table 1. Demographic characteristics of intimate partner violence victims and defendants in 16 large counties, May 2002
Percent of intimate partner violence—Demographic characteristic Victims Defendants
Total 100% 100%Gender
Male 14.0% 86.3%Female 86.0 13.7
Race/Hispanic originWhite non-Hispanic 37.1% 33.6%Black non-Hispanic 26.4 33.5Hispanic 33.6 30.8Other non-Hispanic 2.8 2.0
Age at offense17 or younger 2.7% 0.2%18-24 26.1 24.225-34 34.9 34.835-54 34.0 38.255 or older 2.3 2.6
Note: Among the 3,750 cases of intimate partner violence, data on a defendant’s gender were reported for 99.4%; race/Hispanic origin for 85.6%; age for 99.2%. Data on a victim’s gender were reported for 100% of cases; race/Hispanic origin for 94.5%; age for 94.4%.
Table 2. Most serious charges filed against intimate partner violence defendants in 16 large counties, by charge type, May 2002
Percent of defendants charged with a—Most serious arrest charge All cases Felony Misdemeanor
Total 100% 100% 100%Murder 0.2 1.0 --Rape/sexual assault 1.7 8.5 0.2Robbery 0.2 1.3 --Aggravated assault 12.2 66.1 --Simple assault 77.9 -- 95.6Intimidationa 4.9 10.1 3.7Other violent offenseb 2.8 13.0 0.5
Total cases 3,750 693 3,057Note: Aggravated assault is defined as felony assault. Simple assault is defined as misdemeanor assault.--No cases reported.aIncludes stalking and harassment. bIncludes offenses such as kidnapping and false imprisonment/criminal confinement.

October 2009 3
A third of defendants in intimate partner violence cases were using alcohol or drugsThirty-three percent (33%) of defendants in IPVcases were using alcohol or drugs at the time ofthe incident. The percentage did not vary bywhether a defendant was charged with a felonyor a misdemeanor (table 4).
The majority of defendants using alcohol ordrugs at the time of the incident were under theinfluence of alcohol only. Defendants chargedwith a felony (28%) IPV were as likely as defen-dants charged with a misdemeanor (29%) tohave been under the influence of alcohol.
Defendants used a weapon in 1 in 4 intimate partner violence casesA weapon was used by the defendant in 26% ofIPV cases (table 5). Felony IPV (44%) was morelikely to be characterized by weapon use thanmisdemeanor IPV (22%). About 6% of thedefendants charged with a felony used a firearm,while about 15% used a knife or other sharpobject.
Female defendants (41%) were more likely thanmale defendants (24%) to use a weapon duringan incident of intimate partner violence (notshown in table). Additionally, female defendants(12%) were twice as likely as male defendants(5%) to use a knife or sharp object, and threetimes more likely (17%) than male defendants(6%) to use a blunt object such as a pipe or rockduring an IPV incident.
Prosecutor files indicated that about three-quar-ters (74%)of IPV defendants did not use aweapon. These include cases in which defen-dants may have used hands, fists, or feet as a per-sonal weapon.
Table 3. Location of incident in intimate partner violence cases in 16 large counties, by charge type, May 2002
Percent of defendants charged with a—Location of incident All cases Felony Misdemeanor
Total 100% 100% 100%Residential 85.0 83.8 85.3
Residence shared by victim and defendant 58.1 48.9 60.2Victim's residence 21.1 25.3 20.2Defendant's residence 4.2 7.5 3.4Other residencea 1.6 1.9 1.6
Victim or defendant's workplace 1.2 1.6 1.1Private or public vehicle 7.0 8.8 6.6Public place 5.9 4.5 6.2Other locationb 1.0 1.2 0.9
Total casesc 3,717 683 3,034 aIncludes incidents that occurred at the home of a relative or a friend.bIncludes incidents that occurred in a hotel or motel room, at a shelter, or threats made over the telephone.cExcludes cases for which the location of incident was not reported.
Table 5. Weapon use among defendants in intimate partner violence cases in 16 large counties, by charge type, May 2002
Percent of defendants charged with a—Weapon use All cases Felony Misdemeanor
Total 100% 100% 100%Primary weapon defendant used
during the incident 26.0 44.1 21.9Firearm 2.0 6.2 1.0Knife/sharp object 5.8 14.5 3.9Hard object/wall 5.7 8.8 4.9Blunt object 7.1 8.4 6.9Other weapon* 3.1 3.3 3.1Unknown weapon 2.3 2.8 2.2
Defendant did not use a weapon 74.0 55.9 78.1Total cases 3,750 693 3,057
*Includes flammable items, ropes, telephone cords, belts, and other items.
Table 4. Alcohol and drug use among defendants in intimate partner violence cases in 16 large counties, by charge type, May 2002
Percent of defendants charged with a—Alcohol or drug use All cases Felony Misdemeanor
Total 100% 100% 100%Defendant was using alcohol or
drugs at the time of the incident 32.8 32.9 32.7Alcohol only 28.6 28.0 28.7Drugs only 1.8 2.5 1.6Alcohol and drugs 1.0 1.7 0.9Other substance* 1.4 0.7 1.6
Defendant was not using alcohol or drugs at the time of the incident 67.2 67.1 67.3Total cases 3,750 693 3,057
*Includes unknown substances.

4 Profile of Intimate Partner Violence Cases in Large Urban Counties4 Profile of Intimate Partner Violence Cases in Large Urban Counties
Nearly 9 in 10 victims of IPV sustained an injury during the incident; about 1 in 10 suffered a severe injuryEighty-nine percent of IPV victims were injuredas a result of the incident (table 6). Most victimssustained injuries that were of a less severenature, such as minor cuts, redness, bruises, andcomplaints of pain. Nine percent of victims sus-tained more severe injuries, including gunshotand stab wounds, rape or sexual assault, severelacerations, and broken bones.
The overall prevalence of any victim injury wascomparable between felony and misdemeanorcases; however, victims of felony IPV (23%) weremore likely than victims of misdemeanor IPV(5%) to suffer more severe injuries. Nearly 3% ofall felony IPV victims suffered a gunshot or astab wound, 8% were raped or sexually assaulted,and 9% suffered severe lacerations or burns.
A direct witness was present in more than 40% of intimate partner violence cases; half of those witnesses were childrenHalf of intimate partner violence cases were wit-nessed by a third party (table 7). The majority ofthose witnesses were direct eyewitnesses to theviolence.
Children were witnesses to the violence in 22%of IPV cases (table 8). These child witnessesaccounted for half of the direct eyewitnesses tothe violence (not shown in table). In another14% of IPV cases, a child was present at the timeof the incident, but did not directly witness theviolence.
Table 7. Witness to the incident in intimate partner violence cases in 16 large counties, by charge type, May 2002
Percent of defendants charged with a—Presence of witness All cases Felony Misdemeanor
Total 100% 100% 100%Witness to the incident 49.9 53.8 49.0
Direct/eyewitness 43.0 45.0 42.5Indirect witness* 8.1 9.2 7.9
No witness to the incident 50.1 46.2 51.0Total cases 3,750 693 3,057
Note: Percents do not sum to 100% because prosecutorial files may indicate both direct and indirect witnesses to the incident.*Includes individuals with knowledge of the incident but did not visually witness the incident.
Table 8. Children present during the incident in intimate partner violence cases in 16 large counties, by charge type, May 2002
Percent of defendants charged with a—Presence of children All cases Felony Misdemeanor
Total 100% 100% 100%Child was present during incident 36.4 36.9 36.3
Child witnessed violence 22.0 22.7 21.8Child did not witness violence 14.4 14.3 14.5
Child not present during incident 63.6 63.1 63.7Total cases 3,750 693 3,057
Table 6. Most severe injury to victim in intimate partner violence cases in 16 large counties, by charge type, May 2002
Percent of defendants charged with a—Type of injury All cases Felony Misdemeanor
Total 100% 100% 100%Any injury 89.2 86.0 90.0
More severe injury 8.6 22.8 5.4Gunshot/stab wound 0.7 2.6 0.2Rape/sexual assault 1.7 8.3 0.2Severe lacerations/burns 4.8 8.7 4.0Other major injurya 1.4 3.2 1.0
Less severe injuryb 60.7 45.3 64.2Unknown injury 19.9 17.9 20.3
Not injured/unknown 10.8 14.0 10.0Total cases 3,750 693 3,057
aIncludes loss of teeth, broken bones, and loss of consciousness.bIncludes minor cuts, redness, bruises, and complaints of pain.

October 2009 5
Physical evidence was obtained in about 7 in 10 intimate partner violence casesPhysical evidence, such as photos, tapes of the911 call, and forensic evidence, was obtained in68% of IPV cases (table 9). Photographic evi-dence and the tape of a 911 call were the mostcommon forms of physical evidence obtained.Physical evidence was obtained in a higher per-centage of felony (75%) than misdemeanor(66%) cases.
The types of evidence obtained differed slightlybetween felony and misdemeanor IPV cases.Prosecutor files were more likely to indicate thatforensic evidence had been obtained in felonyintimate partner violence cases (10%) than inmisdemeanor IPV cases (2%). Felony cases werealso more likely to result in a weapon beingrecovered (11%) and medical records beingobtained (10%) than misdemeanor IPV cases.
In addition to physical evidence, a statement wasobtained from a witness to the incident in justunder half of IPV cases. Felony cases were morelikely than misdemeanor cases to feature a wit-ness statement. In about 1 in 10 cases of IPV, theprosecution obtained a statement from thedefendant.
Nearly 1 in 4 intimate partner violence victims had reported prior violence by the same defendant to policeOne factor known to affect outcomes in criminalcases is a defendant’s prior criminal history.While the survey did not collect information ona defendant’s entire criminal history, two mea-sures of prior domestic violence were docu-mented from information recorded in prosecu-tor files: 1) history of abuse between the victimand the defendant in the case, and 2) whether thevictim reported any prior violence to the police.
Forty-six percent of intimate partner violencecases involved a defendant with a prior history ofabuse toward the same victim, and 24% of vic-tims of IPV had reported prior violence to police(table 10). These percentages were similar forboth felony and misdemeanor IPV.
Table 10. History and reporting of prior violence between victim and defendant in intimate partner violence cases in 16 large counties, by charge type, May 2002
Defendants charged with a—Percent of cases in which— All cases Felony MisdemeanorThere was a history of abuse between
victim and defendant 46.3% 46.6% 46.3%Victim reported prior violence by
defendant to police 23.5 26.1 22.9Total cases 3,750 693 3,057
Table 9. Evidence obtained in intimate partner violence cases in 16 large counties, by charge type, May 2002
Percent of defendants charged with a—Type of evidence All cases Felony Misdemeanor
Total 100% 100% 100%Any evidence obtained 83.5 90.9 81.8
Physical evidence 67.9 74.9 66.3Photos of victim/defendant 46.5 44.9 46.9Tape of 911 call 25.9 30.4 24.9Photos of scene 12.2 19.8 10.5Weapon recovered 4.7 10.7 3.3Medical records 3.4 10.4 1.8Forensic evidence 3.3 9.8 1.8Other evidence 8.3 11.3 7.7
Statement from witness 45.9 58.0 43.1 Statement from defendant 10.2 12.7 9.7No evidence obtained 16.5 9.1 18.2
Total cases 3,750 693 3,057Note: Detail does not sum to total because more than one type of evidence was obtained in some cases.
6 Profile of Intimate Partner Violence Cases in Large Urban Counties6 Profile of Intimate Partner Violence Cases in Large Urban Counties
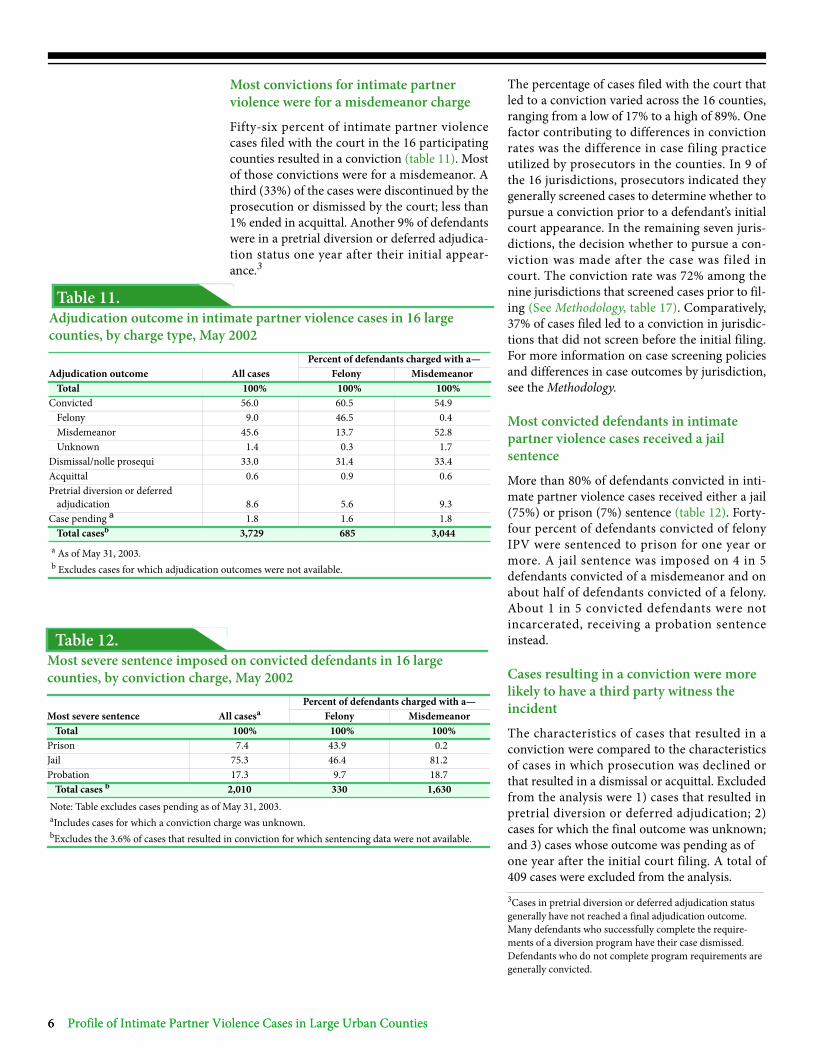
Most convictions for intimate partner violence were for a misdemeanor chargeFifty-six percent of intimate partner violencecases filed with the court in the 16 participatingcounties resulted in a conviction (table 11). Mostof those convictions were for a misdemeanor. Athird (33%) of the cases were discontinued by theprosecution or dismissed by the court; less than1% ended in acquittal. Another 9% of defendantswere in a pretrial diversion or deferred adjudica-tion status one year after their initial appear-ance.3
The percentage of cases filed with the court thatled to a conviction varied across the 16 counties,ranging from a low of 17% to a high of 89%. Onefactor contributing to differences in convictionrates was the difference in case filing practiceutilized by prosecutors in the counties. In 9 ofthe 16 jurisdictions, prosecutors indicated theygenerally screened cases to determine whether topursue a conviction prior to a defendant’s initialcourt appearance. In the remaining seven juris-dictions, the decision whether to pursue a con-viction was made after the case was filed incourt. The conviction rate was 72% among thenine jurisdictions that screened cases prior to fil-ing (See Methodology, table 17). Comparatively,37% of cases filed led to a conviction in jurisdic-tions that did not screen before the initial filing.For more information on case screening policiesand differences in case outcomes by jurisdiction,see the Methodology.
Most convicted defendants in intimate partner violence cases received a jail sentenceMore than 80% of defendants convicted in inti-mate partner violence cases received either a jail(75%) or prison (7%) sentence (table 12). Forty-four percent of defendants convicted of felonyIPV were sentenced to prison for one year ormore. A jail sentence was imposed on 4 in 5defendants convicted of a misdemeanor and onabout half of defendants convicted of a felony.About 1 in 5 convicted defendants were notincarcerated, receiving a probation sentenceinstead.
Cases resulting in a conviction were more likely to have a third party witness the incident The characteristics of cases that resulted in aconviction were compared to the characteristicsof cases in which prosecution was declined orthat resulted in a dismissal or acquittal. Excludedfrom the analysis were 1) cases that resulted inpretrial diversion or deferred adjudication; 2)cases for which the final outcome was unknown;and 3) cases whose outcome was pending as of one year after the initial court filing. A total of409 cases were excluded from the analysis.3Cases in pretrial diversion or deferred adjudication status generally have not reached a final adjudication outcome. Many defendants who successfully complete the require-ments of a diversion program have their case dismissed. Defendants who do not complete program requirements are generally convicted.
Table 12. Most severe sentence imposed on convicted defendants in 16 large counties, by conviction charge, May 2002
Percent of defendants charged with a—Most severe sentence All casesa Felony Misdemeanor
Total 100% 100% 100%Prison 7.4 43.9 0.2Jail 75.3 46.4 81.2Probation 17.3 9.7 18.7
Total cases b 2,010 330 1,630 Note: Table excludes cases pending as of May 31, 2003.aIncludes cases for which a conviction charge was unknown.bExcludes the 3.6% of cases that resulted in conviction for which sentencing data were not available.
Table 11. Adjudication outcome in intimate partner violence cases in 16 large counties, by charge type, May 2002
Percent of defendants charged with a—Adjudication outcome All cases Felony Misdemeanor
Total 100% 100% 100%Convicted 56.0 60.5 54.9
Felony 9.0 46.5 0.4Misdemeanor 45.6 13.7 52.8Unknown 1.4 0.3 1.7
Dismissal/nolle prosequi 33.0 31.4 33.4Acquittal 0.6 0.9 0.6Pretrial diversion or deferred
adjudication 8.6 5.6 9.3Case pending a 1.8 1.6 1.8
Total casesb 3,729 685 3,044 a As of May 31, 2003.b Excludes cases for which adjudication outcomes were not available.

October 2009 7
A third party witnessed the incident in morethan half (56%) of the cases that resulted in aconviction, compared to 41% of cases that wereadjudicated by dismissal, acquittal, or nolleprosequi (table 13). The prosecution obtainedphysical evidence and a statement by the defen-dant in a slightly larger percentage of cases thatresulted in conviction than those that did not.Cases that led to a conviction were also morelikely to have a history of abuse between the vic-tim and the defendant, as well as a child presentat the time of the incident. A somewhat higherpercentage of convicted defendants were usingalcohol or drugs at the time of the incident, com-pared to defendants who were not convicted.
Cases in which the defendant made a formal statement were twice as likely to result in convictionThe survey collected information about thecharacteristics of intimate partner violence casesthat may influence the likelihood that a case willresult in conviction. Logistic regression analysiswas used to assess the unique contribution ofvarious case characteristics to the probability ofconviction (table 14). The analysis producedestimates of the association between each inde-pendent variable (the case characteristics) andthe dependent variable (the likelihood of convic-tion). See the Methodology for more informationabout logistic regression techniques.
In general the logistic regression analysis yieldedpatterns of influence on the probability of con-viction similar to that of the bivariate results.The presence of a statement from the defendantwas the case characteristic with the greatestimpact on the likelihood of conviction. The oddsratio indicated that cases in which prosecutorsobtained a statement from the defendant weretwice as likely to result in conviction than casesin which there was no statement. Additionally,the presence of a third-party witness to the inci-dent increased the likelihood of conviction by1.7 times, as did a documented history of abusebetween the victim and defendant. Whetherphysical evidence was obtained was also posi-tively, although less strongly, associated with thelikelihood of a conviction. Other case character-istics, such as whether a child was present at thetime of the incident and whether the defendantused a weapon, had little independent impact onthe probability of a conviction.4
4Other factors potentially related to the probability of convic-tion were also included in the logistic regression model but are not reported in table 14. See the Methodology for more detail.
Table 14. Logistic regression analysis of the effect of case characteristics on the probability of conviction in intimate partner violence cases in 16 large counties, May 2002Case characteristics Odds ratio*Statement from defendant 2.04Witness to the incident 1.73History of abuse 1.69Physical evidence obtained 1.54Victim injured in incident 1.28Defendant using drugs/alcohol at time of incident 1.11Statement from victim 1.05Child present at time of incident 1.01Weapon used in incident 0.99Note: Table presents the results of a logistic regression analysis with the dependent variable indicating the predicted probability that any conviction was obtained. A total of 3,341 cases were included in the logistic regression analysis. Excluded from the analysis were all cases that resulted in pretrial diversion or deferred adjudication, cases with an unknown adjudication outcome, and cases pending as of May 31, 2003. Also excluded from the analysis were cases for which data were unavailable for one or more variables included in the statistical model. Other variables potentially related to the probability of con-viction were also included in the logistic regression analysis. These included defendant race and gender, whether the defendant was charged with a felony or misdemeanor, and a variable that accounted for individual county-level effects. See the Methodology for more detail.*An odds ratio greater than 1 indicates that the variable is associated with an increased likelihood that the case resulted in conviction. Variables with larger odds ratios have a larger effect on the probability of conviction than variables with smaller odds ratios.
Table 13. Characteristics of intimate partner violence cases in 16 large counties, by adjudication outcome, May 2002
Adjudication outcomeConviction
Case characteristicsDismissal/acquittal/nolle prosequi Any convictiona Felony Misdemeanor
Incident characteristicsDefendant used alcohol or drugs 29.0% 34.7% 34.1% 35.1%Child present at time of incident 30.8 40.1 38.6 40.3Weapon used in incident 25.7 26.7 46.1 23.1Victim injured in incident 91.6 90.6 78.7 92.7Witness to the incident 40.6 56.4 59.9 55.9
Direct/eyewitness 36.7 47.0 47.0 47.0Indirect witness 4.2 11.2 13.5 11.1
Prior historyHistory of abuse between victim
and defendant 40.4% 51.9% 53.3% 52.1%Victim reported prior violence
by defendant to police 24.1 24.9 28.7 24.5Evidence obtainedAny physical evidence obtained 63.4% 70.6% 81.4% 68.5%Statement from witness 44.9 45.3 57.2 43.0Statement from defendant 5.5 13.1 18.6 12.1
Total casesb 1,255 2,086 334 1,699aIncludes cases in which conviction charge was unknown.bExcludes cases with pretrial diversion or deferred adjudication, cases with an unknown adjudication outcome, and cases pending as of May 31, 2003.

8 Profile of Intimate Partner Violence Cases in Large Urban Counties8 Profile of Intimate Partner Violence Cases in Large Urban Counties
About 1 in 8 intimate partner violence cases involved a female defendant and male victim; another 1 in 20 involved a defendant and victim of the same genderSome case characteristics differed based on the gender of the defendant and victim. Cases with male defendants and female victimswere more likely than others to entail a history of abuse between victim and defendant (table 15). A child was also more likely tohave witnessed the violence in these cases. Defendant weapon use was more prevalent in cases with female defendants and malevictims than in other cases.
A larger percentage of cases with male defendants and female victims resulted in conviction than cases with female defendants andmale victims or same-gender cases (table 16). Female defendants convicted of IPV against male defendants were relatively less likelyto receive an incarceration sentence.
Table 15. Incident characteristics of intimate partner violence cases in 16 large counties, by defendant and victim gender, May 2002
Intimate partner violence cases involving a—
Incident characteristicMale defendant and female victim
Female defendant and male victim
Defendant and victim of same gender
Percent of cases in which—Defendant was using drugs or alcohol 33.4% 28.1% 34.2%Weapon was used in incident 23.2 41.3 35.6Victim was injured in incident 91.0 90.2 94.5Witness to the incident 50.9 46.7 37.7Child was present at time of incident 38.0 29.5 21.2Any evidence was obtained 83.0 88.0 82.9History of abuse existed between victim and
defendant 48.7 34.0 32.2Victim reported prior violence by defendant to
police 24.7 17.0 16.4Total cases 3,140 441 146
Table 16. Case processing characteristics of intimate partner violence cases in 16 large counties, by defendant and victim gender, May 2002
Percent of intimate partner violence cases involving a—
Case processing characteristicMale defendant and female victim
Female defendant and male victim
Defendant and victim of same gender
Total 100% 100% 100%Most serious arrest charge
Felony 19.1% 14.5% 16.4%Misdemeanor 80.9 85.5 83.6
Adjudication outcome*Convicted 59.8% 40.3% 43.7%
Felony 9.9 4.9 5.6Misdemeanor 48.5 33.6 37.3Unknown 1.4 1.9 0.7
Dismissal/nolle prosequi/acquittal 32.6 43.7 44.4Pretrial diversion or deferred adjudication 7.7 16.0 12.0
Most severe sentence imposed on convicted defendantsPrison 7.5% 5.0% 10.9%Jail 76.2 65.8 67.3Probation 16.3 29.2 21.8Total cases 3,140 441 146
*Excludes cases with an unknown outcome and those pending as of May 31, 2003.

October 2009 9
Methodology
Data Collection
This report is based on data collected from thestudy Processing of Domestic Violence Cases inState Courts, conducted by the Bureau of JusticeStatistics. Data were collected by the Pretrial Ser-vices Resource Center, Washington, D.C., undergrant 2002-BJ-CX-0001. State prosecutors andcourts in 40 of the 75 largest counties were askedto participate in a pilot study examining howdomestic violence (DV) cases are handled by thejustice system. These counties were identifiedbecause they had participated in the State CourtProcessing Statistics, 2002 data collection, whichcollected case processing information on a sam-ple of felony cases filed in state courts. Of thecounties asked to participate in the study ondomestic violence case processing, prosecutorsand courts in the following 16 counties agreed:
In each of the 16 counties, the prosecutor’s officeor the court clerk’s office compiled a list ofdomestic violence cases filed in state court inMay 2002. In 7 of the 16 counties, the case listwas provided by a specialized DV prosecutionunit. In the remaining 9 counties, the case listwas generated by examining all cases opened inMay 2002 to identify those that contained adomestic violence charge.
Domestic violence was defined as “intentionalphysical violence committed, attempted, orthreatened between family members, intimatepartners, or household cohabitants.” Familymembers included persons related by blood ormarriage. Intimate partners included maritalrelations, such as spouses, ex-spouses, and com-mon-law spouses, as well as boyfriends or girl-friends, present or past. A case was classified asdomestic violence if 1) it met the above defini-tion, based on the relationship of the victim tothe defendant, and 2) the underlying charge wasfor a violent offense or for a violation of a protec-tion order. For a small number of cases, the pros-ecutor’s files either could not be located or werenot available for legal reasons, such as the casewas still pending at the time of data collection orthe case file was sealed to comply with statutoryregulations.
State prosecutors and courts in the participatingcounties provided data on 4,562 defendantswhose most serious arrest charge was a domesticviolence offense (DV). Approximately 83% of the4,562 identified DV cases, or 3,750 cases,involved a victim and defendant who were inti-mate partners. See appendix table 2 for the dis-tribution of intimate partner violence cases byparticipating jurisdiction.
Data sources
Data on the 3,750 intimate partner violencecases (IPV) are based on the information con-tained in both prosecutor files and court records.Prosecutor files were the primary source ofinformation on characteristics of the violentincident, including victim and defendant demo-graphics, measures of the severity of the inci-dent, such as weapon use by the defendant andwhether the victim was injured, history of abusebetween the victim and defendant, and the pres-ence of witnesses to the incident. Court records
State CountyArizona PimaCalifornia Alameda, Orange, Riverside, San Diego, Santa
ClaraFlorida Dade, Palm Beach, PinellasGeorgia FultonIndiana MarionOhio FranklinTennessee ShelbyTexas El Paso, Tarrant, TravisNote: See appendix table 2 for the distribution of intimate partner violence cases by participating jurisdiction.

10 Profile of Intimate Partner Violence Cases in Large Urban Counties10 Profile of Intimate Partner Violence Cases in Large Urban Counties
were the primary source of information on caseprocessing data, such as charges filed against thedefendant, adjudication outcomes, and sentenc-ing information. Case processing data were doc-umented for one year following the defendant’sfirst appearance in court in May 2002.
This study also captured information about thegeneral case screening practices employed byprosecutors at the time of the data collection inthe 16 participating jurisdictions. Prosecutors in9 of the 16 jurisdictions indicated that cases werereviewed prior to a defendant’s initial courtappearance to determine whether the case wouldbe pursued for prosecution. In the remainingseven jurisdictions, case review by prosecutorsdid not occur until after the case was filed withthe court. State law in some of the seven jurisdic-tions mandates case filing upon arrest. Countiesin which prosecutors review cases after initial fil-ing have a rate of dismissal (49%) that is nearlytwo and a half times greater than the comparablerate in counties that screen prior to court filing(21%) (table 17).
Multivariate statistical techniques
This report analyzes the characteristics and out-comes of intimate partner violence cases throughboth bivariate and multivariate statistical tech-niques. While bivariate statistics provide adescriptive overview of intimate partner violencecase characteristics and outcomes, multivariateanalysis can help identify the impacts that spe-cific case characteristics, such as presence of awitness, evidence obtained, and prior history ofviolence between victim and defendant have onthe probability of a conviction. A logistic regres-sion model was used to estimate the impact ofcase characteristics on the probability of a con-viction.
Also included in the model were a defendant’srace and gender, whether the defendant wascharged with a felony or misdemeanor, and indi-vidual county-level effects. To account forcounty-level effects, a model predicting theprobability of conviction was first run at thecounty level, and the residuals produced fromthat analysis were added to the main individual-level model. Incorporating the estimates of theresiduals, which were statistically significant,
Table 17. Adjudication outcome in intimate partner violence cases in 16 large counties, by prosecutor screening practice, May 2002
Prosecutors screened cases—
Adjudication outcomePrior to defendant's initial appearance in court
After defendant's initial appearance in court
Total 100% 100%Conviction 71.5 37.0Dismissal/nolle prosequi/acquittal 20.9 49.2Pretrial diversion/deferred adjudication 5.1 12.8Case pending* 2.5 0.9Note: Adjudication outcomes available for 99.4% of all intimate partner violence cases.*As of May 31, 2003.

October 2009 11
into the model allowed for the ability to isolatethe impact of case characteristics on the likeli-hood of a conviction while accounting for theindependent county effects.
The findings from this study are based on a com-plete enumeration of the cases processed in themonth of May in the 16 counties agreeing to par-ticipate in the study. Given this approach to datacollection, BJS did not compute confidenceintervals for the estimates, nor did BJS conductstatistical significance tests to compare the esti-mates across different subgroups and to evaluatethe logistic regression analysis. Findings in thisreport may not be representative of those that
would have been obtained by examining casesprocessed throughout the entire year, or fromother counties that did not participate in thestudy.
The logistic regression analyses were limited andintended to reflect the effects of selected factorsthat were available in the data collected. Otherfactors could potentially be related to the proba-bility of conviction. For example, informationabout whether the defendant was arrested at thescene of the crime and the defendant’s priorcriminal history was unavailable. If data on thesevariables were available, the logistic regressionresults could be altered.
Appendix Table 2. Number of defendants in intimate partner violence cases in 16 large counties, by county, state, and charge type, May 2002
Number of defendants charged with a—County and State All cases Felony MisdemeanorPima, AZ 41 12 29Alameda, CA 139 8 131Orange, CA 298 24 274Riverside, CA 317 110 207San Diego, CA 301 69 232Santa Clara, CA 276 57 219Dade, FL 392 83 309Palm Beach, FL 117 26 91Pinellas, FL 299 93 206Fulton, GA 123 19 104Marion, IN 298 85 213Franklin, OH 375 19 356Shelby, TN 177 24 153El Paso, TX 237 34 203Tarrant, TX 147 0 147Travis, TX 213 30 183
Total 3,750 693 3,057
Appendix Table 1. Relationship of victim to defendant in domestic violence cases in 16 large counties, by charge type, May 2002
Percent of domestic violence defendants charged with a—Victim was defendant's— All cases Felony Misdemeanor
Total 100% 100% 100%Intimate partner 83.4 74.6 85.7
Spouse 33.3 26.3 35.1Boyfriend or girlfriend 50.1 48.3 50.6
Non-intimate family member 15.5 23.1 13.5Parent or guardian 3.1 3.8 2.9Son or daughter 6.2 11.7 4.8Sibling 3.5 2.8 3.7Other family member 2.7 4.8 2.1
Non-intimate household member 1.1 2.3 0.8Total cases* 4,562 940 3,622
*Excludes the 1.4% of cases for which data on victim-defendant relationship were unavailable.

U.S. Department of JusticeOffice of Justice ProgramsBureau of Justice Statistics
Washington, DC 20531
Official BusinessPenalty for Private Use $300
PRESORTED STANDARDPOSTAGE & FEES PAID
DOJ/BJSPermit No. G-91
*NCJ~227379*
12 Profile of Intimate Partner Violence Cases in Large Urban Counties
The Bureau of Justice Statistics is the statistical agency of the U.S. Department of Justice. Michael D. Sinclair is acting director.
This Special Report was written by Erica L. Smith and Donald J. Farole, Jr., Ph.D.
Sean P. Rosenmerkel verified the report.
Georgette Walsh and Jill Duncan edited the report, Tina Dorsey produced the report, and Jayne Robinson prepared the report forfinal printing, under the supervision of Doris J. James.
October 2009, NCJ 228193
This report in portable document format and in ASCII and its related statistical data and tables are available at the BJS World WideWeb Internet site: <http://www.ojp.usdoj.gov/bjs/abstract/pipvcluc.htm>.
Office of Justice ProgramsInnovation • Partnerships • Safer Neighborhoodshttp://www.ojp.usdoj.gov