Proficiency test for the metals copper and zinc in ...
36
Proficiency test for the metals copper and zinc in compound feed D.P.K.H. Pereboom, H. Brust and M. de Nijs
Transcript of Proficiency test for the metals copper and zinc in ...

The mission of Wageningen University & Research is “To explore the potential of nature to improve the quality of life”. Under the banner Wageningen University & Research, Wageningen University and the specialised research institutes of the Wageningen Research Foundation have joined forces in contributing to finding solutions to important questions in the domain of healthy food and living environment. With its roughly 30 branches, 6,800 employees (6,000 fte) and 12,900 students, Wageningen University & Research is one of the leading organisations in its domain. The unique Wageningen approach lies in its integrated approach to issues and the collaboration between different disciplines.
Proficiency test for the metals copper and zinc in compound feed
D.P.K.H. Pereboom, H. Brust and M. de Nijs
Wageningen Food Safety Research P.O. Box 230 6700 AE WageningenThe NetherlandsT +31 (0)317 48 02 56www.wur.eu/food-safety-research
WFSR report 2021.015


Proficiency test for the metals copper and zinc in compound feed
D.P.K.H. Pereboom, H. Brust and M. de Nijs
This research has been carried out by Wageningen Food Safety Research, institute within the legal entity Wageningen Research Foundation funded by the Dutch Ministry of Agriculture, Nature and Food Quality, WOT programme Feed and Food.
Wageningen, September 2021
WFSR report 2021.015

D.P.K.H. Pereboom, H. Brust and M. de Nijs, 2021. Proficiency test for the metals copper and zinc in compound feed. Wageningen, Wageningen Food Safety Research, WFSR report 2021.015. 32 pp.; 4 fig.; 6 tab.; 11 ref. Project number: 1227248801-WOT BPL Project title: Borging private laboratoria (WOT BPL 20-21 PT ZnCu) Coordinator proficiency tests: D.P.K.H. Pereboom Project leader: M. de Nijs Scientist: H. Brust This report can be downloaded for free at https://doi.org/10.18174/553454 or at www.wur.eu/food-safety-research (under WFSR publications). © 2021 Wageningen Food Safety Research, institute within the legal entity Wageningen Research Foundation. Hereinafter referred to as WFSR. The client is allowed to publish or distribute the full report to third parties. Without prior written permission from WFSR it is not allowed to: a) publish parts of this report; b) use this report or title of this report in conducting legal procedures, for advertising, acquisition or
other commercial purposes; c) use the name of WFSR other than as the author of this report. P.O. Box 230, 6700 AE Wageningen, The Netherlands, T +31 (0)317 48 02 56, E [email protected], www.wur.eu/food-safety-research. WFSR is part of Wageningen University & Research. This report from WFSR has been produced with the utmost care. However, WFSR does not accept liability for any claims based on the contents of this report. WFSR report 2021.015 Distribution list: • Participating laboratories
Contents
1 Introduction 7
2 Material and methods 8
2.1 Scope of the proficiency test 8 2.2 Material preparation 8 2.3 Sample identification 8 2.4 Homogeneity study 8 2.5 Stability of the materials 9
3 Organisational details 10
3.1 Participants 10 3.2 Material distribution and instructions 10
4 Statistical evaluation 11
4.1 Calculation of the consensus value 11 4.2 Calculation of the uncertainty of the consensus value 11 4.3 Calculation of the standard deviation for proficiency assessment (σP) 12 4.4 Performance characteristics with regard to the accuracy 12
5 Methods and results 15
5.1 Scope and LOQ 15 5.2 Methods of analysis applied by participants 15 5.3 Performance assessment 16
6 Discussion and conclusions 18
Codification of the samples 20
Instruction letter 21
Statistical evaluation of homogeneity data 22
Statistical evaluation of stability data 24
Overview of the applied methods 26
Results material A and B 28
Overview performance per laboratory 31


WFSR report 2021.015 | 5
Summary
A proficiency test (PT) for the determination of copper and zinc in compound feed was organised by Wageningen Food Safety Research (WFSR) between January and May 2021 in accordance with ISO/IEC 17043. WFSR is accredited for the organisation of proficiency tests in the field of contaminants, pesticides, mycotoxins, plant toxins and veterinary drugs in feed and feed ingredients according to ISO/IEC 17043 (R013). The primary goal of this proficiency test was to give participants the opportunity to evaluate and demonstrate their competence for the analysis of copper and zinc in compound feed. For this proficiency test, two materials were prepared and dispatched. The consensus value (based on moisture content of 12%) of the metals in each material are given in Table 1. Table 1 Consensus values and RSDR of the copper and zinc in the proficiency materials.
Material A (feed sows) Material B (feed piglets)
Compound Consensus value mg/kg
RSDR (%) Consensus value mg/kg
RSDR (%)
Copper 20.4 12 133 10
Zinc 96.7 7 128 7
Forty-five participants subscribed for the participation in this PT, of which 44 reported results. One participant submitted the results seven days after the closing date of reporting, but the results were nevertheless included in the evaluation. One participant was unable to report results. Materials A and B were prepared by grinding and extensive mixing of two commercially obtained piglet and sow compound feeds. Both materials were sufficiently homogeneous and stable during the PT. Each participant received one test sample of each material. All participants submitted results for copper and zinc. One participant analysed only material A. For both materials (A and B), 88% of the copper and zinc results were rated with satisfactory z-scores (|z|≤ 2), 5% of the results fell in the range of questionable results with 2<|z|<3, and 7% of the results fell in the range of unsatisfactory results with |z|≥ 3. Thirty-three participants achieved optimal performance for both materials by detecting both metals copper and zinc with the correct quantification, the absence of false negative results and reporting within the indicated deadline. Eleven participants reported questionable or unsatisfactory z-scores. No false negative results were reported. The results of this PT on copper and zinc are summarized in Table 2. Table 2 Summarized performance of laboratories reporting results in the proficiency test on copper and zinc in materials A and B.
Compound # of results Satisfactory performance (%)
Material A Copper 44 89
Zinc 44 86
Material B Copper 43 91
Zinc 43 86
6 | WFSR report 2021.015
Based on the results submitted by the participants of this PT it can be concluded the participants are capable of satisfactory quantification of copper and zinc in piglet and sow compound feed. The interlaboratory reproducibility (RSDR) ranged from 7 – 12%. The satisfactory results for copper and zinc varied from 86 to 91%.

WFSR report 2021.015 | 7
1 Introduction
Proficiency testing is conducted to provide participants with a powerful tool to evaluate and demonstrate the reliability of the data that are produced by the laboratory. Proficiency testing is an important requirement and demanded by ISO/IEC 17025:2017 [1]. The preparation of the materials, including the homogeneity and stability testing of the materials, and the evaluation of the quantitative results were carried out under accreditation according to ISO/IEC 17043:2010 [2] accreditation by the Dutch Accreditation Board (R013). The maximum levels of the metals copper and zinc are regulated in Regulation (EC) No 1334/2003 [9] and amendments thereof. The maximum level (ML) for copper in complete feed for piglets, suckling and weaned up to four weeks after weaning is 150 mg/kg and from the 5th week after weaning up to 8 weeks after weaning 100 mg/kg. The ML for copper in sow compound feed is 25 mg/kg. For zinc, the MLs for both the piglet feed and sow compound feed are 150 mg/kg. The aim of this proficiency test was to give participants the opportunity to evaluate or demonstrate their competence for the analysis of copper and zinc in piglets and sow compound feed.

8 | WFSR report 2021.015
2 Material and methods
2.1 Scope of the proficiency test
This proficiency test (PT) focused on the metals copper and zinc in compound feed, using commercially obtained piglet and sow compound feed as representative matrices. The target concentrations aimed for are presented in Table 3 and took the regulatory limits into account. Table 3 Target concentrations mg/kg of copper and zinc in the PT materials.
Target concentrations (mg/kg)
Compound Material A (sow feed) Material B (piglet feed)
Copper 25 150
Zinc 100 150
2.2 Material preparation
For preparation of the two PT materials A and B, respectively, commercial piglet and sow compound feed were used. For each material, three kilograms were milled using a centrifugal mill (ZM 200, Retsch, Haan) to obtain a particle size of 500 µm. The materials were homogenised by extensive mixing using a Stephan Cutter UM12 according to the in-house standard operating procedure [3].
2.3 Sample identification
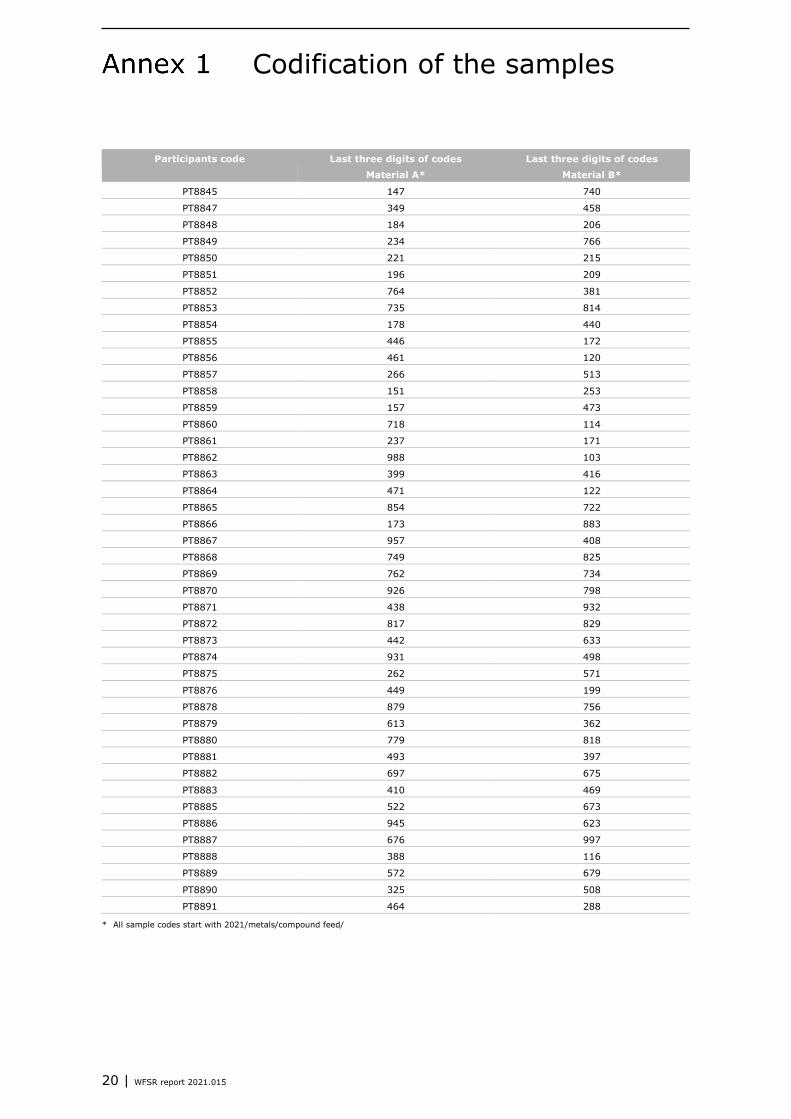
After homogenization, materials A and B were divided into sub-portions of approximately 25 grams and stored in polypropylene, airtight closed tubes of 50 ml at room temperature until use. The samples for the participants were randomly selected and coded using a web application designed for PTs. The code used was “2021/metals/compound feed/000”, in which the three digit number of the code was automatically generated by the WFSR Laboratory Quality Services web application. One sample set was prepared for each participant. Each sample set consisted of one randomly selected sample of material A and one of material B. The codes of the samples for each sample set are presented in Annex 1. The samples for homogeneity and stability testing were also randomly selected tubes of material A and B.
2.4 Homogeneity study
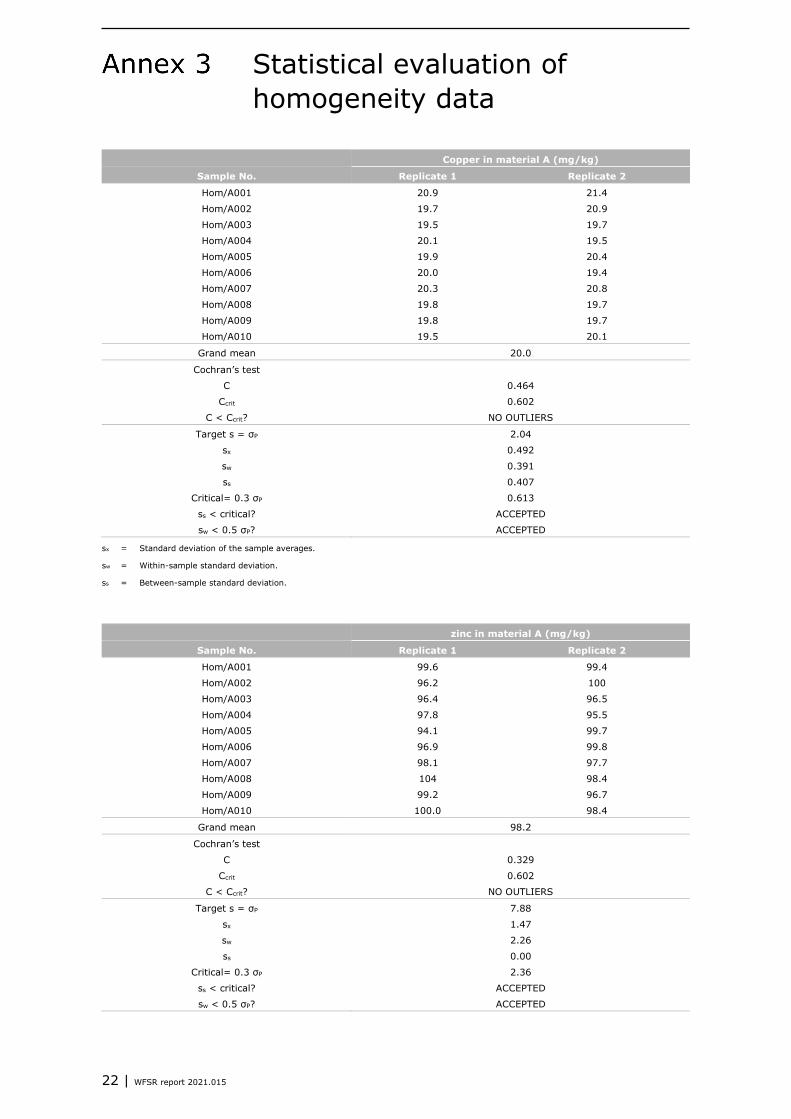
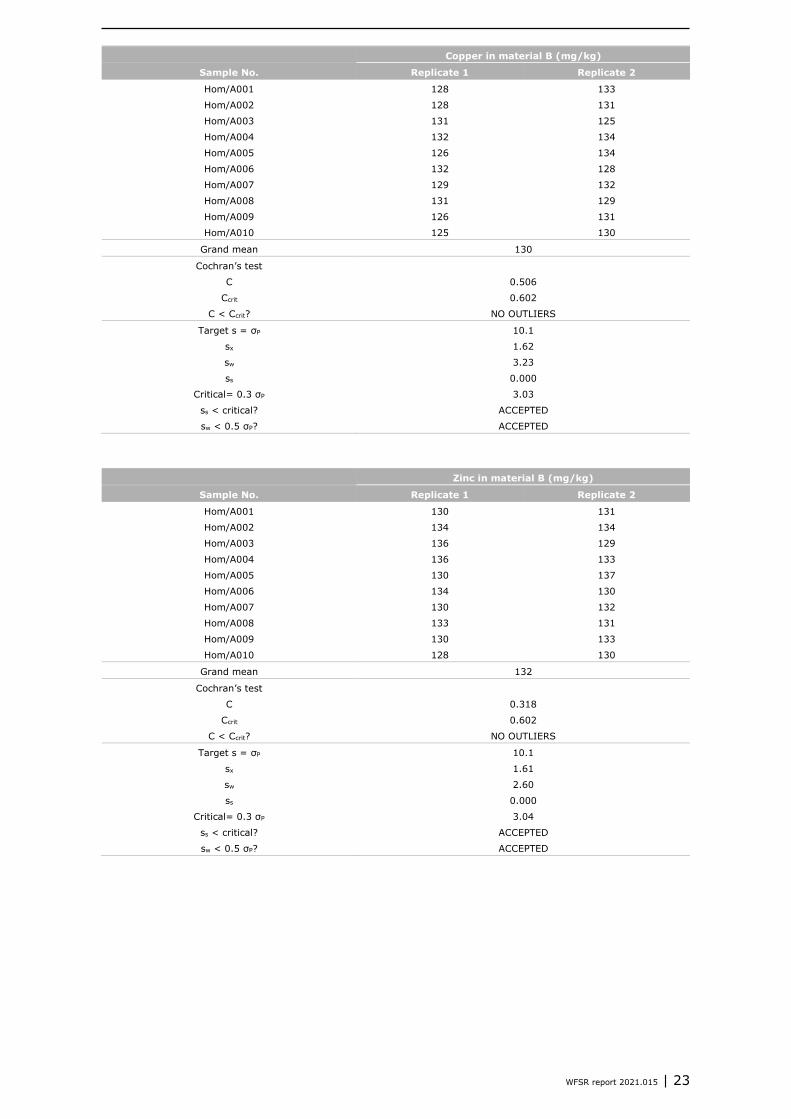
To verify the homogeneity of the PT materials, ten containers of material A and B were analysed in duplicate for copper and zinc. The homogeneity of both materials was evaluated according to The International Harmonized Protocol for Proficiency Testing of Analytical Laboratories [6] and ISO 13528:2015 [4] taking into account the insights discussed by Thompson [5] regarding the Horwitz equation. With this procedure the between-sample standard deviation (ss) and the within-sample standard deviation (sw) were compared with the standard deviation for proficiency assessment. The method applied for homogeneity testing is considered suitable if sw<0.5*σP and a material is considered adequately homogeneous if ss<0.3*σP.

WFSR report 2021.015 | 9
Ten containers of material A and B were analysed in duplicate to determine the homogeneity of the materials. Both materials proved to be sufficiently homogeneous for this PT. The results of the homogeneity study, grand means with the corresponding RSD, are presented in Table 4. The results of the statistical evaluation of materials A and B are presented in Annex 3. Table 4 Concentration of copper and zinc in materials A and B obtained during homogeneity testing.
Material code Material A Material B
Concentration
mg/kg
RSD
%
Concentration
mg/kg
RSD
%
Copper 20.1 2.77 131 2.15
Zinc 98.2 2.22 132 1.86
2.5 Stability of the materials
The stability of copper and zinc in the PT materials was assessed according to the procedures [5, 7]. On March 29th, 2021, the day of distribution of the PT samples, six randomly selected tubes of each material A and B were stored at -20°C. Under these conditions it is assumed that copper and zinc are stable in the materials. In addition, six samples of each material were stored at room temperature. On May 17th, 2021, 49 days after distribution of the samples, six samples of materials A and B, that were stored at -20°C and at room temperature, were analysed. For each set of test samples, the average of the results and the standard deviation were calculated. It was determined whether a consequential instability of the analytes had occurred [5, 7] in the materials stored at room temperature. A consequential instability is observed when the average value of an analyte in the samples stored at room temperature is more than 0.3σP below the average value of the analyte in the samples stored at -20°C. If so, the instability has a significant influence on the calculated z-scores. The results of the stability of materials A and B in this PT are presented in Annex 4. None of the tested storage conditions caused a consequential difference for the analytes in both materials. Copper and zinc in the materials were, therefore, considered stable for the duration of the PT.
10 | WFSR report 2021.015
3 Organisational details
3.1 Participants
Forty-five participants registered for the participation in the PT and 44 participants reported their results. Of the laboratories 39 were situated in Europe, one in Oceania and five in Asia. One participant was unable to report result due to custom clearance issues of the samples. Each participant was free to use their method of choice reflecting their routine procedures. The participants were asked to report the results through an existing web application designed for proficiency tests organised by WFSR.
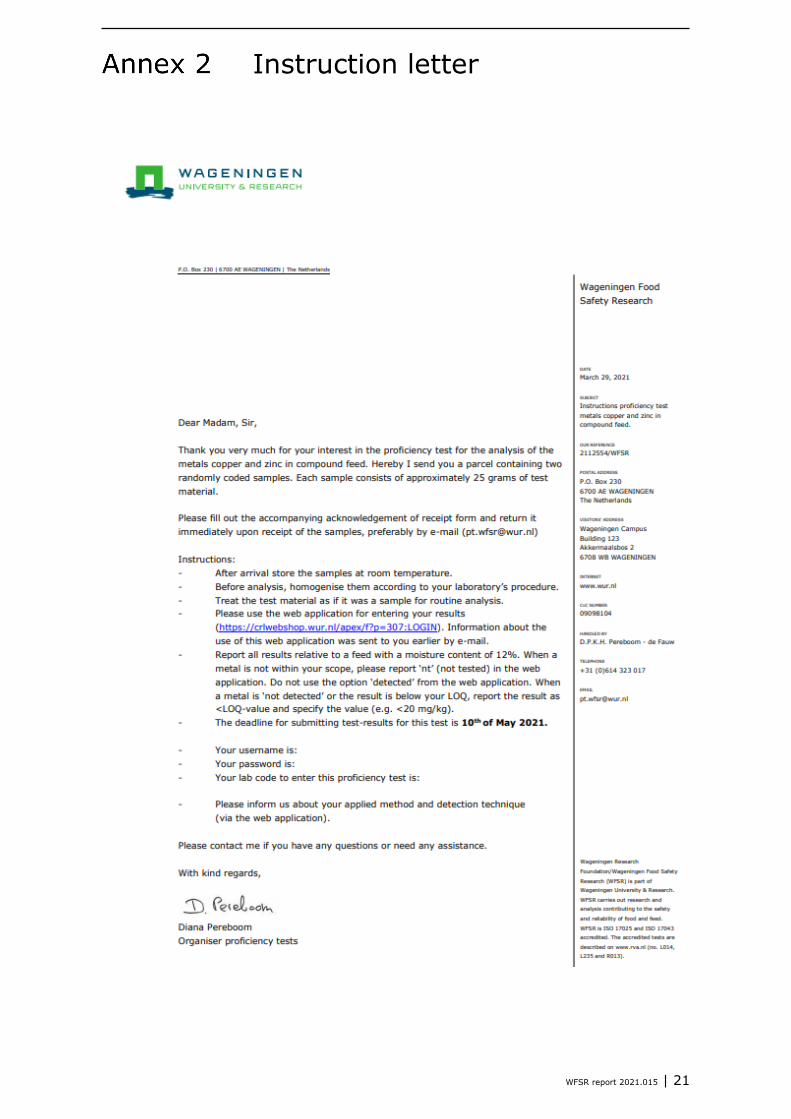
3.2 Material distribution and instructions
Each participant received a randomly assigned laboratory code, generated by the web application. The sets of samples with the corresponding number, consisting of two coded samples (Annex 1) were sent to the PT participants on the 29th of March 2021. The sets of samples were dispatched by courier to the participants in carton boxes. The participants were asked to store the samples at room temperature and to analyse the samples according to their routine practice. As reported by the participants, all parcels were received in good order. One parcel took 5 weeks to reach the laboratory. The samples were accompanied by a letter with instructions for the requested analysis (Annex 2) and an acknowledgement of receipt form. In addition, by e-mail, each participant received instructions on how to use the web application to report the results. Results should be reported as mg/kg product (relative to a feed with a moisture content of 12%). Participants were asked to provide information on their analytical method (sample preparation procedure, internal standards used, detection technique, limit of detection, limit of quantification). A single analysis result for both the metals copper and zinc in each sample was requested. The deadline for submitting the quantitative results was the 10th of May 2021, allowing the participants six weeks for analysis of the test samples. All results, except one, were submitted within the deadline. Participant PT8863 was unable to report results in time due to the long delivery time of the sample. The participant reported the results 1.5 week later than the target deadline. This was not be seen as exceeding the deadline.

WFSR report 2021.015 | 11
4 Statistical evaluation
The statistical evaluation was carried out according to the International Harmonized Protocol for the Proficiency Testing of Analytical Laboratories [6], elaborated by ISO, IUPAC and AOAC and ISO 13528:2015 [4] in combination with the insights published by the Analytical Methods Committee [7,8] regarding robust statistics. For the evaluation of the quantitative results, the consensus value, the uncertainty of the consensus value, the standard deviation for proficiency assessment and z-scores were calculated according to in-house standard operating procedure [11].
4.1 Calculation of the consensus value
The consensus value (X) was determined using robust statistics [4, 7, 8]. The advantage of robust statistics is that all values are taken into account: outlying observations are retained, but given less weight. Furthermore, it is not expected to receive normally distributed data in a proficiency test. When using robust statistics, the data do not have to be normally distributed in contrast to conventional outlier elimination methods. The robust mean of the reported results of all participants, calculated from an iterative process that starts at the median of the reported results using a cut-off value depending on the number of results, was used as the consensus value [4, 7].
4.2 Calculation of the uncertainty of the consensus value
The uncertainty of the consensus value is calculated to determine the influence of this uncertainty on the evaluation of the participants. A high uncertainty of the consensus value will lead to a high uncertainty of the calculated participants za-scores. If the uncertainty of the consensus value and thus the uncertainty of the za-score is high, the evaluation could indicate unsatisfactory method perfor-mance without any cause within the laboratory. In other words, illegitimate conclusions could be drawn regarding the performance of the participating participants from the calculated za-scores if the uncertainty of the consensus value is not taken into account. The uncertainty of the consensus value (the robust mean) is calculated from the estimation of the standard deviation of the consensus value and the number of values used for the calculation of the consensus value [4] and is calculated using the formula:
where: u = Uncertainty of the consensus value; n = Number of values used to calculate the consensus value;
= The estimate of the standard deviation of the consensus value resulting from robust statistics.
nˆ*25.1u σ
=
σ̂
12 | WFSR report 2021.015
According to ISO 13528:2015 [4] the uncertainty of the consensus value (u) is negligible and therefore does not have to be included in the statistical evaluation if: u ≤ 0.3σP where: u = The uncertainty of the consensus value; σP = Standard deviation for proficiency assessment (§3.3). In case the uncertainty of the consensus value does not comply with this criterion, the uncertainty of the consensus value should be taken into account when evaluating the performance of the participants regarding the accuracy (§3.4). In case the uncertainty is > 0.7σP the calculated z-scores should not be used for evaluation of participants performance and are presented for information only.
4.3 Calculation of the standard deviation for proficiency assessment (σP)
According to Commission Decision 2002/657/EC [10], the coefficient of variation for the repeated analysis of a reference or fortified material under reproducibility conditions, shall not exceed the level calculated by the Horwitz equation. The Horwitz equation, σH = 0.02c0.8495, presents a useful and widespread applied relation between the expected relative standard deviation of a singular analysis result under reproducibility conditions, and the concentration, c (g/g). It expresses inter-laboratory precision expected in inter-laboratory trials. Therefore, this relation is suitable for calculating the standard deviation for proficiency assessment in proficiency tests (σP). Thompson [7] demonstrated that the Horwitz equation is not applicable to the lower concentration range (<120 µg/kg) as well as to the higher concentration range (>138 g/kg). Therefore a complementary model is suggested: For analyte concentrations <120 µg/kg: σP = 0.22c For analyte concentrations >138 g/kg: σP = 0.01c0.5 where: σP = Expected standard deviation in proficiency tests; c = Concentration of the analyte (g/g).
4.4 Performance characteristics with regard to the accuracy
For illustrating the performance of the participating participants with regard to the accuracy a za-score is calculated. For the evaluation of the performance of the participants, ISO 13528:2015 [4] is applied. According to these guidelines za-scores are classified as presented in Table 5. Table 5 Classification of za-scores.
|za| ≤ 2 Satisfactory
2 < |za| < 3 Questionable
|za| ≥ 3 Unsatisfactory
WFSR report 2021.015 | 13
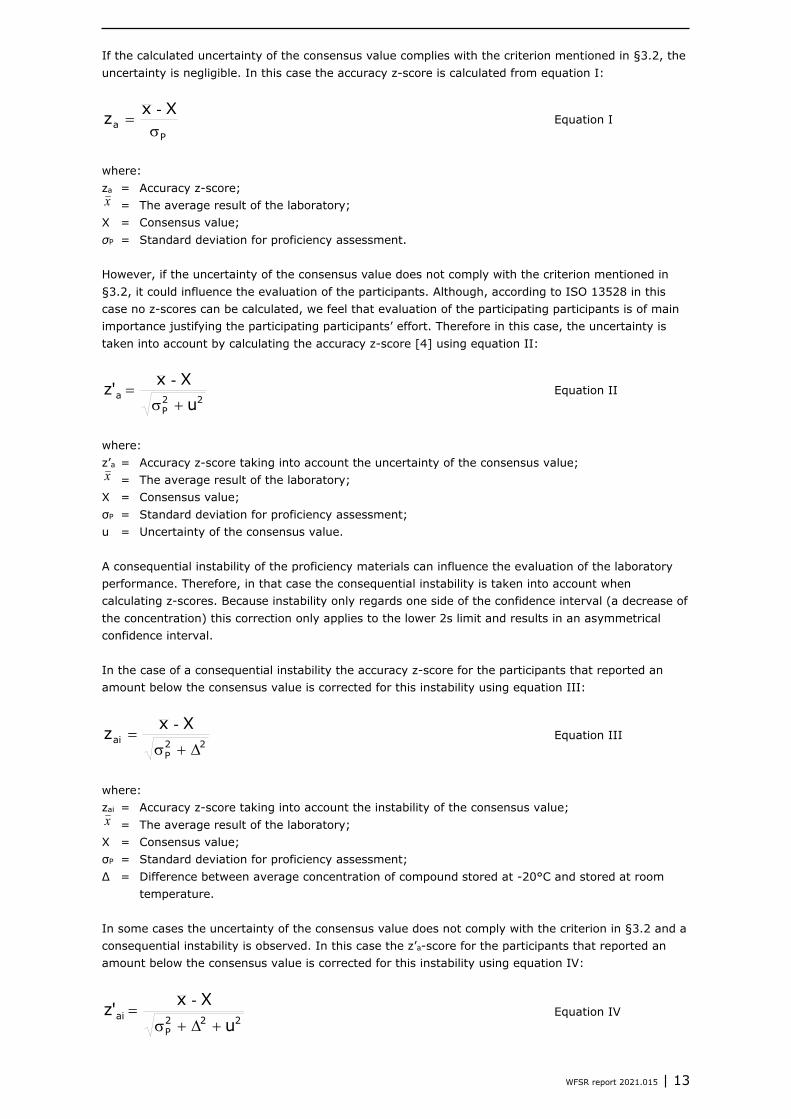
If the calculated uncertainty of the consensus value complies with the criterion mentioned in §3.2, the uncertainty is negligible. In this case the accuracy z-score is calculated from equation I:
Pa
Xxzσ
=-
Equation I
where: za = Accuracy z-score; x = The average result of the laboratory; X = Consensus value; σP = Standard deviation for proficiency assessment. However, if the uncertainty of the consensus value does not comply with the criterion mentioned in §3.2, it could influence the evaluation of the participants. Although, according to ISO 13528 in this case no z-scores can be calculated, we feel that evaluation of the participating participants is of main importance justifying the participating participants’ effort. Therefore in this case, the uncertainty is taken into account by calculating the accuracy z-score [4] using equation II:
22P
au
Xx'z+σ
=-
Equation II
where: z’a = Accuracy z-score taking into account the uncertainty of the consensus value; x = The average result of the laboratory; X = Consensus value; σP = Standard deviation for proficiency assessment; u = Uncertainty of the consensus value. A consequential instability of the proficiency materials can influence the evaluation of the laboratory performance. Therefore, in that case the consequential instability is taken into account when calculating z-scores. Because instability only regards one side of the confidence interval (a decrease of the concentration) this correction only applies to the lower 2s limit and results in an asymmetrical confidence interval. In the case of a consequential instability the accuracy z-score for the participants that reported an amount below the consensus value is corrected for this instability using equation III:
22P
aiXxz∆+σ
=-
Equation III
where: zai = Accuracy z-score taking into account the instability of the consensus value; x = The average result of the laboratory; X = Consensus value; σP = Standard deviation for proficiency assessment; Δ = Difference between average concentration of compound stored at -20°C and stored at room
temperature. In some cases the uncertainty of the consensus value does not comply with the criterion in §3.2 and a consequential instability is observed. In this case the z’a-score for the participants that reported an amount below the consensus value is corrected for this instability using equation IV:
222P
aiu
Xx'z+∆+σ
=-
Equation IV
14 | WFSR report 2021.015
where: z’ai = Accuracy z-score taking into account the uncertainty and instability of the consensus value; x = The average result of the laboratory; X = Consensus value; σP = Standard deviation for proficiency assessment; Δ = Difference between average concentration of compound stored at -20°C and stored at room temperature; u = Uncertainty of the consensus value.

WFSR report 2021.015 | 15
5 Methods and results
5.1 Scope and LOQ
This PT was dedicated to copper and zinc in piglets and sow compound feed. Ranges for the reported limits of detection (LODs) and limits of quantifications (LOQs) for copper and zinc are presented in Annex 5. Ten participants provided no details of the LODs and LOQs of the method used. All the participants determined and quantified copper and zinc as was requested. One participant analysed only material A. The LODs reported by the participants ranged from 0.0044 to 4 mg/kg for copper and 0.00053 to 5.6 mg/kg for zinc. LOQs provided by the participants ranged from 0.02 to 12.5 mg/kg for copper and from 0.005 to 20 mg/kg for zinc.
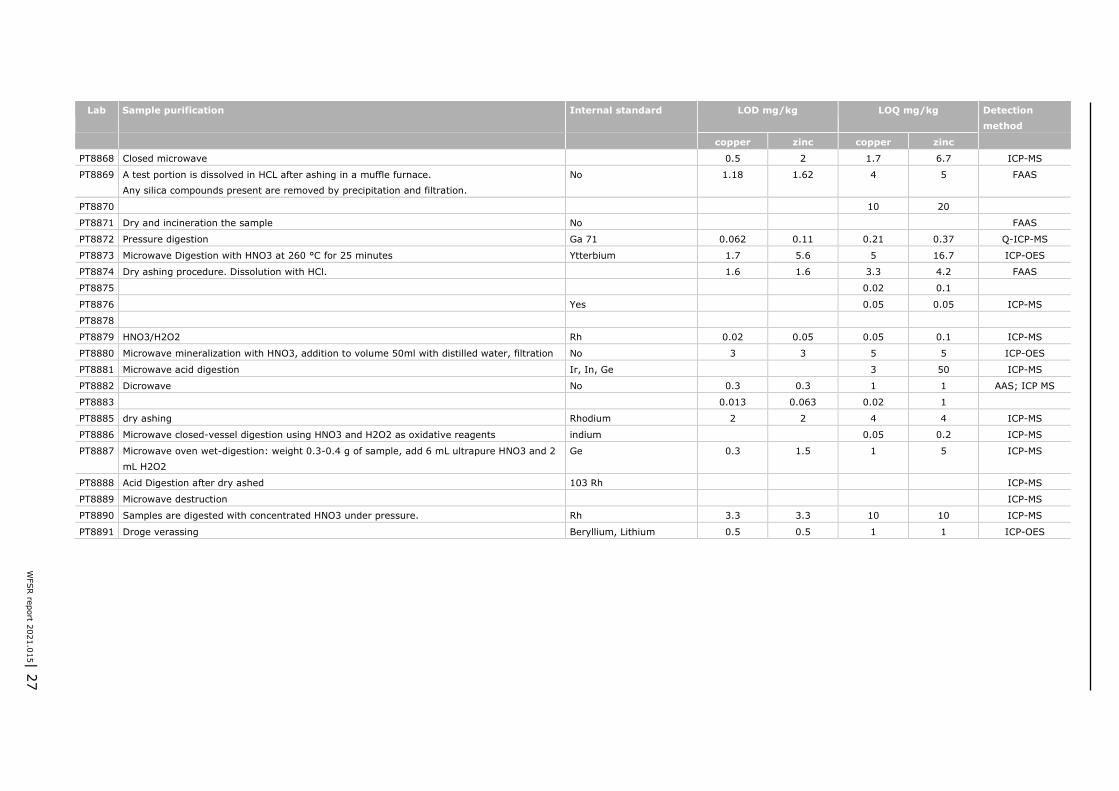
5.2 Methods of analysis applied by participants
An overview of the information provided by the participants regarding the methods applied in this PT is presented in Annex 5. Each participant was free to use their method of choice reflecting their routine procedures. The information provided was not always complete. Six participants provided no information at all. Eighteen laboratories applied ICP-MS (inductively coupled plasma mass spectrometry) for the identification and quantification of the metals, nine laboratories applied ICP-AES (inductively coupled plasma atomic emission spectroscopy) also referred as inductively coupled plasma optical emission spectrometry (ICP-OES), eight laboratories applied FAAS (flame atomic absorption spectroscopy). One laboratory applied ICP-MS as well as AAS (atomic absorption spectroscopy), one applied multi-element photo detector, while seven laboratories did not report the detection technique. Twenty-three laboratories used microwave digestion for sample preparation and therefore different acid digestion procedures were employed for the determination of elements in compound feed. Five laboratories carried out the acid digestions with a mixture of nitric acid and hydrogen peroxide to bring the sample in the form of a solution in order to introduce it into the analyser, three laboratories used nitric acid and hydrochloric acid, three laboratories used only nitric acid and 12 laboratories used microwave digestion but without further specifications. Eight laboratories dry-ashed the sample. One participant digested the sample with a mixture of nitric acid and hydrogen peroxide and diluted the extract for measurement. Two laboratories digested the sample with a mixture of nitric acid and hydrogen peroxide without further specifications. Ten laboratories provided no details on the sample preparation conditions they used. Out of 44 participants, 17 laboratories used one or more internal standards for copper and zinc quantification and 10 did not use an internal standard. The internal standards used were: beryllium, gallium, germanium, indium, iridium, lithium, rhodium, scandium and ytterbium. One participant used a standard of zinc as standard reference material (SRM) And one used a certified reference sample of tomato leaves to calculate recovery. Sixteen laboratories provided no information.

16 | WFSR report 2021.015
5.3 Performance assessment
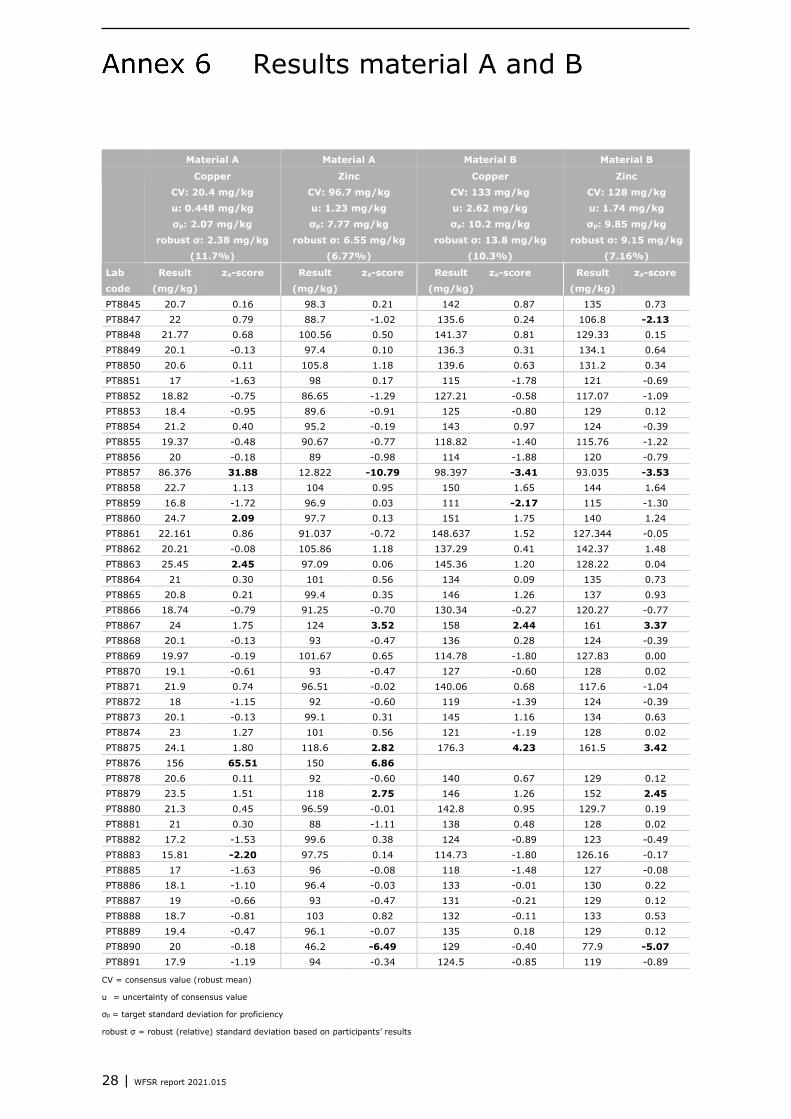
The quantitative performance was assessed through z-scores. The individual z-scores obtained by each participant, including their graphical representation, for copper and zinc in materials A and B are summarised in Annex 6. A summary of the performance of the participants in this PT is provided in Annex 7. A summary of the statistical evaluation of the PT results is presented in Table 6. This table includes all relevant parameters: the consensus value (CV), the uncertainty of the assigned value (u), the standard deviation for proficiency assessment (σp) and the robust (relative) standard deviation, based on participants’ results.
Table 6 Parameters of copper and zinc and summary in material A and B.
Material A Material B
Copper Zinc Copper Zinc
CV (mg/kg) 20.4 96.7 133 128
u (mg/kg) 0.448 1.23 2.62 1.74
σp (mg/kg) suggested by Horwitz 2.07 7.77 10.2 9.85
σp (%) 10.2 8.04 7.66 7.71
u>0.3σp No No No No
robust σ (mg/kg) 2.38 6.55 13.8 9.15
robust σ (%) (RSDR) 11.7 6.77 10.3 7.16
# reported 44 44 43 43
# quantitative results 44 44 43 43
|z|≤ 2 39 38 39 37
2<|z|<3 3 2 2 2
|z|≥ 3 2 4 2 4
Satisfactory z-scores (%) 89 86 91 86
The consensus values for copper and zinc in material A were respectively 20.4 and 96.7 mg/kg and in material B respectively 133 and 128 µg/kg. For copper and zinc in both materials, the uncertainty of the consensus value did comply with the criterion u≤0.3σp and was, therefore, considered as negligible in the evaluation of the z-scores. For material A, three of the reported results for copper were questionable results (PT8860, PT8863 and PT8883) and two results were unsatisfactory (PT8857 and PT8876). For zinc two results were questionable (PT8875 and PT8879) and four results were unsatisfactory (PT8857, PT8867, PT8876 and PT8890). For material B, two of the reported results for copper were questionable results (PT8859 and PT8867) and two results were unsatisfactory (PT8857 and PT8875). For zinc two results were questionable (PT8847 and PT8879) and four results were unsatisfactory (PT8857, PT8867, PT8875 and PT8890). The robust relative standard deviation (RSDR) was calculated according to ISO13528:2015 [4] for informative purposes only. In this study it was used as a good estimation of the interlaboratory variability. The RSDR values for copper and zinc in both materials are shown in Annex 6 and in Table 6. For both materials (A and B), the robust standard deviations (RSDR) of the reported results were comparable with standard deviation suggested by Horwitz (σp). The RSDR for copper and zinc in material A were respectively 12% and 7% and the σp were respectively 10% and 8%. In material B the RSDR for copper and zinc were respectively 10% and 7% and the σp were for both metals 8%. The lower RSDR for zinc in both materials shows that the laboratories’ performance for zinc was slightly better than for copper.

WFSR report 2021.015 | 17
For the individual metals in material A, the percentage of satisfactory results for copper was 89% and for zinc 86%. For the combined results of copper and zinc in material A, 88% of the results were rated with satisfactory z-scores (|z|≤ 2), 5.7% of the results felt into the questionable range with 2<|z|<3 and 6.8% of the results fell into the unsatisfactory range with |z|≥ 3. For the individual metals in material B, the percentage of satisfactory results for copper was 91% and for zinc 86%. For the combined results of copper and zinc in material A, 88% of the results were rated with satisfactory z-scores (|z|≤ 2), 5% of the results felt into the questionable range with 2<|z|<3 and 7% of the results fell into the unsatisfactory range with |z|≥ 3. Overall, 88% of the copper and zinc results obtained for both materials (A and B) were rated with satisfactory z-scores |z|≤ 2, 5% of the results felt into the questionable range with 2<|z|<3 and 7% of the results fell into the unsatisfactory range with |z|≥ 3. Participant PT8857 reported unsatisfactory results for copper and zinc in material A. Based on the results of participant PT8857, it can be speculated that the results for copper and zinc have been interchanged by the participant. Participant PT8876 analysed only material A and reported very high results for material A. Based on these results, it can be speculated that the batch numbers of the samples during reporting on the web application have been changed by the participant. In Annex 7 an overview of the overall performance of each participant in this PT is summarised. For the two materials combined, a maximum of 4 satisfactory z-scores could be obtained, and ‘4 out of 4’ therefore reflects an optimal performance in terms of scope and capability for quantitative determination. All the participants analysed the materials for both copper and zinc. Out of 44 participants, 33 participants achieved optimal performance for both materials by detecting copper and zinc with correct quantification, the absence of false positive and/or false negative results, and reporting all results within the set deadline.

18 | WFSR report 2021.015
6 Discussion and conclusions
Forty-five participants subscribed for the proficiency test on copper and zinc in compound for piglets and sows and 44 participants reported their results. Two materials were sent to each participant. The metals copper and zinc were homogeneously distributed in both materials. An overview of each participant’s performance is shown in Annex 7 and a summary of the results is presented in Table 6. For the individual metals in material A, the percentage of satisfactory results for copper was 89% and for zinc 86%. The robust standard deviations (RSDR) of the reported results were comparable with the standard deviation suggested by Horwitz. For the individual metals in material B, the percentage of satisfactory results for copper was 91% and for zinc 86%. The robust standard deviations (RSDR) of the reported results were comparable with the standard deviation suggested by Horwitz. One participant did not analyse copper and zinc in material B. Overall, for copper and zinc in both materials combined, 88% of the results were rated with satisfactory z-scores |z|≤ 2, 5% of the results fell into the questionable range with 2<|z|<3 and 7% of the results fell into the unsatisfactory range with |z|≥ 3. Out of 44 participants 33 showed optimal performance for both materials by detecting copper and zinc with a correct quantification, the absence of false positive or false negative results and reporting within the deadline. Eleven participants reported questionable or unsatisfactory z-scores. A total of 9 questionable z-scores and 12 unsatisfactory z-scores was reported. Based on the results of this proficiency test it was concluded that: • The satisfactory results for copper and zinc varied from 86-91% in this proficiency test. • The interlaboratory reproducibility (RSDR) ranged from 7 – 12% which is comparable with the
standard deviation suggested by Horwitz (8 – 10%). • Overall results of this PT: 75% of the participants showed optimal performance and are capable of
satisfactory determination of copper and zinc in compound feed for piglets and for sows. • The LOQs as provided by the participants varied widely, from 0.00053 to 50 mg/kg. This variation is
probably caused by the different combinations of sample preparation and detection technique.

WFSR report 2021.015 | 19
References
1 ISO/IEC 17025:2017 (E). 2017. General Requirements for the Competence of Calibration and Testing Laboratories.
2 ISO/IEC 17043:2010. 2010. Conformity assessment - General requirements for proficiency
testing. 3 SOPA0989 – De bereiding van referentiematerialen en referentiemonsters – WFSR. 4 ISO 13528:2015, IDT. 2015. Statistical methods for use in proficiency testing by inter-laboratory
comparison, 1st edition. 5 Thompson M. 2000. Recent trends in inter-laboratory precision at µg/kg and sub-µg/kg
concentrations in relation to fitness for purpose criteria in proficiency testing. Analyst. 125: 385-386.
6 Thompson M, Ellison SL, Wood R. 2006. The International Harmonized Protocol for the Proficiency
Testing of Analytical Chemistry Laboratories. Pure Appl. Chem. 78(1):145-196. 7 Analytical Methods Committee. 1989. Robust statistics - How not to reject outliers Part 1.
Basic concepts. Analyst 114:1693-1697. 8 Analytical Methods Committee. 1989. Robust statistics - How not to reject outliers Part 2.
Inter-laboratory trials. Analyst. 114:1699-1702. 9 Regulation (EC) no 1334/2003 of 25 July amending the conditions for authorisation of a number of
additives in feedingstuffs belonging to the group of trace elements 10 Commission Decision 2002/657/EC. 12 August 2002. Implementing Council Directive 96/23/EC
concerning the performance of analytical methods and the interpretation of results. Official Journal. L 221:67A-76A.
11 SOPA0992 – De statistische verwerking van resultaten van proficiency testen.
20 | WFSR report 2021.015
Codification of the samples
Participants code Last three digits of codes
Material A*
Last three digits of codes
Material B*
PT8845 147 740
PT8847 349 458
PT8848 184 206
PT8849 234 766
PT8850 221 215
PT8851 196 209
PT8852 764 381
PT8853 735 814
PT8854 178 440
PT8855 446 172
PT8856 461 120
PT8857 266 513
PT8858 151 253
PT8859 157 473
PT8860 718 114
PT8861 237 171
PT8862 988 103
PT8863 399 416
PT8864 471 122
PT8865 854 722
PT8866 173 883
PT8867 957 408
PT8868 749 825
PT8869 762 734
PT8870 926 798
PT8871 438 932
PT8872 817 829
PT8873 442 633
PT8874 931 498
PT8875 262 571
PT8876 449 199
PT8878 879 756
PT8879 613 362
PT8880 779 818
PT8881 493 397
PT8882 697 675
PT8883 410 469
PT8885 522 673
PT8886 945 623
PT8887 676 997
PT8888 388 116
PT8889 572 679
PT8890 325 508
PT8891 464 288
* All sample codes start with 2021/metals/compound feed/
WFSR report 2021.015 | 21
Instruction letter
22 | WFSR report 2021.015
Statistical evaluation of homogeneity data
Copper in material A (mg/kg)
Sample No. Replicate 1 Replicate 2
Hom/A001 20.9 21.4
Hom/A002 19.7 20.9
Hom/A003 19.5 19.7
Hom/A004 20.1 19.5
Hom/A005 19.9 20.4
Hom/A006 20.0 19.4
Hom/A007 20.3 20.8
Hom/A008 19.8 19.7
Hom/A009 19.8 19.7
Hom/A010 19.5 20.1
Grand mean 20.0
Cochran’s test
C 0.464
Ccrit 0.602
C < Ccrit? NO OUTLIERS
Target s = σP 2.04
sx 0.492
sw 0.391
ss 0.407
Critical= 0.3 σP 0.613
ss < critical? ACCEPTED
sw < 0.5 σP? ACCEPTED
sx = Standard deviation of the sample averages.
sw = Within-sample standard deviation.
ss = Between-sample standard deviation.
zinc in material A (mg/kg)
Sample No. Replicate 1 Replicate 2
Hom/A001 99.6 99.4
Hom/A002 96.2 100
Hom/A003 96.4 96.5
Hom/A004 97.8 95.5
Hom/A005 94.1 99.7
Hom/A006 96.9 99.8
Hom/A007 98.1 97.7
Hom/A008 104 98.4
Hom/A009 99.2 96.7
Hom/A010 100.0 98.4
Grand mean 98.2
Cochran’s test
C 0.329
Ccrit 0.602
C < Ccrit? NO OUTLIERS
Target s = σP 7.88
sx 1.47
sw 2.26
ss 0.00
Critical= 0.3 σP 2.36
ss < critical? ACCEPTED
sw < 0.5 σP? ACCEPTED
WFSR report 2021.015 | 23
Copper in material B (mg/kg)
Sample No. Replicate 1 Replicate 2
Hom/A001 128 133
Hom/A002 128 131
Hom/A003 131 125
Hom/A004 132 134
Hom/A005 126 134
Hom/A006 132 128
Hom/A007 129 132
Hom/A008 131 129
Hom/A009 126 131
Hom/A010 125 130
Grand mean 130
Cochran’s test
C 0.506
Ccrit 0.602
C < Ccrit? NO OUTLIERS
Target s = σP 10.1
sx 1.62
sw 3.23
ss 0.000
Critical= 0.3 σP 3.03
ss < critical? ACCEPTED
sw < 0.5 σP? ACCEPTED
Zinc in material B (mg/kg)
Sample No. Replicate 1 Replicate 2
Hom/A001 130 131
Hom/A002 134 134
Hom/A003 136 129
Hom/A004 136 133
Hom/A005 130 137
Hom/A006 134 130
Hom/A007 130 132
Hom/A008 133 131
Hom/A009 130 133
Hom/A010 128 130
Grand mean 132
Cochran’s test
C 0.318
Ccrit 0.602
C < Ccrit? NO OUTLIERS
Target s = σP 10.1
sx 1.61
sw 2.60
ss 0.000
Critical= 0.3 σP 3.04
ss < critical? ACCEPTED
sw < 0.5 σP? ACCEPTED

24 | WFSR report 2021.015
Statistical evaluation of stability data
Statistical evaluation for copper in material A.
Storage temperature -20 °C room temperature
Time (days) 0 49
Calculated amounts (mg/kg) 20.6 20.4
20.5 20.2
20.8 20.2
20.2 20.1
19.6 20.0
20.4 20.8
Average amount (mg/kg) 20.3 20.3
n 6 6
st. dev (mg/kg) 0.416 0.291
Difference 0.064
0.3*σP 0.621
Consequential difference? Diff < 0.3*σP No
Statistical evaluation for zinc in material A.
Storage temperature -20 °C room temperature
Time (days) 0 49
Calculated amounts (mg/kg) 102 99.4
100 99.4
99.9 101
103 101
98.6 99.0
98.9 99.1
Average amount (mg/kg) 100 99.8
n 6 6
st. dev (mg/kg) 1.66 0.928
Difference 0.604
0.3*σP 2.41
Consequential difference? Diff < 0.3*σP No

WFSR report 2021.015 | 25
Statistical evaluation for copper in material B.
Storage temperature -20°C room temperature
Time (days) 0 49
Calculated amounts (mg/kg) 134 136
138 138
135 135
138 137
140 137
139 136
Average amount (mg/kg) 137 137
n 6 6
st. dev (mg/kg) 2.16 1.03
Difference 0.776
0.3*σP 3.14
Consequential difference? Diff < 0.3*σP No
Statistical evaluation for zinc in material B.
Storage temperature -20°C room temperature
Time (days) 0 49
Calculated amounts (mg/kg) 135 134
135 136
131 135
133 132
133 137
131 136
Average amount (mg/kg) 133 135
n 6 6
st. dev (mg/kg) 1.99 1.93
Difference -1.64
0.3*σP 3.06
Consequential difference? Diff < 0.3*σP No

26 | WFS
R report 2021.015
Overview of the applied methods
Lab Sample purification Internal standard LOD mg/kg LOQ mg/kg Detection method
copper zinc copper zinc
PT8845 Microwave digestion with HNO3 and HCL No 0.043 0.13 0.5 Multielement photo detector
PT8847 Microwave digestion system 0.08 ppm 0.05 ppm FAAS
PT8848 Microwave digestion with HNO3 and HCl, oxidation agent H2O2 No 0.02 0.006 ICP-OES
PT8849
PT8850 Pressure digestion followed by dilution No 0.35 0.35 1 1 ICP-OES
PT8851 0.7 0.4 ICP-OES
PT8852 HNO3+H2O2 45Sc 0.1 0.1 2 2 ICP-MS
PT8853 Microwave destruction Rh, Sc, Ge en Ir 1 5 ICP-MS
PT8854
PT8855 In ICP-MS
PT8856 Dry ashing/ microwave digestion 0.3 0.05 1.0 0.15 FAAS
PT8857 Dry ashing No FAAS
PT8858 High pressure microwave digestion. Sample solubilised in a mixture of concentrated HNO3 and HCL.
Rhodium 0.02 0.04 0.06 0.12 ICP-MS
PT8859 Dry ashing, dilution in HCL Standard Zn Merck 1000 mg/l (NIST SRM 3168a)
FAAS
PT8860 Samples were digested in a microwave using 6ml of HNO3 and 2ml of H2O2 No 0.01 0.01 0.025 0.05 ICP-MS
PT8861 Microwave Digestion Yes 0.1 0.1 5 20 ICP-OES
PT8862 Microwave digestion 0.1 0.1 ICP-MS
PT8863 Microwave-assisted acid digestion No 4 2 12.5 6.25 FAAS
PT8864 Digestion of 0.5g sample + 3 ml HNO3 + 0,5 ml H2O2 + 2 ml H2O. Dilution to 50 g with H2O.
3.7 18 ICP-OES
PT8865 0.16 0.54 0.54 1.79
PT8866 Closed microwave 0.0044 0.00053 0.05 0.005 ICP-OES
PT8867 Microwave Digestion Scandium ICP-MS
WFS
R report 2021.015| 27
Lab Sample purification Internal standard LOD mg/kg LOQ mg/kg Detection method
copper zinc copper zinc
PT8868 Closed microwave 0.5 2 1.7 6.7 ICP-MS
PT8869 A test portion is dissolved in HCL after ashing in a muffle furnace. Any silica compounds present are removed by precipitation and filtration.
No
1.18 1.62 4 5 FAAS
PT8870 10 20
PT8871 Dry and incineration the sample No FAAS
PT8872 Pressure digestion Ga 71 0.062 0.11 0.21 0.37 Q-ICP-MS
PT8873 Microwave Digestion with HNO3 at 260 °C for 25 minutes Ytterbium 1.7 5.6 5 16.7 ICP-OES
PT8874 Dry ashing procedure. Dissolution with HCl. 1.6 1.6 3.3 4.2 FAAS
PT8875 0.02 0.1
PT8876 Yes 0.05 0.05 ICP-MS
PT8878
PT8879 HNO3/H2O2 Rh 0.02 0.05 0.05 0.1 ICP-MS
PT8880 Microwave mineralization with HNO3, addition to volume 50ml with distilled water, filtration No 3 3 5 5 ICP-OES
PT8881 Microwave acid digestion Ir, In, Ge 3 50 ICP-MS
PT8882 Dicrowave No 0.3 0.3 1 1 AAS; ICP MS
PT8883 0.013 0.063 0.02 1
PT8885 dry ashing Rhodium 2 2 4 4 ICP-MS
PT8886 Microwave closed-vessel digestion using HNO3 and H2O2 as oxidative reagents indium 0.05 0.2 ICP-MS
PT8887 Microwave oven wet-digestion: weight 0.3-0.4 g of sample, add 6 mL ultrapure HNO3 and 2 mL H2O2
Ge 0.3 1.5 1 5 ICP-MS
PT8888 Acid Digestion after dry ashed 103 Rh ICP-MS
PT8889 Microwave destruction ICP-MS
PT8890 Samples are digested with concentrated HNO3 under pressure. Rh 3.3 3.3 10 10 ICP-MS
PT8891 Droge verassing Beryllium, Lithium 0.5 0.5 1 1 ICP-OES
28 | WFSR report 2021.015
Results material A and B
Material A Material A Material B Material B
Copper
CV: 20.4 mg/kg
u: 0.448 mg/kg
σp: 2.07 mg/kg
robust σ: 2.38 mg/kg
(11.7%)
Zinc
CV: 96.7 mg/kg
u: 1.23 mg/kg
σp: 7.77 mg/kg
robust σ: 6.55 mg/kg
(6.77%)
Copper
CV: 133 mg/kg
u: 2.62 mg/kg
σp: 10.2 mg/kg
robust σ: 13.8 mg/kg
(10.3%)
Zinc
CV: 128 mg/kg
u: 1.74 mg/kg
σp: 9.85 mg/kg
robust σ: 9.15 mg/kg
(7.16%)
Lab
code
Result
(mg/kg)
za-score Result
(mg/kg)
za-score Result
(mg/kg)
za-score Result
(mg/kg)
za-score
PT8845 20.7 0.16 98.3 0.21 142 0.87 135 0.73 PT8847 22 0.79 88.7 -1.02 135.6 0.24 106.8 -2.13 PT8848 21.77 0.68 100.56 0.50 141.37 0.81 129.33 0.15 PT8849 20.1 -0.13 97.4 0.10 136.3 0.31 134.1 0.64 PT8850 20.6 0.11 105.8 1.18 139.6 0.63 131.2 0.34 PT8851 17 -1.63 98 0.17 115 -1.78 121 -0.69 PT8852 18.82 -0.75 86.65 -1.29 127.21 -0.58 117.07 -1.09 PT8853 18.4 -0.95 89.6 -0.91 125 -0.80 129 0.12 PT8854 21.2 0.40 95.2 -0.19 143 0.97 124 -0.39 PT8855 19.37 -0.48 90.67 -0.77 118.82 -1.40 115.76 -1.22 PT8856 20 -0.18 89 -0.98 114 -1.88 120 -0.79 PT8857 86.376 31.88 12.822 -10.79 98.397 -3.41 93.035 -3.53 PT8858 22.7 1.13 104 0.95 150 1.65 144 1.64 PT8859 16.8 -1.72 96.9 0.03 111 -2.17 115 -1.30 PT8860 24.7 2.09 97.7 0.13 151 1.75 140 1.24 PT8861 22.161 0.86 91.037 -0.72 148.637 1.52 127.344 -0.05 PT8862 20.21 -0.08 105.86 1.18 137.29 0.41 142.37 1.48 PT8863 25.45 2.45 97.09 0.06 145.36 1.20 128.22 0.04 PT8864 21 0.30 101 0.56 134 0.09 135 0.73 PT8865 20.8 0.21 99.4 0.35 146 1.26 137 0.93 PT8866 18.74 -0.79 91.25 -0.70 130.34 -0.27 120.27 -0.77 PT8867 24 1.75 124 3.52 158 2.44 161 3.37 PT8868 20.1 -0.13 93 -0.47 136 0.28 124 -0.39 PT8869 19.97 -0.19 101.67 0.65 114.78 -1.80 127.83 0.00 PT8870 19.1 -0.61 93 -0.47 127 -0.60 128 0.02 PT8871 21.9 0.74 96.51 -0.02 140.06 0.68 117.6 -1.04 PT8872 18 -1.15 92 -0.60 119 -1.39 124 -0.39 PT8873 20.1 -0.13 99.1 0.31 145 1.16 134 0.63 PT8874 23 1.27 101 0.56 121 -1.19 128 0.02 PT8875 24.1 1.80 118.6 2.82 176.3 4.23 161.5 3.42 PT8876 156 65.51 150 6.86 PT8878 20.6 0.11 92 -0.60 140 0.67 129 0.12 PT8879 23.5 1.51 118 2.75 146 1.26 152 2.45 PT8880 21.3 0.45 96.59 -0.01 142.8 0.95 129.7 0.19 PT8881 21 0.30 88 -1.11 138 0.48 128 0.02 PT8882 17.2 -1.53 99.6 0.38 124 -0.89 123 -0.49 PT8883 15.81 -2.20 97.75 0.14 114.73 -1.80 126.16 -0.17 PT8885 17 -1.63 96 -0.08 118 -1.48 127 -0.08 PT8886 18.1 -1.10 96.4 -0.03 133 -0.01 130 0.22 PT8887 19 -0.66 93 -0.47 131 -0.21 129 0.12 PT8888 18.7 -0.81 103 0.82 132 -0.11 133 0.53 PT8889 19.4 -0.47 96.1 -0.07 135 0.18 129 0.12 PT8890 20 -0.18 46.2 -6.49 129 -0.40 77.9 -5.07 PT8891 17.9 -1.19 94 -0.34 124.5 -0.85 119 -0.89
CV = consensus value (robust mean)
u = uncertainty of consensus value
σp = target standard deviation for proficiency
robust σ = robust (relative) standard deviation based on participants’ results

WFSR report 2021.015 | 29
Figure a Graphical representation of the za-scores for copper in material A. The X ± 2σP lines (dotted) are calculated according to equation I in §4.4.
Figure b Graphical representation of the za-scores for zinc in material A. The X ± 2σP lines (dotted) are calculated according to equation I in §4.4.
-4,0
-3,0
-2,0
-1,0
0,0
1,0
2,0
3,0
4,0
PT88
83PT
8859
PT88
85PT
8851
PT88
82PT
8891
PT88
72PT
8886
PT88
53PT
8888
PT88
66PT
8852
PT88
87PT
8870
PT88
55PT
8889
PT88
69PT
8856
PT88
90PT
8868
PT88
73PT
8849
PT88
62PT
8878
PT88
50PT
8845
PT88
65PT
8864
PT88
81PT
8854
PT88
80PT
8848
PT88
71PT
8847
PT88
61PT
8858
PT88
74PT
8879
PT88
67PT
8875
PT88
60PT
8863
PT88
57PT
8876
za-s
core
Lab code
Copper in material A
24.5 mg/kg
16.2 mg/kg
-4,0
-3,0
-2,0
-1,0
0,0
1,0
2,0
3,0
4,0
PT88
57PT
8890
PT88
52PT
8881
PT88
47PT
8856
PT88
53PT
8855
PT88
61PT
8866
PT88
78PT
8872
PT88
68PT
8887
PT88
70PT
8891
PT88
54PT
8885
PT88
89PT
8886
PT88
71PT
8880
PT88
59PT
8863
PT88
49PT
8860
PT88
83PT
8851
PT88
45PT
8873
PT88
65PT
8882
PT88
48PT
8864
PT88
74PT
8869
PT88
88PT
8858
PT88
50PT
8862
PT88
79PT
8875
PT88
67PT
8876
za-s
core
Lab code
Zinc in material A
112 mg/kg
81.1 mg/kg
30 | WFSR report 2021.015
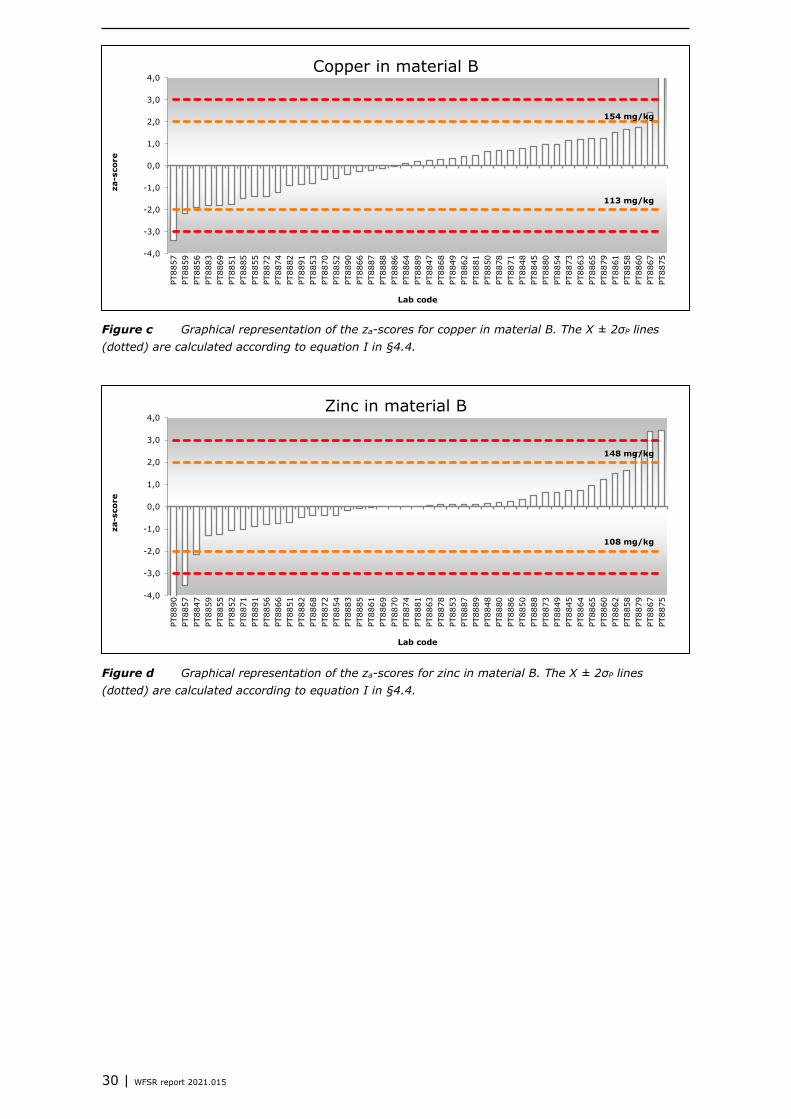
Figure c Graphical representation of the za-scores for copper in material B. The X ± 2σP lines (dotted) are calculated according to equation I in §4.4.
Figure d Graphical representation of the za-scores for zinc in material B. The X ± 2σP lines (dotted) are calculated according to equation I in §4.4.
-4,0
-3,0
-2,0
-1,0
0,0
1,0
2,0
3,0
4,0
PT88
57PT
8859
PT88
56PT
8883
PT88
69PT
8851
PT88
85PT
8855
PT88
72PT
8874
PT88
82PT
8891
PT88
53PT
8870
PT88
52PT
8890
PT88
66PT
8887
PT88
88PT
8886
PT88
64PT
8889
PT88
47PT
8868
PT88
49PT
8862
PT88
81PT
8850
PT88
78PT
8871
PT88
48PT
8845
PT88
80PT
8854
PT88
73PT
8863
PT88
65PT
8879
PT88
61PT
8858
PT88
60PT
8867
PT88
75
za-s
core
Lab code
Copper in material B
154 mg/kg
113 mg/kg
-4,0
-3,0
-2,0
-1,0
0,0
1,0
2,0
3,0
4,0
PT88
90PT
8857
PT88
47PT
8859
PT88
55PT
8852
PT88
71PT
8891
PT88
56PT
8866
PT88
51PT
8882
PT88
68PT
8872
PT88
54PT
8883
PT88
85PT
8861
PT88
69PT
8870
PT88
74PT
8881
PT88
63PT
8878
PT88
53PT
8887
PT88
89PT
8848
PT88
80PT
8886
PT88
50PT
8888
PT88
73PT
8849
PT88
45PT
8864
PT88
65PT
8860
PT88
62PT
8858
PT88
79PT
8867
PT88
75
za-s
core
Lab code
Zinc in material B
148 mg/kg
108 mg/kg

WFSR report 2021.015 | 31
Overview performance per laboratory
Laboratory code Satisfactory performance
PT8845 4 out of 4, optimal performance
PT8847 3 out of 4
PT8848 4 out of 4, optimal performance
PT8849 4 out of 4, optimal performance
PT8850 4 out of 4, optimal performance
PT8851 4 out of 4, optimal performance
PT8852 4 out of 4, optimal performance
PT8853 4 out of 4, optimal performance
PT8854 4 out of 4, optimal performance
PT8855 4 out of 4, optimal performance
PT8856 4 out of 4, optimal performance
PT8857 0 out of 4
PT8858 4 out of 4, optimal performance
PT8859 3 out of 4
PT8860 3 out of 4
PT8861 4 out of 4, optimal performance
PT8862 4 out of 4, optimal performance
PT8863 3 out of 4
PT8864 4 out of 4, optimal performance
PT8865 4 out of 4, optimal performance
PT8866 4 out of 4, optimal performance
PT8867 1 out of 4
PT8868 4 out of 4, optimal performance
PT8869 4 out of 4, optimal performance
PT8870 4 out of 4, optimal performance
PT8871 4 out of 4, optimal performance
PT8872 4 out of 4, optimal performance
PT8873 4 out of 4, optimal performance
PT8874 4 out of 4, optimal performance
PT8875 1 out of 4
PT8876 0 out of 2*
PT8878 4 out of 4, optimal performance
PT8879 2 out of 4
PT8880 4 out of 4, optimal performance
PT8881 4 out of 4, optimal performance
PT8882 4 out of 4, optimal performance
PT8883 3 out of 4
PT8885 4 out of 4, optimal performance
PT8886 4 out of 4, optimal performance
PT8887 4 out of 4, optimal performance
PT8888 4 out of 4, optimal performance
PT8889 4 out of 4, optimal performance
PT8890 2 out of 4
PT8891 4 out of 4, optimal performance
*Participant PT8876 analyse only one sample

Wageningen Food Safety Research P.O. Box 230 6700 AE Wageningen The Netherlands T +31 (0)317 48 02 56 www.wur.eu/food-safety-research WFSR report 2021.015
The mission of Wageningen University & Research is “To explore the potential of nature to improve the quality of life”. Under the banner Wageningen University & Research, Wageningen University and the specialised research institutes of the Wageningen Research Foundation have joined forces in contributing to finding solutions to important questions in the domain of healthy food and living environment. With its roughly 30 branches, 6,800 employees (6,000 fte) and 12,900 students, Wageningen University & Research is one of the leading organisations in its domain. The unique Wageningen approach lies in its integrated approach to issues and the collaboration between different disciplines.

The mission of Wageningen University & Research is “To explore the potential of nature to improve the quality of life”. Under the banner Wageningen University & Research, Wageningen University and the specialised research institutes of the Wageningen Research Foundation have joined forces in contributing to finding solutions to important questions in the domain of healthy food and living environment. With its roughly 30 branches, 6,800 employees (6,000 fte) and 12,900 students, Wageningen University & Research is one of the leading organisations in its domain. The unique Wageningen approach lies in its integrated approach to issues and the collaboration between different disciplines.
Proficiency test for the metals copper and zinc in compound feed
D.P.K.H. Pereboom, H. Brust and M. de Nijs
Wageningen Food Safety Research P.O. Box 230 6700 AE WageningenThe NetherlandsT +31 (0)317 48 02 56www.wur.eu/food-safety-research
WFSR report 2021.015