Professional Issues in Criminal Justice Executive Board Membership v Frank DiMarino Editor’s Notes...
59
PICJ Professional Issues in Criminal Justice: A Professional Journal http://www.picj.org Understanding Police Management: A Typology of the Underside of Compstat 11 John A. Eterno and Eli B. Silverman Police Officer Staffing: Analyzing the Commonly Held Belief That More Cops Equals Less Crime 29 James E. Guffey, James G. Larson, and Chandrika Kelso Factors That Contribute to the Success or Failure of Risk Reduction Initiative Clients 43 Michael Birzer and Paul Cromwell ISSN 1932-1368 Volume 5 Numbers 2 & 3
Transcript of Professional Issues in Criminal Justice Executive Board Membership v Frank DiMarino Editor’s Notes...
PICJ Professional Issues in Criminal Justice: A Professional Journal http://www.picj.org
Understanding Police Management: A Typology of the Underside of Compstat 11 John A. Eterno and Eli B. Silverman
Police Officer Staffing: Analyzing the Commonly Held Belief That More Cops Equals Less Crime 29 James E. Guffey, James G. Larson, and Chandrika Kelso
Factors That Contribute to the Success or Failure of Risk Reduction Initiative Clients 43 Michael Birzer and Paul Cromwell
ISSN 1932-1368 Volume 5 Numbers 2 & 3

Contents Executive Board Membership v Frank DiMarino Editor’s Notes vii Understanding Police Management: A Typology of the Underside of Compstat 11
John A. Eterno and Eli B. Silverman Police Officer Staffing: Analyzing the Commonly Held Belief That More Cops Equals Less Crime 29
James E. Guffey, James G. Larson, and Chandrika Kelso Factors That Contribute to the Success of Failure of Risk Reduction Initiative Clients 43
Michael Birzer and Paul Cromwell
Professional Issues in Criminal Justice Vol 5(2 & 3), 2010 i
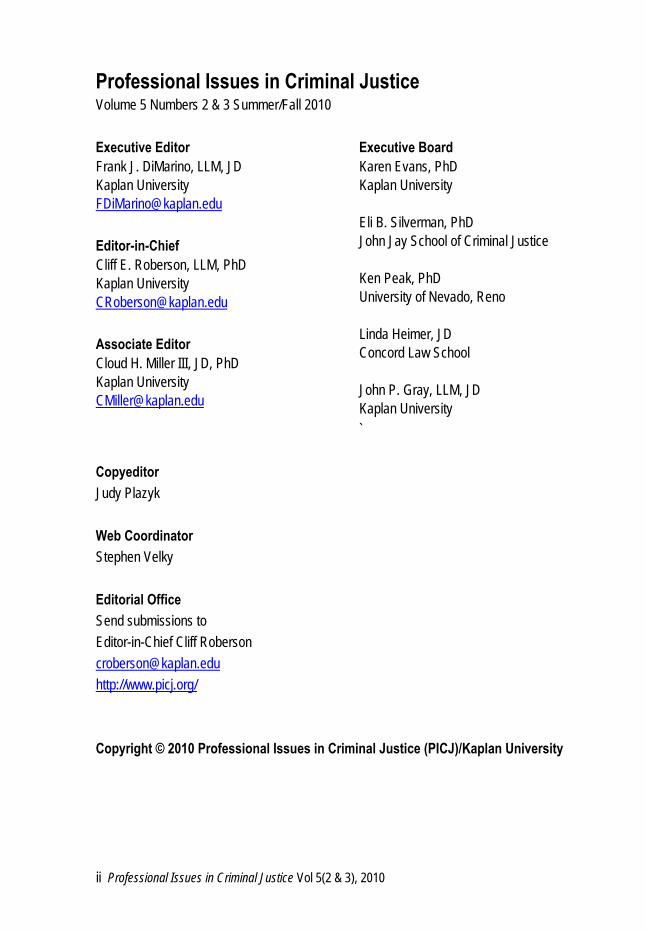
Professional Issues in Criminal Justice Volume 5 Numbers 2 & 3 Summer/Fall 2010 Executive Editor Frank J. DiMarino, LLM, JD Kaplan University [email protected] Editor-in-Chief Cliff E. Roberson, LLM, PhD Kaplan University [email protected] Associate Editor Cloud H. Miller III, JD, PhD Kaplan University [email protected]
Executive Board Karen Evans, PhD Kaplan University Eli B. Silverman, PhD John Jay School of Criminal Justice Ken Peak, PhD University of Nevado, Reno Linda Heimer, JD Concord Law School John P. Gray, LLM, JD Kaplan University `
Copyeditor Judy Plazyk Web Coordinator Stephen Velky Editorial Office Send submissions to Editor-in-Chief Cliff Roberson [email protected]://www.picj.org/ Copyright © 2010 Professional Issues in Criminal Justice (PICJ)/Kaplan University
ii Professional Issues in Criminal Justice Vol 5(2 & 3), 2010

Reviewers Jose F. Anderson
The University of Baltimore Katherine Jean Bennett
Armstrong Atlantic State University Anita Neuberger Blowers
University of North Carolina at Charlotte Stephen A. Cernkovich
Bowling Green State University Mitchell Bart Chamlin
University of Cincinnati Adrian Derral Cheatwood
The Ohio State University
John K. Cochran University of South Florida
Gordon Arthur Crews Marshall University
Walter S. DeKeseredy
University of Ontario, Institute of Technology
Mary Dodge
University of Colorado at Denver William G. Doerner
Florida State University William Evans
University of Nevada, Reno David James Farabee
University of California, Los Angeles Randy R. Gainey
Old Dominion University Jill A. Gordon
Virginia Commonwealth University Michael K. Hooper
California Commission on Peace Officer Standards & Training
Sung Joon Jang
Louisiana State University
Paul Jesilow University of California, Irvine
Wesley W. Johnson
University of Southern Mississippi Paula M. Kautt
University of Cambridge William R. King
Bowling Green State University Jodi Lane
University of Florida Edward J. Latessa
University of Cincinnati Alan J. Lizotte
The University at Albany Daniel Mabrey
Sam Houston State University Cheryl Lee Maxson
University of California, Irvine David C. May
Eastern Kentucky University J. Mitchell Miller
University of Texas at San Antonio Kevin I. Minor
Eastern Kentucky University
Scott M. Mire University of Louisiana at Lafayette
Godpower O. Okereke
Texas A&M University-Texarkana John L. Padgett
Capella University Susan E. Pease
Central Connecticut State University
Mary E. Pelz University of Houston-Downtown
Jeffrey Ian Ross
University of Baltimore
Professional Issues in Criminal Justice Vol 5(2 & 3), 2010 iii

Reviewers Eric L. Sevigny
University of Pittsburgh Frank Shanty
The Cobra Institute Kathleen Marie Littwin Simon
Appalachian State University Barbara A. Sims
Penn State Harrisburg Risdon Nichols Slate
Florida Southern College Stephen G. Tibbetts
California State University, San Bernardino
Sam Torres
California State University, Long Beach John E. Wade
Southeast Missouri State University Lorenn Walker
University of Hawaii School of Business Julia F. Weber
Judicial Council of California John L. Worrall
University of Texas, Dallas Jane A. Younglove
California State University, Stanislaus Marvin Zalman
Wayne State University
iv Professional Issues in Criminal Justice Vol 5(2 & 3), 2010

Executive Board Membership Professional Issues in Criminal Justice recently marked its fifth anniversary. The success of the journal has in large part been due to the hard work and support of the executive board members. The board members have expended valuable time and effort in addition to providing me and Cliff Roberson with their expertise.
I would like to extend a special thanks to three of the board members whose terms have expired: Dr. Katherine Jean Bennett, Dr. Alejandro del Carmen, and Dr. Thomas Jurkanin. The journal is a better and more professional journal because of your member-ship on the board and the efforts you expended on behalf of the journal. I thank each of you. It was an honor to serve on the board with you. I trust that you will continue your support for the journal, and on behalf of the journal membership, we wish you the best.
Unfortunately, board member Dr. William “Bill” Weston passed away earlier this year. We miss him.
I am pleased to announce the appointment of the following new members to the executive board.
Linda Hiemer, JD, Assistant Dean of Curriculum, Concord Law School Dean Hiemer is a full-time faculty member with Concord. She teaches Legal Analysis
and Writing. Before joining the faculty, Dean Hiemer was in private practice with a focus on business law, including mergers and acquisitions, venture capital, securities, and commercial litigation. She is a member of the Bar in Alaska and Idaho.
Kenneth J. Peak, PhD, Professor and former Chairperson of the Department of
Criminal Justice, University of Nevada, Reno Dr. Peak has authored more than 20 books, including historical books on Kansas
bootlegging and one of the leading CJ textbooks on justice administration. Eli B. Silverman, PhD, Professor, Department of Law, Police Science, and Criminal
Justice Administration, John Jay College of Criminal Justice Eli is widely published in the areas of policing, police ethics, and police training
programs. He recently completed an in-depth examination of the New York Police Department and its success in fighting crime.
Professional Issues in Criminal Justice Vol 5(2 & 3), 2010 v
Executive Board Membership
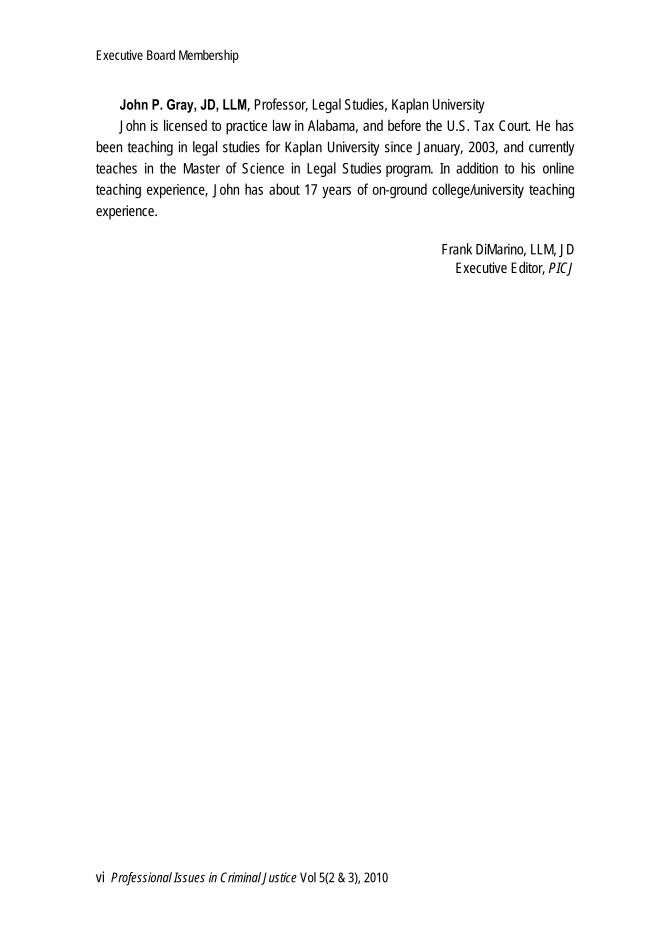
John P. Gray, JD, LLM, Professor, Legal Studies, Kaplan University John is licensed to practice law in Alabama, and before the U.S. Tax Court. He has
been teaching in legal studies for Kaplan University since January, 2003, and currently teaches in the Master of Science in Legal Studies program. In addition to his online teaching experience, John has about 17 years of on-ground college/university teaching experience.
Frank DiMarino, LLM, JD
Executive Editor, PICJ
vi Professional Issues in Criminal Justice Vol 5(2 & 3), 2010

Editor’s Notes
In the lead article of this Summer/Fall issue of PICJ, Professors John Eterno and Eli Silverman discuss Compstat as a management tool. In “Understanding Police Management: A Typology of the Underside of Compstat,” the authors note that scrutiny of this widely accepted police management tool has yielded mixed results. Their study seeks to add to the literature significantly by documenting a typology of the lesser understood underside of Compstat. By using an anonymous survey of 491 retired NYPD commanders, the professors identify four (4) main themes that resonate throughout the survey responses: the implementation of Compstat results in top-down management; hierarchical pressure; commander morale, abuse, and embarrassment; and organizational inefficiency. The authors subject their qualitative findings to quantitative analysis and confirm all but organizational inefficiency as typical of the Compstat process as practiced in New York City.
In the second article, “Police Officer Staffing: Analyzing the Commonly Held Belief That More Cops Equals Less Crime,” James Guffey, James Larson, and Chandrika Kelso discuss their study of police officer staffing levels. The authors observe that officer staffing levels are believed to relate directly to the crime rate in metropolitan areas; however, the studies on this relationship to date are contradictory and inconclusive. Their study compares crime rates in 24 metropolitan areas with the police officer staffing levels over a 12-year period, deriving its data from the Bureau of Justice Statistics’ Law Enforcement Management and Administrative Statistics surveys in 1999 and 2003 and the FBI’s Uniform Crime Reports for the period 1996–2008. The data show some but not overwhelming support for the position that a negative correlation exists between police officer staffing and crime rates.
In “Factors That Contribute to the Success of Failure of Risk Reduction Initiative Clients,” the final article, Professors Michael Birzer and Paul Cromwell report the results of their study investigating the factors that lead to probation clients either successfully completing or failing an offender Risk Reduction Initiative (RRI) program. The study includes 388 clients who were assigned by the courts to the RRI program. Clients were divided into a three group criterion variable: clients who successfully completed the program (n1 = 237), clients who failed the program due to technical violations of their probation (n2 = 100), and clients who failed the program due to the commission of new crimes (n3 = 51). Through a multivariate discriminant analysis, the authors found that
Professional Issues in Criminal Justice Vol 5(2 & 3), 2010 vii
Editor’s Notes
clients who failed to complete the RRI program due to technical violations of probation and for the commission of new crimes were younger and scored at higher risk levels on the Level of Service Inventory–Revised (LSI-R) in the following domains: education/employment, attitude orientation, companionship, criminal history, and alcohol/drug use.
With this issue, the journal completes five years of publication. The last five years would not a have been successful without the help of Executive Editor Dean Frank DiMarino, original Editor-in-Chief Rob Hanser, Associate Editor Cloud Miller, and the members of the executive committee. We look forward to continuing the publication of the journal and improving it with your assistance.
Cliff Roberson, LLM, PhD
Editor-in-Chief, PICJ
viii Professional Issues in Criminal Justice Vol 5(2 & 3), 2010

Contributing Authors Volume 5 Numbers 2 & 3, Summer/Fall 2010 Michael L. Birzer
Wichita State University Paul Cromwell
University of South Florida–Polytechnic John A. Eterno
Molloy College
James E. Guffey National University, Sacremento
Chandrika Kelso
National University, La Jolla James G. Larson
National University, La Jolla Eli B. Silverman
John Jay College of Criminal Justice
Professional Issues in Criminal Justice Vol 5(2 & 3), 2010 ix


Understanding Police Management: A Typology of the Underside of Compstat John A. Eterno and Eli B. Silverman
As Compstat becomes embedded as a police management tool accepted world-wide, it has been held to scrutiny by social scientists, reporters, and policy-makers. Some have favorable accounts, others not so favorable. In this study, we add to this literature significantly by documenting a typology of the lesser understood underside of Compstat. By using an anonymous survey of 491 retired commanders in New York City, we identify four (4) main themes that resonate throughout the responses: top-down management; hierarchical pres-sure; commander morale, abuse, and embarrassment; and organizational in-efficiency. We then subject the qualitative findings to quantitative analysis and confirm all but organizational inefficiency as typical of the Compstat process as practiced in New York City.
Key Words: Compstat police management police culture NYPD When the New York Police Department managerial crime accountability model known as Compstat was adopted by the NYPD in 1994, it was greeted initially with extensive praise and wide adoption by other law enforcement agencies. The favorable reviews centered on Compstat’s managerial assets in ensuring effective crime reduction strategies while de-centralizing decision making, enhancing local discretion, and empowering area commanders to customize their tactics to their local areas (Bratton & Knobler, 1998; Henry, 2002; Kelling & Sousa, 2001; Silverman, 2001; Silverman & O’Connell, 1999).
The widespread adoption throughout the United States—within its first six years, more than a third of U.S. cities with 100 or more officers claimed to have adopted Comp-stat (Weisburd, Mastrofski, McNally, Greenspan, & Willis, 2003)—triggered a new wave of Compstat assessments. The most extensive national evaluation was conducted by the Police Foundation and reported in many publications.
Contrary to previous findings, the Police Foundation researchers found significant drawbacks in Compstat operations and concluded that Compstat in practice fell far short of its promise and the expectations of many:
John A. Eterno is chairperson, associate dean, and director of graduate studies in the Department of Criminal Justice at Molloy College in Rockville Centre, New York. Eli B. Silverman is professor emeritus, John Jay College of Criminal Justice. Drs. Eterno and Silverman are coauthors of Unveiling Compstat: The Global Policing Revolution’s Naked Truths.
Professional Issues in Criminal Justice Vol 5(2 & 3), 2010 11

Eterno and Silverman
Compstat agencies were largely indistinguishable from non-Compstat agencies on measures that gauged geographic organization of command, organizational flexibility, the time availability of data, and the selection and implementation of innovative strategies and tac-tics. . . . Compstat departments are more reluctant to relinquish power that would decentralize some key elements of decision making geographically . . . enhance flexibility, and risk going outside of the standard tool kit of police tactics and strategies. The combined effect overall, whether or not intended, is to reinforce a traditional bureaucratic model of command and control (Weisburd et al., 2003, p. 448).
[A]gencies that had adopted Compstat programs were much less likely to focus on improving the skills and morale of street level officers . . . suggesting that Compstat represents a departure from the properties of “bubble up” community and problem-oriented policing programs that had been predominant in police innovation until Compstat arrived on the scene and had focused attention on the empowerment and training of street-level police officers. Indeed, Compstat appears in this sense to be modeled more closely on the traditional “bureaucratic” or “paramilitary” form of police organization (Weisburd, Mastrofski, Willis, & Greenspan, 2006, in Weisburd & Braga, 2006, p. 290).
This article addresses these Compstat findings in terms of whether and to what degree their depiction of an inefficient, inflexible bureaucratic model may apply to the NYPD’s Compstat (the Police Foundation study did not include New York City in its survey). Readers less familiar with Compstat should read NYPD Battles Crime by co-author Eli B. Silverman for a thorough overview of Compstat implementation and its process.
For the purposes of our analysis, we distinguish and examine four components of this model that have emerged as common concerns in officers’ questionnaire responses. They are: (1) top-down management; (2) hierarchical pressure; (3) commander morale, embar-rassment, and abuse before one’s peers; and (4) organizational inefficiency.
Methods
To examine the Compstat process in New York City scientifically, we use both qualitative and quantitative methods. These methods include a self-administered mail survey; informal in-depth interviews with 15 recently retired members of the service (all who worked in the Compstat era and were familiar with Compstat—some intimately involved in Compstat on
12 Professional Issues in Criminal Justice Vol 5(2 & 3), 2010
Understanding Police Management
a daily basis); and our collective understanding of NYPD based on years of participation, observation, and experience. Earlier studies tend to use one method with little or no congruence with other criteria (e.g., Dabney, 2010). Thus, our research offers triangula-tion of methods, making it unique among studies of its kind.
The survey was sent on September 10, 2008, to 1,197 retired members of the NYPD in the ranks of captain and above. Those ranks are most important to the Compstat process because the managerial style is based generally on bureaucratic hierarchy (see, for example, Cowper, 2000; Eterno & Silverman, 2006; Willis, Mastrofski, & Weisburd, 2003). There were 491 returned responses, indicating a 41% response rate. Of these, 323 (66%) respondents retired in 1995 or later, and 166 (34%) retired before 1995 (the first full year of Compstat). For this purposes of this paper, we analyze the data from respondents who retired in 1995 or later. Among the respondents were 263 (54%) captains, 98 (20%) deputy inspectors, 63 (13%) inspectors, 28 (6%) deputy chiefs, and 34 (7%) others.1 These percentages also approximate the ranks of those retired.2 These data increase our confidence that there is little, if any, non-response bias.
The survey was a self-administered mail survey. The Captains Endowment Associa-tion (CEA) of the NYPD provided the researchers with access to the retirees while a grant from Molloy College supported all expenses. The survey is four sides (two pages) of typical 8 ½ by 11 inch paper and includes 23 questions. It was purposely kept short as lengthy questionnaires often discourage respondents from filling out the instrument (Neuman, 2000). Question wording was tested extensively in development. Focus groups with retired and current members of NYPD, as well as a separate focus group comprising other researchers, reviewed the instrument carefully. Wording was changed numerous times to ensure that respondents clearly understood the meaning of the questions. The CEA also reviewed the questions.
One essential feature of our method was the use of anonymity. Most importantly, it helps to reduce social bias especially when respondents answer sensitive questions such as those this survey asked (see, for example, Babbie, 1989; Bradburn, 1983; Dillman, 1983; Neuman, 2000). While anonymity and questionnaire length are very important, they are also limitations. We had to make tradeoffs for these vital features, but the decision to apply them was carefully considered and based on sound scientific reasoning.
Most survey questions were close-ended with the exception of the last question. As is typical of such surveys, the last question is open-ended to allow respondents to advise the researcher of any crucial points they wish to add. Thus, at the end of the survey respondents were asked, “Please make any comments that you feel are important to understanding the NYPD based on your experiences as a manager (attach other pages if necessary).”
Professional Issues in Criminal Justice Vol 5(2 & 3), 2010 13

Eterno and Silverman
This article reports some of the more pertinent comments respondents made to this question. Importantly, this means that we did not solicit directly the respondent comments on Compstat that we report here; those responding felt strongly enough about these issues to communicate their experiences to us through this instrument. All comments in this manuscript are from the anonymous mail questionnaire unless otherwise noted.
Results & Analysis
For the purposes of this paper, we chose some unsolicited comments from our respondents that exemplify the lesser known bureaucratic underside of New York City’s Compstat.
Unlike other previously published research (e.g., Dabney, 2010), we take the additional step of supporting these comments by conducting statistical analyses of the entire sample. Again, negative comments about Compstat were not solicited; respondents who felt a need to share their thoughts on this issue made these comments freely. These are only a small selection of the many comments respondents made. Some were positive, while the negative comments reflect respondents’ views on the underside of Compstat. It is also important to note that a different respondent offered each of these comments.
While this paper focuses on the underside, we do believe, as do some of our respondents, that Compstat possesses many positive qualities, which the literature has already described extensively (Giuliani, 2002; Maple, 1999; MacDonald, 2002; Moore & Braga, 2003; Silverman, 2001; Walsh, 2001; Walsh & Vito, 2004). Qualitative Analysis of Unsolicited Statements We categorize the respondents’ unsolicited statements regarding Compstat’s bureaucratic dimensions in terms of their reference to: (1) top-down management; (2) hierarchical pressure; (3) commander morale, embarrassment, and abuse before one’s peers; and (4) organizational inefficiency. These themes emerge as commonplace among respondents. This section offers specific respondent examples of these components, while the next section presents quantitative analysis to support these qualitative statements. In all cases, the comments appear exactly as the respondents wrote them, with any errors of spelling and idiosyncrasies of usage retained. Top-Down Management Respondents focus on the top-down management style the Compstat leadership employs at its meetings. Police commanders must stand at a podium in front of higher echelons at semi-weekly meetings (known as Compstat meetings).
14 Professional Issues in Criminal Justice Vol 5(2 & 3), 2010
Understanding Police Management
Comstat has lost its original theme. C.O.’s were allowed to make their own decisions when it first started and then held accountable. Now all you do is follow someone else’s orders and decisions and still your held accountable. NOT FAIR.
Similarly, another respondent writes,
[T]he lack of management training to all ranks caused an Us vs. Them environment. Management training as the department was undergoing a sea change in how it was to accomplish its mission was left at the backdoor. The team concept from the Commissioners to the rank and file was not sought, the tools to accomplish the new tasks were not given. . . .
Clearly, the first respondent believes that with Compstat you are told what to do and later held accountable for what someone else ordered. In other words, you are held responsible for doing what you are told regardless of whether your action is successful or not.
This is basically a “do as you’re told” style of leadership lacking a team approach. Cowper (2000) depicts this as police leaderships’ misunderstanding of a military leadership approach. As he points out, “This style of leadership (not even a true representation of leadership by boot camp drill instructors) has . . . created organizations that are centrally controlled and highly inflexible. . . . ” (Cowper, 2000, p. 237; see also Shane, 2010). This top-down approach, supposedly a military style, strongly reinforces the hierarchical structure of the organization. Hierarchical Pressure Many respondents refer to intense Compstat pressure emanating from higher ranks. One respondent observes:
The pressure placed on captains and above was just too much to live with on a long term basis. It's a shame to leave a job you worked so hard for at the age of 44 because of the pressure and poor quality of life (Days off, hours, vacation, etc).
Another respondent remarks:
For Captains & Above high pressure from supervisors to produce ‘impressive’ results so that they (your supervisors) look good drives Captains out of the Department. Unrealistic given resources.
Professional Issues in Criminal Justice Vol 5(2 & 3), 2010 15

Eterno and Silverman
The extreme level of pressure felt by commanders could not be expressed more clearly. Many of our in-depth interviewees also advised that they spent countless hours at their commands without additional remuneration due to upper level Compstat pressures, which filter down into the streets. When commanders are pressurized, lower ranking police officers and eventually the public may receive little or no respect. Lower ranking officers who feel pressure from above are subject to greater stress. As a result they may be less inclined to reflect a service mentality and treat the public in a manner similar to the way they are treated by higher ranking officials.
Respondents’ references to top management pressures forcing members to retire may also affect commander morale, abuse, and embarrassment before one’s peers as the next section demonstrates. Commander Morale, Abuse, and Embarrassment The themes of poor morale, managerial abuse, and embarrassment emerge repeatedly. One respondent notes,
Compstat was a good Compstat but became very abusive to the very people that were expected to implement the programs, consequently turning people and depressing morale. There is still too much second guessing, no other dept goes through that. . . .
Another respondent writes,
Compstat is a great concept and productive tool when used fairly. I have seen it become a personal vendetta by some commanders towards a variety of Captains and other Commanding Officers.
The respondents sometimes portray Compstat as a device for punishment and reprimand rather than as a mechanism to fight crime constructively. One respondent writes,
Compstat . . . was turned into a tool of petty vindictiveness to punish people who were thought not to be fully committed to the department policies.
Another respondent writes,
Compstat . . . was a tool of 1 PP [1 Police Plaza—Headquarters] to elevate/end careers at will.
Respondents frequently frame managerial abuse in terms of the embarrassment they or others experience at Compstat meetings. One respondent writes,
16 Professional Issues in Criminal Justice Vol 5(2 & 3), 2010

Understanding Police Management
Compstat the meeting, is generally ineffective to those who work hard but aren't always successful. Compstat should do as it says, offer assistance, ideas, plans, etc. to managers. Not ridicule & embarrassment.
Another writes,
Compstat was the most embarrassing moments in my career.
Yet another:
Compstat = Embarrassment in front of peers. NYPD management style is to berate and embarrass subordinates publicly.
Organizational Inefficiency While many in the literature (e.g., Bratton, 1998) advocate Compstat efficiency, several commanders advise that Compstat is anything but. One example:
The pressures on management leads to micromanaging the Sgt & Lt ranks which has led to less decision making at those levels. Often the managers during the Compstat process are treated very differently depending who has been “chosen” to advance at a rapid rate.
Another respondent states,
I would also argue that over time, applying the ‘Comstat process’ to the myriad other roles of the police (trafficstat, Narcostat, etc.) weakened executives’ ability to effectively do their jobs. These exercises although sold as improving efficiency actually distracted police executives.
A similar comment:
I feel that Compstat is not cost effective. In B’klyn South 13 Commands, Transit, Housing and support units spend 3 hrs at the session in addition to travel time. Strategies and procedures should be discussed in a more timely manner.
Yet another writes,
Compstat lost its focus instead of concentrating on what works to reduce crime it is strictly focused on the negative. In addition Traffic stat is a complete waste of a Command's resources. It forces the XO to go
Professional Issues in Criminal Justice Vol 5(2 & 3), 2010 17

Eterno and Silverman
against the overall mission of the Dept and the Pct Commander. Both the XO and CO are competing for very limited resources.
We now present relevant quantitative data from the entire survey.
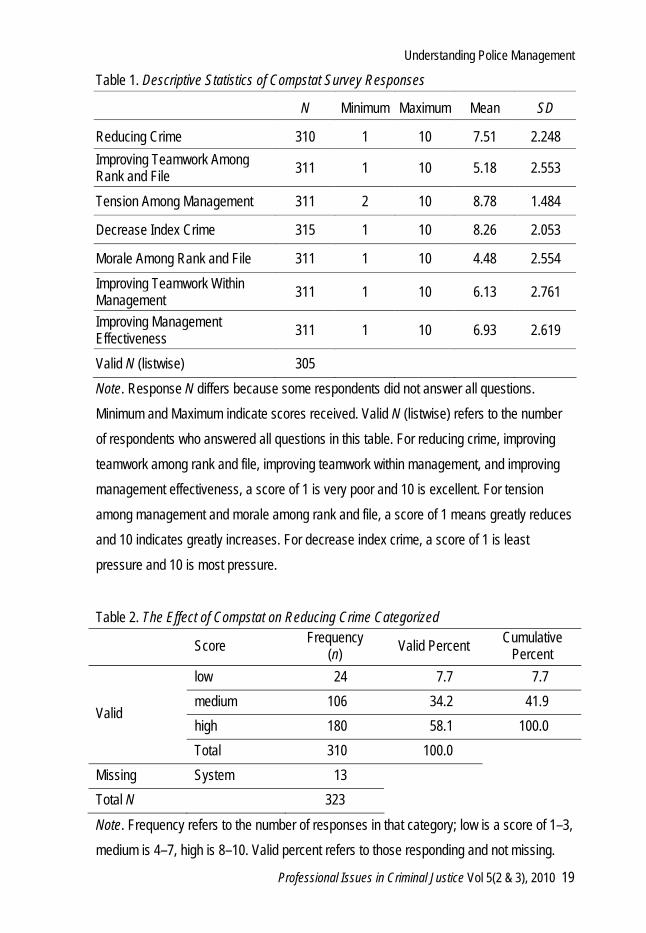
Quantitative Analysis The questionnaire contained several pertinent close-ended questions, which we analyzed to triangulate methods to determine whether our qualitative examination is accurate. We used descriptive statistics and univariate analyses on these key questions for comparison purposes. All questions are based on a 1 to 10 scale with 1 being low and 10 being high, making comparison relatively simple. As a baseline, we used a question about reducing crime, which is reportedly one of Compstat’s most positive aspects. Respondents were asked their “overall opinion of Compstat with respect to reducing crime.” As we would predict for this question, the response was very favorable (M = 7.51, SD = 2.248). Further, 58.1% of respondents thought that Compstat was excellent at reducing crime (see Tables 1 and 2). We now turn to examining variables that are the focus of this study—the themes in the previous qualitative analysis. We link the four (4) themes to specific questions in the survey. These questions may or may not validate them in the entire sample.
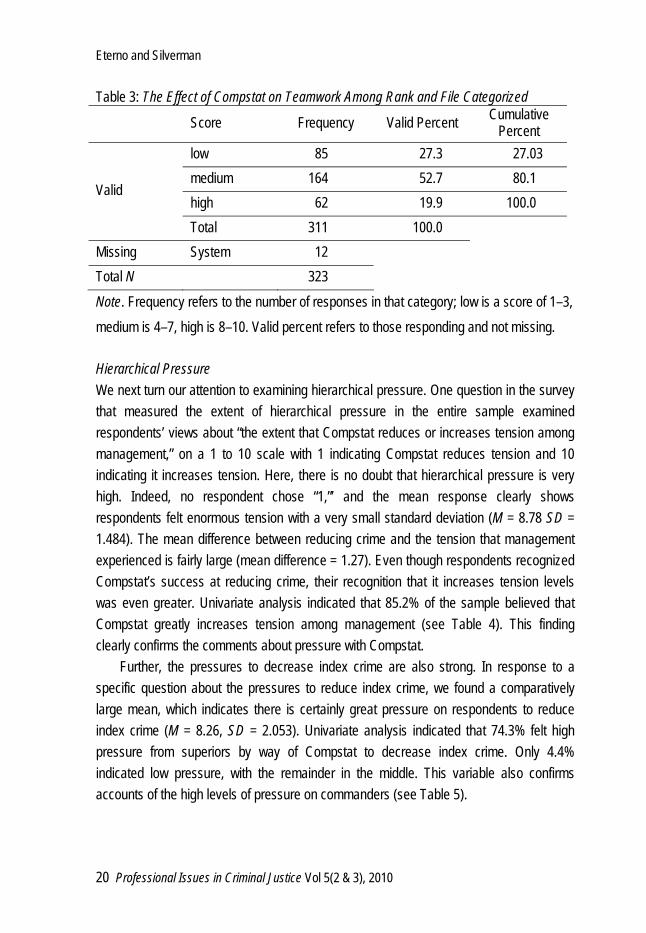
Top-Down Management We first turn to top-down management. The question that examined the extent to which the entire sample thought Compstat is a top-down management approach asked respondents’ “overall opinions of Compstat with respect to improving teamwork among rank and file.” While not an exact measure, those who thought that Compstat is not a top-down style should then assert that it helps improve teamwork within the rank and file. The mean response to the question related to improving teamwork was much lower than the mean response to the favorable aspect of reducing crime (M = 5.18, SD = 2.553). The mean difference between the favorable aspect of Compstat and improving teamwork was fairly high (mean difference = 2.33). Additionally, 27.3% indicated that Compstat is very poor at improving teamwork within the rank and file, while 19.9% indicated it is excellent at improving teamwork, with the remainder in the middle (see Table 3). Clearly, the sample was not enthusiastic about Compstat’s ability to improve teamwork among the rank and file. This suggests that, at a minimum, Compstat is ineffective at improving teamwork, which reaffirms the concept of top-down management style in the entire sample.
18 Professional Issues in Criminal Justice Vol 5(2 & 3), 2010
Understanding Police Management
Table 1. Descriptive Statistics of Compstat Survey Responses
N Minimum Maximum Mean SD
Reducing Crime 310 1 10 7.51 2.248 Improving Teamwork Among Rank and File 311 1 10 5.18 2.553
Tension Among Management 311 2 10 8.78 1.484
Decrease Index Crime 315 1 10 8.26 2.053
Morale Among Rank and File 311 1 10 4.48 2.554 Improving Teamwork Within Management 311 1 10 6.13 2.761
Improving Management Effectiveness 311 1 10 6.93 2.619
Valid N (listwise) 305 Note. Response N differs because some respondents did not answer all questions. Minimum and Maximum indicate scores received. Valid N (listwise) refers to the number of respondents who answered all questions in this table. For reducing crime, improving teamwork among rank and file, improving teamwork within management, and improving management effectiveness, a score of 1 is very poor and 10 is excellent. For tension among management and morale among rank and file, a score of 1 means greatly reduces and 10 indicates greatly increases. For decrease index crime, a score of 1 is least pressure and 10 is most pressure.
Table 2. The Effect of Compstat on Reducing Crime Categorized
Score Frequency (n) Valid Percent Cumulative
Percent low 24 7.7 7.7 medium 106 34.2 41.9 high 180 58.1 100.0
Valid
Total 310 100.0 Missing System 13 Total N 323 Note. Frequency refers to the number of responses in that category; low is a score of 1–3, medium is 4–7, high is 8–10. Valid percent refers to those responding and not missing.
Professional Issues in Criminal Justice Vol 5(2 & 3), 2010 19
Eterno and Silverman
Table 3: The Effect of Compstat on Teamwork Among Rank and File Categorized
Score Frequency Valid Percent Cumulative Percent
low 85 27.3 27.03 medium 164 52.7 80.1 high 62 19.9 100.0
Valid
Total 311 100.0 Missing System 12 Total N 323 Note. Frequency refers to the number of responses in that category; low is a score of 1–3, medium is 4–7, high is 8–10. Valid percent refers to those responding and not missing.
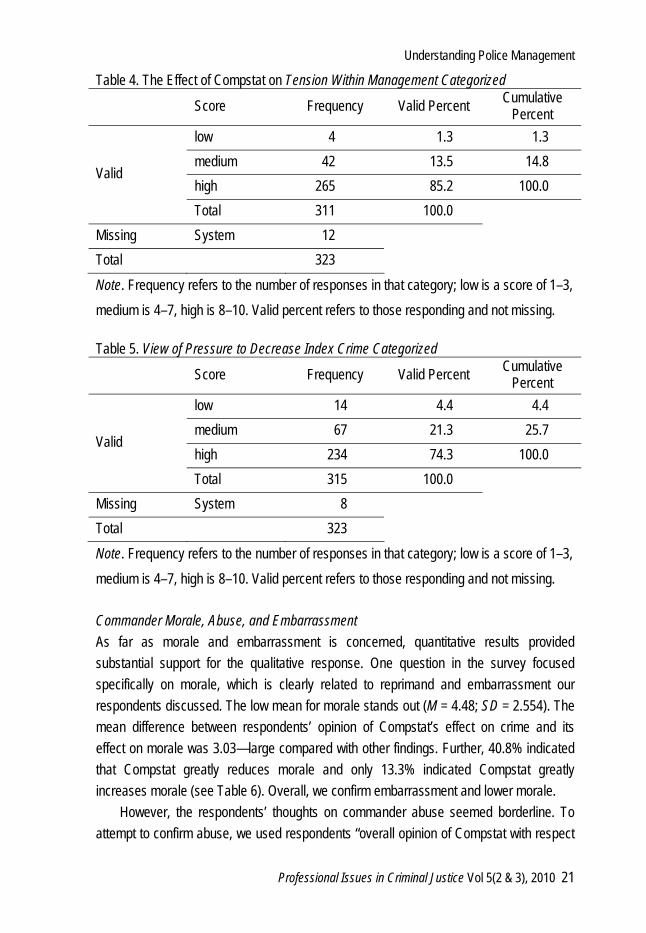
Hierarchical Pressure We next turn our attention to examining hierarchical pressure. One question in the survey that measured the extent of hierarchical pressure in the entire sample examined respondents’ views about “the extent that Compstat reduces or increases tension among management,” on a 1 to 10 scale with 1 indicating Compstat reduces tension and 10 indicating it increases tension. Here, there is no doubt that hierarchical pressure is very high. Indeed, no respondent chose “1,”’ and the mean response clearly shows respondents felt enormous tension with a very small standard deviation (M = 8.78 SD = 1.484). The mean difference between reducing crime and the tension that management experienced is fairly large (mean difference = 1.27). Even though respondents recognized Compstat’s success at reducing crime, their recognition that it increases tension levels was even greater. Univariate analysis indicated that 85.2% of the sample believed that Compstat greatly increases tension among management (see Table 4). This finding clearly confirms the comments about pressure with Compstat.
Further, the pressures to decrease index crime are also strong. In response to a specific question about the pressures to reduce index crime, we found a comparatively large mean, which indicates there is certainly great pressure on respondents to reduce index crime (M = 8.26, SD = 2.053). Univariate analysis indicated that 74.3% felt high pressure from superiors by way of Compstat to decrease index crime. Only 4.4% indicated low pressure, with the remainder in the middle. This variable also confirms accounts of the high levels of pressure on commanders (see Table 5).
20 Professional Issues in Criminal Justice Vol 5(2 & 3), 2010
Understanding Police Management
Table 4. The Effect of Compstat on Tension Within Management Categorized
Score Frequency Valid Percent Cumulative Percent
low 4 1.3 1.3 medium 42 13.5 14.8 high 265 85.2 100.0
Valid
Total 311 100.0 Missing System 12 Total 323 Note. Frequency refers to the number of responses in that category; low is a score of 1–3, medium is 4–7, high is 8–10. Valid percent refers to those responding and not missing.
Table 5. View of Pressure to Decrease Index Crime Categorized
Score Frequency Valid Percent Cumulative Percent
low 14 4.4 4.4 medium 67 21.3 25.7 high 234 74.3 100.0
Valid
Total 315 100.0 Missing System 8 Total 323 Note. Frequency refers to the number of responses in that category; low is a score of 1–3, medium is 4–7, high is 8–10. Valid percent refers to those responding and not missing.
Commander Morale, Abuse, and Embarrassment As far as morale and embarrassment is concerned, quantitative results provided substantial support for the qualitative response. One question in the survey focused specifically on morale, which is clearly related to reprimand and embarrassment our respondents discussed. The low mean for morale stands out (M = 4.48; SD = 2.554). The mean difference between respondents’ opinion of Compstat’s effect on crime and its effect on morale was 3.03—large compared with other findings. Further, 40.8% indicated that Compstat greatly reduces morale and only 13.3% indicated Compstat greatly increases morale (see Table 6). Overall, we confirm embarrassment and lower morale.
However, the respondents’ thoughts on commander abuse seemed borderline. To attempt to confirm abuse, we used respondents “overall opinion of Compstat with respect
Professional Issues in Criminal Justice Vol 5(2 & 3), 2010 21

Eterno and Silverman
to improving teamwork within management.” For this variable the results were somewhat borderline: we saw a fairly large mean difference (mean difference = 1.38) between improving teamwork within management and reducing crime (M = 6.13; SD = 2.761). Also, 41.5% believed that Compstat improves teamwork within management (see Table 7). We leave this finding as borderline due to the larger mean difference; yet, at the same time, respondents have a fairly good opinion of Compstat with respect to improving teamwork. It may be that some management abuse takes place but not enough to upset department-wide teamwork. Further, perhaps only a few of the inquisitors are abusive. Regardless, presence of low morale and embarrassment are confirmed, but management abuse is borderline.
Table 6. The Effect of Compstat on Morale Within Management Categorized
Score Frequency Valid Percent Cumulative Percent
low 127 40.8 40.8 medium 141 45.3 86.2 high 43 13.8 100.0
Valid
Total 311 100.0 Missing System 12 Total 323 Note. Frequency refers to the number of responses in that category; low is a score of 1–3, medium is 4–7, high is 8–10. Valid percent refers to those responding and not missing. Table 7. The Effect of Compstat on Improving Teamwork Within Management Categorized
Score Frequency Valid Percent Cumulative Percent
low 65 20.9 20.9 medium 117 37.6 58.5 high 129 41.5 100.0
Valid
Total 311 100.0 Missing System 12 Total 323 Note. Frequency refers to the number of responses in that category; low is a score of 1–3, medium is 4–7, high is 8–10. Valid percent refers to those responding and not missing.
22 Professional Issues in Criminal Justice Vol 5(2 & 3), 2010

Understanding Police Management
Organizational Inefficiency The final theme we identified is organizational inefficiency. The question we used to examine the extent to which the entire sample felt Compstat is inefficient was respon-dents’ “overall opinion of Compstat with respect to improving management effectiveness.” For this theme, unlike the others, we cannot confirm that the statements of the respondents reflect the entire sample. While the mean score was somewhat less (mean difference = .58) and the standard deviation higher, it does not seem that much different from the favorable aspect of reducing crime (M = 6.93; SD = 2.619) (see Table 1). Additionally, 52.7% of respondents believed that Compstat is excellent at improving management effectiveness (see Table 8). Thus, while there may be specific instances of Compstat’s inefficiency, it does not seem to be department-wide phenomena. Table 8. The Effect of Compstat on Improving Management Effectiveness Categorized
Score Frequency Valid Percent Cumulative Percent
low 42 13.5 13.5 medium 105 33.8 47.3 high 164 52.7 100.0
Valid
Total 311 100.0 Missing System 12 Total 323 Note. Frequency refers to the number of responses in that category; low is a score of 1–3, medium is 4–7, high is 8–10. Valid percent refers to those responding and not missing.
Overall, the quantitative analyses confirm the negative themes of Compstat with respect to top-down management as well as hierarchical pressure. As far as commander morale, abuse, and embarrassment is concerned, low morale and embarrassment were confirmed, but abuse was borderline. Lastly, organizational inefficiency was not confirmed.
Discussion
Four basic themes emerged from the qualitative analysis of the survey responses of retired NYPD officers and their experience with Compstat: top-down management; hierarchical pressure; commander morale, abuse, and embarrassment; and organizational inefficiency. We conclude tentatively that there is at least some quantitative
Professional Issues in Criminal Justice Vol 5(2 & 3), 2010 23

Eterno and Silverman
support for the existence of the first three within Compstat (although abuse is borderline), while inefficiency is not confirmed. These NYPD findings appear somewhat similar to the conclusion of the national survey (which excluded New York City) that Compstat departments “reinforce a traditional bureaucratic model of command and control” (Weisburd et al., 2003, p. 448).
Four basic themes emerged from the qualitative analysis of the survey responses of retired NYPD officers and their experience with Compstat: top-down management; hierarchical pressure; commander morale, abuse, and embarrassment; and organizational inefficiency. We conclude tentatively that there is at least some quantitative support for the existence of the first three within Compstat (although abuse is borderline), while inefficiency is not confirmed. These NYPD findings appear somewhat similar to the conclusion of the national survey (which excluded New York City) that Compstat departments “reinforce a traditional bureaucratic model of command and control” (Weisburd et al., 2003, p. 448).
In addition to the overlap issues of bureaucratization and centralization (i.e., top-down management), our study suggests additional avenues for future analyses. For example, the national survey concluded that “agencies that had adopted Compstat programs were much less likely to focus on improving the . . . morale of street level officers” (Weisburd et al., 2006, p. 293 ). Similarly, our study found a lack of strong support for the view that Compstat improved teamwork among the rank and file. This low level teamwork may well be associated with lower morale. Future research should explore this possible linkage.
Perhaps even more importantly, our respondents had divergent opinions on the issue of teamwork at the different hierarchical levels. In contrast to their views on low level teamwork, our respondents expressed stronger support for the view that Compstat improved teamwork within management.
It is our view that these contrasting views on teamwork are wholly consistent with our overall findings of Compstat as shoring up the bureaucratic top-down centralized style of police organization and management. When Compstat’s top-down management promotes hierarchical pressure to decrease index crime, it filters down to rank-and-file activities whether it is through increased use of quotas or discouraging crime reports. This top-down pressure is bound to affect street level morale and widen the gulf between higher and lower levels in the police department. This is certainly the view of the union that represents the rank and file of the NYPD, the Patrolman’s Benevolent Association:
It was a great idea that has been corrupted by human nature. The Compstat program that made NYPD commanders accountable for controlling crime has degenerated into a situation where the police
24 Professional Issues in Criminal Justice Vol 5(2 & 3), 2010

Understanding Police Management
leadership presses subordinates to keep numbers low by any means necessary. The department’s middle managers will do anything to avoid being dragged onto the carpet at the weekly Compstat meetings. They are, by nature, ambitious people who lust for promotions, and rising crime rates won’t help anybody’s career. So how do you fake a crime decrease? It’s pretty simple. Don’t file reports, misclassify crimes from felonies to misdemeanors, under-value the property lost to crime so it’s not a felony, and report a series of crimes as a single event (Zink, 2004, 1).
This is not the first time that a distinct organizational fault line separating upper management from street level New York City police has been observed. An in-depth study of two precincts in the late 1970s found deeply seated street cop resentment and alienation from what they perceive as the more educated, self-serving upper echelons who are motivated by rationalistic efficiency criteria that appease politicians, the media, and the courts. The precinct cop viewed upper levels as impersonal and neither under-standing nor sympathetic to the necessities of daily police activity (Reuss-Ianni, 1983).
With a glaring parallel to current day Compstat pressures, precinct level cops were put off by what they perceived as contemporary incarnations of managerial imposition in the guise of Management by Objectives, which measured and held them accountable for their production. Upper level innovations were viewed as burdensome, abstract, and impersonal in the tradition of bureaucratic administration (Reuss-Ianni, 1983)
As with any study, this study has some limitations. Most of these are tradeoffs due to key features of the method, namely, the use of anonymity and the need to keep the questionnaire brief. If the questionnaire had been longer, for example, scales could have been developed by using multiple questions. Such tradeoffs are typical, and future research will have to address those issues that are beyond the scope of this study. We are, however, very confident that the analyses completed here accurately reflect respon-dents’ views of Compstat as practiced by the NYPD.
Our study, therefore, raises several issues that are relevant to not only the practice of Compstat but also the functioning operations of the NYPD and other police performance management systems. The issues that we have raised—top-down management, hierarchical pressure, commander moral, abuse, and embarrassment, and organizational inefficiency—are important because Compstat's success is much heralded and well known, but its downside needs further research, exposure, and public discussion.
The results of additional research will also shed light on Compstat’s overall effect on the management, organizational arrangements, leadership style, morale, and functioning
Professional Issues in Criminal Justice Vol 5(2 & 3), 2010 25
Eterno and Silverman
of the New York City Police Department. Surely a management system that has been enshrined in New York and elsewhere for 16 years warrants a full exploration of all its dimensions and their potential linkage with other police performance management systems.
Notes
1. The category of “others” includes, for example, those who may have risen to higher ranks but maintained their membership in the Captains Endowment Association (CEA).
2. Based on statements made by the CEA president to us regarding the percentages.
References
Babbie, E. (1989). The practice of social research (5th ed.). (Belmont, CA: Wordsworth.) Blau, P. M. (1956). Bureaucracy in modern society. New York: Crown. Bradburn, N. M. (1983). Response effects. In P. Rossi, J. Wright, & A. Anderson (Eds.),
Handbook of survey research (pp. 289–328). New York: Academic Press. Bratton, W., & Knobler, P. (1998). Turnaround. New York: Random House. Cowper, T. J. (2000). The myth of the ‘military model’ of leadership in law enforcement.
Police Quarterly. 3(4): 228–246. Dabney, D. (2010). Observations regarding key operational realities in a Compstat model
of policing. Justice Quarterly, 27(1): 28–51. Dillman, D. A. Mail and other self-administered questionnaires. In P. Rossi, J. Wright, & A.
Anderson (Eds.), Handbook of survey research (pp. 359–377). New York: Academic Press.
Eterno, J. A., & Silverman, E. B. (2006). The New York City police department’s
Compstat: Dream or nightmare? The International Journal of Police Science and Management, 8(3): 218–231.
Giuliani, R. W. (2002). Leadership. NY: Hyperion. Henry, V. E. (2002). The Compstat paradigm. Flushing, NY: Looseleaf Law Publications.
26 Professional Issues in Criminal Justice Vol 5(2 & 3), 2010

Understanding Police Management
Kelling, G. L., & Sousa, W. H., Jr. (2001). Do police matter? An analysis of the impact of
New York City’s police reforms. Manhattan Institute Civic Report, No. 22. Retrieved on August 20, 2010, from http://www.manhattan-institute.org/pdf/cr_22.pdf .
Maple, J. (1999). The crime fighter. New York: Doubleday. McDonald, P. (2002). Managing police operations. Belmont, CA: Wadsworth. Moore, M., & Braga, A. A. (2003). Measuring and improving police performance: The
lessons of Compstat and its progeny. Policing: An International Journal of Police Strategies and Management, 26, 439–453.
Neuman, W. L. (2000). Social research methods: Qualitative and quantitative approaches
(4th ed.). Boston: Allyn and Bacon. Reuss-Ianni, E. (1983). Two cultures of policing. New Brunswick, N. J.: Transaction. Shane, J. (2010). The myth of the American police quasi-military model. Paper presented
at the Annual Meeting of Academy of Criminal Justice Sciences, February 26, San Diego.
Silverman, E. B. (2001). NYPD battles crime: Innovative strategies in policing (rev. ed.).
Boston: Northeastern University Press. Silverman. E. B., & O’Connell, P. (1999). Organizational change and decision making in
the New York City Police Department. International Journal of Public Administration, 22(2), 229–242.
Walsh, W. F. (2001) Compstat: An analysis of an emerging police managerial paradigm.
Policing, 24, 347–362. Walsh, W. F., & Vito, G. F. (2004). The meaning of Compstat. Journal of Contemporary
Criminal Justice, 20, 51–69. Weisburd, D., & Braga, A. (2006). Police innovation: Contrasting perspectives.
Cambridge, MA; Cambridge University Press. Weisburd, D., Mastrofski, S., McNally, A., Greenspan, R., & Willis, J. J. (2003). Reforming
to preserve: Compstat and strategic problem solving in American policing. Criminology and Public Policy, 2(3), 421–455.
Weisburd, D., Mastrofski, S., Willis, J. F., & Greenspan, R. (2006). Changing everything
so that everything can remain the same: Compstat and American policing (pp. 284–301). In D. W. Weisburd & A. Braga (Eds.), Police innovation: Contrasting perspectives. Cambridge, MA: Cambridge University Press.
Professional Issues in Criminal Justice Vol 5(2 & 3), 2010 27

Eterno and Silverman
Willis J. J., Mastrofski, S. D., & Weisburd, D. (2003). Compstat in practice: An in depth
analysis of three cities. Washington, D. C.: Police Foundation. Wilson, J. W. (1991). Bureaucracy. New York: Basic Books. Zink, R. (2004, Summer). The trouble with Compstat. PBA Magazine. Retrieved on
August 20, 2010, from http://www.nycpba.org/publications/mag-04-summer/compstat.html
28 Professional Issues in Criminal Justice Vol 5(2 & 3), 2010

Police Officer Staffing: Analyzing the Commonly Held Belief that More Cops Equals Less Crime1
James E. Guffey, James G. Larson, and Chandrika Kelso Police officer staffing levels are believed to relate directly to the crime rate in metropolitan areas; however, the studies on this relationship to date are contradictory and inconclusive. This study compares crime rates in 24 metropolitan areas with the police officer staffing levels over a 12-year time series study. Data for this study are derived from the Bureau of Justice Statistics’ Law Enforcement Management and Administrative Statistics surveys in 1999 and 2003 and the FBI’s Uniform Crime Reports for the period 1996–2008. The data show some but not overwhelming support for the position that there is a negative correlation between police officer staffing and crime rates.
Key Words: Police officers staffing crime rate crime prevention A commonly held belief among law enforcement officials, law enforcement pundits, and citizens of the U.S. is that more police officers on the streets or investigating crimes results in less crime and safer communities. Intuitively, this belief is logical; however, no solid data support this claim. One method of partially and indirectly supporting this claim is to conduct a study of selected cities and counties that compares the number of sworn police officers with the crime rate for given jurisdictions to see whether an inverse relationship exists. Does hiring more police officers result in lower crimes rates?
This paper examines the relationship between police officer staffing and the resulting crime rates in a longitudinal study. It addresses the following research questions:
(1) Is there a correlation between sworn police officer staffing and a city’s or county’s crime rate?
(2) Is there support for the intuitive concept that more police officers on the street conducting preventive patrol reduces the crime rate?
The purpose of this paper is to examine the number of full-time police officers employed by selected police and sheriff’s departments over a 12-year period and compare these staffing levels with the reported crime rate for these cities and counties in the James E. Guffey is associate professor of criminal justice administration and lead faculty for the undergraduate Criminal Justice Administration program, National University, Sacramento. James G. Larson is an associate professor and Chairperson, Department of Professional Studies, National University, La Jolla. Chandrika Kelso is associate professor in the Department of Professional Studies, National University, La Jolla.
Professional Issues in Criminal Justice Vol 5(2 & 3), 2010 29
Guffey, Larson, and Kelso
Uniform Crime Report (UCR). Intuitively, one would posit that more police officers on patrol equals less crime for any particular city or county; however, many researchers assert that their research contradicts this position (see Bayley, 1994; Benson et al., 1994; Blumstein et al., 1978; Cameron, 1988; Gottfredson & Hirschi, 1990; Kelling et al., 1974; Sherman, 1992; and Sparrow et al., 1990). Other researchers (see Correa, 2005; Levitt, 1998; and Marvel & Moody, 1996) have shown a correlation between police officer staffing levels and crime rates for U.S. cities and metropolitan areas. This study analyzes this polemic once again.
Study Overview
Rationale for the Study The period 2007–2009 witnessed one of the most severe recessions in the U.S. since the Great Depression of 1929–1932. Unemployment rose to 10.2%, and police officers in many U.S. cities were laid off in numbers that have not been seen in decades. Layoffs occurred in large part due to: (a) severe drops in general city and county funds resulting from reduced revenue because of decreased property taxes from the housing crisis, and (b) fewer state dollars going to cities and towns as states also found themselves in financial trouble during the recession. But can cities and counties afford to lay off law enforcement officers? Do greater numbers of police officers actually reduce crime in a city or county? Does an economic crisis that results in a reduction in police officers subsequently result in an increase in the crime rate? The foregoing are questions this study addresses. Such questions underscore the need for more studies in the areas of police staffing, efficient use of police person-power, and innovative use of police officers such as community-oriented policing and problem-oriented policing. More comprehensive studies of police officer-to-citizen ratios could also determine more precisely the ideal staffing level for any city in the U.S.
Limitations of the Study The authors conducted a time series study covering 12 years (1996–2008) in which we compared the police officer or sheriff staffing levels with the crime rate for each year to determine whether there was an inverse correlation: Do crime rates decrease over time with the increase in full-time sworn police officers or sheriffs and vice versa? We selected the 18 cities and 8 counties based on their greater fluctuation of officers over time. Specifically, the authors scanned all the reporting cities and counties in the Law Enforce-ment Management and Administrative Statistics for the period 1994–2003 to find the cities and counties with the most variance in the percentage change of police officer staffing—both percentage increase and percentage decrease. This was the only discriminator that
30 Professional Issues in Criminal Justice Vol 5(2 & 3), 2010

Police Officer Staffing
we used and thus the non-random sample. In addition, we did not attempt to control for any possible intervening variables—other than police and sheriff staffing levels—including socioeconomic, cultural, and environmental factors such as community education levels and employment rates, multiculturalism, or availability of drugs and handguns. We also did not consider the many theories of crime causation in the literature, such as biological and sociological factors. Therefore, it is pos-sible that the findings of this study could be spurious or tainted by not having controlled for other variables; however, the authors believe that the combination of the time series design and the selection of cities and counties that vary considerably in police officer staffing size and traditional crime levels has resulted in accurate data and findings. Research Hypothesis The null hypothesis for this study is that there is a negative correlation between police officer staffing and the crime rates, but the correlation is not infinite. Stated in hypothesis format: If cities and counties hire and maintain a prescribed number of peace officers, referred to as the officer-to-citizen ratio, and increase this number based on population increases, then crime rates will remain the same or decrease.
Literature Review
Logic suggests that there must certainly be a relationship between the number of police officers a city or county employs and the crime rate in that city or county, and the relationship is an inverse one: More police officers equals a lower crime rate and fewer police officers equals an increase in the crime rate. This belief is supported logically by the general deterrence theory as espoused two and one-half centuries ago by Cesare Beccaria and Jeremy Bentham in what is now known as the Classical theory of crimi-nology. It is also supported by the concept of incapacitation, i.e., more police officers making more arrests results in more convictions and prison time and thus fewer criminals on the streets to ply their criminal trade. However, a significant number of studies fail to show a negative relationship between the size of a police force and crime (see Bayley, 1994; Benson et al., 1994; Blumstein et al., 1978; Cameron, 1988; Kelling et al., 1974; Gottfredson & Hirschi, 1990; Sherman, 1992; Sparrow et al., 1990).
In summary, the studies offer the following explanations for this finding:
(1) Most police work is not devoted to crime reduction. Policing is primarily reactive to crime that has already occurred.
(2) Only large increases in police levels can produce enough police presence on the streets to deter crime. Police departments generally hire to replace existing vacancies. Large increases occur,
Professional Issues in Criminal Justice Vol 5(2 & 3), 2010 31

Guffey, Larson, and Kelso
for example, when the federal government passes legislation that funds a significant increase in local police and sheriff staffing. As an example of a significant increase in police staffing, the 1994 Omnibus Crime Bill infused cities and counties with 100,000 new police officers serving in the capacity of community policing for about 10 years. During this period, the U.S. experienced significant reductions in both property and violent crime.
(3) The most common police strategies are poor crime-prevention strategies. Police officers conduct “preventive-patrol,” but the time devoted to preventive-patrol can be limited by calls for service.
Police Cost-Efficiency Determining the optimal number of police officers or sheriffs for any given city or county is mostly “guesstimation.” Cities and counties use what is referred to as a police officer-to-citizen ratio, and this ratio is identified for each reporting city and county in all of the Law Enforcement Management and Administrative Statistics (LEMAS) reports. This ratio is expressed as “x” officers per 10,000 citizens residing in the city or county.
In his study titled, “Assessing the Cost-Benefit of Police Officer Staffing: Do Cities with Higher Police Officer-to-Citizen Ratios Have Less Crime?, co-author Guffey (2009) found that this ratio varied considerably. In a study of 29 police and sheriff departments, Guffey found that ratios of 20 or fewer police officers per 10,000 citizens spread officers too thin and resulted in higher crime rates, and ratios above 40 per 10,000 citizens appeared to be greater than needed and possibly resulted in inefficiency. Specifically, crime rates did not decrease in comparison with the lower officer-to-citizen ratio cities and counties and, in fact, increased in some cases. Ratios in excess of 50+ officers per 10,000 citizens showed clear inefficiency; in other words, crime rates in these cities were particular high based on the number of sworn police officers. Ratios in the 30–40 per 10,000 citizen range seemed to be ideal (p. 8).
Correa (2004) also explored this concept of the optimum number of police officers for any given agency. He examined the total cost of damages due to crime plus the cost of police protection in a community. By using UCR data on property and violent crime, Correa converted crime to a monetary cost and compared this with expenditures for police protection. He found, “A preliminary analysis of the data from all [50] states showed a weak positive correlation between expenditures on police protection and cost of crime” (p. 222). He also explains that at some point the expenditures for police protection maximize the reduction in the cost of crime, and no further significant reductions in crime will be realized by continued increases in police officer staffing. Determining the point at which these two intersect determines the maximum police staffing for any given agency.
32 Professional Issues in Criminal Justice Vol 5(2 & 3), 2010

Police Officer Staffing
Correa also reviewed the existing methods of determining the optimal size of police departments; for example, the Commission on Accreditation for Law Enforcement Agencies (CALEA) proposes a formula that uses the number of complaints or incidents reported to a department and the population served. Other researchers recommend similar methods (see Bahl et al., 1980; Hirsch, 1977).
Levitt (1988, 1997) has conducted extensive research in the area of police staffing and crime rates. His results generally contradict those of other researchers, for example Blumstein et al, 1978 and Cameron, 1988, who maintain there is no reliable statistical data to support the contention that increases in police officer staffing levels result in a decrease in a city’s crime rate. Levitt contends that,
If the size of the police force systematically affects the willingness of victims to report crime or a police department’s propensity officially to record victim crime reports, then UCR data will understate the true effectiveness of police in reducing crime (1988, p. 62).
Levitt identifies what he refers to as reporting bias. He asserts that, “[if] reporting bias . . . is present, reported crime rates may increase with the size of the police force, even if the true victimization rate is falling”(p. 63). He states that his data suggest some reporting bias exists, even though the evidence is not overwhelming. He estimates that each additional officer hired leads to the reporting of roughly five Index crimes that otherwise would have gone unreported (p. 64). Consequently, Levitt suggests that resultant decrease in crime rates when police officer staffing increases may be a distortion because more police officers are available to on-view and report crimes that might not have been reported otherwise. In addition, citizens may read or hear about more police officers available to respond to calls for service and report crime that they may not have reported otherwise.
In a subsequent article, Levitt (1997) looked at the timing of mayoral and gubernatorial elections as a causal effect of policing on crime rates. Not surprisingly, Levitt found that increases in the size of police forces are shown to be disproportionately concentrated in mayoral and gubernatorial election years. He found that the mean percentage change in sworn police officers for the 59 cities in the sample was 2.1 percent in gubernatorial election years, 2.0 percent in mayoral election years, and 0.0 percent in nonelection years (p. 2). In addition to looking at election cycles, Levitt also used UCR data of the 59 cities to compare with the increased staffing levels derived from the election years. He found that increases in the number of police reduce violent crime substantially but have a smaller influence on property crime (p. 1).
Professional Issues in Criminal Justice Vol 5(2 & 3), 2010 33
Guffey, Larson, and Kelso
Marvell and Moody (1996) also examined the relationship between police numbers and crime. They used the Granger test, which accounts for lags between changes in police staffing levels and crime rates to avoid the problem of simultaneity. Because there is a significant lag between the time a police officer is hired, trained, and assigned to patrol and any possible reduction in crime, the Granger test seems to be the best method of determining this correlation. By using the data from Levitt’s 59 cities, Marvel and Moody determined that for each additional officer at the city level, approximately 24 fewer crimes occur: .02 homicides, .1 rapes, 1.8 robberies, 5.3 burglaries, 12.5 larcenies, and 4.5 auto thefts (p. 632). Marvel and Moody caution that the estimates are averages across the cities and states, and the figures might be higher or lower in individual localities due to, for example, differences in policing practices and differences in other criminal justice features with which the police interact.
Like Correa above, Marvel and Moody examined the cost of crime and the number of police officers that would be required in their study. They estimate “that the per-officer savings to victims of UCR index crime are roughly $100,000 per additional officer, which are approximately twice the nationwide costs per officer (Lindgren, 1992, as cited in Marvel & Moody, 1996, p. 633). This figure may be spurious, however, because the crime-reducing effect of adding police requires more than just police expenditures. The effect may be due largely to the deterrent and incapacitative effects of additional arrests and more incar-ceration.
In their conclusion, Marvel and Moody emphasize that greater police staffing at the city level reduces most types of crimes, and the effect is often substantial.
Anecdotal evidence suggests a correlation between police officer staffing and city crime rates. In May, 2008, Cleveland, Ohio, mayor Frank Jackson proposed a redistricting plan for the police department that eliminated the city’s Third District and increased the number of officers moving back into patrol duty. In reporting on the proposal, Walker states: “According to Jackson, because of the changes, the city will be able to increase the number of police officers on the street from 914 to 944 as well as the number of patrol cars from 199 to 210” (2008, p. 2). Redistricting, such as in Mayor Frank Jackson’s proposal, allows for more police officers on the street because it takes police officers out of “desk” positions that existed in the District and returns them to patrol assignments where they can have more effect on the crime rate. This is an example of more efficient police officer resources. Crime data are not currently available on the success or non-success of Cleveland’s Third Police District elimination.
Based on the extant literature, with regard to police officer staffing levels and crime rates, there is some degree of support for the commonly held belief that increased police
34 Professional Issues in Criminal Justice Vol 5(2 & 3), 2010

Police Officer Staffing
staffing levels for a city can have at least a delayed effect on reducing the city’s overall crime rate.
Methods
This study is a time series design. It compares crime rates for selected police agencies with the actual staffing numbers of full-time police officers and sheriffs to determine whether there is negative correlation. The negative correlation can be either declining numbers of police officers and increasing crime rates, or increasing numbers of police officers and declining crime rates. The time series period for which data were obtained is 1996 to 2008—12 years. The data were then entered into SPSS to (1) obtain time series graphs for each of the agencies, and (2) obtain correlation coefficients (Pearson r). The null hypothesis is there is a negative correlation between crime rate and police officer staffing in metropolitan police and sheriff departments.
The data for our study were taken from two sources: Law Enforcement Management and Administrative Statistics (LEMAS) published by the Bureau of Justice Statistics (BJS) and the Uniform Crime Report (UCR) published by the Federal Bureau of Investigation (FBI). BJS conducts the LEMAS survey every four to five years, while the FBI compiles and publishes the UCR every year. The most recently published LEMAS survey was conducted in 2003, and the previous survey was conducted in 1999. BJS conducted a LEMAS survey in 2008, but the data have not yet been published.
By using the LEMAS data, the authors selected 18 city police departments and 8 county sheriff agencies to examine. Two agencies, the Suffolk County Police Department and the Palm Beach County Sheriff’s Department, fit the criteria and were surveyed but were dropped from the study due to incomplete crime data for the study time period. The final 24 total agencies studied follow:
Police Departments: Bakersfield, California PD Boise, Idaho PD Downey, California PD Fresno, California PD Garden Grove, California PD Honolulu, Hawaii PD Las Vegas, Nevada Metropolitan PD Memphis, Tennessee PD
Mobile, Alabama PD Newark, New Jersey PD New York City PD Oakland, California PD Philadelphia, Pennsylvania PD Pittsburgh, Pennsylvania PD Pomona, California PD San Jose, California PD San Francisco, California PD
Professional Issues in Criminal Justice Vol 5(2 & 3), 2010 35
Guffey, Larson, and Kelso
Sheriff Departments: San Diego County, California SD Alameda County, California SD San Joaquin County, California SD Bexar County, Texas SD Santa Barbara County, California SD Orange County, California SD Travis County, Texas SD
The selection of these agencies was not done randomly because the authors wanted agencies that showed significant fluctuations in their staffing over the 12 years of the study. Selection was done based on scanning the LEMAS data for agencies that showed the most significant fluctuations of police officer staffing for the period identified. These agencies were then surveyed to obtain the staffing levels for the years 2004 through 2008, the years that will appear in the 2008 LEMAS survey that BJS has not yet published. All agencies responded, which resulted in accurate staffing levels for the years 1996 to 2008. The staffing data were then correlated with the crime index figures for the same years, 1996–2008. Raw figures for both the staffing numbers and the crime index totals were converted to percentage increase or percentage decrease figures to allow for the creation of 24 graphs and 24 Pearson correlation results for each agency by using SPSS. The 1999 LEMAS displayed the percentage increase/decrease of police officer strength for a four-year period (1996–1999) for each of the selected agencies, and the 2003 LEMAS also displayed the percentage increase/decrease for a four-year period (2000–2003). The authors used the 2004–2008 data they obtained by contacting each agency to calculate the percentage increase/decrease for single years for a total of four more years.
Space does not permit reproduction of the 24 SPSS line graphs, which display the relationship of crime rate to officer staffing over the 12-year period of the study. These graphs were used to determine the data in the fourth column of Table 1, Direction of Correlation from SPSS Time Series Graphs.
Results
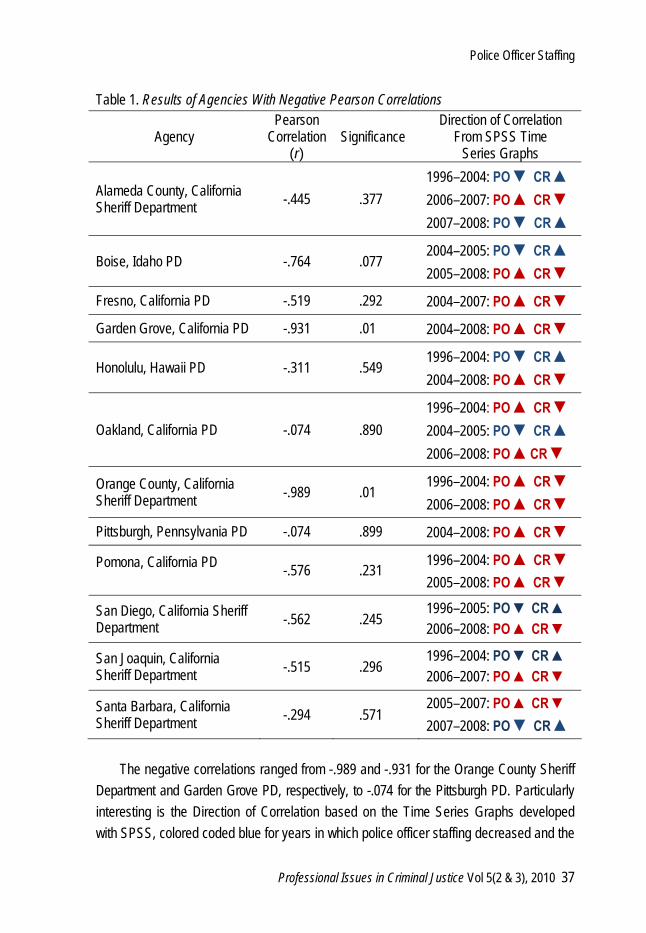
Table 1 reveals that 12 of the 24 agencies (50%) showed a negative correlation between police officer staffing and crime rate. Seven of these agencies fall into the category of large police agencies, defined as agencies serving a population of 300,000 or more: Oakland PD, Fresno PD, Orange County Sheriff Department, Alameda County Sheriff Department, Pittsburgh PD, San Diego Sheriff Department, and Honolulu PD. Five agencies fall into the category of medium to small agencies, defined as serving a population of fewer than 300,000: Boise PD, Garden Grove PD, San Joaquin Sheriff Department, Santa Barbara Sheriff Department, and Pomona PD.
36 Professional Issues in Criminal Justice Vol 5(2 & 3), 2010
Police Officer Staffing
Table 1. Results of Agencies With Negative Pearson Correlations
Agency Pearson
Correlation (r)
Significance Direction of Correlation
From SPSS Time Series Graphs
Alameda County, California Sheriff Department -.445 .377
1996–2004: PO ▼ CR ▲ 2006–2007: PO ▲ CR ▼ 2007–2008: PO ▼ CR ▲
Boise, Idaho PD -.764 .077 2004–2005: PO ▼ CR ▲ 2005–2008: PO ▲ CR ▼
Fresno, California PD -.519 .292 2004–2007: PO ▲ CR ▼
Garden Grove, California PD -.931 .01 2004–2008: PO ▲ CR ▼
Honolulu, Hawaii PD -.311 .549 1996–2004: PO ▼ CR ▲ 2004–2008: PO ▲ CR ▼
Oakland, California PD -.074 .890 1996–2004: PO ▲ CR ▼ 2004–2005: PO ▼ CR ▲ 2006–2008: PO ▲CR ▼
Orange County, California Sheriff Department -.989 .01
1996–2004: PO ▲ CR ▼ 2006–2008: PO ▲ CR ▼
Pittsburgh, Pennsylvania PD -.074 .899 2004–2008: PO ▲ CR ▼
Pomona, California PD -.576 .231
1996–2004: PO ▲ CR ▼ 2005–2008: PO ▲ CR ▼
San Diego, California Sheriff Department -.562 .245
1996–2005: PO ▼ CR ▲ 2006–2008: PO ▲ CR ▼
San Joaquin, California Sheriff Department -.515 .296
1996–2004: PO ▼ CR ▲ 2006–2007: PO ▲ CR ▼
Santa Barbara, California Sheriff Department -.294 .571
2005–2007: PO ▲ CR ▼ 2007–2008: PO ▼ CR ▲
The negative correlations ranged from -.989 and -.931 for the Orange County Sheriff
Department and Garden Grove PD, respectively, to -.074 for the Pittsburgh PD. Particularly interesting is the Direction of Correlation based on the Time Series Graphs developed with SPSS, colored coded blue for years in which police officer staffing decreased and the
Professional Issues in Criminal Justice Vol 5(2 & 3), 2010 37

Guffey, Larson, and Kelso
crime rate increased, and red for the years in which police officer staffing increased and the crime rate decreased. Among the 12 agencies, there were 8 periods in which police officer staffing decreased and the crime rate increased and 15 periods in which police officer staffing increased and the crime rate decreased. Represented in years, police officer staffing decreased and the crime rate increased in 37 combined years, and police officer staffing increased and the crime rate decreased in 55 combined years. This represents 32.7% negative correlation—police officer strength decreased while crime increased in 37 combined years and 67.3% negative correlation—police officer strength increased while crime decreased in 55 combined years, or approximately one-third and two-thirds. Table 2. Results of Agencies With Positive Correlations
Agency Pearson Correlation (r) Significance
Bakersfield, California PD +.975 .01 Bexar, Texas Sheriff Department +.923 .01 Downey, California PD +.743 .090 Las Vegas, Nevada Metro PD +.540 .268 Memphis, Tennessee PD +.684 .134 Mobile, Alabama PD +.084 .874 Newark, New Jersey PD +.745 .090 NYPD +.961 .01 Philadelphia, Pennsylvania PD +.299 .565 San Jose, California PD +.917 .01 San Francisco, California PD +.291 .567 Travis, Texas County Sheriff +.793 .060
Table 2 displays the results of the 12 cities and counties of the 24 surveyed in which
there was no correlation between police officer staffing and crime rate. In other words, while police officer strength increased crime rates also increased, and vice versa. These 12 cities and counties are Bakersfield, California PD; Bexar, Texas Sheriff Department; Downey, California PD; Las Vegas, Nevada Metro PD; Memphis, Tennessee PD; Mobile, Alabama PD; Newark, New Jersey PD; NYPD; Philadelphia, Pennsylvania PD; San Jose, California PD; San Francisco, California PD; and Travis, Texas Sheriff Department. The range of the Pearson correlations are from +.975 in Bakersfield, California, to +.084 in Mobile, Alabama. A positive Pearson correlation indicates either that crime rates increased when
38 Professional Issues in Criminal Justice Vol 5(2 & 3), 2010

Police Officer Staffing
police officer staffing increased or crime rates fell when police officer staffing decreased. Four of the agencies indicate a significant correlation at the .01 level: Bakersfield PD, Bexar, Texas Sheriff Department, NYPD, and San Jose PD.
Conclusions and Recommendations
The data indicate support for the null hypothesis: there is a negative correlation between police officer staffing and the crime rates. Clearly the null hypothesis cannot be rejected. Fifty percent of the agencies revealed a negative correlation between police officer staffing and crime rate. In fact, the data results were contrary to what the authors expected. The limitations of this study were discussed earlier and must be reiterated here in the conclusions. This study did not control for any other factors that might influence crime rates in these agencies. It is possible that factors other than the level of police officer staffing influenced the crime rates of these agencies during the study period. Moreover, this study does not directly account for lag—the period in which additional police officers must be trained and gain experience; police officers and sheriffs cannot affect the crime rate in their agency, for example, during their training—both in the police academy and their 6 months to a year on-the-job training. Nevertheless, a time series design does make an indirect allowance for lag. Twelve years allows considerable time for officer training and experience to have an effect on the crime rate in their agency.
Perhaps the most revealing finding of this study is that one-third of the negative correlations were the result of police officer decreases combined with crime rate increases. It appears that when cities or counties reduce the number of sworn police officers as a result of bad economic conditions or other factors, the crime rate tends to increase. The explanation for this may be that criminals or potential criminals learn about the officer reductions through media reports and decide that times of reduced police officer staffing may be the most opportune time to commit their crimes. A reduction in police officer staffing makes headlines in the local newspapers and television stations. It is not farfetched to assume that criminals and potential criminals watch or read the news about police officer reductions and see this as an opportunity to commit more crimes. Perhaps the results of this study point toward this possibility.
This study only touches on the very important topic of police officer staffing levels and crime rates. It is a topic that requires further research because more data are necessary to support the political stance not to lay off police and sheriff officers in times of financial crisis. Public safety should be the first concern of cities, but politicians need empirical support for not laying off officers when other city or county services are making cuts in times of financial crisis. Moreover, politicians should not be made the only scapegoats when they do make the politically dangerous decision to lay off officers. Agencies can do
Professional Issues in Criminal Justice Vol 5(2 & 3), 2010 39
Guffey, Larson, and Kelso
more in times of crisis as cited earlier (see Walker, 2008). As discussed earlier in this paper, Mayor Frank Jackson of Cleveland, Ohio, imposed a redistricting plan that eliminated the city’s Third Patrol District, and this put 30 more officers on patrol duty and added 11 more patrol vehicles. Police chiefs and sheriffs must be willing, on their own, to reassign officers temporarily from non-patrol duty to patrol duty until staffing returns to the traditional officer-to-citizen ratio. The safety of citizens should not be put in jeopardy while politicians and police administrators fight over cuts versus reassignment; both should be a part of any plan.
More agencies must be included in a follow-up study and perhaps a longer longitudinal study to add external validity to this study. Clearly, more research is needed.
Note
1. This paper was presented originally at the 47th Annual Conference of the Academy of Criminal Justice Sciences, February 23-27, 2010, San Diego, CA.
References
Bahl, R., Johnson, M, & Wasylenko, M. (1980). State and government expenditure determinants: The traditional view and a new approach. In R. Bahl, J. Burkhead, & B. Jump, B. (eds.), Public employment and state and local government finance (pp. 65–119). Cambridge, MA: Ballinger.
Bayley, D. H. (1985). Patterns of policing: A comparative analysis. New Brunswick, N.J.:
Rutgers University Press. Benson, B. L., Kim, I, & Rasmussen, D. W. (1996). Estimating deterrence effects: A public
choice perspective on the economics of crime literature. Southern Economic Journal, 61, 160–168.
Blumstein, A., Cohen, J., & Nagin, D. (1978). Deterrence and incapacitation: Estimating
the effects of criminal sanctions and crime rates. Washington, D.C.: National Academy Press.
Cameron, S. (1988). The economics of crime deterrence: A survey of theory and
evidence. Kyklos, 41, 301–323. Coe, C. K. & Weisel, D. L. (2001). Police budgeting: Winning strategies. Public
Administration Review, 61(6), 718–727. Correa, H. (2005). Optimal expenditures on police protection. Socio-Economic Planning
Sciences, 39, 215–228.
40 Professional Issues in Criminal Justice Vol 5(2 & 3), 2010
Police Officer Staffing
Gennaro, V. F. & Kunselman, J. (2000). Reinventing government: The view of police managers. Police Quarterly, 3(3), 315–330.
Gottfredson, M. R. & Hirschi, T. (1990). A general theory of crime. Stanford, CA: Stanford
University Press. Guffey, J. (2009). Assessing the cost-benefit of police officer staffing: Do cities with higher
police officer to citizen ratios have less crime? Global Conference on Business and Finance Proceedings, 5(11), 120–128.
Hirsch, W. Z. (1977). Production, cost, and expenditure determinate functions of police
services. In S. S. Nagel, (ed.), Modeling the criminal justice system (pp. 127–141). Beverly Hills, CA: Sage Publications.
Jordan, R. E. (1992). Policing strategies that address community needs in the 21st
century. Sacramento, CA: The Commission on Police Officer Standards and Training. Kelling, G. L, Pate, T., Dieckman, D., & Brown, C. E. (1972). The Kansas City preventive
patrol experiment. Washington, D.C.: The Police Foundation. Levitt, S. D. (1997). Using electoral cycles in police hiring to estimate the effect of police
on crime. The American Economic Review, 87(3), 270–290. Levitt, S. D. (1998). The relationship between crime reporting and use of uniform crime
reports. Journal of Quantitative Criminology, 14(1), 61–81. Marvel, T. B., & Moody, C. E. (1996, November). Specification problems, police levels,
and crime rates. Criminology, 34(4), 609–646. Sherman, L. W. (1992). Attacking crime: Police and crime control. In M. Tonry & N. Morris,
(eds.), Modern policing. Chicago, IL: University of Chicago Press. Southwick, L. (2005). Economies of scale and market power in policing. Managerial and
Decision Economics, 26(8), 461–473. Sparrow, M. K., Moore, M. H., & Kennedy, D. (1990). Beyond 911: A new era for policing.
New York: Basic Books. Walker, R. (2008, May 7). Safety threatened by new plan, says police union. Call & Post,
p. A3. Retrieved on October 9, 2009, from Ethnic News Watch (Doc ID: 1496995051).
Professional Issues in Criminal Justice Vol 5(2 & 3), 2010 41

Factors That Contribute to the Success or Failure of Risk Reduction Initiative Clients Michael Birzer and Paul Cromwell
This study investigates factors that contribute to probation clients either successfully completing or failing an offender Risk Reduction Initiative (RRI) program. The study includes (N = 388) clients whom the courts assigned to the RRI program. Clients were divided into three groups: clients who completed the program successfully (n1 = 237), clients who failed the program due to technical violations of their probation (n2 = 100), and clients who failed the program due to the commission of new crimes (n3 = 51). A multivariate discriminant analysis revealed that six discriminator variables met the criteria to be included in interpretation of the discriminant function. Clients who failed to complete the RRI program due to technical violations of probation and for the commission of new crimes were younger and scored at higher risk levels on the Level of Service Inventory–Revised (LSI-R) in the following domains: education/employment, attitude orientation, companionship, criminal history, and alcohol/drug use.
Key Words: Discriminant analysis risk reduction initiative risk factors criminality Factors that contribute to offenders failing or successfully completing programmatic probation efforts have long attracted the interest of criminologists and corrections authorities. Risk factors known to jeopardize offenders’ successful completion of probation programs aimed at reducing recidivism include antisocial behaviors, negative peer influences, substance abuse, mental illness, lack of financial stability, barriers in securing meaningful employment, and dysfunctional family issues. The inability to overcome such factors will likely also result in probationers’ continuing to lead a criminal lifestyle.
This paper reports the results of a study of adult probation clients in a midwestern city who were part of a Risk Reduction Initiative (RRI). The purpose of this study was to describe factors leading to success or failure in completing the RRI program among probation clients. A corollary objective of the study was to determine whether a multi-variate discriminant analysis was a tenable procedure for identifying the factors that separate the three groups of clients: those who completed the program successfully, those who failed the program due to technical violations of probation, and those who failed the program because of the commission of new crimes. Michael L. Birzer is associate professor and director of the School of Community Affairs at Wichita State University. Paul Cromwell is a professor of criminal justice at the University of South Florida-Polytechnic.
Professional Issues in Criminal Justice Vol 5(2 & 3), 2010 43

Birzer and Cromwell
Risk Factors
Risk factors generally fall into two categories, static and dynamic. Static factors cannot be changed with treatment and include, for example, age, gender, age of first substance abuse, age of first arrest, and past criminal history (Kelly & Welsh, 2008). Static risk factors provide important information for assessing overall risk (Beech, Fisher, & Thornton, 2003).
Dynamic factors can potentially change and are amenable to treatment (Bonta & Wormith, 2008). Dynamic factors include antisocial attitudes and behavior, values that support criminality such as neutralizing or excusing criminal behavior, cognitions, family dysfunction, poor self-control, lack of education, associations, substance abuse, interpersonal relationships, particularly the way offenders communicate with pro-social influences such as family or friends, and maintaining active employment status (Andrews & Bonta, 2003). When addressed effectively, changes or improvements in dynamic factors can significantly reduce the likelihood of criminality and subsequent recidivism (Cottle, Lee, & Heilbrun, 2001; Myner, Santman, Cappelletty, & Perlmutter, 1998).
Risk Reduction Initiative (RRI)
Since the 1980s recidivism rates among offenders have increased steadfastly. For example, in the early 1980s, the Bureau of Justice Statistics conducted a national recidivism study and found that 63% of released prisoners were re-arrested (Beck & Shipley, 1989). Austin, Hardyman, and Irwin (2002) estimate that within three years, more than 51% of prisoners released during the 1980s were back in prison either because of a new crime for which they received another prison sentence or because of a technical violation of their parole. One other study that examined nearly 300,000 prisoners released in 15 states in 1994 found that 67.5% were rearrested within three years (Langan & Leven, 2002). Similarly, a study of recidivism rates in California showed that of inmates released from prison in 2000, 60.5% were re-incarcerated within three years (California Department of Corrections, 2004).
Because of the increase in recidivism rates, the emphasis of corrections authorities shifted from individualized models of rehabilitation to managing the aggregate risk of offenders with strategic offender population management approaches (Feeley & Simon, 1992). In the strategic offender population management approach, offenders are often managed in large groups based on risk level with minimal attention given to individual risk factors that may reduce recidivism (Garland, 2001). Risk Reduction Initiative approaches are designed to tailor treatment strategies based on the individual needs of each offender
44 Professional Issues in Criminal Justice Vol 5(2 & 3), 2010
Factors That Contribute to the Success or Failure of RRI Clients
and not simply managing offenders based on large aggregate numbers that often overlook individual treatment needs.
One objective in assessing risk and reducing recidivism is identifying and addressing criminogenic needs—attributes of offenders that are directly linked to recidivism. Crimino-genic needs that place an offender at high risk of re-offending include association with other known offenders, substance abuse habits, unemployment, and lack of job skills.
Effective treatment programs develop comprehensive case plans that identify offenders’ criminogenic needs in an effort to treat the underlying risk factors and minimize future criminality. The RRI is designed to accomplish this important mandate of identifying and treating the individual offender’s criminogenic needs. The RRI program targets clients at high risk for revocation of probation.
Methods
This study is part of a larger evaluation of the RRI program the Department of Adult Corrections initiated in this community. The study took place in a city in the midwestern United States with a metropolitan population of about 500,000. The 2000 census data show the community to be 69% White, 11% Black, 13% Hispanic, 5% Asian, and 2% other race or ethnicity. Comparison Groups The participant population consisted of all clients (N = 388) sentenced to the RRI program from January 1, 2008 to June 30, 2008. At the conclusion of the RRI program, clients were placed into one of three mutually exclusive groups: (1) those who successfully completed the RRI program, (2) those who failed the RRI program due to technical violations, and (3) those who failed the RRI program due to the commission of new crimes. Technical violations of probation are specific violations of the terms and conditions of probation, such as alcohol use, a urinalysis positive for illicit drugs, or failure to report to program authorities. Data Analysis Because the RRI clients fell exclusively into one of three groups, and because one of the objectives of the research was to describe factors that separate the groups, the authors selected discriminant analysis (DA), a multivariate statistical procedure, as the technique for investigating the differences among the groups. As with other multivariate techniques, the emphasis in DA is on analyzing several variables together rather than singly, which allows researchers to consider the interaction of multiple variables simultaneously. DA facilitates the investigation of the differences between two or more known and distinct
Professional Issues in Criminal Justice Vol 5(2 & 3), 2010 45

Birzer and Cromwell
groups in relationship to a set of discriminator variables (Birzer & Craig-Moreland, 2008; Klecka, 1980). DA is used to predict group membership and describe the way(s) that groups differ (Betz, 1987; Huberty & Olejnik, 2006). In this study, we were primarily interested in describing group differences. Measures The analysis included 10 discriminator (independent) variables. These variables were examined to see whether they were useful in differentiating between the outcome variable, which was group placement: successful completion, failed due to technical violations, failed due to new criminal charges. Nine discriminator variables were taken directly from domain scores of the List Service Inventory–Revised (LSI-R) assessment instrument.
The LSI-R is a dynamic risks/needs assessment instrument first developed in Canada and subsequently used widely as a valid and reliable offender classification and management tool (Andrews and Bonita, 1995; Andrews, Kiessling, Mickus, & Robinson, 1986; Austin, 2006; Folsom & Atkinson, 2007; Holsinger, Lowenkamp, & Latessa, 2006; Lowenkamp & Bechtel, 2007). The LSI-R’s applications include assisting in probation placement decisions, making appropriate security level classifications, and assessing treatment progress.
The LSI-R consists of 54 static and dynamic items that are grouped into ten sub-scales believed to be related to future criminal behavior: criminal history (10 items); education and employment status (10 items); financial status (2 items); family and marital relationships (4 items); accommodation, i.e., level of domestic security (3 items); leisure and recreation activities (2 items); character of companions (5 items); alcohol and drug use (9 items); emotional and personality characteristics (5 items), and attitude orientation, i.e., attitudes, values, and antisocial or prosocial beliefs (4 items).
The LSI-R interviewer is expected to make either a dichotomous “yes” or “no” to 37 items and a Likert scale rating of satisfactory, relatively satisfactory, relatively unsatisfactory, or very unsatisfactory for the other 17 items. Based on these responses, the interviewer scores the offender on each item, totals the item scores, and determines the client’s overall risk level. The higher the score on any given domain, the higher the risk for re-offending.
The domain variables taken from the LSI-R for use as discriminator variables in this study were criminal history score, education and employment score, family/marital score, accommodation score, leisure/recreational score, companion score, alcohol/drug use score, emotional/personality score, and attitude/orientation score. The tenth variable used was age.
46 Professional Issues in Criminal Justice Vol 5(2 & 3), 2010
Factors That Contribute to the Success or Failure of RRI Clients
Results
Recall that the study included 388 clients who were assigned to the RRI program from January 1, 2007 to June 30, 2008. Of these, 293 (76%) were males, and 95 (24%) were female. Of these clients, 235 (61%) were White; 120 (31%) Black; 28 (7%) were Hispanic, and 5 (1%) were other race. Twelve (12) clients reported having some college, four (4) reported having attended vocational education courses, 252 (65%) reported having a high school diploma or its equivalent, 120 (31%) reported having less than a high school diploma (this ranged from 6th grade to 11th grade). In regards to marital status, 325 (84%) reported being single or divorced, and 63 (16%) reported being married. Of these 388 clients, 237 (61%) completed the RRI program successfully, 100 (26%) failed the program due to technical violations, and 51 (13%) failed the program due to the commission of new crimes. Discriminant Analysis In preparing for discriminant analysis, it is important to ensure that several assumptions are met. The first assumption is that the analysis includes two or more mutually exclusive groups and each group has at least two subjects. Recall that in this study each client was placed into one of three mutually exclusive groups: successful completion, failed due to technical violations, failed due to the commission of a new crime. Furthermore, 237 clients were in the successful completion group, 100 in the failed due to technical violations group, and 51 in the failed due to commission of new crimes group.
The second assumption is that the discriminating variables are measured at the interval level. In this study, nine variables, which consisted of interval level domain scores from the LSI-R, were used along with the variable of age.
The third assumption is that the size of each group must exceed the number of discriminating variables by 2. The smallest group size in this study was the failed due to the commission of a new crime group (n = 51). Recall that this study used 10 discriminating variables.
The fourth assumption is that the discriminating variables must not share variance. To determine this, the researchers examined the pooled within-groups matrices. This examination revealed that none of the variables shared variance.
The fifth and final assumption the researchers considered was that the covariance matrices for each group were approximately equal. If the covariance matrices are equal, the assumption is that the subjects were sampled from the same population. Thus, any differences noted in the DA can be attributed to the variables of interest rather than the possibility that the two groups were different (Sherry, 2006). Homogeneity of
Professional Issues in Criminal Justice Vol 5(2 & 3), 2010 47
Birzer and Cromwell
variance/covariance matrices in DA is similar to homogeneity of variance in ANOVA. The researchers calculated the Box’s M test of homogeneity of variance/covariance to evaluate whether this assumption was met. The Box’s M test revealed a non-significant finding: F(132, 70068.19) = 1.158, p = .104). The non-significant Box’s M test indicated that the variances are equal across the groups; thus, the homogeneity of variance/covariance assumption is met. Canonical Discriminant Functions The researchers evaluated the statistical significance of the canonical discriminant functions. In DA the number of functions is equal to g (groups) – 1. In this study two discriminant functions were produced because RRI clients were placed into one of three mutually exclusive groups. At least one discriminant function should be statistically significant; if not, no further analysis can be completed, and a DA would not be useful. The Wilks’ lambda statistic is the procedure used in DA to discern which functions are statically significant (p = .001). After examining the Wilks’ lambda statistic, the researchers concluded that only one of the two discriminant functions was statistically significant (function 1); thus, it was used in the interpretation of the discriminant function. Function 2 was not statically significant; thus, it was not considered further (see Table 1).
Table 1. Wilks’ Lambda
Function Wilks’ Lambda Chi Square df p
1 .797 86.386 22 .000
2 .981 3.613 10 .963
Significant Variables To judge the acceptance of the discriminant analysis, it is important that the discriminant function produced is describable by using the structure coefficients of the analysis. Thus, a value of .3 or greater was used as the criterion for determining whether variables would be used from the structure matrix. Six of the 10 discriminating variables had sufficient coefficients to be included in the interpretation of the meaning of the discriminant function: education/employment score (= .578), attitude/orientation score (= .556), companions score (= .538), criminal history score (= .512), age (= .368) and alcohol/drug` score (= .352).
The structure coefficient values were squared to calculate the variance accounted for in the composite score for the discriminant function. The variable “education/employment” accounts for 33.40% of the variance on the discriminant function, and the variable “attitude-
48 Professional Issues in Criminal Justice Vol 5(2 & 3), 2010
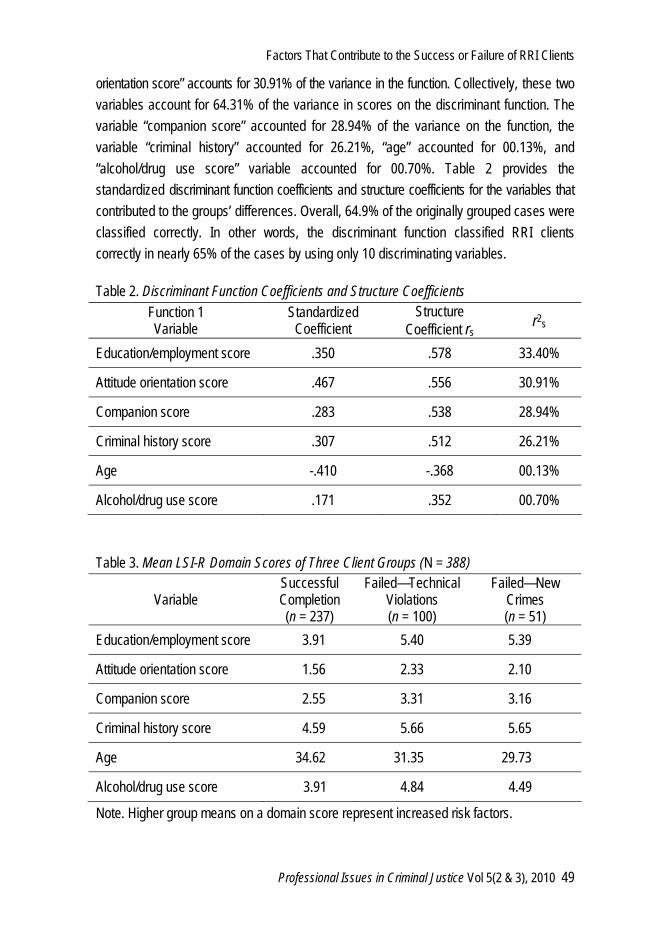
Factors That Contribute to the Success or Failure of RRI Clients
orientation score” accounts for 30.91% of the variance in the function. Collectively, these two variables account for 64.31% of the variance in scores on the discriminant function. The variable “companion score” accounted for 28.94% of the variance on the function, the variable “criminal history” accounted for 26.21%, “age” accounted for 00.13%, and “alcohol/drug use score” variable accounted for 00.70%. Table 2 provides the standardized discriminant function coefficients and structure coefficients for the variables that contributed to the groups’ differences. Overall, 64.9% of the originally grouped cases were classified correctly. In other words, the discriminant function classified RRI clients correctly in nearly 65% of the cases by using only 10 discriminating variables. Table 2. Discriminant Function Coefficients and Structure Coefficients
Function 1 Variable
Standardized Coefficient
Structure Coefficient rs
r2s
Education/employment score .350 .578 33.40%
Attitude orientation score .467 .556 30.91%
Companion score .283 .538 28.94%
Criminal history score .307 .512 26.21%
Age -.410 -.368 00.13%
Alcohol/drug use score .171 .352 00.70% Table 3. Mean LSI-R Domain Scores of Three Client Groups (N = 388)
Variable Successful Completion (n = 237)
Failed—Technical Violations (n = 100)
Failed—New Crimes (n = 51)
Education/employment score 3.91 5.40 5.39
Attitude orientation score 1.56 2.33 2.10
Companion score 2.55 3.31 3.16
Criminal history score 4.59 5.66 5.65
Age 34.62 31.35 29.73
Alcohol/drug use score 3.91 4.84 4.49
Note. Higher group means on a domain score represent increased risk factors.
Professional Issues in Criminal Justice Vol 5(2 & 3), 2010 49

Birzer and Cromwell
Table 3 provides the mean scores of each of these variables by group. Depicting the mean of each of the variables assists in seeing conceptually how the groups differ. Group Centroids The group centroid is the mean of the discriminant function scores within a group. The purpose of the centroid is to represent the convergence of several dimensions to a single point (Huberty & Olejnik, 2006). The group centroid is calculated by applying the discriminant weights to the group means on each variable. By comparing the structure coefficient table with the groups, the researcher can discern how the groups differ on centroid scores. The group centroid value for the successful completion group is -.392. The centroid value for the group that failed for technical violations was .640, and the value for the group that failed because of the commission of a new crime was .566. As noted, there is minimal separation between the failed technical violations group and failed new crimes group. There is a greater separation between the two failed client groups and the successful completion group.
Discussion and Conclusions
The purpose of this study was to describe factors contributing to the success or failure of clients’ completion of the Risk Reduction Initiative program. A corollary objective was to determine whether multivariate discriminant analysis was a robust and tenable procedure in discerning factors that contribute to clients’ success or failure in the RRI program. The discriminant analysis identified six discriminator variables that met the criteria for interpretation of the meaning of the discriminant function (education/employment score, attitude orientation score, companion score, criminal history, age, and alcohol/drug use score).
This study demonstrated that the two failed client groups (failed for technical violation and failed for new criminal offenses) do not appear to differ a great deal. For example, the centroid value for the failed due to a technical violation group is .640, and the centroid value for the failed due to new crimes group is .566. In comparison, the centroid value for the successful completion group is -.392. The two failed groups are very close on their centroid values while the successful completion group demonstrates a fairly good separation from the failed client groups. Moreover, as Table 3 depicts, the failed groups’ mean scores on the dependent variable (LSI-R scores) were very similar. However, even though the mean scores on the dependent variables were relatively close in terms of separating the two failed groups, the DA indicated significant differences when analyzing the variables simultaneously.
The discriminant function classified nearly 65% of the cases correctly. While the researchers certainly desired a higher classification result, we point out that accuracy of
50 Professional Issues in Criminal Justice Vol 5(2 & 3), 2010
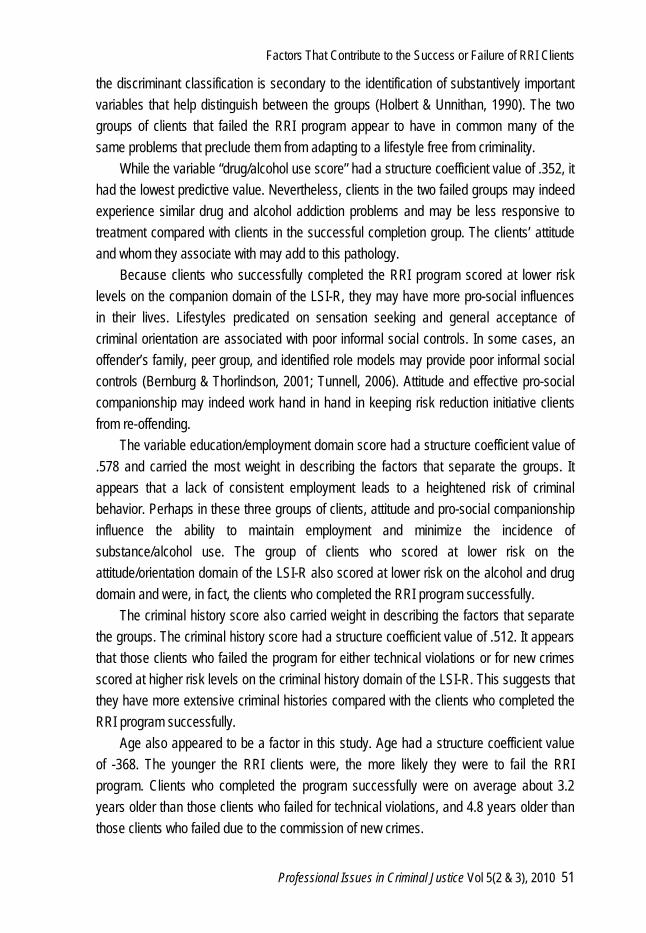
Factors That Contribute to the Success or Failure of RRI Clients
the discriminant classification is secondary to the identification of substantively important variables that help distinguish between the groups (Holbert & Unnithan, 1990). The two groups of clients that failed the RRI program appear to have in common many of the same problems that preclude them from adapting to a lifestyle free from criminality.
While the variable “drug/alcohol use score” had a structure coefficient value of .352, it had the lowest predictive value. Nevertheless, clients in the two failed groups may indeed experience similar drug and alcohol addiction problems and may be less responsive to treatment compared with clients in the successful completion group. The clients’ attitude and whom they associate with may add to this pathology.
Because clients who successfully completed the RRI program scored at lower risk levels on the companion domain of the LSI-R, they may have more pro-social influences in their lives. Lifestyles predicated on sensation seeking and general acceptance of criminal orientation are associated with poor informal social controls. In some cases, an offender’s family, peer group, and identified role models may provide poor informal social controls (Bernburg & Thorlindson, 2001; Tunnell, 2006). Attitude and effective pro-social companionship may indeed work hand in hand in keeping risk reduction initiative clients from re-offending.
The variable education/employment domain score had a structure coefficient value of .578 and carried the most weight in describing the factors that separate the groups. It appears that a lack of consistent employment leads to a heightened risk of criminal behavior. Perhaps in these three groups of clients, attitude and pro-social companionship influence the ability to maintain employment and minimize the incidence of substance/alcohol use. The group of clients who scored at lower risk on the attitude/orientation domain of the LSI-R also scored at lower risk on the alcohol and drug domain and were, in fact, the clients who completed the RRI program successfully.
The criminal history score also carried weight in describing the factors that separate the groups. The criminal history score had a structure coefficient value of .512. It appears that those clients who failed the program for either technical violations or for new crimes scored at higher risk levels on the criminal history domain of the LSI-R. This suggests that they have more extensive criminal histories compared with the clients who completed the RRI program successfully.
Age also appeared to be a factor in this study. Age had a structure coefficient value of -368. The younger the RRI clients were, the more likely they were to fail the RRI program. Clients who completed the program successfully were on average about 3.2 years older than those clients who failed for technical violations, and 4.8 years older than those clients who failed due to the commission of new crimes.
Professional Issues in Criminal Justice Vol 5(2 & 3), 2010 51
Birzer and Cromwell
Discriminant analysis is a multivariate procedure, thus it is important to point out that not any one variable describes the factors that separate the groups; rather a constellation of variables interact with one another. In this analysis, the variables of education/employment score, attitude/orientation score, companion score, criminal history score, age, and alcohol/drug use score were significant in describing the factors that separated the groups.
Discriminant analysis and its simultaneous investigation of a variety of variables was an effective statistical procedure to discriminate between the three client groups. Because a recognizable discriminant function was produced that classified clients in the three groups accurately, it was possible to view the variables that were relevant in separating the three groups. In this sense DA proved useful in understanding the factors that separate the groups. The DA allowed the researchers to examine multiple variables simultaneously to see whether they could describe group placement.
Even though this study was limited to 388 risk reduction initiative clients in one midwestern community and as a case study of sorts cannot be generalized to the larger population, it adds to the body of empirical research that centers on risk factors and criminality. The data appear to show that when probation authorities addressed dynamic risk factors such as education/employment, attitude orientation, pro-social companions, and alcohol/drug addictions in this small group of 388 offenders, the offenders’ chances of failing probation due to a technical violation or for the commission of a new crime was minimized. These data may show preliminarily that efforts to address dynamic risk factors among individual offenders such as drug and alcohol abuse and ensuring that offenders are exposed to pro-social influences, maintain employment, maintain proper attitude, and the like holds much promise. Because the small study was limited to one risk reduction initiative program in a midsized Adult Community Corrections agency, we suggest that state level studies be conducted to determine whether the findings of this study can be replicated in other community settings.
References
Andrews, D. A., & Bonta, J. L. (1995). The Level of Service Inventory–Revised. Toronto, Canada: Multi-Health Systems.
Andrews, D. A., & Bonta, J. (2003). The psychology of criminal conduct (3rd ed.).
Cincinnati, OH: Anderson. Andrews, D. A., Kiessling, J. J., Mickus, S. G. & Robinson, D. (1986). The construct
validity of interview-based risk assessment in corrections. Canadian Journal of Behavioral Sciences, 18, 460–470.
52 Professional Issues in Criminal Justice Vol 5(2 & 3), 2010

Factors That Contribute to the Success or Failure of RRI Clients
Austin, J. (2006). How much risk can we take? The misuse of risk assessment in
corrections. Federal Probation, 70 (2), 58–63. Austin, J., Hardyman, P, & Irwin, J. (2002). Exploring the needs and risks of returning
prisoner populations. Conference Report. Washington, D.C.: The Urban Institute. Retrieved June 24, 2010, from http://www.urban.org/UploadedPDF/410626_ReturningPrisonerPopulation.pdf
Beck, A. J., & Shipley, B. E. (1989). Recidivism of prisoners released in 1983. Bureau of
Justice Statistics Special Report. Washington, DC: U.S. Department of Justice. Retrieved June 23, 2010, from http://bjs.ojp.usdoj.gov/content/pub/pdf/rpr83.pdf
Beech, A. R., Fisher, D. D. & Thornton, D. (2003). Risk assessment of sex offenders.
Professional Psychology: Research and Practice, 34, 339–352. Betz, N. E. (1987). Use of discriminant analysis in counseling psychology research.
Journal of Counseling Psychology, 34(4), 393–403. Birzer, M. L., & Craig-Moreland, D. E. (2008). Using discriminant analysis in policing
research. Professional Issues in Criminal Justice, 3(2), 33–48. Retrieved March 28, 2009, from http://www.picj.org/docs/issue6/PICJ%20Volume3(2)birzer.pdf
Bernburg, J. G., & Thorlindson, T. (2001). Routine activities in social context: A closer
look at the role of opportunity in deviant behavior. Justice Quarterly, 18(3), 543–567. Bonta, J., & Wormith, S. J. (2008). Risk and need assessment. In G. McIvor, & P. Raynor
(Eds.), Developments in social work with offenders, (pp. 131–152). London: Jessica Kingsley.
Cottle, C., Lee, R., & Heilbrun, K. (2001). The prediction of criminal recidivism in juveniles:
A meta-analysis. Criminal Justice and Behavior, 28, 367–394. Feeley, M., & Simon, J. (1992). The new penology: Notes on the emerging strategy of
corrections and its implications. Criminology, 30 (4), 444–474. Folsom, J., & Atkinson, J. L. (2007). The generalizability of the LSI-R and the CAT to the
prediction of recidivism in female offenders. Criminal Justice and Behavior, 34(8), 1044–1056.
Garland, D. (2001). Culture of control. Chicago, IL: University of Chicago Press. Greenberg, D. F. (1979). Mathematical criminology. New Brunswick, NJ: Rutgers
University Press. Holbert, F., & Unnithan, N. P. (1990). Free will, determinism, and criminality: The self-
perception of prison inmates. Journal of Criminal Justice, 18, 43–53. Professional Issues in Criminal Justice Vol 5(2 & 3), 2010 53

Birzer and Cromwell
Holsinger, A. M., Lowenkamp, C. T., & Latessa, E. J. (2006). Exploring the validity of the
level of service inventory-revised with Native American offenders. Journal of Criminal Justice, 34(3), 331–337.
Huberty, C. J., & Olejnik, S. (2006). Applied ANOVA and discriminant analysis (2nd ed.).
Hoboken, NJ: John Wiley and Sons. Kelly, C. E., & Welsh, W. N. (2008). The predictive validity of the level of service
Inventory-Revised for drug-involved offenders. Criminal Justice and Behavior, 35(7), 819–831.
Klecka, W. R. (1980). Discriminant analysis. Beverly Hills, CA: Sage Publishing. Langan, P.A., & Levin, D.J. (2002). Recidivism of prisoners released in 1994. Bureau of
Justice Statistics Special Report. Washington, DC: U.S. Department of Justice. Retrieved September 13, 2010, from http://bjs.ojp.usdoj.gov/content/pub/pdf/rpr94.pdf
Lowenkamp, C. T., & Bechtel, K. (2007). The predictive validity of the LSI-R on a sample
of offenders drawn from the records of the Iowa department of corrections data management system. Federal Probation: A Journal of Correctional Philosophy and Practice, 71(3), 25–29.
Marriott, F. H. (1974). The interpretations of multiple observations. New York: Academic
Press. Myner, J., Santman, J., Cappelletty, G. G., & Perlmutter, B. F. (1998). Variables related to
recidivism among juvenile offenders. International Journal of Offender Therapy and Comparative Criminology, 42(1), 65–80.
Sherry, A. (2006). Discriminant analysis in counseling psychology research. Counseling
Psychologist, 34(5), 661–683. Tunnell, K. D. (2006). Living off crime (2nd ed.). Lanham, MD: Rowman & Littlefield.
54 Professional Issues in Criminal Justice Vol 5(2 & 3), 2010


PICJ c/o Kaplan University 550 West Van Buren, Suite 700 Chicago, Illinois 60607 Editor-in-Chief: Cliff Robersonhttp://www.picj.org