PROF. DR. ALLAH BAKHSH; PI PROF. DR. RAI NIAZ AHMAD; CO-PI...
46
Investigating Aquifer Storage and Recovery Technology to Recharge Saline Groundwater at Farmer’s Field PROF. DR. ALLAH BAKHSH; PI PROF. DR. RAI NIAZ AHMAD; CO-PI HAFIZ UMAR FARID; RA DEPARTMENT OF IRRIGARION AND DRAINAGE UNIVERSITY OF AGRICULTURE, FAISALABAD 1
Transcript of PROF. DR. ALLAH BAKHSH; PI PROF. DR. RAI NIAZ AHMAD; CO-PI...

Investigating Aquifer Storage and Recovery
Technology to Recharge Saline Groundwater at
Farmer’s Field
PROF. DR. ALLAH BAKHSH; PI
PROF. DR. RAI NIAZ AHMAD; CO-PI
HAFIZ UMAR FARID; RA
DEPARTMENT OF IRRIGARION AND DRAINAGE
UNIVERSITY OF AGRICULTURE, FAISALABAD 1
Organization • Water availability and issues
• ASR Technology: Objectives
• Resistivity Survey
• Water Quality Criteria
• ASR Technology
• Achievements; ASR Design
• Injection and Recovery Time
• Recovery Efficiency
• Conclusions
• Recommendations

Source: Rasul, G. (2008)

Groundwater Issues
•Growing number of tubewells as groundwater
contribution is increasing to about 40-50 MAF to
meet crop water requirements (ASP, 2008)
•Falling groundwater levels
•Deteriorating Groundwater quality
•Causing secondary salinization
•Increasing energy cost
•Groundwater recharge is inevitable for its
sustainable exploitation through modern
technologies such as ASR

What is ASR?
•The technique of storing surplus good quality water
into the aquifer and pumping the same water during
periods of high crop water requirements is called
Aquifer Storage and Recovery (ASR).
•ASR techniques are cost effective alternatives
aimed at storing surplus water during flood periods
and recovering it during times of water shortages.
•These techniques provide an option to the farmer
like water bank deposit especially where
groundwater is brackish.

Conceptual Scenario of ARS Technology
Source: (Dillon et al., 2008)

ASR Benefits
• Subsurface water bank
• Buffers between supply and demand
• Allows storage for irrigation
• No mosquito's
• No evaporation/seepage losses
• On farm subsurface water storage option
• Land saving from surface storage
• Geophysical exploration such as resistivity survey can help design and install ASR components.
Objectives
• To investigate possible changes in quality of the
recovered water when injected during aquifer
storage and recovery technology.
• To determine the recovery efficiency during
different aquifer storage and recovery
treatments.
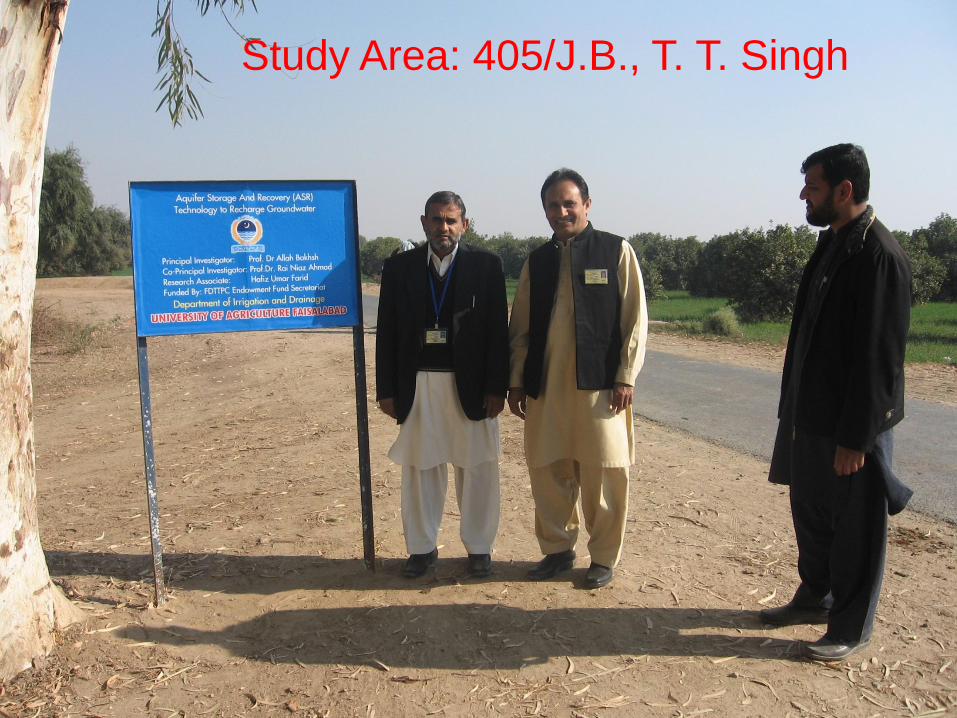
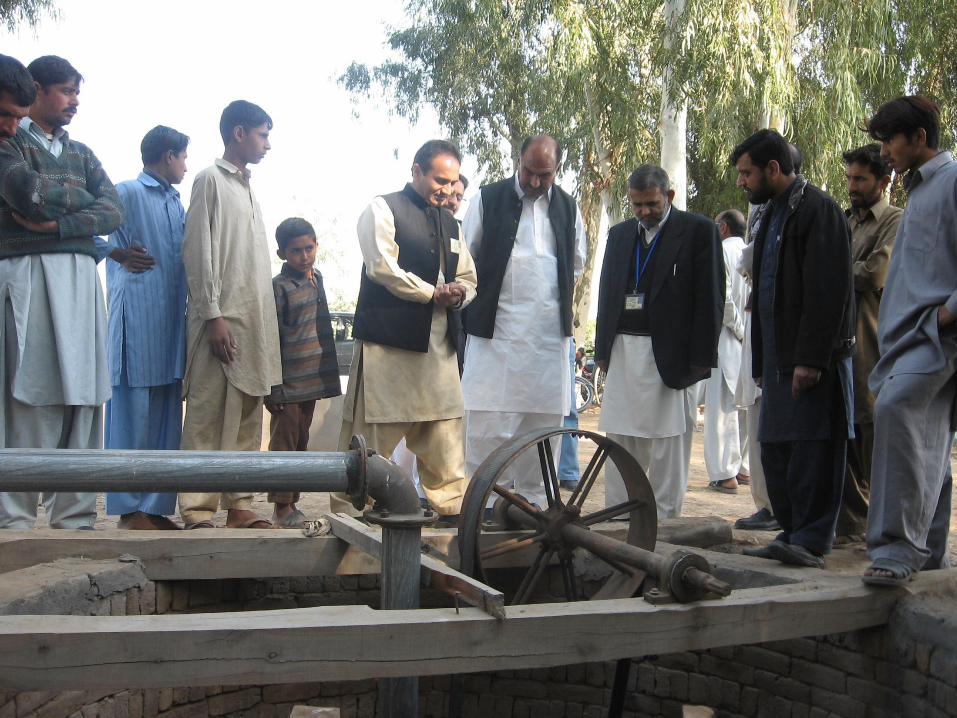
Study Area: 405/J.B., T. T. Singh
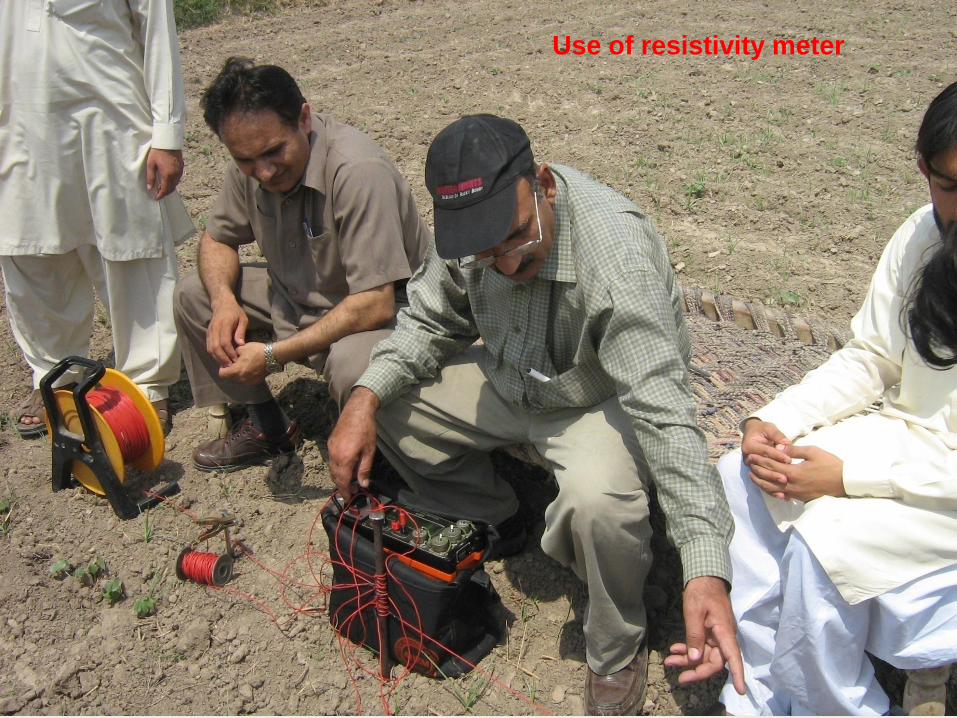
Use of resistivity meter

Resistivity Survey • The resistivity survey meter (ABEM SAS 4000
Terramater) was used to study the aquifer characteristics, water table depth, soil layers below the ground surface and aquifer potential.
• The Schlumberger electrode configuration with current electrode distance (AB/2) was followed with electrode separation of 2, 4, 6, 8, 10, 10, 15, 20, 25, 25, 30, 35, 40, 45, 50, 50, 60, 70, 80, 90, 100, 100, 120, 140, 160 and 180 meter.
• The potential electrode separation (MN/2) was kept at 0.5, 2, 5, 10 and 20 meter.
• Using 1X1D computer software, field data were analyzed by plotting the resistivity against electrode spacing.
11
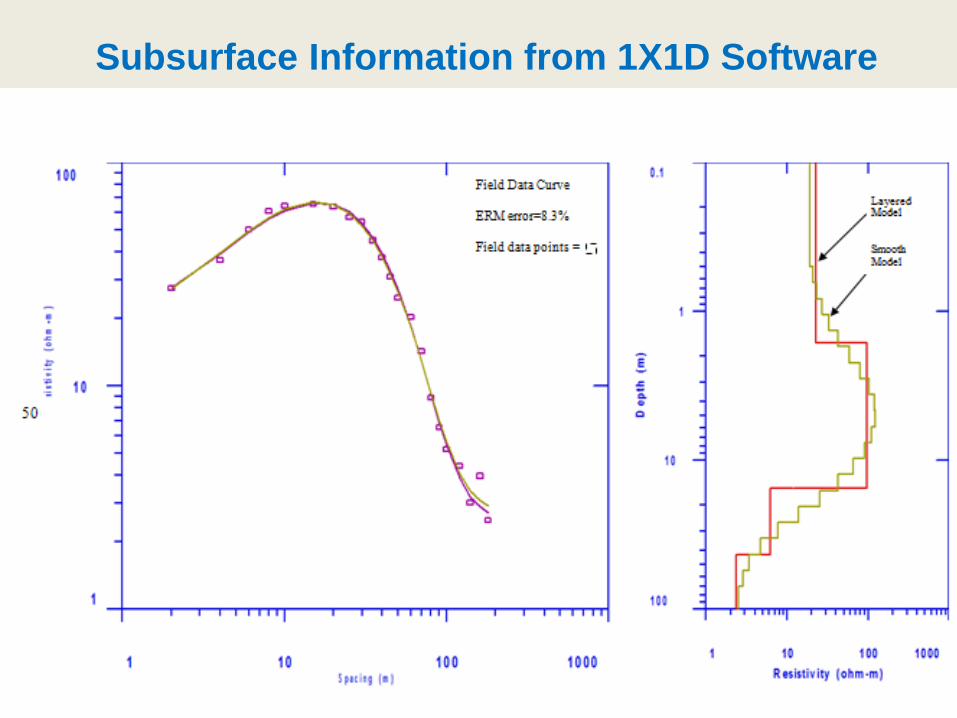
Subsurface Information from 1X1D Software
12


14
Correlation of VES results with subsurface lithology
PW : Production well
W129 : Observation well in west direction in cluster 1with 29 m depth
VES 1 : Vertical Electrical Sounding at position 1
VES 2 : Vertical Electrical Sounding at position

Irrigation water quality criteria
Water
parameter Symbol Unit
Usual
range in
irrigation
water
Severe
Electrical
Conductivity ECw dS/m 0-3
> 3.0
Sodium
Adsorption
Ratio
SAR 0-5
>15
Residual
Sodium
carbonate
RSE meq/l 0-5
> 5
Source: FAO, 1994
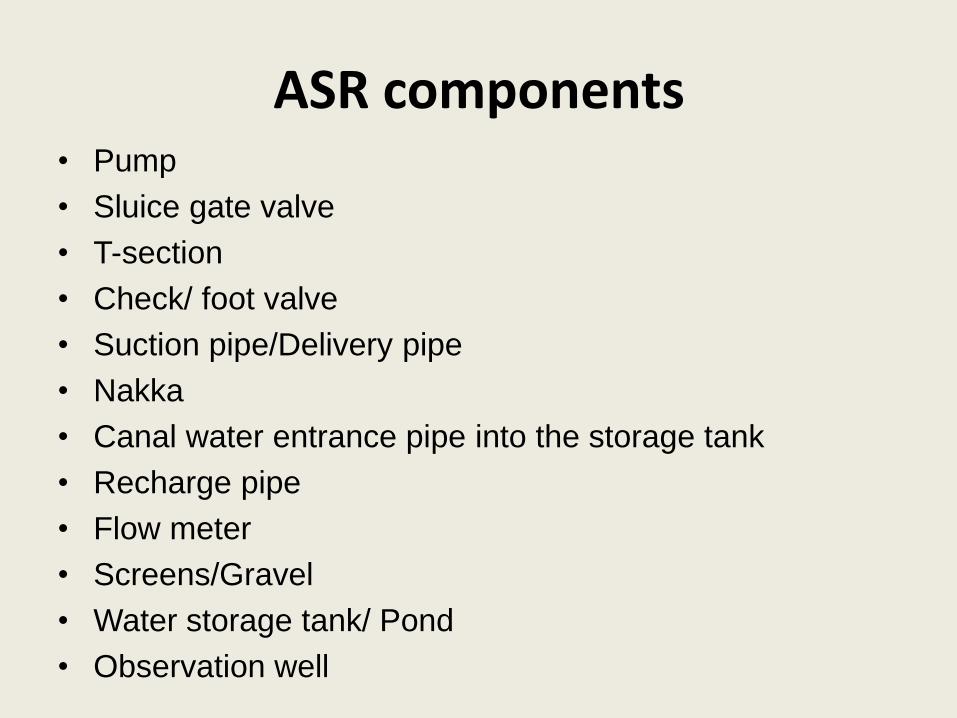
ASR components • Pump
• Sluice gate valve
• T-section
• Check/ foot valve
• Suction pipe/Delivery pipe
• Nakka
• Canal water entrance pipe into the storage tank
• Recharge pipe
• Flow meter
• Screens/Gravel
• Water storage tank/ Pond
• Observation well

17
15x15x
13 ft

18 Layout of the production well and the observation wells at the study area

19 Depth of the production and observation well

Recharge Connection
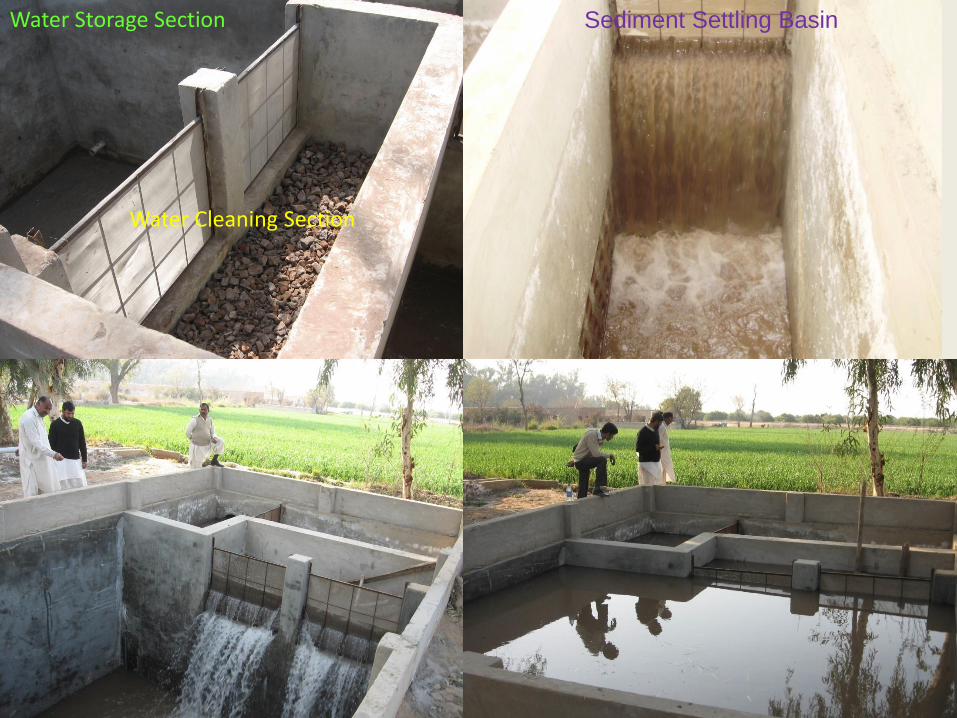
Water Storage Section
Water Cleaning Section
Sediment Settling Basin
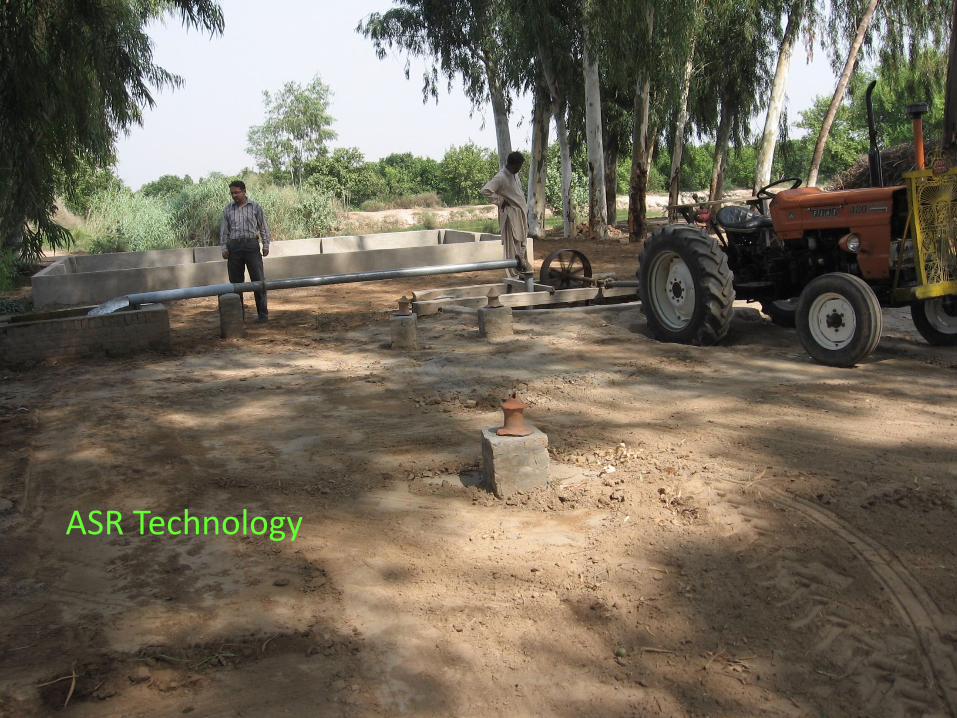
ASR Technology

Amount of Sediment Removed
Volume of water
(m3)
Total
Sediment
Present in
Canal
water
(Kg)
Sediment Settling
Basin
(Kg)
Water Cleaning Section
(Kg)
Water Storage Section
(Kg)
Sediment Passed
(Kg)
100
13
7(54%)
3(23%)
2(15%)
1(8%)

Recovery time, pumping time and injection time
• Recovery time and pumping time both are basically the
pumping time but the point which separates these two
terms is the quality of water at two different targets.
• Recovery time “the time required recovering the same
volume of water as was injected during injection phase”
• pumping time “the time expands to pump the recovered
water up to target EC value of 3 dS/m”
• Injection time “the time required to inject the measured
amount of canal water into the well”
These all times were measured during all the treatments.

Recovery Efficiency
• Stored water displaces the native water of the aquifer creating a large bubble in the vicinity of the well.
• Monitoring of the groundwater quality was continued to assess the development of freshwater zone during recharge period and its depletion zone during pumping periods to assess the Recovery Efficiency.
25
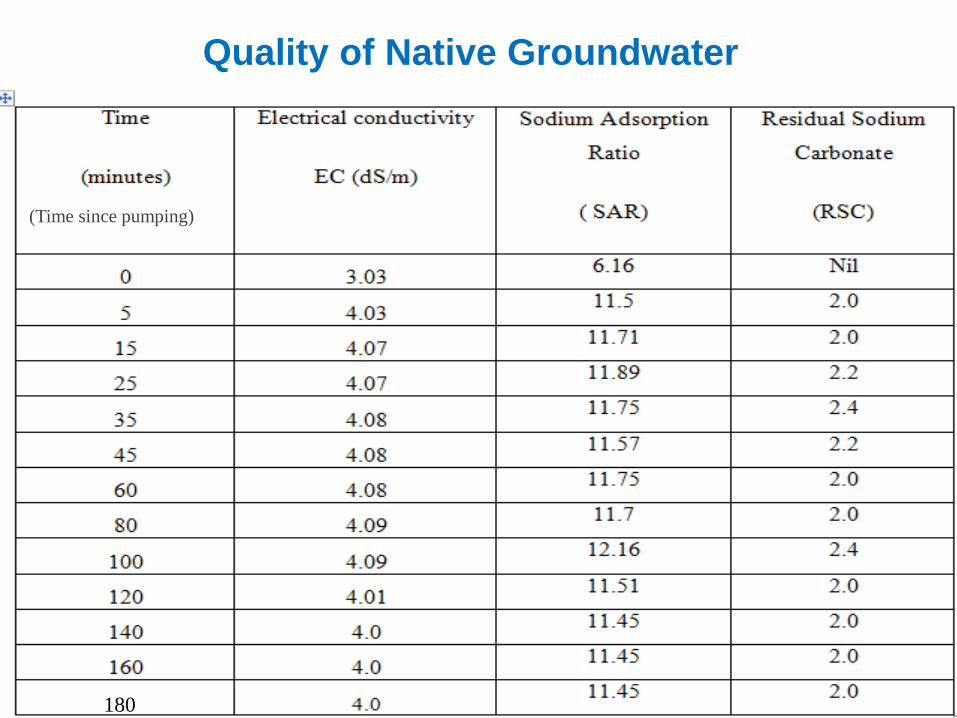
Quality of Native Groundwater
(Time since pumping)
180

Recovered Water Quality 51 m3 71 m3 99 m3

0
0.5
1
1.5
2
2.5
3
3.5
4
4.5
0 20 40 60 80 100 120 140 160 180 200
EC
(d
S/m
)
Time (minutes)
Native grouond water
T1 (51 m3)
T2 (71 m3)
T3 (99 m3)
Usable limit (FAO)
0.67
2.3
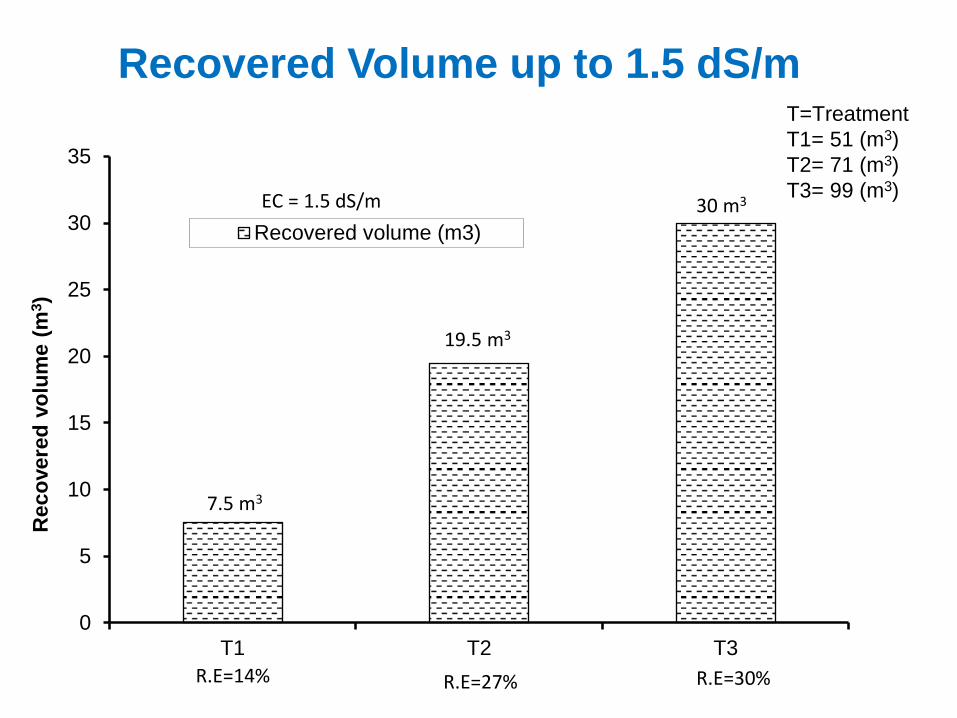
Water Quality Behavior with Pumping
0
5
10
15
20
25
30
35
T1 T2 T3
Reco
vere
d v
olu
me (
m3)
Recovered volume (m3)
EC = 1.5 dS/m
7.5 m3
19.5 m3
30 m3
R.E=14% R.E=27% R.E=30%
T=Treatment
T1= 51 (m3)
T2= 71 (m3)
T3= 99 (m3)
Recovered Volume up to 1.5 dS/m

0
10
20
30
40
50
60
70
T1 T2 T3
Reco
vere
d v
olu
me (
m3)
Recovered volume (m3)
EC = 2.5 dS/m
31.5 m3
45 m3
66 m3
R.E=61% R.E=63% R.E=66%
WAPDA ECiw≤ 2.5 dS/m
Recovered Volume up to 2.5 dS/m

0
20
40
60
80
100
120
T1 T2 T3
Reco
vere
d v
olu
me (
m3)
Recovered volume…
EC = 3.0 dS/m
42 m3
64.5 m3
97.5 m3
R.E=82% R.E=91% R.E=98%
Recovered Volume up to 3.0 dS/m
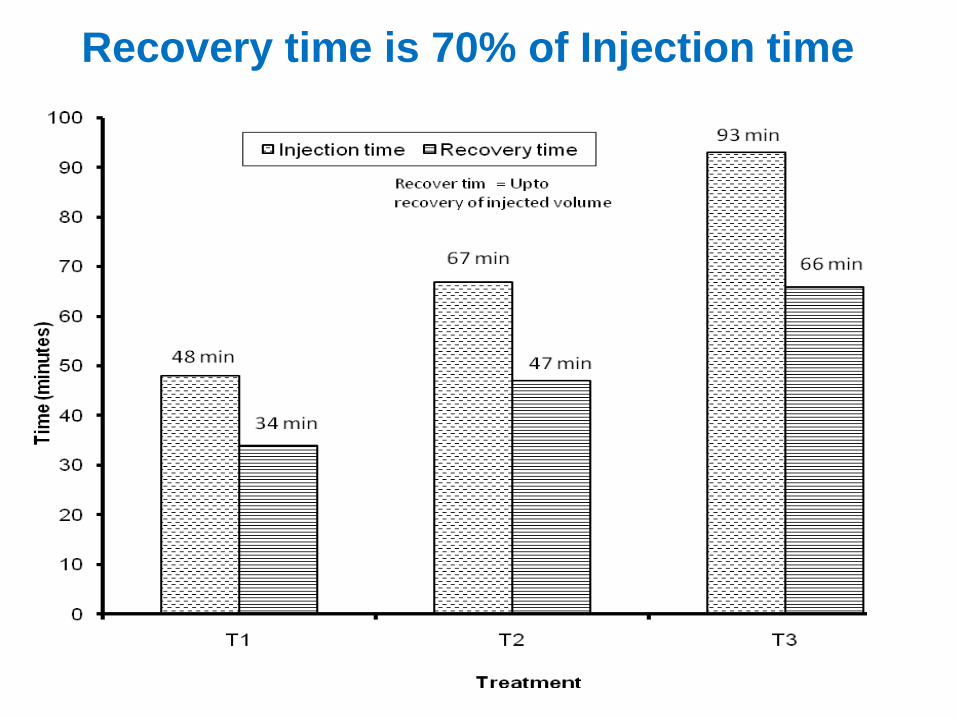
Recovery time is 70% of Injection time
0
10
20
30
40
50
60
70
80
90
100
T1 T2 T3
Tim
e (
min
ute
s)
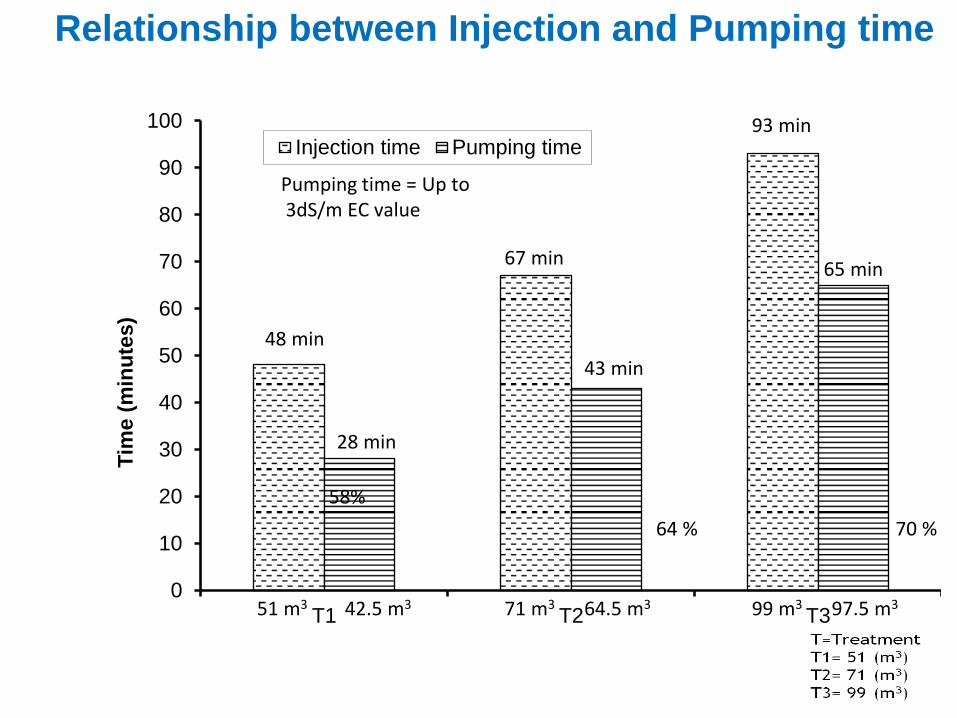
Injection time Pumping time
Pumping time = Up to 3dS/m EC value
28 min
43 min
65 min
48 min
67 min
93 min
51 m3 42.5 m3 71 m3 64.5 m3 99 m3 97.5 m3
64 % 70 %
Relationship between Injection and Pumping time
58%

0
10
20
30
40
50
60
70
T1 T2 T3
Tim
e (
min
ute
s)
Recovery time Pumping time
Recovery time = Upto recovery of injected volume
Pumping time = Upto 3 dS/m EC value
28 min
43 min
65 min
34 min
47 min
66 min
91 % 99 %
Relationship between Recovery and Pumping time
82 %

Recovery up to 3 dS / m; FAO Criteria

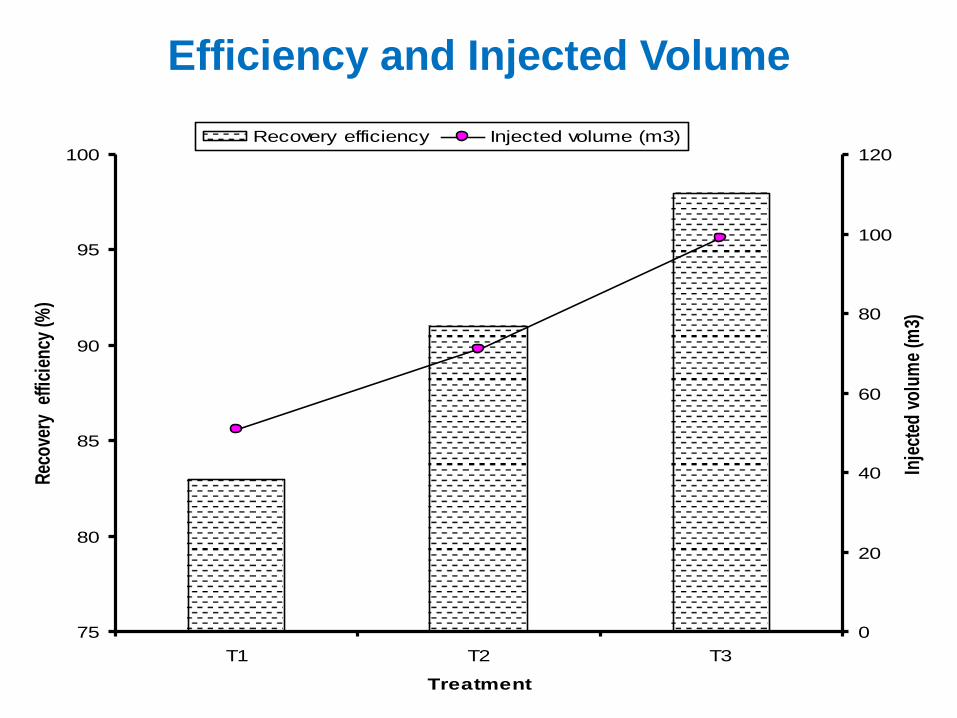
Recovery Time and Injected Volume
75
80
85
90
95
100
T1 T2 T3
Treatment
Rec
ove
ry
effi
cien
cy (
%)
0
20
40
60
80
100
120
Inje
cted
vo
lum
e (m
3)
Recovery efficiency Injected volume (m3)
Efficiency and Injected Volume


ASR Findings / Conclusions
• ASR recovery efficiency was found to be 80% for injected volume of 51 m3; 91% for injected volume of 71 m3 and 98% for injected volume of 99 m3 , up to 3 dS/m.
• The recovered time was found to be 70% of injected time for injected volumes of 51, 71 and 99 m3, respectively.
• The recovered volumes till EC value of 3 dS/m were 42.37 m3 for 51 m3; 64.5 m3 for 71 m3 and 97.5 m3 for 99 m3.
• The results suggested that Aquifer Storage and Recovery (ASR) technology has the potential to store water during period of surplus water to use it during peak hour demand.
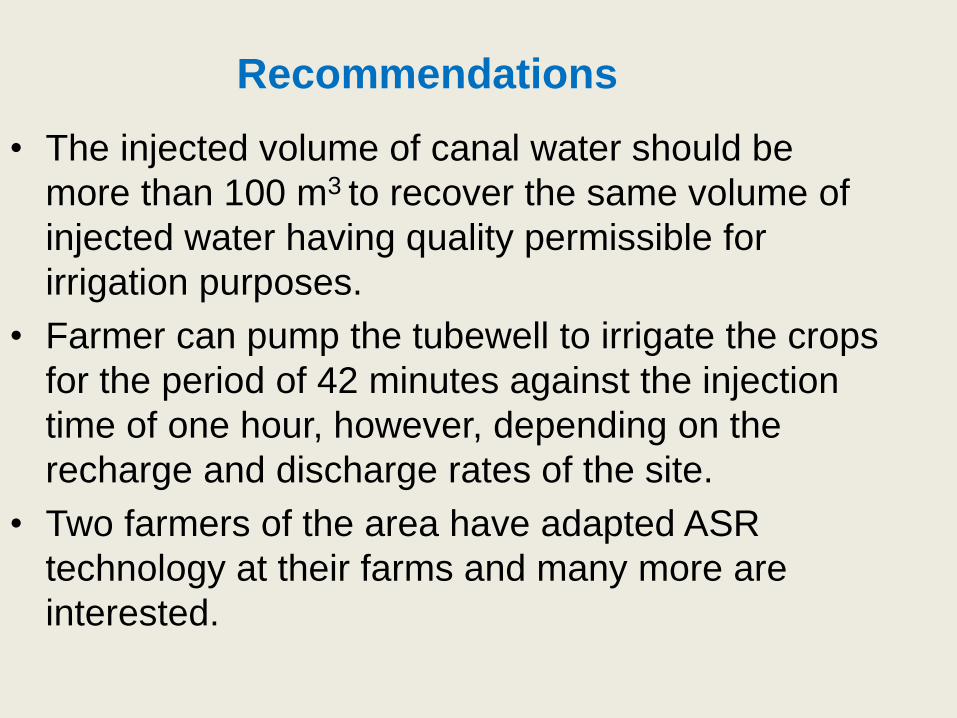
Recommendations
• The injected volume of canal water should be
more than 100 m3 to recover the same volume of
injected water having quality permissible for
irrigation purposes.
• Farmer can pump the tubewell to irrigate the crops
for the period of 42 minutes against the injection
time of one hour, however, depending on the
recharge and discharge rates of the site.
• Two farmers of the area have adapted ASR
technology at their farms and many more are
interested.
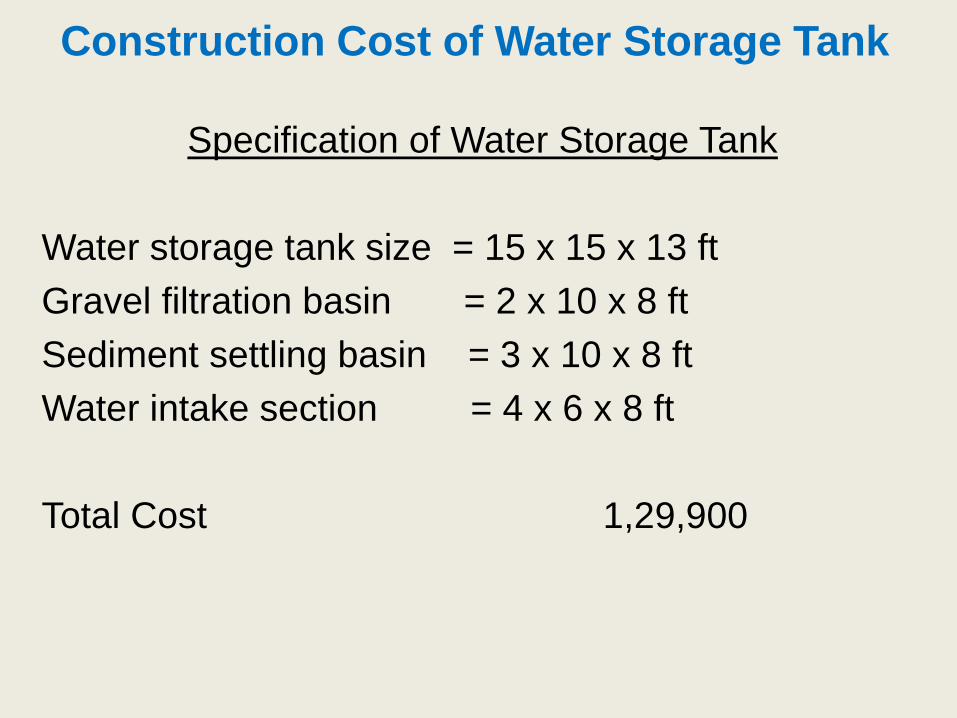
Construction Cost of Water Storage Tank
Specification of Water Storage Tank
Water storage tank size = 15 x 15 x 13 ft
Gravel filtration basin = 2 x 10 x 8 ft
Sediment settling basin = 3 x 10 x 8 ft
Water intake section = 4 x 6 x 8 ft
Total Cost 1,29,900

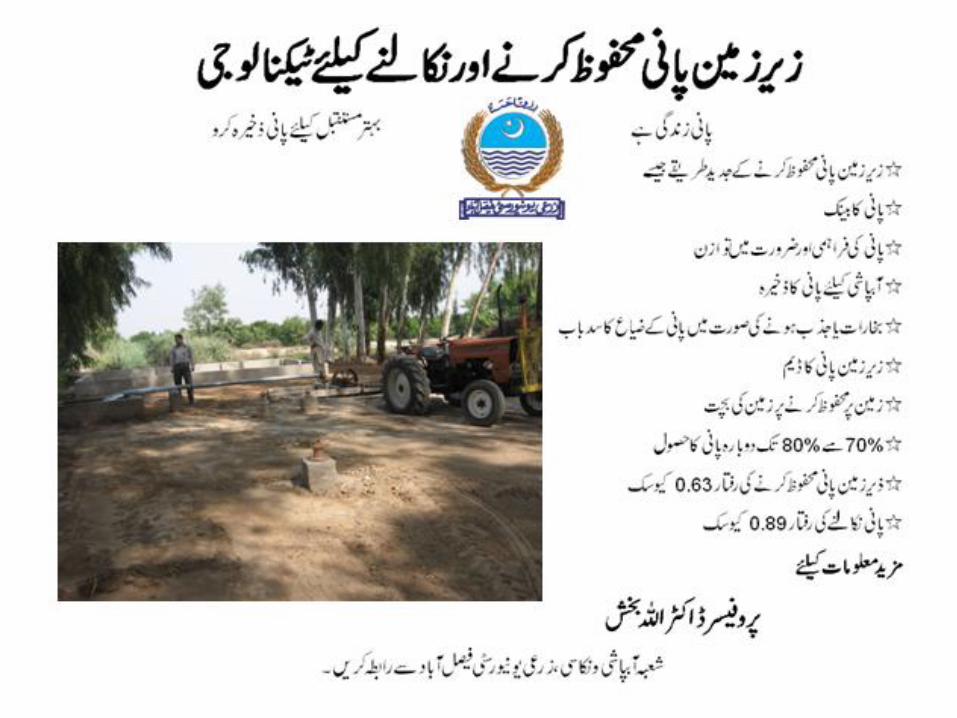
Aquifer Storage and Recovery Technology
• A new technology to store water under ground for later use like
• Water bank • Buffers between supply and demand • Allows storage for irrigation • No mosquito‘s • No evaporation/seepage losses • Underground water dam • Land saving under surface storage • Recovery efficiency 70 to 80% • Recharge rate 0.63 cusec • Pumping rate 0.89 cusec
For Information, Please Contact Prof. Dr. Allah Bakhsh
Department of Irrigation and Drainage, University of Agriculture, Faisalabad
Recharge pipe
Delivery pipe

Thanks
Suggestions / Comments