Products - Willis Towers Watson · Towers Watson Data ServicesTowers Watson Data Services ......
67
Products Catalog of Compensation, Benefits, and Policies and Practices Survey Reports - U.S. Towers Watson Data Services
Transcript of Products - Willis Towers Watson · Towers Watson Data ServicesTowers Watson Data Services ......
Products Catalog of Compensation, Benefits, and Policies and Practices Survey Reports - U.S.
Towers Watson Data ServicesTowers Watson Data Services
Products Catalog of Compensation, Benefits, and Policies and Practices Survey Reports - U.S.
Towers Watson Data ServicesTowers Watson Data Services
Request information
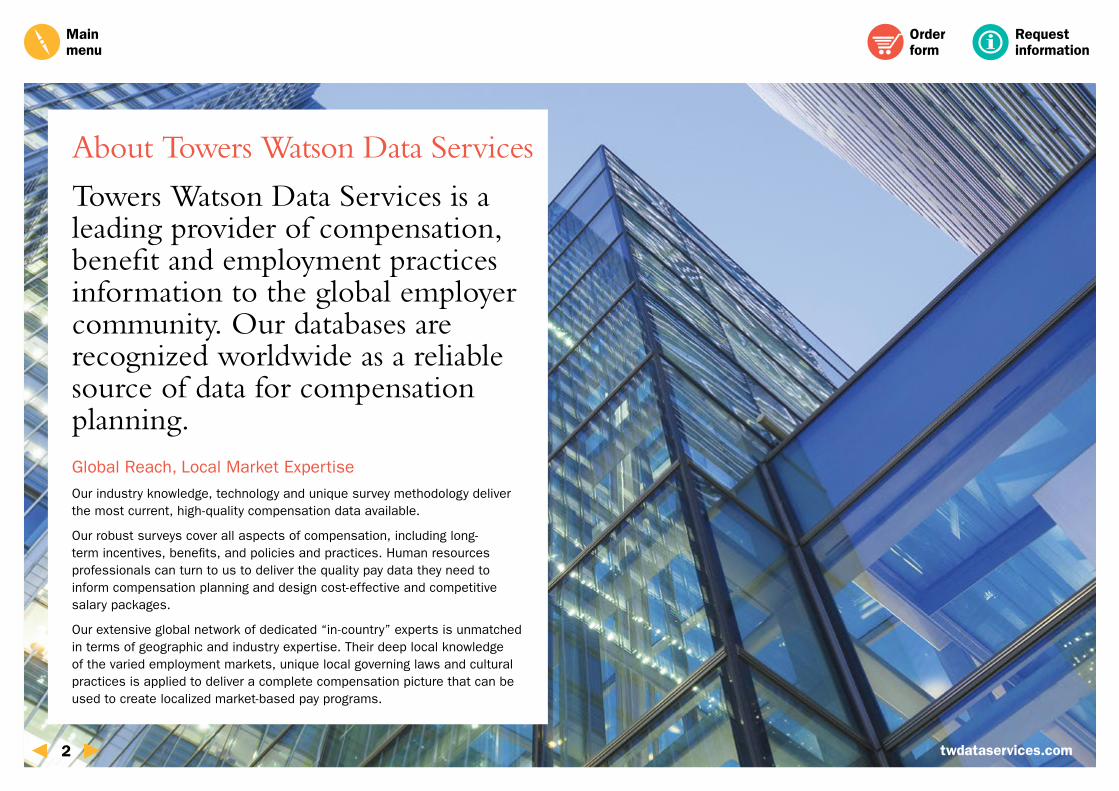
Global Reach, Local Market Expertise
Our industry knowledge, technology and unique survey methodology deliver the most current, high-quality compensation data available.
Our robust surveys cover all aspects of compensation, including long-term incentives, benefits, and policies and practices. Human resources professionals can turn to us to deliver the quality pay data they need to inform compensation planning and design cost-effective and competitive salary packages.
Our extensive global network of dedicated “in-country” experts is unmatched in terms of geographic and industry expertise. Their deep local knowledge of the varied employment markets, unique local governing laws and cultural practices is applied to deliver a complete compensation picture that can be used to create localized market-based pay programs.
Towers Watson Data Services is a leading provider of compensation, benefit and employment practices information to the global employer community. Our databases are recognized worldwide as a reliable source of data for compensation planning.
About Towers Watson Data Services
Order form
Main menu
2 twdataservices.com
Order form
Request information
Main Menu
General Industry Survey Reports - U.S.
(continued on next page)
3 twdataservices.com
Main menu
Request information
Industry-Specific Survey Reports - U.S. Global Survey Reports
Order form
4 twdataservices.com
Request information
Order form
Main menu
Global reach, local expertise
We are a premier provider of compensation, benefit and employment practices information to the global employer community. We conduct surveys in more than 115 countries around the world, the results of which translate into robust, fact-filled databases that offer clients sound, defensible pay and benefit data for creating competitive reward programs.
Centralized survey administration
Your dedicated Towers Watson Data Services account manager will meet with you to select and finalize your unique list of global surveys based on your organization’s specific needs. After you make your selection, your account manager will provide you with a comprehensive pricing proposal available in one-, two- or three-year agreements. The global data discount will be determined by the agreement length, total annual price and number of country surveys cited in the agreement. All survey results will be delivered via our online data delivery vehicle.
Support staff
Clients can access regional and local support from any of our international offices for assistance in completing questionnaires or addressing location-specific data questions. We also have technical support staff who can answer questions related to your online global data delivery vehicle.
Contact us today
Take advantage of these substantial discounts available to you as a global purchaser and discover how easy it is to work with us through our Global Data Account Management team. Call us at +1 800 645 5771 and ask to speak to our Global Data Account Management team.
Towers Watson Data Services’ Global Data Account Management — Experience and Expertise in Multinational Compensation NeedsOur seasoned team of Global Data Account managers will address the unique compensation and benefit needs of multinational organizations and provide the tools necessary to centralize current and future survey participation and purchasing activities.
5 twdataservices.com
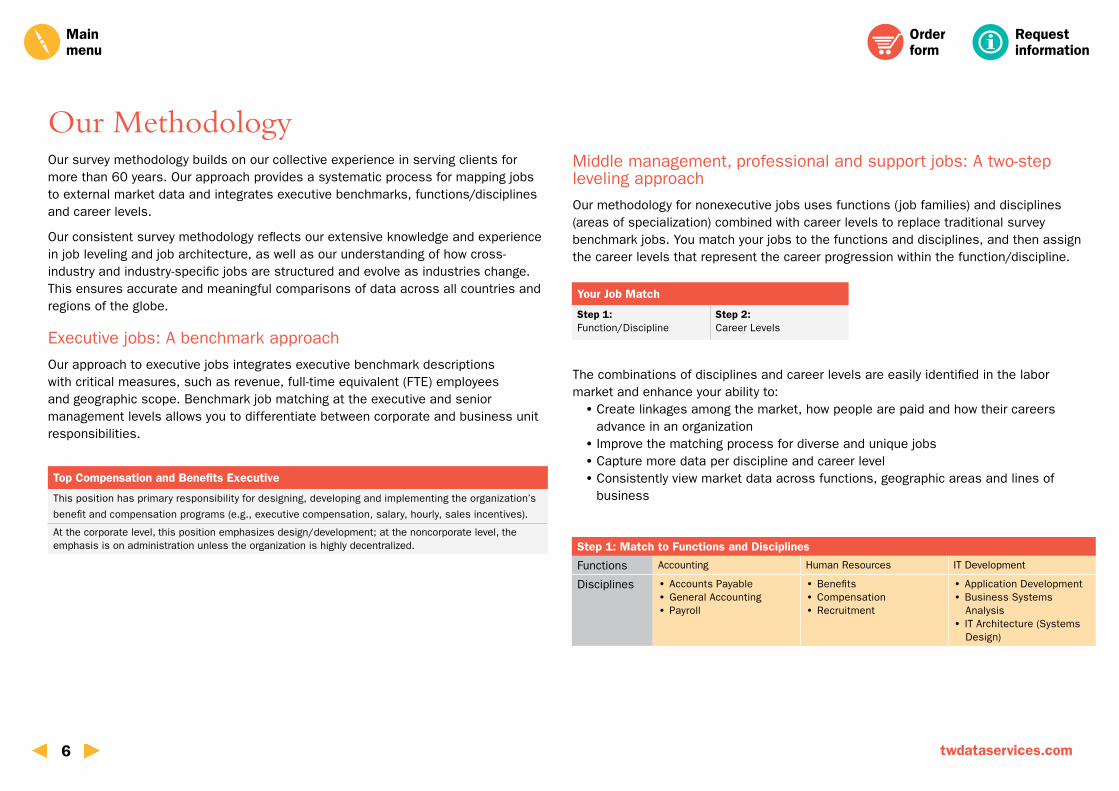
Middle management, professional and support jobs: A two-step leveling approach
Our methodology for nonexecutive jobs uses functions (job families) and disciplines (areas of specialization) combined with career levels to replace traditional survey benchmark jobs. You match your jobs to the functions and disciplines, and then assign the career levels that represent the career progression within the function/discipline.
The combinations of disciplines and career levels are easily identified in the labor market and enhance your ability to:
• Create linkages among the market, how people are paid and how their careers advance in an organization • Improve the matching process for diverse and unique jobs • Capture more data per discipline and career level • Consistently view market data across functions, geographic areas and lines of business
Request information
Our Methodology Our survey methodology builds on our collective experience in serving clients for more than 60 years. Our approach provides a systematic process for mapping jobs to external market data and integrates executive benchmarks, functions/disciplines and career levels.
Our consistent survey methodology reflects our extensive knowledge and experience in job leveling and job architecture, as well as our understanding of how cross-industry and industry-specific jobs are structured and evolve as industries change. This ensures accurate and meaningful comparisons of data across all countries and regions of the globe.
Executive jobs: A benchmark approach
Our approach to executive jobs integrates executive benchmark descriptions with critical measures, such as revenue, full-time equivalent (FTE) employees and geographic scope. Benchmark job matching at the executive and senior management levels allows you to differentiate between corporate and business unit responsibilities.
Order form
Main menu
Top Compensation and Benefits Executive
This position has primary responsibility for designing, developing and implementing the organization’s
benefit and compensation programs (e.g., executive compensation, salary, hourly, sales incentives).
At the corporate level, this position emphasizes design/development; at the noncorporate level, the emphasis is on administration unless the organization is highly decentralized.
Your Job Match
Step 1:Function/Discipline
Step 2:Career Levels
Step 1: Match to Functions and Disciplines
Functions Accounting Human Resources IT Development
Disciplines • Accounts Payable • General Accounting • Payroll
• Benefits • Compensation • Recruitment
• Application Development • Business Systems Analysis
• IT Architecture (Systems Design)
6 twdataservices.com
Request information
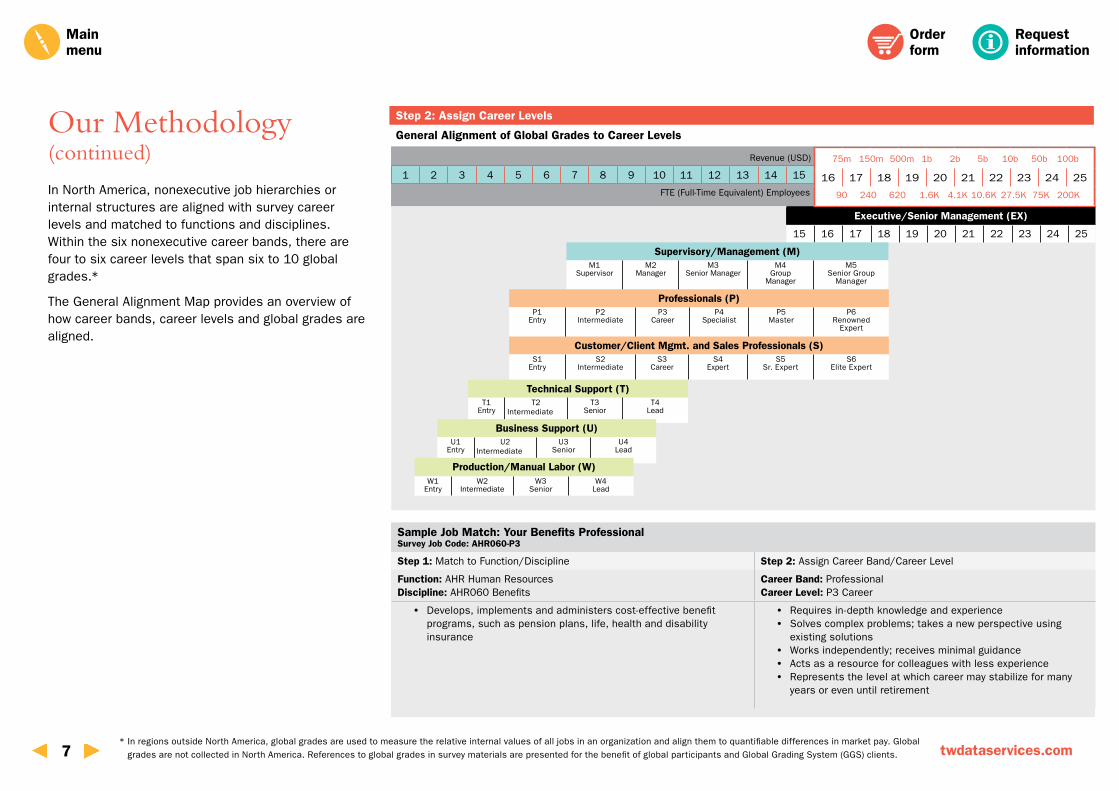
In North America, nonexecutive job hierarchies or internal structures are aligned with survey career levels and matched to functions and disciplines. Within the six nonexecutive career bands, there are four to six career levels that span six to 10 global grades.*
The General Alignment Map provides an overview of how career bands, career levels and global grades are aligned.
* In regions outside North America, global grades are used to measure the relative internal values of all jobs in an organization and align them to quantifiable differences in market pay. Global grades are not collected in North America. References to global grades in survey materials are presented for the benefit of global participants and Global Grading System (GGS) clients.
Our Methodology (continued)
Sample Job Match: Your Benefits ProfessionalSurvey Job Code: AHR060-P3
Step 1: Match to Function/Discipline Step 2: Assign Career Band/Career Level
Function: AHR Human ResourcesDiscipline: AHR060 Benefits
Career Band: ProfessionalCareer Level: P3 Career
• Develops, implements and administers cost-effective benefit programs, such as pension plans, life, health and disability insurance
• Requires in-depth knowledge and experience • Solves complex problems; takes a new perspective using
existing solutions • Works independently; receives minimal guidance • Acts as a resource for colleagues with less experience • Represents the level at which career may stabilize for many
years or even until retirement
1 2 3 4 5 6 7 8 9 10 11 12 13 14 15 16 17 18 19 20 21 22 23 24
General Alignment of Global Grades to Career Levels
Step 2: Assign Career Levels
Executive/Senior Management (EX)
15 16 17 18 19 20 21 22 23 24 25
Supervisory/Management (M)M1
SupervisorM2
ManagerM3
Senior ManagerM4
Group Manager
M5Senior Group
Manager
Professionals (P)P1
EntryP2
IntermediateP3
CareerP4
SpecialistP5
MasterP6
Renowned Expert
Customer/Client Mgmt. and Sales Professionals (S)S1
EntryS2
IntermediateS3
CareerS4
ExpertS5
Sr. ExpertS6
Elite Expert
Technical Support (T)T1
EntryT2
IntermediateT3
SeniorT4
Lead
Business Support (U)U1
EntryU2
IntermediateU3
SeniorU4
Lead
Production/Manual Labor (W)W1
EntryW2
IntermediateW3
SeniorW4
Lead
16 17 18 19 20 21 22 23 24 25
Revenue (USD)
FTE (Full-Time Equivalent) Employees 90 240 620 1.6K 4.1K 10.6K 27.5K 75K 200K
75m 150m 500m 1b 2b 5b 10b 50b 100b
Main menu
Order form
7 twdataservices.com
Request information
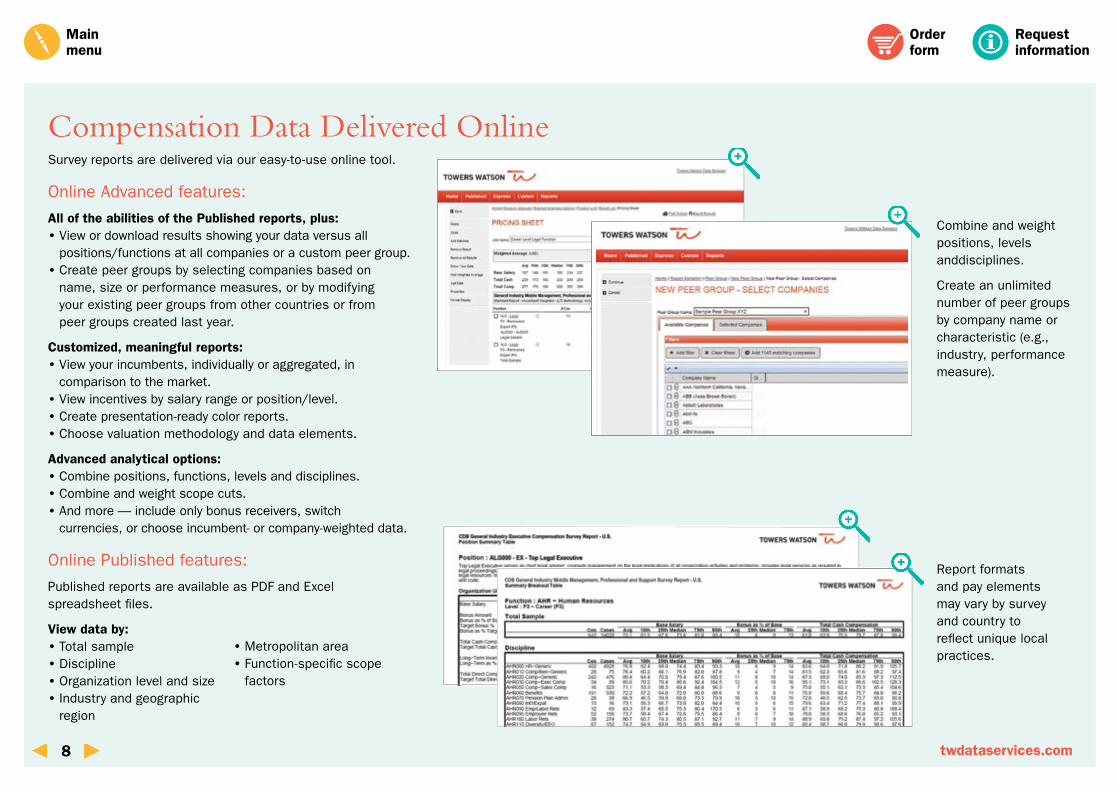
Compensation Data Delivered OnlineSurvey reports are delivered via our easy-to-use online tool.
Online Advanced features:
All of the abilities of the Published reports, plus: • View or download results showing your data versus all positions/functions at all companies or a custom peer group. • Create peer groups by selecting companies based on name, size or performance measures, or by modifying your existing peer groups from other countries or from peer groups created last year.
Customized, meaningful reports: • View your incumbents, individually or aggregated, in comparison to the market. • View incentives by salary range or position/level. • Create presentation-ready color reports. • Choose valuation methodology and data elements.
Advanced analytical options: • Combine positions, functions, levels and disciplines. • Combine and weight scope cuts. • And more — include only bonus receivers, switch currencies, or choose incumbent- or company-weighted data.
Online Published features:
Published reports are available as PDF and Excel spreadsheet files.
View data by: • Total sample • Discipline • Organization level and size • Industry and geographic region
Combine and weight positions, levels anddisciplines.
Create an unlimited number of peer groups by company name or characteristic (e.g., industry, performance measure).
Report formats and pay elements may vary by survey and country to reflect unique local practices.
• Metropolitan area • Function-specific scope factors
Main menu
Order form
8 twdataservices.com
Request information
Custom Surveys We provide custom survey services to address your organization’s specific compensation objectives. Choose us for your next custom survey project. Our team will expertly manage all the steps involved to ensure your satisfaction. Custom survey services include the following:
Survey design
We start by working to understand your business and compensation philosophies by meeting with you and members of your organization. The resulting interactive process will allow both you and your survey team to properly identify and address the objectives of your survey.
We’ll discuss the positions and the types of organizations you want in your survey sample, along with the data elements you’ll need to address your objectives. We have extensive experience in surveying a wide range of compensation components, such as salaries, salary ranges, annual bonuses, commissions and other sales incentives, a variety of other short-term incentives, long-term incentives, benefits, perquisites, starting salaries, hiring bonuses, and any number of policies and practices.
Once we have a thorough understanding of your project, we’ll develop an in-depth price quote.
Maximizing participation
Several contributing factors influence survey participation, and Towers Watson Data Services knows how to leverage those factors to generate the maximum response to your survey.
We will design, produce and distribute survey submission materials that minimize completion time and effort.
We’ll assist you in determining the appropriate incentives to ensure target companies respond to your survey, and we’ll leverage our relationships with organizations and HR professionals to help generate interest and participation. We’ll distribute reminders and conduct telephone calls for the data solicitation efforts to further generate ample participation.
Quality results
A team of experienced compensation data analysts, aided by diagnostic software, will conduct meticulous quality control procedures to ensure the validity of the data.
We will thoroughly examine every piece of data on every response and conduct telephone interviews to clarify job comparability issues and any discrepancies in the data. Only after each data point is fully verified does it become part of the database. And our quality control doesn’t stop there. We examine the database numbers in aggregate using sophisticated statistical modeling techniques and programs to identify outliers and other potential problems. If the survey is conducted annually, we’ll also examine the data from the prior year on a job-by-job basis and ensure that any unusual increases or decreases are explainable and reasonable.
Results preparation
We offer a complete menu of survey output possibilities, ranging from simple tabular output to sophisticated regression analysis or maturity curves. We can use a variety of approaches to value benefits and stock-based incentives.
Your survey results can be delivered via our online data delivery tool. If requested, your Custom Survey team will be available to prepare and make a formal presentation in person, or via teleconference or webcast.
For more information, call us at +1 800 645 5771 and ask to speak with a custom survey consultant.
Main menu
Order form
9 twdataservices.com
Request information
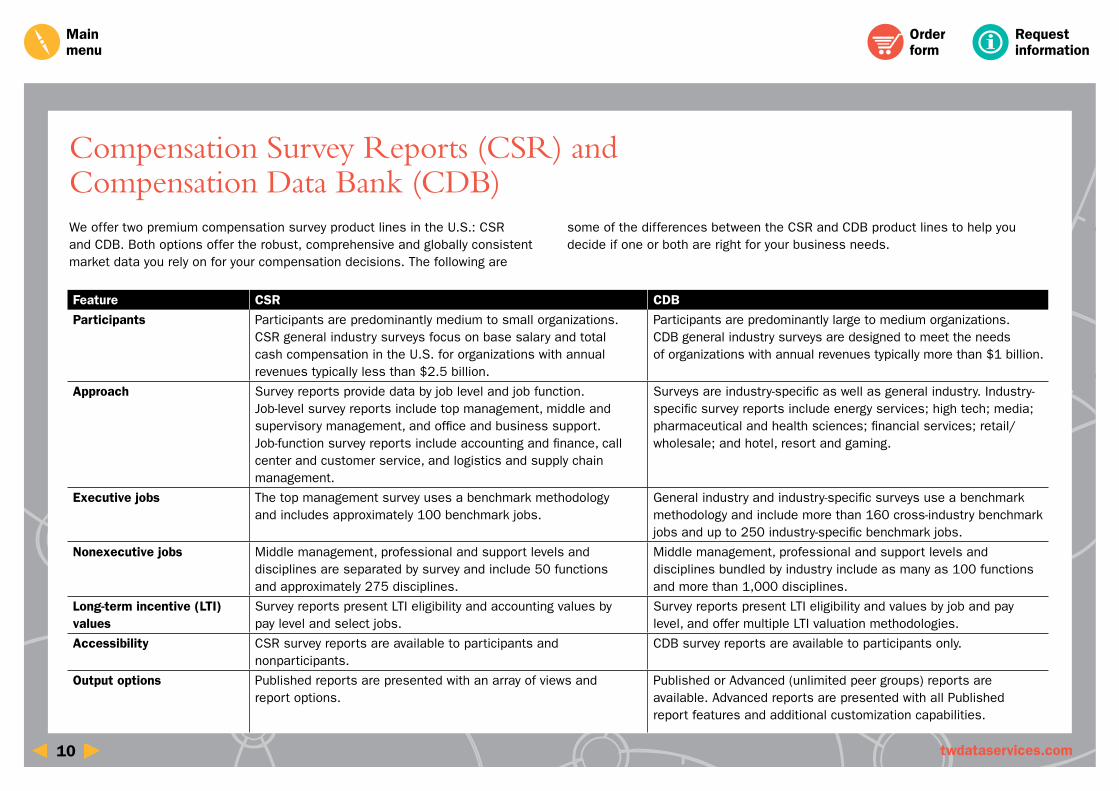
We offer two premium compensation survey product lines in the U.S.: CSR and CDB. Both options offer the robust, comprehensive and globally consistent market data you rely on for your compensation decisions. The following are
some of the differences between the CSR and CDB product lines to help you decide if one or both are right for your business needs.
Compensation Survey Reports (CSR) and Compensation Data Bank (CDB)
Feature CSR CDB
Participants Participants are predominantly medium to small organizations. CSR general industry surveys focus on base salary and total cash compensation in the U.S. for organizations with annual revenues typically less than $2.5 billion.
Participants are predominantly large to medium organizations. CDB general industry surveys are designed to meet the needs of organizations with annual revenues typically more than $1 billion.
Approach Survey reports provide data by job level and job function. Job-level survey reports include top management, middle and supervisory management, and office and business support. Job-function survey reports include accounting and finance, call center and customer service, and logistics and supply chain management.
Surveys are industry-specific as well as general industry. Industry-specific survey reports include energy services; high tech; media; pharmaceutical and health sciences; financial services; retail/wholesale; and hotel, resort and gaming.
Executive jobs The top management survey uses a benchmark methodology and includes approximately 100 benchmark jobs.
General industry and industry-specific surveys use a benchmark methodology and include more than 160 cross-industry benchmark jobs and up to 250 industry-specific benchmark jobs.
Nonexecutive jobs Middle management, professional and support levels and disciplines are separated by survey and include 50 functions and approximately 275 disciplines.
Middle management, professional and support levels and disciplines bundled by industry include as many as 100 functions and more than 1,000 disciplines.
Long-term incentive (LTI) values
Survey reports present LTI eligibility and accounting values by pay level and select jobs.
Survey reports present LTI eligibility and values by job and pay level, and offer multiple LTI valuation methodologies.
Accessibility CSR survey reports are available to participants and nonparticipants.
CDB survey reports are available to participants only.
Output options Published reports are presented with an array of views and report options.
Published or Advanced (unlimited peer groups) reports are available. Advanced reports are presented with all Published report features and additional customization capabilities.
Main menu
Order form
10 twdataservices.com
Request information
In-depth compensation data for more than 160 jobs in over 40 functions common to all industries, matched using a benchmarking methodology that integrates benchmark summaries with critical scope measures.
CDB general industry survey results are available to participants only. CDB accepts general industry data submissions throughout the year.
To participate, go to twdataservices.com and download everything you need.
At a Glance
Compensation elements reported on: • Base salary • Actual and target bonus • Total cash compensation • Long-term incentive expected values • Total direct compensation
Data are segmented by: • Revenue • Organization unit and size • Highest paid
OutputPublishedAdvanced
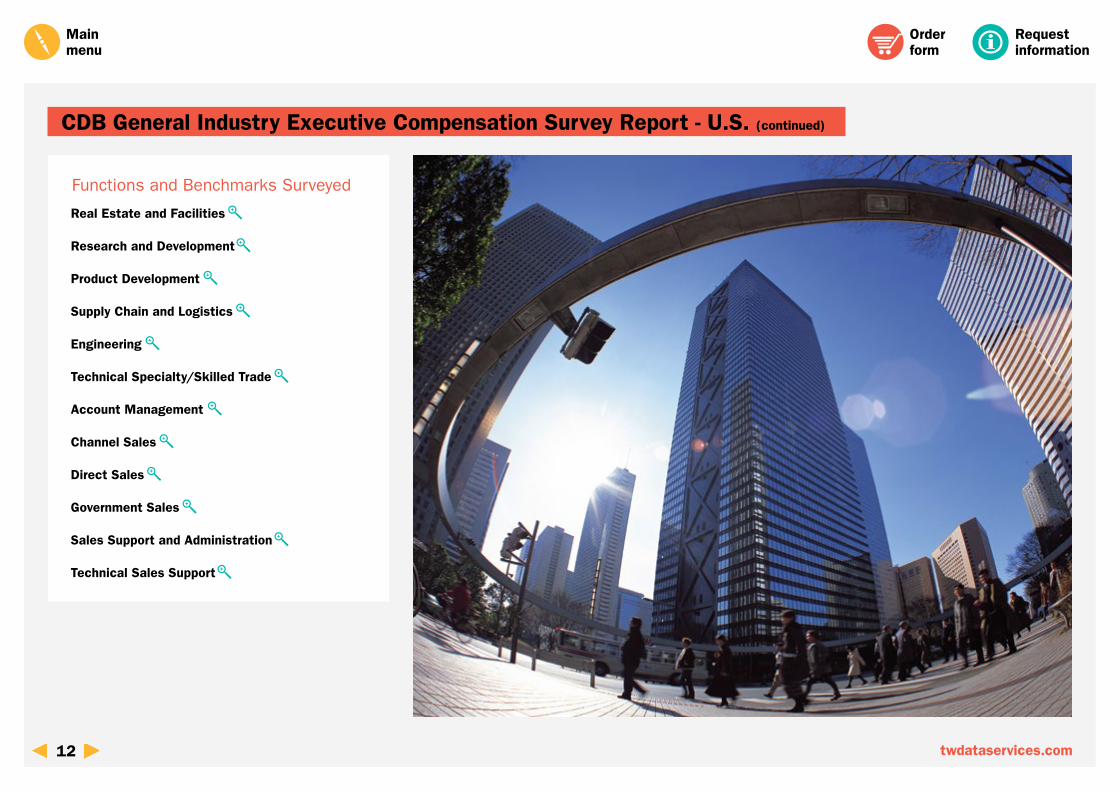
CDB General Industry Executive Compensation Survey Report - U.S.
Functions and Benchmarks Surveyed
(continued on next page)
2015 CDB General Industry Executive Compensation Survey results and trends webinar recording
Main menu
Order form
11 twdataservices.com
Top Executive
Profit Center Management
Transportation Services and Administration
Security
Corporate Affairs/Communications
Strategic Planning/Corporate Development
Modeling, Forecasting and Economic Analysis
Finance
Accounting
Credit and Collections
Financial Analysis and Tax
Audit and Financial/Business Controls
Risk Management
General Management and Administration
Human Resources
Environmental Health and Safety
Information Technology
IT Development
IT Administration
Legal
Sales and Marketing
Marketing
Customer Support/Operations
Technical Customer Support
Manufacturing and Engineering
Manufacturing/Operations
Project/Program Management
Quality Assurance Methods
Request information
CDB General Industry Executive Compensation Survey Report - U.S. (continued)
Functions and Benchmarks Surveyed
Main menu
Order form
12
Real Estate and Facilities
Research and Development
Product Development
Supply Chain and Logistics
Engineering
Technical Specialty/Skilled Trade
Account Management
Channel Sales
Direct Sales
Government Sales
Sales Support and Administration
Technical Sales Support
twdataservices.com
Request informationRequest information
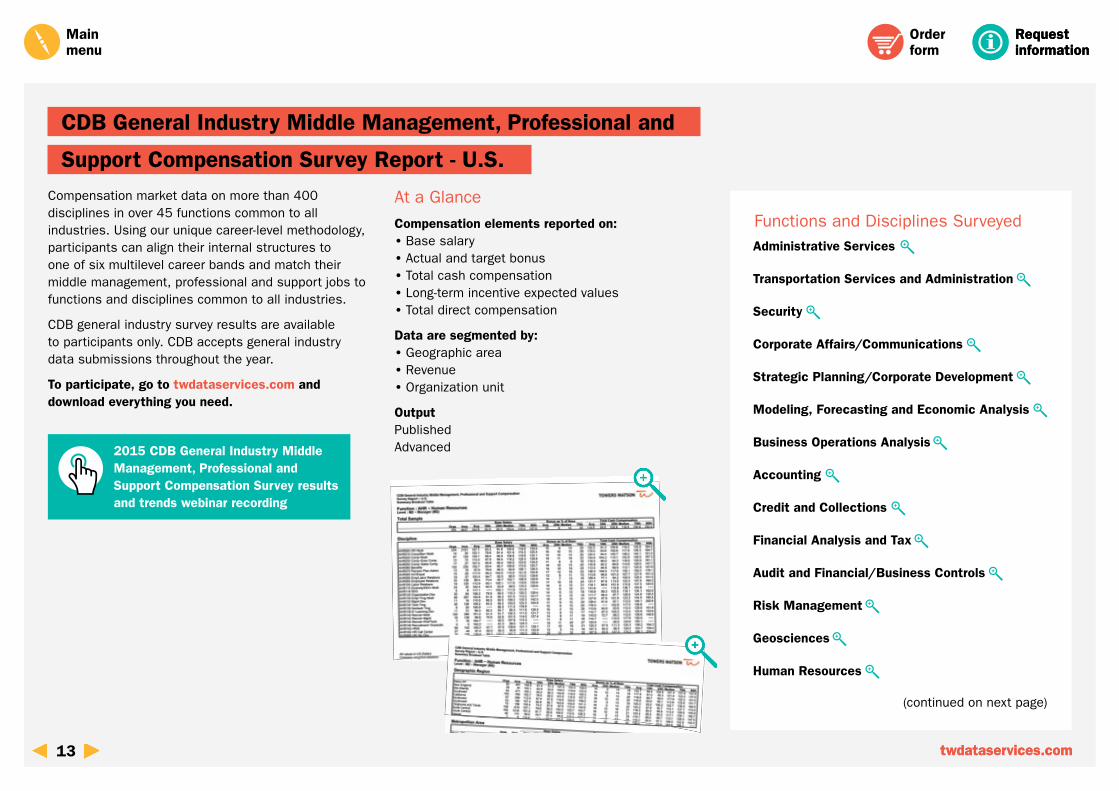
Functions and Disciplines Surveyed
CDB General Industry Middle Management, Professional and
Support Compensation Survey Report - U.S. Compensation market data on more than 400 disciplines in over 45 functions common to all industries. Using our unique career-level methodology, participants can align their internal structures to one of six multilevel career bands and match their middle management, professional and support jobs to functions and disciplines common to all industries.
CDB general industry survey results are available to participants only. CDB accepts general industry data submissions throughout the year.
To participate, go to twdataservices.com and download everything you need.
At a Glance
Compensation elements reported on: • Base salary • Actual and target bonus • Total cash compensation • Long-term incentive expected values • Total direct compensation
Data are segmented by: • Geographic area • Revenue • Organization unit
OutputPublished Advanced
(continued on next page)
2015 CDB General Industry Middle Management, Professional and Support Compensation Survey results and trends webinar recording
Main menu
Order form
twdataservices.com13 twdataservices.com
Administrative Services
Transportation Services and Administration
Security
Corporate Affairs/Communications
Strategic Planning/Corporate Development
Modeling, Forecasting and Economic Analysis
Business Operations Analysis
Accounting
Credit and Collections
Financial Analysis and Tax
Audit and Financial/Business Controls
Risk Management
Geosciences
Human Resources
Request information
Functions and Disciplines Surveyed
Main menu
Order form
CDB General Industry Middle Management, Professional and
Support Compensation Survey Report - U.S. (continued)
14 twdataservices.com
Quality Assurance Methods
Real Estate and Facilities
Product Development
Product Development Support
Research Science
Research Science Support
Supply Chain and Logistics
Engineering
Technical Specialty/Skilled Trade
Manual/Unskilled Labor
Account Management
Environmental Health and Safety
IT Development
IT Administration
Legal
Legal Support
Marketing
Customer Support/Operations
Technical Customer Support
Manufacturing/Operations
Outsourced/Contract Manufacturing
Project/Program Management
Bid Management
Client Service Delivery Management
Channel Sales
Direct Sales
Government Sales
Large Deal Acquisition Sales
New Account Acquisition Sales
Telesales
Sales Support and Administration
Technical Sales Support
Request information
Design and deliver a competitive compensation plan for your entire organization with our CSR General Industry Reports Package, which provides detailed pay data for every job level and function.
The reports package includes 14 compensation reports and two regression analysis tools, including:
Six reports by job level:
• CSR General Industry Office and Business Support Compensation Survey Report - U.S.
• CSR General Industry Technical Support and Production Compensation Survey Report - U.S.
• CSR General Industry Professional (Administrative and Sales) Compensation Survey Report - U.S.
• CSR General Industry Professional (Technical and Operations) Compensation Survey Report - U.S.
• CSR General Industry Supervisory and Middle Management Compensation Survey Report - U.S.
• CSR General Industry Top Management Compensation Survey Report - U.S.
Two regression analysis tools:
• CSR General Industry Supervisory and Middle Management Comp Calculator - U.S. This tool includes regression equations that relate supervisory and middle management salaries and total pay to organization size.
• CSR General Industry Top Management Comp Calculator - U.S. This tool includes regression equations that relate top management salaries and total pay to organization size.
Eight reports by job function:
• CSR General Industry Call Center and Customer Service Compensation Survey Report - U.S.
• CSR General Industry Engineering, Design and Technical Specialty Compensation Survey Report - U.S.
• CSR General Industry Human Resources Compensation Survey Report - U.S.
• CSR General Industry Information Technology Compensation Survey Report - U.S.
• CSR General Industry Logistics and Supply Chain Management Compensation Survey Report - U.S.
• CSR General Industry Sales Compensation Survey Report - U.S.
• CSR General Industry Marketing and Communications Compensation Survey Report - U.S.
• CSR General Industry Accounting and Finance Compensation Survey Report - U.S.
Output
Published
CSR General Industry Reports Package - U.S.
Main menu
2015 CSR General Industry Compensation Survey results and trends webinar recording
Order form
15 twdataservices.com
Request information
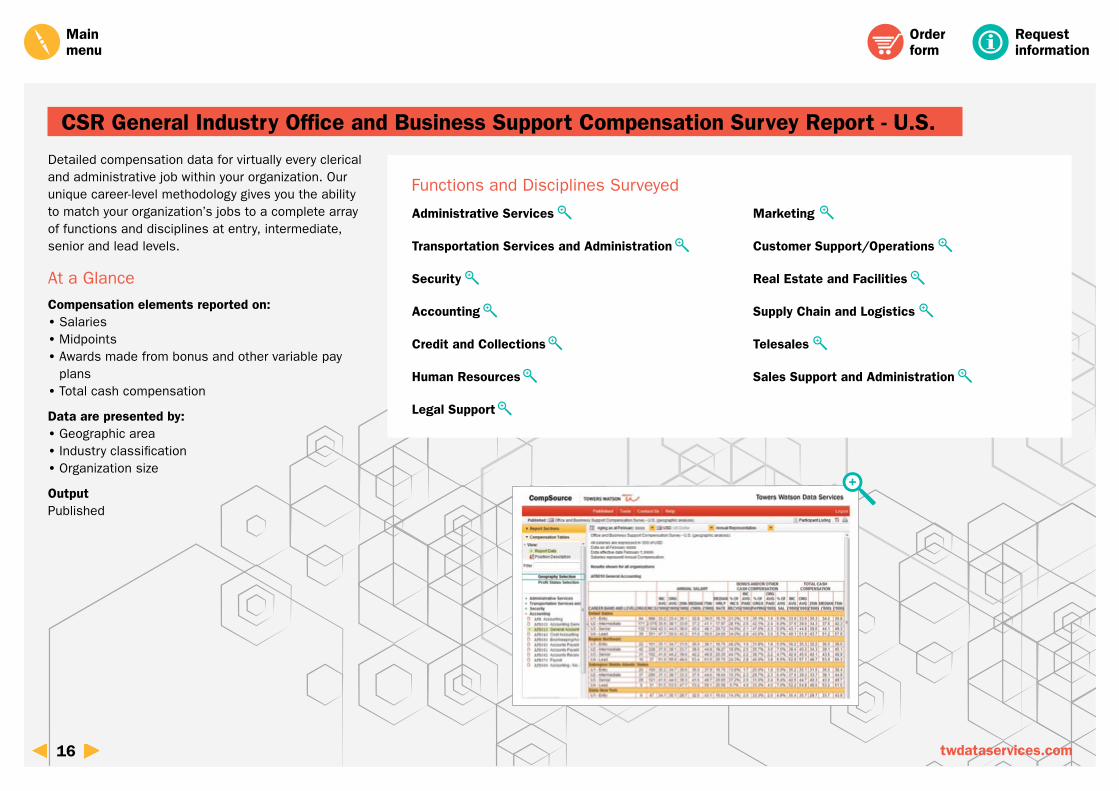
CSR General Industry Office and Business Support Compensation Survey Report - U.S.
Functions and Disciplines Surveyed
Detailed compensation data for virtually every clerical and administrative job within your organization. Our unique career-level methodology gives you the ability to match your organization’s jobs to a complete array of functions and disciplines at entry, intermediate, senior and lead levels.
At a Glance
Compensation elements reported on: • Salaries • Midpoints • Awards made from bonus and other variable pay plans • Total cash compensation
Data are presented by: • Geographic area • Industry classification • Organization size
OutputPublished
Main menu
Order form
16 twdataservices.com
Marketing
Customer Support/Operations
Real Estate and Facilities
Supply Chain and Logistics
Telesales
Sales Support and Administration
Administrative Services
Transportation Services and Administration
Security
Accounting
Credit and Collections
Human Resources
Legal Support
Request information
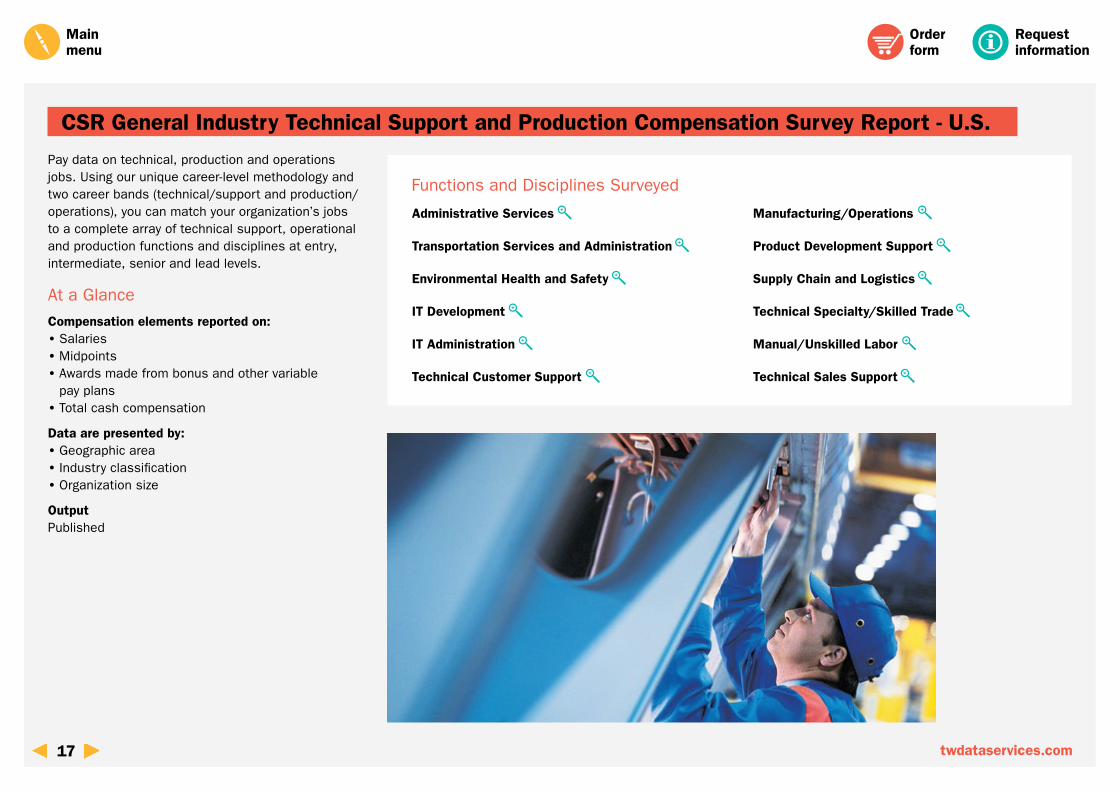
CSR General Industry Technical Support and Production Compensation Survey Report - U.S.
Functions and Disciplines Surveyed
Main menu
Pay data on technical, production and operations jobs. Using our unique career-level methodology and two career bands (technical/support and production/operations), you can match your organization’s jobs to a complete array of technical support, operational and production functions and disciplines at entry, intermediate, senior and lead levels.
At a Glance
Compensation elements reported on: • Salaries • Midpoints • Awards made from bonus and other variable pay plans • Total cash compensation
Data are presented by: • Geographic area • Industry classification • Organization size
OutputPublished
Order form
17 twdataservices.com
Manufacturing/Operations
Product Development Support
Supply Chain and Logistics
Technical Specialty/Skilled Trade
Manual/Unskilled Labor
Technical Sales Support
Administrative Services
Transportation Services and Administration
Environmental Health and Safety
IT Development
IT Administration
Technical Customer Support
Request information
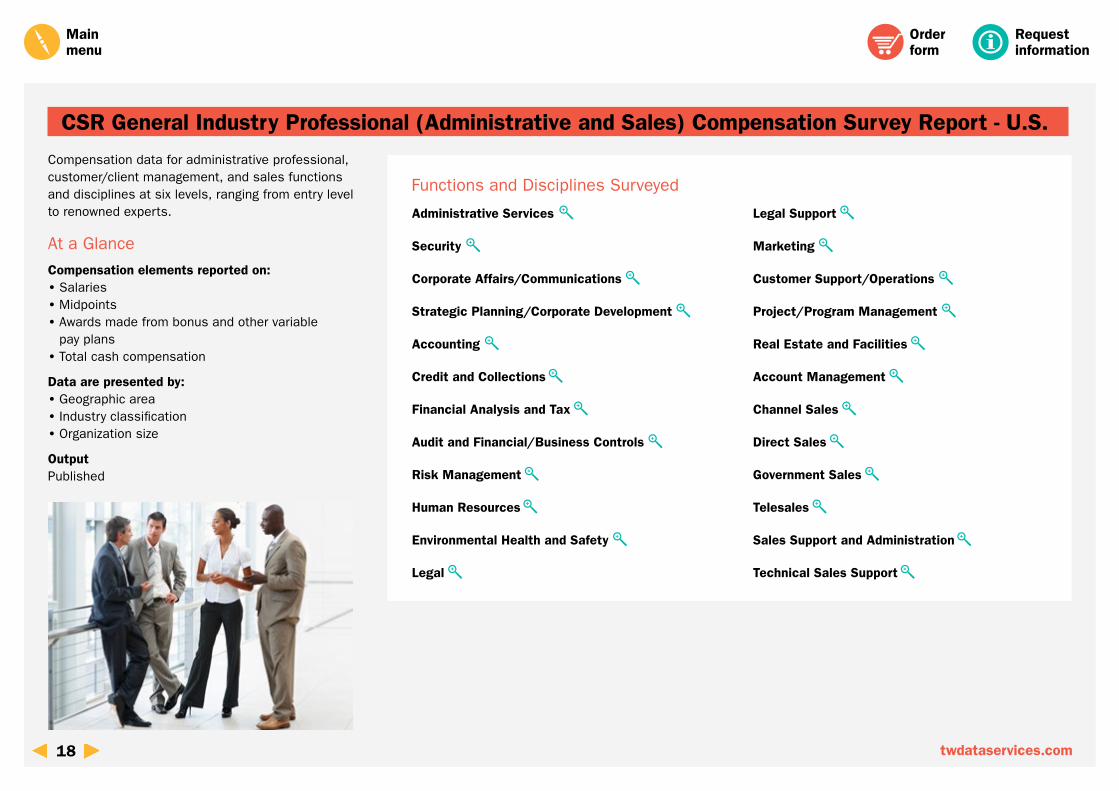
Compensation data for administrative professional, customer/client management, and sales functions and disciplines at six levels, ranging from entry level to renowned experts.
At a Glance
Compensation elements reported on: • Salaries • Midpoints • Awards made from bonus and other variable pay plans • Total cash compensation
Data are presented by: • Geographic area • Industry classification • Organization size
OutputPublished
CSR General Industry Professional (Administrative and Sales) Compensation Survey Report - U.S.
Functions and Disciplines Surveyed
Main menu
Order form
18 twdataservices.com
Administrative Services
Security
Corporate Affairs/Communications
Strategic Planning/Corporate Development
Accounting
Credit and Collections
Financial Analysis and Tax
Audit and Financial/Business Controls
Risk Management
Human Resources
Environmental Health and Safety
Legal
Legal Support
Marketing
Customer Support/Operations
Project/Program Management
Real Estate and Facilities
Account Management
Channel Sales
Direct Sales
Government Sales
Telesales
Sales Support and Administration
Technical Sales Support
Request information
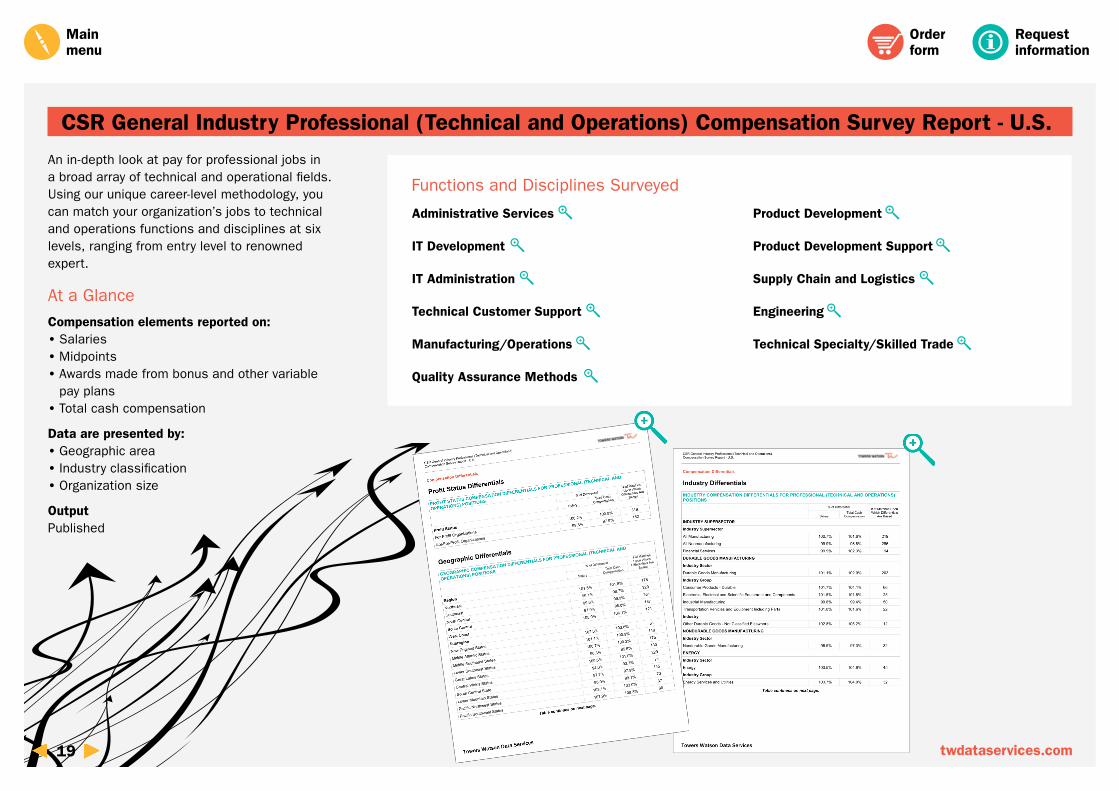
CSR General Industry Professional (Technical and Operations) Compensation Survey Report - U.S.
Functions and Disciplines Surveyed
An in-depth look at pay for professional jobs in a broad array of technical and operational fields. Using our unique career-level methodology, you can match your organization’s jobs to technical and operations functions and disciplines at six levels, ranging from entry level to renowned expert.
At a Glance
Compensation elements reported on: • Salaries • Midpoints • Awards made from bonus and other variable pay plans • Total cash compensation
Data are presented by: • Geographic area • Industry classification • Organization size
OutputPublished
Main menu
Order form
19 twdataservices.com
Product Development
Product Development Support
Supply Chain and Logistics
Engineering
Technical Specialty/Skilled Trade
Administrative Services
IT Development
IT Administration
Technical Customer Support
Manufacturing/Operations
Quality Assurance Methods

Request information
Current compensation data for supervisory/middle management jobs ranging from first-level supervisor to senior group manager. Our unique career-level methodology enables you to match your organization’s jobs to multiple levels of management at varying degrees of responsibility and accountability for people and resources, as well as business functions, operational areas, processes and/or programs.
At a Glance
Compensation elements reported on: • Salaries • Midpoints • Awards made from bonus and other variable pay plans • Total cash compensation
Data are presented by: • Geographic area • Industry classification • Organization size
Output • Published
Also Available
CSR General Industry Supervisory and Middle Management Comp Calculator - U.S.This tool includes regression equations that relate supervisory and middle management salaries and total pay to organization size.
OutputPublished
CSR General Industry Supervisory and Middle Management Compensation Survey Report - U.S.
Functions and Disciplines Surveyed
Main menu
(continued on next page)
Order form
20 twdataservices.com
Administrative Services
Transportation Services and Administration
Security
Corporate Affairs/Communications
Strategic Planning/Corporate Development
Accounting
Credit and Collections
Financial Analysis and Tax
Audit and Financial/Business Controls
Risk Management
Human Resources
Environmental Health and Safety
IT Development
IT Administration
Legal
Legal Support
Marketing
Customer Support/Operations
Technical Customer Support
Manufacturing/Operation
Project/Program Management
Quality Assurance Methods
Real Estate and Facilities
Product Development
Request information
Functions and Disciplines Surveyed
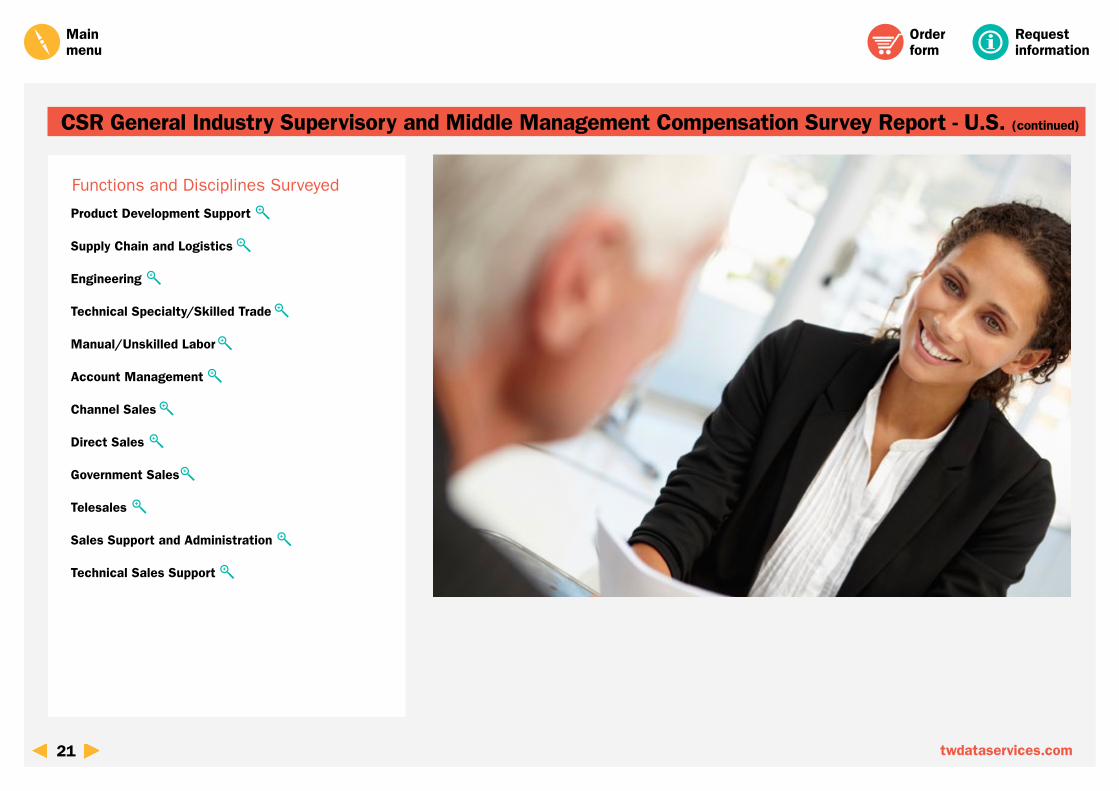
CSR General Industry Supervisory and Middle Management Compensation Survey Report - U.S. (continued)
Main menu
Order form
21 twdataservices.com
Product Development Support
Supply Chain and Logistics
Engineering
Technical Specialty/Skilled Trade
Manual/Unskilled Labor
Account Management
Channel Sales
Direct Sales
Government Sales
Telesales
Sales Support and Administration
Technical Sales Support
Request information
Functions and Benchmarks Surveyed
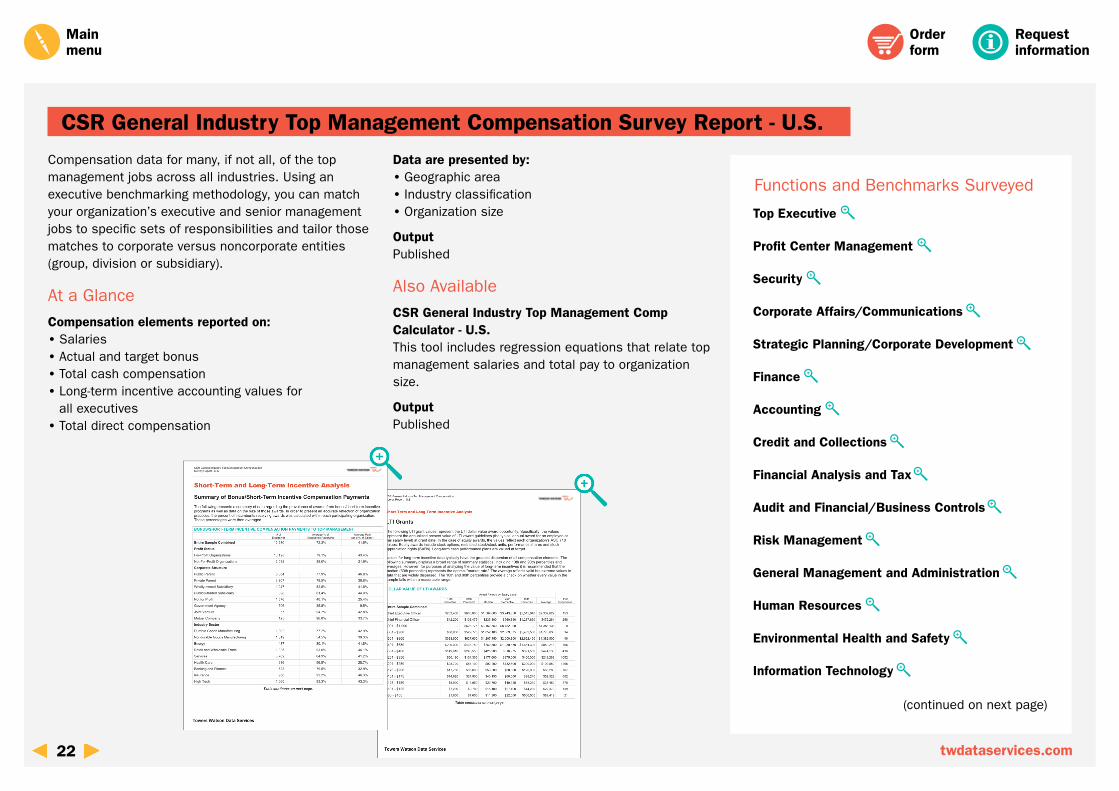
Compensation data for many, if not all, of the top management jobs across all industries. Using an executive benchmarking methodology, you can match your organization’s executive and senior management jobs to specific sets of responsibilities and tailor those matches to corporate versus noncorporate entities (group, division or subsidiary).
At a Glance
Compensation elements reported on: • Salaries • Actual and target bonus • Total cash compensation • Long-term incentive accounting values for all executives • Total direct compensation
Data are presented by: • Geographic area • Industry classification • Organization size
OutputPublished
Also Available
CSR General Industry Top Management Comp Calculator - U.S.This tool includes regression equations that relate top management salaries and total pay to organization size.
OutputPublished
CSR General Industry Top Management Compensation Survey Report - U.S.
Main menu
Order form
22 twdataservices.com
Top Executive
Profit Center Management
Security
Corporate Affairs/Communications
Strategic Planning/Corporate Development
Finance
Accounting
Credit and Collections
Financial Analysis and Tax
Audit and Financial/Business Controls
Risk Management
General Management and Administration
Human Resources
Environmental Health and Safety
Information Technology
(continued on next page)
Request information
CSR General Industry Top Management Compensation Survey Report - U.S. (continued)
Functions and Benchmarks Surveyed
Main menu
Order form
23 twdataservices.com
Real Estate and Facilities
Research and Development
Supply Chain and Logistics
Engineering
Technical Specialty/Skilled Trade
Account Management
Sales
Channel Sales
Direct Sales
Government Sales
Sales Support and Administration
IT Development
IT Administration
Legal
Sales and Marketing
Marketing
Customer Support/Operations
Technical Customer Support
Manufacturing and Engineering
Manufacturing/Operations
Project/Program Management
Quality Assurance Methods
Technical Sales Support
Request information
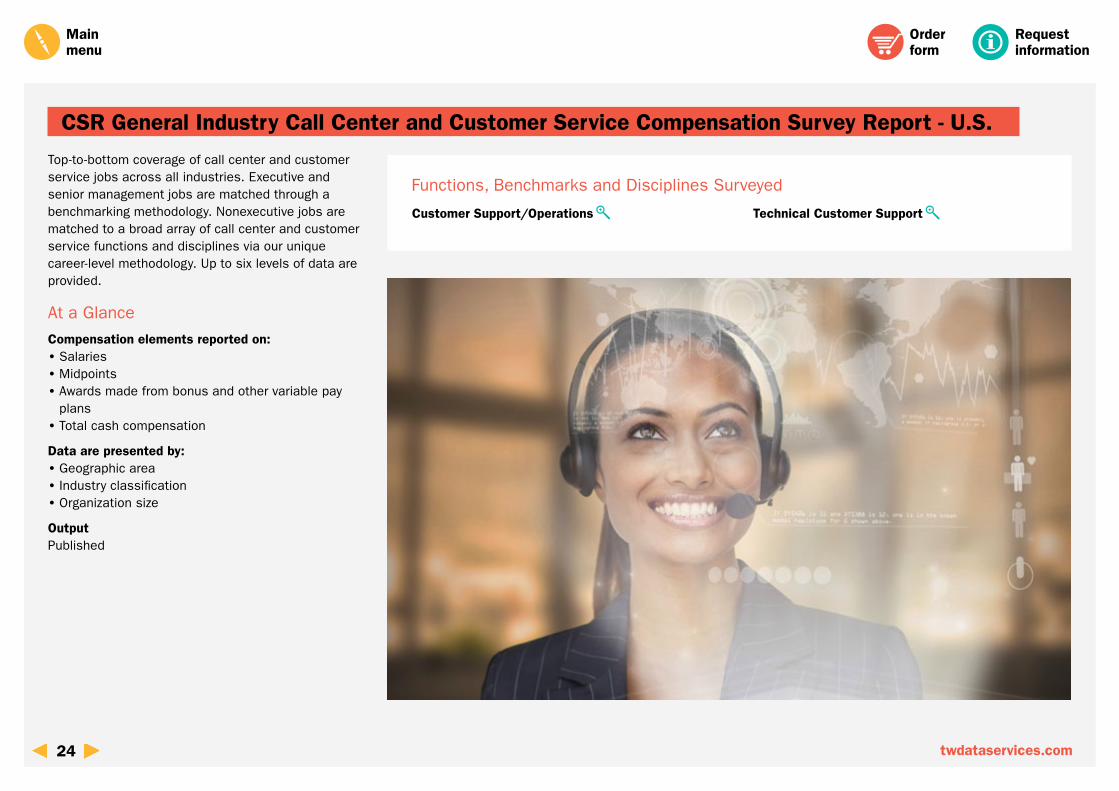
Top-to-bottom coverage of call center and customer service jobs across all industries. Executive and senior management jobs are matched through a benchmarking methodology. Nonexecutive jobs are matched to a broad array of call center and customer service functions and disciplines via our unique career-level methodology. Up to six levels of data are provided.
At a Glance
Compensation elements reported on: • Salaries • Midpoints • Awards made from bonus and other variable pay plans • Total cash compensation
Data are presented by: • Geographic area • Industry classification • Organization size
OutputPublished
CSR General Industry Call Center and Customer Service Compensation Survey Report - U.S.
Functions, Benchmarks and Disciplines Surveyed
Main menu
Order form
24 twdataservices.com
Customer Support/Operations Technical Customer Support
Request information
Functions, Benchmarks and Disciplines Surveyed
Main menu
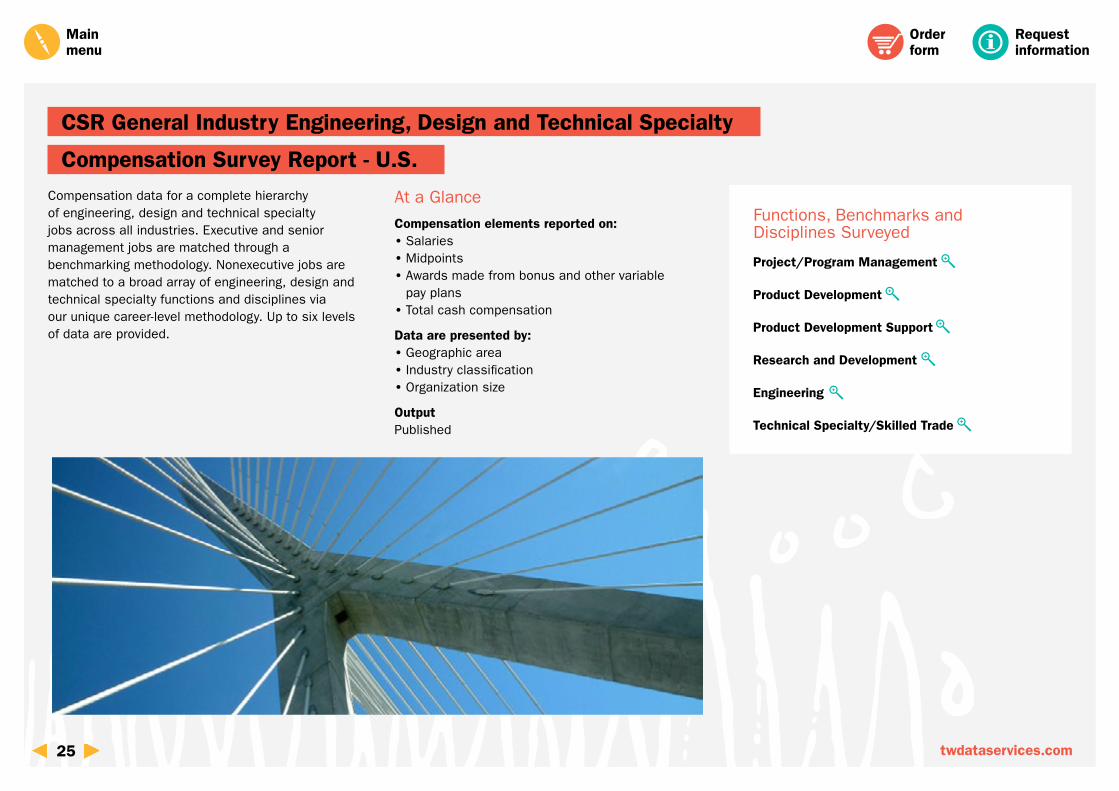
Compensation data for a complete hierarchy of engineering, design and technical specialty jobs across all industries. Executive and senior management jobs are matched through a benchmarking methodology. Nonexecutive jobs are matched to a broad array of engineering, design and technical specialty functions and disciplines via our unique career-level methodology. Up to six levels of data are provided.
At a Glance
Compensation elements reported on: • Salaries • Midpoints • Awards made from bonus and other variable pay plans • Total cash compensation
Data are presented by: • Geographic area • Industry classification • Organization size
OutputPublished
Order form
CSR General Industry Engineering, Design and Technical Specialty
Compensation Survey Report - U.S.
25 twdataservices.com
Project/Program Management
Product Development
Product Development Support
Research and Development
Engineering
Technical Specialty/Skilled Trade
Request information
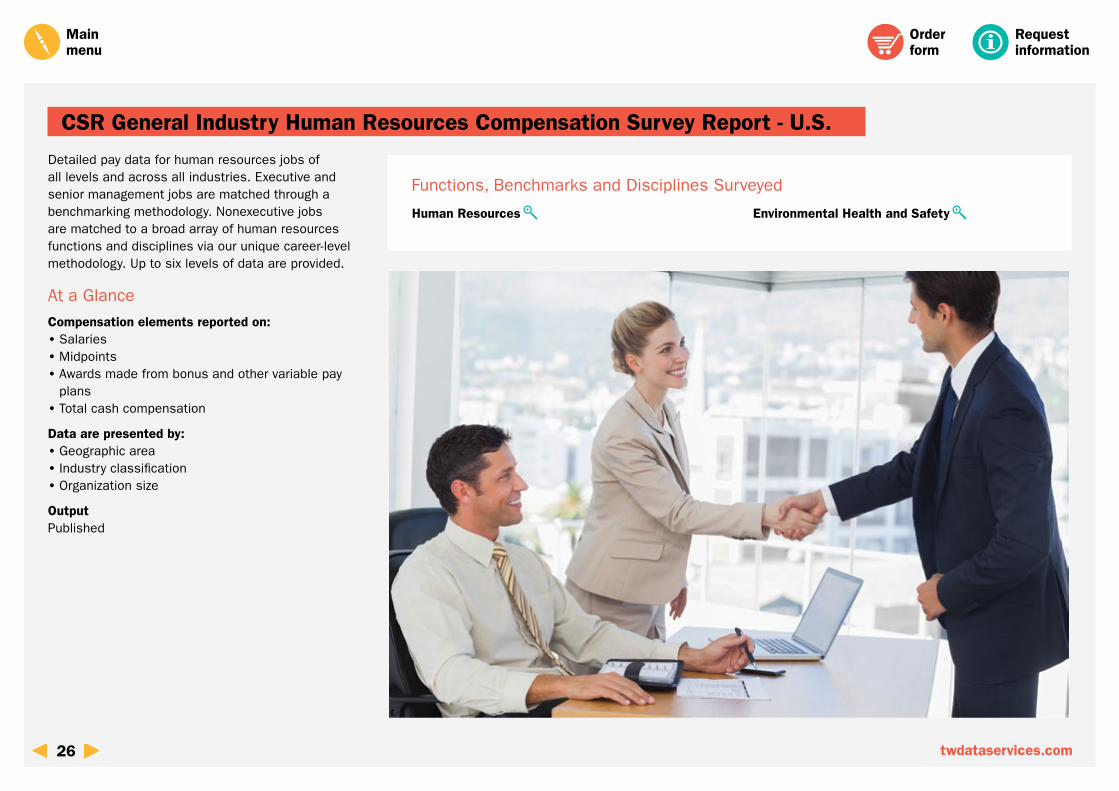
Detailed pay data for human resources jobs of all levels and across all industries. Executive and senior management jobs are matched through a benchmarking methodology. Nonexecutive jobs are matched to a broad array of human resources functions and disciplines via our unique career-level methodology. Up to six levels of data are provided.
At a Glance
Compensation elements reported on: • Salaries • Midpoints • Awards made from bonus and other variable pay plans • Total cash compensation
Data are presented by: • Geographic area • Industry classification • Organization size
OutputPublished
CSR General Industry Human Resources Compensation Survey Report - U.S.
Main menu
Functions, Benchmarks and Disciplines Surveyed
Human Resources Environmental Health and Safety
Order form
26 twdataservices.com
Request information
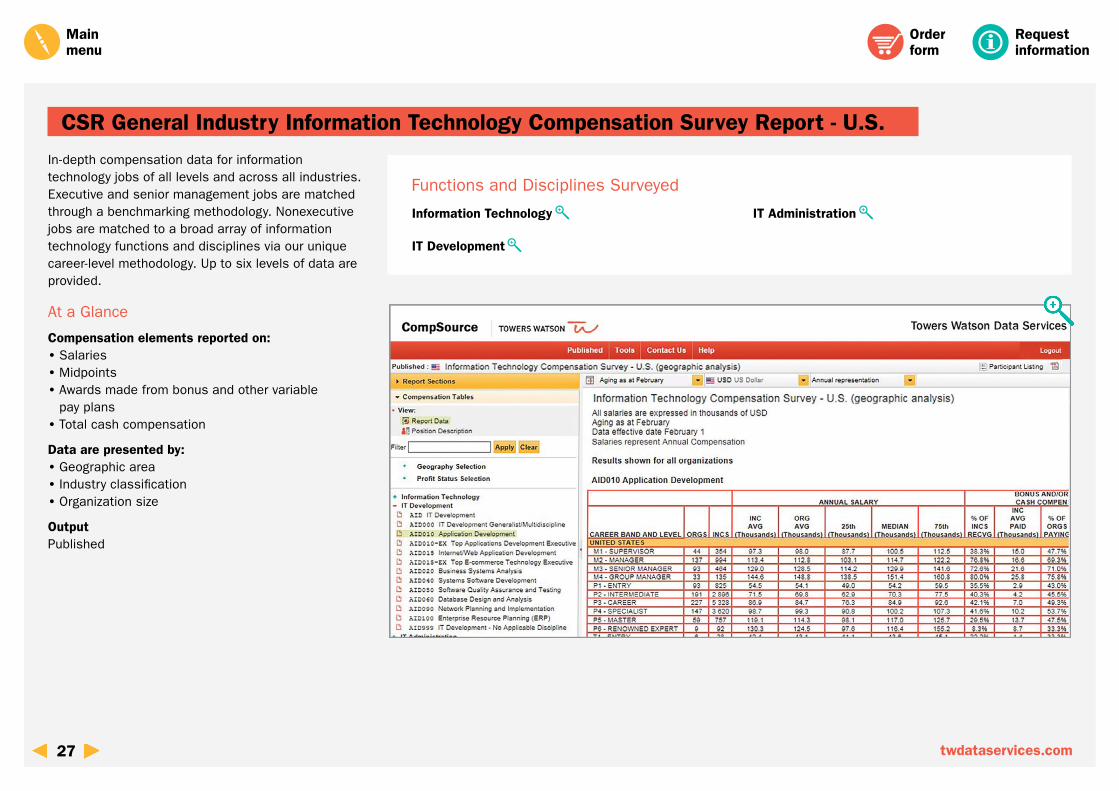
In-depth compensation data for information technology jobs of all levels and across all industries. Executive and senior management jobs are matched through a benchmarking methodology. Nonexecutive jobs are matched to a broad array of information technology functions and disciplines via our unique career-level methodology. Up to six levels of data are provided.
At a Glance
Compensation elements reported on: • Salaries • Midpoints • Awards made from bonus and other variable pay plans • Total cash compensation
Data are presented by: • Geographic area • Industry classification • Organization size
OutputPublished
CSR General Industry Information Technology Compensation Survey Report - U.S.
Main menu
Functions and Disciplines Surveyed
Order form
27 twdataservices.com
Information Technology
IT Development
IT Administration
Request information
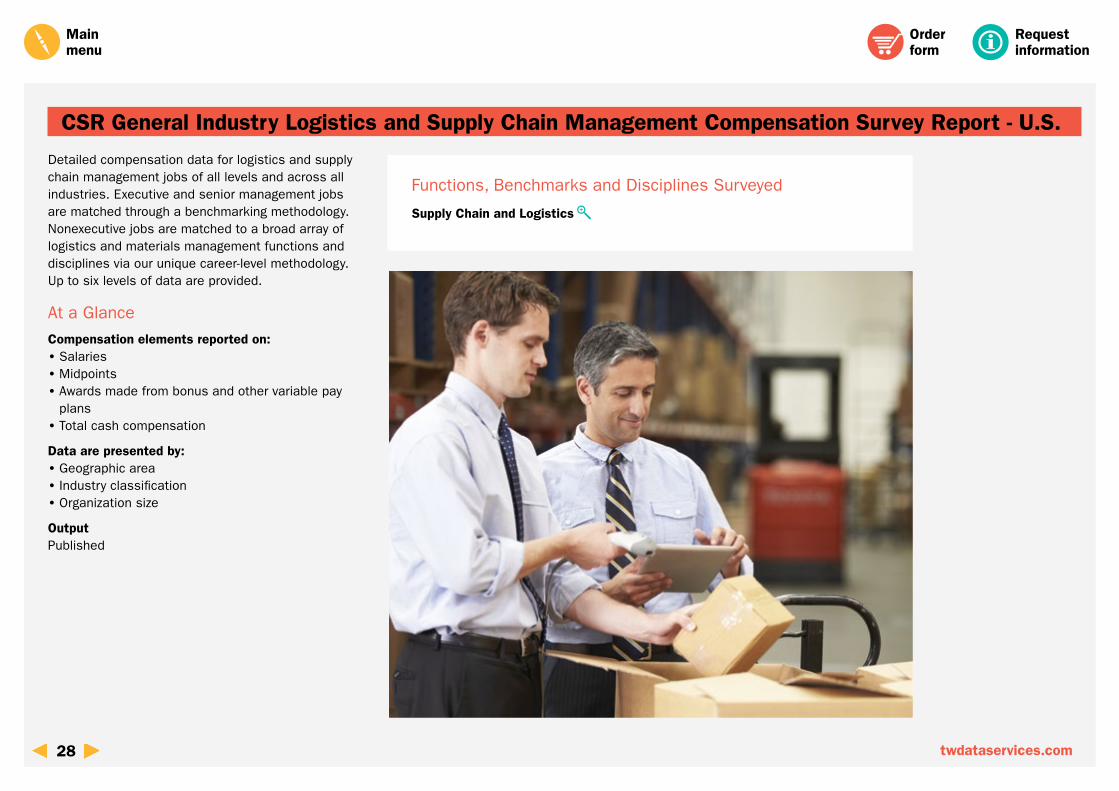
Detailed compensation data for logistics and supply chain management jobs of all levels and across all industries. Executive and senior management jobs are matched through a benchmarking methodology. Nonexecutive jobs are matched to a broad array of logistics and materials management functions and disciplines via our unique career-level methodology. Up to six levels of data are provided.
At a Glance
Compensation elements reported on: • Salaries • Midpoints • Awards made from bonus and other variable pay plans • Total cash compensation
Data are presented by: • Geographic area • Industry classification • Organization size
OutputPublished
CSR General Industry Logistics and Supply Chain Management Compensation Survey Report - U.S.
Main menu
Functions, Benchmarks and Disciplines Surveyed
Supply Chain and Logistics
Order form
28 twdataservices.com
Request information
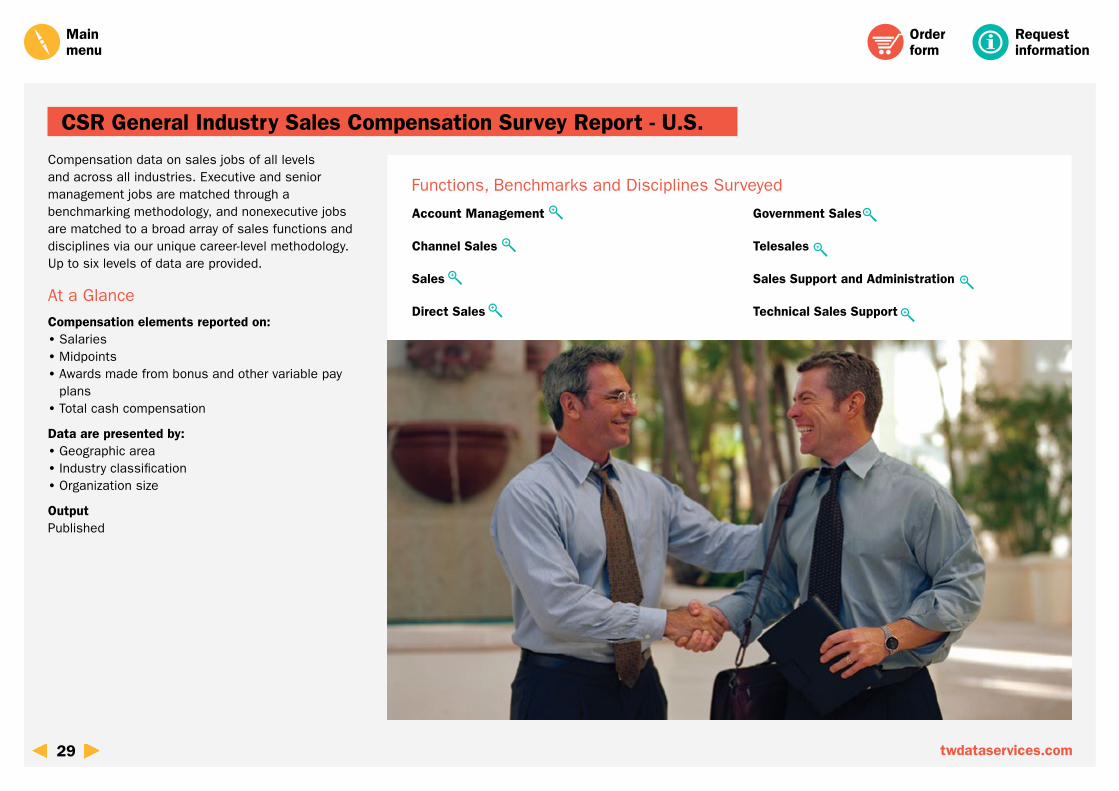
Compensation data on sales jobs of all levels and across all industries. Executive and senior management jobs are matched through a benchmarking methodology, and nonexecutive jobs are matched to a broad array of sales functions and disciplines via our unique career-level methodology. Up to six levels of data are provided.
At a Glance
Compensation elements reported on: • Salaries • Midpoints • Awards made from bonus and other variable pay plans • Total cash compensation
Data are presented by: • Geographic area • Industry classification • Organization size
OutputPublished
CSR General Industry Sales Compensation Survey Report - U.S.
Functions, Benchmarks and Disciplines Surveyed
Main menu
Order form
29 twdataservices.com
Account Management
Channel Sales
Sales
Direct Sales
Government Sales
Telesales
Sales Support and Administration
Technical Sales Support
Request information
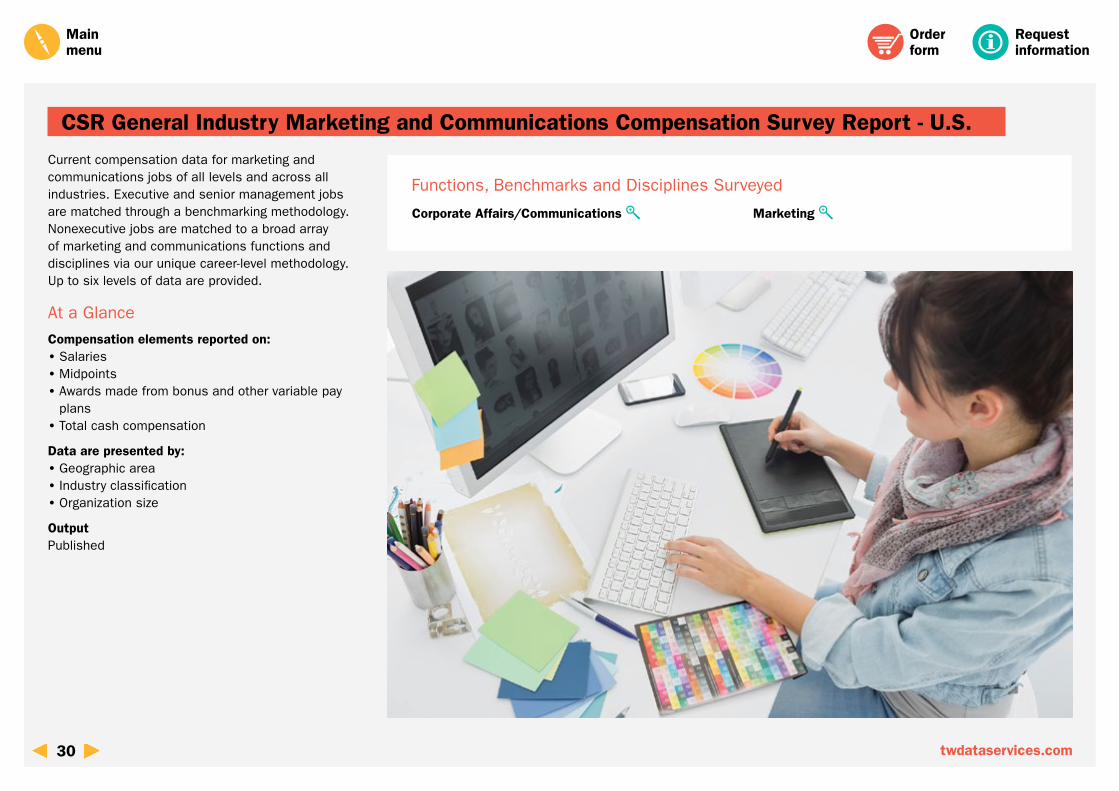
Current compensation data for marketing and communications jobs of all levels and across all industries. Executive and senior management jobs are matched through a benchmarking methodology. Nonexecutive jobs are matched to a broad array of marketing and communications functions and disciplines via our unique career-level methodology. Up to six levels of data are provided.
At a Glance
Compensation elements reported on: • Salaries • Midpoints • Awards made from bonus and other variable pay plans • Total cash compensation
Data are presented by: • Geographic area • Industry classification • Organization size
OutputPublished
CSR General Industry Marketing and Communications Compensation Survey Report - U.S.
Main menu
Functions, Benchmarks and Disciplines Surveyed
Order form
30 twdataservices.com
Corporate Affairs/Communications Marketing
Request information
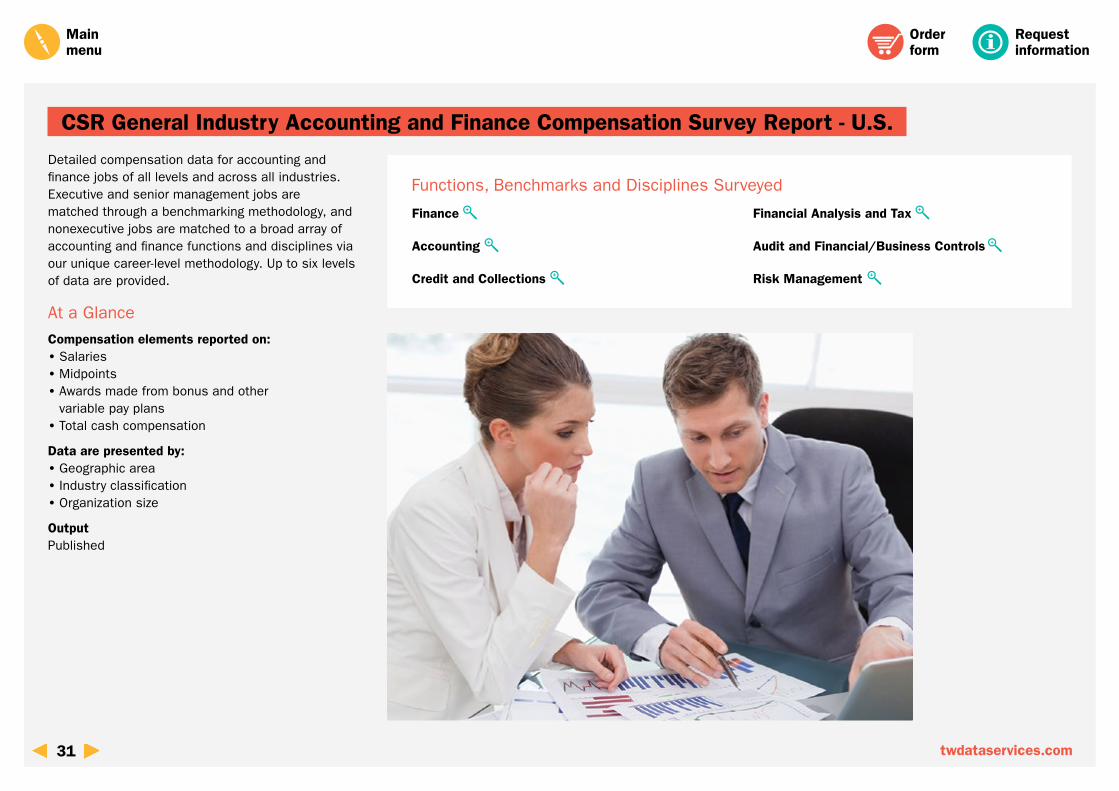
Detailed compensation data for accounting and finance jobs of all levels and across all industries. Executive and senior management jobs are matched through a benchmarking methodology, and nonexecutive jobs are matched to a broad array of accounting and finance functions and disciplines via our unique career-level methodology. Up to six levels of data are provided.
At a Glance
Compensation elements reported on: • Salaries • Midpoints • Awards made from bonus and other variable pay plans • Total cash compensation
Data are presented by: • Geographic area • Industry classification • Organization size
OutputPublished
CSR General Industry Accounting and Finance Compensation Survey Report - U.S.
Functions, Benchmarks and Disciplines Surveyed
Main menu
Order form
31 twdataservices.com
Finance
Accounting
Credit and Collections
Financial Analysis and Tax
Audit and Financial/Business Controls
Risk Management
Request information
General Industry Employee Benefit Policies and Practices Report - U.S.
Our latest report is based on collaborative efforts between Towers Watson Data Services and Towers Watson’s Research and Innovation Center (RIC). Data were compiled from the Benefits Data Source (BDS) database and the annual Towers Watson/National Business Group on Health Employer Survey on Purchasing Value in Health Care.
At a Glance
Benefits covered: • Medical benefits* — Participation requirements, coordination of benefits, annual deductibles, annual out-of-pocket maximums, health reimbursement accounts/health savings accounts, hospital, emergency room and physician inpatient services, office visits, chiropractic care, prescription drugs (retail and mail order) and employee contributions • Dental benefits — Dental plan offered, participation, type of plan, annual deductibles, annual maximums, preventive/type I (cleanings), basic/type II (fillings), major/type III (crowns), orthodontia and monthly employee contributions • Vision plans — Vision plans, participation requirements, types of plans, in-network provisions and employee contributions • Defined contribution plans — Plan type, participation, Roth (401K) plans, covered pay, employee contributions, auto-enrollment, auto-escalation, company contributions, vesting, availability of company stock as an investment option, automatic rebalancing, stock buying/selling contributions, loans and withdrawal provisions • Pension plans — Defined benefit pension plans, type of plan
• Traditional defined benefit plans — Participation requirements, vesting, employee contributions, type of formula, integration, covered pay, average pay, normal retirement – eligibility, early retirement provisions, disability provisions, terminated vested, active preretirement death benefits, normal forms of payment, lump sum payments and postretirement automatic cost-of-living adjustments • Account-based plans — Participation requirements, vesting, employee contributions, type of formula, covered pay, average pay, disability provisions, active preretirement death benefits, normal forms of payment, lump sum payments, postretirement automatic cost of living adjustments, crediting formula, interest credits and annuity conversions • Vacation — Vacation/holiday practices, vacation buying, vacation selling, carryover of vacation, maximum carryover of vacation, pay for unused vacation – during employment, vacation at hire, vacation with one year of service, vacation with three years of service, vacation with seven years of service, vacation with 15 years of service, vacation with 25 years of service, vacation with 35 years of service, employer scheduled holidays, employee scheduled holidays, total holidays and vacation selling
Main menu
(continued on next page)
* Data on medical benefits include comprehensive coverage of individual types of plans, including preferred provider organization (PPO), account-based medical/health plan (ABHP), health maintenance organization/exclusive provider organization (HMO/EPO) and point of service (POS).
Order form
32 twdataservices.com
Request information
General Industry Employee Benefit Policies and Practices Report - U.S. (continued)
• Paid time off (PTO) — Paid time off plans, paid time off buying, paid time off selling, carryover of paid time off, maximum carryover of paid time off, pay for unused paid time off – during employment, paid time off at hire, paid time off with one year of service, paid time off with three years of service, paid time off with seven years of service, paid time off with 15 years of service, paid time off with 25 years of service, paid time off with 35 years of service, employer scheduled holidays and employee scheduled holidays • Sick leave/short-term disability — Participation requirements • Long-term disability — Long-term disability plans, participation requirements, definition of disability, monthly employee contributions, covered pay, commencement, benefits and cost-of-living adjustments • Active employee life insurance — Type of coverage, participation requirements, monthly employee contributions, covered pay and benefit amounts • Accidental death and dismemberment insurance — Coverage available and AD&D provisions • Flexible/other benefits — Elder care, adoption benefits, flexible work arrangements, flextime, job sharing, onsite fitness center, long-term care insurance, group financial planning, group auto insurance and group homeowners insurance • Retiree medical plans — Retiree medical plans, participation requirements – retirees under age 65, type of plan – retirees under age 65, annual deductibles – retirees under age 65, annual
out-of-pocket maximum including deductible – retirees under age 65, hospital room and board – retirees under age 65, physician expenses – retirees under age 65, prescription drugs – retirees under age 65, monthly retiree contributions – retirees under age 65, cost containment – retirees under age 65, participation requirements – retirees 65 and older, Medicare, type of plan – retirees 65 and older, annual deductibles – retirees 65 and older, annual out-of-pocket maximum including deductible – retirees 65 and older, hospital room and board – retirees 65 and older, physician expenses – retirees 65 and older, prescription drugs – retirees 65 and older, monthly retiree contributions – retirees 65 and older, cost containment – retirees 65 and older, survivors of retirees – retirees 65 and older • Retiree medical savings accounts — Retiree medical savings account plans and employer contributions • Retiree dental plans — Retiree coverage under age 65, retiree coverage age 65 and older • Retiree life insurance (death benefits) — Retiree participation requirements, monthly retiree contributions, early retiree coverage and normal retiree coverage
Data are presented by: • Geographic area • Organization size • Industry classification
Output Published
Main menu
Order form
33 twdataservices.com
Request information
General Industry Salary Budget Survey Report - U.S.
Data on actual salary budget increase percentages for the current year and projected increases for the following year, two figures most sought after by HR and compensation professionals.
At a Glance
Data are presented by: • Geographic area • Industry classification • Organization size • Profit status
Employee groups covered: • Executives • Management, excluding executives • Exempt, nonmanagement • Nonexempt salaried • Nonexempt hourly
Salary budget elements reported on: • Merit and total increase statistics reported as a percentage of total base salaries that were granted, budgeted and projected • Salary range midpoint increases that were granted, budgeted and projected • The percentage of incumbents who receive variable pay elements (short-term incentives/bonuses and low-cost recognition/spot awards programs) in each applicable employee group
• Statistics regarding the percentage of total base salaries budgeted for short-term incentives/bonuses • Targeted total reward mix indicating the target percentage of each element • Salary increase statistics expressed both as a percentage of incumbents receiving and the average salary increase at each of the four performance ratings
OutputPublished
Main menu
Order form
34 twdataservices.com
Receive detailed information on a wide variety of current compensation-related issues.
At a Glance
Policies and practices reported on: • Labor market definition by employee group • Short-term incentive pay programs • Sales incentives and policies affecting sales personnel • Shift and holiday pay differentials • Severance pay policies • Exempt overtime policies • Staffing • Tuition assistance • Recruitment and retention • Work/life policies • Deferred compensation plans for executives • Compensation policies and practices specific to financial services and health care organizations
Data are presented by: • Geographic region • Organization size • Profit status • Industry sector
Employee groups covered: • Executives • Management, excluding executives • Exempt, nonmanagement • Nonexempt employees
Output Published
Request information
General Industry Compensation Policies and Practices Survey Report - U.S.
Main menu
Order form
35 twdataservices.com
Request information
Long-Term Incentives, Policies and Practices Survey Report - U.S.
No executive compensation program is complete without considering the impact LTI plans and awards have on total direct compensation. Make sure your LTI plan is on track with this report, jointly developed by the compensation consultants at Towers Watson and the compensation survey experts at Towers Watson Data Services, to take a close look at all aspects of LTI programs.
Participants will learn about LTI practices in the marketplace and have the ability to compare their offerings with those of other participants using competitive market data.
As a participant in any of our CDB or financial services industry compensation surveys, you are also eligible to purchase the Long-Term Incentives, Policies and Practices Report - U.S. The report is available only to participants.
To participate, go to twdataservices.com and download everything you need.
At a Glance
Incentive elements reported on: • LTI award values by salary band, industry classification or organization size measured by revenue • LTI plan prevalence • LTI plan design by award type: stock options, restricted stock/stock units, performance plan awards and stock appreciation rights • Changes in most recent grants and future directions • Stock ownership guidelines and restrictive covenants • The grant process: determination of LTI grant values, award timing and individual participation/awards
Data are presented by: • Salary band • Industry • Organization size measured by revenue
OutputPublished
Custom Long-Term Incentive AnalysisParticipants can purchase a custom analysis and review of their company’s long-term incentive practices. This review will cover award levels, plan design, performance metrics and market trends.
Main menu
Order form
36 twdataservices.com
Contact our Client Care team at +1 800 645 5771 or [email protected] for information on our 2015 Long-Term Incentives, Policies and Practices Survey results webinar.
Request information
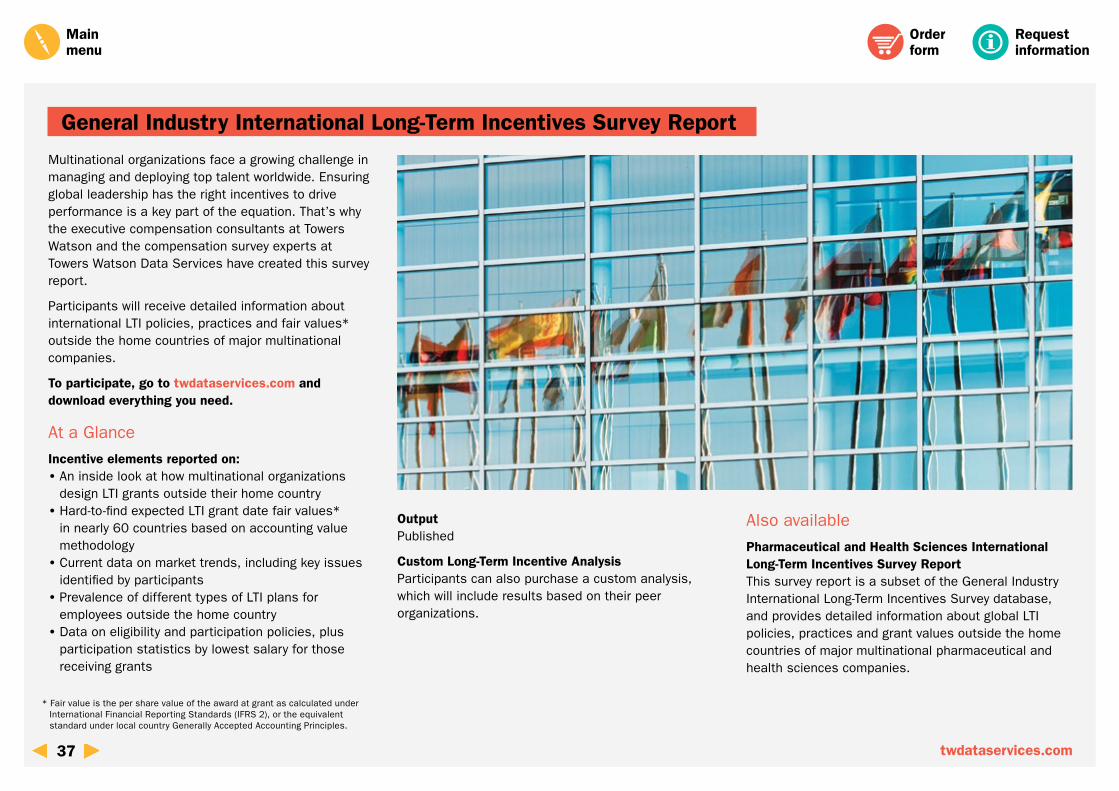
General Industry International Long-Term Incentives Survey Report
Multinational organizations face a growing challenge in managing and deploying top talent worldwide. Ensuring global leadership has the right incentives to drive performance is a key part of the equation. That’s why the executive compensation consultants at Towers Watson and the compensation survey experts at Towers Watson Data Services have created this survey report.
Participants will receive detailed information about international LTI policies, practices and fair values* outside the home countries of major multinational companies.
To participate, go to twdataservices.com and download everything you need.
At a Glance
Incentive elements reported on: • An inside look at how multinational organizations design LTI grants outside their home country • Hard-to-find expected LTI grant date fair values* in nearly 60 countries based on accounting value methodology • Current data on market trends, including key issues identified by participants • Prevalence of different types of LTI plans for employees outside the home country • Data on eligibility and participation policies, plus participation statistics by lowest salary for those receiving grants
OutputPublished
Custom Long-Term Incentive AnalysisParticipants can also purchase a custom analysis, which will include results based on their peer organizations.
Also available
Pharmaceutical and Health Sciences International Long-Term Incentives Survey ReportThis survey report is a subset of the General Industry International Long-Term Incentives Survey database, and provides detailed information about global LTI policies, practices and grant values outside the home countries of major multinational pharmaceutical and health sciences companies.
Main menu
Order form
37 twdataservices.com
* Fair value is the per share value of the award at grant as calculated under International Financial Reporting Standards (IFRS 2), or the equivalent standard under local country Generally Accepted Accounting Principles.
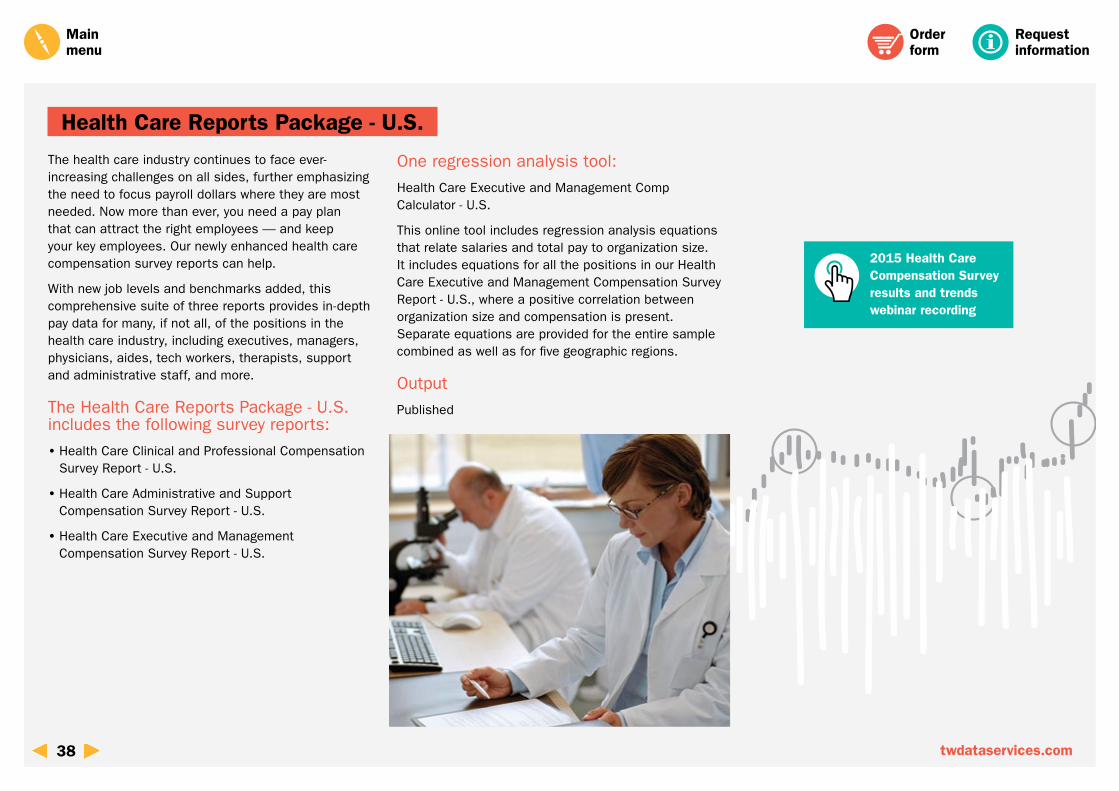
The health care industry continues to face ever-increasing challenges on all sides, further emphasizing the need to focus payroll dollars where they are most needed. Now more than ever, you need a pay plan that can attract the right employees — and keep your key employees. Our newly enhanced health care compensation survey reports can help.
With new job levels and benchmarks added, this comprehensive suite of three reports provides in-depth pay data for many, if not all, of the positions in the health care industry, including executives, managers, physicians, aides, tech workers, therapists, support and administrative staff, and more.
The Health Care Reports Package - U.S. includes the following survey reports:
• Health Care Clinical and Professional Compensation Survey Report - U.S.
• Health Care Administrative and Support Compensation Survey Report - U.S.
• Health Care Executive and Management Compensation Survey Report - U.S.
One regression analysis tool:
Health Care Executive and Management Comp Calculator - U.S.
This online tool includes regression analysis equations that relate salaries and total pay to organization size. It includes equations for all the positions in our Health Care Executive and Management Compensation Survey Report - U.S., where a positive correlation between organization size and compensation is present. Separate equations are provided for the entire sample combined as well as for five geographic regions.
Output
Published
Request information
Health Care Reports Package - U.S.
Main menu
Order form
38 twdataservices.com
2015 Health Care Compensation Survey results and trends webinar recording
Request informationRequest information
Align your compensation with the growing demand for highly skilled health care professionals and emerging specialties with the detailed pay data included in this report. New job levels for professionals and nurses have been added, along with new benchmark jobs, including:
• Nurse Practitioner - Clinical/Outpatient • Physician Assistant - Clinical/Outpatient • Licensed Clinical Social Worker
At a Glance
Compensation elements reported on: • Salaries • Salary ranges • Awards made from bonus and other variable pay plans • Total cash compensation
Data are presented by: • Profit, not-for-profit and government classifications • Geographic area • Industry classification • Employment size • Operating revenue
OutputPublished
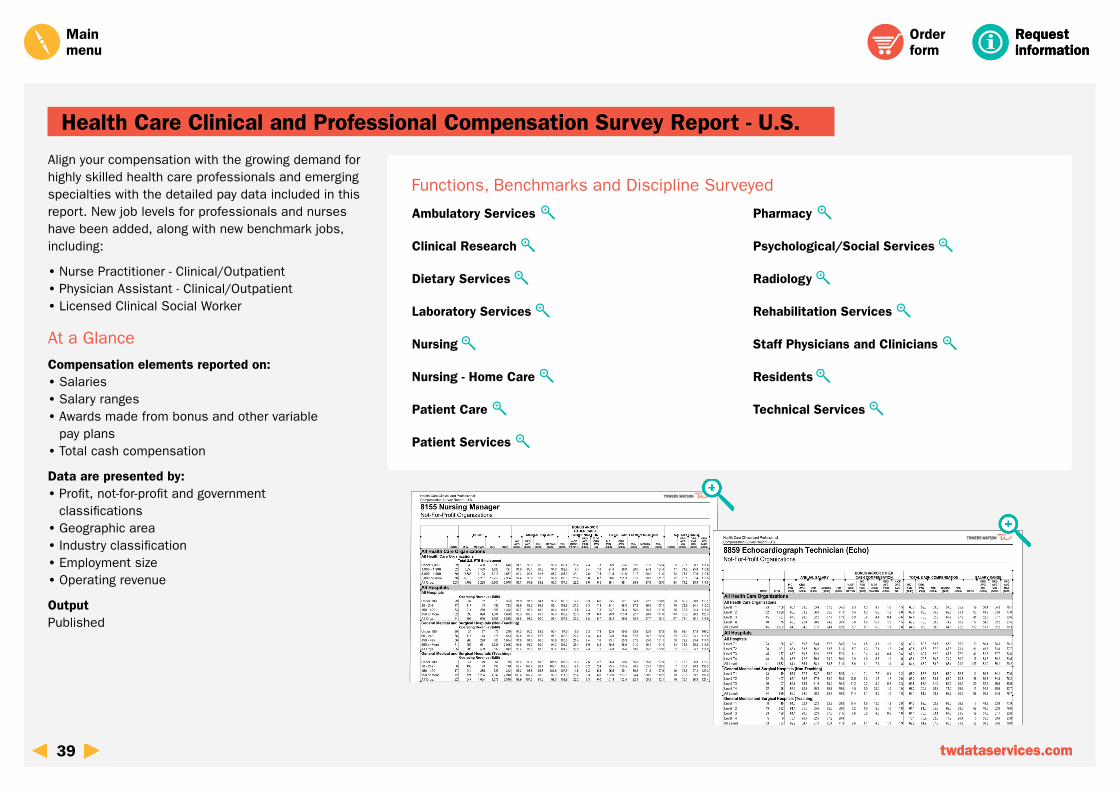
Health Care Clinical and Professional Compensation Survey Report - U.S.
Functions, Benchmarks and Discipline Surveyed
Main menu
Order form
twdataservices.com39 twdataservices.com
Ambulatory Services
Clinical Research
Dietary Services
Laboratory Services
Nursing
Nursing - Home Care
Patient Care
Patient Services
Pharmacy
Psychological/Social Services
Radiology
Rehabilitation Services
Staff Physicians and Clinicians
Residents
Technical Services
Request informationRequest information
Gain access to complete pay data for skilled administrative and support personnel with this newly expanded report.
At a Glance
Compensation elements reported on: • Salaries • Salary ranges • Awards made from bonus and other variable pay plans • Total cash compensation
Data are presented by: • Profit, not-for-profit and government classifications • Geographic area • Industry classification • Employment size • Operating revenue
OutputPublished
Health Care Administrative and Support Compensation Survey Report - U.S.
Functions, Benchmarks and Disciplines Surveyed
Main menu
Order form
twdataservices.com40 twdataservices.com
Administrative/Support Services
Clinical Research
Dietary Services
Environmental Health and Engineering
External and Government Affairs
Finance Service
Health Information Management
Human Resources
Information Systems
Managed Care
Marketing and Account Services
Materials Management
Medical and Clinical Support Services
Patient Services
Pharmacy
Project Management
Quality and Compliance
Safety and Security
Legal
Request information
Receive detailed compensation data for top executives and managers in all types of health care settings as well as data on positions related to health care executive and management personnel with this expanded report, which includes new job levels and more than 180 benchmark jobs.
At a Glance
Compensation elements reported on: • Salaries • Salary ranges • Awards made from bonus and other variable pay plans • Total cash compensation
Data are presented by: • Profit, not-for-profit and government classifications • Geographic area • Industry classification • Employment size • Operating revenue
OutputPublished
Also Available
Health Care Executive and Management Comp Calculator - U.S. This online tool includes thousands of regression analysis equations that relate salaries and total pay to organization size. It includes equations for all the positions in our Health Care Executive and Management Compensation Survey Report - U.S., where a positive correlation between organization size and compensation is present. Separate equations
Request information
Health Care Executive and Management Compensation Survey Report - U.S.
Functions, Benchmarks and Disciplines Surveyed
Request information
are provided for the entire sample combined as well as for five geographic regions.
Output Published
Main menu
Order form
twdataservices.com41 41 twdataservices.com
Top Executive
Administrative/Support Services
Clinical Research
Department Administrators
Dietary Services
External and Government Affairs
Facilities, Environmental Services and Engineering
Financial Services
Health Information Management
Human Resources
Information Systems
Institute/Service Line Directors
Laboratory Services
Legal Services
Marketing, Communications and Account Services
Materials Management
Non-Acute Care
Nursing
Patient Services
Pharmacy
Physician Enterprise
Planning and Development
Psychological/Social Services
Quality and Compliance
Rehabilitation Services
Safety and Security
School of Medicine
Managed Care
Telecommunications
Request informationRequest information
Receive detailed information on a wide variety of current compensation-related issues in the health care industry.
At a Glance
Policies and practices reported on: • Salary administration • Salary increase budgets and range increases • Bonuses and other incentive pay programs • Registered nurse (RN) hiring rates • Shift and pay differentials/premiums • On-call, stand-by or availability pay • Pay for certifications • Holiday pay • Paid leave • Turnover • Recruitment and retention
Data are presented by: • Geographic region • Organization classification and size • Profit status • Industry group
Data also presented by employee group, where appropriate.
OutputPublished
Health Care Compensation Policies and Practices Survey Report - U.S.
Main menu
Order form
twdataservices.comtwdataservices.com42
Request informationRequest information
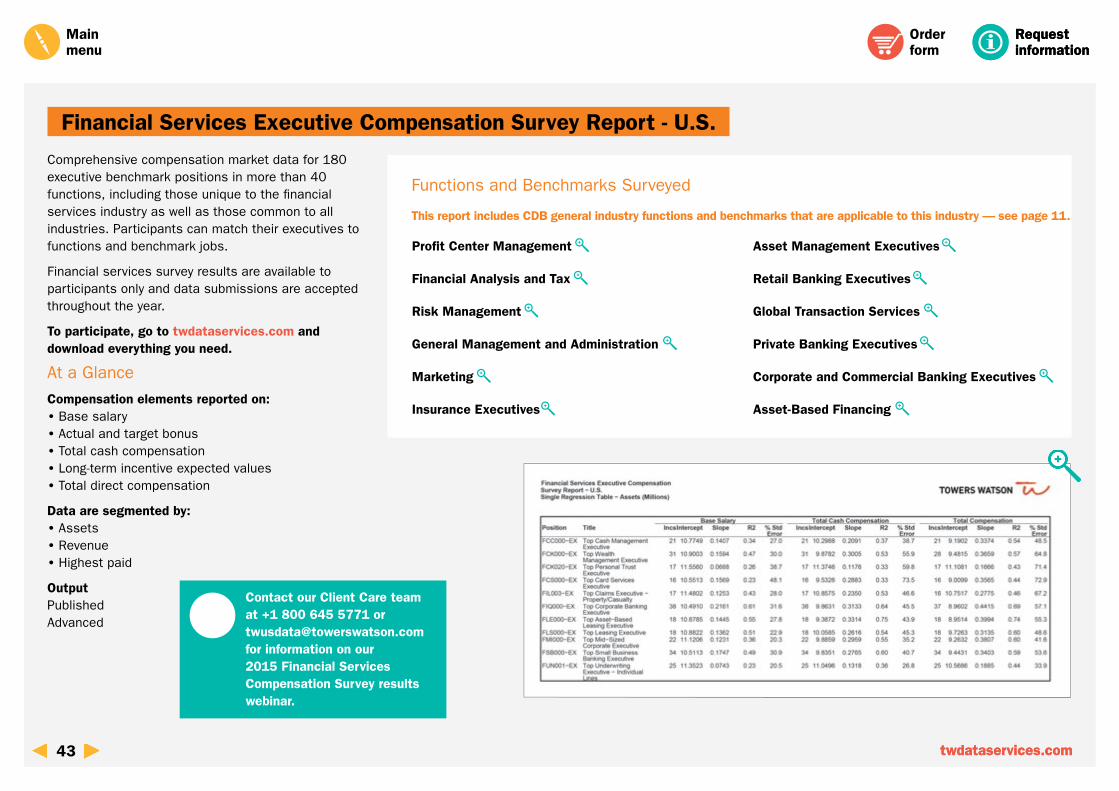
Financial Services Executive Compensation Survey Report - U.S.
Functions and Benchmarks Surveyed
This report includes CDB general industry functions and benchmarks that are applicable to this industry — see page 11.
Comprehensive compensation market data for 180 executive benchmark positions in more than 40 functions, including those unique to the financial services industry as well as those common to all industries. Participants can match their executives to functions and benchmark jobs.
Financial services survey results are available to participants only and data submissions are accepted throughout the year.
To participate, go to twdataservices.com and download everything you need.
At a Glance
Compensation elements reported on: • Base salary • Actual and target bonus • Total cash compensation • Long-term incentive expected values • Total direct compensation
Data are segmented by: • Assets • Revenue • Highest paid
OutputPublished Advanced
Main menu
Contact our Client Care team at +1 800 645 5771 or [email protected] for information on our 2015 Financial Services Compensation Survey results webinar.
Order form
twdataservices.com43 twdataservices.com
Profit Center Management
Financial Analysis and Tax
Risk Management
General Management and Administration
Marketing
Insurance Executives
Asset Management Executives
Retail Banking Executives
Global Transaction Services
Private Banking Executives
Corporate and Commercial Banking Executives
Asset-Based Financing
Request informationRequest information
Detailed pay data on more than 80 functions and over 640 disciplines, including those unique to the financial services industry as well as those common to all industries. Using our career-level methodology, participants can align their internal structures to one of five multilevel career bands and match all or most of their middle management, professional and support jobs to functions and disciplines.
Financial services survey results are available to participants only and data submissions are accepted throughout the year.
To participate, go to twdataservices.com and download everything you need.
At a Glance
Compensation elements reported on: • Base salary • Actual and target bonus • Total cash compensation • Long-term incentive expected values • Total direct compensation
Data are segmented by: • Assets • Revenue • Geographic area
OutputPublished Advanced
Financial Services Middle Management, Professional
and Support Compensation Survey Report - U.S.
Functions and Disciplines SurveyedThis report includes CDB general industry functions and disciplines that are applicable to this industry — see page 13.
Main menu
Order form
twdataservices.com44 twdataservices.com
Financial Analysis and Tax
Audit and Financial/Business Controls
Fraud
Risk Management
Credit Policy/Administration and Collection
IT Development
Securities Operations
Compliance
Legal
Customer Support/Operations
Actuarial (Non-Life)
Actuarial (Life)
Asset Allocation
Asset Management Support
Consumer Branch Staff
Consumer Credit Finance
Digital Banking
Cross Product Transaction Services
Cash Management
Asset Management Client Relationship Management
Private Banking Client Relationship Management
Credit Cards
Cash Management Payment Services
Credit Card Merchant Sales and Service
Asset Management Product Development/ Management
(continued on next page)Asset Management Research
Request informationRequest information
Functions and Disciplines Surveyed
Financial Services Middle Management, Professional
and Support Compensation Survey Report - U.S. (continued)
Main menu
Order form
twdataservices.com45 twdataservices.com
Institutional Custody and Trust Services
Reinsurance Technical Accounts
Alternative Investment Services
Insurance Technical Support
Insurance Medical
Risk Engineer
Asset Based Finance Account Management
Asset Based Finance Sales
Middle Market Commercial Banking
Performance Measurement
Mortgage Origination, Processing and Servicing
Private Banking Portfolio Management
Private Banking Product Development
Business/Commercial Banking Product Development
Financial Advice
Retail Banking Technical/Product Specialists
Fund Management
Foreign Operations
Banking Operations
Fund Accounting
Intermediary Sales (Insurance)
Direct Sales (Insurance)
Agency Sales (Insurance)
Claims (Non-Life)
Real Estate
Claims (Life)
Insurance Product Development
Institutional Services
Private Banking Sales and Marketing
Retail Banking Product Development
Asset Management Sales and Marketing
Small Commercial Banking
Business Banking
Securities Lending
Asset Based Finance Product Management/Development
Asset Finance Technical
Invoice Finance
Private Banking Technical/Product Specialists
Private Banking Support
Trade Services
Underwriting (Non-Life)
Underwriting (Life)
Request informationRequest information
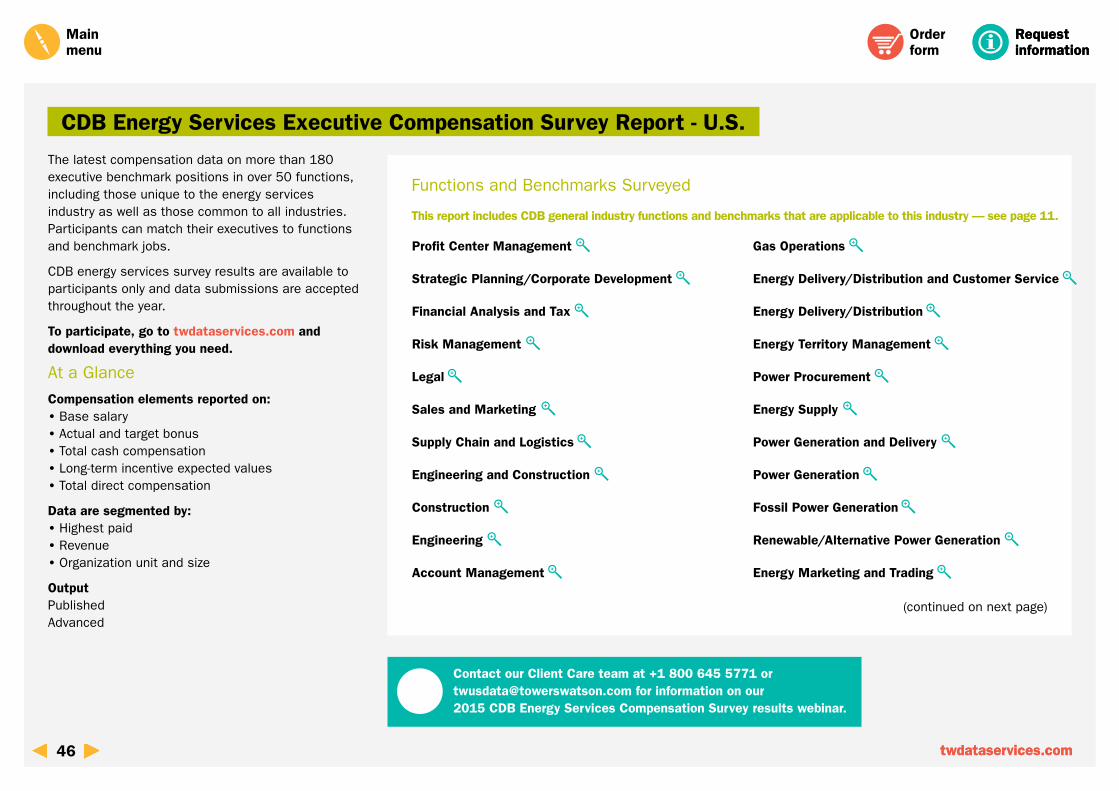
The latest compensation data on more than 180 executive benchmark positions in over 50 functions, including those unique to the energy services industry as well as those common to all industries.Participants can match their executives to functions and benchmark jobs.
CDB energy services survey results are available to participants only and data submissions are accepted throughout the year.
To participate, go to twdataservices.com and download everything you need.
At a Glance
Compensation elements reported on: • Base salary • Actual and target bonus • Total cash compensation • Long-term incentive expected values • Total direct compensation
Data are segmented by: • Highest paid • Revenue • Organization unit and size
OutputPublished Advanced
CDB Energy Services Executive Compensation Survey Report - U.S.
Functions and Benchmarks Surveyed
This report includes CDB general industry functions and benchmarks that are applicable to this industry — see page 11.
Main menu
Contact our Client Care team at +1 800 645 5771 or [email protected] for information on our 2015 CDB Energy Services Compensation Survey results webinar.
Order form
twdataservices.com46 twdataservices.com
Profit Center Management
Strategic Planning/Corporate Development
Financial Analysis and Tax
Risk Management
Legal
Sales and Marketing
Supply Chain and Logistics
Engineering and Construction
Construction
Engineering
Account Management
Gas Operations
Energy Delivery/Distribution and Customer Service
Energy Delivery/Distribution
Energy Territory Management
Power Procurement
Energy Supply
Power Generation and Delivery
Power Generation
Fossil Power Generation
Renewable/Alternative Power Generation
Energy Marketing and Trading
(continued on next page)
Request informationRequest information
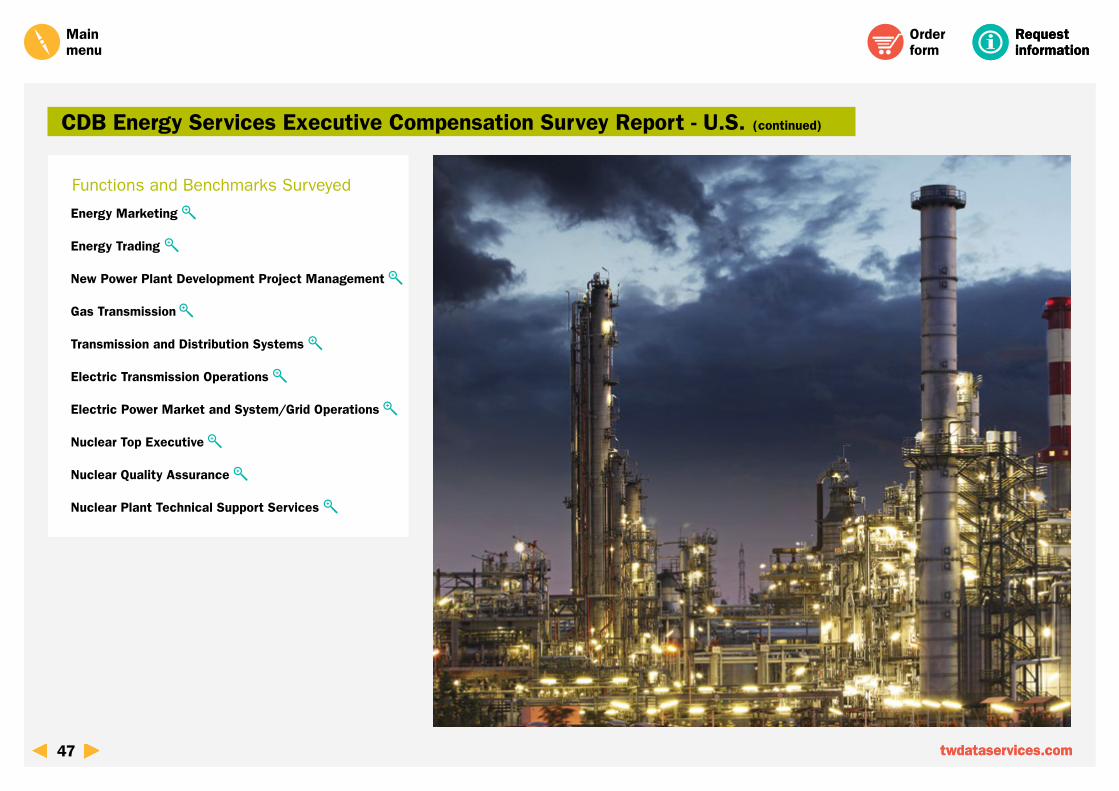
CDB Energy Services Executive Compensation Survey Report - U.S. (continued)
Functions and Benchmarks Surveyed
Main menu
Order form
twdataservices.com47 twdataservices.com
Energy Marketing
Energy Trading
New Power Plant Development Project Management
Gas Transmission
Transmission and Distribution Systems
Electric Transmission Operations
Electric Power Market and System/Grid Operations
Nuclear Top Executive
Nuclear Quality Assurance
Nuclear Plant Technical Support Services
Request informationRequest information
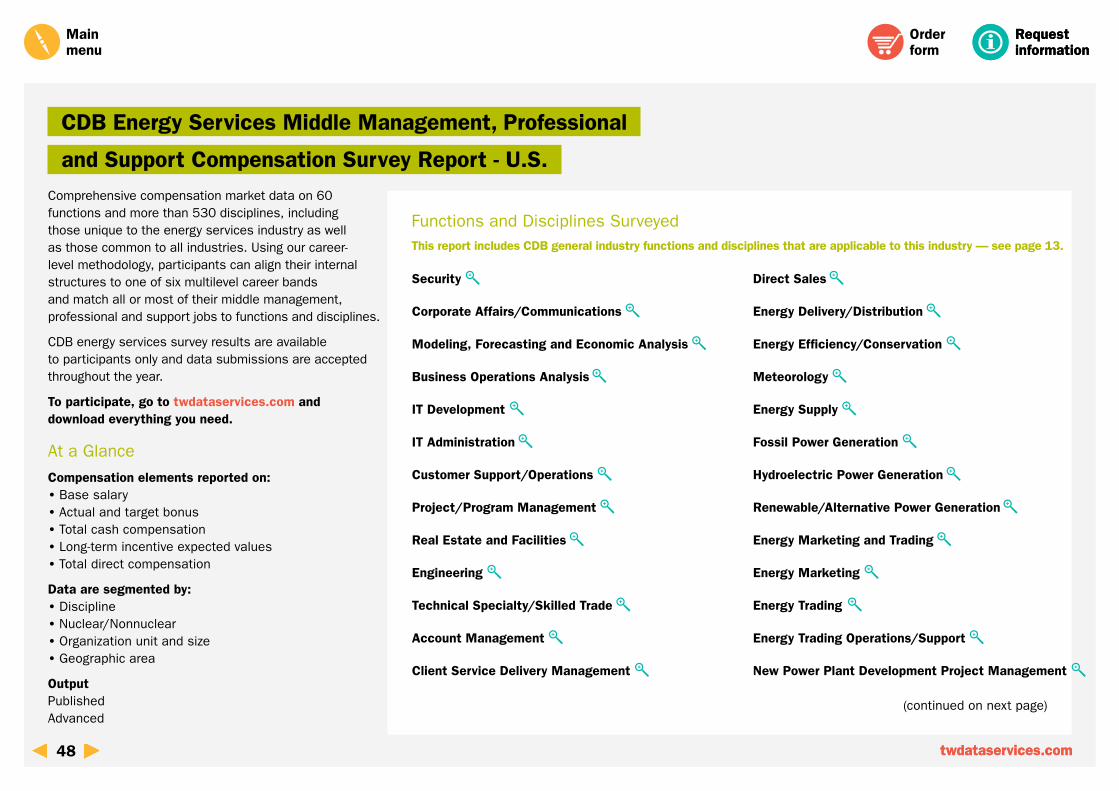
CDB Energy Services Middle Management, Professional
and Support Compensation Survey Report - U.S.
Functions and Disciplines SurveyedThis report includes CDB general industry functions and disciplines that are applicable to this industry — see page 13.
Comprehensive compensation market data on 60 functions and more than 530 disciplines, including those unique to the energy services industry as well as those common to all industries. Using our career-level methodology, participants can align their internal structures to one of six multilevel career bands and match all or most of their middle management, professional and support jobs to functions and disciplines.
CDB energy services survey results are available to participants only and data submissions are accepted throughout the year.
To participate, go to twdataservices.com and download everything you need.
At a Glance
Compensation elements reported on: • Base salary • Actual and target bonus • Total cash compensation • Long-term incentive expected values • Total direct compensation
Data are segmented by: • Discipline • Nuclear/Nonnuclear • Organization unit and size • Geographic area
OutputPublished Advanced
Main menu
Order form
twdataservices.com48 twdataservices.com
Security
Corporate Affairs/Communications
Modeling, Forecasting and Economic Analysis
Business Operations Analysis
IT Development
IT Administration
Customer Support/Operations
Project/Program Management
Real Estate and Facilities
Engineering
Technical Specialty/Skilled Trade
Account Management
Client Service Delivery Management
Direct Sales
Energy Delivery/Distribution
Energy Efficiency/Conservation
Meteorology
Energy Supply
Fossil Power Generation
Hydroelectric Power Generation
Renewable/Alternative Power Generation
Energy Marketing and Trading
Energy Marketing
Energy Trading
Energy Trading Operations/Support
New Power Plant Development Project Management
(continued on next page)
Request informationRequest information
Functions and Disciplines Surveyed
CDB Energy Services Middle Management, Professional
and Support Compensation Survey Report - U.S. (continued)
Main menu
Order form
twdataservices.com49 twdataservices.com
Gas Transmission
Electric Transmission Construction and/or Maintenance
Electric Transmission Operations
Electric System/Grid and Bulk Power Training
Vegetation Management and Forestry
Nuclear Plant Maintenance
Nuclear Plant Operations
Nuclear Quality Assurance
Nuclear Plant Radiation Safety
Nuclear Plant Administrative Support Services
Nuclear Plant Technical Support Services
Nuclear Plant Training
Request informationRequest information
In-depth compensation market data on 20 executive benchmark positions in 10 functions, and more than 50 middle management and professional disciplines unique to energy marketing and trading. Subscribers can match their executives to functions and benchmark job summaries. Using our career-level methodology, participants can align their internal structures to one of six multilevel career bands and match their middle management and professional jobs to functions and disciplines.
CDB energy marketing and trading survey results are available to participants only and data submissions are accepted throughout the year.
To participate, go to twdataservices.com and download everything you need.
At a Glance
Compensation elements reported on: • Base salary • Actual and target bonus • Total cash compensation • Long-term incentive expected values • Total direct compensation
Data are segmented by: • Discipline • Type of commodity • Gross trading and marketing revenues
OutputPublished
CDB Energy Marketing and Trading Compensation Survey Report - U.S.
Functions, Benchmarks and Disciplines Surveyed
Main menu
Order form
twdataservices.com50 twdataservices.com
Profit Center Management
Corporate Affairs/Communications
Strategic Planning/Corporate Development
Modeling, Forecasting and Economic Analysis
Risk Management
Energy Marketing and Trading
Energy Marketing
Energy Trading
Energy Trading Operations/Support
Meteorology
Energy Supply
Request informationRequest information
Current compensation data on more than 185 executive benchmark positions in over 40 functions, including those unique to the high-tech industry as well as those common to all industries. Participants can match their executives to functions and benchmark jobs.
CDB high-tech industry survey results are available to participants only and data submissions are accepted throughout the year.
To participate, go to twdataservices.com and download everything you need.
At a Glance
Compensation elements reported on: • Base salary • Actual and target bonus • Total cash compensation • Long-term incentive expected values • Total direct compensation
Data are segmented by: • Geographic area • Revenue • Organization unit and size
OutputPublished Advanced
CDB High Tech Executive Compensation Survey Report - U.S.
Functions and Benchmarks Surveyed
This report includes CDB general industry functions and benchmarks that are applicable to this industry — see page 11.
Main menu
Order form
twdataservices.com51 twdataservices.com
Engineering
Account Management
Consulting/Professional Services
Outsourcing Services
Technology Product Development
Request informationRequest information
Comprehensive compensation market data on 50 functions and more than 530 disciplines, including those unique to the high-tech industry as well as those common to all industries. Using our career-level methodology, participants can align their internal structures to one of six multilevel career bands and match their middle management, professional and support jobs to functions and disciplines.
CDB high-tech industry survey results are available to participants only and data submissions are accepted throughout the year.
To participate, go to twdataservices.com and download everything you need.
At a Glance
Compensation elements reported on: • Base salary • Actual and target bonus • Total cash compensation • Long-term incentive expected values • Total direct compensation
Data are segmented by: • Geographic area • Revenue • Organization unit and size
OutputPublishedAdvanced
CDB High Tech Middle Management, Professional and Support Compensation Survey Report - U.S.
Functions and Disciplines Surveyed
This report includes CDB general industry functions and disciplines that are applicable to this industry — see page 13.
Main menu
Contact our Client Care team at +1 800 645 5771 or [email protected] for information on our 2015 North America High Tech Compensation Survey results webinar.
Order form
twdataservices.com52 twdataservices.com
Corporate Affairs/Communications
Credit and Collections
Manufacturing/Operations
Project/Program Management
Client Service Development
Engineering
Technical Specialty/Skilled Trade
Account Management
Channel Sales
Direct Sales
Government Sales
Large Deal Acquisition Sales
New Account Acquisition Sales
Telesales
Technical Sales Support
Business Consulting
Technology/Systems Consulting
Technology/Systems Development - External Clients
External Project/Program Management
Technology Product Development
Computer Game Development
Technology Product Development Support

Request informationRequest information
Detailed compensation data for more than 150 executive benchmark positions in over 40 functions, including those unique to the hotel, resort and gaming industry as well as those common to all industries. Participants can match their executives to functions and benchmark jobs.
CDB hotel, resort and gaming survey results are available to participants only and data submissions are accepted throughout the year.
To participate, go to twdataservices.com and download everything you need.
At a Glance
Compensation elements reported on: • Base salary • Actual and target bonus • Total cash compensation • Long-term incentive expected values • Total direct compensation
Data are segmented by: • Revenue • Organization unit and size • Property level
OutputPublished Advanced
CDB Hotel, Resort and Gaming Executive Compensation Survey Report - U.S.
Functions and Benchmarks Surveyed
This report includes CDB general industry functions and benchmarks that are applicable to this industry — see page 11.
Main menu
Order form
twdataservices.com53 twdataservices.com
Profit Center Management
IT Development
Customer Support/Operations
Hospitality Property Development and Acquisitions
Casino Management
Casino Gaming
Casino Money Management
Hospitality Property Design and Construction
Events Management
Food and Beverage
Food Preparation and Operations
Housekeeping and Laundry Services
Health, Sports and Fitness Services
Beauty and Personal Care Services
Request informationRequest information
This report provides detailed compensation data on more than 45 functions and 465 disciplines, including those unique to the hotel, resort and gaming industry as well as those common to all industries. Using our unique career-level methodology, participants can align their internal structures to one of six multilevel career bands and match all or most of their middle management, professional and support jobs to functions and disciplines.
CDB hotel, resort and gaming survey results are available to participants only and data submissions are accepted throughout the year.
To participate, go to twdataservices.com and download everything you need.
At a Glance
Compensation elements reported on: • Base salary • Actual and target bonus • Total cash compensation • Long-term incentive expected values • Total direct compensation
Data are segmented by: • Geographic area • Organization unit and size
OutputPublished Advanced
CDB Hotel, Resort and Gaming Middle Management, Professional and
Support Compensation Survey Report - U.S.
Functions and Disciplines Surveyed
This report includes CDB general industry functions and disciplines that are applicable to this industry — see page 13.
Main menu
Order form
twdataservices.com54 twdataservices.com
Transportation Services and Administration
Security
Corporate Affairs/Communications
Human Resources
IT Development
Marketing
Customer Support/Operations
Project/Program Management
Quality Assurance Methods
Supply Chain and Logistics
Technical Specialty/Skilled Trade
Manual/Unskilled Labor
Account Management
Channel Sales Health, Sports and Fitness Services
Direct Sales Beauty and Personal Care Services
Telesales
Hospitality Property Development and Acquisitions
Casino Management
Casino Gaming
Casino Money Management
Hospitality Property Design and Construction
Events Management
Food and Beverage
Food Preparation and Operations
Beverage
Front Desk/Property Reception
Concierge Services
Housekeeping and Laundry Services
Request informationRequest information
Current compensation data on nearly 150 executive benchmark positions in more than 40 functions, including those unique to the media industry as well as those common to all industries. Participants can match their executives to functions and benchmark jobs.
CDB media survey results are available to participants only and data submissions are accepted throughout the year.
To participate, go to twdataservices.com and download everything you need.
At a Glance
Compensation elements reported on: • Base salary • Actual and target bonus • Total cash compensation • Long-term incentive expected values • Total direct compensation
Data are segmented by: • Revenue • Organization unit and size • Primary medium
Media survey report coverageThe CDB media survey reports segment data by organization unit (e.g., corporate, group and media outlet) and by primary medium, including the following:
CDB Media Executive Compensation Survey Report - U.S.
Functions and Benchmarks Surveyed
This report includes CDB general industry functions and benchmarks that are applicable to this industry — see page 11.
• Book Publishing or Information Services • Consumer Magazine or Business-to-Business Media • Event/Exhibit • Newspaper • Online/Digital
• Radio • TV Network • TV Station
OutputPublished Advanced
Main menu
Contact our Client Care team at +1 800 645 5771 or [email protected] for information on our 2015 CDB Media Compensation Survey results webinar.
Order form
twdataservices.com55 twdataservices.com
Profit Center Management
Sales and Marketing
Marketing
Product Development
Direct Sales
Audience Development/Circulation/Subscription Sales
Advertising Sales and Account Management
Program/Affiliate Licensing Sales and Account Management
Media Business Affairs
Media Operations
Media Programming
Media Production/Development
Media Production Creative Design
Media Post-Production
Broadcast Engineering
Journalism
Online/Digital Content Production and Management
Printed/Recorded Materials Production
Request information
In-depth compensation data on 50 functions and more than 450 disciplines, including those unique to the media industry as well as those common to all industries. Using our career-level methodology, participants can align their internal structures to one of six multilevel career bands and match their middle management, professional and support jobs to functions and disciplines.
CDB media survey results are available to participants only and data submissions are accepted throughout the year.
To participate, go to twdataservices.com and download everything you need.
At a Glance
Compensation elements reported on: • Base salary • Actual and target bonus • Total cash compensation • Long-term incentive expected values • Total direct compensation
Data are segmented by: • Geographic area • Revenue • Organization unit and size • Primary medium
Media survey report coverageThe CDB media survey reports segment data by organization unit (e.g., corporate, group and media outlet) and by primary medium, including the following:
• Book Publishing or Information Services • Consumer Magazine or Business-to-Business Media • Event/Exhibit • Newspaper • Online/Digital • Radio • TV Network • TV Station
OutputPublished Advanced
CDB Media Middle Management, Professional and Support Compensation Survey Report - U.S.
Functions and Disciplines Surveyed
This report includes CDB general industry functions and disciplines that are applicable to this industry — see page 13.
(continued on next page)
Main menu
Order form
twdataservices.comtwdataservices.com56
Administrative Services
Accounting
Financial Analysis and Tax
Risk Management
Marketing
Project/Program Management
Product Development
Product Development Support
Supply Chain Management
Account Management
Channel Sales
Direct Sales
Audience Development/Circulation/ Subscription Sales
Request information
CDB Media Middle Management, Professional and Support Compensation Survey Report - U.S. (continued)
Functions and Disciplines Surveyed
Main menu
Order form
twdataservices.com57
Presenting/On Screen/On Air
Media Production Operations
Media Post-Production
Media Localization/Translation Services
Broadcast Engineering
Journalism
Online/Digital Content Production and Management
Printed/Recorded Materials Production
Event/Exhibit Production and Operations
Advertising Sales and Account Management
Program/Affiliate Licensing Sales and Account Management
Advertising Sales Creative Services
Sales Support and Administration
Media Business Affairs
Media Programming
Media Production/Development
Media Production Creative Design
Request information
Current compensation data on 160 executive benchmark positions in more than 30 functions, including those unique to the pharmaceutical and health sciences industries as well as those common to all industries. Participants can match their executives to functions and benchmark jobs.
CDB pharmaceutical and health sciences survey results are available to participants only and data submissions are accepted throughout the year.
To participate, go to twdataservices.com and download everything you need.
At a Glance
Compensation elements reported on: • Base salary • Actual and target bonus • Total cash compensation • Long-term incentive expected values • Total direct compensation
Data are segmented by: • Scope of responsibility • Revenue • Organization unit and size
OutputPublished Advanced
CDB Pharmaceutical and Health Sciences Executive Compensation Survey Report - U.S.
Functions and Benchmarks Surveyed
This report includes CDB general industry functions and benchmarks that are applicable to this industry — see page 11.
Also Available
Pharmaceutical and Health Sciences International Long-Term Incentives Survey Report For more information about this report, refer to page 37.
Main menu
Order form
twdataservices.com58 twdataservices.com
Top Executive
Profit Center Management
Strategic Planning/Corporate Development
Information Technology
Sales and Marketing
Marketing
Manufacturing and Engineering
Manufacturing/Operations
Project/Program Management
Product Development
Account Management
Medical Representation
Market Access
Pharmaceutical Research and Development
Clinical Development
Drug Discovery Research
Medical Affairs
Drug Development and Preclinical Studies
Medical Regulatory Affairs

Request information
Comprehensive compensation market data on more than 40 functions and over 430 disciplines, including those unique to the pharmaceutical and health sciences industries as well as those common to all industries. Using our career-level methodology, participants can align their internal structures to one of six multilevel career bands and match all or most of their middle management, professional and support jobs to functions and disciplines.
CDB pharmaceutical and health sciences survey results are available to participants only and data submissions are accepted throughout the year.
To participate, go to twdataservices.com and download everything you need.
At a Glance
Compensation elements reported on: • Base salary • Actual and target bonus • Total cash compensation • Long-term incentive expected values • Total direct compensation
Data are segmented by: • Revenue • Scope measures • Geographic region and metropolitan area
OutputPublished Advanced
CDB Pharmaceutical and Health Sciences Middle Management, Professional and Support
Compensation Survey Report - U.S.
Functions and Disciplines Surveyed
This report includes CDB general industry functions and disciplines that are applicable to this industry — see page 13.
Contact our Client Care team at +1 800 645 5771 or [email protected] for information on our 2015 North America Pharmaceutical and Health Sciences Compensation Survey results webinar.
Main menu
Order form
twdataservices.com59
Strategic Planning/Corporate Development
Risk Management
Marketing
Technical Customer Support
Manufacturing and Engineering
Manufacturing/Operations
Project/Program Management
Quality Assurance Methods
Animal Health Sales
Product Development
Account Management
Medical Representation
Channel Sales
Direct Sales
Technical Sales Support
Market Access
Clinical Development
Drug Discovery Research
Medical Affairs
Drug Development and Preclinical Studies
Medical Regulatory Affairs
Request informationRequest information
Compensation market data on nearly 160 executive benchmark positions in more than 45 functions, including those unique to the retail/wholesale industry as well as those common to all industries. Participants can match their executives to functions and benchmark jobs.
CDB retail/wholesale survey results are available to participants only and data submissions are accepted throughout the year.
To participate, go to twdataservices.com and download everything you need.
At a Glance
Compensation elements reported on: • Base salary • Actual and target bonus • Total cash compensation • Long-term incentive expected values • Total direct compensation
Data are segmented by: • Revenue • Organization unit and size
OutputPublished Advanced
CDB Retail/Wholesale Executive Compensation Survey Report - U.S.
Functions and Benchmarks Surveyed
This report includes CDB general industry functions and benchmarks that are applicable to this industry — see page 11.
Main menu
Contact our Client Care team at +1 800 645 5771 or [email protected] for information on our 2015 North America Retail/Wholesale Compensation Survey results webinar.
Order form
twdataservices.com60 twdataservices.com
Profit Center Management
Real Estate and Facilities
Direct Sales
Merchandising
Retail Buying
Design/Product Development
Creative Design
Inventory Control/Loss Prevention
Retail Private Label Sourcing
Franchising
Retail Store Management
Retail Store Operations
Visual Merchandising
Food and Beverage
Technical Design Food Preparation and Operations

Request informationRequest information
Detailed compensation market data on more than 45 functions and nearly 450 disciplines, including those unique to the retail/wholesale industry as well as those common to all industries. Using our career-level methodology, participants can align their internal structures to one of six multilevel career bands and match all or most of their middle management, professional and support jobs to functions and disciplines.
CDB retail/wholesale survey results are available to participants only and data submissions are accepted throughout the year.
To participate, go to twdataservices.com and download everything you need.
At a Glance
Compensation elements reported on: • Base salary • Actual and target bonus • Total cash compensation • Long-term incentive expected values • Total direct compensation
Data are segmented by: • Geographic area • Retail segment • Organization unit and size
OutputPublished Advanced
CDB Retail/Wholesale Middle Management, Professional and
Support Compensation Survey Report - U.S.
Functions and Disciplines Surveyed
This report includes CDB general industry functions and disciplines that are applicable to this industry — see page 13.
Main menu
Order form
twdataservices.com61 twdataservices.com
Corporate Affairs/Communications
Audit and Financial/Business Controls
Human Resources
IT Development
IT Administration
Legal Support
Marketing
Outsourced/Contract Manufacturing
Project/Program Management
Quality Assurance Methods
Real Estate and Facilities
Supply Chain and Logistics
Technical Specialty/Skilled Trade
Retail Store Sales
Merchandising
Retail Buying
Creative Design
Technical Design
Inventory Control/Loss Prevention
Retail Private Label Sourcing
Franchising
Retail Store Management
Retail Store Operations
Retail Store Technical Specialty
Visual Merchandising
Direct Sales Food Preparation and Operations
Food and Beverage
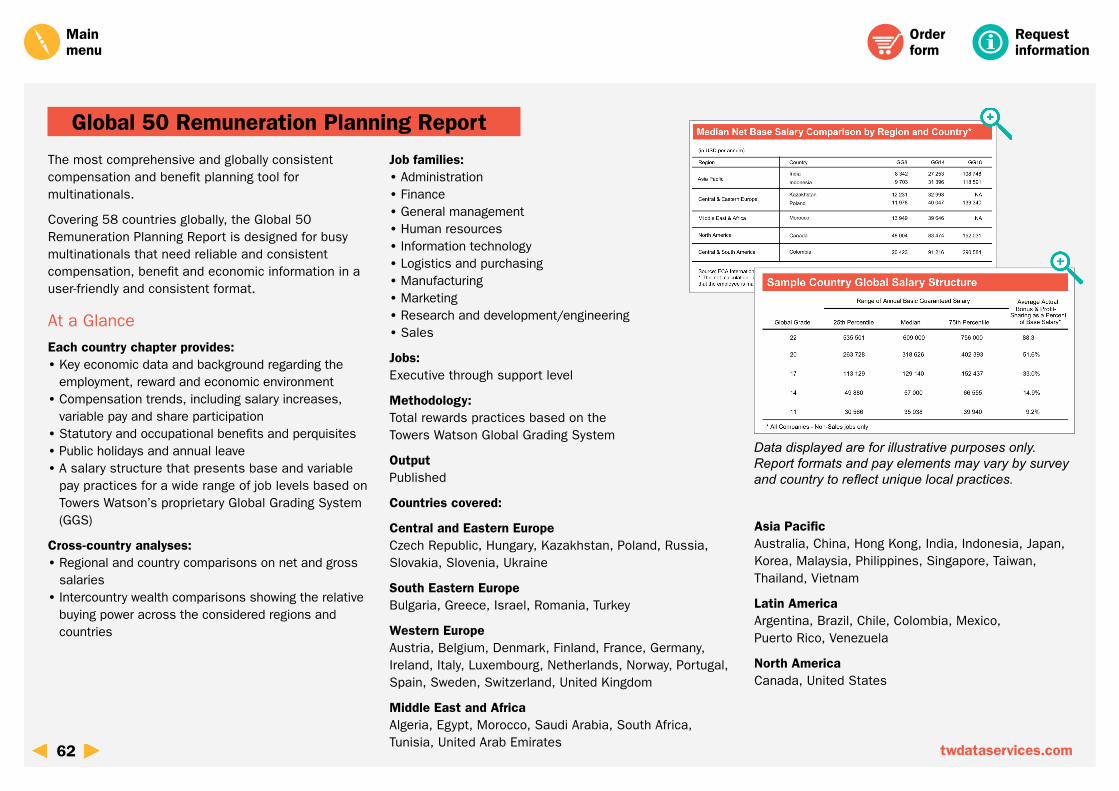
Request information
The most comprehensive and globally consistent compensation and benefit planning tool for multinationals.
Covering 58 countries globally, the Global 50 Remuneration Planning Report is designed for busy multinationals that need reliable and consistent compensation, benefit and economic information in a user-friendly and consistent format.
At a Glance
Each country chapter provides: • Key economic data and background regarding the employment, reward and economic environment • Compensation trends, including salary increases, variable pay and share participation • Statutory and occupational benefits and perquisites • Public holidays and annual leave • A salary structure that presents base and variable pay practices for a wide range of job levels based on Towers Watson’s proprietary Global Grading System (GGS)
Cross-country analyses: • Regional and country comparisons on net and gross salaries • Intercountry wealth comparisons showing the relative buying power across the considered regions and countries
Data displayed are for illustrative purposes only. Report formats and pay elements may vary by survey and country to reflect unique local practices.
Job families: • Administration • Finance • General management • Human resources • Information technology • Logistics and purchasing • Manufacturing • Marketing • Research and development/engineering • Sales
Jobs:Executive through support level
Methodology:Total rewards practices based on the Towers Watson Global Grading System
OutputPublished
Countries covered:
Central and Eastern EuropeCzech Republic, Hungary, Kazakhstan, Poland, Russia, Slovakia, Slovenia, Ukraine
South Eastern EuropeBulgaria, Greece, Israel, Romania, Turkey
Western EuropeAustria, Belgium, Denmark, Finland, France, Germany, Ireland, Italy, Luxembourg, Netherlands, Norway, Portugal, Spain, Sweden, Switzerland, United Kingdom
Middle East and AfricaAlgeria, Egypt, Morocco, Saudi Arabia, South Africa, Tunisia, United Arab Emirates
Asia PacificAustralia, China, Hong Kong, India, Indonesia, Japan, Korea, Malaysia, Philippines, Singapore, Taiwan, Thailand, Vietnam
Latin AmericaArgentina, Brazil, Chile, Colombia, Mexico, Puerto Rico, Venezuela
North AmericaCanada, United States
Global 50 Remuneration Planning Report
Main menu
Order form
62 twdataservices.com
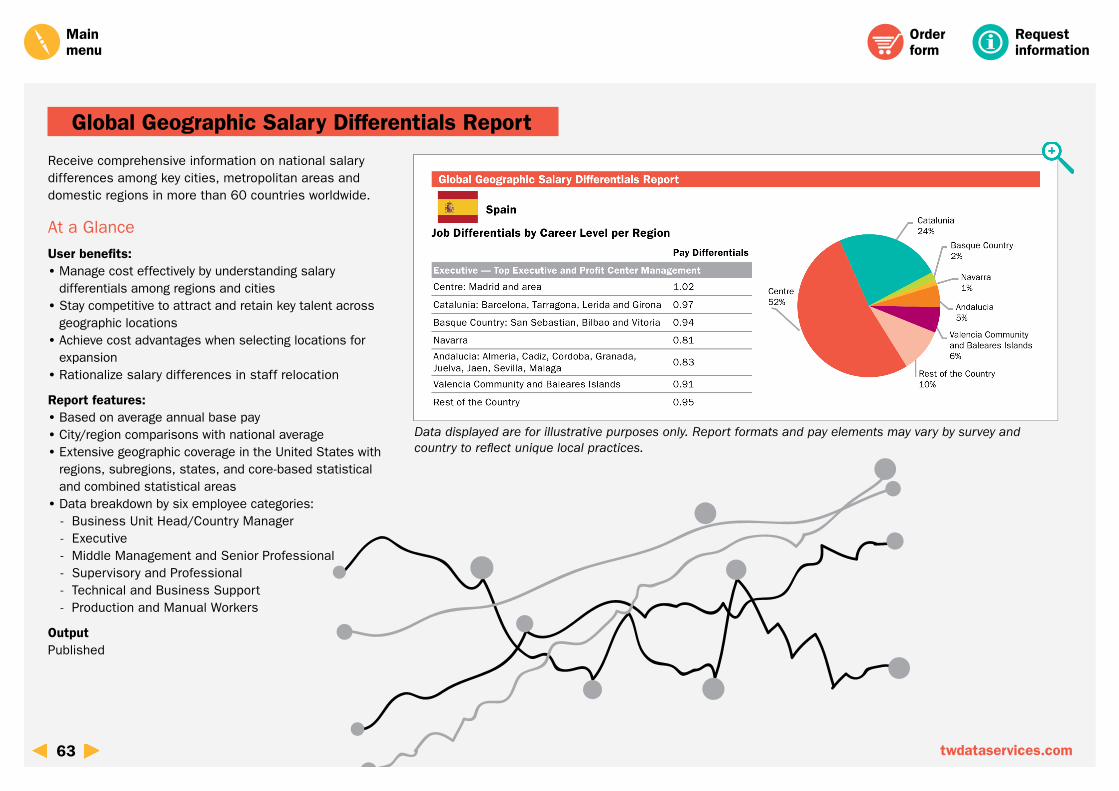
Request information
Receive comprehensive information on national salary differences among key cities, metropolitan areas and domestic regions in more than 60 countries worldwide.
At a Glance
User benefits: • Manage cost effectively by understanding salary differentials among regions and cities • Stay competitive to attract and retain key talent across geographic locations • Achieve cost advantages when selecting locations for expansion • Rationalize salary differences in staff relocation
Report features: • Based on average annual base pay • City/region comparisons with national average • Extensive geographic coverage in the United States with regions, subregions, states, and core-based statistical and combined statistical areas • Data breakdown by six employee categories: - Business Unit Head/Country Manager - Executive - Middle Management and Senior Professional - Supervisory and Professional - Technical and Business Support - Production and Manual Workers
OutputPublished
Global Geographic Salary Differentials Report
Data displayed are for illustrative purposes only. Report formats and pay elements may vary by survey and country to reflect unique local practices.
Main menu
Order form
63 twdataservices.com
Request information
Determine appropriate and competitive pay packages to attract and retain new graduate talent with data from this report, which provides detailed pay data for graduates at varying levels of education for 11 different functions.
At a Glance
User benefits: • Attract talent from different education levels • Maintain competitiveness and cost effectiveness of starting salaries • Save cost in selecting locations for increasing graduate hire
Report features: • Based on base pay of graduate starting salaries • Starting salary comparisons for six education levels: - High School/Secondary School - Post-High School Business/Technical Training - University - Master (excluding M.B.A.) - Master of Business Administration (M.B.A.) - Doctorate (Ph.D.)
• Starting salary for 11 key functions: - Accounting and Finance - Administrative Services - Customer Service/Technical Support - Engineering - Human Resources - Information Technology - Legal - Manufacturing - Marketing - Sales/Business Development - Supply Chain, Logistics and
Procurement
Output • Published
Global Starting Salaries Report
Main menu
Order form
64 twdataservices.com
Request information
Based on the responses from leading local and multinational organizations across 76 countries, the Company Car Benefits Survey Report offers unmatched data and best practices on establishing and administering an attractive car policy.
At a Glance
76 countries across Europe, Middle East and Africa, Asia Pacific and Latin America:
Central and Eastern Europe Azerbaijan, Belarus, Bosnia-Herzegovina, Bulgaria, Croatia, Czech Republic, Estonia, Georgia, Hungary, Kazakhstan, Latvia, Lithuania, Macedonia, Poland, Romania, Russia, Serbia, Slovakia, Slovenia, Turkey, Ukraine
Western Europe Austria, Belgium, Denmark, Finland, France, Germany, Greece, Ireland, Italy, Luxembourg, Netherlands, Norway, Portugal, Spain, Sweden, Switzerland, United Kingdom
Middle East and Africa Algeria, Bahrain, Egypt, Israel, Jordan, Kenya, Kuwait, Lebanon, Morocco, Nigeria, Oman, Pakistan, Qatar, Saudi Arabia, South Africa, Tunisia, United Arab Emirates
Asia Pacific China, Hong Kong, India, Indonesia, Japan, Korea, Malaysia, Philippines, Singapore, Taiwan, Thailand, Vietnam
Latin America Argentina, Brazil, Chile, Colombia, Costa Rica, Mexico, Panama, Peru, Puerto Rico
Car benefits policies and practices: • Trends regarding car/cash allowances and company car alternatives • Tax treatments highlights • Trade-up and trade-down policies • Coverage of fuel costs • Policy related to part-time employees • Garage/parking arrangements • Use of personal cars on business • Accessories and other features • Purchase and lease/rent costs • Financing methods • Replacement periods • Contribution for private use • Chauffeur services • Environmentally friendly initiatives • Highway toll and congestion charges • Armored cars • And much more
Data elements captured: • Actual car makes and models provided • Actual cash allowances amounts • Eligibility for company car or car/cash allowance • Purchase amounts • Leasing/renting amounts (including and excluding maintenance) • Typical benchmark car make and model • Car purchase bonus
OutputPublished
Company Car Benefits Survey Report
Main menu
Order form
65 twdataservices.com
(continued on next page)
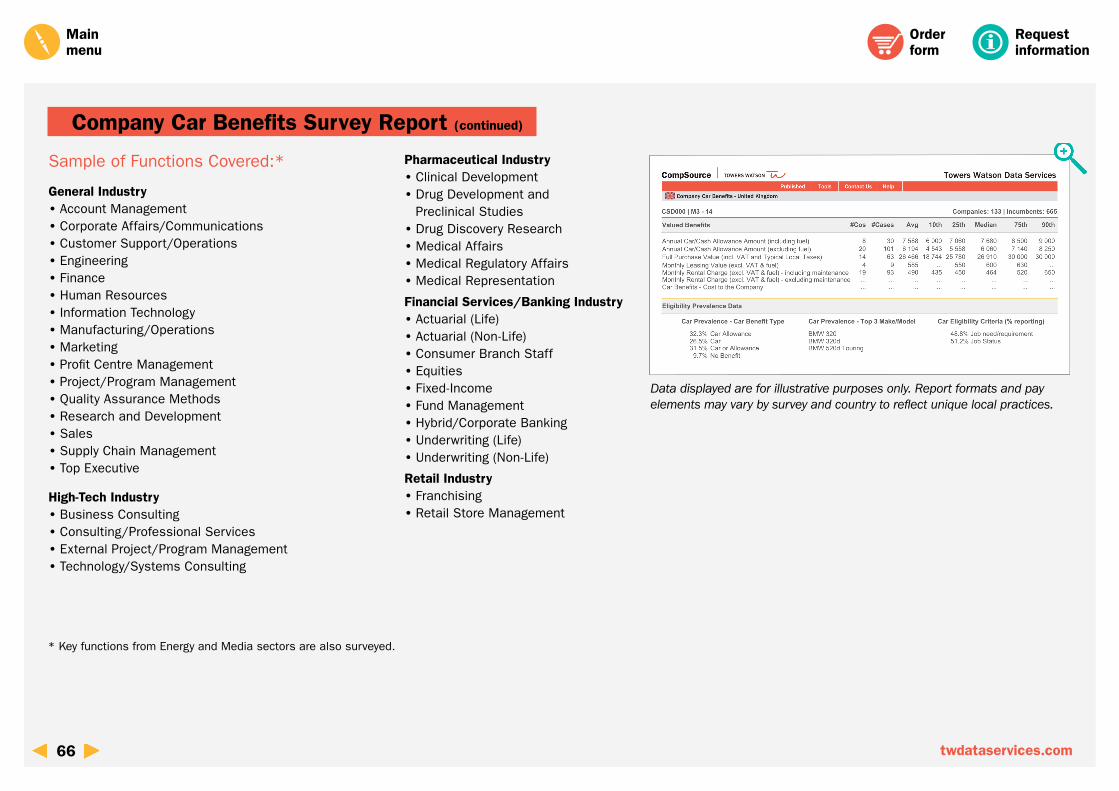
Request information
Sample of Functions Covered:*
General Industry • Account Management • Corporate Affairs/Communications • Customer Support/Operations • Engineering • Finance • Human Resources • Information Technology • Manufacturing/Operations • Marketing • Profit Centre Management • Project/Program Management • Quality Assurance Methods • Research and Development • Sales • Supply Chain Management • Top Executive
High-Tech Industry • Business Consulting • Consulting/Professional Services • External Project/Program Management • Technology/Systems Consulting
Pharmaceutical Industry • Clinical Development • Drug Development and Preclinical Studies • Drug Discovery Research • Medical Affairs • Medical Regulatory Affairs • Medical Representation
Financial Services/Banking Industry • Actuarial (Life) • Actuarial (Non-Life) • Consumer Branch Staff • Equities • Fixed-Income • Fund Management • Hybrid/Corporate Banking • Underwriting (Life) • Underwriting (Non-Life)
Retail Industry • Franchising • Retail Store Management
Company Car Benefits Survey Report (continued)
* Key functions from Energy and Media sectors are also surveyed.
Data displayed are for illustrative purposes only. Report formats and pay elements may vary by survey and country to reflect unique local practices.
Main menu
Order form
66 twdataservices.com
Towers Watson Data ServicesTowers Watson Data Services is a leading provider of compensation, benefits and employment practices information to the global employer community. Our databases are recognized worldwide as a premier source of current data for compensation planning.
Towers Watson Data Services44 South Broadway, 13th Floor White Plains, NY 10601-4411 T +1 800 645 5771 F +1 914 289 3201 [email protected] twdataservices.com
About Towers WatsonTowers Watson is a leading global professional services company that helps organizations improve performance through effective people, risk and financial management. With 16,000 associates around the world, we offer consulting, technology and solutions in the areas of benefits, talent management, rewards, and risk and capital management. Learn more at towerswatson.com.
Copyright © 2015 Towers Watson. All rights reserved.TWDS-NA-2015-66L
twdataservices.com
/company/towerswatson @towerswatson /towerswatson
Request information
Main menu
Order form
67