Products of motor burnout - AHRI Results... · to correlate the quantity of by-products produced...
92
DOE/CE/23810-74 Products of Motor Burnout Final Report Ruth Hawley-Fedder, David Goerz, Carolyn Koester, Michael Wilson Lawrence Livermore National Laboratory University of California Livermore, CA 94551 30 March 1996 Prepared For The Air-Conditioning and Refrigeration Technology Institute Under ARTI MCLR Project Number 660-52200 This program is supported, in part, by U.S. Department of Energy (Office of Building Technology) grant number DE-FG02-91CE23810: Materials Compatibility and Lubricants Research (MCLR) on CFC-Refrigerant Substitutes. Federal funding supporting this program constitutes 93.57% of allowable costs. Funding from non-government sources supporting this program consists of direct costs sharing of 6.43% of allowable costs, and significant in-kind contributions from the air-conditioning and refrigeration industry.
Transcript of Products of motor burnout - AHRI Results... · to correlate the quantity of by-products produced...

DOE/CE/23810-74
Products of Motor BurnoutFinal Report
Ruth Hawley-Fedder, David Goerz, Carolyn Koester, Michael Wilson
Lawrence Livermore National LaboratoryUniversity of CaliforniaLivermore, CA 94551
30 March 1996
Prepared ForThe Air-Conditioning and Refrigeration Technology Institute
UnderARTI MCLR Project Number 660-52200
This program is supported, in part, by U.S. Department of Energy (Office of Building Technology) grant numberDE-FG02-91CE23810: Materials Compatibility and Lubricants Research (MCLR) on CFC-Refrigerant Substitutes. Federalfunding supporting this program constitutes 93.57% of allowable costs. Funding from non-government sources supportingthis program consists of direct costs sharing of 6.43% of allowable costs, and significant in-kind contributions from theair-conditioning and refrigeration industry.

ARTI Final ReportProducts of Motor Burnout
DISCLAIMER
The U.S. Department of Energy's and the air-conditioning industry's support for theMaterial Compatibility and Lubricants Research Program does not constitute anendorsement by the U.S. Department of Energy, nor by the air-conditioning andrefrigeration industry, of the views expressed herein.
NOTICE
This report was prepared on account of work sponsored by the United StatesGovernment. Neither the United States Government, nor the Department of Energy,nor the Air-Conditioning and Refrigeration Technology Institute, nor any of theiremployees, nor of any or their contractors, subcontractors, or their employees, makesany warranty, expressed or implied, or assumes any legal liability or responsibility forthe accuracy, completeness, or usefulness of any information, apparatus, product orprocess disclosed or represents that its use would not infringe privately-owned rights.
COPYRIGHT NOTICE
By acceptance of this article, the publisher and/or recipient acknowledges the right ofthe U.S. Government and the Air-Conditioning and Refrigeration TechnologyInstitutes, Inc. (ARTI) to retain a nonexclusive, royalty-free license in and to anycopyrights covering this paper.
page 2

ARTI Final ReportProducts of Motor Burnout
ABSTRACT
A program was developed to perform (a) identify and quantify the products of motor
burnouts generated through pulsed electrical discharge on three fluids: a) R-22/mineral
oil, (b) R134a/polyolester lubricant, and (c) R-507/polyolester lubricant (50:50 blend of
50% R-125 and 50% R-143). Test conditions were varied in an attempt to identify
whether bench scale testing could be performed which would accurately simulate
actual motor AC carryover conditions. Results of laboratory tests were compared with
a simulated motor AC carryover. Fewer by products were observed after high
temperature/high pressure testing than were seen at atmospheric pressure testing. The
major breakdown products remained the same for all fluids tested. The number of
minor breakdown products decreased slightly. Although the numbers of different
breakdown products decreased, the total amount of breakdown products remained
relatively constant when plotted as a function of energy deposited into the system.
Data presented here shows that bench-scale electrical breakdown testing does not
duplicate motor failure conditions. Examination of the literature, in conjunction with
the limited testing described here, indicates that thermal breakdown testing also does
not accurately predict breakdown products due to an AC carryover motor failure.
SCOPE
I.A. Background:
The Montreal Protocol of 1987 effectively banned a long list of chlorofluorocarbons
(CFCs) traditionally used in air conditioning and refrigeration applications. The
refrigeration and air conditioning industries have responded by developing and testing
new, alternative refrigerants that are less damaging to the atmosphere upon release.
Despite a reputation for quality and reliability, air conditioning systems do
occasionally fail. One of the more common failure modes in a hermetic system is a
motor burnout.
page 3

ARTI Final ReportProducts of Motor Burnout
Motor burnouts can occur by various mechanisms. One of the most common
scenarios is a locked motor rotor, which may result from a damaged bearing. The
resulting electrical motor burnout is caused by overheating of the locked rotor and
subsequent failure of the insulation. This is primarily a thermal breakdown process.
A fewer number of systems which experience a motor burnout failure will do so as a
direct result of an electrical short circuit in the motor. The refrigerant breakdown
products formed as a result of an electrical arc in the fluid volume of a refrigeration
system may differ from those products resulting from a thermal breakdown process.
The products may differ in both type of compound and amount formed. Chemical
products generated during motor burnouts in refrigeration systems may be highly toxic
and/or damaging to system components. In some hermetic motor systems which cycle
on and off (refrigerators, home air conditioning systems), a small electrical arc is
generated within the motor by the electrical contacts engaging and disengaging each
time the motor goes through a cooling cycle. Although the electrical energy deposited
into the fluid by each small arc may be minimal, the cumulative effects on fluid
breakdown may be important.
Lawrence Livermore National Laboratory (LLNL) began investigating the effects of
electrical current discharges (arcing) in CFC's and CFC replacements in 1987. At that
time, a replacement was being sought for the R-113 used in large quantities as a
dielectric and heat transfer medium in pulsed power modulators for high power laser
systems. Many of the candidate replacement fluids were hydrofluorocarbons (HFCs)
and fluorocarbons (FCs). Data on the material safety data sheets indicated the
possibility of formation of highly toxic by-products during thermal breakdown;
however, formation of these by-products under electrical breakdown conditions was
not addressed.
LLNL personnel have designed and constructed a special purpose electrical test stand
to evaluate CFCs and CFC replacement fluids under simulated AC, DC, and
page 4

ARTI Final ReportProducts of Motor Burnout
pulsed breakdown conditions. The test stand includes an electrical diagnostic system
which allows the measurement of breakdown voltage, discharge current, arc power
and energy associated with each pulse. The appropriate data that is collected in order
to correlate the quantity of by-products produced with the pertinent control variables,
such as voltage, current, pulse-width, pulse-repetition-frequency, and energy. Along
with the electrical test stand, LLNL has extensive chemical analysis facilities that
enable us to perform gas chromatographic and gas chromatographic-mass
spectrometric analysis of various fluids to identify and quantify the breakdown
products formed under various scenarios of electrical energy deposition.
In July of 1994, Lawrence Livermore National Laboratory received funding from the
Air Conditioning Research and Technology Institute (ARTI) to perform work
associated with LLNL's proposal titled "Compatibility Problems Resulting from
Products of Motor Burnout." The objectives of the proposed work were:
(1) To identify and quantify the products of motor burnouts in systems
containing (a) R-22/mineral oil, (b) R134a/polyolester lubricant, and (c)
R-507/polyolester lubricant. R-507 is a 50:50 blend of 50% R-125 and
50% R-143.
(2) To assess, based on the existing literature, the toxic nature of the
identified products of motor burnout on humans.
(3) To assess, based upon existing literature, the corrosive effects of the
identified products of motor burnout on the electrical feed through
terminals.
(4) To assess, based upon existing literature, the efficacy of existing
procedures which use filter driers to remove the residual burnout
products
page 5

ARTI Final ReportProducts of Motor Burnout
(5) To assess, based upon existing literature, whether HFC refrigerant/oil
systems are likely to increase or decrease the incidence of motor burnouts
as compared to HCFC/lubricant systems.
The principle focus of this effort has been in support of the first objective. A program
was developed to perform pulsed electrical discharge on the three fluids in question.
Initial electrical discharge experiments were performed on 100 mL samples of fluid
held at atmospheric pressure and temperature. In the second phase of testing, a special
test cell was constructed to perform electrical discharge testing at elevated
temperatures up to 200°C (392°F) and elevated pressures up to 1380 kPa (200 psi).
The final phase of testing was devised to simulate full scale compressor failure
initiated by high electrical stress (arcing). As initially proposed, compressor motors
were to be charged with the specific fluid and then intentionally caused to fail by
applying a high-voltage impulse that would create a lasting arc fed by the normal AC
power to the motor. After difficulties were encountered with induction of an AC
carryover condition in hermetic motors, the final phase of the experimental work was
modified so as to use the original test stand apparatus to simulate a possible AC
carryover arc condition. These experimental difficulties are discussed in detail later in
the report.
The breakdown products formed under the various test scenarios were analyzed by gas
chromatography-mass spectrometry. By-products produced under electrical
breakdown conditions were found to be significantly different in type and quantity
from breakdown products produced under purely thermal conditions. After
identification of breakdown products, a literature search was performed to determine
potential health hazards of breakdown products.
page 6

ARTI Final ReportProducts of Motor Burnout
METHODS
II. Electrical Breakdown Tests
Three types of electrical breakdown tests were performed on each fluid. Tests were
performed at atmospheric pressure and ambient temperature, at elevated temperature
and pressure (temperature to 200°C, pressure dependent upon specific fluid), and
under simulated motor breakdown conditions. Ambient temperature and pressure
testing was performed because this was the method used previously to investigate
breakdown product formation in CFCs and CFC replacements. Elevated temperature
(up to 200°C) and elevated pressure tests (pressure determined by enthalpy conditions
for each fluid) were performed in order to establish breakdown product creation under
more realistic operating conditions. Finally, tests were planned to be performed under
induced motor breakdown conditions in order to determine whether the rate of energy
deposition might be a significant factor in the quantity and type of by-products
produced.
Initial intentions were to perform actual motor breakdown tests, where a suitable
hermetic motor would be charged with the fluid of interest, and then a high-voltage
pulse introduced in such a way as to produce an electrical arc in the fluid space
surrounding the motor. We were unable to introduce such a failure in actual electrical
motors; the electrical input required to induce an internal electrical failure resulting in
an arc was sufficiently high that external arcing occurred first. In order to determine
the breakdown products resulting from high voltages which might occur, for example,
as result of a lighting strike, a simulated motor burnout test was performed. Data from
this test was compared with data from the elevated temperature/pressure and
atmospheric pressure tests, and with data from the literature. However, we feel that,
based upon the experiments described in this report, failure due to massive
overvoltage is an unlikely failure mechanism.
page 7

ARTI Final ReportProducts of Motor Burnout
II.A.1 Atmospheric Pressure Testing
Initial testing involved the use of high impedance impulse injectors to cause electrical
breakdown in the gas or head pressure regions. The purpose of this approach was to
establish the relationship between the amount of energy deposited (in Joules) and the
amount of by-products produced for the selected fluids of interest. Similar injectors
were used for the atmospheric testing and the high-temperature/high-pressure testing.
The test configuration for all three tests are similar and explained in the following
sections.
The test cell (device under test, DUT) is shown in Figure 1.
Figure 1 Block diagram (above) andphotograph (right) showing electrode
placement in test cell
As can be seen in Figure 1, the device under test (DUT; also referred to as the test
cell) is a simple two electrode gap used to hold the selected gas specimen. The
opposing electrodes are labeled A & K to represent anode and cathode respectively.
The electrodes are made of brass, while the housing is constructed from a polyimide
material capable of withstanding the required temperature and pressure. Total cell
volume is 93 mL. The test cell was fitted with suitable ports
page 8

ARTI Final ReportProducts of Motor Burnout
and valves used to introduce and remove the fluid being test, as shown in Figure 2.
Figure 2 Schematic of ambient pressure/temperature test cell
Figure 3 Block Diagram of test stand and diagnostics
page 9

Figure 4 Voltage probe diagram
Figure 4 is a schematic representation of the voltage probe used to monitor the
collapsed voltage drop across the DUT. A current rectifier (CR1) was used to block
the injected high voltage source. CR1 was constructed from 30 fast recovery diodes,
each having an estimated voltage drop of 0.7 volts. Representative electrical
parameters were measured on the DUT during testing. An estimated 6% error was
given to all electrical measurements. Appendix B.1 provides sample waveforms for
each of the selected fluids.
page 10
ARTI Final ReportProducts of Motor Burnout
Figure 3 is a block diagram that illustrates the relationship of the impulse generator,
the device under test (DUT), and the associated diagnostics. A series resistor (R1)
limits the available source current to the DUT and provides the short circuit protection
to the impulse generator. Using the measured voltage and current signals, it is possible
to determine the energy delivered to the DUT.

ARTI Final ReportProducts of Motor Burnout
II.A.2 Sampling and analysis: Prior to the beginning of each test, the test cell was
cleaned with hexane and dried with air. The cell was then filled with the fluid to be
tested and evacuated, using a vacuum pump, to approximately 50-100 millitorr. The
cell was filled and evacuated once more before filling it to 100 kPa (15 psia) with the
fluid to be tested. The fluid was then subjected to the specified number of pulses
before a sample was drawn.
After each test, the fluid was collected in a 10 mL, stainless steel, sampling bottle with
a valve and metal-seal fitting. The sampling bottle had been previously evacuated to
10-6 torr. The sampling bottle was placed on the sampling manifold and the region
between the test cell and the sampling bottle was evacuated to 50-100 mtorr. First, the
valve to the test cell and, then, the valve to the sample bottle were opened and the gas
sample was collected. The sample bottle was fitted to a small manifold that contained
a septum seal. The manifold was evacuated to 50-100 mtorr, the valve to the sample
bottle was opened, and a gas tight syringe (Dynatech Precision Sampling Corp., Baton
Rouge, LA) was used to pierce the septum seal and transfer the fluid into the gas
chromatograph/mass spectrometer (GC/MS).
All samples were analyzed with a Hewlett-Packard GC/MS. A gas tight syringe was
used to transfer 50 µL of gas from the sample bottle to the split/splitless injection inlet
of the GC/MS. The breakdown products were separated using a 105 m, RTX-1 column
(Restek Corp., Bellefonte, PA) with a 0.25-mm i.d. and a 1-µm film thickness. The
analytes were separated using He carrier gas at 210 kPa (30 psig) head pressure. A
splitless injection (0.75 min.) was used and the GC was started at -30°C (held for 13
min.), ramped at 5°C/min. to 150°C, and ramped at 10°C/min. to 300°C (held for 10
min.). The analytes were detected by electron ionization MS. The MS was scanned
from 33 to 500 amu at a rate of 1.1 sec/scans.
page 11

ARTI Final ReportProducts of Motor Burnout
Prior to sample analysis, an injection of 55 ng 1,1,2-trichlorotrifluoroethane (TCTFE)
was made each day to verify that the GC/MS was functioning optimally. Quantitation
of the analytes was accomplished by assuming that the mass spectral responses of the
analytes were the same as that of TCTFE and by comparing the total ion
chromatogram peak areas of analytes to that of the TCTFE external standard. It was
assumed that the calibration curve for the analytes would be linear for the amounts of
analyte detected (i.e. if the mass of analyte injected into the GC/MS is doubled, then
the GC/MS response, measured as peak area in the total ion chromatogram, would also
double). This assumption was valid for the measurement of the breakdown products
formed.
However, the assumption of linear response was not valid for the quantitation of the
starting material (parent fluid). Because- the parent fluid was often present at a
concentration 500 to 1000 times greater than those of the breakdown products, its
response exceeded the linear range of the GC/MS. Thus, a correction factor was
needed to allow the quantitation of the parent fluid based on the GC/MS response of
TCTFE. To correct for nonlinear behavior, the GC/MS response of dichloromethane,
from its linear range to its non-linear range was determined. We assumed that the
parent fluid would behave similarly to dichloromethane. A logarithmic fit described
this curve. Next, we calculated the response that given amounts of dichloromethane
would have, if the GC/MS behaved linearly for all amounts of dichloromethane.
Comparison of these two curves yielded response factors which could be multiplied to
peak areas of the total ion chromatogram which were outside the linear range of the
GC/MS. The corrected peak area was then used, along with the response of the
TCTFE standard, to calculate concentration. Because the approximate amount of
parent fluid which was injected into the GC/MS could be estimated, it was possible to
select appropriate correction factors (ranging from 10 to 40) to calculate the amounts
of parent fluid that were actually present in the sample.
page 12

ARTI Final ReportProducts of Motor Burnout
The concentrations of breakdown products were reported as parts-per-million in the
presence of the parent fluid (i.e. micrograms of breakdown product per gram of parent
fluid). Had the above correction factors not been applied, the concentrations of
breakdown products would have been overestimated by factors of 10-50.
The reproducibility of the GC/MS method was determined by comparing four, 50 µL
injections of a standard gas mixture containing 2.5 µg/mL each of chloromethane,
vinyl chloride, bromomethane, chloroethane, trichlorofluoromethane, and
dichlorodifluoromethane in nitrogen (Restek, Bellefonte, PA). The retention times for
replicate injections of these compounds agreed within 2 seconds. The GC/MS
response, as measured by area counts recorded by the detector, averaged 8% standard
deviation. The standard deviation varied from 4% (for dichlorodifluoromethane and
chloromethane) to 12% (for chloroethane), depending on the compound.
II.B Elevated Temperature and Pressure Testing
The design of the test cell used for the high temperature/high pressure tests was
similar to that described above, with the exception of sampling. The elevated
temperature/pressure test cell had a sample volume of 77 mL. A schematic of the test
cell and sampling apparatus is shown Figure 5.
page 13

Figure 5. Schematic and Photograph of High Temperature/High Pressure Test Cell
page 14
ARTI Final ReportProducts of Motor Burnout

ARTI Final ReportProducts of Motor Burnout
II.B.1 Electrical measurements: Total electrical energy deposited into each of the
fluids under test was measured as described for the ambient pressure/temperature
tests, and is summarized in Table II in Section III. As in the ambient testing a 6%
error is reflected in the electrical measurements. Selected waveforms representing
typical measured electrical parameters are provided in Appendix B.2.
II.B.2 Elevated Temperature/Pressure sampling/analysis procedures: The cell
was prepared and filled to the desired pressure as previously described. The cell was
allowed to heat to 200°C and the test was begun. Because it took several hours for the
cell to reach 200°C, five samples were taken from the same volume of parent fluid.
Samples from the cell were taken at the beginning of the experiment, at 10K pulses, at
50K pulses, at 100K pulses, and at 200K pulses.
The fluid samples were collected in 10 mL, stainless steel, sampling bottles, as
previously described. The fluid sampled was first collected in a smaller (3 mL)
volume on the sampling manifold before it was expanded into the 10 mL sample
bottle. This provided a reduced gas pressure in the sample bottle. The collected gas
was then sampled, as described previously, with a gas tight syringe and injected into
the GC/MS. Analysis and quantitation of the breakdown products and parent fluids
was performed as described previously.
II.C Motor tests
The objective of the simulated motor AC carryover tests was to simulate AC-like
faults within a refrigeration motor-compressor unit, and to quantify and identify the
by-products produced. Previous tests conducted at LLNL, along with the ambient
temperature/pressure and elevated temperature/pressure tests conducted for this work,
indicated that the production of breakdown products was an approximately linear
function of arc energy. The motor carryover tests were designed initially to provide
data collected under realistic fault conditions to compare against the bench-scale data.
The tests were designed to deposit the
page 15

ARTI Final ReportProducts of Motor Burnout
same amount of energy in a single (or a few) AC cycles of millisecond duration as
was deposited in thousands of repetitive discharges of microsecond duration using the
bench-top tester.
The intent of this series of tests was to impose sufficient over voltages on an energized
motor to initiate an arc within the motor compressor housing and maintain the
established arc with the motor's normal operating voltage. In pursuit of this effort,
appropriate temperature range units were procured having internal construction
characteristics allowing for the desired effect. The requirement for establishment of an
internal electrical arc was that motors must have internally exposed electrical
connections which might allow arcing within a vapor region. The focus of these tests
was on electrical breakdown of the refrigerant fluid within an operating
motor-compressor unit, in order to determine by-products produced as a result of
electrical arcing within an operating motor. Other test scenarios which might result in
thermal decomposition (i.e., overheating due to locked rotors) were not investigated.
A simulated AC test bed was used to investigate the effects of AC type of currents on
the selected fluids. The High Voltage Test Facility at LLNL was initially designed to
investigate transient type of impulses on active AC operating systems. The test system
utilized an impulse generator to inject sufficient impulse voltage to over stress the
motor winding in a reasonable time but not allow prime power currents to continue
through the injector circuit. The impulse parameters originally estimated to be
sufficient can be represented by a double exponential waveshape having a rise time of
10 ns to a peak of 20 kV and a fall time of 350 ns to a level that is one half the peak
voltage. The initial peak value of 20 kV was selected to allow for simulator impedance
mismatches. The injection level of a device under test (DUT) was limited to 5 kV. The
5 kV level was selected as below the representative flashover voltage of a typical
duplex outlet (6 kV). The impulse rise time and fall time were estimated based upon
previous work at LLNL in solid dielectric breakdown. Verification of these
page 16

ARTI Final ReportProducts of Motor Burnout
parameters was performed during shakedown tests using reclaimed excess refrigerator
motors.
The initial phase of this effort characterized a representative unit using low level
measurement techniques. Following this high voltage impulses were injected into the
setup unit. An extensive effort was required to modify the unit so that it would not
breakdown externally on the atmospheric side of the housing. The resulting internal
spacing of the exposed electrical inside the test unit far exceeded the test units
capability to withstand the related external fields generated during the initial testing.
As a result the approach to access the AC effects were iterated.
However, after several attempts at exposing a representative test unit to typical
transients without successfully inducing a fault, a simulated motor burnout test was
developed. We believe that the frequency of occurrence of a transient-induced arc is
not a credible environment and/or has a frequency of occurrence less than
1:1,000,000. The attempt to establish a probability of the selected occurrence takes the
following things into consideration: As mentioned above, a typical AC connector will
flashover at a nominal 6 kV. The DUT used to characterize a typical unit flashed over
externally at 9 kV and flashed over internally at 15 kV. Continued attempts to induce
internal AC carryover by extending the impulse duration were not sufficient to cause
the unit to fail. Past experience on highly stressed electrical cables indicate that this
type of environmental exposure to a given system did not induce failure even after
70,000 exposures. Internal motor construction is not meant to operate at these levels
and insulation degradation would be anticipated. Allowing for a representative system
fail frequency of 1:100, and an impulse exposure rate of 1:1000 provides an
accumulative frequency of occurrence of 1:100,000,000. We use a conservative
estimate of 1:1,000,000 for this type of environment causing AC carryover. As a result
of this effort contact to a local vendor to access the observed electrical failure
scenarios was made. Other failure mechanisms in the
page 17

ARTI Final ReportProducts of Motor Burnout
electrical insulation might provide close enough electrical paths that may induce the
operating voltage to go into an arc phase. One example of this failure mechanism
would be overheating scenarios that might be brought on by a locked rotor or a
mechanical wearing scenario of electrical insulation.
II.C.1 Test cell modifications: To investigate AC-type failure current effects a
modification to the initial test plan was made. The initial two electrode test fixture was
taken from the original test stand and inserted into the LLNL AC test bed. Figure 6
illustrates the test configuration used to acquire the data reported for the simulated
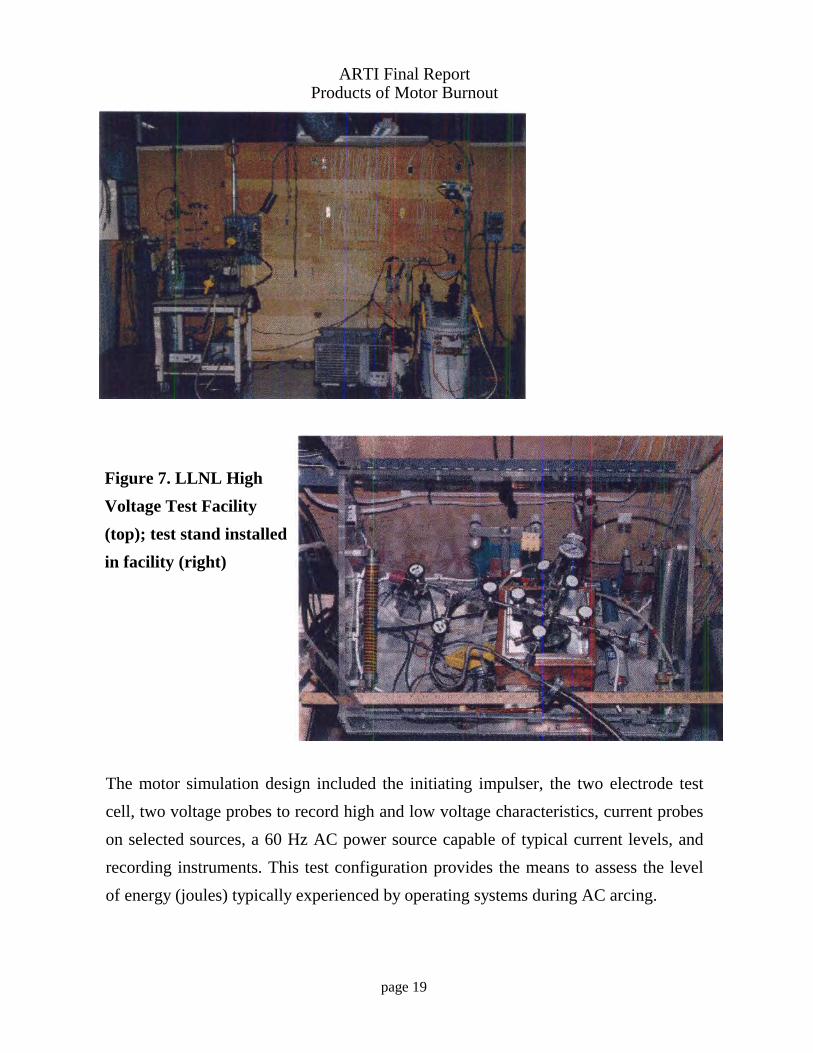
motor AC carry over tests; Figure 7 is a photograph of the high voltage test facility at
LLNL, with the test cell installed in the facility.
Figure 6. Simulated AC carry-over test configuration.
page 18
ARTI Final ReportProducts of Motor Burnout
Figure 7. LLNL High
Voltage Test Facility
(top); test stand installed
in facility (right)
The motor simulation design included the initiating impulser, the two electrode test
cell, two voltage probes to record high and low voltage characteristics, current probes
on selected sources, a 60 Hz AC power source capable of typical current levels, and
recording instruments. This test configuration provides the means to assess the level
of energy (joules) typically experienced by operating systems during AC arcing.
page 19

ARTI Final ReportProducts of Motor Burnout
As in the ambient testing, a 6% error is reflected in the electrical measurements.
Selected waveforms representing typical measured electrical parameters were
collected and are provided in Appendix B. Incomplete testing on R507 restricts the
reporting of that specimen for this environment.
II.C.2 Motor Tests (Modified test stand) sampling/analysis: After the completion
of each test, the resulting fluid was collected in a 10 mL, stainless steel sampling
bottle, analyzed, and the breakdown products and parent fluids were quantified as
described previously.
SIGNIFICANT RESULTS
III.A. Energy Deposition
Electrical testing was divided into three different areas of interest. All testing involved
initiating an impulse pulse. Initial testing was performed with fluids at ambient
temperature and pressure. The second phase of testing involved arcing with fluids held
at elevated pressure and at a temperature of 200°C. The final testing included a
continuing current typical in active AC power circuits. A summary of the injected
electrical energy in joules is given in Table I. Table I shows the amount of electrical
energy injected into the test specimen in joules per impulse, average one half cycle 60
Hz AC, and single exposure with multiple breakdowns in 60 Hz AC. Notice that under
AC conditions an increase of 4 orders of magnitude in energy is delivered to the
device under test. Additional information on the electrical parameters specific to each
test is given in the preceding sections.
page 20

ARTI Final ReportProducts of Motor Burnout
Table I Electrical energy (Joules) deposited into each fluid during testing*
* - note: the ambient T/P and high T/P energy per pulse must be scaled according to
the number of pulses to determine the total energy deposited.
III.B. Atmospheric Pressure/Temperature Testing: A wide variety of breakdown
products were identified in all test scenarios. Identification of breakdown products is
performed by comparison of mass spectra obtained with mass spectra contained in the
following mass spectral libraries:
a. The Wiley/NBS Registry of Mass Spectral Data, F. W. McLafferty and D.
B. Stauffer, John Wiley & Sons, New York, 1989.---112,300 compounds
b. Mass Spectral Library: DuPont Fluorochemicals, personal
communication from Pat Kaczarel, February 11, 1991.---126 compounds
c. The Eight Peak Index of Mass Spectra, 4th Ed., The Mass Spectrometry Data
Centre, The Royal Society of Chemistry, Thomas Graham House, Science Park,
Cambridge, UK, 1991.---81,123 compounds
d. NIST/EPA/NIH Mass Spectral Database, PC Version 4.0, US Department of
Commerce, NIST, Gaithersburg, MD, May 1992. >100,000 compounds.
page 21
R22 R134a 8507 UnitsAmbient
temperature/pressure1.56 E-03 1.80 E-03 3.31 E-03 J/pulse
Hightemperature/pressure
2.54 E-03 3.73 E-03 1.93 E-03 J/pulse
AC singlehalf-cycle exposure
2.53 E+01 2.29 E+01 no test J total
AC multiple cycleexposure
3.80 E+02 3.89 E+02 no test J total

ARTI Final ReportProducts of Motor Burnout
The electrical arcing experiments described in this work produced highly complex
mixtures of breakdown products. In general, few breakdown products were formed
which were lighter than the original material. In both the atmospheric pressure and
elevated temperature and pressure tests, the compounds produced were generally
heavier (higher molecular weight and less volatile) than the starting material.
Chlorodifluoromethane (R-22) was identified in all samples taken, at widely varying
levels. Although the sample cell was cleaned thoroughly between each test and
evacuated prior to filling, the source of the R-22 could not be identified. Formation of
chlorinated breakdown products from R-22 is reasonable; however, R-134a and R-507
do not contain chlorine sources, so that detection of R-22 in these fluids after testing
can only be due to contamination from carry over or other sources, which we were not
able to identify. No other chlorinated breakdown products were identified in R-134a or
R-507 tests.
For all test scenarios, R-22 produced the largest number and variety of breakdown
products; compounds ranged from chlorotrifluoromethane (R-13) to long-chained
chlorinated and/or fluorinated hydrocarbons. R-134a produced the least complex
breakdown products in terms of numbers of different compounds. Table II lists the
compounds produced by each of the fluids during atmospheric pressure testing, with
an indication of the relative amount produced at 100K pulses, or a total energy
deposition 156-331 Joules. Amounts are indicated as high, med, or low, as measured
relative to the parent fluid µg compound/µg parent fluid). High indicates relative
concentrations in the 10-3 range (0.1% or greater when compared to the parent fluid),
medium indicates relative compound concentrations in the 10-4 range, and low
indicates compounds produced at relative concentrations of 10-5 or lower (<100 ppm).
A complete listing of all compounds identified in each test, along with the quantity
relative to the parent fluid, is given in Appendix C.
page 22

ARTI Final ReportProducts of Motor Burnout
Table II. Compounds Produced under atmospheric pressure/ambienttemperature electrical discharge
Compound R-22 R-134a R-507
Chlorodifluoromethane (R22)* High@ High Low1,1,1,2-tetrafluoroethane (R-134a) High@ MedR-507 High@
tetrafluoroethene (R-1114) High High Highhexafluoroethane (R-116) High High1,1-difluoroethene (R-1132a) High1,1-dichloro-2,2-difluoroethene (R-1112a) High1,2-dichloro-1,1,2,2-tetrafluoroethane (R-114) Highdichlorodifluoromethane (R-12) Highhexafluoropropene Hightrifluoroethene High1,1,2-trichloro-1,2,2-trifluoroethane (R-113) Med1,1,3,3-tetrachloro-2,3-difluoropropene Med1,2,2-trichloro-1,1,3,3,3-pentafluoropropane Med1,2-dichloro-1,2-difluoroethene# (R-1113) Med1,2-dichloro-1,3,3,3-tetrafluoro-1-propene# Med1,2-dichloro-tetrafluorocyclobutene# Med1-chloro-1,1,2,2,-tetrafluoroethane (R-124a) Med2-chloro-1,1,3,3,3 - pentafluoro-1-propene Med3-chloro-1,1,2,3,3-pentafluoro-1-propene MedC4F3Cl Med1,3-dichloro-1,1,2,2,3,3-hexafluoropropane (R-216ca) MedCF3CFClCF2Cl Medchlorinated aromatic compound Medchlorinated hydrocarbon (2 Cl; mw=145?) Medchlorinated hydrocarbon (2 Cl; mw=156?) Medchlorofluorohydrocarbon# Medchlorohexafluoropropane Medchloropentafluorobenzene MedCl-CCCF3 Meddichloroethyne Medfluorinated alkane Medhexafluorochlorobutene Medmw=152? mono Cl aromatic? Medtetrachloroethene Medtrans- 1,3,3-trichloro-1-propene Medtrichlorofluoroethene Medtrichlorofluoromethane (R-11) Med
page 23

ARTI Final ReportProducts of Motor Burnout
(Table II continued)
Compound R-22 R-134a R-507trichloropropene Medunknown# Med1,1,3,3,3-pentafluoro-1-propene Med3,3,3-Trifluoro-1-propyne Med1,1,1,6,6,6-hexafluoro-2,4-diyne Low Low1,2,3,4,5,5-hexafluoro-1,3-cyclopentadiene# Low Low1,3-Butadiyne Lowdichlorofluoromethane (R-21) LowC5F5H Lowoctafluoro-1,3,5-Hexatriene Low1,1,2,3,3,3-hexafluoropropane Low3 chloro-1,1,3,3-tetrafluoro-1-propene Low4 - (difluoromethylene)-2,3,3-trifluorocyclobutene LowCH3-substituted pentafluorocyclopentadiene Lowfluorinated hydrocarbon (aliphatic) # Lowhexafluoro-cyclobutene Lowmonochlorinated, CH3-substituted hydrocarbon Low
* - no chlorine source for R-134a or R-507; detection of R-22 must be suspect.@ - in all cases the parent fluid was the major constituent present (>97%).# -multiple isomers detected; highest concentration reported
ASHRAE R-designations are provided where known for compounds listed in Table II;
where the specific isomer is unknown, the parent R-number is listed. A complete
listing of compounds identified with relative concentrations is given in Appendix C.
Tetrafluoroethene (R-1114) was the only common compound detected in all three
fluids under electrical breakdown at atmospheric pressure and temperature. With the
exception of R-22, the major breakdown products produced for all fluids were
two-carbon molecules. Hexafluoroethane (R-116) was produced by both R-134a and
R-507. Tetrafluoroethene was the major breakdown product produced by R-22,
followed by R-12 (dichlorodifluoromethane); both these compounds were produced at
percent
page 24

ARTI Final ReportProducts of Motor Burnout
levels (1.2-1.9%). Dichlorotetrafluoroethane (R-114) was the next most abundant
breakdown product from R-22, found at levels of approximately 0.4%.
Hexachloropropene and dichlorodifluoroethene (R-1112a) were the next most
abundant breakdown products for R-22, present at levels of from 0.1-0.3%. Figure 8
shows the relative amounts of the major breakdown products produced as a function
of energy deposition for R-22.
Figure 8. Major Breakdown products for R-22 as a function of energy,atmospheric pressure/ambient temperature testing.
R-134a and R-507 produced both lesser amounts of breakdown products, and less
complex mixtures than R-22 when tested at ambient temperature and pressure. In the
case of R-134a, tetrafluoroethene (R-1114; 0.4-0.7%), hexafluoroethane (R-116;
0.2%) and trifluoroethene (0.2%) were the major breakdown products. For
page 25

page 26
ARTI Final ReportProducts of Motor Burnout
R-507, tetrafluoroethene was again the major breakdown product, present at 0.4-
0.5%. 1,1-difluoroethene (R-1132a) and hexafluoroethane (R-116) were present at
around 0.2%. Figures 9 and 10 are graphic representations of the amounts of these
breakdown products as a function of energy for R-134a and R-507.
Figure 9. Major Breakdown products for R-134a as a function of energy,atmospheric pressure/ambient temperature testing.

ARTI Final ReportProducts of Motor Burnout
Figure 10. Major Breakdown products for R-507 as a function of energy,atmospheric pressure/ambient temperature testing.
III.C. Elevated Temperature/Pressure Testing: Elevated temperature/pressure
testing with electrical discharges to 200,000 pulses was conducted on R-22 and R-
134a. We were unable to complete electrical breakdown testing of R-507 to these
levels due to conductance by R-507. Although R-507 was found to carry over quickly
when pulsed, it was not able to sustain an arc. R-507 testing was successful only to
77K arcs, at which time the test stand was found to conduct. When disassembled after
sampling, deposits of carbon were observed between the electrodes. These deposits
served as a conductive bridge between the electrodes, preventing the pulsed
breakdown of the fluid. Similar behavior was seen in the simulated motor AC
carryover tests, which prevented the testing of R-507 under these electrical conditions.
R-134a was also found to produce carbon
page 27

ARTI Final ReportProducts of Motor Burnout
upon high temperature/pressure testing, although carbon production did not interfere
with the electrical discharge breakdown.
Final pressure of each fluid under test varied. Pressure was measured through the use
of a pressure transducer mounted on the cell (see figure 5). The high temperature cell
was initially filled to a pressure at equilibrium with the source cylinder. The cell was
then heated to 200°C, and the resulting pressure measured. Fluid test pressures were
1860 kPa (270 psi) for R-507, 1380 kPa (200 psi) for R-22, and 830 kPa (120 psi) for
R-134a. Once the test cell had reached 200°C, the electrical breakdown testing was
initiated.
Fewer by-products were observed after high temperature/high pressure testing than
were seen at atmospheric pressure testing. The major breakdown products remained
the same for all fluids tested. The number of minor breakdown products decreased
slightly. Although the numbers of different breakdown products decreased, the total
amount of breakdown products remained relatively constant when plotted as a
function of energy deposited into the system. Figure 11 is a plot of the total amounts
of breakdown products produced for all fluids as a function of energy. With the
exception of R-22 at ambient temperature and pressure, the amount of breakdown
products produced appears to be approximately linear with respect to energy
deposition. One possible explanation for the anomalous R-22 data is that multiple
discharge arcs may have occurred during breakdown testing which were incorrectly
counted as single events. When the electrical waveforms collected during the R-22
atmospheric pressure testing were analyzed, multiple arcing was observed on at least
one waveform. Waveform data was not taken for every pulse due to instrument
limitations, so the actual amount of multiple arcing cannot be accurately estimated.
page 28

ARTI Final ReportProducts of Motor Burnout
Figure 11. Comparison of total breakdown products as a function of energy foratmospheric pressure and elevated temperature/pressure testing of R-22, R-134a
and R-507.
Figure 12 is a plot of the relative amounts of specific breakdown products for R-22 and
R-134a produced under testing at ambient temperature / pressure and at elevated
temperature / pressure. With the exception of the high levels of R-1114
(tetrafluoroethene) and R-12 (dichlorodifluoromethane) found in the atmospheric
pressure testing of R-22, a general trend of increasing production with increasing
energy deposition can clearly be seen. When the data for figure 12 is replotted without
the ambient temperature and pressure R-22 data, a clearer
page 29

page 30
Figure 12. Relative amounts of specific breakdown products from R-22 andR-134a; solid markers indicate products from ambient temperature andpressure tests, while open markers indicate elevated temperature and pressuretests.
ARTI Final ReportProducts of Motor Burnout
link between energy deposition and breakdown product formation can be seen (Figure
13).

Figure 13. Same as Figure 12 but data from ambient pressure testing of R-22is not plotted.
III.D. Simulated Motor AC Carryover Experiments: Two experiments were
performed to simulate an AC carryover overvoltage event on an electrical motor.
R-22 and R-134a were chosen for these experiments. R-507 was not studied due to
the difficulty in inducing non-conductive arcing in an elevated pressure environment.
The high temperature /pressure test cell was moved to the pulsed power laboratory
and connected to high voltage transformers as described previously (section II.C).
The system was charged with fluid to a pressure that would be expected in a typical
operating system. A single half-cycle current injection was performed, and the fluid
sampled and analyzed.
page 31
ARTI Final ReportProducts of Motor Burnout

ARTI Final ReportProducts of Motor Burnout
The total energy injected into the system was comparable to the maximum energy
injected during both the ambient temperature/pressure tests and the high
temperature/pressure fluid testing. Maximum energy deposition in R-22 ranged from
approximately 150 to 500 Joules; for R-134a, maximum energy deposition ranged
from approximately 180 to 750 joules. The total amount of breakdown products
produced showed the same dependence upon energy that had been observed in
previous ambient and elevated temperature/pressure tests. Figure 14 is a graph of
total breakdown products for all tests.
Figure 14. Total breakdown products produced as a function ofenergy deposition, all fluids, all tests
page 32

ARTI Final ReportProducts of Motor Burnout
Although the total amounts of breakdown products formed under AC carryover testing
was consistent with the apparently linear relationship of energy deposition with
by-product formation, there were important differences in the by-products formed
under AC carryover. The by-products seen in both R-22 and R-134a were less
complex mixtures than had been obtained in previous tests. Only five major
by-products were identified for both R-22 and R-134a. In each case, only one of those
by-products had been identified in previous testing; the other four were new. The
by-products observed and the amounts relative to the parent fluid are given in Table
III.
Table III. Breakdown products formed during AC carryover testing.
amount relative to parent fluidcompound R-22 R-134a
dichlorodifluoromethane (R-12) 0.000733chlorotrifluoromethane (R-13) 0.00510pentafluoroethane (R-125) 0.00232 0.000146trifluoroethane (R-143) 0.00415 0.000359tetrafluoroethane (R-134) 0.0241hexafluoroethane (R-116) 0.0000454trifluoroethene 0.000242difluoroethene (R-1132a) 0.0000190
It is interesting to note that products which were major breakdown products under
ambient and elevated temperature and pressure tests are seen at very low
concentrations under simulated AC carryover tests. For example, for R-22, R-12
(dichlorodifluoromethane) was the major breakdown product under bench-scale
testing. Under simulated AC carryover conditions, R-12 is the least abundant
page 33

ARTI Final ReportProducts of Motor Burnout
breakdown product, and is present at approximately 733 ppm. If we extrapolate the
bench-scale results for R-12 production to a similar energy deposition (380 joules), we
would expect levels of 2500 ppm (elevated T/P) to almost 3% (ambient T/P).
Hexafluoroethane (R-116) was identified as a breakdown product of R-134a under
both bench-scale and simulated AC carryover testing; again, at levels in the AC
carryover sample that were much lower than what would be expected from previous
tests. For an energy deposition of 389 joules (AC carryover), we would expect
formation of 1700 ppm (elevated T/P) to 4000 ppm (ambient T/P) of R-116, rather
than the actual amount detected of 45 ppm. These expectations are shown graphically
in Figure 15.
The differences in types of breakdown products, combined with the different levels
observed, suggest that different mechanisms are controlling the final breakdown
products. Previous work on thermal and shock-wave decomposition of CFCs has
indicated that formation of free radicals is a mechanism by which halocarbon
decomposition occurs (Foon, Millward, Schug, Kargamanov, Xavier). The wide
variety and high levels of breakdown products observed under low pressure conditions
suggests that collisions of free radical species with other free radicals and/or unreacted
starting material is an important process for formation of various breakdown products.
page 34

ARTI Final ReportProducts of Motor Burnout
Figure 15. Variation in production of dichlorodifluoromethane (R-12, circles)and hexafluoroethane (R116, squares) as a function of electrical breakdown
test. Triangles indicate expected R-12 formation; diamonds indicate expectedR-116 formation.
In both the ambient temperature/pressure and elevated temperature/pressure tests,
electrical energy was deposited into the system through pulsing at 100 Hz. This
repeated pulsing provides a steady source of radicals, which can then react through
collisions with other radicals or unreacted molecules, to generate new species. This
steady-state free radical formation would suggest that by-product formation is
dependent upon free-radical collision frequency. A continual influx of radicals may
allow an equilibrium to be established. Under ambient
page 35

ARTI Final ReportProducts of Motor Burnout
temperature and pressure conditions, the radicals formed have relatively fewer
collisions with other radicals or molecules than in the elevated temperature and
pressure condition. The radicals formed under ambient temperature and pressure
conditions may have lifetimes long enough to allow rearrangement to more stable
radicals. This suggests the possibility of thermodynamic control of reaction products.
The observation that both smaller amounts and fewer compounds are formed under
elevated temperature and pressure conditions supports the hypothesis that product
formation under these conditions is controlled by collision rate. In a higher pressure
system, radicals are likely to collide and react relatively soon after formation, and
before they can rearrange to more stable (thermodynamic) isomers. With a relatively
constant influx of radicals, there is opportunity for multiple reactions over a relatively
long period of time; conditions that would be expected to favor formation of a variety
of reaction products.
In the AC carryover tests, an equivalent amount of energy is deposited into the system
in a relatively short period of time, suggesting that the observed reaction products are
governed by kinetics. The system is at high pressure (relative to the ambient
temperature and pressure bench scale tests). Radicals have relatively short lifetimes,
reacting soon after they are formed. By-products are formed quickly; there is not a
continual input of additional radicals that can allow continued reaction and
rearrangements to more complex products.
III.E. Thermal Breakdown of Refrigerants (literature data): CFC and HCFC
degradation, as determined in the laboratory, is dependent on many factors including
the experimental set-up, temperature, the presence of varying types of metal catalysts,
and the presence of various oils (Parmelee, Huttenlocher, Kauffman, Broyer, Chinoy,
Gozzo, DiFelice). Tests of R22 and R134a conducted in sealed tubes at 150-200°C
for 14 days showed that these fluids were stable;
page 36

ARTI Final ReportProducts of Motor Burnout
although various oils mixed with these fluids showed some degradation
(Huttenlocher). Several authors cited in a literature review (Kauffman) demonstrated
that R22 and R134a were stable below 200°C.
However, thermal breakdown of R-22 has been observed under certain conditions.
R-32 (CF2H2), R-23 (CF3H), carbon monoxide, carbon dioxide, methane, and
hydrogen were produced as R-22 (mixed with lubricant) decomposed at 200-250°C in
sealed tubes in the presence of metals; the log of the percentage of R-22 decomposed
increased linearly with temperature up to 250°C (Spauschus). HCl, C2F4,
hexafluoropropylene, C4F8, and CF2ClCF2H (R-124a) have also been observed at
temperatures of 800-950°C (Broyer). The presence of C2F4 as a decomposition
product is not surprising--pyrolysis of R-22 is used to make this monomer, which is
used in the synthesis of Teflon. R-22 pyrolysis at 500-750°C produced HCl, C2F4,
C4F8, C2F3Cl, C2HF4Cl, and trace amounts of perfluoroisobutylene (DiFelice). Bar
graphs showing the major products formed when R22 is thermally degraded are
shown in Figures 16 and 17. Note that both of these experiments were performed at
very different conditions than those present in our reactor--the major differences being
the flow cell configurations and the short residence times of the R-22 in the
experimental cells. In both experiments C2F4 was observed to be a major by-product.
No detailed information was found in the open literature describing the thermal
breakdown products of R-134a and R-507.
page 37

ARTI Final ReportProducts of Motor Burnout
Figure 16. Major break-down products of R22; adapted from Figure 4, ref.Broyer. Experimental conditions: tubular reactor, 4 psig of R22, 0.25 s residencetime in the test reactor; (equivalent energy deposited into R-22 approximately 28
joules).
page 38

ARTI Final ReportProducts of Motor Burnout
Figure 17. Major break-down products of R22; adapted from Table 3, ref.Gozza. Experimental conditions: flow system, 742 mm Hg, reactant mixture of9.5% R22 and 90.5% He, reaction time 0.09 s; equivalent energy deposited in to
R22 approximately 0.27 joules).
In order to verify that the breakdown products observed in the high temperature/ high
pressure electrical breakdown experiments were not due to both thermal and electrical
breakdown of the fluids, thermal breakdown tests were performed. R-22 and R-134
were chosen for the thermal tests. The high temperature/pressure cell was filled and
treated as for a normal high temperature/pressure test, but no electrical breakdown was
initiated. After 4.5 hours (the usual time required to fill the cell, bring it to
temperature, and conduct an electrical breakdown test of 200,000 pulses), a sample
was withdrawn
page 39

ARTI Final ReportProducts of Motor Burnout
using the standard method, and analyzed. R-22 produced five compounds under
thermal breakdown condition; only one of these (dichlorodifluoromethane, R-12) was
also identified in electrical breakdown tests. Table IV lists the compounds and
approximate amounts formed.
Table IV. Compounds identified in R-22 due to thermal breakdown
compound amount (relative to R-22)difluoromethane (R-32) 0.000164trifluoromethane (R-13) 0.000199tetrafluoroethane (R-134) 0.00453dichlorodifluoromethane (R-12) 0.0000298benzene 0.000281
The only breakdown product detected from R-134a was trifluoroethane, which was
detected at a concentration of approximately 170 ppm, relative to R-134a.
Trifluoroethane was not detected in R-134a as a by-product of electrical breakdown at
elevated temperatures. When combined with the observation that the breakdown
products detected under the elevated temperature and pressure conditions differed only
from atmospheric pressure and temperature breakdown products in having a lesser
variety of compounds, this confirms that no by-products due to purely thermal
breakdown were detected in the elevated temperature/pressure tests.
IV. Breakdown Products Materials Compatibility
Data on the compatibility of breakdown products observed with hermetic motor
elements is available through the Air Conditioning and Refrigeration Technology
Institute (ARTI) Refrigerants Database. Several extensive studies of
page 40

ARTI Final ReportProducts of Motor Burnout
materials compatibility with various refrigerants have been performed with financial
support from ARTI and the refrigeration and air conditioning industry. Extensive
references were found in the database describing swell and softening data for various
elastomer and refrigerant combinations (Cavestri, Doerr, Atwood, Hamed). Private
corporation publications also detailed the reactions of various fluorocarbons with a
variety of materials, including metals, elastomers, lubricants and plastics (E.I. duPont
de Nemours). Data was not available for all of the principle breakdown products
formed; for example, no swell or softening data was found for R-1132a, R-1114, or
R-116 (major products observed in R-507 and R-134a), hexafluoropropene, or
R-1112a (major products observed in R-22 under bench scale testing). Studies have
been conducted to investigate materials compatibility between various CFCs and
CFC-replacements with metals, elastomers, polymers, lubricants, lubricant additives.
As an example, R-12 and R-22 have been observed to cause embrittlement of
polyethylene phthalate found in Mylar and Melinex sheet and sleeving insulation, and
separation of varnish from metal surfaces, although the condition of the metal surface
may have contributed to the varnish separation. Certain plastics have been found to be
generally incompatible with refrigerants; these include acrylonitrile-butadiene-styrene
terpolymers, polyphenylene oxide, and polycarbonate.
Although specific analyses for free chloride and fluoride were not performed as a part
of this work, previous experiments at LLNL have shown that HF is formed upon
electrical breakdown of fluorocarbons fluids. Concentrations as high as 11 ppm for
fluoride and 50 ppm chloride were measured in R-123 after 90,000 pulses; the total
energy deposition is unknown but is estimated at approximately 150 Joules (similar to
R-134a ambient temperature/pressure tests, this work). The formation of HF from
fluorocarbons, and (by analogy) HF and HCl from chlorofluorocarbons, is expected to
have a larger effect upon materials compatibility and motor lifetimes than is the
formation of low percent to ppm levels of breakdown products which are also
refrigerants.
page 41

ARTI Final ReportProducts of Motor Burnout
V. Literature Searches
An initial literature and patent search (1965 - 1995) was conducted using the
computer-based Chemical Abstracts and Envirochem databases; a manual search of the
Chemical Abstracts database was performed for the time period 1955-1965. Through
the use of key words and CAS numbers, references related to of "pyrolysis" or "thermal
degradation" of R-22, R-134a, R-125 and R-143a, as well as other CFC-replacements
(R-124, R-142B, R-32, R-134, R-152, R-502) were searched. Approximately 75
articles and patents were identified. Brief abstracts or complete copies of the articles of
interest were obtained. The focus of the many these articles was flash or shock-wave
pyrolysis combined with laser spectroscopy for kinetics studies, or pyrolysis of various
precursors as a route to the formation of tetrafluoroethylene. Very few articles on
thermal stability were identified. Several articles discussing reaction mechanisms of
Freons® in the upper atmosphere were also identified in the literature search. Some of
the articles (Gozzo & Patrick, 1966; Martin & McGee, 1968; Yasuhara & Morita,
1990) covering kinetic reactions contained tables listing various degradation products
identified by GC, GC/MS, or IR spectroscopy. Many of the kinetics references
postulated the formation of CF2 radicals from one- and two-carbon halogenated starting
materials.
The most useful source of information on thermal decomposition of HCFCs was found
in the ARTI Refrigerant Database. Most of the experiments described were from
sealed-tube tests containing mixtures of lubricants and refrigerants with metal catalysts
(steel, iron, copper, aluminum). Temperatures were in general rather low (200°C or
less). Compatibility tests with other materials (lubricants, motor materials and
elastomers) were also conducted at elevated temperatures; however, decomposition of
motor materials or elastomers was generally the primary concern. Several references
described potential methods for the destruction of CFC's (passing over catalysts of
various metals at elevated temperature, microwave induced plasma, RF-plasma);
however, chemical
page 42

ARTI Final ReportProducts of Motor Burnout
analysis was usually aimed at detection of CO, CO2 HCl, HF (for one-carbon species)
or dehydrohalogenation products.
Health and exposure data was taken from the Toxicology, Occupational Medicine &
Environmental Series (TOMES) Plus database. The TOMES system is a
comprehensive collection of proprietary and government databases. The TOMES plus
system includes the databases listed in Table V. Animal test data and human exposure
guidelines were not available for many of the compounds we identified as breakdown
products. The data has been summarized in individual sheet form and is included in
Appendix A.
page 43

ARTI Final ReportProducts of Motor Burnout
Table V. Databases included in the Toxicology, Occupational Medicine &
Environmental Series (TOMES) Plus System
page 44
Database Description
MEDITEXTTM
designed for use by health careprofessionals in treating exposurerange of toxicity physicochemicalparameters
HAZARDTEXTTMinformation for emergency responseand safety personnel clinical effectsrange of toxicity
INFOTEXTTMGeneral Health & Safety informationfor industrial hygiene personnelregulatory information
SARATEXT®
Acute & chronic effects of chemicalslisted on the SARA title III Hazardoussubstance list clinical effects ofexposure range of toxicity .
Hazardous Substance Data Bank(HSDB; from National Libraryof Medicine)
Information on impact of >4000chemical substances on health andenvironment exposure standards andregulations monitoring and analysismethods

ARTI Final ReportProducts of Motor Burnout
(Table V. continued)
page 45
Database DescriptionChemical Hazard ResponseInformation System (CHRIS;form U.S. Coast Guard)
primarily information useful forresponse to aquatic incidents involvinghazardous materials
Oil and HazardousMaterials/Technical AssistanceData System (OHMS/TADS;from U.S. EPA)
primarily information useful forresponse to aquatic incidents involvinghazardous materials
Integrated Risk InformationSystem (IRIS; from U.S. EPA)
contains U.S. EPA health riskassessment information used indetermining safe levels of human andenvironmental exposure
Registry of Toxic Effects ofChemical Substances (RTECS;from NIOSH)
toxicity data on >100,000 substancesextracted from worldwide scientificliterature carcinogenicity, mutagenicity,reproductive hazards acute & chronictoxicology
NIOSH Pocket Guidecritical industrial hygiene data forapproximately 675 chemicals
New Jersey Fact Sheets (from NewJersey Dept. of Health)
generic, non-technical worker safety andtraining information
DOT Emergency Response Guidesprimarily for spill response; containsinformation necessary to identify asubstance, isolate and contain it

ARTI Final ReportProducts of Motor Burnout
VI. Conclusions and Recommendations
The principle focus of this work has been to identify and quantify the products of
motor burnouts in systems containing (a) R-22, (b) R134a, and (c) R-507. Test
conditions were varied in an attempt to identify whether bench scale testing could be
performed which would accurately simulate actual motor AC carryover conditions.
Results of laboratory tests were compared with a simulated motor AC carryover.
Simulated motor AC carryover was done because we were unable to directly induce an
AC carryover failure in a hermetic motor as originally expected. Although we believe
that AC carryover failures are still possible in hermetic motors, the likelihood and
frequency of these failures is unknown.
Data presented here has shown that bench-scale electrical breakdown testing does not
duplicate motor failure conditions. Examination of the literature, in conjunction with
the limited testing described here, indicates that thermal breakdown testing also does
not accurately predict breakdown products due to an AC carryover motor failure.
Although some common breakdown products were observed in all tests conducted, the
majority of the by-products and the relative amounts formed under simulated AC
carryover conditions are significantly different than in bench-scale electrical
breakdown tests or from thermal breakdown only. Laboratory bench-scale breakdown
experiments produced highly complex mixtures. Both thermal and simulated AC
carryover experiments produced relatively few by-products. By-products from
bench-scale testing ranged from two carbon to six carbon molecules, with few single
carbon species. AC carryover produced only one and two carbon species, as did
thermal breakdown; however, R-12 was the only by-product observed in both thermal
and electrical breakdown of R-22.
page 46

ARTI Final ReportProducts of Motor Burnout
An assessment of the probability and mechanism of purely electrical breakdown with
resulting AC carryover in hermetic motors is required before additional testing should
be undertaken. If a likely mechanism for this type of failure is identified, a more
accurate simulation can be designed. The by-products produced from this simulation
can then be compared with actual motor breakdown events.
COMPLIANCE WITH AGREEMENT
Modifications from the original scope of the proposed work have been discussed in
section II.C. Due to funding limitations, no action was taken to assess the efficacy of
cleanup procedures using filter driers for the removal of by-products. Based upon the
research reported herein, it was not possible to formulate any conclusions concerning
whether HFC refrigerant/oil systems are likely to increase or decrease the incidence of
motor burnouts as compared to HCFC/lubricant systems.
PRINCIPAL INVESTIGATOR EFFORT
The principal investigator, Ms. Ruth Hawley-Fedder, Ph.D., has directed and
performed the necessary activities for the completion of this contract.
page 47

ARTI Final ReportProducts of Motor Burnout
REFERENCES
1. H. M. Parmelee, ASHRAE Transactions, No. 1924, p. 154-168.
2. D. F. Huttenlocher, "Chemical and Thermal Stability of Refrigerant-Lubricant
Mixtures with Metals", Final Report for Air-Conditioning and Refrigeration
Technology Institute under ARTI MCLR Project Number 650-50200, 1992.
3. R. Kauffman, "Accelerated Screening Methods for Determining Chemical and
Thermal Stability of Refrigerant-Lubricant Mixtures Part I: Method Assessment",
Final Report for Air-Conditioning and Refrigeration Technology Institute under ARTI
MCLR Project Number 655-51500, 1993.
4. E. Broyer, A. Y. Bekker, A. B. Ritter, Ind. Eng. Chem. Res., 27(1),.208-11, 1988.
5. P. B. Chinoy, P. D. Sunavala, Ing. Eng. Chem. Res., 26(7), 1340-4, 1988.
6. F. Gozzo, C. R. Patrick, Tetrahedron, 22, 3329-36, 1966.
7. J. J. DiFelice, E. R. Ritter, Chemical and Physical Processes in Combustion, 1993
Fall Technical Meeting, Eastern States Section of the Combustion Institute, 113-6,
October 1993, Princeton, NJ.
8. H. O. Spauschus, G. C. Doderer, ASHRAE Transactions, 71, 162-7, 1965.
9. A. Yasuhara., M. Morita Chemosphere 21(4-5) 479-486 (1990)
10. W.J. Martin, H.A. McGee, Jr., J. Phys. Chem. 72(2) 738-740 (1968)
11. R. Foon, K.P Schug, Molecular Rate Processes Symposium, E3.1-E3.6, August,
1995, Royal Austrailian Chemical Institute, Warburton, Austrailia
page 48

ARTI Final ReportProducts of Motor Burnout
12. G.E. Millward, E. Tschuikow-Roux, J. Phys. Chem. 76(3) 292-298 (1972)
13. K.P. Schug, H.G. Wagner, F. Zabel, Ber. Bunsenges. Phys. Chem 83(2) 167-175
(1979)
14. N.D. Kargamanov, Yu. A. Kolbanovskii, K. A. Soshinskii, Khim. Fiz. 11(4)
566-570 (1992)
15. I.M. Xavier Jr., K.N. Walzl, M.R. Giorgi, A. Kuppermann, Collison Processes of
Ion, Positron, Electron and Photon Beams with Matter, 378-387, Proceedings of the
Latin American School of Physics, August 2-24, 1991 (Published 1992)
16. R.C. Cavestri, "Compatibility of Refrigerants and Lubricants with Engineering
Plastics", report DOE/CE/23810-15, Sept 1993 (rev. Dec. 1993)
17. R.G. Doerr, S.A. Kujak, "Compatibility of Refrigerants and Lubricants with
Electrical Sheet Insulation", Proceeding of the 45th Annual International Appliance
Technical Conference, University of Wisconsin, Madison, WI, May 911,1994 pages
493-504 (May 1994)
18. T. Atwood, E.M. Clark, R.C. Downing, M.O. Mc Linden, Refrigerants, ASHRAE
Handbook D Fundamentals, published by the American Society of Heating,
Refrigeration, and Air-Conditioning Engineers, Atlanta 16.1-16.10 (1989) and
updates (1993)
19. R.G. Doerr, S.A. Kujak, ASHRAE Journal 35(8) 42-47 (1993)
20. G.R. Hamed, R.H. Seiple, O. Taikum, "Compatability of Refrigerants and
Lubricants with Elastomers", report DOE/CE/23810-14 Jan. 1994
page 49

ARTI Final ReportProducts of Motor Burnout
21. Freon® Fluorocarbons Properties and Applications, bulletin G-1, E.I. duPont de
Nemours and Company, Inc., Wilmington, DE, March 1985
page 50

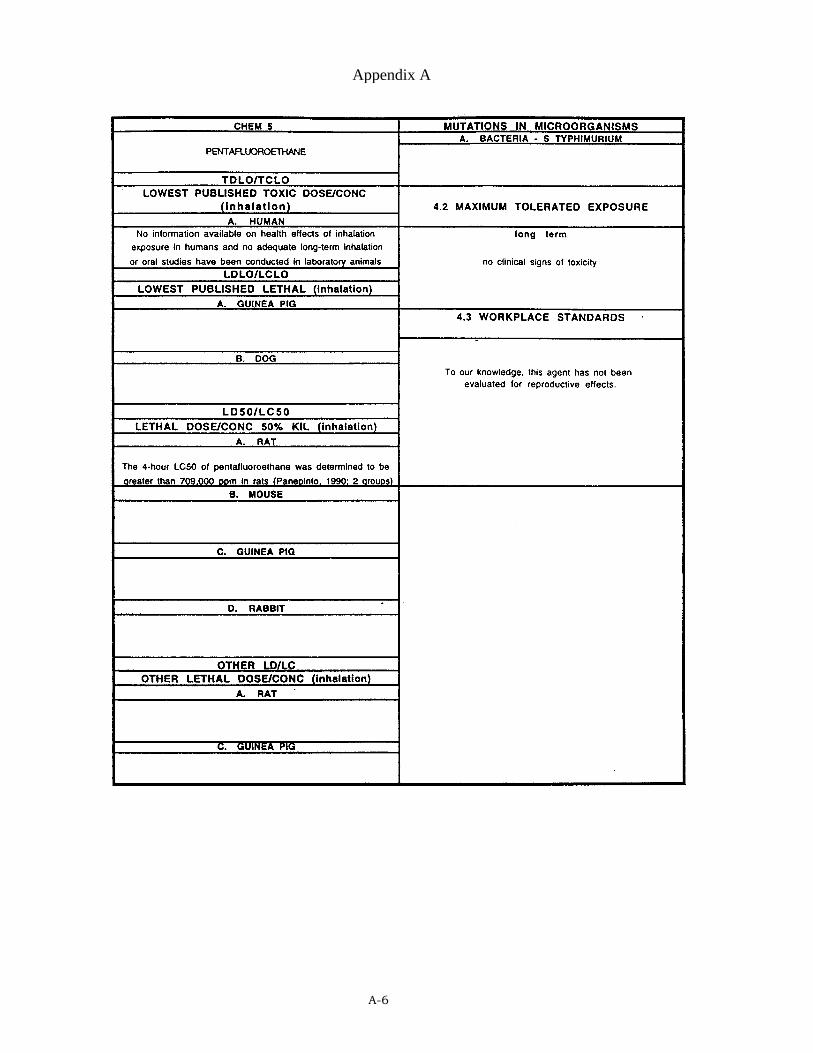
Appendix A
Appendix A. Health and Exposure Data for Selected Breakdown Products
Exposure data was not available for all compounds identified by mass spectral analysis. Datawas investigated only for breakdown products present at medium to high concentrations(above 100 ppm). The table below lists the compounds for which industrial hygiene data weresought and the file name used to identify the data. For those files where no data is indicated,no exposure data was identified in the TOMES database.
Compound Name FileName Comments Registry #1,2-dichloro-1,1,2,2-tetrafluoroethane (R-114) CHEMl 76-14-2
1,1,1-trifluoroethane (R-143a) CHEM2 RTECS no data 420-46-2
tetrafluoroethene (R-1114) CHEM3 116-14-3
1,1,1,2-tetrafluoroethane (R-134a) CHEM4 811-97-2
pentafluoroethane (R-125) CHEM5 354-33-6
hexafluoroethane (R-116) CHEM6 76-16-4
hexafluoropropene CHEM7 116-15-4
dichlorodifluoromethane (R-12) CHEM8 75-71-8
chlorodifluoromethane (R-22) CHEM9 75-45-6
1,1-dichloro-2,2-difluoroethene (R-1112a) CHEM10 RTECS Only 79-35-6
1,2-dichloro-l,2-difluoroethene CHEM11 Not In TOMES
chloropentafluoroethane (R-115) CHEM12 76-15-3
1,1,-difluoroethene (R-1132a) CHEM13 75-38-7
trifluoroethene CHEM14 HSDB;no data 359-11-5
1,2-dichloro-hexafluoropropane CHEM15 Not In TOMES
1,2,2-trichloro-pentafluoropropane CHEM16 RTECS Only 1599-41-3
1-chloro-3,3,3-trifluoro-propyne CHEM17 RTECS Only 460-35-5
3-chloropentafluoropropene CHEM18 RTECS Only 79-47-0
dichloroethyne CHEM19 7572-29-4
trichlorofluoroethene CHEM20 Not In TOMES
trichlorofluoromethane (R-11) CHEM21 75-69-4
1-chloro-1,1,2,2-tetrafluoroethane (R-124a) CHEM22 RTECS Only 354-25-6
1,1,3,3,3-pentafluoropropene CHEM23 Not In TOMES
2-chloropentafluoropropene CHEM24 Not In TOMES
1,2-dichlorotetrafluorocyclobutene CHEM25 Not In TOMES
trichloropropene CHEM26 Not In TOMES
1,3-dichloro-hexafluoropropane CHEM27 Not In TOMES
1,1,2-trichloro-1,2,2-trifluoroethane (R-113) CHEM28 76-13-1
chloropentafluorobenzene CHEM29 RTECS Only 344-07-0
1,1,3,3-tetrachloro-2,3-difluoropropene CHEM30 Not In TOMES
1,2-dichloro-1,3,3,3,-tetrafluoropropene CHEM31 Not In TOMES
chlorohexafluoropropane CHEM32 Not In TOMES
3,3,3-trifluoropropyne CHEM33 75-43-4
dichlorofluoromethane (R-21) CHEM34 Not In TOMES
1,1,1,6,6,6-hexafluoro-hexa-2,4-di-yne CHEM35 Not In TOMES
1,1,1,3,3,3-hexafluoropropane CHEM36 Not In TOMES
A-1

Appendix A
A-2

Appendix A
A-3

Appendix A
A-4

Appendix A
A-5
Appendix A
A-6

Appendix A
A-7

Appendix A
A-8

Appendix A
A-9

Appendix A
A-10

Appendix A
A-11

Appendix A
A-12

Appendix A
A-13

Appendix A
A-14

Appendix A
A-15

Appendix A
A-16

Appendix A
A-17

Appendix A
A-18

Appendix A
A-19

Appendix A
A-20

Appendix B
This appendix provides the electrical measurements used to determine theelectrical characteristics used in the Final Report.
B.1 The following section provides representative electrical data on selectedambient gas exposures to impulse arcing.
Figure B.1.1 The amount of voltagemeasured across the device under test(DUT) represents a voltage dropacross a gap during the high currentconduction phase. A typicalwaveform measured across a DUT ofR22 during atmospheric testing isillustrated in the adjacent figure. Thehorizontal dimension is 20 µs perdivision and the vertical displacementis 50 volts per division.
Figure B.1.2 The amount of currentmeasured through the DUT representsthe increased current observed duringthe conduction phase. A typicalwaveform indicating current asmeasured by a current transformerthrough R22 during atmospherictesting is illustrated in the adjacentfigure. The horizontal dimension is20 µs per division and the verticaldisplacement is 0.5 amperes perdivision.
B-1

B-2
Figure B.1.4 Integrating the powerdelivered to the specimen an energy perbreakdown can be measured. A typicalresulting waveform is illustrated in theadjacent figure. Shown is the energy injoules as a function of time for R22under initial ambient conditions. Thehorizontal dimension is 20 µs perdivision and the vertical displacement is0.001 joules per division.
Figure B.1.3 The resulting product ofthe voltage and current represents thepower across the DUT. Illustrated inthe adjacent figure is a functional viewof the power as a function of timeacross a DUT specimen of R22. Thehorizontal dimension is 20 µs perdivision and the vertical displacementis 50 watts per division.
Appendix B

Appendix B
Figure B.1.5 The amount of voltagemeasured across the device under testDUT represents a voltage drop across agap during the high current conductionphase. A typical waveform measuredacross a DUT of R134a duringatmospheric testing is illustrated in theadjacent figure. The horizontaldimension is 20 µs per division and thevertical displacement is 50 volts perdivision.
Figure B.1.6 The amount of currentmeasured through the DUT representsthe increased current observed duringthe conduction phase. A typicalwaveform indicating current asmeasured by a current transformerthrough R134a during atmospherictesting is illustrated in the adjacentfigure. The horizontal dimension is20 µs per division and the verticaldisplacement is 0.5 amperes perdivision.
Figure B.1.7 The resulting product ofthe voltage and current represents thepower across the DUT. Illustrated inthe adjacent figure is a functional viewof the power as a function of timeacross a DUT specimen of R134a. Thehorizontal dimension is 20 µs perdivision and the vertical displacementis 50 watts per division.
B-3

B-4
Figure B.1.10 The amount of currentmeasured through the DUT representsthe increased current observed duringthe conduction phase. A typicalwaveform indicating current asmeasured by a current transformerthrough R507 during atmospherictesting is illustrated in the adjacentfigure. The horizontal dimension is20 µs per division and the verticaldisplacement is 0.5 amperes perdivision.
Figure B.1.9 The amount of voltagemeasured across the DUT represents avoltage drop across a gap during thehigh current conduction phase. Atypical waveform measured across aDUT of R507 during atmospherictesting is illustrated in the adjacentfigure. The horizontal dimension is 20µs per division and the verticaldisplacement is 50 volts per division.
Figure B.1.8 As above byintegrating the power delivered tothe specimen an energy perbreakdown can be measured. Atypical resulting waveform isillustrated in the adjacent figure.Shown is the energy in joules as afunction of time for R134a underinitial ambient conditions. Thehorizontal dimension is 20 µs perdivision and the verticaldisplacement is 0.001 joules perdivision.
Appendix B

Appendix B
Figure B.1.11 The resulting productof the voltage and current representsthe power across the DUT. Illustratedin the adjacent figure is a functionalview of the power as a function oftime across a DUT specimen of R507.The horizontal dimension is 20 µs perdivision and the vertical displacementis 50 watts per division.
Figure B.1.12 As above byintegrating the power delivered tothe specimen an energy perbreakdown can be measured. Atypical resulting waveform isillustrated in the adjacent figure.Shown is the energy in joules as afunction of time for R507 underinitial ambient conditions. Thehorizontal dimension is 20 µs perdivision and the verticaldisplacement is 0.001 joules perdivision.
B-5

B-6
Figure B.2.2 The amount of currentmeasured through the DUT representsthe increased current observed duringthe conduction phase. A typicalwaveform indicating current asmeasured by a current transformerthrough R22 during elevatedtemperature and pressure testing isillustrated in the adjacent figure. Thehorizontal dimension is 20 µs perdivision and the vertical displacementis 0.5 amperes per division.
Figure B.2.1 The amount of voltagemeasured across the DUT represents avoltage drop across a gap during thehigh current conduction phase. Atypical waveform measured across aDUT of R22 during elevatedtemperature and pressure testing isillustrated in the adjacent figure. Thehorizontal dimension is 20 µs perdivision and the vertical displacementis 100 volts per division.
Figure B.2 Test performed at elevated temperature and pressure arereported and include the following electrical parameters.
Appendix B

Appendix B
Figure B.2.3 The resulting product ofthe voltage and current represents thepower across the DUT. Illustrated inthe adjacent figure is a functional viewof the power as a function of timeacross a DUT specimen of R22. Thehorizontal dimension is 20 µs perdivision and the vertical displacementis 50 watts per division.
Figure B.2.4 Integrating the powerdelivered to the specimen an energyper breakdown can be measured. Atypical resulting waveform isillustrated in the adjacent figure.Shown is the energy in joules as afunction of time for R22 underelevated temperature and pressureconditions. The horizontal dimensionis 20 µs per division and the verticaldisplacement is 0.001 joules perdivision.
Figure B.2.5 The amount of voltagemeasured across the DUT represents avoltage drop across a gap during thehigh current conduction phase. Atypical waveform measured across aDUT of R134a during elevatedtemperature and pressure testing isillustrated in the adjacent figure. Thehorizontal dimension is 20 µs perdivision and the vertical displacementis 100 volts per division.
B-7

B-8
Figure B.2.7 The resulting product ofthe voltage and current represents thepower across the DUT. Illustrated inthe adjacent figure is a functional viewof the power as a function of timeacross a DUT specimen of R134a. Thehorizontal dimension is 20 µs perdivision and the vertical displacementis 50 watts per division.
Figure B.2.6 The amount of currentmeasured through the DUT representsthe increased current observed duringthe conduction phase. A typicalwaveform indicating current asmeasured by a current transformerthrough R134a during elevatedtemperature and pressure testing isillustrated in the adjacent figure. Thehorizontal dimension is 20 µs perdivision and the vertical displacementis 0.5 amperes per division.
Appendix B

Appendix B
Figure B.2.8 As above by integratingthe power delivered to the specimenan energy per breakdown can bemeasured. A typical resultingwaveform is illustrated in theadjacent figure. Shown is the energyin joules as a function of time forR134a under elevated temperatureand pressure conditions. Thehorizontal dimension is 20 µs perdivision and the vertical displacementis 0.001 joules per division.
Figure B.2.9 The amount of voltagemeasured across the DUT represents avoltage drop across a gap during thehigh current conduction phase. Atypical waveform measured across aDUT of R507 during elevatedtemperature and pressure testing isillustrated in the adjacent figure. Thehorizontal dimension is 20 µs perdivision and the vertical displacementis 100 volts per division.
Figure B.2.10 The amount of currentmeasured through the DUT representsthe increased current observed duringthe conduction phase. A typicalwaveform indicating current asmeasured by a current transformerthrough R507 during elevatedtemperature and pressure testing isillustrated in the adjacent figure. Thehorizontal dimension is 20 µs perdivision and the vertical displacementis 0.5 amperes per division.
B-9

B-10
Figure B.2.12 As above byintegrating the power delivered to thespecimen an energy per breakdowncan be measured. A typical resultingwaveform is illustrated in theadjacent figure. Shown is the energyin joules as a function of time forR507 under elevated temperature andpressure conditions. The horizontaldimension is 20 µs per division andthe vertical displacement is 0.001joules per division.
Figure B.2.11 The resulting productof the voltage and current representsthe power across the DUT. Illustratedin the adjacent figure is a functionalview of the power as a function oftime across a DUT specimen of R507.The horizontal dimension is 20 µs perdivision and the vertical displacementis 50 watts per division.
Appendix B

Appendix C R-22
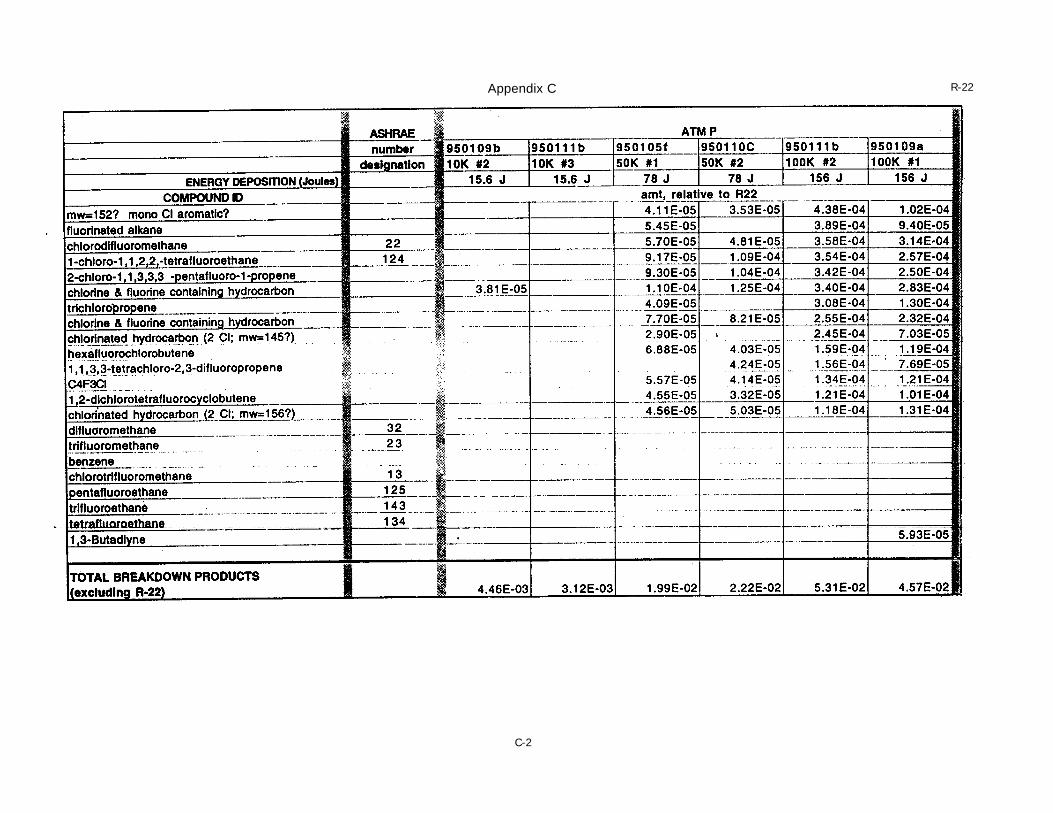
C-2
Appendix C R-22

Appendix C R-22

C-4
Appendix C R-22

Appendix C R-22

C-6
Appendix C R-22

Appendix C R-22

Appendix C
C-8
R-22

C-9
Appendix CR-134a

Appendix C
C-10
R-134a

C-11
Appendix CR-507

C-12
R-507

![WELCOME [arozinfamily.com]arozinfamily.com/images/Arozin Product PPT Eng.pdf · Consumers often correlate good products with premium pricing. But Arozin offers products at highest](https://static.fdocuments.us/doc/165x107/5f77fee8988a62439e3330f0/welcome-product-ppt-engpdf-consumers-often-correlate-good-products-with-premium.jpg)