Productivity Trends - Centre for the Study of Living Standards · ... Summary of Productivity...
67
111 Sparks Street, Suite 500 Ottawa, Ontario K1P 5B5 Tel: 613-233-8891 – Fax: 613-233-8250 [email protected] Report on Productivity Trends in Selected Natural Resource Industries in Canada CSLS Research Report 2004-06 October, 2004 Report Prepared by the Centre for the Study of Living Standards for Natural Resources Canada
Transcript of Productivity Trends - Centre for the Study of Living Standards · ... Summary of Productivity...

111 Sparks Street, Suite 500 Ottawa, Ontario K1P 5B5
Tel: 613-233-8891 – Fax: 613-233-8250 [email protected]
Report on Productivity Trends in Selected Natural Resource Industries in Canada
CSLS Research Report 2004-06 October, 2004
Report Prepared by the Centre for the Study of Living Standards for Natural Resources Canada


Report on Productivity Trends in
Selected Natural Resource Industries in Canada Table of Contents Abstract..............................................................................................................................1 Executive Summary ..........................................................................................................3 Introduction.......................................................................................................................7
I. Context........................................................................................................7 II. Methodology...............................................................................................8 III. The Importance of Productivity ................................................................10 IV. Main Findings of the Report .....................................................................13
Part One: Summary of Productivity Trends in Mining Industries ...........................14
I. Productivity in the Canadian Coal Mining Industry .................................14 II. Productivity in the Canadian Gold Mining Industry.................................18 III. The Future of Diamond Mining in Canada...............................................22
Part Two: Summary of Productivity Trends in Energy Industries ...........................26
I. Productivity in the Canadian Electric Power Generation Industry...........26 II. Productivity in the Canadian Oil and Gas Extraction Industry ................31
Part Three: Summary of Productivity Trends in Forest Product Industries ...........37
I. Productivity in the Canadian Logging and Forestry Industry...................37 II. Productivity in the Canadian Wood Products Industry.............................41 III. Productivity in the Canadian Paper and Allied Products Industry ..........45
Part Four: The Earth Sciences ......................................................................................50
I. Introduction to the Earth Sciences Industries ...........................................50 II. Technology and the Development of Earth Sciences ...............................51 III. The Impact of Earth Sciences on Natural Resource Industries.................52 IV. Key Observations......................................................................................53

Part Five: Synthesis of the Main Lessons from the Productivity Experiences of High and Low Productivity Growth Natural Resource Industries .....................................55
I. Assessing Productivity Performance ........................................................55 II. Lessons from the Productivity Experience of Selected Natural Resource
Industries ..................................................................................................57 III. Policy Levers to Improve Productivity Growth........................................61
Part Six: Conclusions......................................................................................................62

Report on Productivity Trends in Selected Natural Resource Industries in Canada
Abstract The purpose of this report is to shed light on the dynamics and determinants of productivity growth in nine selected natural resource industries and in the overall natural resource sector in Canada. This report provides a concise review of the findings of a detailed analysis undertaken by the Centre for the Study of Living Standards for Natural Resources Canada. The importance of productivity growth is reviewed, and observations are made on the contribution of natural resource industries to aggregate productivity growth; brief summaries on productivity and its determinants are presented for each of the nine industries; and the findings are synthesized into lessons for the natural resource sector as a whole. Some of the main findings are that: natural resource industries contribute disproportionately to aggregate productivity growth in Canada, with labour productivity levels twice as high as the total economy on average, and labour productivity growth one and one half times as rapid as total economy labour productivity growth; capital deepening is a key driver of labour productivity growth in natural resource industries, and high levels of capital intensity explain the high levels of labour productivity in natural resource industries; technological advance is another important driver of labour productivity growth in natural resource industries, and has also increased the importance of human capital; the earth sciences industries make a significant contribution to productivity growth in natural resource industries by providing innovative exploration and development services; and price trends play a large role in the productivity performance of many natural resource industries by determining the quality of deposit that is profitable to be exploited.

3
Report on Productivity Trends in
Selected Natural Resource Industries in Canada Executive Summary The purpose of this report is to shed light on the dynamics and determinants of productivity growth in nine selected natural resource industries and in the overall natural resource sector in Canada. This report provides a concise review of the findings of a detailed analysis undertaken by the Centre for the Study of Living Standards for Natural Resources Canada. Brief summaries are presented for each of the nine industries, and the findings are synthesized into lessons for the natural resources sector as a whole.
Productivity is the key factor behind the growth in living standards. Without increases in the amount each worker is able to produce, there would be no increase in the real wages and incomes of Canadians. Future increases in our living standards are thus dependent on productivity gains. Natural resource industries contribute disproportionately to the aggregate productivity performance of the Canadian economy. The average level of labour productivity in natural resource industries in Canada in 2000 was 194 per cent of the total economy average. Long-term labour productivity growth in the natural resources sector has been nearly one and one half times the total economy average. The continued rise in the standard of living of Canadians hence depends importantly on the future productivity performance of natural resource industries.
Productivity growth in natural resource industries is also important for keeping
unit cost increases low and maintaining the competitiveness of Canadian industries in world markets. The limited evidence available suggests that Canadian natural resource industries have performed reasonably well in terms of labour productivity levels and growth compared to their international competitors, in contrast to some manufacturing industries. Labour productivity growth in both the wood and paper industries has been faster in Canada than in the United States since the 1970s, although lagging that of Finland. Coal mining has seen much higher labour productivity growth in Canada than in the United States since the 1960s. Both the wood and gold mining industries had higher levels of labour productivity in Canada than in the United States in the 1990s.
The first step in the methodology used in the report was to select representative industries from the three natural resources sectors. Coal mining, gold mining and diamond mining were chosen from the mining sector; oil and gas and electricity generation were chosen from the energy sector; and all three industries in the forestry sector were chosen, namely logging and forestry, wood, and paper.
Detailed analyses were then undertaken for each industry, first to estimate growth rates in labour and total factor productivity; second to identify trends in the probable determinants of productivity, such as capital intensity, technology, skills, output price and economies of scale; and third to determine the importance of each of these explanatory

4
variables in the actual productivity performance of each industry. This third step of the analysis entailed both the application of a growth accounting framework and, for some industries, econometric analysis.
Earth sciences industries were also studied in depth, although the lack of output
and hence productivity data made such detailed analyses more difficult. However, one significant finding was that earth sciences industries have played an important role in the productivity performances of other natural resource industries.
The final step of the methodology involved the division of the industries into high
and low productivity growth groups. This division was based on each industry’s performance relative to the total economy in terms of both labour and total factor productivity growth for the 1961-2000 and 1989-2000 periods. If a given industry outperformed the total economy in three or four of these four categories, it was classified as a high productivity growth industry. Coal mining, wood products, paper products and gold mining were classified as high productivity growth according to this definition. If a given industry underperformed relative to the total economy in three or four categories, it was classified as a low productivity growth industry. Oil and gas and electricity generation were classified as low productivity growth according to this process. Logging and forestry was classified as an intermediate productivity growth industry, as it outperformed the total economy in two categories and underperformed in the other two. The rationale for this typology was to identify productivity drivers common to industries in each grouping. The Synthesis Table illustrates the relative importance of these drivers.
Synthesis of the Main Labour Productivity Drivers in Natural Resource Industries in Canada, 1961-2000 Real
Output Price
Capital Intensity
Technology and
Innovation
Human Capital
Other Factors
High Productivity Growth Natural Resource Industries Coal M H H H L Wood M L L M L
Paper L H H M L Gold M H H M H Low Productivity Growth Natural Resource Industries Oil and Gas H L H L H Electricity L H L M L Intermediate Productivity Growth Natural Resource Industries Logging and Forestry H M L M L Legend: H indicates that the factor was of high importance in determining the labour
productivity performance of a given industry over the 1961-2000 period.
M indicates that the factor was of moderate importance.
L indicates that the factor was of little or no importance.

5
The most important drivers of productivity growth in natural resource industries identified by the report are discussed below:
• Capital deepening, that is increases in the capital-labour ratio, is a key driver of labour productivity growth. The faster long run growth of labour productivity in natural resource industries, relative to the all industries average, can be explained by the faster growth in the capital intensity of these industries.
• Along with capital intensity growth, technological advance is the most important
driver of labour productivity in natural resource industries. This has especially been the case in the 1990s, with the computerization of production processes. A key component of technological change in natural resource industries is innovation in exploration and development. Such innovation has been concentrated in the technology-driven earth sciences industries, whose services will continue to make a significant contribution to labour productivity growth in natural resource industries.
• With the increased use of sophisticated technologies and the related shift from
blue collar to white collar occupations, human capital has become increasingly important for long-run productivity growth in natural resource industries.
• Price trends are the key for understanding productivity developments in many
natural resource industries. In general, high output prices have a negative effect on productivity as they encourage exploitation of poor quality deposits and lower productivity through a composition effect. Low prices tend to have a favourable effect on productivity through the exit of marginal operations.
The Synthesis Table also provides insights on the productivity drivers that were
particularly relevant for high and low productivity growth natural resource industries.
• Three of the four high labour productivity growth industries have above average contributions from capital intensity and technology. The three intermediate and low productivity growth industries, on the other hand, each have below average contributions from either capital intensity, technological progress or both.
• Low productivity growth industries tend to have slightly below average
contributions from human capital. Oil and gas, a low productivity growth industry, saw the average years of educational attainment of its workers increase at a rate significantly below that of the total economy. Coal mining, a high productivity growth industry, saw the average years of educational attainment of its workers increase at a rate significantly above that of the total economy.
• It also appears that productivity trends in low productivity growth industries are
slightly more sensitive to output prices than high growth industries.

6
Additional conclusions are as follows:
• There have been significant declines in workplace injuries and fatalities in natural resource industries, and there appear to have been reductions in environmental damage associated with natural resource extraction. Consequently, conventional estimates of productivity in natural resource industries, which do not reflect trends in these two areas, likely underestimate the broader productivity gains, measured from a societal or social perspective, that have taken place in natural resource industries.
• In sparsely populated provinces or territories, the development of natural resource
industries can greatly affect aggregate productivity levels and growth because of the high value added per hour worked associated with these industries. The development of offshore oil production in Newfoundland and the diamond industry in the Northwest Territories have propelled these two jurisdictions to top positions in terms of productivity growth among Canadian provinces and territories in recent years.
• As an economic incentive and as a determinant of the financial health of an
industry, the importance of profitability trumps that of productivity. The two concepts normally go hand in hand as increased productivity leads to higher profits, at least in the short to medium term before new entrants drive down prices and reduce profits. But in natural resource industries a price shock can have differential effects on profits and productivity. For example, the oil price shock in 1973 increased profitability, but lead to lower average productivity. Firms, which enjoyed high levels of profitability, now had an incentive to exploit poor quality, low productivity resources.
• Trade exposure increases competitive pressure and fosters productivity growth.
Natural resource industries in Canada, whether in the energy, mining or forestry products sector, export most of their output and compete with other countries for international markets. Thus they have always been subject to a high degree of trade exposure. While this factor has certainly contributed to the high productivity levels and growth rates in these industries, it is not a new development, in contrast to certain manufacturing and service industries recently exposed to international competition.

7
Report on Productivity Trends in Selected Natural Resource Industries in Canada
Introduction I. Context
In December 2002, the Centre for the Study of Living Standards (CSLS)
delivered to Natural Resources Canada (NRCan) an overview report entitled “Productivity Trends in Natural Resource Industries in Canada.” This report examined trends and drivers or determinants of labour, capital, and total factor productivity for all 20 natural resource industries in Canada over the 1961-2000 period. The purpose of this study is to present a more in-depth analysis of the drivers of labour productivity growth for a subset of these industries, consisting of nine selected natural resource industries (coal mining, gold mining, diamond mining, electricity generation, oil and gas, logging and forestry, wood products, paper products, and earth sciences).1
The report is divided into six major parts following this introduction:
• Part One provides summaries of the findings for selected industries from the mining sector;
• Part Two provides summaries of the findings for selected energy sector industries;
• Part Three provides summaries of the findings for selected industries in the forest
products sector; • Part Four presents a brief overview of earth sciences industries and their impact
on the productivity performance of other natural resource industries;
• Part Five provides a synthesis of the findings for all the industries examined and draws lessons for policies to foster productivity growth in all natural resource industries; and
1 CSLS would like to thank NRCan for financial support to undertake this research, and NRCan officials for comments on earlier drafts. This report draws on detailed studies on these nine selected industries prepared by CSLS for NRCan in February and March 2004. Three of these studies – on coal mining, gold mining and diamond mining – are available as CSLS Research Reports 2004-07 through 2004-09 respectively, and the remaining six are available upon request from [email protected]. This report also draws on two earlier studies of productivity trends in the forest products sector prepared in 2002 by CSLS for the Forest Products Association of Canada and available as CSLS Research Reports 2003-02a and 2003-02b. The overview report on 20 natural resource industries is available as CSLS Research Report 2003-01. Data discussed in this report are taken from these previous studies. Research for this report was directed by Andrew Sharpe, with contributions from Olivier Guilbaud, Dmitry Kabrelyan, Kirsten Robertson, Jeremy Smith and Lesley Taylor.

8
• Part Six summarizes and concludes.
II. Methodology
The first step in the methodology used in this report was to select representative industries from the three natural resources sectors. Coal mining, gold mining and diamond mining were chosen from the mining sector; oil and gas and electricity generation were chosen from the energy sector; and all three industries in the forestry sector were chosen, namely logging and forestry, wood, and paper. Although it has not been possible to examine productivity trends in earth sciences industries because of lack of data on output and hence productivity, the impact of geosciences on productivity in natural resources industries will be discussed.
Detailed analyses were then undertaken for each industry, first to estimate growth rates in labour and total factor productivity; second to identify trends in the probable determinants of productivity, such as capital intensity, technology, skills, output price and economies of scale; and third to determine the importance of each of these explanatory variables in the actual productivity performance of each industry. This third step of the analysis entailed both the application of a growth accounting framework and, for some industries, econometric analysis.
The final step of the methodology involved the division of the industries into high
and low productivity growth groups. This division was based on each industry’s performance relative to the total economy in terms of both labour and total factor productivity growth for the 1961-2000 and 1989-2000 periods. If a given industry outperformed the total economy in three or four of these four categories, it was classified as a high productivity growth industry. If a given industry underperformed relative to the total economy in three or four categories, it was classified as a low productivity growth industry. If an industry outperformed the total economy in two categories and underperformed in the other two, it was classified as an average or intermediate productivity growth industry. The purpose of this division was to identify any characteristics and productivity drivers common to industries in each grouping.
Table 1 shows the classification of the seven industries for which long-term
productivity data are available into high and low productivity growth groups. The industries included in the study are roughly equally divided between upstream (raw material extraction) production and downstream (raw material processing) production. The reader should be aware of two methodological aspects of the analytical approach underlying the conclusions to be discussed here. First, growth rates have been calculated for cyclically neutral periods based on the overall business cycle. Short-term productivity trends are influenced by the business cycle, and to minimize these fluctuations, growth rates have been calculated between business cycle peak years. It is recognized that cycle peaks and troughs vary by industry, but the cyclical peaks and
9
troughs in many natural resource industries do correspond closely to the all industries peaks and troughs. Moreover, the use of the same business cycle dating across industries facilitates industry comparisons. The period of the 1960s therefore corresponds to the 1961-1973 period; the period of the 1970s corresponds to 1973-1981; the period of the 1980s corresponds to 1981-1989; and the 1990s corresponds to 1989-2000. In addition, the 1990s have been divided into the 1989-1995 and 1995-2000 periods. This is because the productivity performance of some industries has been markedly different after 1995 compared to earlier periods, and this difference does not appear to be linked to the business cycle. All growth rates are expressed as compound average annual rates.
Table 1: Labour and Total Factor Productivity in Selected Natural Resource Industries (Average Annual Growth)
Labour Productivity
Total Factor Productivity
Industry 1961-2000
1989-2000
1961-2000
1989-2000
Productivity Classification
Coal
7.2
7.4
3.7
6.1
High
Electricity
2.3
1.0
0.7
-0.8
Low Gold
2.4
5.7
-0.9
3.0
High
Logging & forestry
2.3
0.1
1.9
0.3
Intermediate
Oil and gas
-0.9
4.9
-1.9
-0.7
Low
Paper
2.3
4.0
1.1
3.0
High
Wood
2.7
1.3
2.1
0.9
High
Economy Average
1.8
1.1
1.2
0.7
Legend: indicates that the industry productivity growth was above that of the total economy.
indicates that the industry productivity growth was below that of the total economy.
Second, the analysis makes use of a growth accounting decomposition to quantify the individual contributions to labour productivity growth of various variables. Specifically, it is assumed that the real value added of a given industry is produced with capital and labour, with the contributions of all other factors captured by total factor productivity. Within such a framework, labour productivity growth can be divided into the contribution of capital intensity growth and the contribution of total factor productivity growth. The interpretation of total factor productivity growth must be

10
treated as very broad. Total factor productivity growth in this framework can reflect the influence of many factors, including technological progress, changes in intermediate input use, changes in the quality of labour and capital, increasing returns to scale, organizational innovations and changes in capacity utilization. Given this wide range of explanations for trends in total factor productivity, economists often refer to this variable as a “measure of our ignorance.” The contribution of capital intensity growth to labour productivity growth is calculated by multiplying the rate of growth of the capital-labour ratio by the share of capital in total value added. III. The Importance of Productivity
Productivity is the key factor behind the growth in living standards. Without
increases in the amount each worker is able to produce, there would be no increase in the real wages and incomes of Canadians. Future increases in our living standards are thus dependent on productivity gains.
Natural resource industries contribute disproportionately to the aggregate
productivity performance of the Canadian economy. The average level of labour productivity (real value added per hour) in natural resource industries in Canada in 2000 was 194 per cent of the total economy or all industries average. Long-term labour productivity growth in the natural resource sector has been nearly one and one half times the total economy average. The continued rise in the standard of living of Canadians hence depends importantly on the future productivity performance of natural resource industries.
Figure 1 Notes: Labour Productivity is measured by GDP per hour worked. Growth rates are annual compound growth rates. 1 2003 Data are preliminary for Canada and the United States and are OECD projections for the other countries. Data for Canada from the Labour Force Survey and National Income and Expenditure Accounts. Data for the United States from the Bureau of Labour Statistics (unpublished) and the National Income and Product Accounts GDP. Data from OECD for all other countries. Source: Department of Finance Canada, 2004 Budget Plan, p. 292.

11
Canada experienced an acceleration in aggregate labour productivity growth after 1996. Figure 1, taken from the 2004 Federal Budget, illustrates this acceleration and the improvement in Canada’s productivity growth ranking among the G-7 countries. This development is consistent with an acceleration during this period in labour productivity growth in a number of natural resource industries, including coal mining, gold mining, logging and wood products. In addition, oil and gas and paper products, while not experiencing accelerations, enjoyed above average labour productivity growth. The diamond industry, with an extraordinarily high level of labour productivity, began operations in Canada in 1998. The major factor behind the economy-wide improved labour productivity performance in the second half of the 1990s has been identified as the increased diffusion and use of information and communication technologies. In natural resource industries, this is manifested in the general computerization of production processes. Natural resource industries have played an important role in the wider diffusion of new technologies and in driving the post-1996 productivity growth acceleration in Canada.
Productivity growth in natural resource industries is also important for keeping unit cost increases low and maintaining the competitiveness of Canadian industries in world markets. The limited international evidence available suggests that Canadian natural resource industries have performed reasonably well in terms of labour productivity levels and growth rates compared to their international competitors. Labour productivity growth in both the wood and paper industries has been faster in Canada than the United States since the 1970s, although lagging that of Finland. Coal mining has seen much higher labour productivity growth in Canada than in the United States since the 1960s. Both the wood and gold mining industries had higher levels of labour productivity in Canada than in the United States in the 1990s.
In 2003, the OECD published a major study on the sources of economic growth.
The study attempted to quantify the impact of various variables on productivity and living standards, measured as GDP per capita, based on regression analysis of the experience of 21 OECD countries. A summary of the key findings is given in Figure 2, taken from an article by Peter Nicholson that appeared in the Fall 2003 issue of the International Productivity Monitor published by the Centre for the Study of Living Standards.
The implications of the findings for growth in GDP per capita given typical changes in productivity drivers over the 1980s and 1990s in OECD countries are the following:
• human capital growth added 6-10 percentage points to GDP per capita
growth;
• increased business R&D added a relatively small 1.2 percentage points to GDP per capita growth;

12
• increased trade exposure increased GDP per capita growth by 4 percentage points;
• because of the lack of any trend in the investment/GDP share, this factor made
no net contribution to GDP per capita growth;
• the growing tax burden reduced GDP per capita growth by around 1 percentage point;
• lower inflation raised GDP per capita growth by around 2 percentage points;
and
• reduced inflation variability increased GDP per capita growth by around 1.5 percentage points.
Figure 2
Source: Nicholson, Peter J. “The Growth Story: Canada’s Long-run Economic Performance and Prospects,” International Productivity Monitor Number 7, Fall 2003.
Adding up the estimates of the impact for the seven drivers gives a total net
contribution of around 14-18 percentage points, which accounts for a significant share of the actual increase in GDP per capita between 1980 and 2000. Increased human capital and trade exposure were found to be the most important influences, accounting for well over half of the increase from the drivers.

13
IV. Main Findings of the Report
The findings of this report provide support for many of the OECD results. The major drivers of labour productivity growth in natural resource industries in Canada identified by the report are technology, capital intensity and skills. High productivity growth natural resource industries tend to excel in each of these areas, and lower productivity growth natural resource industries are deficient in at least one. Further, it appears that high productivity growth natural resource industries tend to be proficient at exploiting the interrelations between these primary drivers. For example, the educational qualifications of the workforce drive productivity growth by improving the quality of labour services, but also improve productivity growth because they are complementary with advanced technologies requiring highly skilled workers.
Figure 3, from the 2004 Federal Budget, illustrates the importance of skills,
technology and capital in driving productivity growth, and also shows the interrelations between these drivers. Figure 3
Source: Department of Finance Canada, 2004 Budget Plan, p. 297.
In addition to these three major factors behind productivity growth in natural resource industries, the report also identifies the price of output and advanced exploration techniques as important in many natural resource industries. Most of these advanced exploration techniques emanate from the technology-driven earth sciences industries.

14
Part One: Summary of Productivity Trends in Mining Industries I. Productivity in the Canadian Coal Mining Industry: Success Through
Innovation and Capital Accumulation Coal mining has a small but not insignificant direct impact on the Canadian economy and employment. The industry accounted for 0.15 per cent of total Canadian output in 2000, up from 0.07 per cent in 1961. The share of coal mining employment in total Canadian employment has fallen in the past 40 years, from 0.17 per cent to 0.04 per cent. Canada’s labour productivity level in coal mining is only slightly behind that in U.S. coal mining, and labour productivity growth has been markedly higher.
Chart 1: Labour Productivity Growth in Coal Mining and the Total Economy in Canada
a) 1961-2000
1.7
7.4
3.4
1.0
9.39.3
1.41.2
01
23
45
67
89
10
1961-1973 1973-1981 1981-1989 1989-2000
Coal MiningTotal Economy
%/year
Coal Mining average, 7.2%
All Industries average, 1.9%
The Canadian coal mining industry has had a phenomenal record in terms of labour productivity growth, with output per hour advancing at a 7.2 per cent average annual rate over the 1961-2000 period (Chart 1). This extremely robust performance has lead to the narrowing of the productivity gap with the U.S. coal mining industry. In 1961, the Canadian coal mining industry had a level of labour productivity only 21 per cent that of the U.S. coal mining industry. By 2000 the Canadian coal mining industry had reduced the productivity gap with the U.S. coal mining industry to a large degree, with a relative labour productivity level of 85 per cent (Chart 2).
b) 1989-2000
2.41.1 1.8
13.9
0
5
10
15
1989-1995 1995-2000
%/year

15
Chart 2: Relative Level of Output per Hour in Coal Mining in Canada, 1961-2000, United States = 100
0
20
40
60
80
100
120
1961 1965 1969 1973 1977 1981 1985 1989 1993 1997Source: Statistics Canada, Bureau of Labor Statistics, CSLS.
A. Productivity Trends and Determinants 1. The 1960s – Strong Capital Intensity Growth Between 1961 and 1973, real value added per hour advanced at an average annual rate of 9.3 per cent per year in coal mining, greatly exceeding the all industries average of 3.4 per cent per year. This growth gap allowed the coal mining industry to increase its productivity level relative to the total economy average from 44 per cent in 1961 to 85 per cent in 1973. Over the same period, capital intensity growth (growth in the capital stock per hour worked) was an extremely strong 15.8 per cent per year. Capital intensity growth therefore accounted for nearly all (96 per cent) of labour productivity growth in the 1960s. The factors behind the strong increases in capital intensity in this period appear to have been driven by the adoption of new operating processes in the underground coal mines then in operation, and by the increasing use of conveyor systems and larger vehicles. 2. The 1970s – Increasing Demand for Coal and Labour Disputes The decade of the 1970s (1973-1981) was a poor time for productivity growth for virtually all industries, and coal mining was no exception. After the impressive performance of the 1960s, output per hour growth fell to just 1.7 per cent per year, albeit still somewhat higher than total economy labour productivity growth of just 1.2 per cent per year.

16
Several factors dampened productivity growth in the coal mining industry in the 1970s. Most importantly was the sharp increase in the price of coal after 1973. With the oil price shock of that year, there was a strong incentive to substitute away from oil and towards coal where possible. This increased demand made the mining of lower quality sites profitable, since there was a greater willingness to pay higher prices for coal. Since more labour effort was required to extract a given amount of coal on these marginal sites, the average labour productivity of the overall industry suffered.
Two other shocks occurred in the 1970s, although their effects on productivity are not perfectly understood. These are labour unrest and the temporary negative effect on productivity of safety and environmental regulations. 3. The 1980s – Falling Price and the Continued Transition to Surface Mining
The 1981-1989 period saw a return to the 1960s output per hour growth rate of 9.3 per cent per year. The total economy saw output per hour grow by only 1.0 per cent per year over this same period.
This impressive rebound in labour productivity growth does not appear to have
been driven by capital intensity. Growth in the capital-labour ratio was a paltry 1.5 per cent per year between 1973 and 1981, less than a tenth the average annual growth rate of the 1961-1973 period. This growth picked up slightly in 1981-1989, but to just 2.5 per cent per year, accounting for only 15 per cent of output per hour growth.
Two compositional effects appear to account for most of the impressive
productivity growth in coal mining in the 1980s. The first, driven by sharp declines in the real price of coal after the oil price shocks of the 1970s, entailed the movement of production away from lower quality sites. Since sites with richer deposits require less effort to extract a given amount of coal, this had a favourable impact on the average productivity of the overall industry.
The second compositional shift entailed a lower proportion of total Canadian coal
output originating from the underground mines in Nova Scotia. Open-pit coal mines are typically characterized by a much larger volume of coal extracted per worker compared to underground mines. This is because there are usually far fewer geological constraints to the scale of operations at surface mines. Therefore, as the higher productivity western surface mines continued to increase their share of total Canadian coal output, the average productivity of the overall industry increased.
4. The 1990s – Technology-Driven Growth Output per hour growth in coal mining for the 1989-2000 period was a strong 7.4 per cent per year, compared to 1.4 per cent per year for the total economy. This growth rate reflects weaker productivity growth of 2.4 per cent per year for the 1989-1995

17
period, following the recession of the early 1990s, and incredible 13.9 per cent per year average annual growth for the 1995-2000 period. Although the real price of coal continued to decline steadily throughout the 1990s, leading to further shifts towards higher quality deposits, the primary driver of the impressive productivity growth in the 1990s appears to have been technology. The computerization of many mining operations took off in the second half of the 1990s, accounting for the impressive productivity growth after 1995. These investments in computer systems provided an ability to plan and implement optimal extraction strategies not previously available. 5. Additional Factors Fostering Productivity Growth in Coal Mining Three other characteristics of the Canadian coal mining industry have contributed to the excellent productivity growth of the industry.
• The coal mining industry has a well-educated workforce. Average years of educational attainment in 2001 were 14.0 in coal mining, compared to 13.5 in the total economy. This represents an increase of 3.1 years from 10.9 average years of education in 1976, compared to an increase of only 1.6 years in the total economy. Coal mining also had a high proportion of workers with a post-secondary certificate or diploma.
• Coal mining workers receive high wages relative to the total economy, giving
firms a strong incentive to substitute capital for labour. Average hourly labour compensation in coal mining was about 162 per cent of the total economy average in 2000.
• There has been a remarkable decrease in time-loss workplace injuries in coal
mining, from 25.6 per 100 workers in 1982 to 3.1 per 100 workers in 2002. The total economy incidence of workplace injuries was 2.2 per 100 workers in 2002.
B. Policy Implications The impressive productivity performance of the coal mining industry over virtually all of the past four decades highlights three important productivity drivers. The first is technological advance. In the case of coal, this appears to be mostly embodied in new capital, especially in computer systems in the 1990s. The second is the price of coal, which affects productivity through determining the minimum quality of the coal seam that can be mined profitably. A low price forces low productivity mines out of business, thereby increasing the average productivity of the industry. The third is capital intensity. Especially with open-pit mines, where there are fewer constraints to the size of operations, there are significant productivity benefits to investing in more and larger vehicles, as the amount of coal that can be extracted with a given labour effort increases dramatically.

18
Several policy implications can be drawn from these observations. • Mining operations should be encouraged to invest in the most recent technologies
available, and to exploit the possibility of computerization of the extraction process.
• Large operations should be encouraged in order to realize increasing returns to
scale, especially in terms of utilizing the largest earth movers and highest capacity hauling vehicles available. In other words, higher capital intensity allows operation on a larger scale, both of which benefit productivity growth.
• When the price of coal is decreasing, the exit of inefficient firms should not be
blocked by support for the industry. The benefits to society in terms of productivity growth of allowing the less productive mines to close may outweigh the costs in terms of the loss of the few jobs provided by those mines.
Two other productivity drivers should also be mentioned here briefly. These are
the shift away from underground mining and the role of exploration in improving productivity growth through uncovering richer deposits. II. Productivity in the Canadian Gold Mining Industry: Exploration, Innovation
and Survival A. Productivity Trends and Determinants Gold mining has a small but not insignificant direct impact on the Canadian economy and employment. The industry accounted for 0.15 per cent of total Canadian output in 2000, down from 0.64 per cent in 1961. The share of gold mining employment in total Canadian employment has also fallen in the past 40 years, from 0.26 per cent to 0.05 per cent. Gold mining is not an industry in decline though. After experiencing absolute declines in output throughout the 1960s and 1970s, output more than quadrupled in the 1980s, and grew moderately in the 1990s. Gold mining is widely dispersed across Canada. Although most gold mining activity in Canada is concentrated in Ontario and Quebec, there are also mines in British Columbia, Manitoba, the Northwest Territories, the Yukon, Nunavut, Newfoundland, and Saskatchewan. Canada is a world leader in gold mining. In 2000, Canada was the fourth largest producer of gold in the world with about 5.8 per cent of world production, after South Africa, the United States and Australia. Canada’s gold mining labour productivity level exceeded that in U.S. gold mining in 2000, although the U.S. industry experienced slightly faster labour productivity growth than the Canadian gold mining industry. The Canadian gold mining industry has experienced above average labour productivity growth in the overall 1961-2000 period. But this long-term trend masks

19
very strong labour productivity growth in the 1980s and 1990s, a marked improvement from the below-average performance of the 1960s and 1970s. Chart 3 shows labour productivity growth rates in gold mining and the total economy in Canada since the 1960s.
Chart 3: Labour Productivity Growth in Gold Mining and the Total Economy in Canada
a) 1961-2000
-4.2
5.4 5.7
3.41.9 1.4
1.01.2
-6
-4
-2
0
2
4
6
8
1961-1973 1973-1981 1981-1989 1989-2000
Gold Mining Total Economy
%/year
Gold Mining average, 2.4%
All Industries average, 1.9%
1. The 1960s – Strong Capital Intensity Growth but Declining Ore Grades Between 1961 and 1973, real value added in the gold mining industry declined by 7.4 per cent per year. But this was accompanied by strong increases in the capital stock, with the capital-labour ratio (capital intensity) increasing by an astounding 17.4 per cent per year over the same period. The inability of such large capital investments to increase output suggests that the yields of gold per tonne of extracted ore were low and declining. Had gold reserves been of higher quality during this period, such impressive capital deepening would have lead to considerably higher labour productivity growth than the 1.9 per cent per year actually experienced. 2. The 1970s – Continued Declines in Output Real value added in gold mining continued to fall in the 1970s, by 5.0 per cent per year between 1973 and 1981; and capital intensity growth continued to be strong, at 4.4 per cent per year. Output per hour, in contrast to the experience of the 1960s, experienced sharp declines, falling by 4.2 per cent per year. These facts suggest that ore grades at established sites were continuing to deteriorate in this period. Although exploration efforts were undoubtedly underway in this period, the exploration that was taking place was simply not successful in finding deposits of higher grade ores.
b) 1989-2000
1.0
11.6
1.1 1.8
0
5
10
15
1989-1995 1995-2000
%/year

20
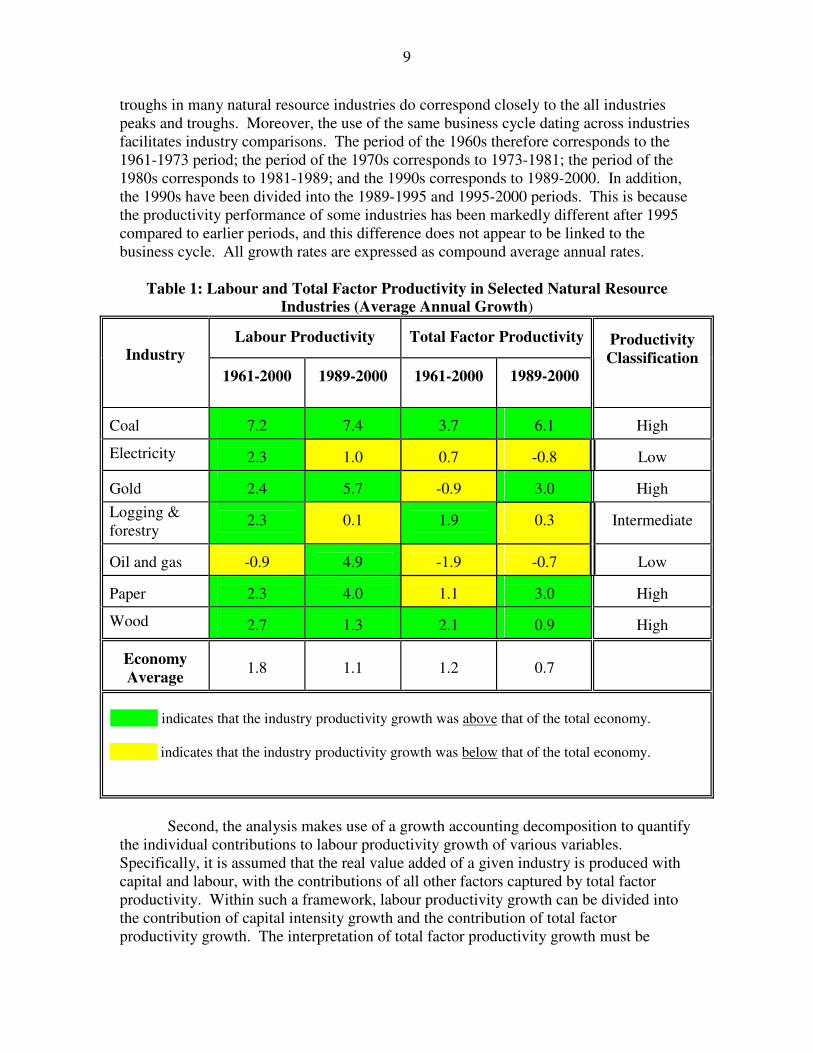
The difference between the 1960s and the 1970s lies in the fact that the real price of gold was virtually constant in the 1960s but increased sharply in the 1970s, by 10.7 per cent per year between 1973 and 1981. Usually this steep increase in output price would encourage the opening of more gold mines, since the high price would ensure the profitability of operations on lower quality sites. The declining nature of the gold mining industry in Canada in the 1970s, however, suggests that these sharp increases in price were barely able to sustain the profitability of the extent mines. Without these increases in price, therefore, the Canadian gold mining industry may have collapsed in the 1970s. 3. The 1980s – New Discoveries and a Rapid Recovery In contrast to the declines in real value added in gold mining in the 1960s and 1970s, output increased by an incredible 17.3 per cent per year between 1981 and 1989. Labour productivity growth was also impressive, at 5.4 per cent per year. Some of this rebound was caused by a compositional shift away from sites with lower ore grades due to the falling price of gold in the 1980s, but such strong output growth implies that there must have been other factors at work.
It does not appear that the rebound was capital driven though. The capital stock increased by only 2.6 per cent per year over this period, with capital intensity declining by 7.8 per cent per year. These declines in capital intensity did not hamper labour productivity growth in gold mining because so much of the capital accumulated during the 1960s and 1970s was still available to be used. However, the fact that the same capital was producing so much more output in the 1980s as in the earlier periods suggests that there must also have been a significant increase in the grade of available ores in this period. This is evidenced by the sharp increase in Canadian gold output in the 1980s, as shown in Chart 4.
The rebound of gold mining can hence be attributed to the eventual success of the
exploration efforts of the 1970s in terms of locating new and higher quality reserves. A second minor factor of the rebound, discussed in more detail in the main report, is a possible change in the organization of work in the early 1980s.
4. The 1990s – Technology-Driven Growth The 1989-2000 period saw high labour productivity and capital intensity growth in the Canadian gold mining industry. There appear to be several factors driving the strong productivity growth of the 1990s, but the most important is probably technology. The computerization of many mining operations took off in the second half of the 1990s, accounting for the impressive productivity growth after 1995. Several innovations, such as in-pit ore crushers and improved conveyor systems, took place in the late 1980s and early 1990s.
21
Chart 4: Real Output in the Gold Industry in Canada, 1961-2002, 1992 Dollars
0
200400
600800
1000
12001400
1600
1961 1965 1969 1973 1977 1981 1985 1989 1993 1997 2001Source: CSLS (2003:Table 28).
$ (millions)
5. Additional Factors Fostering Productivity Growth in Gold Mining Three other characteristics of the Canadian gold mining industry have contributed to the favourable productivity performance of the industry.
• The gold mining industry has a well-educated workforce. Average years of educational attainment in 2001 were 13.0 in metal mining, compared to 13.5 in the total economy. Metal mining also had a high proportion of workers with a post-secondary certificate or diploma.
• Gold mining workers also receive high wages relative to the total economy,
giving firms a strong incentive to substitute capital for labour. Average hourly labour compensation in gold mining was about 173 per cent of the total economy average in 2000.
• There has been a remarkable decrease in time-loss workplace injuries in metal
mining, from 8.7 per 100 workers in 1982 to 2.2 per 100 workers in 2002. The incidence of workplace injuries in gold mining was equivalent to that in the total economy in 2002.
B. Policy Implications The significant differences in the productivity performance of the gold mining industry across the past four decades highlight three important productivity drivers. The first is exploration, which is crucial not just in ensuring the survival of the industry through uncovering new deposits, but also in boosting the productivity of the industry through finding richer and more accessible deposits. The second is technological advance. This can be either embodied in new capital, or disembodied, for example changing work rules to allow for a more efficient organization of production. Such

22
advances can improve both the amount of ore that can be extracted and the efficiency with which gold can be withdrawn from a given amount of ore. The third is the price of gold, which affects productivity through determining the minimum ore quality that can be mined profitably. A low price forces low productivity mines out of business, thereby increasing the average productivity of the industry. Several policy implications can be drawn from these observations.
• Exploration should be encouraged in order to uncover more and richer gold deposits.
• Mining operations should be encouraged to invest in the most recent technologies
available.
• When the price of gold is decreasing, government support may be called for in terms of ensuring the survival of the industry. To the extent that the episode of low prices appears temporary and there are new technologies available that have not yet been adopted, there may be large pay-offs to such support in terms of future productivity gains. This was certainly the case in the 1980s, following the near collapse of the industry in the 1970s.
III. The Future of Diamond Mining in Canada A. The Rise of Diamond Mining in Canada
In the six years since diamond mining began in Canada, the industry has shown a remarkable potential for growth. There are currently two diamond mines in production in Canada, both located in the Northwest Territories. The Ekati mine began production in the fall of 1998, and the Diavik mine in 2003. Between 1997 and 2002, value added in the diamond mining industry increased from zero to nearly $550 million (Chart 5), and the share of diamond mining in total economy real output was 0.05 per cent in 2002. Diamond production accounted for 19.9 per cent of total real output in the Northwest Territories in 2002, representing a phenomenal impact, especially given that the industry did not exist five years before. Exploration and development of diamond mines is currently taking place in several other Canadian provinces. There were no employees in diamond mining in Canada in 1997 and 93 in 1998, the first year of production. This rose to 731 in 2001.
In 2001, the value of Canadian production of rough diamonds from mines
accounted for just over 5 per cent of the value of world production. Production has increased markedly since then, and our share of world value of production may have surged to 15 per cent in 2003. This would rank Canada third, only behind Botswana and Russia, and ahead of South Africa, Angola and Namibia.

23
Chart 5: Output and Employment in the Canadian Diamond Mining Industry, 1998-2002
0
100200
300400
500
600700
800
1997 1998 1999 2000 2001 2002
GDP (millions of 1997$)
Employees
It is also important to note the quality of Canadian diamonds. The average price
per carat for rough diamonds, which reflects such quality indicators as size, colour and clarity, was third highest in the world for Canadian diamonds in 2002, behind only diamonds from Namibia and Angola.
Besides the direct employment and output from diamond mining activity and the
future output and employment promised from continued successful exploration and development, diamond mining creates several economic spin-offs. These include, but are not limited to:
• the actual employment in exploration and development activities;
• services incidental to the actual mining process, such as site construction and
supply companies;
• the cutting and polishing of rough stones; and
• the manufacture and retail sale of jewelry products.
Two more benefits derived from the recent take-off of the diamond mining industry in Canada are increased government revenues and well-paying work in areas of typically limited employment opportunities, particularly for aboriginal people.
The federal government has royalty claims to resource extraction in the territories,
and provincial governments will stand to realize these same gains when diamond mining commences in the provinces. As well, there are higher receipts from income and business taxes when new businesses and jobs are created. These revenues could be used to invest in northern communities contributing to these mines, or in other programs aiming to improve economic and social progress.

24
The well-paying diamond mining jobs are potentially a boon to northern
communities, where employment alternatives of any sort are sparse and jobs requiring specific skills usually require the importation of workers from other provinces. The challenge in making these jobs beneficial for the north is to ensure that northern residents have access to them. There is evidence that there has been success thus far in this area. About one third of total employment in both the Ekati and Diavik mines consists of aboriginals, amongst whom unemployment has been typically severe.
Between 1998 and 2001, labour productivity growth in diamond mining was 2.9
per cent per year. These are the only years for which data are currently available, and refer only to the Ekati mine, which was the only mine in production for this period. This compares to labour productivity growth of only 1.5 per cent per year at the total economy level.
Even more impressive than the productivity growth of diamond mining is the
productivity level. Output per hour in diamond mining in 2001 was $274.24 (1997 constant dollars), 7.6 times the total economy average of $36.33. Diamond mining is a very high-productivity level industry. This is of course explained by the high degree of economic rent in diamond mining, and the capital intensive nature of operations.
Given the above-average level of labour productivity in diamond mining and the
expectation of expanding diamond mining activity as new mines are opened, it can be expected that the labour productivity growth of the overall mining industry will accelerate in coming years due to a composition effect (i.e. as the high-productivity diamond sector continues to grow in importance). Based on a rough simulation exercise, preliminary estimates suggest that the average annual labour productivity growth rate in overall mining (including diamond mining) between 2001 and 2006 will be between 1 and 2 percentage points higher than if the diamond mining industry did not exist.2
2 Full details of the simulation exercise are available in the diamond mining industry study prepared by CSLS for NRCan, available as CSLS Research Report 2004-09. Briefly, the simulation made assumptions about output and productivity growth in the diamond mining industry and in the mining industry excluding diamonds for the 2001-2006 period. These assumptions were then combined to calculate output and productivity growth for the mining industry including diamonds for the 2001-2006 period. The higher the assumed output growth in diamond mining, the higher was the calculated productivity growth of the overall mining industry. The assumption underlying the simulation exercise that lead to an estimated impact in the 2 percentage point range is that output from Canadian diamond mines will quadruple between 2001 and 2006. The assumption underlying the simulation exercise that lead to an estimated impact in the 1 percentage point range is that output from Canadian diamond mines will increase by only 2.5 times between 2001 and 2006. Preliminary mineral production statistics for 2003 from the Minerals and Metals Division of NRCan, along with anecdotal evidence on expected output increases and mine openings, suggest that the former assumption may be somewhat optimistic but that the latter assumption is quite conservative. The overall point of the simulation is that the diamond mining industry has a very high level of labour productivity, and that any growth in diamond mining will hence have a positive effect on the labour productivity growth rate of the overall mining industry.

25
B. Policy Suggestions for Fostering Future Growth of the Diamond Mining Industry in Canada
The surest route to ensuring continued and increasing diamond mining activity is to encourage further exploration and development activity. The diamond mines that have been established in Canada thus far have had to seek capital support from large international mining companies for developing their sites and for meeting the rigorous core sampling requirements that investors demand. Given the good evidence provided by the diamond mines now in existence that Canada has rich and high quality diamond reserves, there may be large future benefits to supporting the junior companies currently in the early stages of development, in terms of keeping a larger proportion of ownership in Canadian hands. It may be possible to increase the labour productivity of diamond mining above its already extremely high level. Mining operations require a certain level of skills in the workforce for the efficient use of computerized and large scale machinery and equipment. Given the remote location of the present and in-development diamond mines in Canada, such a skilled workforce may be difficult to attract. In terms of a broader social policy suggestion, the take-off of the diamond mining industry in Canada’s northern regions provides an important opportunity to assist in the further development of these regions and to narrow the disparities between these and other regions of Canada. Such assistance could have favourable economic and social impacts for Canada as a whole, and certainly for northern communities themselves, some of which have already seen significant improvements to their quality of life resulting from diamond mining employment.
Government support may also be beneficial in the further development of activities downstream from diamond mining in Canada. The hiring of master cutters by Canadian cutting and polishing firms, the investments in transferring the skills of these cutters to a larger workforce, and the development of distinctive markings for Canadian diamonds all indicate a desire to create a recognized and respected all-Canadian brand. Companies marketing the Ekati and Diavik diamonds have already gone to great efforts to strengthen the uniqueness of their brand by highlighting the unrivaled nature of the colour and clarity of the diamonds. Aber Diamond Mines, co-owner of the Diavik mine, has been pursuing exclusive retail contracts in order to capture more of the high retail profits of jewelry sales. Investment in the further establishment of the Canadian brand could promise large returns in keeping a larger proportion of the economic rent associated with this distinctive Canadian brand in Canada.

26
Part Two: Summary of Productivity Trends in Energy Industries I. Productivity in the Canadian Electric Power Generation Industry The electricity generation industry is a key component of the Canadian economy, with the real output of the industry representing 2.6 per cent of GDP in 2000. The industry, however, has declined as a proportion of the Canadian economy since the mid-1980s. This section of the report examines the drivers of productivity growth in the electricity generation industry in Canada over the 1961-2000 period, with particular attention to the 1990s. While the electricity generation industry is made up of a large number of sub-industries, defined by generation method, the lack of output data by this fine a classification precludes a productivity analysis of each individual industry. The analysis is therefore for the sector as a whole.
Chart 6: Labour Productivity Growth in the Electricity Generation Industry and the Total Economy in Canada
The level of output per hour worked in the electricity generation industry is well above that of the all-industries average, reflecting extremely high capital intensity of production. In comparison, the performance of this industry in terms of labour productivity growth has been poor. The key productivity development in this industry has been the massive deceleration in labour productivity growth after the 1960s. After 1973, the previously high rate of growth fell below that of the all industries average. Chart 6 demonstrates the sharp decline in labour productivity growth in this industry. A. Productivity Trends and Determinants 1. The 1960s – Strong Capital Intensity Growth and Increasing Returns to Scale
Labour productivity, or output per hour worked, is the most commonly used
measure of the productivity of an industry. Growth in labour productivity in the electric
a) 1961-2000
6.0
0.1
3.4
1.00.8 1.0 1.2 1.4
0
2
4
6
8
1961-1973 1973-1981 1981-1989 1989-2000
Electricity All Industries
%/year
All Industries Average, 1.9 % Electricity Average, 2.3 %
b) 1989-2000
1.3
0.51.1
1.8
0
1
2
3
1989-1995 1995-2000
%/year

27
Chart 7: Capital Intenstiy Growth in the Electricity Generation Industry, 1961-2000, average annual per cent
change
2.2
0.5
3.0
1.7
0 1 2 3 4
1989-2000
1981-1989
1973-1981
1961-1973
%
1961-2000 Average, 2.0 %
generation industry proceeded at a rate nearly double that of the aggregate economy from 1961 to 1973, at an average annual rate of 6.0 per cent per year. Labour productivity growth can be examined by the contributions of capital intensity (capital stock per hour worked) and total factor productivity (TFP – the increase in labour productivity not accounted for by increased capital per hour worked).
The 1960s were a period of
large additions to the capital stock of the electricity industry. Total capital intensity grew at 3.0 per cent per year throughout this decade. This increase in capital intensity accounted for almost half (41 per cent) of the labour productivity growth in the period. Chart 7 illustrates the rise in capital intensity, accompanied by rising labour productivity in this period.
Other factors, captured by the
TFP measure, accounted for the remaining 59 per cent of labour productivity growth in this period. Chart 8 presents the growth of TFP in
electricity generation in each decade since 1961. The largest contribution likely came from increasing scale in the equipment used to generate electricity. Secondly, high rates of capacity utilization are generally associated with high productivity growth through increasing returns and the spreading of overhead costs. The rise in capacity utilization between 1961 and 1973 may have contributed to the rapid productivity growth. 2. The 1970s – Technological Barriers and Declining Capital Intensity The remainder of the 1970s (1973-1981) was a period of much slower growth for the electricity industry, as annual productivity growth was a low 0.1 per cent per year. After the impressive productivity growth performance in the 1960s, this was a period of relative stagnation.
The average annual rate of growth of capital intensity in the electricity generation industry declined from 3.0 per cent during the 1960s to 0.6 per cent per year in the 1970s (Chart 7). A large proportion of the capital stock of the electricity generation industry (70 per cent in 2002) is in engineering capital stock, and it was this component that accounted for the fall in capital intensity growth after 1973. Although the growth rate of capital intensity was falling, it continued to make a positive contribution to labour productivity in this decade.

28
The downturn in labour productivity growth in the electricity industry came as a result of the negative TFP growth of the decade. This reversal likely came as a result of the large changes in the technology used to produce electricity that occurred at the end of the 1960s and early 1970s.
Evidence suggests that a widespread new technology, the “supercritical” boiler, was seriously flawed and that these flaws led to increased repairs and downtime, resulting in decreases in real output. The unexpected maintenance required the addition of maintenance and repair crews to most plants. Thus, the large number of workers employed to undertake activities not directly affecting output may partially explain the sharp drop in labour productivity growth after the early 1970s.
There was also a link
between human capital and the productivity of the industry through the effects of learning by doing and accumulated skills. There was a delay between the introduction of the new technology and its successful implementation, resulting from a period of learning adjustment by technicians and plant managers. While this lagged effect is difficult to measure quantitatively, anecdotal evidence suggests that, in the early 1970s, the technology change led to decreased productivity as workers faced this type of adjustment. 3. The 1980s – Low Output Growth
The 1980s (1981-1989) was again a period of weak productivity performance for
the electricity industry. The average annual growth for the decade was 0.8 per cent, a rate below the Canadian economy average of 1.1 per cent per year. While the growth of real output in the electricity industry had been above that of the total economy in the 1960s and 1970s, the 1980s were a period of below average output in the industry. This growth slowdown likely had contributed to the weak productivity growth of the decade.
Over this period, capital intensity growth rebounded from the weaker 1970s
performance, to a rate above that of the total economy. This increase was reflected in a small rise in the overall productivity growth of the industry, relative to that of the 1970s.
Chart 8: Total Factor Productivity Growth in the Electricity Generation Industry, 1961-2000, average annual
per cent change
-0.8
-0.6
-0.3
3.5
-1 0 1 2 3 4
1989-2000
1981-1989
1973-1981
1961-1973
%
1961-2000 Average, 0.7 %
29
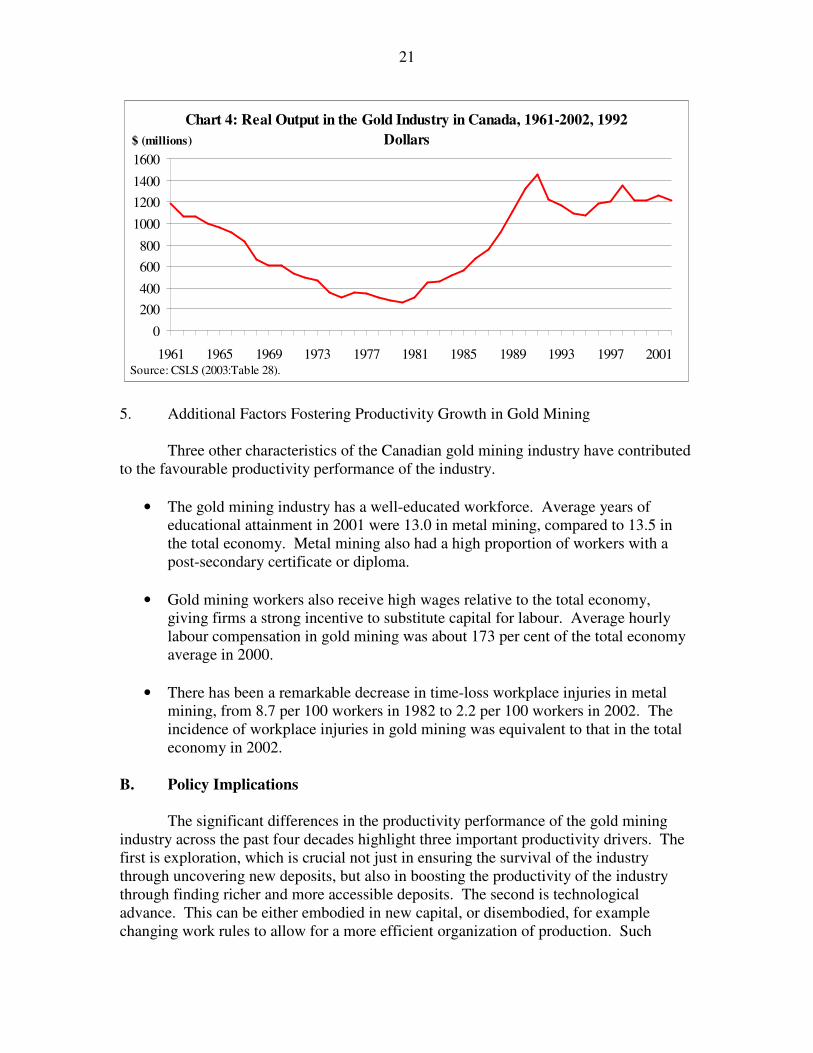
4. The 1990s – Environmental Regulations, Repairs and Restructuring The 1990s were again a period of poor performance for the electricity industry, in
terms of below average labour productivity growth, real output growth and employment growth.
After 1989, the electricity sector experienced the strongest growth in capital
intensity since the 1960s, at 2.2 per cent per year. Unlike the 1960s, however, this growth was not accompanied by increasing labour productivity. There is evidence that expenditures on capital stock in the 1990s failed to contribute to labour productivity because they were directed at addressing environmental regulations and at repairing or re-fitting older equipment. These types of expenditures have little effect on the output of the sector, therefore having little effect on productivity performance. Additionally, this suggests that plants may have been investing less in new, more efficient generating technology, possibly contributing to the declining productivity of the sector.
In particular, the operational problems encountered by some of the older nuclear
generation units at Pickering A and Bruce A caused Ontario Power Generation to undertake an expensive refurbishing program during the 1990s. These repairs may have contributed to the large increase in capital per hour worked in the 1989-2000 period, while having little effect on overall productivity in the industry.
The expenditures on retrofitting older equipment may also have been partially due
to the increased presence of environmental regulations, which required the upgrading of older capital stock to meet new performance guidelines.
In the framework of this analysis, environmental regulations are often considered a drag on productivity growth because they impose costs on firms. One way to gauge the impact of regulations on the electricity generation industry is to examine the trends in capital repairs expenditures by the industry on Pollution Abatement and Control (PAC). In response to increased regulation in the early 1990s, nominal expenditures on PAC by the electricity industry peaked in 1992. The majority of the PAC expenditures undertaken by the electricity industry were on end of pipe processes, which supports the evidence presented above regarding spending on retrofitting capital stock. B. Conclusions and Policy Implications
While, on average, the productivity performance of the electricity generation industry has been slightly above that of the Canadian economy over the 1961-2000 period, this largely reflects the extremely high growth of productivity in the industry during the 1960s. The strong productivity growth witnessed in the 1960s gave way to three decades of relative stagnation, as labour productivity growth remained below 1.0 per cent per year throughout the 1970s, 1980s and 1990s.
The electricity industry is one of the most capital intensive in the economy. In
Canada, hydro generation and nuclear generation provide a large part of the total

30
electricity supply, and their structure requires massive up-front outlays of capital before any output is realized. It appears that the large capital stock investments of the 1960s initially led to rapid labour productivity growth in that decade, but that by the early 1970s, declining capital intensity growth and problems with equipment slowed labour productivity growth in the industry. Continuing improvements in the quality of stock of physical capital, and the encouragement of research and development of newer, more efficient and possibly cleaner generation technologies should be undertaken to ensure the stock of physical capital remains of high quality.
It appears that much of the growth in capital investments in the 1990s were on
equipment designed to abate pollution, and in the refurbishment of ageing nuclear facilities, both of which have had little impact on output (to date). These increases in capital stock and capital intensity have therefore had little impact on productivity. Importantly, conventional estimates of productivity in the electricity industry, such as those produced in this study, likely underestimate true the productivity gains from a social perspective. This occurs due to the fact that while the increases in capital stock linked to pollution abatement and control appear as a cost to firms, the analysis omits the benefits of improvements in environmental quality that have resulted from actions taken by the industry. As coal burning electricity generators are one of the country’s largest emitters of pollutants, the improvement in environmental quality resulting from abatement activities undertaken by this industry should not be ignored.
The large amount of capital involved in production of electricity requires that the
power generation sector have sufficient technicians and skilled workers in order to operate both existing and new technologies efficiently. Evidence suggests the importance of on-the-job skills and knowledge accumulation is high in this industry, and that policies should be designed to ensure that there is no gap or shortage in the availability of workers that have such experience. The large amount of environmental abatement technologies and new plant and equipment designs that will follow from the imposition of higher environmental standards may require further training for all workers in the industry.
It is notable that while the prices for certain energy inputs used in the generation
process, such as oil and gas, have been extremely volatile, this input price volatility has not necessarily translated into large fluctuations in electricity prices. This stability is largely the outcome of the provincial regulatory regimes that have intervened to limit the movements of electricity output pricing. It is possible that these types of pricing schemes and price freezes have provided little incentive for electricity producers to reduce costs or to invest in new equipment. Most de-regulation and restructuring initiatives have been considered on the basis of introducing efficiency incentives into the electricity generation industry. Further research as to the productivity effects of such de-regulation plans should be conducted as more evidence becomes available.

31
II. Productivity in the Canadian Oil and Gas Extraction Industry: Output Price Effects and Technology-Driven Growth
The oil and gas extraction industry is an important part of the Canadian economy, with the real output of the industry representing 2.0 per cent of total Canadian GDP in 2000. While the industry contributes a large share in terms of output, it employs a relatively small number, at only 0.2 per cent of total Canadian employment in 2000. Due to the large value of output of the industry, the level of output per hour worked in the oil and gas industry has been well above that of the Canadian all-industries average over the 1961-2000 period, reaching nearly ten times the average in 2000. At the same time, the performance of this industry in terms of labour productivity growth has been poor, most notably in the 1970s and early 1980s. During the 1990s, however, the industry has turned around in terms of labour productivity growth. Chart 9 clearly illustrates the evolution of labour productivity performance of the oil and gas industry.
Chart 9: Labour Productivity Growth in the Oil and Gas Extraction Industry and the Total Economy in Canada
a) 1961-2000
2.0
-12.0
4.93.4
1.2 1.0 1.4-1.3
-16
-12
-8
-4
0
4
8
1961-1973 1973-1981 1981-1989 1989-2000
Oil and Gas All Industries
All Industries Average, 1.9 %
Oil and Gas Average, -0.9 %
%/year
A. Productivity Trends and Determinants 1. The 1960s – Growing Output and Employment
Between 1961 and 1973, output in the oil and gas industry grew at a very strong 11.4 per cent per year, far outpacing the all industries growth rate of 5.8 per cent. The industry also experienced extremely rapid employment growth in this decade, with average yearly job growth of over 9 per cent per year. While output was growing in this period, hours worked were also accelerating rapidly, thereby offsetting the effect of output growth in terms of labour productivity. As a result, the productivity growth of the oil and gas industry was below that of the total economy, advancing at an average annual rate of 2.0 per cent per year, relative to the Canadian economy rate of growth of 3.4 per cent per year.
b) 1989-20006.2
3.3
1.11.8
0
4
8
1989-1995 1995-2000
%/year

32
Labour productivity growth can be decomposed into contributions of capital
intensity (capital stock per hour worked) and total factor productivity (TFP - the increase in labour productivity not accounted for by increased capital per hour worked). Capital intensity growth in the 1960s was -1.6 per cent per year, well below the 2.3 per cent per year growth in the total economy. As labour productivity is affected by the amount of capital available to each worker, this decrease appears to have had a negative influence on labour productivity in the oil and gas industry of the 1960s. 2. The 1970s – Price Effects: Growing Employment, Declining Output
After the first oil shock, the oil and gas industry entered a period of massive
labour productivity decline. The remainder of the 1970s (1973-1981) were a period of negative productivity growth, at an average of -12.0 per cent per year. In comparison, the total economy productivity growth rate averaged 1.2 per cent per year throughout this period.
Most of the decline in labour productivity and in the real output of the industry is attributable to the effects of the dramatic increase in the price of oil after 1973. These effects are visible in the sharp decline in TFP growth during the decade, the most notable feature of Chart 10. In general, price trends appear to have had an important effect on productivity in the oil and gas industry. Chart 11 presents the movements of the real price of oil and gas and labour productivity in the industry. It is clear that there is a strong inverse relationship between the two.
Profitability is an extremely important motivator for economic activity in the oil
and gas industry, as increases in realized and expected profits drive both exploration and development activities. As prices rose in the 1970s and 1980s, this was reflected in an unfavorable compositional shift in the industry, as wells that were previously unprofitable became economically feasible. This compositional shift is reflected in the TFP growth downturn during the decade.
Chart 10: Total Factor Productivity Growth in the Oil and Gas Extraction Industry, 1961-2000, average annual
growth rates
3.5
-11.6
-0.7
-0.9
-15 -10 -5 0 5
1989-2000
1981-1989
1973-1981
1961-1973
%
1961-2000 Average, -1.9 %
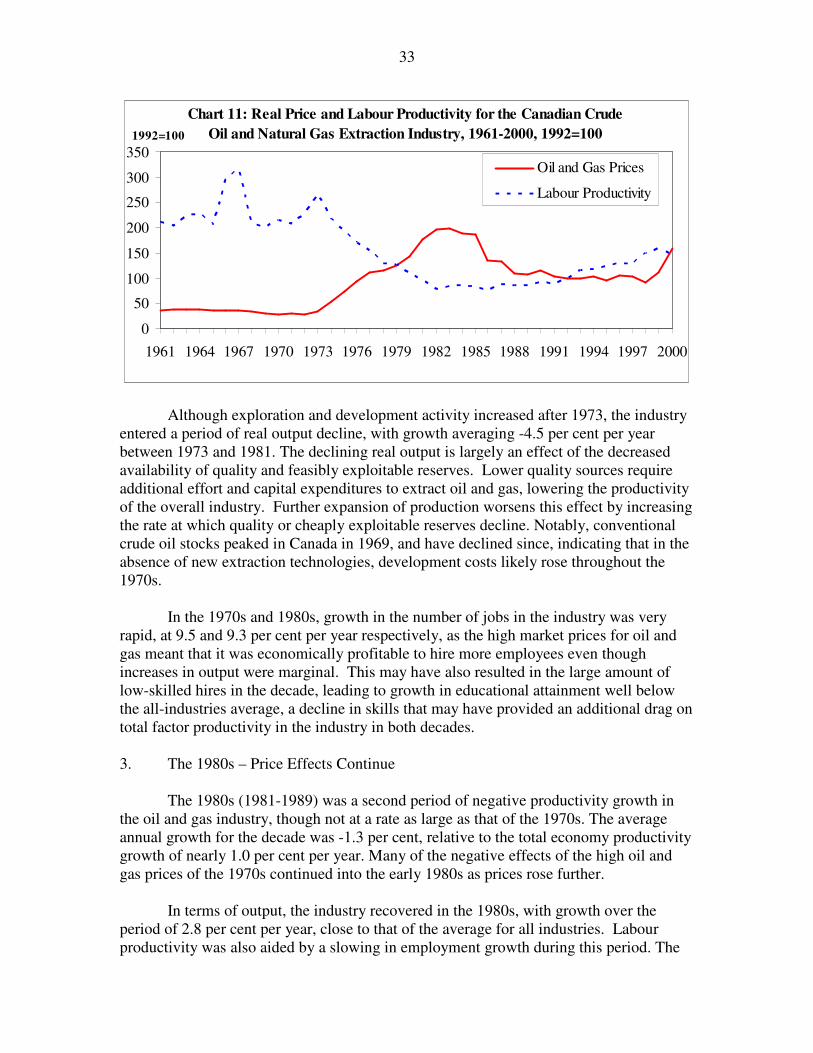
33
Chart 11: Real Price and Labour Productivity for the Canadian Crude Oil and Natural Gas Extraction Industry, 1961-2000, 1992=100
0
50
100
150
200
250
300
350
1961 1964 1967 1970 1973 1976 1979 1982 1985 1988 1991 1994 1997 2000
Oil and Gas Prices
Labour Productivity
1992=100
Although exploration and development activity increased after 1973, the industry entered a period of real output decline, with growth averaging -4.5 per cent per year between 1973 and 1981. The declining real output is largely an effect of the decreased availability of quality and feasibly exploitable reserves. Lower quality sources require additional effort and capital expenditures to extract oil and gas, lowering the productivity of the overall industry. Further expansion of production worsens this effect by increasing the rate at which quality or cheaply exploitable reserves decline. Notably, conventional crude oil stocks peaked in Canada in 1969, and have declined since, indicating that in the absence of new extraction technologies, development costs likely rose throughout the 1970s.
In the 1970s and 1980s, growth in the number of jobs in the industry was very rapid, at 9.5 and 9.3 per cent per year respectively, as the high market prices for oil and gas meant that it was economically profitable to hire more employees even though increases in output were marginal. This may have also resulted in the large amount of low-skilled hires in the decade, leading to growth in educational attainment well below the all-industries average, a decline in skills that may have provided an additional drag on total factor productivity in the industry in both decades.
3. The 1980s – Price Effects Continue
The 1980s (1981-1989) was a second period of negative productivity growth in
the oil and gas industry, though not at a rate as large as that of the 1970s. The average annual growth for the decade was -1.3 per cent, relative to the total economy productivity growth of nearly 1.0 per cent per year. Many of the negative effects of the high oil and gas prices of the 1970s continued into the early 1980s as prices rose further.
In terms of output, the industry recovered in the 1980s, with growth over the
period of 2.8 per cent per year, close to that of the average for all industries. Labour productivity was also aided by a slowing in employment growth during this period. The

34
massive price drop of oil and gas after 1986 seems to be the main motivator behind this slight recovery.
4. The 1990s – Capital Intensity and Technology-Driven Growth
In the 1990s, labour productivity growth in the oil and gas industry recovered to a
rate well above that of the Canadian economy. Output per hour growth was positive, at a strong 4.9 per cent per year throughout the decade. In terms of real output, the oil and gas industry actually outpaced the growth of the total Canadian economy in the 1990s, at 2.5 per cent between 1989 and 2000, relative to the 2.3 per cent growth of the all industries aggregate.
Capital intensity growth has been extremely important in the high labour productivity growth in the oil and gas industry during the 1990s:
• The majority of the positive contribution to labour productivity growth came from a take-off in the growth in the intensity of the engineering stock of the industry, and to a lesser degree the machinery and engineering stock.3 Capital intensity grew at a level almost six times the all-industry average in the 1990s.
• Embodied within the engineering capital acquired by the oil and gas industry
during the 1990s was a large amount of new technology that had important effects on productivity. It is impossible to separate the contributions of the growth in capital intensity and
these new technological innovations in terms of their relative productivity improving effects, but evidence from industry publications suggests that new technologies were largely responsible for the turnaround in the productivity growth of the oil and gas industry. New technologies that came into widespread use throughout the 1990s facilitated greater resource recovery from both new and existing reservoirs. While many of these new technologies came at a higher cost than more conventional approaches, the output generated by innovations such as the horizontal well were generally much higher than those from conventional applications. The increases in output appear to have offset the increases in inputs in terms of labour productivity.
Another effect of the introduction of sophisticated technologies to the industry has
been the shift to workers with higher levels of education in the industry. Throughout the 1990s (1989-2001), the average annual rate of growth of years of schooling in the oil and gas industry rose at its highest rate since the mid-1970s. As higher levels of human
3 Capital stocks are divided into three types. The largest proportion of capital stock in the oil and gas industry (almost 95 per cent in 2002) was in engineering capital stock, with proportions in structures capital stock and machinery and equipment totaling the remaining 5 per cent. This type of stock is therefore extremely important to this industry. In the petroleum and natural gas industry, expenditures on drilling, development drilling, production facilities, enhanced recovery projects and natural gas processing plants are all included under the engineering capital stock category. Machinery and equipment capital stock represents the balance of any machinery and equipment not covered as part of the engineering stock.

35
capital can have positive effects on labour productivity, this provided an additional boost to performance in the 1990s.
Growing scarcity of oil and gas reserves in the previous decades may have provided impetus for the development of new technologies and techniques to aid in the exploitation of unconventional reserves. Unconventional crude oil stocks have become an increasingly important part of the Canadian industry in the late 1980s and 1990s.4 The development of new technologies that have permitted the exploitation of such rich deposits as the oil sands has greatly increased the stock of recoverable reserves in Canada. High-cost, sophisticated technologies are used in the extraction of unconventional crude oil, requiring highly skilled labour. B. Conclusions and Policy Implications
The Canadian oil and gas industry has had a very poor record in terms of labour productivity growth over the majority of the 1961-2000 period, but has had a remarkable turnaround in the 1990s. The analysis performed in this report suggests that:
• TFP growth was, in general, the main contributor to the negative labour productivity growth over the entire 1961-2000 period. The TFP growth declines can be largely attributed to the effects of high prices on production decisions in the industry. The compositional shift in the industry characterized the exploitation of wells of marginal productivity led to a two-decade period of poor productivity performance.
• Capital intensity growth has been extremely important in the high labour productivity growth in the oil and gas industry during the 1990s. The majority of the positive contribution to labour productivity growth came from growth in the intensity of the engineering stock of the industry.
Although the productivity performance of the industry has been poor, the increased output prices and economic rent led to boom in employment and profits, and hence increased real incomes in the industry after 1973.
The 1990s saw a productivity turnaround in the oil and gas industry. The driver of this productivity recovery was increased capital intensity, embodied within which were several new technologies developed in the past 10-15 years. Investment in capital reflecting this technology change, combined with a skilled workforce that is essential to its proper application, led to better than average growth throughout the decade. This type of productivity growth is especially encouraging, as it does not appear to be tied to price, as has been the story of much of the productivity movements in the industry in previous decades.
4 Non-conventional crude oil includes crude bitumen recovered by in-situ methods, and synthetic crude oil derived from crude bitumen extracted by in-situ or oil sands mining techniques.

36
If it is possible to continue the positive productivity trend through the further application and development of new exploration and development technologies, there may be a strong future for the oil and natural gas industry in terms of productivity growth. The level of current dollar value produced per hour of work in the oil and gas industry is far above the total economy average, reflecting the high potential of the industry to improve the real incomes of Canadians. With the further planned development of the oil sands in Alberta, and other unconventional reserves, the contribution of the oil and gas industry to the Canadian economy and to Canada’s aggregate productivity performance promises to remain strong. Continuing research will need to be conducted as the full impact of these technologies on the industry unfolds.
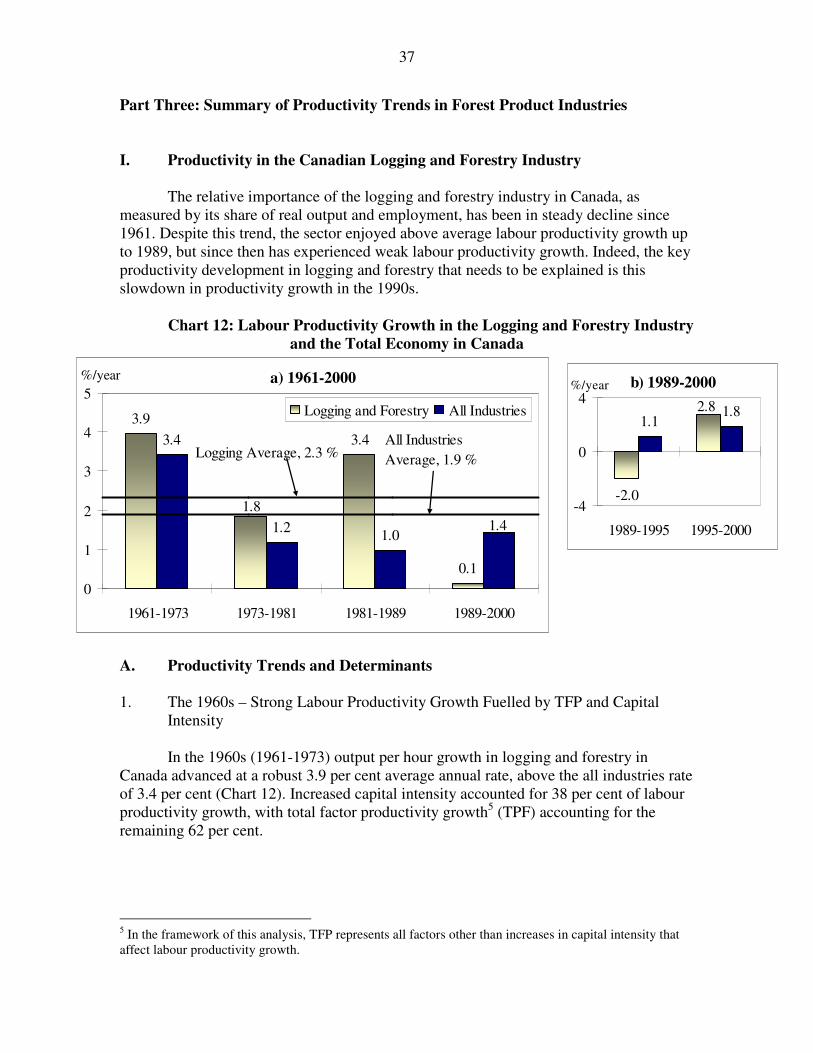
37
Part Three: Summary of Productivity Trends in Forest Product Industries I. Productivity in the Canadian Logging and Forestry Industry
The relative importance of the logging and forestry industry in Canada, as measured by its share of real output and employment, has been in steady decline since 1961. Despite this trend, the sector enjoyed above average labour productivity growth up to 1989, but since then has experienced weak labour productivity growth. Indeed, the key productivity development in logging and forestry that needs to be explained is this slowdown in productivity growth in the 1990s.
Chart 12: Labour Productivity Growth in the Logging and Forestry Industry
and the Total Economy in Canada
a) 1961-2000
3.9
0.1
3.4
1.2 1.0
1.8
3.4
1.4
0
1
2
3
4
5
1961-1973 1973-1981 1981-1989 1989-2000
Logging and Forestry All Industries
%/year
All Industries Average, 1.9 %Logging Average, 2.3 %
A. Productivity Trends and Determinants 1. The 1960s – Strong Labour Productivity Growth Fuelled by TFP and Capital
Intensity
In the 1960s (1961-1973) output per hour growth in logging and forestry in Canada advanced at a robust 3.9 per cent average annual rate, above the all industries rate of 3.4 per cent (Chart 12). Increased capital intensity accounted for 38 per cent of labour productivity growth, with total factor productivity growth5 (TPF) accounting for the remaining 62 per cent.
5 In the framework of this analysis, TFP represents all factors other than increases in capital intensity that affect labour productivity growth.
b) 1989-2000
-2.0
1.11.82.8
-4
0
4
1989-1995 1995-2000
%/year

38
Chart 14: Capacity Utilization in
the Total Economy and the Logging and Forestry Industry,
1962-2000, per cent
50
60
70
80
90
100
1962 1969 1976 1983 1990 1997
Logging Total Non-Farm Goods Industries
%
2. The 1970s – Slower but Still Above Average Labour Productivity Growth
As was the case in almost all industries, labour productivity growth in logging and forestry fell off after 1973, advancing at a 1.8 per cent average annual rate in 1973-1981, still above the all industries average (1.2 per cent). The slowdown reflected slower growth in both capital intensity and total factor productivity. A significant fall in capacity utilization between the 1973 and 1981 cyclical peaks may account for some of the slowdown.
3. The 1980s – Rebound in Labour Productivity Growth Reflecting Acceleration in
TFP Growth
Labour productivity growth rebounded after 1981, advancing at a 3.4 per cent average annual rate in 1981-1989, well above the all industries average of 1.0 per cent. The driving force behind this development was total factor productivity, which increased to 4.3 per cent from 0.8 per cent in 1973-1981 and hence accounted for all the pick-up in labour productivity growth. Indeed, the capital stock and capital intensity growth were negative in the period and hence contributed negatively to labour productivity growth (Chart 13). The very strong TFP growth may reflect major technological innovations that were introduced but were not embodied in the capital stock. Evidence from industry publications suggests that during the 1980s
Chart 13: Capital Intensity, in 1997 Dollars, in the Logging and Forestry Industry, 1961-2002, 1961=100
50
100
150
200
250
1961 1966 1971 1976 1981 1986 1991 1996 2001

39
total costs were held down through the introduction of such labour saving innovations as a new means of attaching felled trees to cables to remove them from the forest site (grappling). A rise in capacity utilization between the 1981 and 1989 cyclical peaks may have also fostered the productivity rebound (Chart 14).
4. The 1990s – The Disappearance of Productivity Gains
After above average productivity growth in the 1960s, 1970s, and 1980s, productivity growth in logging and forestry in Canada virtually disappeared in the 1990s. Output per hour advanced a meagre 0.1 per cent from 1989 to 2000, down from 3.2 per cent in 1961-1989. This fall-off in labour productivity growth reflected both a deceleration in TFP growth and in capital intensity growth.
Relative to the 1961-1989 period, capital intensity growth fell at a 0.6 per cent
average annual rate from 2.1 per cent and TPF growth fell to 0.3 per cent from 2.5 per cent. Thus of the 3.1 percentage point fall in labour productivity growth between 1961-1989 and 1989-2000, about 70 per cent was due to the deceleration of TFP growth and 30 per cent to the fall-off in capital intensity growth.
Other factors likely contributed to the decline in labour productivity in the logging industry after 1989. These factors would have affected TFP growth, and in turn labour productivity.
• The stocks of natural capital
in the logging and forestry industry have been falling while production has been rising (Chart 15). While the forest reserves are still larger than production by several orders of magnitude, much of the industry is harvesting secondary growth, which typically yields lower harvest volumes. For the segment of the industry that is still cutting old growth the sites are increasingly inaccessible. This increases cost for the industry.
• The introduction of more
environmental regulations in logging and forestry in the 1990s may then have impeded productivity growth. Examples include the imposition of higher standards for logging roads in British Columbia in the 1990s, which limited the use of labour-saving grappling
Chart 15: Canadian Timber Harvests and Assets, 1961-1997
12000
12500
13000
13500
14000
14500
15000
1961
1966
1971
1976
1981
1986
1991
1996
Tim
ber
asse
ts, m
illio
n cu
bic
met
ers
020406080100120140160180200
Tim
ber
harv
est,
mill
ion
cubi
c m
eter
s
Assets
Harvests
Source: Statistics Canada, Table No. 1530030.
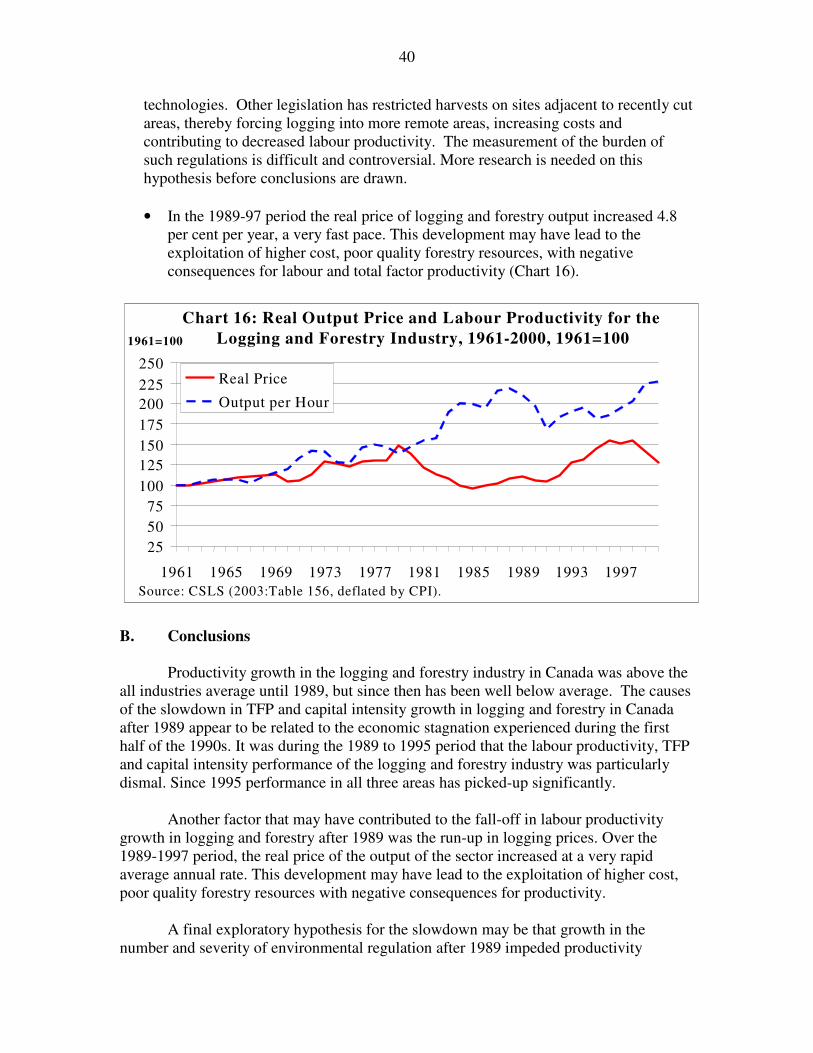
40
technologies. Other legislation has restricted harvests on sites adjacent to recently cut areas, thereby forcing logging into more remote areas, increasing costs and contributing to decreased labour productivity. The measurement of the burden of such regulations is difficult and controversial. More research is needed on this hypothesis before conclusions are drawn.
• In the 1989-97 period the real price of logging and forestry output increased 4.8
per cent per year, a very fast pace. This development may have lead to the exploitation of higher cost, poor quality forestry resources, with negative consequences for labour and total factor productivity (Chart 16).
Chart 16: Real Output Price and Labour Productivity for the Logging and Forestry Industry, 1961-2000, 1961=100
25 50 75
100
125 150 175 200 225
250
1961 1965 1969 1973 1977 1981 1985 1989 1993 1997
Real Price
Output per Hour
Source: CSLS (2003:Table 156, deflated by CPI).
1961=100
B. Conclusions
Productivity growth in the logging and forestry industry in Canada was above the all industries average until 1989, but since then has been well below average. The causes of the slowdown in TFP and capital intensity growth in logging and forestry in Canada after 1989 appear to be related to the economic stagnation experienced during the first half of the 1990s. It was during the 1989 to 1995 period that the labour productivity, TFP and capital intensity performance of the logging and forestry industry was particularly dismal. Since 1995 performance in all three areas has picked-up significantly.
Another factor that may have contributed to the fall-off in labour productivity
growth in logging and forestry after 1989 was the run-up in logging prices. Over the 1989-1997 period, the real price of the output of the sector increased at a very rapid average annual rate. This development may have lead to the exploitation of higher cost, poor quality forestry resources with negative consequences for productivity.
A final exploratory hypothesis for the slowdown may be that growth in the
number and severity of environmental regulation after 1989 impeded productivity

41
growth. But it is very difficult to document the extent of the regulatory burden and estimate the impact on productivity. Moreover, productivity measures adjusted for improvements in environmental conditions may diverge from conventional measures because of the introduction of environmental regulations. Additional research on this issue is needed. II. Productivity in the Canadian Wood Products Industry The Canadian wood products industry has had a mixed record in terms of labour productivity growth since 1961. Labour productivity grew at a rate well above that of the total Canadian economy in the 1970s and 1980s, before decelerating sharply in the 1990s. The key productivity development in this industry is thus the fall-off in productivity growth after 1989. From 1961 to 1989 labour productivity advanced at a 3.2 average annual rate. From 1989 to 2000 it advanced at a 1.2 per cent rate, a turnaround of 2 percentage points (Chart 17).
Chart 17: Labour Productivity Growth in the Wood Industry and the Total Economy in Canada
a) 1961-2000
2.6
3.5
1.2
3.4
1.2 1.0
3.8
1.4
0
1
2
3
4
5
1961-1973 1973-1981 1981-1989 1989-2000
Wood All Industries
%/year
All Industries Average, 1.9 %
Wood Average, 2.7 %
A. Productivity Trends and Determinants 1. The 1960s – Strong Output and Employment Growth but Below Average
Productivity Growth Between 1961 and 1973, labour productivity in the wood industry grew at 2.6 per cent per year, a rate below that of the total economy (3.4 per cent). Output growth advanced at its strongest rate in this period, at 5.1 per cent per year. Employment growth in wood products was also especially fast over the
b) 1989-2000
-0.3
1.11.8
3.2
-2
2
6
1989-1995 1995-2000
%/year

42
Chart 18: Capital Intensity, in 1997Dollars, in the Wood Industry,
1961-2002, 1961=100
50
100
150
200
250
300
1961 1968 1975 1982 1989 1996
1961-1973 period, at 2.7 per cent per year, thereby offsetting some of the output increase in terms of labour productivity growth.
Capital stock growth in the wood products sector was very fast during the 1961-1973 period, with an average annual growth rate of 5.0 per cent. As a result of rapid employment growth, capital intensity grew at a slower 2.5 per cent per year (Chart 18). The analysis presented in the report suggests that while the growth in capital per hour worked did boost labour productivity growth, it did not have a large impact, accounting for only 22 per cent of labour productivity growth. Total factor productivity growth at 2.1 per cent per year was responsible for the remaining 78 per cent.
2. The 1970s – Pick-up in Labour Productivity Growth
Labour productivity growth accelerated to 3.5 per cent per year over 1973-1981, far outperforming the total economy growth of 1.2 per cent per year. Output growth declined significantly relative to the 1960s, at 2.5 per cent per year. Employment declined slightly over the 1973-1981 period, at -0.1 per cent per year.
Capital stock growth fell off to 3.5 per cent per year in 1973-81. Due to declining employment, capital intensity rose at a rapid 4.5 per cent per year and accounted for 30 per cent of labour productivity growth, with total factor productivity growth of 2.4 per cent responsible for the remaining 70 per cent. 3. The 1980s – Continued Strong Labour Productivity Growth Despite Slowdown in
Capital Intensity Growth
Labour productivity growth accelerated to its fastest rate of the 1961-2000 period, at 3.8 per cent in the 1980s, a rate nearly four times the all-industries average of 1.0 per cent growth. Real output growth was strong in the 1980s at 5.4 per cent, nearly double the total economy average of 2.9 per cent. Employment growth rebounded to a 0.7 per cent average annual rate in the 1981-89 period.
Capital stock growth declined further to 1.9 per cent in 1981-89, well below the total economy rate of 2.9 per cent per year. Capital intensity growth was extremely slow,

43
at 0.4 per cent per year so this factor only accounted for 2 per cent of labour productivity growth. Total factor productivity growth at 3.7 per cent per year thus accounted for almost all labour productivity growth. 4. The 1990s – Deceleration of Labour Productivity Growth
In the 1990s, output per hour growth in wood products has been much weaker than that of the 1970s and 1980s, at only 1.2 per cent per year on average. The weak performance, however, was concentrated in the early half of the decade, at a -0.3 per cent per year average annual rate, before picking up to 3.2 per cent in the 1995-2000 period. Real output growth in the 1990s was near the total economy average, although output actually fell during the first half of the decade (-0.9 per cent in 1989-95) before rebounding at a massive 6.6 per cent average annual rate from 1995 to 2000.
Employment advanced at a 1.2 per cent average annual rate in the 1989-2000 period. This latter growth rate was almost equal that of the aggregate economy. Employment growth was particularly robust in the second half of the 1990s, advancing at a 3.2 per cent average annual rate, after falling in the first half of the decade. Capital stock growth rebounded somewhat in the 1990s, to 2.8 per cent per year. This led to capital intensity growth of 1.5 per cent per year, but because of the weak labour productivity performance it still accounted for 28 per cent of the increase in labour productivity. Total factor productivity growth at 0.9 per cent per year and accounted for the remaining 72 per cent.
The analysis in the report suggests that the fall in labour productivity growth in wood products between the 1961-1989 and 1989-2000 periods was mostly (66 per cent) due to the slowdown in total factor productivity growth, with slower capital intensity growth accounting for 34 per cent.
Several factors in addition to the capital intensity of production contributed to the decreased growth in labour productivity of the wood products industry after 1989. • During the 1980s, real wages
in the industry fell at 0.8 per cent per year (Chart 19). While they rebounded somewhat in the 1990s, they did not regain the 1981 level. The fall in the rate of growth of the capital-labour ratio in the 1990s could in principle be explained by a
Chart 19: Average Real Hourly Labour Compensation in the Total Economy and
the Wood Industry in Canada, 1961-2000, 1992 dollars
8
10
12
14
16
18
20
22
1961 1966 1971 1976 1981 1986 1991 1996
Total Economy Wood
1992 $/hr

44
fall in the price of labour. This would give firms less incentive to substitute capital for labour and thereby slow labour productivity growth.
• The rate of increase in the average years of educational attainment in the wood
products industry from 1976 to 1989 was above that of the total economy. Human capital accumulation was likely an important a source of productivity growth for wood products in the 1976-89 period. After 1989, however, the fall-off in productivity was not due to a slowdown in human capital accumulation. The rate of increase in the average years of educational attainment of workers in the sector was not much different from the rate of advance in the 1976-1989 period.
• Between 1961 and 1989 the real price for wood products fell at a 0.7 per cent average
annual rate. In contrast to this decline, in the 1989-2000 period the real price of logging and forestry output increased at an extremely fast pace of 3.7 per cent per year. This favourable price development may have made high cost, low productivity wood products operations profitable and lead to slower labour productivity growth (Chart 20).
Chart 20: Real Output Price and Labour Productivity for the Wood Industry, 1961-2000, 1961=100
50 75
100 125 150 175 200 225 250 275
1961 1965 1969 1973 1977 1981 1985 1989 1993 1997
Real Price Output per Hour
Source: CSLS (2003:Table 156, deflated by CPI).
1961=100
• The pace of technological change and innovation may also have affected productivity
growth. One hypothesis to explain the productivity pattern may be that the pace of technological change in wood products, particularly technological change that is not embodied in the capital stock, was very rapid in the 1960s, 1970s, and 1980s, fostering strong productivity growth. If this pace of technological change subsequently fell off after 1989, it may have been reflected in slower productivity growth. A detailed analysis of trends in technological innovation in the sector would be needed to prove or disprove this hypothesis.

45
• There was been a remarkable decrease in time-loss workplace injuries in the wood products industry throughout the 1980s. Such gains in workplace safety may have had important positive effects on productivity through improving worker morale and encouraging more effort. The gains from this effect may have been exhausted prior to the 1990s.
B. Conclusions The Canadian wood products industry experienced weak labour productivity growth in the 1990s, relative to its performance in the 1960s, 1970s and 1980s. The fall-off in labour productivity was nearly 2 percentage points between the 1980s and the 1990s. Approximately one third of this trend was linked to declines in capital intensity in the industry, while the remaining two thirds resulted from a combination of other factors, the most influential of which was likely the increased price of output after 1989. III. Productivity in the Canadian Paper and Allied Products Industry
The Canadian paper and allied products industry (hereafter the paper industry) has had a good record in terms of labour productivity growth since 1961. The 1990s, in particular, was a period of high growth, with a rate almost three times that of the total economy. Productivity growth in this industry began to take off in the 1980s, when it was double the all industries average. Prior to 1981, the productivity growth in the industry had been weak (Chart 21).
Chart 21: Labour Productivity Growth in the Paper and Allied Products
Industry and the Total Economy in Canada
0.9
4.03.4
1.2 1.0
1.9 2.1
1.4
0
1
2
3
4
5
1961-1973 1973-1981 1981-1989 1989-2000
Paper All Industries
a) 1961-2000%/year
All Industries Average, 1.9 %
Paper Average, 2.3 %
4.1
1.1 1.8
3.8
0
4
1989-1995 1995-2000
b) 1989-2000 %/year

46
A. Productivity Trends and Determinants 1. The 1960s – Below Average Labour Productivity Growth Based on Capital
Deepening and TFP Growth
Between 1961 and 1973, labour productivity advanced at an average annual rate of 1.9 per cent per year in the paper industry, well below the all industries average of 3.4 per cent. Over the same period, the real output growth of the industry experienced its strongest gains, at 3.8 per cent, a rate that was still below the total economy average of 5.8 per cent.
The paper industry experienced rapid capital stock growth during the 1961-1973 period, at 5.1 per cent per year. As a result, capital intensity advanced at 3.2 per cent per year, almost one percentage point above the capital intensity growth of the total economy. Capital deepening was responsible for 58 per cent of labour productivity growth, with total factor productivity growth of 0.8 per cent responsible for the remaining 42 per cent. 2. The 1970s – Very Weak Labour Productivity Growth and Strong Paper Prices
During the 1970s (1973-1981), labour productivity growth fell to 0.9 per cent per year. The relative performance of output growth of the paper industry was the worst in the 1970s, with output advancing a meagre 0.4 per cent per year, compared to the total economy average of 3.3 per cent.
Capital intensity growth actually picked up during the period, advancing at a 3.5 per cent average annual rate and contributing 1.2 points to labour productivity growth (Chart 22). Given the weak labour productivity growth, this contribution actually represented 129 per cent of overall labour productivity growth. This meant that total factor productivity growth fell 0.3 per cent per year over the period.
A key factor contributing to the
weak labour productivity growth and falling total factor productivity was likely the very large increase in the real price of paper products, up 3.7 per cent per year over the period. This favourable price environment allowed marginal operations to continue, lowering average productivity.
Chart 22: Capital Intensity, in 1997 Dollars, in the Paper and Allied Products Industry, 1961-
2002, 1961=100
50
100
150
200
250
300
350
400
450
1961 1968 1975 1982 1989 1996

47
3. The 1980s – Rebound in Labour Productivity and Capital Intensity Growth
Labour productivity growth recovered in the 1980s, picking up to a 2.1 per cent per year rate. Output growth rose to an average 1.4 per cent per year in 1981-89. At the same time, employment fell at a 1.1 average annual rate.
Capital stock growth rebounded to a strong 5.0 per cent growth in 1981-89.
Capital intensity grew at a massive 5.7 per cent per year, greatly exceeding the all-industry average of 1.0 per cent per year (Chart 22). The rebound of labour productivity growth in this industry in the 1980s was almost entirely a result of the increases in capital per hour worked. The analysis in the report suggests that 94 percent of the growth in labour productivity of the 1980s was a result of the growth in capital stock per hour worked, the majority of which came from growth in machinery and equipment stock. Total factor productivity growth was a very weak 0.2 per cent per year. 4. The 1990s – Continued Acceleration of Labour Productivity Growth Based on
TFP Growth
Labour productivity growth in the paper industry was an even stronger 4.0 per cent in 1989-2000. Even in the first half of the 1990s, when demand conditions were weak, productivity growth was very strong (4.1 per cent per year in 1989-1995 versus 3.8 per cent in 1995-2000).
In the 1990s, output growth at 2.1 per cent per year was only slightly below the all industries average of 2.3 per cent. Employment shrank throughout the decade, at -1.7 per cent per year growth over 1989-2000. Employment continued to decline even in the second half of the 1990s, a period of strong economic growth.
In the 1990s, the capital stock increased at a 0.8 per cent average annual growth
rate, much slower than in earlier periods. But the decline in employment and hours worked meant that the capital-labour ratio still advanced 2.7 per cent per year. However, unlike in earlier periods when increased capital intensity was the main driver of labour productivity growth, this was not the case in the 1990s. The analysis conducted in the report suggests that only 24 per cent of the increase in labour productivity growth occurred as a result of increasing capital intensity. Total factor productivity growth contributed the remaining 76 per cent.
Thus the acceleration in labour productivity growth in paper products after 1989 cannot be explained by an increase in the rate of growth of capital intensity of production of the sector. Indeed, just the opposite occurred. A fall in capital intensity growth, arising from a slowdown in the rate of growth of the machinery and equipment-labour ratio, reduced labour productivity growth between periods. It was the acceleration of total factor productivity growth from 0.3 per cent per year in 1961-1989 to 3.0 per cent in 1989-2000 that fully accounts for the acceleration in labour productivity growth.

48
The impact of embodied technical change, which is technical change that is embodied in new capital goods, on productivity is captured by increases in capital intensity. As increased capital intensity cannot account for the post-1989 productivity acceleration in the paper products industry, it is likely that some disembodied technical change occurred and was the main driver of the strong growth in the 1990s. One such example is the scientific process breakthrough in mechanical pulping technology. Canadian scientists were at the forefront of this research, developing a greater understanding of refining technologies that enabled the production of very high quality pulp and making the best possible use of inferior wood species. A second example of process changes is the optimization of manufacturing processes, which seems to have occurred in the 1990s, leading to a reduction in costs. 5. Other Factors Supporting Productivity Growth in the Paper Industry
There are four other characteristics of the Canadian paper industry that have been
necessary in sustaining productivity growth, even though they cannot be considered the main drivers of growth over 1961-2000. • In terms of real compensation, workers in the paper products industry have
experienced above average wage growth over the 1961-2000 period. In the 1990s real wage growth was robust at 2.1 per cent per year, compared to the all industries average of 0.5 per cent. High wages can have a positive effect on productivity through incentives to exert more effort.
• The rate of increase in average educational attainment of workers in paper products
was 0.54 per cent per year in the 1989-2000 period, compared to 0.46 per cent in the 1976-1989 period. This minimal pick-up is clearly insufficient to account for the acceleration of labour productivity growth between periods, although certainly the increase in human capital contributed to productivity growth.
• The real price of paper may have had an influence on the productivity of the sector.
Overall in the 1990s (1989-2000), the real price of paper products fell an average 0.4 per cent per year (Chart 23). Productivity growth took off during this period. The real price of paper was extremely volatile in the 1980s, and productivity improved over this period. During the 1970s, there were large increases in the real price of paper, at nearly 4 per cent per year, and it was during this period that productivity growth was slowest.

49
Chart 23: Real Output Price and Labour Productivity for the Paper and Allied Products Industry, 1961-2000, 1961=100
50
75
100
125
150
175
200
225
1961 1965 1969 1973 1977 1981 1985 1989 1993 1997
Real Price
Output per hour
Source: CSLS (2003:Table 156, deflated by CPI).
1961=100
B. Conclusions
The key development in terms of the productivity performance of the paper products sector is the acceleration in labour productivity growth after 1989. From 1961 to 1989, labour productivity advanced at a 1.7 per cent average annual rate. From 1989 to 2000, it grew at a 4.0 per cent rate, a turnaround of 2.3 percentage points. The acceleration in the 1990s is in sharp contrast to the productivity growth decelerations that hit forestry and logging and wood products. It is particularly interesting to note that it was the first half of the 1990s, when demand conditions were weak that productivity growth in paper products was very strong (4.1 per cent per year in 1989-1995 versus 3.8 per cent in 1995-2000)
Paper products have, by far, the highest productivity levels of the three industries
that make up the forest products sector. In 2000, output per hour in this sector was 17 per cent higher than in forestry and logging and 79 per cent higher than in wood products.
In the 1961-89 period, the increase in capital intensity accounted for about four-fifths the total growth in labour productivity. After 1989, there was a turnaround as capital intensity increases declined in importance in terms of labour productivity growth. Given the lack of evidence that other factors can account for the acceleration in labour productivity growth in the paper products industry after 1989 in Canada, it would appear reasonable to conclude that a favourable technology shock was largely responsible, although direct evidence of this is difficult to find. It seems that better technologies, largely not embodied in the capital stock, have been the main driver of the acceleration in labour and total factor productivity growth in the paper products industry in Canada in the 1990s.

50
Part Four: The Earth Sciences I. Introduction to the Earth Sciences Industries
The Earth Sciences industries are an increasingly important contributor to the productivity performance of many natural resources industries. The earth sciences industries include both the geomatics service industry and geosciences industries. This part of the report examines the growing earth sciences industries in Canada, and highlights several technological innovations that have contributed to productivity growth in the natural resource industries.
The earth sciences industries provide support for both exploration activity and the actual planning and production processes in many natural resource industries. Earth science industries act as an important driver of productivity in natural resource industries, as their services and products not only add to the capital stock of natural resource industries, but also represent a high level of technology. Unfortunately, there are several serious deficiencies in the data required to undertake a full productivity analysis of this industry. In most cases, earth science industries are included within larger sector or activity aggregates in the macroeconomic databases available for public use. This prevents a detailed and meaningful study of the true productivity performance of these industries. Additionally, it is difficult, in general, to assess the productivity performance of service industries due to measurement problems in determining real output estimates for such sectors.
The little data available can be used to calculate output per hour estimates for the scientific and technical services industries aggregate for 1997 through 2002, and for support activities for mining and oil and gas for the period 1987-2002. Both sectors contain geomatics activities among many other scientific and mining support services. These data reveal that:
• between 1997 and 2000, output per hour in the scientific and technical services industries declined by 2.8 per cent per year, from $29.15 in 1997 (1997 constant dollars) to $26.73 in 2000. Productivity rebounded slightly to $28.11 in 2002, but the productivity growth rate over the 1997-2002 period was still negative, at -0.7 per cent per year;
• output per hour in the support activities for mining and oil and gas advanced at a
strong 3.6 per cent per year average annual rate between 1989 and 2000. However, labour productivity fell sharply after 2000, and growth over the 1989-2002 period was 1.1 per cent per year.
The limited usefulness of examining these aggregates and the possibility of
serious measurement problems make discussion of productivity developments problematic. It is consequently more useful to focus on the broader developments in the

51
earth science industries and the importance of earth sciences to the productivity performance of natural resource industries.
II. Technology and the Development of Earth Sciences
The lack of output and employment data makes the growth of the earth sciences difficult to measure. Information from Natural Resources Canada officials, does, however, highlight the growing size of the earth sciences in Canada and internationally. The international market for earth sciences products and services has been estimated at $30 billion and is growing at more than 20 per cent per year. Canada has a large role in this industry, as it is an important world supplier of such technologies as remote sensing products and services, electronics used in satellite receiving stations and image processing systems. Additional evidence shows that the worldwide usage of Geographic Information Systems (GIS) software has increased exponentially since 1980. The growth of the earth sciences over the past decade and more therefore appears to be truly remarkable.
This apparent growth seems to be linked to three important developments. First, technology, especially in terms of the widespread availability of computing power, has advanced rapidly throughout the 1990s. Steep reductions in cost have increased the feasibility of using high-powered geoscience services at the firm or individual worker level.
Second, and also driven by technological developments, are newer software packages that are designed to run on popular operating systems, so that the software and hardware components can be upgraded separately. This increases productivity by reducing learning times, since the hardware (i.e. personal computers) is standard across different software applications.
Finally, the drop in oil prices in the early 1990s, and to a lesser extent the gradual decline in the prices of many other natural resource commodities throughout the 1980s and 1990s, seems to have driven firms to demand very high returns to exploration. In contrast to periods of high prices, where exploration activity is typically very intense due to the large payoff of extracting from virtually any deposit, low prices encourage managers to reduce costs by exploiting only the most productive deposits, and by exploiting them more efficiently.
In the 1990s, this led to a substitution away from traditional exploration techniques and towards geoscience techniques, requiring investments in new technologies, the acquisition of detailed geophysical data, and a workforce skilled in the use of these technologies and in the interpretation of such data. These techniques were also applied to the natural resource extraction process, as the geophysical data allowed the quantity and location of remaining reserves to be more accurately described. The period of low oil prices therefore contributed to the apparent rapid growth of the

52
geoscience industry in the 1990s. Now that the industry is firmly established and natural resource industries are convinced of its benefits, geoscience services have continued to be sought at an increasing rate.
One other factor that is sure to contribute to the further success of the earth sciences is the increasing availability of detailed geophysical data. Up to 60 per cent of the time of geomatics workers can be spent searching for appropriate data. This has likely been reduced significantly in recent years by the efforts of Geomatics Canada and the Geological Survey of Canada in undertaking surveys and making the results available, as well as by the development of GeoConnections and the Canadian Geospatial Data Infrastructure. The availability of such data can significantly improve the growth of the earth sciences, which have a large impact on the productivity growth of natural resource industries though increasing the productivity of exploration and extraction.
III. The Impact of Earth Sciences on Natural Resource Industries A. Mining
The primary application of geoscience technology in the exploration and development phases of mining industries is in the production of detailed and increasingly high-resolution maps of underground rock formations and resource deposits. In particular, the use of seismic and electromagnetic data and ground-penetrating radar for identifying the underground location of deposits and evaluating the potential metal content of ores, or the location of gemstones and diamonds, can have large payoffs in terms of choosing the most productive sites for development. The future of geoscience technology applications will be in the continued refinement and improvement of these technologies to further reduce the expense and uncertainty of extraction and production. Three-dimensional GIS is becoming increasingly common as well, and is used to plan actual ore extraction and facilitate mine planning. B. Crude Oil and Natural Gas
The oil and gas industry relies on new technological advances to meet projected demand for new oil and gas supplies. Anecdotal evidence from the industry reveals that recent dramatic changes in the technology employed by the oil and gas industry are a central part of a dramatic story of productivity change that has occurred in this industry in the 1990s.
Three-dimensional (3D) seismology has been the most important technological change to affect the oil and gas industry in the past 10-15 years. This technology has been used to create high quality images of the structure and properties of sub-surface rock layers. In terms of increasing efficiency, these higher quality images improve the ability of producers to locate new hydrocarbon deposits, determine the characteristics of reservoirs for optimal development and determine the best approach for the development

53
of a reservoir. Producers have had remarkable success in finding and developing reserves with this technology, especially when it has been combined with other technologies such as horizontal drilling.
In production of oil and gas, the addition of a time component to the three-dimensional imaging technology has proved beneficial. 4-D technology has allowed well operators to track the characteristics of deposits over time, permitting a better understanding of the impact of drilling on deposits and enabling better decision making and more efficient management of the depletion of reservoirs. The use of sophisticated visualization technologies that can graphically present the data from 3-D seismology applications has also proved useful in integrating team members of different backgrounds and skills. One study has estimated that 3-D technology has been responsible for increasing the success rate in the exploration phase of oil and gas production from about 20 per cent to 50 per cent, and the success rate in the development phase from about 70 per cent to about 85 per cent.
In terms of offshore exploration, 3-D surveys and multi-beam mapping technology have been employed to map the Scotian Shelf sea floor. The production of these maps is crucial to both the environmental protection of this area and to oil and gas producers making decisions regarding the development of coastal and offshore reserves. This information allows producers to identify the best locations for exploration and production rigs, in terms of output potential and construction costs. It also helps producers identify and mitigate natural hazard risks. C. Forestry and Logging
The impact of earth sciences on the forestry sector appears to be more limited than for other natural resource industries. Geomatics activities in the forestry sector appear to be concentrated in helping firms meet their environmental objectives, in terms of minimizing harm through strategic selective cutting, and planning effective reforestation. Remote sensing technology and geographic information systems are key geomatics technologies for these forestry applications. IV. Key Observations
Overall, in the future, many natural resource industries in Canada will focus on exploiting reserves that have previously been technologically unfeasible, and on more inaccessible reserves. There will be an increasingly important role for geoscience technologies that can be implemented in the field and provide valuable information faster in remote areas.
The observations on the widespread application of earth science technologies confirms the indirect evidence, presented in the previous section, of rapid growth in this

54
industry in the 1990s and the beneficial impact this industrial sector has had on the productivity performance of natural resource industries.
The period of low oil and other natural resources commodity prices created an environment in which natural resource producers were searching for more efficient, low cost, and low risk methods for both exploring and developing resources. Low prices therefore contributed to the rapid growth of the earth sciences in the 1990s.
A key driver of productivity growth in natural resource industries will hence be the continued expansion of the earth sciences industries. The adoption of new technologies, in combination with the hiring of skilled workers, will continue to drive this expansion. The importance of skilled technicians to the efficient use of these technologies cannot be ignored. The efforts of Geomatics Canada and the Geological Survey of Canada in collecting and providing detailed geophysical and other earth sciences data (e.g. geochemical, remote sensing, etc.) will also have favourable effects for the earth sciences industries as a whole, and therefore for natural resource industries in general.
55
Part Five: Synthesis of the Main Lessons from the Productivity Experiences of High and Low Productivity Growth Natural Resource Industries I. Assessing Productivity Performance Before discussing the productivity performance of natural resource industries, it is useful to discuss what is meant by the term “productivity performance” and to ascertain in this regard the productivity performance of the eight natural resource industries covered in this report. These industries are coal, gold, electricity, oil and gas, logging and forestry, wood, paper, and diamonds (data only available for 1997-2001).6
There are at least three perspectives on, or definitions of, productivity performance. Each definition can be applied to labour productivity, capital productivity, and total factor productivity. Of course, performance is sensitive to the year or period chosen for analysis.
• absolute productivity levels; • productivity growth rates; and,
• changes in productivity growth rates between key periods. In terms of the first definition, in 2000 all natural resource industries covered in
this report with the exception of wood had an above average labour productivity level. This situation is largely explained by the above average capital intensity of the industries. Most of the industries studied experienced above average productivity growth. This is illustrated in Table 2 below, which shows the classification of the industries into high and low productivity growth groups based on their labour and total factor productivity performance (relative to all industries) for the 1961-2000 and 1989-2000 periods. Table 2 reveals the following observations: • In 1961-2000, six of the seven selected natural resource industries had above average
labour productivity growth. But in the more recent 1989-2000 period, only four industries exceeded the all industries average.
• In 1961-2000, five of seven selected natural resource industries had above average
TFP growth. Again this fell to three industries in the 1990s.
6 The earth sciences sector is also discussed, but there are no productivity data available for this sector.

56
Table 2: Labour and Total Factor Productivity in Selected Natural Resource Industries (Average Annual Growth)
Labour Productivity
Total Factor Productivity
Industry 1961-2000
1989-2000
1961-2000
1989-2000
Productivity Classification
Coal
7.2
7.4
3.7
6.1
High
Electricity
2.3
1.0
0.7
-0.8
Low Gold
2.4
5.7
-0.9
3.0
High
Logging & forestry
2.3
0.1
1.9
0.3
Intermediate
Oil and gas
-0.9
4.9
-1.9
-0.7
Low
Paper
2.3
4.0
1.1
3.0
High
Wood
2.7
1.3
2.1
0.9
High
Economy Average
1.8
1.1
1.2
0.7
Legend: indicates that the industry productivity growth was above that of the total economy.
indicates that the industry productivity growth was below that of the total economy.
As illustrated in Table 2, coal mining, gold mining, the paper products industry
and the wood industry are classified as the high productivity growth group, based on the two periods and two productivity measures. Oil and gas extraction and the electricity industry can be classified as the low productivity growth group. Logging and forestry is in an intermediate position between the high and low productivity performance groups. This typology will be used in the analysis of the drivers of productivity growth in the seven selected natural resource industries to ascertain if any productivity determinants are associated with a particular productivity performance group.

57
II. Lessons from the Productivity Experience of Selected Natural Resource Industries
This section highlights a number of the key findings or conclusions arising out of the productivity analysis undertaken for this report. A. General Observations • There have been significant declines in workplace injuries and fatalities in natural
resource industries, and there appear to have been reductions in environmental damage associated with natural resource extraction. Consequently, conventional estimates of productivity in natural resource industries, which do not reflect trends in these two areas, likely underestimate the broader productivity gains, measured from a societal or social perspective, that have taken place in natural resource industries.
• In sparsely populated provinces or territories, the development of natural resource
industries can greatly affect aggregate productivity levels and growth because of the high value added per hour worked associated with these industries. The development of offshore oil production in Newfoundland and the diamond industry in the Northwest Territories have propelled these two jurisdictions to top positions in terms of productivity growth among Canadian provinces and territories in recent years.
• As an economic incentive and as a determinant of the financial health of an industry,
the importance of profitability trumps that of productivity. The two concepts normally go hand in hand as increased productivity leads to higher profits, at least in the short-run before new entrants drive down prices and reduce profits. But in natural resource industries a price shock can have differential effects on profits and productivity. For example, the oil price shock in 1973 increased profitability, but lead to lower average productivity. Firms, which enjoyed high levels of profitability, now had an incentive to exploit poor quality, low productivity resources.
• The OECD study discussed in the introduction of this report found that trade
exposure increases competitive pressures and fosters productivity growth. Natural resource industries in Canada, whether in the energy, mining or forestry products sector, export most of their output and compete with other countries for international markets. Thus they have always been subject to a high degree of trade exposure. While this factor has certainly contributed to the high productivity levels and growth rates in these industries, it is not a new development, in contrast to certain manufacturing and service industries recently exposed to international competition.

58
B. Observations on Productivity Growth Determinants Table 3 illustrates the importance of the main productivity drivers in natural resource industries identified by the report. These are discussed in more detail below.
Table 3: Synthesis of the Main Labour Productivity Drivers in Natural Resource Industries in Canada, 1961-2000 Real
Output Price
Capital Intensity
Technology and
Innovation
Human Capital
Other Factors
High Productivity Growth Natural Resource Industries Coal M H H H L
Wood M L L M L
Paper L H H M L
Gold M H H M H
Low Productivity Growth Natural Resource Industries Oil and Gas H L H L H
Electricity L H L M L
Intermediate Productivity Growth Natural Resource Industries Logging and Forestry H M L M L Legend: H indicates that the factor was of high importance in determining the labour
productivity performance of a given industry over the 1961-2000 period.
M indicates that the factor was of moderate importance.
L indicates that the factor was of little or no importance. • Capital deepening, that is increases in the capital-labour ratio, is a key driver of
labour productivity growth, although the impact varies by industry and by period. For example, Chart 24 shows that over the 1961-2000 period increased capital intensity accounted for all the labour productivity growth in the gold industry, but only one fifth of labour productivity growth in logging and forestry. The faster long run growth of labour productivity in natural resource industries, relative to the all industries average, can be explained by the faster growth in the capital intensity of these industries. Over the 1961-2000 period, the average absolute contribution of capital intensity growth to labour productivity growth was much less in the group of low and average productivity growth industries (1.0 percentage points per year) than in the group of high productivity growth industries (1.9 points). This supports the importance of capital intensity as a key driver of productivity growth.

59
• Along with capital intensity growth, technical advance is the most important driver of
labour productivity in natural resource industries. This has especially been the case in the 1990s, with the computerization of production processes. A key component of technological change in natural resource industries is innovation in exploration and development. Such innovation has been concentrated in the technology-driven earth sciences industries, whose services will continue to make a significant contribution to labour productivity growth in natural resource industries.
Chart 24: Absolute Contributions of Capital Deepening and Educational Attainment to Average Annual Labour
Productivity Growth, 1961-2000
0.1
0.4
0.3
0.4
0.6
0.3
0.3
0.9
1.6
0.4
3.4
3.4
0.5
1.2
2.3
2.3
2.4
7.2
2.7
2.3
-0.9
-2 -1 0 1 2 3 4 5 6 7 8
oil and gas
electricity
logging and forestry
gold
coal
wood
paper
percentage points
Labour Productivity Growth, 1961-2000
Absolute Contribution from Capital Deepening
Absolute Contribution from Educational Attainment
Average Productivity Growth
Low Productivity Growth
High Productivity Growth
Note: Industries were classified as high, average or low productivity growth based on both labour and total factor productivity growth for both the 1961-2000 and 1989-2000 periods. Therefore, although, for example, electricity and paper had similar labour productivity growth in 1961-2000, electricity performed worse than paper in the other three categories and was therefore classified as a low productivity growth industry.

60
• With the increased use of sophisticated technologies and the related shift from blue
collar to white collar occupations, human capital has become increasingly important for long-run productivity growth in natural resource industries. Chart 24 also shows contributions of educational attainment to labour productivity growth.7 Education made a substantial contribution to productivity growth in each of the industries examined, although in all cases the contribution from education was smaller than that from capital intensity. Education’s contribution to productivity growth was only slightly larger in the high productivity growth industries than in the low and average growth industries (0.4 percentage points per year versus 0.3 points). It should be noted, however, that there is no automatic mechanism whereby increased educational attainment raises labour productivity. Other conditions must be present, including appropriate incentive structures for firms to invest.
• Price trends are the key for understanding productivity developments in many natural
resource industries. In general, high output prices have a negative effect on productivity as they encourage exploitation of poor quality deposits and lower productivity through a composition effect. Low prices tend to have a favourable effect on productivity through the exit of marginal operations.
Table 3 also provides insights on the productivity drivers that were particularly
relevant for high and low productivity growth natural resource industries. • Three of the four high labour productivity growth industries have above average
contributions from capital intensity and technology. The three intermediate and low productivity growth industries, on the other hand, each have below average contributions from either capital intensity, technological progress or both.
• Low productivity growth industries tend to have slightly below average contributions
from human capital. Oil and gas, a low productivity growth industry, saw the average years of educational attainment of its workers increase at a rate significantly below that of the total economy. Coal mining, a high productivity growth industry, saw the average years of educational attainment of its workers increase at a rate significantly above that of the total economy.
• It also appears that productivity trends in low productivity growth industries are
slightly more sensitive to output prices than high growth industries.
7 The contributions of educational attainment to labour productivity growth in Chart 24 were calculated based on econometric analysis of the determinants of productivity growth in OECD countries, which was carried out by the OECD as discussed in the introduction of this report. They are not strictly consistent with the contributions from capital intensity, since they are calculated based on a different methodology. Data on educational attainment are from the Labour Force Survey of Statistics Canada, and the metal ore mining industry is used as a proxy for the gold mining industry. Since educational attainment data are only available for the period after 1976, the 1976-2000 average annual growth rate in each industry was assumed to hold for the entire 1961-2000 period.

61
III. Policy Levers to Improve Productivity Growth
The responsibility for private sector productivity growth lies largely with the private sector itself. Through their decisions regarding capital investment, the introduction of new technologies, and the training of their workforce, firms determine the pace of productivity advance in their industry. But public policy can also play an important role in fostering private sector productivity through its effects on the environment in which private sector decisions on the productivity drivers – investment, innovation, human capital accumulation – take place. For example, this report has stressed the importance of technological innovation for productivity growth in natural resource industries. Government policy supports innovation though financial assistance for R&D spending (both through the tax system and through grants and loans) and through programs that foster the diffusion of new technologies. The tax treatment of R&D in Canada is generous by international standards and certainly does not explain our relatively low level of business sector R&D spending. Firms already have an incentive to use the most recent technological advances in their area. However, information and knowledge are imperfect and many opportunities for productivity improvement may go unexpolited, particularly by small firms who do not have the resources to keep abreast of technological developments. A case can be made that there is an important role for government in providing information on technological developments to industry. Existing programs such as the Industrial Research Assistance Program (IRAP) already fulfill this role. But there may be a significant productivity payoff from strengthening and expanding such programs.
Two additional observations on policy are the following: • An objective of natural resource policy in Canadian industries is to promote increased
value added in downstream activities, particularly in peripheral regions, subsequent to the extraction of natural resources. The diamond industry represents an example of how policy levers have been used in the Northwest Territories to foster the development of value-added activities such as cutting and polishing related to diamond mining. A factor conditioning the relative success of this policy has been the large amount of economic rent in diamond mining, which gives the government a certain amount of leverage over the industry.
• A key characteristic of all industries is the large variation in productivity levels across
firms and plants within the same industry. Composition effects, that is changes in the distribution of low and high productivity plants within an industry, account for much of industry-specific productivity growth. One way to improve industry productivity growth is to develop policies that foster the diffusion of best practice techniques to increase the productivity of the low productivity plants and hence reduce the productivity gap within the industry. A second approach is to pursue policies that encourage or force low productivity plants to exit the industry, thereby increasing average productivity through this composition effect.

62
Part Six: Conclusions
Overall, Canada’s natural resource industries have tended to experience faster labour productivity growth than other Canadian industries over the past 40 years. This has been consistently the case in each of the past four decades, including the 1970s in which the productivity growth slowdown was more severe in natural resource industries than in the economy on average. This report has attempted to uncover the factors driving the impressive productivity performance of natural resource industries in Canada.
The major drivers of labour productivity growth in natural resource industries in
Canada identified by this report are technology, capital intensity and skills. High productivity growth natural resource industries tend to excel in each of these areas, and lower productivity growth natural resource industries are deficient in at least one. Further, it appears that higher productivity growth natural resource industries tend to be proficient at exploiting the interrelations between these primary drivers. For example, the educational qualifications of the workforce drive productivity growth by improving the quality of labour services, but also improve productivity growth because they are complementary with advanced technologies requiring highly skilled workers.
In addition to these three major factors behind productivity growth in natural resource industries, the report also identifies the price of output and advanced exploration techniques as important in many natural resource industries. Most of these advanced exploration techniques emanate from the technology-driven earth sciences industries. It appears that productivity trends in low productivity growth industries are slightly more sensitive to output prices than high growth industries. High prices tend to encourage the exploitation of poorer quality reserves and hence reduce the productivity of operations on average. But high productivity growth natural resource industries have typically been more active than low growth industries in utilizing earth sciences technologies to identify richer reserves and exploit them more efficiently.
This report has made four further observations related to productivity in natural
resource industries: • There have been significant declines in workplace injuries and fatalities in natural
resource industries, and there appear to have been reductions in environmental damage associated with natural resource extraction. Productivity growth from a social perspective is therefore likely higher in natural resource industries than is suggested by conventional estimates, which do not reflect trends in these two areas.
• In sparsely populated provinces or territories, the development of natural resource
industries can greatly affect aggregate productivity levels and growth because of the high value added per hour worked associated with these industries.
63
• As an economic incentive and as a determinant of the financial health of an industry,
the importance of profitability trumps that of productivity. In times of high output prices, firms may not have enough of an incentive to pursue productivity gains, as profits can be maximized by exploiting lower quality reserves, which also reduces average productivity.
• Trade exposure increases competitive pressures and fosters productivity growth.
Natural resource industries in Canada have always been subject to a high degree of trade exposure. While this factor has certainly contributed to the high productivity levels and growth rates in these industries, it is not a new development, in contrast to certain manufacturing and service industries recently exposed to international competition.
This report has also made some brief policy suggestions for improving
productivity growth in natural resource industries. The responsibility for private sector productivity growth lies largely with the private sector itself. Through their decisions regarding capital investment, the introduction of new technologies, and the training of their workforce, firms determine the pace of productivity advance in their industry. But public policy can also play an important role in fostering private sector productivity through its effects on the environment in which private sector decisions on the productivity drivers – investment, innovation, human capital accumulation – take place.
In particular:
• An across-the-board reduction in business taxes may have a productivity enhancing effect through encouraging investment. Recent federal initiatives were aimed at making the tax treatment of the oil and gas industry more comparable to that in other natural resource industries.
• It may be possible to encourage research and development by providing tax incentives and research grants, and by promoting diffusion of information on technological advances through programs like the Industrial Research Assistance Program.
• An effective way to ensure an adequate supply of skilled workers may be to promote
and support sector councils, such as the Mining Industry Training and Adjustment Council.
• It may also be desirable to use government policy to encourage the establishment of
high productivity growth natural resource industries in peripheral regions; and to encourage the adoption of best practices by – or alternatively the exit of – low productivity firms in order to boost the average productivity growth of a given natural resource industry.