PRODUCTIVITY NORMS FOR MAKING DYNAMIC PLANS UNDER …zbornik.gf.uns.ac.rs/doc/NS2016.104.pdf ·...
10
4. МЕЂУНАРОДНА КОНФЕРЕНЦИЈА Савремена достигнућа у грађевинарству 22. април 2016. Суботица, СРБИЈА | ЗБОРНИК РАДОВА МЕЂУНАРОДНЕ КОНФЕРЕНЦИЈЕ (2016) | 1027 PRODUCTIVITY NORMS FOR MAKING DYNAMIC PLANS UNDER UNCERTAINTY Dejan Beljaković 1 Aleksandar Milajić 2 UDK: 65.01 : 69.05 DOI:10.14415/konferencijaGFS 2016.104 Summary: Critical Path Method is a vital tool for the planning and control of complex projects. The successful implementation of this method requires availability of a clearly defined duration for each activity. However, due to the long duration of the construction and risks that accompany this process, it is often very difficult or almost impossible to accurately predict the duration of an activity, and consequently to take it for granted that the given activity will be finished on the very same day that is given in the dynamic plan of construction. The aim of this research was to establish new productivity norms for construction works for planing under uncertainty. Keywords: Critical Path Method, productivity norms, dynamic plans, uncertainty 1. INTRODUCTION Term norm has specialized contextual meanings in different academic disciplines, but in general, all these meanings relate to an ideal standard or model. In construction industry, it is accepted that the norm is standard of work, i.e. the time needed for completing a given task. Therefore, productivity in construction works can be defined as the time required by a skilled worker qualified for a given type of work to successfully complete specific procedure and/or sequence of work operations with satisfactory quality using appropriate tools and/or machines, in average surrounding and ambient conditions, with normal effort and fatigue. Standard productivity norms, which have been used for decades in civil engineering for calculating and planning duration of the construction works, can be described as deterministic, because they are always precisely and strictly defined by a number. However, in realistic situations in practice, there are many cases where activity duration cannot be presented in a precise manner, especially in construction projects. Due to the long duration of construction works and risks that accompany this process, it is often very difficult or almost impossible to accurately predict the duration of an activity, and consequently to take it for granted that the given activity will be finished 1 Dejan Beljaković, Faculty of Construction Management, Union Nikola Tesla University, Cara Dušana 62–64, Belgrade, Serbia, e-mail: [email protected] 2 Aleksandar Milajić, Faculty of Construction Management, Union Nikola Tesla University, Cara Dušana 62– 64, Belgrade, Serbia, e-mail: [email protected]
Transcript of PRODUCTIVITY NORMS FOR MAKING DYNAMIC PLANS UNDER …zbornik.gf.uns.ac.rs/doc/NS2016.104.pdf ·...

4. МЕЂУНАРОДНА КОНФЕРЕНЦИЈА
Савремена достигнућа у грађевинарству 22. април 2016. Суботица, СРБИЈА
| ЗБОРНИК РАДОВА МЕЂУНАРОДНЕ КОНФЕРЕНЦИЈЕ (2016) | 1027
PRODUCTIVITY NORMS FOR MAKING DYNAMIC
PLANS UNDER UNCERTAINTY
Dejan Beljaković 1
Aleksandar Milajić2 UDK: 65.01 : 69.05
DOI:10.14415/konferencijaGFS 2016.104
Summary: Critical Path Method is a vital tool for the planning and control of complex
projects. The successful implementation of this method requires availability of a clearly
defined duration for each activity. However, due to the long duration of the construction
and risks that accompany this process, it is often very difficult or almost impossible to
accurately predict the duration of an activity, and consequently to take it for granted
that the given activity will be finished on the very same day that is given in the dynamic
plan of construction. The aim of this research was to establish new productivity norms
for construction works for planing under uncertainty.
Keywords: Critical Path Method, productivity norms, dynamic plans, uncertainty
1. INTRODUCTION
Term norm has specialized contextual meanings in different academic disciplines, but
in general, all these meanings relate to an ideal standard or model. In construction
industry, it is accepted that the norm is standard of work, i.e. the time needed for
completing a given task. Therefore, productivity in construction works can be defined
as the time required by a skilled worker qualified for a given type of work to
successfully complete specific procedure and/or sequence of work operations with
satisfactory quality using appropriate tools and/or machines, in average surrounding
and ambient conditions, with normal effort and fatigue.
Standard productivity norms, which have been used for decades in civil engineering
for calculating and planning duration of the construction works, can be described as
deterministic, because they are always precisely and strictly defined by a number.
However, in realistic situations in practice, there are many cases where activity
duration cannot be presented in a precise manner, especially in construction projects.
Due to the long duration of construction works and risks that accompany this process,
it is often very difficult or almost impossible to accurately predict the duration of an
activity, and consequently to take it for granted that the given activity will be finished
1 Dejan Beljaković, Faculty of Construction Management, Union Nikola Tesla University, Cara Dušana 62–64,
Belgrade, Serbia, e-mail: [email protected] 2 Aleksandar Milajić, Faculty of Construction Management, Union Nikola Tesla University, Cara Dušana 62–
64, Belgrade, Serbia, e-mail: [email protected]
4th INTERNATIONAL CONFERENCE
Contemporary achievements in civil engineering 22. April 2016. Subotica, SERBIA
1028 | CONFERENCE PROCEEDINGS INTERNATIONAL CONFERENCE (2016) |
on the very same day that is given in the dynamic plan of construction. In engineering
practice, durations of different activities are usually taken from the productivity
norms for man-hours calculation, which are often too generalized and sometimes
obviously not accurate. For example, productivity rates for man-hours calculation for
in-situ reinforcement fixing are based only on total amount of the reinforcing steel
[1], regardless of the pattern complexity which can greatly affect time needed for
proper placing, tying and control. Because of that, patterns consisting of 12Ø16 and
3Ø32 bars, respectively, have exactly the same total amount of steel and consequently
the same theoretical number of man-hours needed for placing and fixing, although it
is obvious that such result would not be realistic, as was proven in studies [2, 3].
Besides that, Proverbs at al. [4] have proven that productivity rates can significantly
wary from country to country. All these factors can lead to an unreliable dynamic
plan for a given construction project.
Deterministic version of the Critical Path Method (CPM), known in practice for decades,
is characterized by the fact that the duration of any activity in the network diagram is
known and expressed deterministically (by exactly one number). However, it would be
more realistic to have the duration of any construction activity and deadline for its
accomplishment in the general dynamic plan of construction expressed as an interval of
a few days rather than one specific day (date) [5]. The first solution of this problem has
emerged in the form of the PERT method (Program Evaluation and Review Technique),
which is based on the theory of probability. However, application of the PERT method is
very limited in practice due to the fact that existing production norms provide only
average times for accomplishing different activities, while all other data, such as
optimistic and pessimistic times, have to be estimated in accordance with personal
experience.
The aim of presented study was to enable probabilistic approach in planning by creating
productivity norms that provide most likely time, optimistic time and pessimistic time
for each activity, based not on individual estimation but on realistic data obtained by the
field research. Methodology for creating probabilistic productivity norms is illustrated
by example of times needed for laying ceramic floor and wall tiles.
2. PERT METHOD
Although the CPM technique has become widely recognized as valuable tool for
planning and scheduling large construction projects, the successful implementation of
this method requires the availability of clearly determined time duration for each
activity. In case of construction projects, due to the complexity, long duration and
accompanied and unavoidable risks, it is often unrealistic to expect that a given activity,
group of activities or the entire project will be accomplished on the very day given in the
dynamic plan of construction. This results in an unreliable dynamic plan for construction
process.
In order to create a realistic and more applicable progress schedule in the construction
industry, it is often better to use the PERT method, which does not provide exact date of

4. МЕЂУНАРОДНА КОНФЕРЕНЦИЈА
Савремена достигнућа у грађевинарству 22. април 2016. Суботица, СРБИЈА
| ЗБОРНИК РАДОВА МЕЂУНАРОДНЕ КОНФЕРЕНЦИЈЕ (2016) | 1029
accomplishing given task, but the time interval in which the task will be accomplished.
PERT technique treats activity completion time using the Three Times Estimation
approach, i.e. as a set of three variables. This approach includes the element of
uncertainty in order to provide time-frame for the PERT network chart.
In this approach, every activity’s duration is described by a set of three data that can be
obtained by a statistical study or subjective estimation:
to = optimistic time – minimum possible time required to accomplish the task;
tm = most likely time – activity duration with high probability of completing the
task;
tp = pessimistic time – maximum possible time required to accomplish the task.
These three variables are used for calculating the expected time (te), defined as most
probable (average) time for accomplishing given activity:
6
4t e
omp ttt (1)
with standard deviation:
6te
op tt (2)
Although the PERT method has proven to be a reliable source for making dynamic
plans, its application in engineering practice is limited by the fact that official
productivity norms prove only most likely times, while optimistic and pessimistic times
have to be estimated by an individual’s estimation based on experience.
This paper presents methodology for developing database of productivity norms
applicable for the PERT method, in which each activity is described by its three
characteristic times, namely: optimistic, most likely and pessimistic time. As it will be
shown on example of creating probabilistic productivity norms for ceramic tiles laying,
this approach can be further developed by introducing the level of probability of
performing given activity which would enable planning with higher or lower accuracy.
3. DATA PROCESSING
Data collection was carried out at five different construction sites and included following
activities:
SRW 1: Laying ceramic floor tile 10x20 in cement mortar
4th INTERNATIONAL CONFERENCE
Contemporary achievements in civil engineering 22. April 2016. Subotica, SERBIA
1030 | CONFERENCE PROCEEDINGS INTERNATIONAL CONFERENCE (2016) |
SRW 2: Laying ceramic floor tile 10x20 with adhesive
SRW 3: Laying ceramic floor tile 10x10 in cement mortar
SRW 4: Laying ceramic floor tile 10x10 with adhesive
SRW 5: Laying ceramic floor tile 20x20 in cement mortar
SRW 6: Laying ceramic wall tile 15x15 in cement mortar
SRW 7: Laying ceramic wall tile 15x15 in cement mortar with highlighted joints
SRW 8: Laying ceramic wall tile 10x20 in cement mortar
SRW 9: Laying ceramic wall tile 10x20 in cement mortar with highlighted joints
SRW 10: Laying ceramic wall tile 15x15 with adhesive
SRW 11: Laying ceramic wall tile 15x15 with adhesive with highlighted joints
SRW 12: Laying ceramic wall tile 10x20 with adhesive
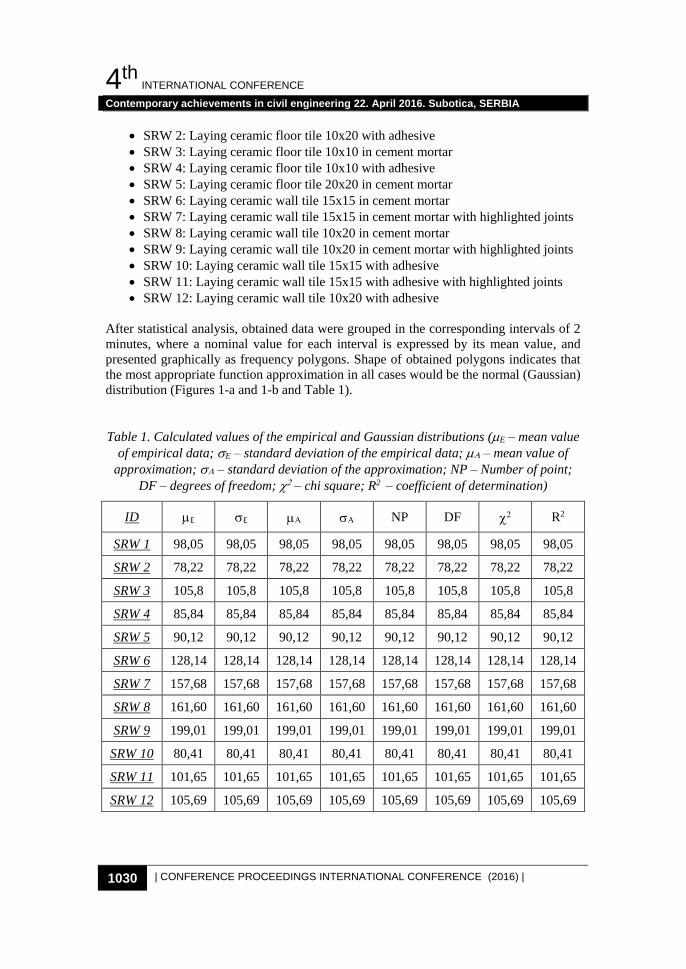
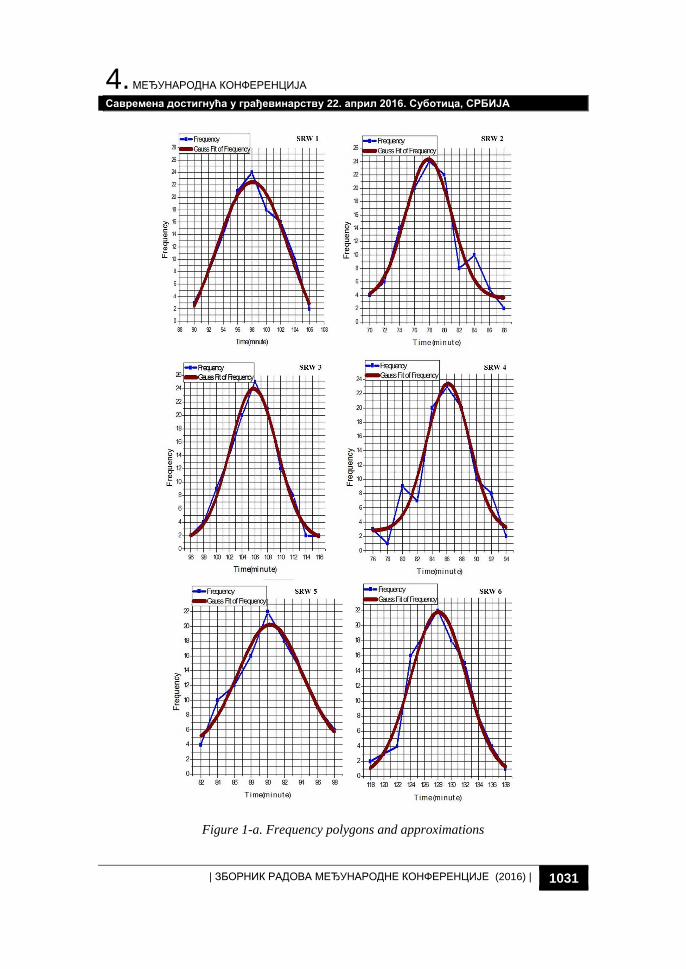
After statistical analysis, obtained data were grouped in the corresponding intervals of 2
minutes, where a nominal value for each interval is expressed by its mean value, and
presented graphically as frequency polygons. Shape of obtained polygons indicates that
the most appropriate function approximation in all cases would be the normal (Gaussian)
distribution (Figures 1-a and 1-b and Table 1).
Table 1. Calculated values of the empirical and Gaussian distributions (E – mean value
of empirical data; E – standard deviation of the empirical data; – mean value of
approximation; – standard deviation of the approximation; NP – Number of point;
DF – degrees of freedom; – chi square; R2 – coefficient of determination)
ID E E NP DF R2
SRW 1 98,05 98,05 98,05 98,05 98,05 98,05 98,05 98,05
SRW 2 78,22 78,22 78,22 78,22 78,22 78,22 78,22 78,22
SRW 3 105,8 105,8 105,8 105,8 105,8 105,8 105,8 105,8
SRW 4 85,84 85,84 85,84 85,84 85,84 85,84 85,84 85,84
SRW 5 90,12 90,12 90,12 90,12 90,12 90,12 90,12 90,12
SRW 6 128,14 128,14 128,14 128,14 128,14 128,14 128,14 128,14
SRW 7 157,68 157,68 157,68 157,68 157,68 157,68 157,68 157,68
SRW 8 161,60 161,60 161,60 161,60 161,60 161,60 161,60 161,60
SRW 9 199,01 199,01 199,01 199,01 199,01 199,01 199,01 199,01
SRW 10 80,41 80,41 80,41 80,41 80,41 80,41 80,41 80,41
SRW 11 101,65 101,65 101,65 101,65 101,65 101,65 101,65 101,65
SRW 12 105,69 105,69 105,69 105,69 105,69 105,69 105,69 105,69
4. МЕЂУНАРОДНА КОНФЕРЕНЦИЈА
Савремена достигнућа у грађевинарству 22. април 2016. Суботица, СРБИЈА
| ЗБОРНИК РАДОВА МЕЂУНАРОДНЕ КОНФЕРЕНЦИЈЕ (2016) | 1031
Figure 1-a. Frequency polygons and approximations

4th INTERNATIONAL CONFERENCE
Contemporary achievements in civil engineering 22. April 2016. Subotica, SERBIA
1032 | CONFERENCE PROCEEDINGS INTERNATIONAL CONFERENCE (2016) |
Figure 1-b. Frequency polygons and approximations
4. МЕЂУНАРОДНА КОНФЕРЕНЦИЈА
Савремена достигнућа у грађевинарству 22. април 2016. Суботица, СРБИЈА
| ЗБОРНИК РАДОВА МЕЂУНАРОДНЕ КОНФЕРЕНЦИЈЕ (2016) | 1033
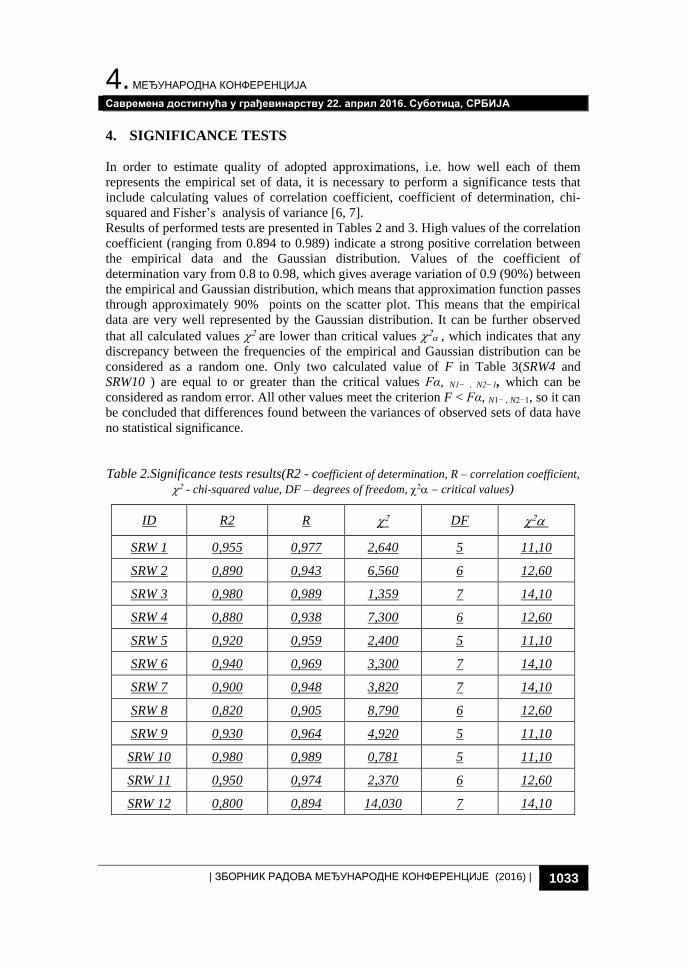
4. SIGNIFICANCE TESTS
In order to estimate quality of adopted approximations, i.e. how well each of them
represents the empirical set of data, it is necessary to perform a significance tests that
include calculating values of correlation coefficient, coefficient of determination, chi-
squared and Fisher’s analysis of variance [6, 7].
Results of performed tests are presented in Tables 2 and 3. High values of the correlation
coefficient (ranging from 0.894 to 0.989) indicate a strong positive correlation between
the empirical data and the Gaussian distribution. Values of the coefficient of
determination vary from 0.8 to 0.98, which gives average variation of 0.9 (90%) between
the empirical and Gaussian distribution, which means that approximation function passes
through approximately 90% points on the scatter plot. This means that the empirical
data are very well represented by the Gaussian distribution. It can be further observed
that all calculated values are lower than critical values , which indicates that any
discrepancy between the frequencies of the empirical and Gaussian distribution can be
considered as a random one. Only two calculated value of F in Table 3(SRW4 and
SRW10 ) are equal to or greater than the critical values Fα, N1− , N2−1, which can be
considered as random error. All other values meet the criterion F < Fα, N1− , N2−1, so it can
be concluded that differences found between the variances of observed sets of data have
no statistical significance.
Table 2.Significance tests results(R2 - coefficient of determination, R – correlation coefficient,
- chi-squared value, DF – degrees of freedom, critical values)
ID R2 R DF
SRW 1 0,955 0,977 2,640 5 11,10
SRW 2 0,890 0,943 6,560 6 12,60
SRW 3 0,980 0,989 1,359 7 14,10
SRW 4 0,880 0,938 7,300 6 12,60
SRW 5 0,920 0,959 2,400 5 11,10
SRW 6 0,940 0,969 3,300 7 14,10
SRW 7 0,900 0,948 3,820 7 14,10
SRW 8 0,820 0,905 8,790 6 12,60
SRW 9 0,930 0,964 4,920 5 11,10
SRW 10 0,980 0,989 0,781 5 11,10
SRW 11 0,950 0,974 2,370 6 12,60
SRW 12 0,800 0,894 14,030 7 14,10

4th INTERNATIONAL CONFERENCE
Contemporary achievements in civil engineering 22. April 2016. Subotica, SERBIA
1034 | CONFERENCE PROCEEDINGS INTERNATIONAL CONFERENCE (2016) |
Table 3. Fisher’s tests results (E – variance from the empirical data,
A – variance from the
values, DF – degrees of freedom, Fα, N1− , N2−1 – critical values)
ID E
A F DF Fα, N1− , N2−1
SRW 1 5,48 30,03 5,15 26,52 1.132 5 5.0503
SRW 2 6,05 36,60 3,07 9,42 3.885 6 4.2839
SRW 3 6,63 43,96 3,66 13,39 3,283 7 3.7870
SRW 4 6,05 36,60 2,91 8,47 4,321 6 4.2839
SRW 5 5,48 30,03 3,86 14,90 2,033 5 5.0503
SRW 6 6,63 43,96 4,10 16,81 2,615 7 3.7870
SRW 7 6,63 43,96 4,26 21,16 2.077 7 3.7870
SRW 8 6,05 36,60 5,63 31,70 1,154 6 4.2839
SRW 9 5,47 29,92 2,91 8,47 3,532 5 5.0503
SRW 10 5,47 29,92 2,32 5,38 5,561 5 5.0503
SRW 11 6,05 36,60 3,70 13,69 2,673 6 4.2839
SRW 12 6,63 43,96 4,39 19,27 2,281 7 3.7870
5. PROBABILISTIC PRODUCTIVITY NORMS
Based on statistical analysis, probabilistic productivity norms have been developed using
probability distribution. Two cases were examined – for probability of 68% and 96 %,
respectively (Figure 2). Optimistic times (to) were obtained by adding one, respectively
two, standard deviations to the mean time (tm = ), and pessimistic times (tp) are
obtained by subtracting these values. Calculated values for both cases are presented in
Table 4.
Figure 2. Probability distribution
4. МЕЂУНАРОДНА КОНФЕРЕНЦИЈА
Савремена достигнућа у грађевинарству 22. април 2016. Суботица, СРБИЈА
| ЗБОРНИК РАДОВА МЕЂУНАРОДНЕ КОНФЕРЕНЦИЈЕ (2016) | 1035
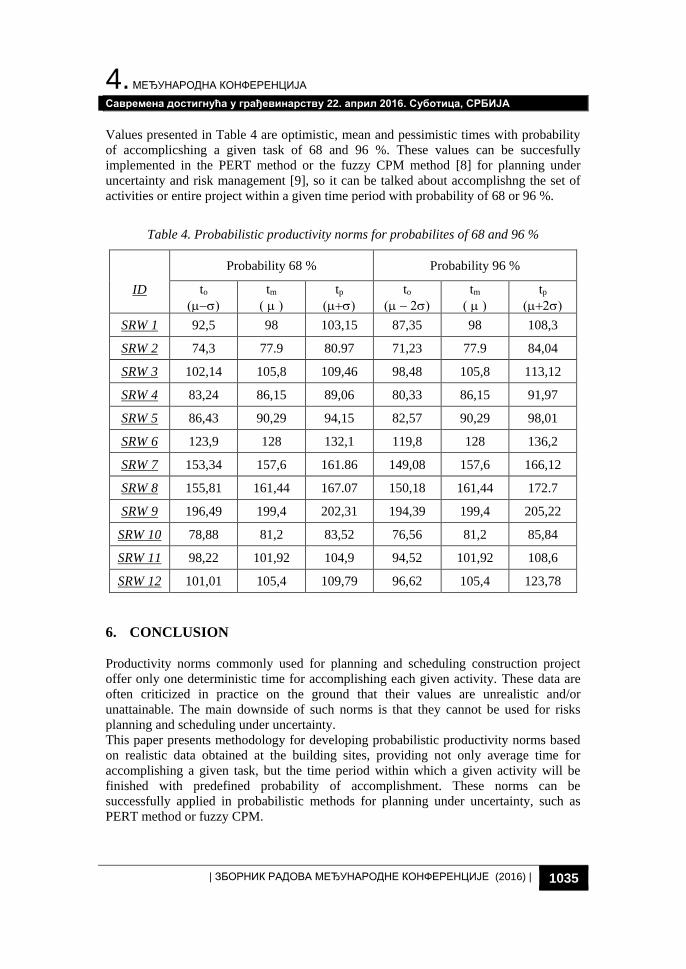
Values presented in Table 4 are optimistic, mean and pessimistic times with probability
of accomplicshing a given task of 68 and 96 %. These values can be succesfully
implemented in the PERT method or the fuzzy CPM method [8] for planning under
uncertainty and risk management [9], so it can be talked about accomplishng the set of
activities or entire project within a given time period with probability of 68 or 96 %.
Table 4. Probabilistic productivity norms for probabilites of 68 and 96 %
ID
Probability 68 % Probability 96 %
to
tm
tp
to
tm
tp
SRW 1 92,5 98 103,15 87,35 98 108,3
SRW 2 74,3 77.9 80.97 71,23 77.9 84,04
SRW 3 102,14 105,8 109,46 98,48 105,8 113,12
SRW 4 83,24 86,15 89,06 80,33 86,15 91,97
SRW 5 86,43 90,29 94,15 82,57 90,29 98,01
SRW 6 123,9 128 132,1 119,8 128 136,2
SRW 7 153,34 157,6 161.86 149,08 157,6 166,12
SRW 8 155,81 161,44 167.07 150,18 161,44 172.7
SRW 9 196,49 199,4 202,31 194,39 199,4 205,22
SRW 10 78,88 81,2 83,52 76,56 81,2 85,84
SRW 11 98,22 101,92 104,9 94,52 101,92 108,6
SRW 12 101,01 105,4 109,79 96,62 105,4 123,78
6. CONCLUSION
Productivity norms commonly used for planning and scheduling construction project
offer only one deterministic time for accomplishing each given activity. These data are
often criticized in practice on the ground that their values are unrealistic and/or
unattainable. The main downside of such norms is that they cannot be used for risks
planning and scheduling under uncertainty.
This paper presents methodology for developing probabilistic productivity norms based
on realistic data obtained at the building sites, providing not only average time for
accomplishing a given task, but the time period within which a given activity will be
finished with predefined probability of accomplishment. These norms can be
successfully applied in probabilistic methods for planning under uncertainty, such as
PERT method or fuzzy CPM.

4th INTERNATIONAL CONFERENCE
Contemporary achievements in civil engineering 22. April 2016. Subotica, SERBIA
1036 | CONFERENCE PROCEEDINGS INTERNATIONAL CONFERENCE (2016) |
REFERENCES
[7] Mijatović, R.; Norms and Standards in Civil Engineering, Book 2 (in Serbian),
Građevinska knjiga, Belgrade, 2008.
[8] Milajić, A., Beljaković, D., Pejičić, G.: Optimal reinforced concrete beams design
using hybrid GA-TABU algorithm. Technics Technologies Education Management,
vol. 8 (2), 2013, p.p. 533-540.
[9] Milajić Aleksandar, Prokić Aleksandar, Beljaković Dejan, Pejičić Goran:
Quantitative method for evaluating applicability of designed reinforcement pattern,
Tehnical Gazette, vol. 22 (1), 2015, p.p. 119-124.
[10] Proverbs, D.; Holt, G. D.; Olomolaiye, P.: A comparative evaluation of planning
engineers' formwork productivity rates in European construction, Building and
Environment, vol. 33 (4), 1998, p.p. 181-187.
[11] Smith, N.J.: Appraisal, Risk and Uncertainty (Construction Management Series),
London: Thomas Telford Ltd, UK, 2003.
[12] Shen, L.Y., Wu, G.W.C. and Ng, C.S.K. Risk Assessment for Construction Joint
Ventures in China, Journal of Construction Engineering and Management, 2001,
vol. 127(1), p.p. 76-81.
[13] Rutherford, A.: Introducing ANOVA and ANCOVA: A GLM approach. Thousand
Oaks, CA: Sage Publications, 2001.
[14] Kurij, K., Milajić, A., Beljaković, D.: Analysis of Construction Dynamic Plan Using
Fuzzy Critical Path Method, Tehnika, vol. 69 (2), 2014, p.p. 209-215.
[15] Smith, N.J.: Appraisal, Risk and Uncertainty (Construction Management Series),
London: Thomas Telford Ltd, UK, 2003.
НОРМАТИВИ ЗА ИЗРАДУ ДИНАМИЧКИХ
ПЛАНОВА У УСЛОВИМА НЕИЗВЕСНОСТИ
Резиме: Метод критичног пута представља незаменљиву алатку за планирање и
контролу сложених пројеката. Успешна примена ове методе подразумева
располагање јасно дефинисаним подацима о трајању сваке активности.
Међутим, због дугог трајања процеса градње и ризика који се при том јављају,
често је тешко или чак готово немогуће тачно предвидети трајање сваке
активности, а самим тим и подразумевати да ће дата активност бити завршена
дана предвиђеног динамичким планом градње. Циљ овог истраживања био је да се
успоставе нови нормативи за планирање грађевинских радова у условима
неизвесности.
Кључне речи: Метод критичног пута, нормативи, динамички планови,
неизвесност