Productivity Growth, Decoupling and Pollution Leakage Growth, Decoupling and Pollution Leakage Karen...
36
Productivity Growth, Decoupling and Pollution Leakage Karen Turner Nick Hanley Cathy Xin Cui Soo Jung Ha Peter McGregor Kim Swales Ya Ping Yin Stirling Economics Discussion Paper 2011-13 July 2011 Online at http://www.management.stir.ac.uk/research/economics/working- papers
-
Upload
dinhnguyet -
Category
Documents
-
view
216 -
download
0
Transcript of Productivity Growth, Decoupling and Pollution Leakage Growth, Decoupling and Pollution Leakage Karen...
Productivity Growth, Decoupling and Pollution Leakage
Karen Turner
Nick Hanley
Cathy Xin Cui
Soo Jung Ha
Peter McGregor
Kim Swales
Ya Ping Yin
Stirling Economics Discussion Paper 2011-13
July 2011
Online at
http://www.management.stir.ac.uk/research/economics/working-
papers

1
Productivity Growth, Decoupling and Pollution Leakage
By
Karen Turnera*, Nick Hanley
a, Cathy Xin Cui
b, Soo Jung Ha
c, Peter McGregor
b,
Kim Swalesb and Ya Ping Yin
d
a. Division of Economics, Stirling Management School, University of Stirling, UK
b. Fraser of Allander Institute, Department of Economics, University of
Strathclyde, UK
c. Korean Research Institute for Human Settlements, South Korea
d. Department of Economics, Social Sciences and Tourism, Business School,
University of Hertfordshire, UK
* Corresponding author: Division of Economics, Cottrell Building, University of
Stirling, Scotland, FK9 4LA. Telephone: 00 44 (0) 1786 467474. E-mail:
Acknowledgements:
The research reported in this paper has been supported by the UK Economic and Social
Research Council under the Climate Change Leadership Fellowship “Investigating the
pollution content of trade flows and the importance of environmental trade balances”
(ESRC ref. RES-066-27-0029), based at the Universities of Stirling and Strathclyde. It
also draws on earlier research carried out under an ESRC 1st Grants project (ESRC ref.
RES-061-25-0010) and the UK EPSRC SuperGen Marine Energy Research Consortium
(Grant reference: EP/EO40136/1). We are grateful to participants at seminars at the
University of Strathclyde in September 2010 and at University of Stirling in March
2011 for helpful comments on initial results. We also acknowledge the input and advice
of the input-output team at the Office of the Chief Economic Advisor at Scottish
Government and Tommy Wiedmann, formerly of the Stockholm Environment Institute,
in constructing UK input-output and regional and national imports data, and to Nori
Yamano at OECD, who worked with us to identify the pollution content of UK imports.
Finally, we are grateful to Janine De Fence and Stuart McIntyre for research assistance.
2
Productivity Growth, Decoupling and Pollution Leakage
Abstract
This paper examines the issue of decoupling economic growth and pollution
through growth driven by productivity improvements; and the extent to which pollution
effects spill over national borders. Focus is widened from conventional production
measures of pollution to a consumption accounting principle (carbon footprints). This
adds a useful dimension to understanding pollution leakage effects. Using an
interregional empirical general equilibrium framework, we consider the impacts of
productivity growth in one region in that region and a neighbour linked through trade in
goods and services and in the factor of production that is targeted with the productivity
improvement (here through interregional migration of labour). The key finding is that
while economic growth resulting from the productivity improvement in one region is
accompanied by increased absolute pollution levels across both regions, positive
competitiveness effects lead to a reduction in imports and pollution embodied therein to
both regions from the rest of the world.
Keywords: CGE models; labour productivity; factor mobility; economic growth;
pollution leakage; carbon footprints.
JEL codes: D57, D58, O18, O44, Q56

3
1. Introduction
Labour productivity improvements are widely recognised as a key driver of
economic growth (World Bank, 2011). The contribution of labour productivity
improvements has been measured in numerous growth accounting studies (most
recently by Jorgenson and Vu, 2010, for the G7 and other major economies and
regions), and it has provided a focus for both international (e.g. the Millennium
Development Goals adopted by the United Nations in 20001) and national policy
targets (e.g. see HM Treasury, 2000, for the UK). Moreover, factor productivity
improvements may also be important in decoupling economic growth from absolute
pollution levels. This is one possible explanation for observations of an Environmental
Kuznets Curve (Jaffe et al, 2003), where increased productivity in input use makes it
possible to reduce the pollution intensity (generally defined as the amount of pollution
emitted in a given time period relative to GDP) of an economy over time.
However, there has also been considerable debate in the literature relating to
how actions to reduce domestic pollution generation, particularly in industrialised
economies, may lead to increased global emissions through pollution leakage, or
pollution embodied in trade. An important early contribution in this area was Arrow et
al (1995). The pollution leakage literature is reviewed more comprehensively below. A
key point is that the main focus in empirical analyses of pollution leakage to date
(increasingly composed of computable general equilibrium, CGE, analyses) have
focussed on the implementation of carbon caps (e.g. Babiker, 2005) or carbon taxes
(e.g. Bruvoll and Faehn 2006; Elliot et al, 2010). The current paper adds to this
literature by considering whether increased labour productivity in one economy (taking
Scotland as an example) leads to a decoupling of economic growth and pollution in
1 http://mdgs.un.org/unsd/mdg/Host.aspx?Content=Indicators%2fOfficialList.htm

4
terms of both direct CO2 emissions within Scotland and indirect emissions embodied in
its imports.
We make a further contribution by considering the impacts of increased labour
productivity in one region on a neighbour (here, the rest of the UK) linked with the
target region not only through trade in goods and services but also through a mobile
supply of labour, being the factor of production whose productivity improves in our
simulations. This provides a link to the wider growth literature, where the available
quantity of labour is a key determinant of growth (indeed Jorgenson and Vu, 2010, find
this to be more important than productivity change). It also makes a new contribution to
the pollution leakage literature, which has tended to focus on trade in goods and
services with a fixed (domestic) labour supply.
A further, novel contribution of our paper is to consider pollution leakage in the
context of measuring an economy‟s „carbon footprint‟, a concept that is attracting
increasing public and policy interest. Measuring carbon footprints and the pollution
embodied in trade has been the focus of numerous input-output studies (see Wiedmann,
2009, for a review) since Munksgaard and Pedersen (2001) demonstrated that it is
possible to account for pollution generation in a given economy in a given time period
under both production and consumption accounting principles using this simple general
equilibrium framework. The current paper extend this literature by employing a more
flexible CGE modelling framework (which incorporates a set of input-output accounts
as its core database) to consider the impact of changes in activity the carbon footprint of
the target economy (Scotland) and its neighbour (the rest of the UK).
The remainder of the paper is structured as follows. In Section 2 we review the
existing literature on economic growth and pollution leakage. In Section 3 we introduce
the interregional CGE model of Scotland and the Rest of the UK (RUK) that is used for
5
our empirical analysis of the economic and CO2 impacts of an increase in Scottish
labour productivity in Sections 4, 5 and 6. Conclusions and considerations for future
research are provided in Section 7.
2. Economic growth and pollution leakage
Pollution leakage has emerged as a potentially important factor in the
relationship between economic growth and environmental quality (Antweiler et al,
2001). Critics of the Environmental Kuznets Curve hypothesis have suggested that
whilst economic growth in country A may lead to lower domestic emissions due to
structural changes in the domestic economy, continued consumption of pollution-
intensive products imported from overseas may lead to increases in pollution in the
exporting country (Bruvoll and Faehn, 2006). Moreover, measures to reduce emissions
in country A – such as a pollution tax – may result in increased emissions in exporting
countries, partly through changing incentives for the location of dirty industries when
factors of production are mobile across international borders (Sheldon, 2006).
Modelling studies of the effects of energy efficiency improvements on domestic
pollution reveal a third channel for pollution levels in trading countries to be co-
determined, due to competiveness effects on energy-intensive (and thus, typically,
carbon-intensive) export sectors (Hanley et al, 2009).
Empirical evidence of pollution leakage has been developed using a number of
approaches. Using both historical data and CGE modelling, Faehn and Bruvoll (2009)
find little evidence of leakage in the context of economic growth impacts on net imports
of “dirty” goods. The same authors (Bruvoll and Faehn 2006) also use a CGE model to
study the effects on global pollution of a domestic carbon tax, and find partly offsetting
impacts on third country emissions. Elliot et (2010) also adopt a CGE approach to

6
examine various scenarios for taxing carbon emissions and find that border tax
adjustments are required to eliminate pollution leakage as a result of Annex B Kyoto
countries substituting domestic emissions for imports from developing countries.
Babiker (2005) also uses CGE study to analyse carbon caps rather than carbon taxes,
considering how, depending on market structure, energy-intensive industries may
relocate away from developed countries with carbon control policies as a result of
obligations under the Kyoto protocol. Again, the prediction is one of increased pollution
leakage and global emissions.
The CGE studies noted above have mainly taken a production accounting
approach to measuring domestic pollution. Consumption accounting of carbon
emissions is a more common development in the input-output literature. For example,
Peters and Hertwich (2006) use input-output modelling to measure the pollution content
of imports to Norway, and find that CO2 embodied in imports equated to more than
50% of domestic emissions, and that consumption of these imports had led to
significant implied carbon emissions in developing countries. They concluded that
national emissions inventories should be based on domestic consumption rather than
production. A similar analysis for Italy is presented by Mongelli et al (2006). Finally,
Ghertner and Fripp (2007) use life-cycle analysis to calculate the “global warming
potential” implicit in US consumption, and show that allowing for the carbon-
equivalent emissions contained in imports resulted in no turning point being found for
the relationship between GDP per capita and emissions – that is, no evidence of an EKC
once a consumption accounting principle was adopted.
Looking across both modelling approaches, conditions which emerge as
important from this literature for determining the degree of pollution leakage are
compositional changes in the domestic economy, factor mobility, and the pollution

7
content of imports which substitute for domestic production. These are all allowed for
in the model described below, along with endogenous changes in the scale of economic
activity in both the domestic economy and its trading partners induced by productivity-
led growth. Our modelling approach also allows us to measure pollution leakage in the
context of full consumption accounting measures of carbon emissions (or carbon
footprints): these consumption-accounting measures of leakage can then be compared
with more usual production-accounting leakage measures.
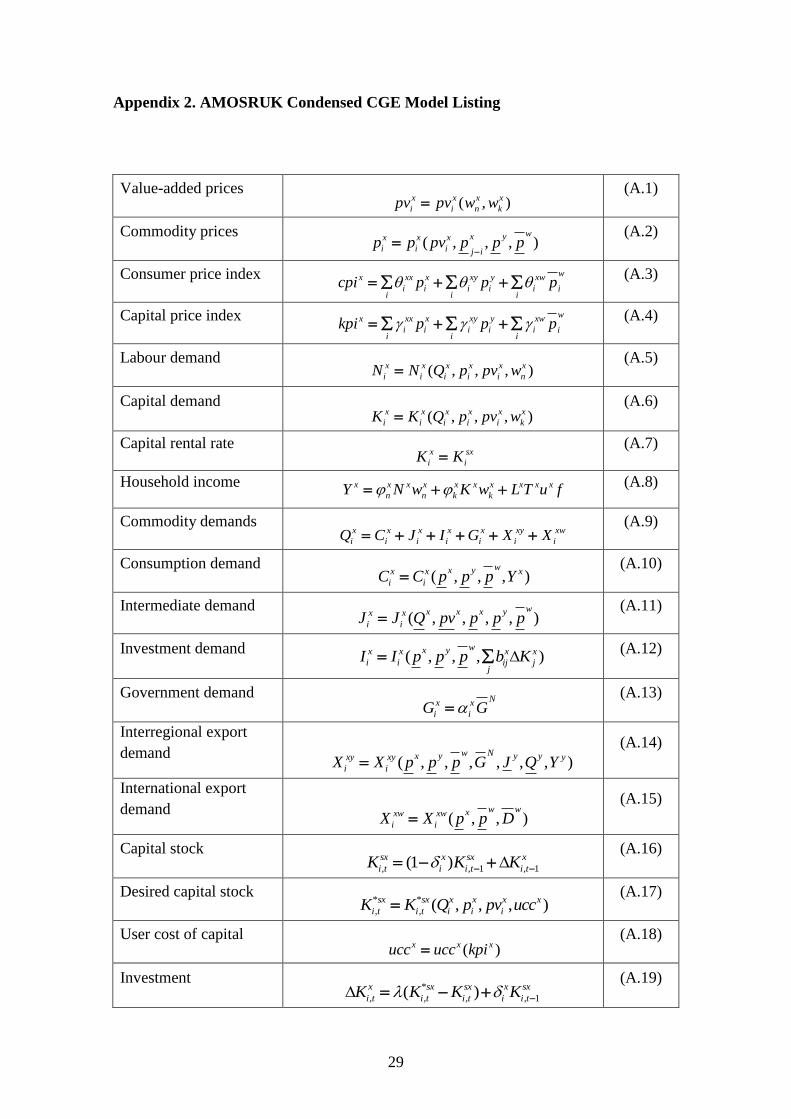
3. The AMOS UK 2-region CGE modelling framework
AMOSRUK is a computable general equilibrium (CGE) model of the UK
economy with two endogenous regions, Scotland and the Rest of the UK (RUK), and
one exogenous region, the Rest Of the World (ROW). It is calibrated on a 2-region, 6-
sector interregional Social Accounting Matrix (SAM) for 2004, which provides a
„snapshot‟ of the Scottish and rest of the UK economies and related CO2 emissions
generation for that year.2 The six sectors/commodities modelled are detailed in
Appendix 1.3 A condensed model listing of the AMOSRUK modelling framework used
here is provided in Appendix 2.4 In this section we summarise the main features of the
interregional CGE model in the context of the scenarios modelled here.
2 The interregional SAM uses input-output data for Scotland in 2004 published by the Scottish
Government (http://www.scotland.gov.uk/Topics/Statistics/Browse/Economy/Input-Output) and UK
analytical IO tables (http://www.strath.ac.uk/fraser/research/2004ukindustry-byindustryanalyticalinput-
outputtables/) derived from the UK Supply and Use tables, which may be accessed at the Office for
National Statistics, ONS, web-site (http://www.statistics.gov.uk/STATBASE/Product.asp?vlnk=3026 ) .
Interregional trade data to derive the interregional framework were provided by the Scottish Government
(not published) as were Scottish environmental accounting data (considered most reliable at the 6-sector
level modelled here). The UK Environmental Accounts may also be accessed at the ONS web-site
(http://www.statistics.gov.uk/about/methodology_by_theme/Environmental_Accounts/default.asp).
3 The sectoral breakdown is limited to six sectors due to reliability issues regarding the Scottish
environmental accounting data available (see previous footnote). 4 Harrigan et al (1991) gives a full description of early versions of the AMOS framework, and Turner et al
(2011a) provide an application of an earlier version of the AMOSRUK model. Greenaway et al (1993)
provides a general appraisal of CGE models, Partridge and Rickman (1998, 2010) review regional CGEs,
while Bergman (2005) provides an overview of environmental CGE modelling frameworks.
8
There are four main components of final demand: household consumption,
investment, government expenditure and exports to the ROW. Household consumption
is a linear homogenous function of income; investment is explained below, while
government expenditure is exogenous (and unchanging) in the central case, though we
relax this assumption, constraining to a fixed national expenditure/GDP ratio in
sensitivity analysis. Both interregional and international exports are price sensitive – see
equations (A.14)-(A.15). However, while non-price determinants of export demand
from the rest of the world are taken to be exogenous, export demand to the other UK
region is fully endogenous, depending not only on relative prices, but also on the
structure of all elements of intermediate and final demand in the other region.
In production, a local composite of intermediate inputs is combined with
composite imports from the other region and the rest of the world via an Armington link
(Armington, 1969). This means that domestic products and imported goods are treated
as imperfect substitutes, with the degree of substitutability set by the modeller.5
However, while the commodity composition of Scottish and RUK intermediates to each
sector varies with local prices, we assume that the commodity composition of ROW
imports to each sector and for final consumers is fixed.6
In the current application we set all Armington import elasticities at 2.0 (Gibson,
1990). The composite intermediate input is then combined with labour and capital
(value added) to determine each sector‟s gross output. Production functions at each
level of the production hierarchy can be CES, Cobb-Douglas or Leontief. The
simulations in this paper use CES production functions at the value-added and gross-
5 We acknowledge issues raised by other authors (e.g. Copeland and Taylor, 2005; Babiker, 2005)
regarding restrictions imposed by the use of the Armington assumption in most CGE studies. It may be a
useful focus in future research to explore alternatives. However, at this time we follow Elliot et al (2010)
in retaining the conventional Armington assumption in considering pollution leakage without a particular
focus on issues such as production differentiation. 6 It will be a focus of future research to introduce commodity level substitution between local and
imported goods and services.
9
output level (with a value of 0.3, informed by Harris, 1989, with some sensitivity
noted), and Leontief productions functions at the intermediate-inputs level in each
region.
The capital stock in each region is determined by region-specific investment.
Gross investment is determined by a capital-stock adjustment mechanism: in each
period investment demand from each sector is a proportion of the difference between
actual and desired capital stock, where desired capital stock is a function of commodity
output, the nominal wage and the user cost of capital.7 Thus in response to a shock,
investment acts to optimally adjust capital stocks over time (equations (A.16)-(A.19)).
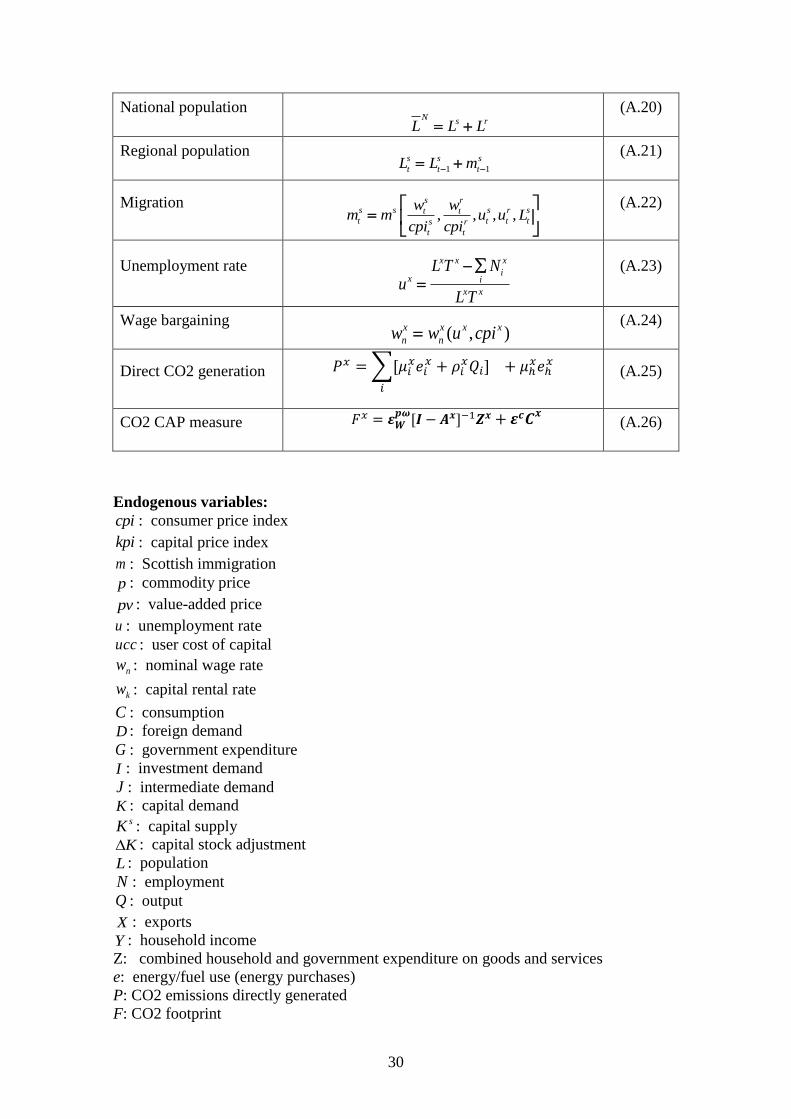
The labour force also updates following a shock. In the current application we
assume that there is no natural population increase and no international migration, but
regional labour forces adjust through inter-regional migration between Scotland and
RUK in response to changes in real wage and unemployment differentials (equations
A.20-A.24). This specification is based on the model of Harris and Todaro (1970),
which is commonly used in US studies of interregional migration, and parameterised
based on regional work for the UK carried out by Layard et al (1991). Real wages are
determined using a regional wage bargaining function in each region and reflect
workers‟ bargaining power through a negative relationship with unemployment
(Blanchflower and Oswald, 1994). This function is also parameterised based on work
by Layard et al (1991).
Direct CO2 emissions generation in each production sector and households in
the two endogenous regions are related to energy use where appropriate and otherwise
to output or total final expenditure (see equation A.25). For the CAP (Consumption
Accounting Principle) measure, emissions embodied in imports from ROW to each
7 The speed of adjustment of the capital stock – i.e. the proportion of gap between actual and desired
capital stock filled between any two periods is an exogenously specified parameter. Here it is set at 0.5.
10
region are determined using a dataset provided by the OECD and are adjusted to reflect
total emissions (kilo-tonnes) per £1 million of imports to each production sector and
final consumer in the two endogenous regions. This involves weighting output-CO2
intensities for the six external commodities based on the commodity and country source
composition of imports in each (see equation A.26 and Turner et al, 2011b for details).
4. Simulation strategy
We introduce an exogenous (and costless) step increase in Harrod Neutral
(labour augmenting) technological progress in all Scottish production sectors. Both
regional economies (Scotland and RUK) are assumed to be in long-run equilibrium at
the outset and the shock is introduced in the first period/year. Both economies adjust to
to a new long-run equilibrium through a series of temporary equilibria, each of which is
interpreted as one year (due to the annual nature of the SAM data). While some period-
by-period results are reported, we focus on two conceptual time periods. First, the short-
run, the first period after the shock is introduced, where both labour and capital stocks
and fixed. Second, the long-run, where labour and capital stocks are fully adjusted in
response to the shock. Given that a single exogenous shock is simulated, all changes
reported are attributable entirely and solely to the shock imposed. That is, if no shock
were introduced, the model would recreate the base year data. Generally, we report in
terms of percentage changes from the base year (2004) equilibrium (but with absolute
physical changes reported for CO2 embodied in imports in Table 2). We calculate CO2
emissions under the consumption accounting principle by using CGE results on price
and quantity changes to derive post-shock input-output accounts in value terms for each
period after the shock is introduced, and then compute the CAP measure (and its
components) using equation A.26 in Appendix 2.

11
5. Central case results
5.1 Impacts in the target economy (Scotland)
As stated above, a Harrod neutral efficiency improvement is one that increases
the productivity of labour relative to capital and other inputs to production. The
efficiency improvement increases the effective labour supply, thus reducing the price of
labour measured in efficiency units. This will trigger a number of general equilibrium
effects in the target economy (in this case, Scotland). The first is the pure efficiency
effect, which acts to reduce demand for labour (i.e. as labour efficiency is increased by
5%, 5% less labour input is required to produce a given level of output). This may
trigger an initial contraction in the Scottish labour supply (through out-migration) as the
real wage rate falls and the unemployment rate rises. However, since the efficiency
improvement reduces the effective price of labour, there will also be upward pressure on
the labour demand as producers substitute in favour of labour and away from other
inputs. Moreover, as both the effective and actual price of labour fall (the latter as a
result of the efficiency effect), Scottish output prices will also fall, increasing
competitiveness and stimulating export demand, which will in turn increase the (direct
and derived) demand for labour and other inputs. Positive indirect demand (or
multiplier) effects also occur. as Scottish firms require more intermediate inputs to meet
increased demand, which puts opposing (upward) pressure on local output prices, partly
or wholly offsetting positive competitiveness effects. Finally, as the economy expands
(with short-run supply constraints relaxed through in-migration of labour and
investment in capital stock), labour incomes to households will increase, further
increasing demand in all sectors of the economy.
12
<Insert Table 1 around here>
This complex pattern of effects underlies the results reported in the first two
numerical columns of Table 1. These summary results show the short- and long-run
impacts on key economic and CO2 generation variables in Scotland in response to the
5% step increase in Scottish labour efficiency. In the first period after the shock is
introduced the efficiency effect is reflected in a 0.8% drop in employment. This is
significantly less than the proportionate increase in labour efficiency implying a large
„rebound‟ effect in employment driven by positive substitution, competitiveness,
income and multiplier effects as the economy begins to expand. However, this
expansion is limited in the short-run by constraints on capital and labour stocks. In the
early periods (years) after shock in the scenario presented in Table 1, the labour supply
constraint is actually exacerbated by the fact that the drop in the real wage rate and
employment triggers out-migration of labour from Scotland to the rest of the UK.8
However, this trend is quickly reversed as economy expands with a net increase in
labour demand so that the real wage begins to rise and the unemployment rate falls,
triggering migration in the other direction. Migration continues until the differential
with RUK is restored in the long-run.
Economic growth in Scotland (GDP expands by 7.7% over the long-run) is
ultimately driven by the rise in competitiveness facilitated by the efficiency increase.
From the outset the Scottish price level, reflected in the CPI, falls (by 0.6% in the short-
run and by 3.2% over the long-run). This stimulates export demand from both RUK and
ROW. However, while output grows from the outset in all Scottish production sectors
(see Figure 1) the underlying effects are more complex. Local intermediate demand
pressures for the outputs of Sectors 1-3 (Energy; Extraction, Quarrying, Construction
8 While it is not reported here, parametric sensitivity analyses show that the temporary out-migration
effect is lost if the substitutability in favour of labour is increased in the nested production function (i.e. if
a stronger substitution effect is facilitated).

13
and Water Supply; Agriculture and Fishing) initially cause an increase in the price of
output in these sectors that is sufficient to reduce export demands for sectoral outputs
(particularly from ROW). However, increased intermediate demands are sufficient to
offset external demand reductions so that there is net growth in output in all sectors
from the outset. As supply constraints ease, both local and export demands increase in
all sectors with falling output prices.
<Insert Figure 1 around here>
In terms of CO2 generation, Table 1 shows that emissions generation within
Scotland, the production accounting principle (PAP) measure, grows from the outset (a
2.5% increase over the baseline in the short-run rising to 6.9% over the long-run).
Figure 1 shows that output grows in all production sectors by between 5.6% (Other
Services) and 9.5% (Quarrying, Construction and Water Supply) over the long-run
depending on (a) their exposure to the efficiency boost through their labour intensity,
(b) to positive competitiveness effects, through their export intensity, and (c) the
strength of local demand effects. Use of all inputs increases, as does associated CO2
generation in each sector (largely driven by increased energy use). Direct emissions in
the household sector (where consumption rises by 2.8% in the short-run, rising to 3.6%
in the long-run) also rise. However, the growth in emissions is dominated by the
expansion in the highly carbon-intensive Energy sector, accounting here for almost half
of the long-run increase in PAP emissions.
From the onset of the productivity shock GDP grows faster than CO2 generation
so that the CO2 intensity of Scottish GDP falls (by 0.07% in the short-run and 0.8% in
the long-run). This is due to the increase in competitiveness resulting from the labour
efficiency improvement.

14
CAP emissions, on the other hand, are driven by what is consumed rather than
what is produced in the Scottish economy. The results in Table 1 show that the increase
in total CAP is greater in the short-run (3.2%) than in the long-run (3%). The short-run
increase in CAP is also proportionately greater than the increase in aggregate
(household and government) consumption (1.9%). It is pulled up by the larger increases
in direct emissions by households and by the initial increase in imports from ROW,
which tend to be more CO2-intensive than the average unit of consumption of UK
(Scottish and RUK) goods and services. This is due to the commodity composition of
imports and associated external polluting technologies. Moreover, there is a further net
change in the composition of imports from ROW as different activities grow at different
rates. This is reflected in the result that while imports from ROW rise by 2% in the
short-run, the CO2 embodied therein rises more than proportionately (2.5%).
However, the initial net increase in imports from both RUK and ROW is partly
driven by the presence of short-run supply constraints limiting the expansion of Scottish
production. Over time, as supply constraints ease allowing Scottish prices to continue to
fall, substitution effects in favour of locally produced commodities dominate so that
there is a net reduction in total imports from ROW of 0.4% by period 50 and only a very
small increase (0.09%) in imports from RUK (prices in the latter fall over time as
activity levels contract – see below).
Nonetheless, there is a net increase (of 0.8%) in CO2 embodied in ROW
imports to Scotland over the long run. This is because, despite a decrease in direct
imports by Scottish households and service sectors (5 and 6 in Appendix 1), there is a
strong enough income effect in Scottish production of outputs/commodities 1-4 to bring
about an increase in the levels of both domestically produced and imported
intermediates to these sectors. This leads to a net increase in emissions embodied in

15
imports from ROW of commodities 1-3 (energy, agriculture and other primary
production in ROW). This equates to around 218 kilo-tonnes of additional CO2
generated outside the UK in these activities to support increased Scottish consumption
demands (see the first numerical column of Table 2 – to be discussed in more detail
below).
At the aggregate level this gross increase is partly offset by a 79 kilo-tonne
reduction in CO2 embodied in imports of commodities 4-6 (broadly manufacturing and
service sectors). However, the net increase of 139 kilo-tonnes may have implications in
terms of impacts in different countries that Scotland imports from. For example,
according to the data supplied by OECD to estimate the pollution content of trade flows
used here, around half of imports of commodity outputs 2 and 3 come from other EU
countries; however, non-EU countries such as Russia and Canada are important in terms
of energy imports (commodity output 1).
Over the long-run, the increase in CAP of 3% is small relative to the increase in
GDP (7.7%) so that the CO2 intensity of Scottish GDP under the CAP measure falls by
4.3%. This is significantly larger than the reduction in the CO2 intensity of GDP under
PAP, at only 0.8%. However, the discussion above shows that it is important to
decompose the results to determine whether growth is accompanied by pollution
leakage effects. Moreover, the productivity growth does lead to increases in absolute
CO2 levels in Scotland under both PAP and CAP measures, though this is to a greater
degree in the case of the former led by growth in export demands (i.e. emissions that are
attributable to the carbon footprints or CAP measures of other regions/nations). Thus,
while the PAP measure captures the total change in emissions that accompanies
economic growth in the target economy, the CAP measure allows us to focus on the
16
change in emissions at both home and abroad that is driven by increased consumption
possibilities in the target economy.
5.2 Impacts in the neighbouring region (the rest of the UK)
The analysis above focuses on the impacts of productivity growth on economic
activity in the target region (Scotland) and pollution embodied in induced consumption.
However, neighbouring regions may also be impacted by the productivity shock in
Scotland, particularly if factors of production flow across regional borders. This is a
focus of the pollution leakage literature. Here, we model a second region, the rest of the
UK (RUK) which is linked with Scotland not only through trade in goods and services
but also in terms of the supply of the factor of production, labour, that is targeted with
the productivity improvement through migration.
The third and fourth numerical columns of Table 1 show the short- and long-run
impacts on key economic and CO2 generation variables in RUK response to the 5%
step increase in Scottish labour efficiency. Given the extent of inter-regional trade, the
positive supply shock in Scotland translates to a positive demand shock in RUK. This is
reflected in the immediate (short-run) increase in RUK exports to Scotland of 2.1%. In
order to meet the increased demand from Scotland, RUK producers also increase their
imports from Scotland and from ROW. However, the short-run increase in RUK
imports from Scotland of 1.5% is significantly larger than the 0.04% increase in imports
from ROW, reflecting the fact that Scottish prices have generally fallen (see above) due
to the productivity improvement there. ROW prices, on the other hand, are exogenous
(and therefore unchanging in the simulations reported here). Over time the reduction in
Scottish prices relative to those in RUK leads to a net reduction in trade flows from
RUK to Scotland but an increase in the other direction (i.e. RUK production sectors,

17
and also final consumers, substitute in favour of Scottish commodity outputs and away
from domestic production).
However, the long-run results in Table 1 also reflect the fact that, after the short-
run, inter-regional migration occurs in response to real wage and unemployment rate
differentials between Scotland and RUK. Where Scotland is drawing labour away from
RUK, this translates to a negative supply shock in the latter.9 The impact of migration
on RUK production is reflected in Figure 2. As noted above (though not shown in Table
1), in the early periods (years) after shock, there is actually an out-migration of labour
from Scotland to RUK as a result of the drop in the real wage rate and employment due
to the efficiency effect in the former. 10
Figure 2 shows that all RUK production sectors
benefit from the indirect demand shock as Scottish imports rise, particularly with the
relaxation of the labour supply constraint in RUK workers migrate from Scotland to
RUK. However, this effect is quickly reversed as the Scottish economy grows and after
peaking around 5 periods/years in Figure 2, the growth in output in RUK production
sectors declines and eventually becomes negative in all sectors.
The contraction in RUK production activity overall is reflected in a net decrease
in all key macroeconomic indicators over the long run: GDP falls by 0.17%, household
consumption by 0.24%, investment by 0.16% and employment by 0.21%. The lasting
supply constraint is reflected in the increased real wage rate but lower unemployment
9 While it is not reported in detail here, all scenarios were also simulated with no migration, so that
impacts are only transmitted through goods and services trade flows. This causes a more limited
expansion in the targeted region, because of the fixed labour supply without migration. Here we found
that, despite a 0.17% increase in aggregate Scottish consumption over the long-run, there is a net decrease
in CAP due to substitution in favour of Scottish outputs, and in associated emissions embodied in imports
in ROW. RUK (as the neighbouring region) also enjoys a small expansion due to the indirect demand
shock with no additional supply constraint from out-migration. However, the small increase in RUK
consumption (0.01%) is also accompanied a net reduction in CAP due to a reduction in imports from
ROW (with substitution in favour of Scottish outputs, the price of which still falls, though to a lesser
extent than in the presence of migration) and associated pollution leakage in ROW. 10
However, as noted above, this initial migration effect in favour of RUK is sensitive to the values
assigned to parameters governing the substitution effect in favour of labour in Scotland. However, the
long-run result of labour shifting from RUK to Scotland is not.
18
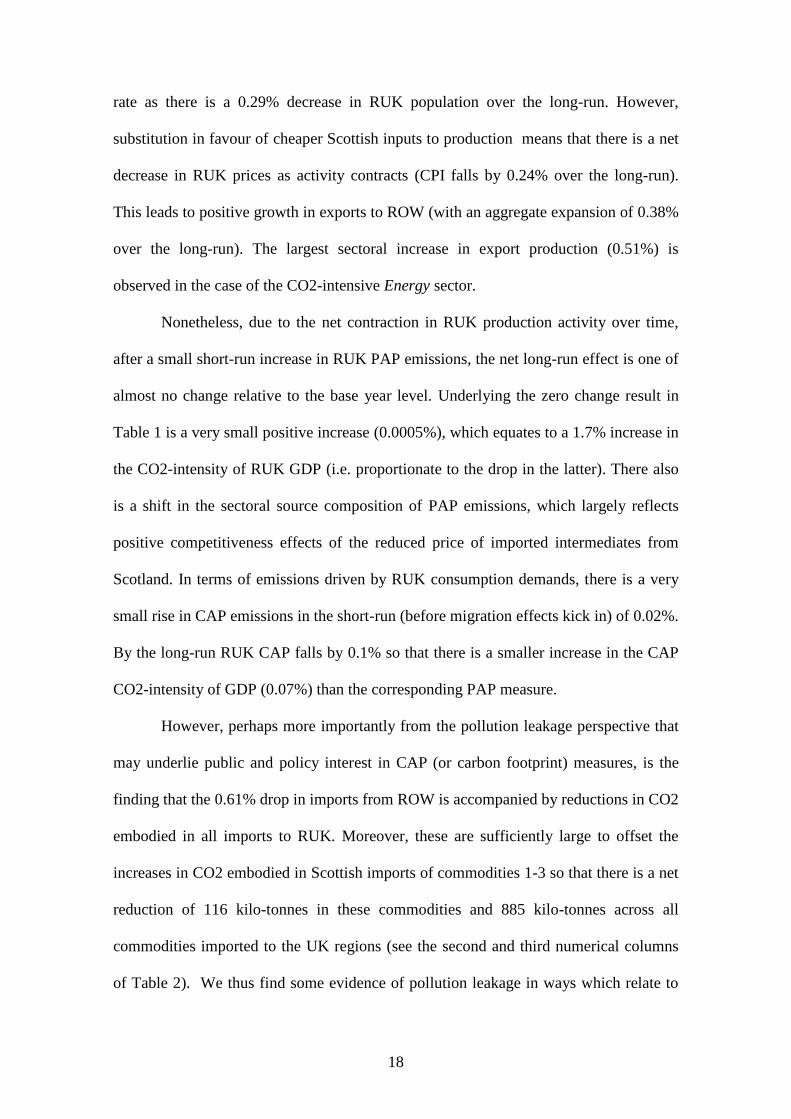
rate as there is a 0.29% decrease in RUK population over the long-run. However,
substitution in favour of cheaper Scottish inputs to production means that there is a net
decrease in RUK prices as activity contracts (CPI falls by 0.24% over the long-run).
This leads to positive growth in exports to ROW (with an aggregate expansion of 0.38%
over the long-run). The largest sectoral increase in export production (0.51%) is
observed in the case of the CO2-intensive Energy sector.
Nonetheless, due to the net contraction in RUK production activity over time,
after a small short-run increase in RUK PAP emissions, the net long-run effect is one of
almost no change relative to the base year level. Underlying the zero change result in
Table 1 is a very small positive increase (0.0005%), which equates to a 1.7% increase in
the CO2-intensity of RUK GDP (i.e. proportionate to the drop in the latter). There also
is a shift in the sectoral source composition of PAP emissions, which largely reflects
positive competitiveness effects of the reduced price of imported intermediates from
Scotland. In terms of emissions driven by RUK consumption demands, there is a very
small rise in CAP emissions in the short-run (before migration effects kick in) of 0.02%.
By the long-run RUK CAP falls by 0.1% so that there is a smaller increase in the CAP
CO2-intensity of GDP (0.07%) than the corresponding PAP measure.
However, perhaps more importantly from the pollution leakage perspective that
may underlie public and policy interest in CAP (or carbon footprint) measures, is the
finding that the 0.61% drop in imports from ROW is accompanied by reductions in CO2
embodied in all imports to RUK. Moreover, these are sufficiently large to offset the
increases in CO2 embodied in Scottish imports of commodities 1-3 so that there is a net
reduction of 116 kilo-tonnes in these commodities and 885 kilo-tonnes across all
commodities imported to the UK regions (see the second and third numerical columns
of Table 2). We thus find some evidence of pollution leakage in ways which relate to

19
trade linkages, but which also shows that linkages through factor movements across
borders in response to relative factor returns are important (though this is driven by a
contraction is the region suffering out-migration of labour).
6. Sensitivity analysis – endogenous government expenditure
So far in this paper, we have examined the impacts on pollution of export-led
growth triggered entirely by the increase in labour productivity. In Table 3, we repeat
the simulation but make government expenditure endogenous, so that increased
government revenues from increased macro activity may be spent (i.e. allowing income
effects in government expenditure as the economy expands). We apply two constraints.
First, we assume a fixed ratio between the government balance (revenue minus
expenditure) and GDP across the two regions (we assume that government revenue is
collected and spending decisions are made at the national, UK, level). Second, we
assume that the pattern of government expenditure across the two regions and the six
sectors therein remains the same as in the base case. Endogenising government
expenditure means that the labour productivity increase triggers a knock-on demand
shock to the economy that is sufficient to do several things. First, it partly offsets the
long-run contraction in RUK activity so that there is no net change in RUK GDP,
although there is still a long-run contraction in household consumption and employment
(of -0.21% and -0.01% respectively) due to the out-migration to Scotland. In both
regions the short-run expansion is more limited in Table 3 relative to Table 1 because
the net decrease in employment across the two regions reduces revenue earned and
increases unemployment benefits required. However, over the long-run, Scottish GDP
grows by slightly more (7.9% relative to 7.7% in Table 1), as does aggregate (combined
household and government) consumption (3.01% relative to 2.5%).

20
However, the additional government demand reduces the positive
competitiveness effects observed in the central case. The long-run decrease in Scottish
CPI is smaller (-2.8% in Table 2 relative to -3.2% in Table 1) and there is a net increase
(of 0.16%) in RUK. This is reflected in a crowding out of ROW export demands. In the
case of Scotland these now only grow by 6.8% over the long-run relative to the 7.7%
increase in Table 1. In the case of RUK, the long-run increase of 0.38% reported in
Table 1 becomes a decrease of 0.42% in Table 3. This equates to a net increase of only
0.008% across the two regions.
Whilst GDP growth is higher across both regions with government expenditure
endogenous, PAP emissions of CO2 increase by less. This is because government
expenditure is concentrated in Sectors 5 and 6, which are less CO2-intensive (i.e. export
demands for more CO2-intensive sectors are partly crowded out). This also leads to a
net decrease in the PAP CO2-intensity of GDP in both regions over the long-run (-
1.17% in Scotland and -0.07% in RUK, compared to the respective -0.78% drop and
0.07% increase in Table 1). However, the increased government demand drives up the
CAP measures in both Scotland and RUK CAP measures (with a 0.18% increase
replacing the -0.1% drop in the case of RUK). The long-run impact on the CAP CO2
intensity of GDP is not qualitatively affected.
However, in terms of pollution leakage, the key result is that the reduced
strength of the positive competitiveness effects of the Scottish productivity increase
means that income effects in import demands dominate, so that there is an increase in
imports from ROW in both Scotland and RUK (of 0.45% and 0.14% respectively over
the long-run). There is also a change in the composition of imports as different activities
grow and their prices change at different rates with the result that CO2 embodied in
imports rises more than proportionately in both Scotland and RUK (1.4% and 0.8%
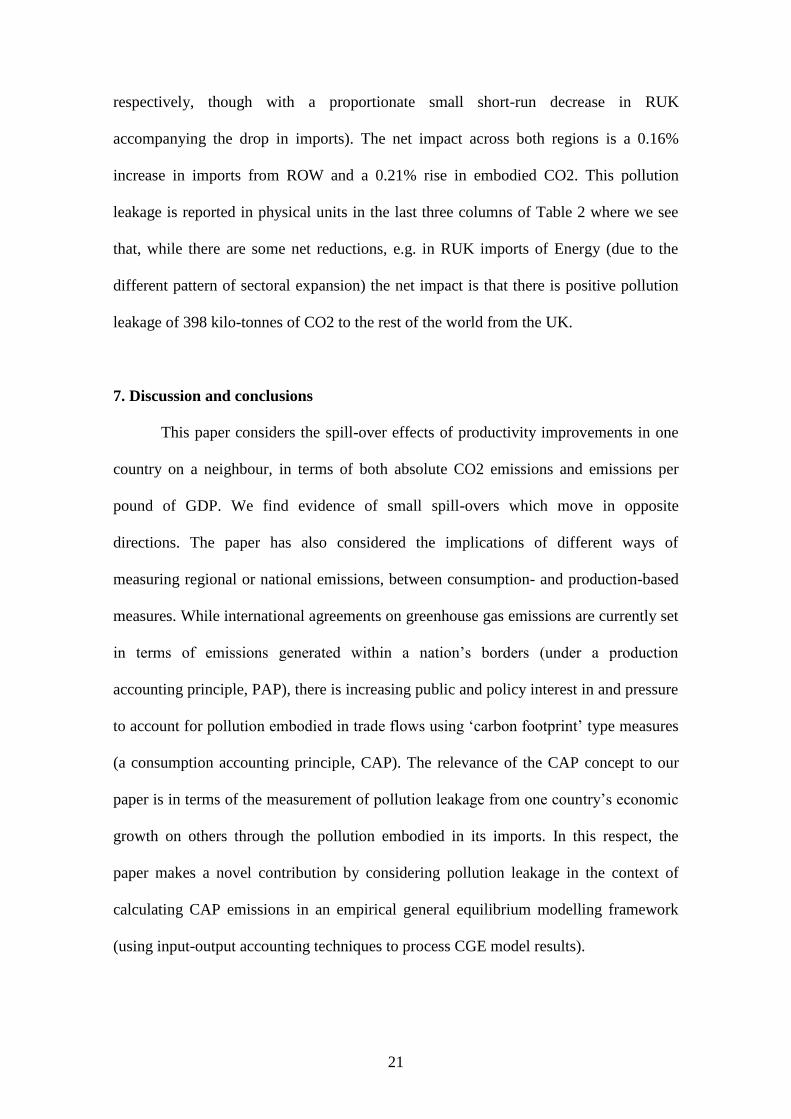
21
respectively, though with a proportionate small short-run decrease in RUK
accompanying the drop in imports). The net impact across both regions is a 0.16%
increase in imports from ROW and a 0.21% rise in embodied CO2. This pollution
leakage is reported in physical units in the last three columns of Table 2 where we see
that, while there are some net reductions, e.g. in RUK imports of Energy (due to the
different pattern of sectoral expansion) the net impact is that there is positive pollution
leakage of 398 kilo-tonnes of CO2 to the rest of the world from the UK.
7. Discussion and conclusions
This paper considers the spill-over effects of productivity improvements in one
country on a neighbour, in terms of both absolute CO2 emissions and emissions per
pound of GDP. We find evidence of small spill-overs which move in opposite
directions. The paper has also considered the implications of different ways of
measuring regional or national emissions, between consumption- and production-based
measures. While international agreements on greenhouse gas emissions are currently set
in terms of emissions generated within a nation‟s borders (under a production
accounting principle, PAP), there is increasing public and policy interest in and pressure
to account for pollution embodied in trade flows using „carbon footprint‟ type measures
(a consumption accounting principle, CAP). The relevance of the CAP concept to our
paper is in terms of the measurement of pollution leakage from one country‟s economic
growth on others through the pollution embodied in its imports. In this respect, the
paper makes a novel contribution by considering pollution leakage in the context of
calculating CAP emissions in an empirical general equilibrium modelling framework
(using input-output accounting techniques to process CGE model results).

22
In the specific application in this paper we examine the impact of productivity-
induced growth in one region on its own economic performance and pollution
generation and also in a neighbouring region that the target region trades with in terms
of both goods and services and the factor targeted with the productivity improvement.
We also examine the wider global pollution leakage effects of changes in imports. In
our results for the UK two-region case, we find that increased labour productivity in one
region, Scotland, provides the basis for an export-led expansion in that region but also
provides an indirect demand boost to the neighbouring region (the rest of the UK).
However, there is a negative supply shock in the neighbouring region as target region
draws labour (the input targeted with productivity improvement) away. There is also
growth in absolute pollution levels in both regions (under both PAP and CAP
measures). While in the targeted region this is slower than GDP growth so that the
CO2-intensity of aggregate activity falls, this will not necessarily be true in across both
regions, particularly where labour migration equates to a negative supply shock in the
neighbouring region. However, the export led nature of the growth means that CAP
emissions rise less than PAP emissions. Moreover, positive competitiveness effects
feeding through to both regions from the productivity improvement (through
interregional trade in the case of the neighbour) mean that there is substitution away
from imports from the rest of the world in favour of domestic production, which limits
or negates pollution leakage effects.
However, sensitivity analyses demonstrates that if government decides to use
revenues generated by the productivity-led expansion to fund increased expenditures,
then this increased domestic demand will put upward pressure on local prices, reducing
the strength of substitution effects away from imported commodities and making
pollution leakage effects more likely.

23
In practice, economy-wide responses to productivity growth will be complicated
by many factors. In this paper we do not consider specific ways in which a labour
productivity improvement may be introduced, or the extent to which technological
progress in the form of factor productivity improvements can also spill-over national
borders. This will be a focus of future research. A positive cost of producing the labour
productivity improvement may reduce the positive competitiveness effects of the
productivity improvement, thereby making pollution leakage effects more likely.
Another future research aim will be to extend to empirical analysis with greater sectoral
and spatial disaggregation in terms of modelling both goods and services production
and trade flows, but also factor markets. For example, in the current application we fix
the UK national population. However, intra-EU migration is an increasingly important
phenomenon that should be examined. More generally, it would be useful to consider
more policy-orientated scenarios. An initial direction may be to consider different types
of productivity improvement. For example, increases in energy efficiency are
commonly regarded as central to climate change policy (European Commission, 2009,
2010; IPCC, 2007; Stern, 2007). However, the possibility of rebound and particularly
backfire effects (Khazzoom 1980; Brookes 1990; Herring, 1999; Birol and Keppler,
2000; Saunders, 1992) makes the direction of pollution impacts more difficult to predict
(Hanley et al, 2009; Fisher-Vanden and Ho, 2010).
24
References
Antweiler, W., Copeland, B., Taylor, M., Is free trade good for the environment?
American Economic Review 91 (2001) 877-908.
Armington, P., A theory of demand for products distinguished by place of production,
IMF Staff Papers 16 (1969) 157-178.
Arrow, K., et al., Economic growth, carrying capacity, and the environment, Science
268 (1995) 520-521.
Babiker, M.H., Climate change policy, market structure and carbon leakage, Journal of
International Economics 65 (2) (2005) 421-445.
Bergman, L., CGE Modelling of Environmental Policy and Resource Management, in:
K.G. Mäler and J. Vincent (Ed.) Handbook of Environmental Economics: Economy
wide and International Environmental Issues, Elsevier North Holland (2005) 1273-
1306.
Birol, F., Keppler, J. H., Prices, technology development and the rebound effect,
Energy Policy 28 (2000) 457-479.
Blanchflower, D., Oswald, A., The Wage Curve, MIT Press Cambridge 1994.
Brookes, L., The greenhouse effect: the fallacies in the energy efficiency solution,
Energy Policy 18 (1990) 199-201.
Bruvoll, A., Fæhn, T., Transboundary effects of environmental policy: Markets and
emission leakages, Ecological Economics 59 (2006) 499-510.
Copeland, B.R., Taylor, M.S., Free trade and global warming: a trade theory view of the
Kyoto Protocol, Journal of Environmental Economics and Management 49 (2)
(2005) 205-234.
Elliot, J., et al., Trade and carbon taxes, American Economic Review: Papers and
Proceedings 100 (2010) 465-469.
25
European Commission, EU action against climate change: leading global action to 2020
and beyond, http://ec.europa.eu/clima/ publications/docs/post_2012_en.pdf (2009).
European Commission, The European Strategic Energy Technology Plan - SET-Plan-
towards a low carbon future, http://ec.europa.eu/energy/technology/set_plan/doc/
setplan_brochure.pdf (2010).
Fæhn, T., Bruvoll, A., Richer and cleaner - At others‟ expense? Resource and Energy
Economics 31(2) (2009) 103–122.
Fisher-Vanden, K., Ho, M.S., Technology, development and the environment, Journal
of Environmental Economics and Management 59 (2010) 94-108.
Ghertner, D. A., Fripp, M., Trading away damage: Quantifying environmental leakage
through consumption-based, life-cycle analysis, Ecological Economics 63 (2007) 563-
577.
Gibson, H., Export Competitiveness and UK sales of Scottish Manufacturers, Scottish
Economists Conference, The Burn, Scotland, 1990.
Greenaway, D., et al., Applied General Equilibrium Modelling: Applications,
Limitations and Future Developments. HMSO, London (1993).
Hanley, N., et al., Do increases in energy efficiency improve environmental quality and
sustainability? Ecological Economics 68 (2009) 692-709.
Harrigan, F., et al., AMOS: A Macro-Micro Model of Scotland, Economic Modelling
10 (1991) 424-479.
Harris, R., The Growth and Structure of the UK Regional Economy, Avebury,
Aldershot (1989) 1963-85.
Harris, J., Todaro, M., Migration, Unemployment and Development: A Two Sector
Analysis, American Economic Review 60 (1) (1970) 126-142.
Herring, H., Does energy efficiency save energy? The debate and its consequences,
26
Applied Energy 63(3) (1999) 209-226.
HM Treasury, Productivity in the UK: the evidence and the Government‟s approach,
http://www.hm-treasury.gov.uk/media/D/C/ACF1FBA.pdf (2000).
IPPC, Intergovernmental Panel on Climate Change, IPCC Fourth Assessment Report:
Climate Change 2007 – the physical science basis, Cambridge University Press,
http://www.ipcc.ch/ipccreports/ar4-wg1.htm (2007).
Jaffe, A., Newell, R., Stavins, R., Technological change and the environment,
Handbook of Environmental Economics, North-Holland (2003).
Jorgenson, D., Vu, K., Potential growth of the world economy, Journal of Policy
Modelling 32 (5) (2010) 615-631.
Khazzoom, D.J., Economic implications of mandated efficiency in standards for
household appliances, Energy Journal 1(4) (1980) 21-39.
Layard, R., Nickell, S., Jackman, R., Unemployment: Macroeconomic Performance and
the Labor Market, Oxford University Press, New York (1991).
Mongelli, I., Tassielli, G., Notarnicola, B., Global warming agreements, international
trade and energy/carbon embodiments: an input–output approach to the Italian case.
Energy Policy 34 (2006) 88–100.
Munksgaard, J., Pedersen, K., CO2 accounts for open economies: producer or consumer
responsibility? Energy Policy 29 (2001) 327-334.
Partridge, M., Rickman, D., Regional Computable General Equilibrium Modelling: A
Survey and Critical Appraisal, International Regional Science Review 21 (1998) 205-
248.
Partridge, M., Rickman, D., CGE Modelling for Regional Economic Development
Analysis, Regional Studies 44 (2010) 1311-1328.
Peters, G.P., Hertwich, E.G., Pollution embodied in trade: The Norwegian case, Global

27
Environmental Change 16 (2006) 379–387.
Saunders, H.D., The Khazzoom-Brookes postulate and neoclassical growth, Energy
Journal 13 (4) (1992) 131-148.
Sheldon, I., Trade and environmental policy: a race to the bottom? Journal of
Agricultural Economics 57 (3) (2006) 365-392.
Stern, N., Stern Review: The Economics of Climate Change, London: HM Treasury,
http://webarchive.nationalarchives.gov.uk/+/http://www.hm-treasury.gov.uk/stern_
review_report.htm (2007).
Turner, K., et al., An integrated IO and CGE approach to analysing changes in
environmental trade balances, Regional Science, in press doi:10.1111/j.1435-
5957.2011.00365.x (2011a).
Turner, K., et al., An input-output carbon accounting tool with carbon footprints
estimates for the UK and Scotland, Fraser of Allander Institute Economic Commentary,
Special edition (2011b) (06.01.2011).
Wiedmann, T., A review of recent multi-region input-output models used for
consumption based emission and resource accounting, Ecological Economics 69 (2009)
211-222.
World Bank (2011) The Changing Wealth of Nations. Washington DC, The World
Bank.

28
Appendices
Appendix 1. Sectors and commodity outputs identified in the general equilibrium
modelling framework
Sector/commodity output UK IOC SIC (2003)
1. Energy 4, 85, 86, 35 10, 40.1, 40.2, 40.3, 23
2. Extraction, Quarrying, Construction and Water Suppy 5, 6, 7, 87, 88 11, 12, 13, 14, 41, 45
3. Agriculture & Fishing 1-3 01, 02 (Part), 05.01, 05.02
4. Manufacturing 8-84, except 35 15-37, except 23
5. Retail, Distribution and Transport 89-99 50-52, 55, 60.1-60.3, 61-63, 64.1-64.2
6. Other services 100-123 65-75, 80, 85.1-85.3, 90-93, 95
29
Appendix 2. AMOSRUK Condensed CGE Model Listing
Value-added prices (A.1)
Commodity prices (A.2)
Consumer price index (A.3)
Capital price index (A.4)
Labour demand (A.5)
Capital demand (A.6)
Capital rental rate (A.7)
Household income (A.8)
Commodity demands (A.9)
Consumption demand (A.10)
Intermediate demand (A.11)
Investment demand (A.12)
Government demand (A.13)
Interregional export
demand (A.14)
International export
demand (A.15)
Capital stock (A.16)
Desired capital stock (A.17)
User cost of capital (A.18)
Investment (A.19)
x sx
i iK K
( , )x x x x
i i n kpv pv w w
( , , , )wx yx x x
i i i j ip p pv p p p
wx xx x xy y xw
i i i i i ii i i
cpi p p p
wx xx x xy y xw
i i i i i ii i i
kpi p p p
( , , , )x x x x x x
i i i i i nN N Q p pv w
( , , , )x x x x x x
i i i i i kK K Q p pv w
x x x x x x x x x x
n n k kY N w K w L T u f
x x x x x xy xw
i i i i i i iQ C J I G X X
( , , , )wx yx x x
i iC C p p p Y
( , , , )wx yx x x x
i i ij jj
I I p p p b K
Nx x
i iG G
( , , , , )wx x x yx x
i iJ J Q pv p p p
( , , , , , , )w Nx y y yxy xy y
i iX X p p p G J Q Y
( , , )w wxxw xw
i iX X p p D
, , 1 , 1(1 )sx x sx x
i t i i t i tK K K
* *
, , ( , , , )sx sx x x x x
i t i t i i iK K Q p pv ucc
( )x x xucc ucc kpi
*
, , , , 1( )x sx sx x sx
i t i t i t i i tK K K K
30
National population (A.20)
Regional population (A.21)
Migration (A.22)
Unemployment rate (A.23)
Wage bargaining (A.24)
Direct CO2 generation
(A.25)
CO2 CAP measure
(A.26)
Endogenous variables:
cpi : consumer price index
kpi : capital price index
m : Scottish immigration
p : commodity price
pv : value-added price
u : unemployment rate
ucc : user cost of capital
nw : nominal wage rate
kw : capital rental rate
C : consumption
D : foreign demand
G : government expenditure
I : investment demand
J : intermediate demand
K : capital demand sK : capital supply
K : capital stock adjustment
L : population
N : employment
Q : output
X : exports
Y : household income
Z: combined household and government expenditure on goods and services
e: energy/fuel use (energy purchases)
P: CO2 emissions directly generated
F: CO2 footprint
x x x
ix i
x x
L T Nu
L T
N s rL L L
1 1
s s s
t t tL L m
, , , ,s r
s s s r st t
t t t ts r
t t
w wm m u u L
cpi cpi
( , )x x x x
n nw w u cpi

31
A: combined use (domestic and imported intermediate inputs) matrix
: output/expenditure emissions intensity (post-shock IO accounting)
Parameters and exogenous variables:
b : capital coefficient
f : benefit payment per registered unemployed
D : rest of the world demand
T : participation rate
: government expenditure coefficient
: real wage coefficient
: depreciation rate
: regional share of factor income
: consumption expenditure share
: capital expenditure share
: capital stock adjustment parameter
µ: emissions intensity of fuel use
ρ: non-fuel combustion emissions intensity of output production
I: identity matrix
Subscripts:
,i j : sectors, commodity outputs (there are six of each – see Appendix 1)
k : capital
n : labour
t : time
h: households
Superscripts:
r : rest of the UK
s : Scotland
w : rest of the world
,x y : generic regional identifiers
p: (pollution) generated in production
c: (pollution) generated in final (household) consumption
: weighting on pollution intensity to reflect use of commodities produced in other
regions (and associated pollution intensities).
Functions:
(.)m : migration function
(.), (.)p pv : cost function
(.)ucc : user cost of capital function
(.)w : wage curve
(.)C : Armington consumption demand function
I(.): Armington investment demand function
(.)J : Armington intermediate demand function
(.), (.)K N : factor demand functions
(.)X : Armington export demand function

32
Notes:
- A bar above a variable indicates that this variable is exogenous for the purposes
of the simulations) i.e. a bar over a variable denotes exogeneity.
- Underlined variables are vectors whose elements are the sectoral values of the
corresponding variables. Where the subscript ij is used, this represents a
vector of all sectoral values, excluding sector i .
- A starred variable indicates desired value.
Implicit time subscripts apply to all the variables; these are stated explicitly only for the
relevant updating equations (A. 16, A.19, A.21, A.22).

33
Tables
Table 1. Impacts of a 5% increase in Scottish labour productivity in Scotland and
the rest of the UK (RUK) (% change from base year values)
Base SR LR Base SR LR
GDP (£m) 88,351 2.548% 7.703% 967,744 0.014% -0.170%
Household Consumption (£m) 54,923 2.769% 3.557% 621,187 0.012% -0.237%
Aggregate consumption (Households and Government, £m) 79,630 1.910% 2.453% 846,395 0.009% -0.174%
Investment (£m) 12,949 8.348% 6.776% 174,508 -0.016% -0.164%
CPI 1 -0.610% -3.200% 1 -0.020% -0.240%
Exports to other region (£m) 34,876 1.493% 7.814% 36,480 2.106% 0.094%
Imports from other region (£m) 36,480 2.106% 0.094% 34,876 1.493% 7.814%
Exports to ROW (£m) 15,706 1.675% 7.735% 249,595 -0.013% 0.380%
Imports from ROW (£m) 18,329 2.000% -0.373% 304,359 0.040% -0.611%
Real T-H consumption wage (£) 15.81 -0.730% 0.191% 17.39 0.020% 0.166%
Total employment (000s) 2,108 -0.786% 3.254% 21,681 0.017% -0.211%
Unemployment rate (%) 6.44 11.419% -1.664% 5.22 -0.301% -1.462%
Total population (000s) 5,078 0.000% 3.136% 54,756 0.000% -0.291%
PAP
Total CO2 generation (kilo-tonnes) 52,790 2.480% 6.865% 578,294 0.046% 0.000%
CO2/GDP (kilo-tonnes per £1million) 0.598 -0.066% -0.778% 0.598 0.031% 0.170%
CAP (relaxed DTA)
Total CO2 generation (kilo-tonnes) 62,659 3.152% 3.061% 626,180 0.016% -0.097%
CO2/GDP (kilo-tonnes per £1million) 0.709 0.589% -4.309% 1 0.002% 0.073%
CO2 embodied in imports from ROW 18,236 2.489% 0.760% 172,164 -0.001% -0.594%
CO2 embodied in imports of commodities
1. Energy 10,044 2.609% 2.018% 63,366 -0.062% -0.779%
2. Extraction, Quarrying, Construction and Water Supply 585 0.928% 1.850% 3,778 0.042% -1.112%
3. Agriculture & Fishing 575 2.736% 0.727% 4,297 0.083% -0.710%
4. Manufacturing 2,976 2.711% -0.712% 62,794 0.049% -0.394%
5. Retail, Distribution and Transport 3,781 2.397% -1.323% 33,412 -0.003% -0.569%
6. Other services 276 -0.271% -2.862% 4,518 0.078% -0.435%
Scotland RUK

34
Table 2. Increase (kilo-tonnes) in CO2 embodied in imports from ROW to the UK
regional and national economies in response to the increase in Scottish labour
productivity
Table 3. Impacts of a 5% increase in Scottish labour productivity in Scotland and
the rest of the UK (RUK) with endogenous government expenditure (% change
from base year values)
Central case Government expenditure endogenous
Scotland RUK UK Scotland RUK UK
CO2 embodied in imports from ROW (kilo-tonnes) 139 -1,024 -885 254 144 398
CO2 embodied in imports of commodities
1. Energy 203 -494 -291 242 -154 88
2. Extraction, Quarrying, Construction and Water Suppy 11 -42 -31 14 -14 -1
3. Agriculture & Fishing 4 -31 -26 7 4 11
4. Manufacturing -21 -248 -269 9 204 214
5. Retail, Distribution and Transport -50 -190 -240 -13 80 68
6. Other services -8 -20 -28 -5 23 18
Base SR LR Base SR LR
GDP (£m) 88,351 2.541% 7.901% 967,744 0.012% 0.000%
Household Consumption (£m) 54,923 2.774% 3.434% 621,187 0.005% -0.210%
Government Expenditure (£m) 24,708 -0.124% 2.305% 225,208 -0.124% 2.305%
Aggregate consumption (Households and Government, £m) 79,630 1.875% 3.084% 846,395 -0.030% 0.459%
Investment (£m) 12,949 8.293% 7.026% 174,508 -0.067% 0.128%
CPI 1 -0.650% -2.770% 1 -0.050% 0.160%
Exports to other region (£m) 34,876 1.495% 7.701% 36,480 2.091% 0.146%
Imports from other region (£m) 36,480 2.091% 0.146% 34,876 1.495% 7.701%
Exports to ROW (£m) 15,706 1.730% 6.787% 249,595 0.056% -0.419%
Imports from ROW (£m) 18,329 1.919% 0.453% 304,359 -0.033% 0.141%
Real T-H consumption wage (£) 15.81 -0.739% 0.430% 17.39 0.013% 0.406%
Total employment (000s) 2,108 -0.795% 3.392% 21,681 0.011% -0.097%
Unemployment rate (%) 6.44 11.553% -3.714% 5.22 -0.203% -3.525%
Total population (000s) 5,078 0.000% 3.128% 54,756 0.000% -0.290%
PAP
Total CO2 generation (kilo-tonnes) 52,790 2.488% 6.641% 578,294 0.045% -0.074%
CO2/GDP (kilo-tonnes per £1million) 0.598 -0.052% -1.168% 0.598 0.033% -0.074%
CAP (relaxed DTA)
Total CO2 generation (kilo-tonnes) 62,659 3.127% 3.236% 626,180 -0.015% 0.179%
CO2/GDP (kilo-tonnes per £1million) 0.709 0.571% -4.323% 1 -0.027% 0.179%
CO2 embodied in imports from ROW 18,236 2.407% 1.395% 172,164 -0.082% 0.083%
CO2 embodied in imports of commodities
1. Energy 10,044 2.543% 2.406% 63,366 -0.136% -0.243%
2. Extraction, Quarrying, Construction and Water Supply 585 0.812% 2.324% 3,778 -0.035% -0.382%
3. Agriculture & Fishing 575 2.669% 1.237% 4,297 0.006% 0.099%
4. Manufacturing 2,976 2.603% 0.313% 62,794 -0.038% 0.325%
5. Retail, Distribution and Transport 3,781 2.305% -0.338% 33,412 -0.088% 0.240%
6. Other services 276 -0.441% -1.642% 4,518 -0.029% 0.509%
Scotland RUK

35
FIGURES
Figure 1. Impacts of a 5% increase in Scottish labour productivity on Scottish
production sector output levels (time periods/years 1-50)
Figure 2. Impacts of a 5% increase in Scottish labour productivity on RUK
production sector output levels (time periods/years 1-50)
0
0.01
0.02
0.03
0.04
0.05
0.06
0.07
0.08
0.09
0.1
0 1 2 3 4 5 6 7 8 9 10 11 12 13 14 15 16 17 18 19 20 21 22 23 24 25 26 27 28 29 30 31 32 33 34 35 36 37 38 39 40 41 42 43 44 45 46 47 48 49 50
% c
han
ge f
rom
bas
e y
ear
val
ue
1. Energy 2. Extraction, Quarrying, Construction and Water Supply
3. Agriculture & Fishing 4. Manufacturing
5. Retail, Distribution and Transport 6. Other services
-0.0025
-0.002
-0.0015
-0.001
-0.0005
0
0.0005
0.001
0.0015
0 1 2 3 4 5 6 7 8 9 10 11 12 13 14 15 16 17 18 19 20 21 22 23 24 25 26 27 28 29 30 31 32 33 34 35 36 37 38 39 40 41 42 43 44 45 46 47 48 49 50
% c
han
ge f
rom
bas
e y
ear
val
ue
1. Energy 2. Extraction, Quarrying, Construction and Water Supply
3. Agriculture & Fishing 4. Manufacturing
5. Retail, Distribution and Transport 6. Other services