Productivity Growth and the New Economy
56
Productivity Growth and the New Economy What, another paper on the new economy? When financial markets are raking through the debris of $8 trillion in lost equity value, and “.com” is a reviled four-symbol word, a paper on the impact of the new economy on productivity would seem as welcome as an analysis of the role of whales in the lighting revolution. In fact, the new economy (or, more precisely, information technolo- gies) continues to raise important puzzles about productivity growth. Variations in productivity growth have proved to be one of the most durable puzzles in macroeconomics. After a period of rapid growth fol- lowing World War II, productivity stagnated in the early 1970s. There was no shortage of explanations offered, including rising energy prices, high and unpredictable inflation, rising tax rates, growing government, burdensome environmental and health regulation, declining research and development, deteriorating labor skills, depleted possibilities for inven- tion, and societal laziness. 1 Yet these explanations seemed increasingly inadequate as inflation fell, tax rates were cut, regulatory burdens stabi- lized, government’s share of output fell, research and development and patents granted grew sharply, real energy prices fell back to pre-1973 lev- els, and a burst of invention in the new economy and other sectors fueled an investment boom in the 1990s. The productivity slowdown puzzle of the 1980s evolved into the Solow paradox of the early 1990s: computers were everywhere except in the 211 WILLIAM D. NORDHAUS Yale University The author is grateful for comments from Ray Fair, Robert Yuskavage, and members of the Brookings Panel. 1. See Nordhaus (1972), Baily (1982), and Denison (1980).
Transcript of Productivity Growth and the New Economy

Productivity Growth and the New Economy
What, another paper on the new economy? When financial marketsare raking through the debris of $8 trillion in lost equity value, and “.com”is a reviled four-symbol word, a paper on the impact of the new economyon productivity would seem as welcome as an analysis of the role ofwhales in the lighting revolution.
In fact, the new economy (or, more precisely, information technolo-gies) continues to raise important puzzles about productivity growth.Variations in productivity growth have proved to be one of the mostdurable puzzles in macroeconomics. After a period of rapid growth fol-lowing World War II, productivity stagnated in the early 1970s. Therewas no shortage of explanations offered, including rising energy prices,high and unpredictable inflation, rising tax rates, growing government,burdensome environmental and health regulation, declining research anddevelopment, deteriorating labor skills, depleted possibilities for inven-tion, and societal laziness.1 Yet these explanations seemed increasinglyinadequate as inflation fell, tax rates were cut, regulatory burdens stabi-lized, government’s share of output fell, research and development andpatents granted grew sharply, real energy prices fell back to pre-1973 lev-els, and a burst of invention in the new economy and other sectors fueledan investment boom in the 1990s.
The productivity slowdown puzzle of the 1980s evolved into the Solowparadox of the early 1990s: computers were everywhere except in the
211
W I L L I A M D . N O R D H A U SYale University
The author is grateful for comments from Ray Fair, Robert Yuskavage, and members ofthe Brookings Panel.
1. See Nordhaus (1972), Baily (1982), and Denison (1980).
1017-04 BPEA/Nordhaus 12/30/02 15:01 Page 211

productivity statistics. The penetration of the American workplace byincreasingly sophisticated and powerful computers and software appar-ently failed to give an upward boost to productivity growth, for throughthin and thick, labor productivity growth seemed to be on a stable track ofslightly over 1 percent a year.
Then, in the mid-1990s, productivity growth rebounded sharply.Beginning in 1995, productivity in the business sector grew at a rateclose to that in the pre-1973 period. The causes of the rebound werewidely debated, but at least part was clearly due to astonishing produc-tivity growth in the new economy sectors of information technology andcommunications. This period led to yet another paradox, identified byRobert Gordon, who argued that, after correcting for computers, thebusiness cycle, and changes in measurement techniques, there was noproductivity rebound outside the computer industry.
This paper attempts to sort out the productivity disputes by using a newtechnique for decomposing sectoral productivity growth rates and using anew data set that relies primarily on value added by industry. In additionto examining the recent behavior of productivity, the paper adds a fewnew features to the analysis.
First, it lays out a different way of decomposing productivity growth,one that divides aggregate productivity trends into factors that increaseaverage productivity growth through changes in the shares of differentsectors. Second, it develops an alternative way of measuring aggregateand industrial productivity based on industrial data built up from theincome side rather than the product side of the national accounts. By rely-ing on the industrial data, I can focus on different definitions of outputand get sharper estimates of the sources of productivity growth. Third, byworking with the new industrial data, I can make more accurate adjust-ments for the contribution of the new economy than has been possible inearlier studies. Finally, this new data set allows creation of a new eco-nomic aggregate, which I call “well-measured output,” that excludesthose sectors where output is poorly measured or measured by inputs.
Productivity Accounting
Measuring productivity would appear to be a straightforward issue ofdividing output by inputs. In fact, particularly with the introduction of
212 Brookings Papers on Economic Activity, 2:2002
1017-04 BPEA/Nordhaus 12/30/02 15:01 Page 212

chain-weighted output measures, disentangling the different componentsof productivity growth has become quite complex. In this section Iexplore how to decompose productivity growth into three components: afixed-weight aggregate productivity index, a “Baumol effect” that reflectsthe effect of changing shares of output, and a “Denison effect” thatreflects the effect of differences between output and input weights.2
Consider indexes for the major aggregates. Define aggregate output asXt , composite inputs (here, hours of work) as St , and aggregate productiv-ity as At = Xt /St. The share of output of sector i in nominal GDP is σi,t , andthe growth of output or other variables is designated by g(X). Output ismeasured as a chained index, whereas labor inputs and productivity aresums and ratios, respectively. In this paper all growth rates will be calcu-lated in logarithmic terms, so that g(Xt) = ∆ln(Xt) = ln(Xt) – ln(Xt–1).
The growth of labor productivity in logarithmic terms is
Considering only the first term, after some manipulation I get
Using the same methodology, I derive the growth of productivity asg(At) = ∆ ln(At), which after some manipulation gives
where wi,t–1 is the share of inputs in sector i in total inputs. The interpreta-tion of equation 1 is that the rate of aggregate productivity growth is equalto the weighted-average productivity growth of the individual sectors plusthe difference-weighted average of input growth. The weights on produc-tivity growth are the lagged shares of nominal outputs, whereas the differ-ence weights on input growth are the differences between output andinput shares. (A symmetrical formula could be derived where the roles ofinput and output shares are reversed.)
( ) ( ) ln( ) ( ) ( )( – ),, – , – , –1 1 1 1g A A g A g S wt t it i t it i t i tii
= = + ∑∑∆ σ σ
∆ ln( ) ln ( ) ( ) ., – , –X g X g Xt it i ti
it i ti
= +
≈∑ ∑1 1 1σ σ
∆ ∆ ∆ln( ) ln( ) – ln( ).A X St t t=
William D. Nordhaus 213
2. The formulas in this section are derived and discussed more extensively in Nordhaus(2002).
1017-04 BPEA/Nordhaus 12/30/02 15:01 Page 213
It will be convenient to add a term to capture the role of changingshares of output. Add and subtract from equation 1 and
rearrange terms, where “base” indicates a base year. This yields
Interpretation
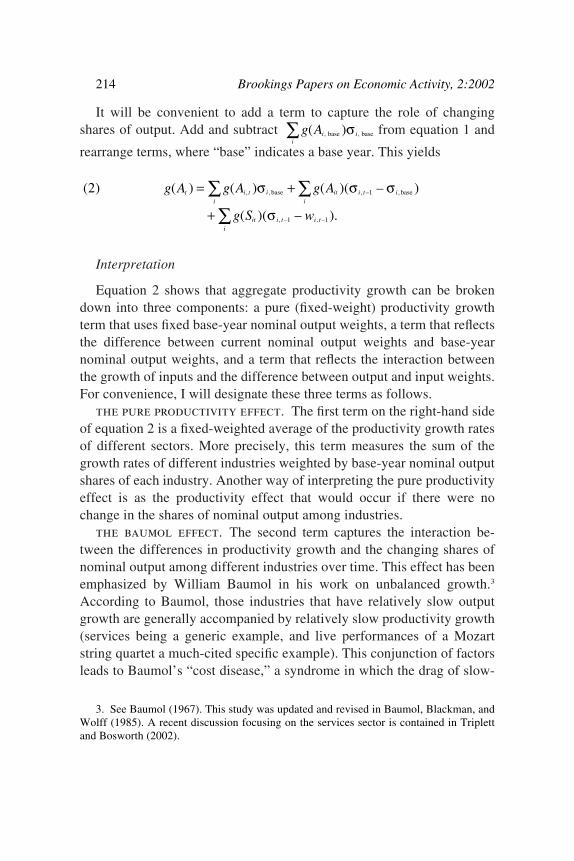
Equation 2 shows that aggregate productivity growth can be brokendown into three components: a pure (fixed-weight) productivity growthterm that uses fixed base-year nominal output weights, a term that reflectsthe difference between current nominal output weights and base-yearnominal output weights, and a term that reflects the interaction betweenthe growth of inputs and the difference between output and input weights.For convenience, I will designate these three terms as follows.
the pure productivity effect. The first term on the right-hand sideof equation 2 is a fixed-weighted average of the productivity growth ratesof different sectors. More precisely, this term measures the sum of thegrowth rates of different industries weighted by base-year nominal outputshares of each industry. Another way of interpreting the pure productivityeffect is as the productivity effect that would occur if there were nochange in the shares of nominal output among industries.
the baumol effect. The second term captures the interaction be-tween the differences in productivity growth and the changing shares ofnominal output among different industries over time. This effect has beenemphasized by William Baumol in his work on unbalanced growth.3
According to Baumol, those industries that have relatively slow outputgrowth are generally accompanied by relatively slow productivity growth(services being a generic example, and live performances of a Mozartstring quartet a much-cited specific example). This conjunction of factorsleads to Baumol’s “cost disease,” a syndrome in which the drag of slow-
( ) ( ) ( ) ( )( – )
( )( – ).
, , , – ,
, – , –
2 1
1 1
g A g A g A
g S w
t i t ii
it i t ii
it i t i ti
= +
+
∑ ∑∑
σ σ σ
σ
base base
g Aii
i( ), , base base∑ σ
214 Brookings Papers on Economic Activity, 2:2002
3. See Baumol (1967). This study was updated and revised in Baumol, Blackman, andWolff (1985). A recent discussion focusing on the services sector is contained in Triplettand Bosworth (2002).
1017-04 BPEA/Nordhaus 12/30/02 15:01 Page 214

productivity-growth industries retards the growth of aggregate productiv-ity. In terms of equation 2, if the share of nominal output σi,t devoted toslow-productivity-growth industries rises over time, the second term willalso be rising, and overall growth will thereby be driven downward.
the denison effect. The third term in equation 2 captures leveleffects due to differences in shares. I label this the Denison effect, after Edward Denison, who pointed out that the movement from low-productivity-level agriculture to high-productivity-level industry wouldraise productivity even if the productivity growth rates in the two sectorswere zero. Denison showed that this effect was an important componentof overall productivity growth when fixed-weight indexes are used tomeasure output.4
Earlier work on productivity decomposition implicitly or explicitlyincluded a fourth effect, called the fixed-weight drift term.5 That effectarises when real output is measured using Laspeyres indexes of output.Real output measured with a Laspeyres fixed-base quantity index tends togrow more slowly than output measured by a chain index in periodsbefore the base year and more rapidly in periods after the base year. Thedivergence of relative real outputs from relative nominal outputs with“old-style” fixed-weight quantity indexes motivates the name. This termvanishes (or almost vanishes) with the introduction of chain indexes (or,more precisely, well-constructed superlative index numbers) because realoutput shares used in calculating the growth rates are equal (or almostequal) to nominal output shares. A careful examination of the measure ofproductivity growth that most closely corresponds to the welfare-theoreticmeasure of the growth of real income shows as well that the fixed-weightdrift term should be omitted.6 All in all, moving to chain weights andremoving the fixed-weight drift term marked a major advance in produc-tivity measures.
William D. Nordhaus 215
4. A number of studies found this syndrome. See in particular Denison’s studies ofpostwar Europe (Denison, 1967).
5. More precisely, when output is measured using fixed weights, the fixed-weight drift
term is where zit is the share of industry i in total output when output is
measured by a Laspeyres index. This term is zero when output is measured using chainweights.
6. See Nordhaus (2002).
g X zit it it
i
( )[ – ],σ∑
1017-04 BPEA/Nordhaus 12/30/02 15:01 Page 215

Review of Alternative Productivity Measures
The Underlying Productivity Data
The productivity data used in this paper differ from standard measuresused to track productivity. The output data are based on income-sidevalue-added data (gross domestic income, or GDI) developed by theBureau of Economic Analysis (BEA).7 The BEA provides data on nomi-nal output by industry (value added), Fisher indexes of real output andprices by industry, and hours of work. For this paper I have created Fisherindexes of output for different aggregates as well as estimates of laborproductivity by industry and for different aggregates.8
The major advantage of the income-side measures is that they present aconsistent set of detailed industrial accounts in which the nominal valuessum to nominal GDP; by contrast, very little industrial detail is availableon the product side of the accounts. The disadvantage is that the real out-put data using chain weights are available only for the period 1977–2000.
Because of interest in the new economy, I have also constructed a setof new economy accounts. For the purpose of this paper, I define the neweconomy as machinery, electric equipment, telephone and telegraph, andsoftware. The combined share of these sectors in real GDP grew from2.9 percent in 1977 to 10.6 percent in 2000. These sectors are somewhatmore inclusive than a narrow definition of the new economy but are thenarrowest definition for which a complete set of accounts is available. Idiscuss details of the new economy below.
In addition, I develop productivity measures for three different broadoutput concepts that can be used in productivity studies. One of these isstandard GDP (measured from the income side of the accounts). A secondis what the Bureau of Labor Statistics (BLS) defines as nonfarm businesssector output. A third concept responds to concerns in productivity stud-ies about the poor quality of the price deflation in several sectors. For thispurpose I have constructed a set of accounts that I call “well-measuredoutput,” which includes only those sectors for which output is relativelywell measured. I begin with a review of standard labor productivity mea-
216 Brookings Papers on Economic Activity, 2:2002
7. The BEA data are available on the BEA website. Details on the construction of thedata sets are provided in Nordhaus (2002).
8. A discussion of the use of Fisher indexes in the national income and productaccounts is found in Triplett (1992) and Landefeld and Parker (1997).
1017-04 BPEA/Nordhaus 12/30/02 15:01 Page 216

sures and then turn to a comparison of standard measures with themeasures constructed for this study.
The BLS Productivity Data
The most widely followed productivity measures are constructed andpublished by the BLS. Figure 1 shows the behavior of the BLS series forthe business sector; for this purpose I have used a three-year moving aver-age of labor productivity growth. Table 1 shows a simple regression withtwo breaks in trend, one in 1973 and another in 1995.
Three points are worth noting. First, the labor productivity growth datain figure 1 do not show dramatic and obvious breaks in trend. Labor pro-ductivity began deteriorating in the late 1960s, and the really terribleperiod was in the early 1980s. An untutored analyst would probably notrecognize any sharp break in trend labor productivity after 1973. Second,the productivity upsurge in the late 1990s was not a particularly rareevent. Productivity accelerations of greater magnitude were seen in theearly 1960s, the early 1970s, and the early 1980s—indeed, there werechanges in “trend” in virtually every decade. The volatile nature of pro-ductivity growth is a warning that one should not read too much into aperiod even as long as five years. Third, even with the rapid productivitygrowth observed since 1995, labor productivity growth is still below fourother postwar highs. The early 1950s, the mid-1960s, the early 1970s(briefly), and the mid-1980s were periods when labor productivity grewmore rapidly than it has in the last three years.
Notwithstanding these cautions, it is important to examine the currentupturn in productivity with an eye to understanding its sources. In partic-ular, we will want to determine the role of the new economy in the recentproductivity rebound.
Comparison of Labor Productivity Growth Rates between Product Side and Income Side
The BLS business output series is a product-side index provided by theBEA. It is useful to compare the standard BLS series with the income-sideproductivity measures developed here. This is not straightforwardbecause (in addition to the problem of dealing with the statistical discrep-ancy) the BLS business output (“Bus-Prod”) series does not correspond toa straightforward combination of the income-side industries. I have
William D. Nordhaus 217
1017-04 BPEA/Nordhaus 12/30/02 15:01 Page 217

prepared an income-side business output measure (“Bus-Inc”) by combin-ing the major industries as best I can. The nominal values of the twoaggregates are reasonably close, with a root mean square error of0.16 percent over the 1977–2000 period.9
As far as productivity per hour worked is concerned, the two seriesagree reasonably well. For the entire 1977–2000 period the income-sideproductivity growth of nonfarm business output was about 0.07 percent ayear faster. On the whole, the income-side and the product-side data arereasonably consistent. Table 2 shows a comparison of estimates ofproductivity growth from the two series for three subperiods of the1977–2000 period. The basic story is the same except in the last period,when the income-side measure grew substantially faster; this difference is
218 Brookings Papers on Economic Activity, 2:2002
9. The Bus-Inc variable excludes general government and private households alongwith most of housing and the nonprofit sectors of the service industries. For the comparisonin the text, I have subtracted the statistical discrepancy from the income-side measure.
Figure 1. Labor Productivity Growth in the Business Sectora
Source: Bureau of Labor Statistics.a. Three-year moving average of logarithmic growth rates.
0
1
2
3
4
5
6
1955 1960 1965 1970 1975 1980 1985 1990 1995 2000
Percent a year
1017-04 BPEA/Nordhaus 12/30/02 15:01 Page 218

due primarily to the mysterious statistical discrepancy, which rose sharplyfrom 1977 to 2000.
Well-Measured Output
The final output measure is one that includes only those sectors whereoutput is relatively well measured. It is widely accepted today that, inmany sectors, real output is poorly measured in the national incomeaccounts. In some cases, such as general government and education, thereis no serious attempt to measure output, and instead the indexes of activ-ity are inputs such as employment. In other cases the BEA (or the BLS,which prepares the underlying price data) uses deflation techniques thatare potentially defective.
The idea of well versus poorly measured sectors was introduced by ZviGriliches in his 1994 presidential address to the American EconomicAssociation:
Imagine a “degrees of measurability” scale, with wheat production at one endand lawyer services at the other. One can draw a rough dividing line on thisscale between what I shall call “reasonably measurable” sectors and the rest,where the situation is not much better today than it was at the beginning of thenational income accounts.10
Defective deflation occurs for two quite different reasons. First, in somesectors, of which construction, insurance, and banking are examples, the
William D. Nordhaus 219
10. Griliches (1994, p. 10).
Table 1. Trends in Labor Productivity in the Business Sector, 1948–2002
Regression Standard Variablea coefficient error t Statistic
Constant 3.34 0.36 9.4DUM73b –1.93 0.52 –3.7DUM95c 1.17 0.77 1.5
Summary statisticR2 0.060Standard error of regression 3.58No. of observations 218
Source: Author’s regressions using data from the Bureau of Labor Statistics.a. The dependent variable is the annualized one-quarter change in the logarithm of labor productivity. The sample period is
1948:1 to 2002:2.b. Dummy variable that takes the value of 1 after 1973:2.c. Dummy variable that takes the value of 1 after 1995:2.
1017-04 BPEA/Nordhaus 12/30/02 15:01 Page 219

BEA does use price indexes for deflation of nominal magnitudes, but theprice indexes are for goods or services that are not representative of therange of outputs in that sector. Second, and this has received much moreattention, in some sectors the underlying price index does not adequatelycapture quality change or the introduction of new goods and services. Anexcellent historical example of this syndrome is computers. Beforehedonic techniques were introduced, the government assumed that theprice of computers was constant in nominal terms. When hedonic priceindexes for computers were introduced, the earlier assumption was foundto overstate the “true” price increase by around 20 percent a year for thelast three decades.
It is difficult for an outsider to assess the quality of the deflation of eachsector included in the industrial accounts. There have been many studiesof this issue.11 Nonetheless, after discussion with experts inside and out-side the BEA, I have constructed a new measure of output for sectors thathave relatively well measured outputs. The sectors included are
Agriculture, forestry, and fishingMiningManufacturingTransportation and public utilitiesWholesale trade
220 Brookings Papers on Economic Activity, 2:2002
11. Griliches’s (1994) definition of “measurable” sectors is identical to that of well-measured output except that he puts trade in the unmeasurable sector.
Table 2. Alternative Measures of Productivity Growth in the Nonfarm Business Sector, 1977–2000a
Percent a year
Change, Change,1977–89 to 1977–89 to
Measure 1977–89 1989–95 1995–2000 1989–95 1995–2000
BLS (product side)b 1.21 1.46 2.45 0.25 1.24BEA (income side)c 1.26 1.26 2.87 0.00 1.61Difference –0.05 0.20 –0.41 0.25 –0.36
Source: Bureau of Economic Analysis data.a. Growth in output per hour worked; annual averages.b. Product-side output of the nonfarm business sector, based on BLS hours-worked measures, and used by the BLS in its busi-
ness sector productivity measures.c. Uses income-side output and hours measures derived in this paper and using BEA hours data.
1017-04 BPEA/Nordhaus 12/30/02 15:01 Page 220

Retail tradeCertain services (software, other business services, hotels, repair).
Five major sectors are excluded:
Construction*Finance,* insurance,* and real estateMost services*General governmentGovernment enterprises*.
The sectors marked by asterisks are included in the BLS’s measure ofbusiness output. Nonfarm business output remained about 75 percent ofnominal GDP over the 1977–2000 period, whereas well-measured outputdeclined from 68 percent of nominal GDP in 1948 to 57 percent in 1977and 50 percent in 2000. Thus, well-measured output is currently onlyabout half of GDP, and the share of output that is well measured has beendeclining steadily since World War II. This trend confirms, using a differ-ent approach and data set, Griliches’s observation that the degree of“measurability” of real output has been declining over time. At the sametime, the BEA has made considerable progress in introducing improveddeflation techniques. Whether the progress of improved deflation has out-stripped the decline in measurability is an interesting but open question.
Table 3 shows the growth of output per hour for the three majoraggregates—GDP, nonfarm business output, and well-measured output—for different subperiods of the 1977–2000 period. Productivity in thebusiness sector has grown faster than productivity for total GDP, primar-ily because of the slow growth of productivity in the government sector.Productivity in the well-measured sectors has grown about 0.65 percent-age point a year faster than in the nonfarm business economy because ofpoor performance in the construction and services industries.
The New Economy
This study also develops input and output data for the new economy.For the purpose of this study, I use the following formal definition: Thenew economy involves acquisition, processing and transformation, anddistribution of information. The three major components are the hardware(primarily computers) that processes the information, the communications
William D. Nordhaus 221
1017-04 BPEA/Nordhaus 12/30/02 15:01 Page 221

Tab
le 3
.P
rodu
ctiv
ity
Gro
wth
for
Alt
erna
tive
Mea
sure
s of
Agg
rega
te O
utpu
t an
d th
e N
ew E
cono
my,
197
7–20
00a
Per
cent
a y
ear
Cha
nge,
C
hang
e,
Cha
nge,
19
77–8
9 to
1977
–89
to19
89–9
5 to
Mea
sure
1977
–89
1989
–95
1995
–200
019
77–2
000
1989
–95
1995
–200
019
95–2
000
Tot
al e
cono
my
GD
P1.
201.
111.
731.
29–0
.09
0.53
0.62
GD
I1.
210.
962.
241.
37–0
.25
1.04
1.28
Non
farm
bus
ines
s se
ctor
Inco
me-
side
1.26
1.26
2.87
1.61
0.00
1.61
1.61
BL
S m
easu
re1.
211.
462.
451.
540.
251.
240.
99W
ell-
mea
sure
d ou
tput
2.00
1.93
3.29
2.26
–0.0
71.
291.
36N
ew e
cono
my
6.25
6.37
9.98
7.09
0.12
3.73
3.61
Sou
rce:
Aut
hor’
s ca
lcul
atio
ns u
sing
BE
A a
nd B
LS
dat
a.a.
Gro
wth
in o
utpu
t per
hou
r w
orke
d; d
ata
are
annu
al a
vera
ges.
Det
ails
may
not
sum
to to
tals
bec
ause
of
roun
ding
.
1017-04 BPEA/Nordhaus 12/30/02 15:01 Page 222

systems that acquire and distribute the information, and the software that,with human help, manages the entire system.
Which sectors are included in practice under this definition? Table A1in the appendix shows the new economy sectors as defined by the Com-merce Department for its study The Emerging Digital Economy.12 Thatdefinition overlaps with the formal definition, and it includes some oldeconomy sectors as well as some sectors with questionable price indexes.
For purposes of this study, we are hamstrung because comprehensivedata are limited to major industries. I therefore include in the new econ-omy the four major industries that contain the new economy industries:industrial machinery and equipment (Standard Industrial Classifica-tion 35), electronic and other electric equipment (SIC 36), telephone andtelegraph (SIC 48), and software (SIC 873). The BEA has developeddetailed industrial data for the first three of these, but there is incompletedetail for software.
This definition of the new economy is somewhat broader than wouldbe ideal for the present purposes. For example, SIC 35 contains comput-ers and office equipment, but the computer industry accounts for less than25 percent of the total 1996 value added in that sector. Other parts ofSIC 35 include ball bearings and heating and garden equipment, whichare dubious candidates for inclusion in the new economy. A prominentcomponent of SIC 36 is semiconductors, an industry central to the neweconomy, but semiconductors constitute only 8 percent of the 1996 valueadded in SIC 36. This sector includes communications equipment, onepart of which has hedonic deflation. This sector also contains many oldeconomy industries, including incandescent bulbs, and a wide array ofconsumer electronics, whose prices are probably poorly measured. Simi-larly, although the telephone and telegraph sector is central to the com-munications components of the new economy, it also includes somepaleoindustries like telegraph, whose commercial applications date from1844, and telephone, which premiered in 1876.
Software is genuinely a new economy industry. However, only the datafor the prepackaged component (slightly larger than one-fourth of thetotal) are hedonically deflated at present. The data on software are incom-plete, and some crude assumptions are necessary to fit software into thepresent database.
William D. Nordhaus 223
12. U.S. Department of Commerce (2000).
1017-04 BPEA/Nordhaus 12/30/02 15:01 Page 223

Because of the importance of the new economy in the present analysis,it is worth emphasizing that relatively few industries are measured usinghedonic price indexes that systematically attempt to capture new goodsand components or quality change. The BEA reports that systematichedonic prices are used for only four major industries (all in new econ-omy sectors): computers and peripheral equipment, semiconductors,prepackaged software, and digital switching equipment. In 1998 thesesectors accounted for about 2.2 percent of GDP, while the four industriesincluded in the broad definition of the new economy in this studyaccounted for 9.6 percent of GDP. This suggests that only a quarter ofwhat I have labeled as the new economy has careful hedonic measure-ment of prices and output.
Productivity Resurgence and the New Economy
I now turn to the central questions about productivity performance inthe late 1990s: What was the magnitude of the productivity upturn? Howmuch of it was due to each of the three factors derived above—pure pro-ductivity acceleration, the Baumol effect, and the Denison effect? Whatwas the contribution of the new economy to the productivity acceleration?And is there a different view for the well-measured part of the economythan for the entire economy?
How Large a Productivity Acceleration?
Returning to table 3, we see that labor productivity growth in the threemajor aggregates showed little change in the two subperiods between1977 and 1995, averaging around 1.1 percent a year for the income-sidemeasure of the total economy and around 1.3 percent a year for income-side nonfarm business output. Well-measured output showed more robustproductivity growth, averaging around 2.0 percent a year, but was rela-tively stable over this period. The new economy showed substantialproductivity growth, averaging over 6 percent a year in the first two sub-periods, but with little acceleration.
The last five years of the period showed a dramatic upturn in labor pro-ductivity growth in all of the measures (last column of table 3). For thetotal economy the acceleration from the first to the last subperiod was
224 Brookings Papers on Economic Activity, 2:2002
1017-04 BPEA/Nordhaus 12/30/02 15:01 Page 224

0.53 percentage point using the output-side measure and almost twice asmuch, 1.04 percentage points, using the income-side measure. Account-ing for the difference is the huge growth in the statistical discrepancyfrom 1997 to 2000.
The nonfarm business sector showed an upturn of 1.61 percentagepoints using the income-side measure and a slightly smaller increase of1.24 percentage points according to the BLS measure. The differencebetween the two estimates is partly due to more rapid growth in theincome-side estimate of nonfarm business output and partly due to some-what faster growth in the BLS’s estimate of hours for that sector.
Well-measured output is estimated to have seen faster productivitygrowth over the entire period than the other major aggregates. Over theentire period, productivity growth was 0.65 percentage point faster in thewell-measured sectors than in the income-side measure of nonfarm busi-ness, and 0.89 percentage point faster than in income-side total output.The acceleration in productivity in the last five years of the period in thewell-measured sectors was slightly smaller than that in income-side non-farm business output, but larger than for either of the definitions of theentire economy. The new economy logged a breathtaking acceleration inproductivity of 3.7 percentage points a year over the last five years of theperiod, to a growth rate of 10 percent a year. In short, the last five years ofthe period witnessed a major upturn in productivity growth for all themajor aggregates.
Decomposition of the Productivity Acceleration
Productivity growth is determined both by the rates of productivitygrowth within industries and by changes in the composition of industries.How much of the recent growth in productivity was due to each of thethree factors—pure productivity growth, the Baumol effect, and the Deni-son effect—derived above?
The first panel of table 4 shows the basic results for the overall econ-omy, as measured from the income side. The pure productivity effect wasvirtually identical to overall productivity growth over the entire period.However, the pure productivity effect was slightly (0.15 percentage point)higher than conventionally measured average productivity growth in themost recent period. Even larger differences are seen for the nonfarm busi-ness sector and for well-measured output (bottom two panels of table 4).
William D. Nordhaus 225
1017-04 BPEA/Nordhaus 12/30/02 15:01 Page 225
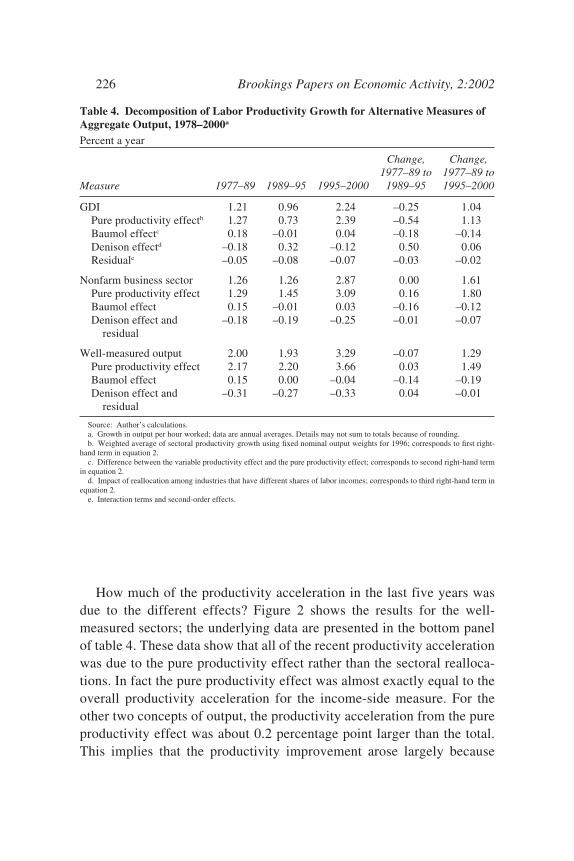
How much of the productivity acceleration in the last five years wasdue to the different effects? Figure 2 shows the results for the well-measured sectors; the underlying data are presented in the bottom panelof table 4. These data show that all of the recent productivity accelerationwas due to the pure productivity effect rather than the sectoral realloca-tions. In fact the pure productivity effect was almost exactly equal to theoverall productivity acceleration for the income-side measure. For theother two concepts of output, the productivity acceleration from the pureproductivity effect was about 0.2 percentage point larger than the total.This implies that the productivity improvement arose largely because
226 Brookings Papers on Economic Activity, 2:2002
Table 4. Decomposition of Labor Productivity Growth for Alternative Measures ofAggregate Output, 1978–2000a
Percent a year
Change, Change, 1977–89 to 1977–89 to
Measure 1977–89 1989–95 1995–2000 1989–95 1995–2000
GDI 1.21 0.96 2.24 –0.25 1.04Pure productivity effectb 1.27 0.73 2.39 –0.54 1.13Baumol effectc 0.18 –0.01 0.04 –0.18 –0.14Denison effectd –0.18 0.32 –0.12 0.50 0.06Residuale –0.05 –0.08 –0.07 –0.03 –0.02
Nonfarm business sector 1.26 1.26 2.87 0.00 1.61Pure productivity effect 1.29 1.45 3.09 0.16 1.80Baumol effect 0.15 –0.01 0.03 –0.16 –0.12Denison effect and –0.18 –0.19 –0.25 –0.01 –0.07
residual
Well-measured output 2.00 1.93 3.29 –0.07 1.29Pure productivity effect 2.17 2.20 3.66 0.03 1.49Baumol effect 0.15 0.00 –0.04 –0.14 –0.19Denison effect and –0.31 –0.27 –0.33 0.04 –0.01
residual
Source: Author’s calculations.a. Growth in output per hour worked; data are annual averages. Details may not sum to totals because of rounding.b. Weighted average of sectoral productivity growth using fixed nominal output weights for 1996; corresponds to first right-
hand term in equation 2.c. Difference between the variable productivity effect and the pure productivity effect; corresponds to second right-hand term
in equation 2.d. Impact of reallocation among industries that have different shares of labor incomes; corresponds to third right-hand term in
equation 2.e. Interaction terms and second-order effects.
1017-04 BPEA/Nordhaus 12/30/02 15:01 Page 226

weighted-average productivity growth in the underlying industriesincreased, not because of sectoral shifts or other factors.
The basic conclusion regarding the decomposition of productivitygrowth is that pure productivity growth in the most recent period hasbeen even more rapid than total productivity growth. This is most clearlyseen for overall output, where the conventional product-side estimates ofproductivity growth (table 3) are well below pure productivity growth(table 4) because of the statistical discrepancy as well as modest Baumoland Denison effects. The understatement is even larger for the nonfarmbusiness sector and for the well-measured sector.
We can also use these results to determine the gravity of the Baumoleffect. In a series of pioneering works, William Baumol analyzed theimpact of differential productivity growth on different sectors and institu-
William D. Nordhaus 227
Figure 2. Components of Productivity Growth in Well-Measured Output, 1977–2000
Sources: Author’s calculations using data from Bureau of Economic Analysis.
0
1
2
3
1977–89 1989–95 1995–2000
Total
Pure productivity effect
Baumol effect
Denison effect and residual
Percent a year
1017-04 BPEA/Nordhaus 12/30/02 15:01 Page 227

tions such as services, health care, the cities, and the performing arts.13
His basic story is that those sectors whose productivity growth rates arebelow the economy’s average will tend to experience above-average costincreases and a growing share of total spending. The resulting “cost dis-ease” may, according to Baumol, lead to above-average price increases,financial pressures on suppliers, and a reduction in the economy’s overallrate of productivity growth.
Table 4 shows the Baumol effect over the 1977–2000 period. In factthe effect was slightly positive over the period as a whole for all three out-put concepts, indicating that changing sectoral shares added slightly toaggregate productivity. Recall from equation 2 that the Baumol effectcaptures the interaction of changing shares of nominal output and produc-tivity growth. As it turns out, those sectors with rising nominal outputshares have experienced higher than average productivity growth rates(the new economy sectors are a good example). Baumol’s cost disease hasbeen cured, or at least is in remission.
Contribution of the New Economy to the Productivity Rebound
The next question involves using the new data set to ask, What is thecontribution of the new economy to the remarkable resurgence in produc-tivity over the last few years? In this exercise the answer is limited to thedirect contribution of more rapid productivity growth in new economyindustries, or to the production of new economy goods and services. Thisanalysis omits the important question, addressed later in this paper, of theuse of new economy goods and services elsewhere in the economy,through the contribution of capital deepening and of spillover effects fromthe information economy to productivity.
The technique for calculating the impact of the new economy is as fol-lows. For each output concept, output and hours indexes are calculatedwith and without the four new economy sectors. In other words, in calcu-lating the chain indexes, the index with the new economy sectors takes theFisher index including the four industries, whereas the index without thenew economy omits those and rescales the weights and recalculatesFisher indexes so that the output and labor indexes sum to 100 percent ofthe total. This entire procedure is conceptually straightforward primarilybecause I have constructed a consistent set of value-added accounts.
228 Brookings Papers on Economic Activity, 2:2002
13. See the references in note 3.
1017-04 BPEA/Nordhaus 12/30/02 15:01 Page 228

Figure 3 shows the pattern of productivity growth in the four neweconomy sectors. The most impressive acceleration in the late 1990s wasin the electronics sector (SIC 36), which contains microprocessors. Inaddition, industrial machinery (SIC 35), which contains computers,showed impressive gains in the late 1990s. The other two new economysectors had healthy but not spectacular measured productivity gains. Thesoftware sector contains one component (prepackaged software) withrapid price declines, but the other two components (custom and own-account software) do not have hedonic estimates of prices and show mod-est price declines.
Table 5 shows the results for all three major sectors. Focusing first onthe nonfarm business sector, we see that relatively little of the productiv-ity acceleration in that sector in the late 1990s was due to the new econ-omy. Productivity in the nonfarm business output measure that includesthe new economy accelerated by 1.61 percentage points from the 1977–89period to the 1995–2000 period. But only 0.29 percentage point, or one-sixth, was due to acceleration in the new economy sectors. The balance of1.32 percentage points came in old economy sectors. The results areroughly the same for the overall economy. For the well-measured sectors,one-third of the productivity acceleration from the first half to the secondhalf of the 1990s was due to the new economy.
Although the new economy contributed relatively little to the accelera-tion in productivity growth, it nonetheless provided a substantial part oftotal productivity growth. In the last five years of the period, as shown intable 5, the new economy contributed 0.64, 0.78, and 1.16 percentagepoints to the total for GDP, nonfarm business, and well-measured output,respectively.
Figure 4 shows the contribution of the four new economy sectors tooverall GDP productivity. These calculations weight the productivitygrowth rates of each of the four sectors by its share in nominal GDP (fol-lowing the approach of the ideal welfare-theoretic formula). The totalimpact on GDP productivity, shown in the far-right-hand bar in eachgroup, was 0.46 percentage point in the first two subperiods and then roseto 0.72 percentage point for the 1995–2000 period. The largest single con-tributor for the period as a whole was electric and electronic equipment,followed by machinery, except electrical.14
William D. Nordhaus 229
14. The estimates here vary from those in the tables because the weighting procedure isslightly different.
1017-04 BPEA/Nordhaus 12/30/02 15:01 Page 229

Evaluation of the Gordon Hypothesis
Equipped with this new data set, I can now evaluate the Gordonhypothesis. This view holds that most if not all of the productivity accel-eration in the late 1990s was due to higher productivity in the computerindustry. As summarized in The Economist:
Robert Gordon of Northwestern University, one of the country’s top authoritieson the subject, has found that more than 100% of the acceleration in productiv-ity since 1995 happened not across the economy as a whole, nor even across IT[information technology] at large, but in computer manufacturing, barely 1% ofthe economy. Elsewhere, growth in productivity has stalled or fallen.15
Since the first statement of the Gordon hypothesis in 1999, there hasbeen some backtracking. The most recent estimates associated with the
230 Brookings Papers on Economic Activity, 2:2002
15. “How Real Is the New Economy?” The Economist, July 24, 1999. Also see Gordon(2000). Further discussions can be found in Oliner and Sichel (2000). The latest publishedversion is Gordon (2002).
Figure 3. Productivity Growth in Four New Economy Industries, 1980–98
Source: Author’s calculations using Bureau of Economic Analysis data.
5
10
15
1985 1990 1995
Percent a year
Electronic and other electric equipment
Software
Industrial machinery and equipment
Telephone and telegraph
1017-04 BPEA/Nordhaus 12/30/02 15:01 Page 230

Gordon hypothesis (presented by Gordon in his comment on this paper)find that, outside of durable manufacturing, private business experiencedan acceleration of labor productivity growth of only 0.22 percentage pointfor the period 1995:4 to 2000:4 relative to the period 1972:2 to 1995:4;this estimate has drifted upward since Gordon’s early calculations.
The results developed here definitely reject the Gordon hypothesisover the period studied. For all three broad output concepts (GDP, thenonfarm business sector, and well-measured output), labor productivitygrowth in the economy excluding the new economy showed a markedupturn over 1995–2000 relative to the 1977–95 period (table 5). Theacceleration in non–new economy productivity growth was 0.85 percent-age point for the overall economy (measured from the income side),1.33 percentage points for nonfarm business output, and 0.80 percentagepoint for well-measured output (these can be calculated from the data intable 5). The new economy contributed directly about one-quarter of thetotal acceleration in labor productivity growth for total output, one-sixthfor nonfarm business, and two-fifths for well-measured output.
A final decomposition of productivity growth examines how mucheach industry contributes to the total. Table 6 does this for the nonfarm
William D. Nordhaus 231
Table 5. Productivity Growth with and without the New Economy for AlternativeMeasures of Aggregate Output, 1978–2000a
Percent a year
Change, Change, 1977–89 to 1977–89 to
Measure 1977–89 1989–95 1995–2000 1989–95 1995–2000
GDIWith new economy 1.21 0.96 2.24 –0.25 1.04Without new economy 0.84 0.56 1.60 –0.28 0.76Difference 0.37 0.39 0.64 0.03 0.27
Nonfarm business sectorWith new economy 1.26 1.26 2.87 0.00 1.61Without new economy 0.76 0.73 2.08 –0.03 1.32Difference 0.50 0.53 0.78 0.03 0.29
Well–measured outputWith new economy 2.00 1.93 3.29 –0.07 1.29Without new economy 1.38 1.21 2.13 –0.17 0.74Difference 0.61 0.72 1.16 0.10 0.55
Source: Author’s calculations.a. Growth in output per hour worked; data are annual averages. Details may not sum to totals because of rounding.
1017-04 BPEA/Nordhaus 12/30/02 15:01 Page 231

business sector. For this calculation I measured productivity growth as thechain-weighted average of sectoral productivity growth rates; this is equalto the pure productivity effect plus the Baumol effect (see the discussionabove). This measure is the closest to the welfare-theoretical ideal of thedifferent indexes. The advantage of using this measure is that the sum ofthe individual-sector figures equals the total.
Not surprisingly, three of the four new economy sectors are among thetop ten contributors to the productivity upturn. Some of the other sectorsare more surprising. For example, retail and wholesale trade have eachmade a major contribution to overall productivity growth in the latestperiod. Indeed, the contribution of each of these two sectors to the accel-eration of productivity for the 1995–2000 period was larger than that ofany of the new economy sectors. The data in these sectors are somewhatof a mystery, however, which emphasizes the importance of closer atten-
232 Brookings Papers on Economic Activity, 2:2002
Figure 4. Contribution of New Economy Industries to Productivity Growth for theTotal Economy, 1977–2000a
Source: Bureau of Economic Analysis.a. Total economy is measured by income-side GDP. Estimates use nominal output weights.
0.1
0.2
0.3
0.4
0.5
0.6
0.7
1977–89 1989–95 1995–2000
Industrial machinery and equipment
Electronic and other electric equipment
Telephone and telegraph
Software
Total
Percentage points
1017-04 BPEA/Nordhaus 12/30/02 15:01 Page 232

tion to measuring their output. At the bottom of the league, meanwhile,are food manufacturing, petroleum and coal, and nonfarm housing ser-vices. These sectors generally show a negative contribution because ofvery good productivity performance in the first subperiod followed by apoor performance in recent years.16 This is a reminder that the underlyingindustrial data are noisy and should be viewed as at best an approximationto the true performance.
Productivity growth in manufacturing has been an important contribu-tor to growth in aggregate labor productivity. Manufacturing productivity
William D. Nordhaus 233
16. These results are on the whole similar to the results of Jorgenson and Stiroh(2000a), who use an accounting framework that includes all inputs and explains the move-ment of gross output.
Table 6. Contribution of Selected Industries to Productivity Acceleration in theNonfarm Business Economya
Percent a year except where stated otherwise
Contribution toproductivityacceleration
Industry 1975–89 1995–2000 (percentage points)
LeadersRetail trade 1.30 5.25 0.46Security and commodity brokers 2.80 18.15 0.32Wholesale trade 2.80 5.86 0.27Electronic and other electric 8.49 17.87 0.23
equipmentOther real estate 1.01 5.64 0.18Other services –1.12 1.40 0.08Electric, gas, and sanitary services –0.08 2.59 0.08Industrial machinery and 7.17 13.07 0.08
equipmentSoftware 2.01 4.36 0.08Chemicals and allied products 2.56 4.87 0.06
LaggardsNonfarm housing services 2.52 –0.62 –0.06Petroleum and coal products 8.43 1.32 –0.07Other services 0.86 –1.59 –0.09Food and kindred products 3.85 –2.94 –0.15
All other n.a. n.a. 0.22
All industries 1.26 2.87 1.61
Source: Bureau of Economic Analysis data.a. New economy sectors are shown in boldface.
Productivity growth
1017-04 BPEA/Nordhaus 12/30/02 15:01 Page 233

growth clocked 4.1 percent a year in the 1977–95 period according to theincome-side data, and that rate moved up to 5.5 percent a year in the1995–2000 period. Figure 5 shows the major contributors by industry inmanufacturing. The importance of industrial machinery (notably comput-ers) and electronic machinery (notably semiconductors) is striking: thesetwo industries contributed 4.5 percentage points of the 5.5-percentage-point total growth.17 Manufacturing productivity growth outside of thenew economy was positive if modest.
On the other hand, the totality of non–new economy manufacturingindustries showed a marked productivity deceleration in the latestperiod, from 2.00 to 0.97 percent a year between 1977–89 and1995–2000. (This result was shown by Gordon using a different dataset.) Of this 1.03-percentage-point slowdown, food processing is respon-sible for 0.81 percentage point, which raises questions about either thedata or the performance of that industry. If the two major new economyindustries and the oldest old economy industry (food) are removed fromthe total, the latest data for manufacturing do not appear to show a majorchange in productivity growth. It seems reasonable to conclude, as hasbeen argued by Gordon, that up through 2000 the acceleration in manu-facturing productivity was limited to the two major new economy sectorsled by computers and semiconductors.
Qualifications
The present study is but one of many that have analyzed recent produc-tivity trends and the role of the new economy. Before concluding, it willbe useful to highlight some of the qualifications that attach to the results.
To begin with some technical details, the data for this study pertainexclusively to gross product (that is, value added), which is derived fromthe industry accounts and primarily based on income rather than productdata. Moreover, in these data the nominal output data are directly esti-mated from income data, whereas the real output data are derived fromgross output and intermediate inputs by double deflation.18 In the aggre-
234 Brookings Papers on Economic Activity, 2:2002
17. Within SIC 35 and 36, appendix table A2 shows the major data on shipments andthe price of shipments. The industries with sharply falling price indexes have hedonictreatment.
18. Yuskavage (2000, 2002).
1017-04 BPEA/Nordhaus 12/30/02 15:01 Page 234

gate, the income-side industry data differ from the conventional product-side data by the statistical discrepancy; this discrepancy has moved insuch a way that nominal GDI grew 0.33 percentage point a year morerapidly than nominal GDP over the 1995–2000 period. Additionally,because of technical issues involving aggregation and differences indeflators, estimates of chained real GDP based on industry real grossproduct numbers differ somewhat from product-side real GDP even aftercorrecting for the statistical discrepancy. Finally, the industry accounts
William D. Nordhaus 235
Figure 5. Contribution to Manufacturing Productivity Growth by Industry,1995–2000a
Source: Bureau of Economic Analysis.a. Each bar measures productivity growth in one industry times the share of that industry in total manufacturing output. Shaded
bars indicate new economy industries.
0.0 0.5 1.0 1.5 2.0 2.5
Lumber and wood products
Percentage points
Furniture and fixtures
Stone, clay, and glass products
Primary metals
Fabricated metal
Industrial machinery
Electronic and electrical
Motor vehicles
Other transport
Instruments
Miscellaneous manufacturing
Food and kindred products
Tobacco products
Textile mill products
Apparel and other textile products
Paper and allied products
Printing and publishing
Chemicals and allied products
Petroleum and coal
Rubber and miscellaneous plastics
Leather and leather products
1017-04 BPEA/Nordhaus 12/30/02 15:01 Page 235

are on a different revision cycle from the product accounts, and it seemslikely that some of the downward product account revisions in mid-2002will also occur in the industry accounts revision.
From an operational point of view, the major implication of usingincome-side industry data is that real GDI calculated from these data isestimated to have grown faster than the usual product-side estimates.Over the 1995–2000 period, real income-side GDI had an average annualgrowth rate of 4.46 percent, versus 3.95 percent for real GDP, for anaverage difference of 0.51 percentage point. Since this difference is asubstantial part of the 1.04-percentage-point acceleration in GDI produc-tivity, these numbers are subject to substantial uncertainty and potentialrevision.
A second qualification is that the productivity estimates presented hererefer to gross product (value added) rather than total output—the differ-ence being purchased goods and services. In principle, there should be nodifference between the two approaches if the aggregation technique andthe source data are perfect, since it makes no difference whether theweighted sum of inputs is subtracted from the left side or the right side ofthe total factor input productivity equation. Subtle differences can creepin, however, if purchased goods and services are not measured accuratelyor if the index numbers suffer from aggregation nonneutrality,19 both ofwhich apply to the data and to the Fisher indexes. I am unaware of anystudies indicating which approach is less prone to aggregation nonneutral-ity or which approach is more accurate given the inaccuracies of thesource data on purchased goods and services.
A third and more important qualification concerns omitting the contri-bution of capital services to the productivity upturn. This omission is par-ticularly important given the substantial increase in measured capitalservices in recent years. Studies by Stephen Oliner and Daniel Sichel,Dale Jorgenson, and Kevin Stiroh, among others, suggest that most if notall of the acceleration in labor productivity in the late 1990s was due tocapital deepening.20
Although estimating total factor productivity is a central technique forunderstanding trends in productivity, labor productivity also has a useful,
236 Brookings Papers on Economic Activity, 2:2002
19. An index is aggregation neutral if F(x1, x2, x3, x4) = F[F(x1, x2), F(x3, x4)] for all ele-mental series x1, x2, … , where F is an aggregator such as the Fisher or Tornqvist index.
20. Oliner and Sichel (2000); Jorgenson and Stiroh (2000a, 2000b); Jorgenson (2001);Stiroh (forthcoming).
1017-04 BPEA/Nordhaus 12/30/02 15:01 Page 236

independent role to play. To begin with, growth in labor productivity is acentral policy concern given its strong linkage to the growth of realwages. Moreover, from a technical point of view, it should be recalledthat total factor productivity depends upon estimating rather than measur-ing the inputs of capital services. Estimates of capital services dependupon several important and often-criticized assumptions. The majorassumptions implicit in this model include such things as the existence ofperfect rental markets for capital, no difference between ex ante and expost substitutability, no break-in or adjustment costs or learning costs,perfect competition, factor rewards proportional to marginal products,and so forth.
These assumptions are likely to be stretched particularly in periods,such as the late 1990s, when new technologies with very high rates ofdepreciation dominate the data on the growth of capital services. Fur-thermore, measures of capital services generally use a cost-of-capitalformula based on interest rates and therefore do not reflect the extraordi-nary equity valuations of the late 1990s; the effect of this is to overesti-mate the user cost and implicit marginal cost of capital, particularly inhigh-technology industries. The data for this period are especially prob-lematical given that the high-technology stock market bubble probablyled to overinvestment in several sectors, telecommunications in particu-lar, and that some of the investments (such as the ominous sounding“dark fiber”) turned out to be useless and have zero productivity.
A final shortcoming is that the production function includes only thereturn to fixed capital as a nonlabor market input. It excludes the return toother assets such as land, inventories, intangible assets (such as patentsand trademarks, brand value, and marketing), and subsoil assets such asoil and gas reserves. Given the list of unrealistic assumptions that under-lie the total factor productivity model, it is useful to examine techniques,such as estimation of labor productivity, that do not depend on the multi-tude of assumptions that underpin that model.
One can illustrate the issues involved in moving from labor productiv-ity to total factor productivity by estimating the extent to which capitaldeepening was associated with the recent changes in labor productivity.For this question I looked at the relationship between output growth andthe growth of labor and capital inputs over the 1977–2000 period in thosetwenty-nine industries included in well-measured output for which theBEA prepares net capital stock data. Pooling the data with industry and
William D. Nordhaus 237
1017-04 BPEA/Nordhaus 12/30/02 15:01 Page 237

time effects along with cross-sectional equation weighting yields the fol-lowing estimated equation:
R2 = 0.515; n = 667,
where g(Xi,t ), g(Li,t ), and g(Ki,t ) are growth of gross output, growth ofhours worked, and growth of the net capital stock, respectively, for indus-try i in year t.
If the assumptions underlying the calculation of total factor productiv-ity were correct, the coefficients on g(Li,t ) and g(Ki,t ) should correspond tothe factor shares in the different industries. Although the coefficient onlabor is close to the average share of compensation for all industries, thecoefficient on capital is negative. This equation indicates that the acceler-ation in the net capital stock made a small but insignificant negative con-tribution to the growth of gross output in these industries in the sampleperiod. Since the average share of property-type income is around 40 per-cent of total output, the estimated coefficient is around four standarderrors from accepting the null hypothesis that the coefficient equals theincome share of capital; this indicates that, although the coefficient is notwell determined, it is significantly different from the theoretical assump-tions that underpin the calculation of total factor productivity.
An alternative specification defines capital inputs as proportional to thedepreciation of fixed capital plus an opportunity cost of fixed capital; thisspecification, however, did not improve the estimates on capital growth.The coefficient on capital in this specification was very close to zero, witha standard error of the coefficient of 0.048, again significantly differentfrom the theoretical coefficient of around 0.4. Other specifications did notcome to the rescue of the standard model.
These results should not be taken too seriously, as they involve a highlyoversimplified specification of the link between capital and productivity.Moreover, they do not affect the accounting relationship involved in totalfactor productivity indexes that depend basically on some identities and ahost of underlying assumptions. But they should caution practitioners thatthe empirical relationship between the capital stock or capital services andproductivity is at best weak and at worst unrelated to the model underlyingtypical total factor productivity calculations.
g X g L g Ki t i t i t( ) . ( ) – . ( )( . ) ( . )
, , ,= +0 605 0 03080 049 0 085
industry effects + year effects
238 Brookings Papers on Economic Activity, 2:2002
1017-04 BPEA/Nordhaus 12/30/02 15:01 Page 238
A final qualification concerns the role of business cycles in productiv-ity growth. This issue is particularly relevant given the strong economicexpansion during the 1995–2000 period. Annual growth of real GDPaveraged 4.0 percent in that period, compared with 2.9 percent in the1977–95 period. The reason for concern is that productivity growth hastypically been procyclical.
I have not undertaken a systematic assessment of the cyclical effectsfor the industry data. Doing this would require confronting the potentiallyserious estimation bias due to measurement errors in output at the indus-try level. For example, because of data peculiarities involving indirecttaxes, the gross output of the tobacco industry fell by 63 percent (in loga-rithmic terms) in 1999. Productivity in that year also fell sharply, by53 percent, primarily because of the strange output numbers. Not surpris-ingly, therefore, there is a strong positive association of output and pro-ductivity in tobacco manufacturing.
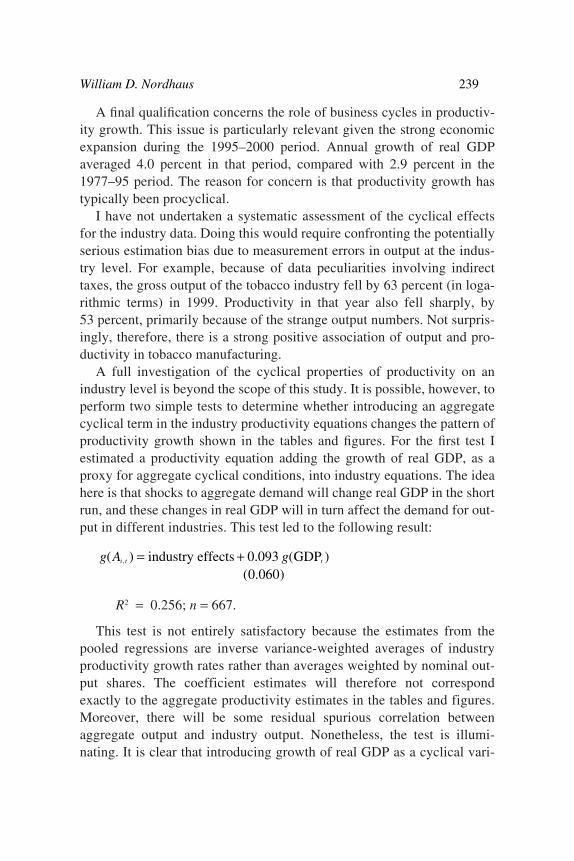
A full investigation of the cyclical properties of productivity on anindustry level is beyond the scope of this study. It is possible, however, toperform two simple tests to determine whether introducing an aggregatecyclical term in the industry productivity equations changes the pattern ofproductivity growth shown in the tables and figures. For the first test Iestimated a productivity equation adding the growth of real GDP, as aproxy for aggregate cyclical conditions, into industry equations. The ideahere is that shocks to aggregate demand will change real GDP in the shortrun, and these changes in real GDP will in turn affect the demand for out-put in different industries. This test led to the following result:
R2 = 0.256; n = 667.
This test is not entirely satisfactory because the estimates from thepooled regressions are inverse variance-weighted averages of industryproductivity growth rates rather than averages weighted by nominal out-put shares. The coefficient estimates will therefore not correspondexactly to the aggregate productivity estimates in the tables and figures.Moreover, there will be some residual spurious correlation betweenaggregate output and industry output. Nonetheless, the test is illumi-nating. It is clear that introducing growth of real GDP as a cyclical vari-
g A gi t t( ) . ( )( . )
, = +industry effects GDP0 0930 060
William D. Nordhaus 239
1017-04 BPEA/Nordhaus 12/30/02 15:01 Page 239

able makes very little difference to average productivity growth. Thecoefficient on aggregate output indicates that a 1 percent increase inaggregate output would increase productivity in the average industry byonly 0.09 percent. Real GDP grew at a rate of 0.80 percentage point a yearfaster in 1995–2000 than the average for the sample period. This indicatesthat the rapid growth in the 1995–2000 period raised average productivitygrowth by 0.072 percentage point; this compares with an acceleration of0.44 percentage point in GDP productivity and 0.92 percentage point inGDI productivity.
An alternative approach is to use the overall unemployment rate as thecyclical variable; this approach has the advantage of completely removingany spurious measurement error that infects both aggregate and industryoutput. Additionally, it is particularly illuminating to the extent thatmovements in the unemployment rate are a good index of movements inaggregate demand. This equation yields
Using the unemployment rate as a cyclical variable indicates thatindustrial productivity is anticyclical. Using an Okun’s Law coefficient of2, this equation indicates that growth in aggregate output by 1 percentwould decrease productivity in the average industry by 0.1 percent.
In summary, although these tests of the cyclical impact are hardlydefinitive, they do suggest that, on average, cyclical forces played but asmall role in the productivity upsurge in the 1995–2000 period. However,more work needs to be done at the industry level to test the role of cycli-cal conditions.
Conclusion
This paper has considered issues in the recent behavior of productivityand productivity growth. The major points can be summarized as follows.
First, the paper introduces a new approach to measuring industrial pro-ductivity. It develops an income-side database on output, hours worked,and labor productivity, relying on data published by the BEA. The data
g A U
R n
i t t( )( . )
. ; .
, =
= =
industry effects + 0.218 0 084
0 253 6672
240 Brookings Papers on Economic Activity, 2:2002
1017-04 BPEA/Nordhaus 12/30/02 15:01 Page 240

are internally consistent and add up to income-side GDP. The advantageof the unified income-side measures is that they present a consistent set ofindustrial accounts. The disadvantage is that they are available only forthe period 1977–2000.
Second, the paper presents a set of labor productivity measures for fourdifferent definitions of output:
—GDP from the income side (GDI)—The BLS’s nonfarm business sector output from the income side—A new measure called well-measured output, which includes only
those sectors for which output is relatively well measured—The “new economy.”Third, there has definitely been a rebound in productivity growth since
1995. The rebound is observed in all three broad aggregates developed forthis study. The labor productivity acceleration in the last five years of theperiod (1995–2000) relative to the 1977–95 period was 1.12 percentagepoints for income-side GDP, 1.61 percentage points for the nonfarm busi-ness sector, and 1.31 percentage points for well-measured output.
Fourth, the paper explores a new technique for decomposing changesin labor productivity growth by source. This decomposition identifies apure productivity effect (which is a fixed-weighted average of the produc-tivity growth rates of different industries), a Baumol effect (which cap-tures the effect of changing shares of nominal output on aggregateproductivity), and a Denison effect (which captures the interactionbetween the differences in productivity growth and the changing hoursshares of different industries over time). Total productivity growth is thesum of these three effects.
Fifth, the estimates show that the pure productivity effect in recentyears has exceeded total productivity growth. For example, in the non-farm business sector for the period 1995–2000, total labor productivitygrowth was 2.87 percent a year, and the pure productivity effect was3.09 percent a year. The difference was due to a mixture of the Baumoland Denison effects. Moreover, in analyses using the data for all indus-tries, the Baumol effect has been very close to zero over this period, indi-cating that composition shifts in output have had little effect on aggregateproductivity growth over the last quarter century.
Sixth, a key question is the contribution of the new economy to theproductivity rebound. For the purpose of this study I have defined thenew economy as machinery, electric equipment, telephone and tele-
William D. Nordhaus 241
1017-04 BPEA/Nordhaus 12/30/02 15:01 Page 241

graph, and software. These sectors grew from 3 percent of real GDP in1977 to 11 percent in 2000. Productivity growth in the new economy sec-tors has made a significant contribution to economy-wide productivitygrowth. In the nonfarm business sector over the last five years, labor pro-ductivity growth excluding the new economy sectors was 2.08 percent ayear compared with 2.87 percent a year including the new economy.
Seventh, the major new economy contributors to the productivityrebound have been nonelectric and electric machinery, the major sub-sectors of which are computers and semiconductors. These two sectors,which accounted for less than 4 percent of nominal GDP, contributed0.56 percentage point to income-side GDP productivity growth of2.24 percent a year in the 1995–2000 period.
Finally, to what extent has there been an acceleration of productivitygrowth outside the new economy? According to all three output measures,there has been a substantial upturn in non–new economy productivitygrowth. After the new economy sectors are stripped out, the productivityacceleration from 1977 to 1989 was 0.76 percentage point for income-side GDP, 1.32 percentage points for business output, and 0.74 percent-age point for well-measured output. It is clear that the productivityrebound is not narrowly focused in a few new economy sectors.
242 Brookings Papers on Economic Activity, 2:2002
1017-04 BPEA/Nordhaus 12/30/02 15:01 Page 242

William D. Nordhaus 243
Table A1. Value Added by Information Technology Industries, 1995 and 1998Millions of current dollars except where stated otherwise
Industry SIC code 1995 1998
HardwareComputers and equipment 3571,2,5,7 32,931.2 45,081.8Computers and equipment, wholesale sales 5045 (part) 50,756.0 74,173.3Computers and equipment, retail sales 5734 (part) 2,513.6 3,441.3Calculating and office machines, n.e.c.a 3578–9 3,036.2 3,478.1Electron tubes 3671 1,472.9 1,716.8Printed circuit boards 3672 5,718.5 7,602.8Semiconductors 3674 51,272.0 70,092.0Passive electronic components 3675–9 19,097.6 29,801.9Industrial instruments for measurement 3823 4,998.5 5,546.9Instruments for measuring electricity 3825 7,512.3 8,399.0Laboratory analytical instruments 3826 4,270.6 4,780.9
Total 183,579.6 254,115.0
Software and servicesComputer programming services 7371 26,178.3 n.a.b
Prepackaged software 7372 19,971.7 n.a.Prepackaged software, wholesale sales 5045 (part) 2,564.0 n.a.Prepackaged software, retail sales 5734 (part) 126.1 n.a.Computer integrated systems design 7373 15,025.1 n.a.Computer processing and data preparation 7374 17,924.5 n.a.Information retrieval services 7375 3,768.5 n.a.Computer services management 7376 2,135.2 n.a.Computer rental and leasing 7377 1,329.0 n.a.Computer maintenance and repair 7378 5,023.7 n.a.Computer-related services, n.e.c. 7379 8,549.1 n.a.
Total 7371–9 102,595.2 151,999.3
Communications hardware Household audio and video equipment 3651 2,343.0 2,767.6Telephone and telegraph equipment 3661 14,925.2 17,373.7Radio and television and communications 3663 19,862.0 27,854.3
equipmentMagnetic and optical recording media 3695 2,787.8 3,293.0
Total 39,918.0 51,288.0(continued)
A P P E N D I X A
Supplemental Tables
1017-04 BPEA/Nordhaus 12/30/02 15:01 Page 243

244 Brookings Papers on Economic Activity, 2:2002
Table A2. Shipments by Selected New Economy Industries and Changes in OutputPrices, 1987–98Units as indicated
Change in price Shipments, 1998 index, 1987–98a
Industry SIC code (millions of dollars) (percent a year)
SIC 35Electronic computers 3571 74,720 –17.9Computer storage devices 3572 15,734 –7.2Computer terminals 3575 1,180 –10.7Computer peripheral equipment, 3577 31,100 –12.0
n.e.c.Calculating and accounting 3578 2,308 –1.5
machinesTotal for included industries 125,042 –14.5Total for SIC 35 442,315 –2.3
SIC 36Household audio and video 3651 9,882 –1.0
equipmentPhonograph records and audio 3652 2,504 –0.1Telephone and telegraph apparatus 3661 40,080 –3.4Printed circuit boards 3672 12,916 –2.0Semiconductors 3674 86,189 –20.1Electronic components, n.e.c. 3679 39,790 –1.5Magnetic and optical recording 3695 5,143 –1.0
mediaTotal for included industries 196,504 –7.4Total for SIC 36 375,968 –4.2
Source: Bureau of Economic Analysis at www.bea.doc.gov/bea/dn2/gpo.htm.a. Price indexes for totals are “mongrels” rather than true chain indexes, and they double-count because they are based on
gross output rather than value-added weights.
Table A1. Value Added by Information Technology Industries, 1995 and 1998(continued)Millions of current dollars except where stated otherwise
Industry SIC code 1995 1998
Communications servicesTelephone and telegraph communications 481,22,99 144,100.0 163,674.4Radio broadcasting 4832 6,149.6 8,695.8Television broadcasting 4833 17,102.7 20,975.6Cable and other pay television services 4841 24,247.7 31,838.3
Total 191,600.0 225,184.0
All information technologies 517,692.8 225,184.0As a share of the economy (percent) 7.1 8.1
Source: U.S. Department of Commerce (2000).a. Not elsewhere classified.b. Not available.
1017-04 BPEA/Nordhaus 12/30/02 15:01 Page 244

Comments andDiscussion
Robert J. Gordon: Economists were slow to recognize the post-1995productivity growth revival in its early stages. Those of us who partici-pated in panels on productivity issues at the January 1998 meetings of theAmerican Economic Association recall no such recognition. Rather therewas a singular focus on explaining the long, dismal period of slow pro-ductivity growth dating from 1972, especially in the context of RobertSolow’s much-cited quip that “we can see the computer age everywhereexcept in the productivity statistics.” From today’s perspective it is under-standable that several years had to elapse before the post-1995 revivalcould be distinguished from previous short-lived upward blips in produc-tivity growth such as occurred in 1991–92.
Since 1999, however, the analysis of the post-1995 revival hasbecome a growth industry, featuring an outpouring of analyses thatattempt to quantify the sources of the revival, and especially the contri-bution of the “new economy,” that is, of investment in information tech-nology (IT). The paper by William Nordhaus joins a substantial literaturethat assesses the role of the new economy in the revival; it also providesoriginal analyses of other aspects of the revival that have previously beenignored. I will begin by discussing Nordhaus’s findings on these otherissues and then turn to his controversial treatment of the new economy’scontribution. Along the way I will try to reconcile Nordhaus’s finding ofa small new economy contribution with contrasting results in research bySteven Oliner and Daniel Sichel that the new economy overexplains therevival. I will conclude with the suggestion that Oliner and Sichel mayhave exaggerated the role of IT investment in the revival, thus leaving
245
1017-04 BPEA/Nordhaus 12/30/02 15:01 Page 245

open some support for Nordhaus’s contrary conclusion, through anotherline of reasoning.
Nordhaus’s paper is based on what he calls a “new approach to mea-suring industrial productivity.” This measures productivity as the ratio ofreal value added by industry divided by hours of labor input, with both thenumerator and denominator taken from published tables in the NationalIncome and Product Accounts (NIPA). As Nordhaus emphasizes in hisconcluding section, this industrial decomposition of productivity growthin the NIPA provides a measure of the income side of GDP, which issmaller than the product side of GDP by the amount of the NIPA statisti-cal discrepancy. Since the statistical discrepancy shifted from 0.4 percentof GDP in 1995 to –1.3 percent in 2000 (that is, the income measure wassmaller than the product measure in 1995 and larger in 2000), the exclu-sive use of income-side measures in Nordhaus’s paper adds 0.34 percent-age point a year to the annual growth rate of productivity during the1995–2000 interval compared with studies based on product-side data.
Three caveats apply to his approach. First, it differs from other analy-ses, for example those in the 2000 and 2001 Economic Report of the Pres-ident, which regard an average of the product-side and the income-sidemeasures as superior to exclusive reliance on one or the other; to use onlythe income-side measure assumes knowledge about the sources of the sta-tistical discrepancy that does not exist. Second, this approach is not“new.” Use of NIPA data to analyze productivity behavior by industrygoes back at least three decades to Nordhaus’s own pioneering paper onthis topic,1 if not before, and the same data have been compiled in thesame way in several recent papers.2 Third, Nordhaus’s database is limitedto output and hours and contains no information on capital input by indus-try; so, unlike the recent paper by Jack Triplett and Barry Bosworth,3
Nordhaus has nothing to say about the behavior of total factor productiv-ity and particularly about the role of IT capital deepening as a source ofthe productivity growth revival across industries.
None of these caveats apply to Nordhaus’s original and ingeniousdecomposition of changes in productivity growth into a pure productivityeffect, a Baumol effect, and a Denison effect. This decomposition is
246 Brookings Papers on Economic Activity, 2:2002
1. Nordhaus (1972).2. Including Jorgenson and Stiroh (2000a), Gordon (2001), and Triplett and Bosworth
(2002).3. Triplett and Bosworth (2002).
1017-04 BPEA/Nordhaus 12/30/02 15:01 Page 246

closely related to the pioneering analysis in his 1972 paper, differing onlyin that the recent conversion of the NIPA from a fixed base year for defla-tion to a chain-weighting methodology alters the details of the earlier1972 formulas. The new conclusion, that “composition shifts in outputhave had little effect on aggregate productivity over the last quarter cen-tury,” differs from Nordhaus’s 1972 conclusion that the productivitygrowth slowdown of the late 1960s and early 1970s was primarily due toa shift in the composition of output to industries with low levels of pro-ductivity. The decomposition analysis yields a pure post-1995 productiv-ity acceleration (compared with 1977–95) that is higher than theacceleration in the raw productivity data by a mere 0.14 percentage pointa year, as shown in table 4 of the paper.
Another novel contribution in the paper is the attention to ZviGriliches’s distinction between poorly measured and well-measured out-put.4 Although one can quibble with how Nordhaus allocates industriesacross the boundary of good measurement, his analysis does represent asignificant advance over Griliches’s initial effort.5 The post-1995 revivalin the well-measured sectors (compared, as before, with 1977–95) is1.31 percentage points compared with 1.61 percentage points in the totalnonfarm business sector, indicating that a disproportionate share of therevival was contributed by the poorly measured sectors. The decomposi-tion analysis yields a pure productivity acceleration for the well-measuredsectors that is 0.17 percentage point higher than in the raw data, a slightlylarger adjustment than for the total nonfarm business sector.
This brings us to the core of the paper and its controversial finding thatthe new economy was relatively unimportant as a source of the post-1995productivity revival; that conclusion stands in diametric opposition to therecent findings of Oliner and Sichel that new economy capital over-explains the revival. Nordhaus’s baseline result is found in his table 5. Ifone averages the economy’s performance in the two pre-1995 periods, thepost-1995 productivity growth acceleration was 1.61 percentage points
William D. Nordhaus 247
4. Griliches (1994).5. Nordhaus classifies both retail and wholesale trade as well measured, but Gordon
(2001) shows that there is substantial ambiguity in the NIPA data on output growth in thesetwo sectors, due to an implausible discrepancy between the behavior of the value-addeddata used by Nordhaus and the gross output data (including intermediate inputs) also avail-able in the NIPA. The value-added data portray a post-1995 productivity revival that ismuch stronger in retail and wholesale trade, and much weaker in manufacturing, than thatportrayed by the gross output data.
1017-04 BPEA/Nordhaus 12/30/02 15:01 Page 247

for the nonfarm business sector and 1.33 percentage points when the neweconomy sectors are stripped out, for a net new economy contribution ofa mere 0.28 percentage point, or only 17 percent of the total revival.When one makes the same calculation for the well-measured sectors intable 5, the new economy’s contribution jumps to 38 percent (a revival of1.31 percentage points for all well-measured sectors and only 0.81 per-centage point excluding the new economy industries). This larger contri-bution is not surprising, since the new economy’s contribution occursentirely within the well-measured sector and contributes nothing to themore-than-proportionate revival in the poorly measured sector. Overall,then, Nordhaus concludes that the new economy has been overhyped as asource of the revival and that its true sources lie elsewhere, but whereexactly remains entirely unexplained.
Why does Nordhaus’s baseline finding, that the new economy sectorscontributed only 17 percent of the revival, differ so much from otherresearch? Table 1 in Daniel Sichel’s comment on the paper takes us partof the way toward an answer, showing that much of the revival that Nord-haus attributes to non–new economy causes is due to capital deepening,that is, accelerating growth after 1995 in the ratio of IT capital to labor.Recall that Nordhaus has no data on capital and thus no way of providinga complete analysis of the contribution of the new economy. It is desirableto use Sichel’s table to provide a comparison of the 1995–2000 periodwith the full 1977–95 interval, and this yields a growth acceleration of1.53 percentage points: a contribution from IT production of 0.47 per-centage point, a contribution from IT capital deepening of 0.50 percent-age point, and an unexplained residual of 0.56 percentage point.Nordhaus’s new economy contribution of 17 percent contrasts sharplywith the Oliner-Sichel IT contribution of 63 percent.
But the contrast between Nordhaus’s core finding and the most recentresearch of Oliner and Sichel is much starker than is apparent fromSichel’s table, because Sichel has made three changes that all favor Nord-haus’s conclusion. First, Sichel has used income-side data rather than theproduct-side data that formed the basis of the previous Oliner-Sichelresearch. Second, he ends the post-1995 period in 2000 rather than in2001, the final year of the Oliner-Sichel study that he cites. Third, he baseshis pre-1995 comparison on 1977–95 data, to match Nordhaus’s data,rather than on 1973–95 as in the Oliner-Sichel research. When product-
248 Brookings Papers on Economic Activity, 2:2002
1017-04 BPEA/Nordhaus 12/30/02 15:01 Page 248

side data are used and the terminal year is 2001, Oliner and Sichel obtain acontribution from IT investment of 115 percent, not 63 percent.
It may help readers of both Nordhaus’s paper and Sichel’s comment ifI provide here a concordance table that largely reconciles their results. Allnumbers represent percentage points of growth acceleration from1973–95 or 1977–95 to 1995–2000 or 1995–2001. First I “peel theonion,” showing how Nordhaus’s large estimate of the revival is influ-enced by the choice of GDP concept, by revisions to the data, and by timeintervals. Then I show how the new economy’s contribution also changeswhen Oliner and Sichel’s work is used instead of Nordhaus’s:
Percentage points
Nordhaus nonfarm business productivity, income side 1.61Equivalent data from the product side (1.61 – 0.34) 1.27Effect of August 2002 NIPA revisions on 2000 data 1.20Switch from 2000 to 2001 as terminal year, including 2002 revisions 0.97Switch from 1977–95 to 1973–95 as comparison period 0.84
Thus the contribution of the new economy is no longer based, as in Nord-haus’s paper, on a productivity growth revival of 1.61 percentage points,but rather one of 0.84 percentage point, or little more than half Nord-haus’s figure. The contribution of the new economy to productivitygrowth can be examined in a similar way:
Percentage points
Nordhaus contribution of new economy sectors 0.28Oliner-Sichel contribution of IT production (from Sichel’s table) 0.47Oliner-Sichel contribution of IT including capital deepening 0.97
(from Sichel’s table)Change in comparison to 1973–95 versus 1995–2001 0.98
Clearly, there are numerous contributions to this reconciliation. If onetakes the approach of the 2000 and 2001 Economic Report of the Presi-dent, which is that the average of the income and product sides is a bettermeasure than either alone, the result is to add back 0.17 percentage point(half of 0.34) to the productivity revival, boosting it from 0.84 to 1.01 per-centage points. The Oliner-Sichel IT contribution of 0.98 percentagepoint now explains virtually all of the revival.
This summary of the differences constitutes a mini-critique of theNordhaus paper. First, by relying only on income-side data rather than
William D. Nordhaus 249
1017-04 BPEA/Nordhaus 12/30/02 15:01 Page 249

introducing an adjustment for half of the statistical discrepancy, Nordhausoverstates the productivity growth revival. Second, by relying on industrydata that are currently available only through 2000, Nordhaus ignores thesharp deceleration of productivity growth in 2001 and the implication thathis 1995–2000 results are artificially inflated by a cyclical effect. Third,and similarly, by relying on industry data for 2000 that have not yet beenrevised down to match the overall downward revisions in the NIPAannounced in August 2002, Nordhaus further exaggerates the size of therevival. Fourth, and most important, by limiting his study to labor produc-tivity and failing to take account of capital deepening, he ignores themajor contribution of IT capital.
The difference between the results when 2000 and 2001 are used as ter-minal dates reflects my long-standing argument that productivity growthwas inflated in 1998–2000 by a cyclical effect.6 This concept of “cyclical”is not related to the dating of recessions and expansions but reflects thesluggish response of labor input to changes in output growth, which wasextraordinary and unsustainable in 1998–2000. In another paper I haverecently estimated that fully 0.40 percentage point of the 1995–2000 pro-ductivity acceleration was cyclical and did not represent a true “trend” or“structural” acceleration.7 More recent work using a different techniqueestimates a cyclical effect for the same 1995–2000 period of almostexactly the same amount (0.44 percentage point).8 With either technique,the sharp slowdown in both output and productivity growth between 2000and 2001 eliminates the cyclical effect; the estimated cyclical effect for1995–2001 is close to zero.
Stepping back from the details of the Nordhaus-Oliner-Sichel debate,one may wonder whether the upsurge in productivity growth in 2002, evi-dent in the quarterly Bureau of Labor Statistics releases based on product-side data, shifts the weight of the conclusion toward Nordhaus.9 Growth
250 Brookings Papers on Economic Activity, 2:2002
6. Gordon (2000, 2001).7. Gordon (2002).8. The technique used in Gordon (2000, 2001) to estimate the cyclical effect was devel-
oped in Gordon (1993) and involves carrying out a grid search for the productivity growthtrend that optimizes the fit of an equation relating growth in hours to growth in output. Thealternative results emerge from the straightforward estimation of a Hodrick-Prescott trendto the history of the log-level of nonfarm business productivity over the 1955–2002 period.
9. Nonfarm business productivity growth was 5.0 percent in the four quarters ending in2002:3.
1017-04 BPEA/Nordhaus 12/30/02 15:01 Page 250

of IT capital investment decelerated sharply during this period, while pro-ductivity growth was robust. The performance of productivity growth in2002 would be the basis for optimism if it were not for the false hope cre-ated by similar behavior in the past. If one compares nonfarm businessproductivity growth in the first four quarters of previous recoveries withthat in the subsequent eight quarters, a distinct productivity “bubble”emerges, followed by mediocre growth. The four-quarter annual rate ofchange followed by the eight-quarter change starting in 1975:1 is4.63 percent followed by 0.99 percent, that starting in 1982:3 is 5.19 per-cent followed by 1.58 percent, and that starting in 1991:1 is 4.01 percentfollowed by 1.15 percent. The substantive explanation of this bubblebehavior is that, in the early stages of a recovery, profits are still squeezedand business firms continue to cut labor costs aggressively, but subse-quently the economic expansion leads to renewed hiring. If this happensagain, productivity growth in 2002–04 will be much slower than in thepast four quarters.
The debate between Nordhaus and Oliner-Sichel extends to substan-tive issues beyond numbers and measurement. There are two nagging rea-sons for doubt about the Oliner-Sichel results. First, as shown inNordhaus’s table 6, the most important contribution of any industry to thepost-1995 productivity growth revival was made by retail trade. Was thatreally achieved entirely by the purchase of IT equipment, as the Oliner-Sichel capital deepening results would seem to imply? Second, how doesone explain the failure of the leading nations of Western Europe to enjoya productivity growth revival in the late 1990s, when casual observationsuggests that Europeans are using the same computer hardware and soft-ware as Americans? Why did IT equipment and software emerge as thesole cause of the productivity growth revival in the United States even asproductivity growth was slumping in Europe?
One reason to suspect that the technique of Oliner and Sichel exagger-ates the role of IT capital is that they introduce the IT effect instantly,with no delay. If there is a substantial delay in the real world due to thetime taken to learn how to use the new IT capital and reorganize produc-tion around it, their approach may exaggerate the contribution of IT capi-tal deepening to the 1995–2000 revival. In years like 2001 and 2002,when IT investment has declined, there may be substantial leftover bene-fits from the IT boom of the late 1990s, which may support productivitygrowth even if IT investment remains in a slump.
William D. Nordhaus 251
1017-04 BPEA/Nordhaus 12/30/02 15:01 Page 251

Another qualification relates to the robust productivity revivalrecorded in the retail sector, as documented in Nordhaus’s table 6. Arecent finding of a study of a large set of individual retail establishmentsshows that all of retail productivity growth (not just the revival but theentire measured amount of productivity growth) in the 1990s can beattributed to more-productive new establishments displacing much lessproductive existing establishments.10 The average establishment that con-tinued in business exhibited zero productivity growth, and this despitemassive investment by the retail industry in IT equipment, which presum-ably went to both new and old establishments, including the mom-and-pop stores that have long used bar-code scanning at checkout. In the studyjust cited, recent productivity growth reflects the greater efficiency ofnewly opened stores: the proverbial “big boxes” like Wal-Mart, HomeDepot, Best Buy, Circuit City, and the new large supermarkets. The pos-sibility that Oliner and Sichel exaggerate the role of IT capital deepening,or indeed of IT gains in total factor productivity, would imply that theresidual role of non-IT total factor productivity growth is greater, sup-porting Nordhaus’s conclusion at least to some extent.
What about the puzzle that IT boosted American productivity growthwhile exhibiting no such payoff in Europe? Another recent study supportsthe widespread impression that America accelerated while Europe fellbehind.11 The core of the U.S. success story appears to lie in the sameindustries highlighted in Nordhaus’s table 6: retail, wholesale, and securi-ties trading, which the study shows are the leading users of IT capital thatcontribute to Oliner and Sichel’s capital deepening effect. In fact, thestudy shows that literally all of the productivity growth differentialbetween the United States and Europe in the late 1990s came from thesethree industries, with retail contributing about 55 percent of the differen-tial, wholesale 24 percent, and securities trade 20 percent.12
These results for Europe shed some light on the contrast betweenNordhaus and Oliner-Sichel. Just as I argued above that the U.S. retailingsector has achieved efficiency gains for reasons not directly related tocomputers, so I can suggest in parallel that Europe has fallen backbecause European firms are much less free to develop the big-box retail
252 Brookings Papers on Economic Activity, 2:2002
10. Foster, Haltiwanger, and Krizan (2002).11. van Ark, Inklaar, and McGuckin (2002).12. van Ark, Inklaar, and McGuckin (2002, figure 2a).
1017-04 BPEA/Nordhaus 12/30/02 15:01 Page 252

formats. Impediments include land use regulations that prevent the carv-ing out of new greenfield sites for big-box stores in suburban and exurbanlocations, shop-closing regulations that restrict the revenue potential ofnew investments, congestion in central-city locations that are near thenodes of Europe’s extensive urban public transit systems, and restrictivelabor rules that limit flexibility in organizing the workplace and make itexpensive to hire and fire workers with the near-total freedom to whichU.S. firms are accustomed.
In conclusion, it is clear that Nordhaus has overstated the magnitude ofthe post-1995 productivity growth revival, because of the many factorsquantified above: the use of only income-side output measures in prefer-ence to a mix of income- and product-side measures, a data-driven choiceof initial and terminal years that exaggerates the magnitude of the revival,an inability to take account of the most recent data revisions, and a failureto take any account of the most important aspect of new economy capitalinvestment, namely, capital deepening. Yet the contrasting results ofOliner and Sichel may overstate their conclusion that, for a time ending in2001, IT investment explains all of the post-1995 productivity growthrevival. Recent microeconomic evidence on retail productivity suggestsstrongly that IT investment was a sideshow, perhaps necessary but notsufficient for the retail productivity explosion. Finally, the failure ofEurope to enjoy a revival, even as its firms invested heavily in the samecomputer hardware and software as did their U.S. counterparts, suggeststhat the productivity gap across the Atlantic originates in something otherthan new economy investment. To understand the transatlantic gap, andindeed to make progress in trying to forecast whether future U.S. produc-tivity growth will more closely resemble that of 1995–2001 or that of1973–95, we need to move beyond the macroeconomic framework of theNordhaus paper and much of the closely related recent research.
Daniel E. Sichel: William Nordhaus starts his paper by asking, rhetori-cally, why we need another paper on the new economy now, given thecollapse of the technology sector and the bursting of the NASDAQ bub-ble. Indeed, analysts at Goldman Sachs recently started an issue of anewsletter with the headline “New Economy, Rest In Peace: It Was FunWhile It Lasted.”1 However, given the uncertainty engendered by recent
William D. Nordhaus 253
1. Goldman Sachs (2002).
1017-04 BPEA/Nordhaus 12/30/02 15:01 Page 253

developments about the underlying pace of productivity growth, now isan especially appropriate time to take a fresh look at what accounted forthe productivity revival in the mid-1990s. The Nordhaus paper does thisin a careful and thoughtful way.
For the most part, I agree with the paper’s conclusions and I like thestyle of the analysis. The decomposition of labor productivity growth in achain-weighted world into a pure productivity effect, a Baumol effect,and a Denison effect is useful and insightful. Where I would interpret thenumbers differently relates mainly to the extent to which the rebound inproductivity growth is linked to information technology (IT). I will startwith that issue, comment on some measurement issues raised by thepaper, and then offer a few words about the big question on everyone’smind: how much of the productivity resurgence might be sustainable?
the role of IT capital deepening in the productivity revival.Nordhaus’s paper focuses on labor productivity and a decomposition ofits growth by industry. As the section on “Qualifications” clearly notes, heexplicitly chooses not to take account of the role of capital deepening.Although Nordhaus argues that the numbers on capital deepening arepotentially problematic, I believe that taking account of capital deepeningas best one can would give a clearer picture of the role played by IT in theproductivity resurgence.
Table 1 below shows the results of Nordhaus’s decomposition of laborproductivity growth. According to his numbers for the nonfarm businesssector, labor productivity increased at an average pace of 1.3 percent ayear from 1989 to 1995 (first line of the table). This rate increased to2.8 percent a year from 1995 to 2000, implying a step-up of 1.5 percent-age points over the 1989–95 period.2 (These figures are based on income-side data. Product-side figures are discussed below.) Using data on outputby industry from the Bureau of Economic Analysis, Nordhaus essentiallydefines the new economy as those industries that produce new economyproducts. These include industrial machinery and equipment (which pro-duces computer hardware), electronic and other electric equipment(which produces communications equipment and semiconductors), tele-
254 Brookings Papers on Economic Activity, 2:2002
2. The step-up in productivity growth is smaller when data for 2001 are included.According to an unpublished update of Oliner and Sichel (2002), labor productivitygrowth—measured on the income side to maintain comparability with Nordhaus’sfigures—picked up about 1 percentage point when figures for 2001 are included.
1017-04 BPEA/Nordhaus 12/30/02 15:01 Page 254

phone and telegraph (which provides telecommunications services), andsoftware. This new economy classification focuses primarily on the com-panies involved in the production of IT, but says little about the compa-nies and industries that use IT. According to Nordhaus’s definition, thecontribution to productivity growth from new economy industries steppedup from an average of 0.5 percentage point a year during 1989–95 to 0.8percentage point a year during 1995–2000 (second line of table 1). Thus,according to this classification scheme, the new economy accounted for0.3 percentage point of the 1.5-percentage-point improvement in laborproductivity growth in the mid-1990s. Nordhaus’s interpretation of thesenumbers is that the new economy made a noticeable contribution to theresurgence in productivity growth after 1995, but that the bulk of theimprovement in labor productivity growth owed to developments else-where in the economy.
In contrast, I believe that, to assess the role of IT on labor productivitygrowth, it is essential to consider the use of IT as well as its production.
William D. Nordhaus 255
Table 1. Contributors to Labor Productivity Growth in the Nonfarm BusinessSector, 1978–2000a
Percentage points a year except where noted otherwise
Change from 1989-95 to
Item 1978–89 1989–95 1995–2000 1995–2000
Nordhaus decompositionLabor productivity growth 1.3 1.3 2.8 1.5
(percent a yearb)Contribution of:
New economy industriesc 0.5 0.5 0.8 0.3Other 0.8 0.8 2.0 1.2
Oliner-Sichel decompositionLabor productivity growth 1.3 1.5 2.9 1.4
(percent a yearb)Contribution of:
IT production 0.3 0.4 0.8 0.4IT capital deepening 0.5 0.5 1.0 0.5Other 0.5 0.6 1.1 0.5
Sources: Nordhaus, this volume; Oliner and Sichel (2002).a. Both decompositions are based on income-side data.b. Measured as the annual log difference for the indicated years, multiplied by 100.c. Includes only the contribution from the production of goods by new economy industries, not the use of those goods in other
industries.
1017-04 BPEA/Nordhaus 12/30/02 15:01 Page 255

Several authors have done this;3 here I will draw on a recent study byStephen Oliner and myself.4 As the fifth line of table 1 shows, the Oliner-Sichel decomposition indicates that the production of IT contributed0.4 percentage point to the step-up in labor productivity growth in the sec-ond half of the 1990s, a figure quite similar to Nordhaus’s for the contri-bution of new economy industries to the pickup. The figures for thecontribution of IT capital deepening (sixth line of the table) capture theimpact on labor productivity growth of greater use of IT throughout allsectors. Under standard neoclassical assumptions, these numbers showthe effect on labor productivity growth of rising amounts of IT capitalavailable per worker-hour; that is, the growing use of IT. As shown,Oliner and Sichel report that IT capital deepening accounted for 0.5 per-centage point of the pickup in labor productivity growth.
By these numbers, the use of IT was even more important to the pro-ductivity revival than was the production of IT. In this sense, Nordhaus’sargument that much of the pickup in labor productivity growth occurredoutside the new economy could mislead the casual reader. It is true thatthe industries he identifies as part of the new economy accounted for a rel-atively modest portion of the improvement in productivity growth, but thegoods produced by those industries were very important contributors toproductivity growth in the industries in which they were used. Indeed, ofthe 1.4-percentage-point pickup in labor productivity growth through2000 identified by Oliner and Sichel, the use and the production of ITtogether accounted for nearly two-thirds.5 Thus, once IT capital isaccounted for, it appears that IT played a central role in the mid-1990sresurgence of labor productivity growth. This view contrasts with Nord-haus’s narrower interpretation of the impact of the new economy.
In the “Qualifications” section of the paper, Nordhaus discusses thereasons behind his choice to explicitly exclude the role of capital deep-
256 Brookings Papers on Economic Activity, 2:2002
3. They include Jorgenson and Stiroh (2000a), Jorgenson, Ho, and Stiroh (2002), andOliner and Sichel (2000, 2002).
4. Oliner and Sichel (2002); that study presents product-side figures extending through2001. The numbers presented in this comment are for the period ending in 2000 and areincome-side numbers to ensure comparability with Nordhaus’s. In addition, the numberspresented here incorporate the 2002 annual revision of the National Income and ProductAccounts, which the numbers in the published version of Oliner and Sichel (2002) do not.
5. Jorgenson, Ho, and Stiroh (2002) and Stiroh (forthcoming) also show that, takentogether, the use and production of IT account for a significant portion of the pickup inlabor productivity growth after 1995.
1017-04 BPEA/Nordhaus 12/30/02 15:01 Page 256

ening (and therefore the use of IT) from his analysis. He highlightspotential problems with measures of capital and suggests reasons todoubt the validity of the neoclassical assumptions that underlie conven-tional growth accounting. I would grant him some of the points raisedhere, but not all.6 Wherever one comes down in that debate, the key ques-tion is how to paint the most accurate picture one can of the impact ofnew economy developments. Is it more useful to focus just on the contri-bution of the production of IT alone because that piece is, arguably, bet-ter measured? Or is it more useful to focus on the contribution of both theproduction and the use of IT, despite the long-standing challenges of cor-rectly measuring capital? I believe that a clearer picture of the impact ofIT on productivity growth emerges from evaluating the impact of both itsproduction and its use.7
other matters. A few other measurement issues bear emphasis.First, as the paper explains clearly, the data on output by industry used inthe paper are income-side measures, in contrast to the product-side mea-sures that have been used in some aggregate growth accounting studies.8
Although income-side and product-side measures of real output have typ-ically shown similar patterns of growth—they did so in the first half of the1990s, for example—during the late 1990s the income-side measure ofreal output increased noticeably more rapidly than the product-side mea-sure. In terms of the Oliner-Sichel decomposition, during 1995–2000 theproduct-side measure increased at an average annual rate of 2.5 percent,implying a 1-percentage-point improvement in the pace of labor produc-tivity growth, compared with the 1.4-percentage-point pickup in theincome-side measure. No one knows whether the income-side or theproduct-side figures portray the economy more accurately. But the choicebetween income- and product-side data is not inconsequential for ananalysis of the late 1990s.
Second, Nordhaus’s decompositions use industry value-added datarather than industry gross output. There are, however, arguments for
William D. Nordhaus 257
6. Also recall that Nordhaus’s measure of the output of new economy industries is lessthan ideal, because data limitations necessitate that industries be broadly defined and there-fore include products that would not typically be associated with the new economy.
7. See Triplett and Bosworth (2002) for an industry-by-industry decomposition oflabor productivity growth that breaks out the contribution of IT capital deepening withinservices industries.
8. Such as Jorgenson, Ho, and Stiroh (2002) and Oliner and Sichel (2002).
1017-04 BPEA/Nordhaus 12/30/02 15:01 Page 257
preferring a decomposition that uses industry gross output. (Gross outputis the total value of an industry’s production, and value added is grossoutput less the value of the intermediate inputs purchased by that indus-try.) As a practical matter, gross output may be preferable because anindustry actually produces gross output, not value added.9 For example,the motor vehicle industry produces motor vehicles; it does not producemotor vehicle value added. Thus, to assess the labor productivity of anindustry, it may be more natural to use the actual output that the industryproduces rather than value added. In some industries the distinctionbetween gross output and value added can be important, because interme-diate inputs can be large and can move around a lot. For example, I havereported elsewhere that in the communications industry—telecommuni-cations and radio and television broadcasting—labor productivity decel-erated considerably on a value-added basis in the mid-1990s butaccelerated slightly on a gross output basis.10
Third, Nordhaus’s paper highlights an important point about dataavailability. Although the objective of the paper was to focus onhigh-technology, new economy industries, Nordhaus was forced to lookat broader industry classifications than would be ideal. For example,where he would have liked to examine just the industry that producescomputers, data limitations forced him instead to look at the broaderindustry that produces industrial machinery. And where he would haveliked to study just the semiconductor industry and just the telecommuni-cations equipment industry, data limitations forced him to look at thebroader industry that produces all electronic equipment. Nordhaus doesthe best he can with the available data, but in my view these data limita-tions represent a shortcoming in our national data system. The statisticalagencies are working on this, but it still is not possible to track preciselythe role of IT in the economy.
what might the future hold? Despite my concern about theimportance of considering the use of IT capital, this paper lays out a veryuseful framework for thinking about the sources of labor productivitygrowth on an industry-by-industry basis. Stepping a bit beyond what is inthe paper itself, I would like to offer a few words about an important ques-
258 Brookings Papers on Economic Activity, 2:2002
9. In terms of econometrics, Basu and Fernald (1995) argue that gross output industrydata are preferable because econometric analyses based on value-added data can, in certaincircumstances, lead to spurious findings.
10. Sichel (2001).
1017-04 BPEA/Nordhaus 12/30/02 15:01 Page 258

tion implicit in the paper, namely, what portion of the productivity revivalmight be sustainable?
Robert Gordon, the other discussant of this paper, has tended to take arelatively pessimistic view on this. He has identified several reasons whythe late 1990s were a unique period, with a confluence of events that areunlikely to be repeated: the World Wide Web could only be inventedonce, and efforts to counter the year-2000 (Y2K) bug compressed thereplacement cycle. Perhaps most important, Gordon argues that the sup-ply of greater computing power and falling prices may not generate newdemand, and he therefore urges some caution in thinking about how muchof the productivity revival might be sustainable.
We really do not know the answer to this question, but there are waysto examine the issue systematically. For example, the paper I wrote withOliner analyzed the steady-state properties of a multisector growth model,to try to put some rough bounds on what might be reasonable numbers, or“structured guesses,” for sustainable labor productivity growth over thenext five to ten years.11 Compared with the very interesting work done byBill Martin and Karl Whelan,12 the Oliner-Sichel model beefs up thehigh-technology portion of the model in order to focus on the impact ofdevelopments in that sector. We do not regard this exercise as a forecast-ing model, but rather as a way to translate alternative views about under-lying fundamentals—such as total factor productivity growth in eachindustry and IT output shares—into the metric of labor productivitygrowth. We considered both more conservative and more optimistic sce-narios for key parameters and found a plausible range for sustainablegrowth in labor productivity between 2 and 23⁄4 percent a year. Even at thebottom end of the range, productivity is performing quite a bit better thanits pace during the sluggish period from the early 1970s to the mid-1990s.The reason is that, despite the downturn in IT shares in 2001, those shareshad moved up enough so that there would now be a bigger weight on fast-growing IT sectors.
An assessment of whether or not this story is reasonable hinges on twokey issues. First, what will be the pace of technological progress in key ITsectors? Second, as this progress unfolds and semiconductor and com-puter prices continue to fall on a quality-adjusted basis, how much of this
William D. Nordhaus 259
11. Oliner and Sichel (2002).12. Martin (2001); Whelan (2001).
1017-04 BPEA/Nordhaus 12/30/02 15:01 Page 259

new technology will be absorbed? Put another way, will computing powerin the economy reach a saturation point, or will new applications be foundas prices continue to fall?
Dale Jorgenson has said a great deal about the first question, and I donot want to pursue that further here.13 As for the second, BradfordDeLong has offered an interesting perspective based on a historical anal-ogy.14 Starting from the early days of computers in the 1950s, DeLonglooks back at each successive generation of computers and falling pricesof computers. He starts with large mainframes, which in the early dayswere primarily used for military applications, the U.S. Census, or veryspecialized business applications. Then computers became cheaper,smaller, and faster, and the use of computers expanded into back-officecalculations in insurance companies and other large firms. As timepassed, computers became still cheaper, smaller, and faster, and their useexpanded to allow real-time manipulation of databases such as airlinereservation systems. With further miniaturization and further price cuts, awhole additional set of applications opened up as the era of desktop com-puting unfolded and evolved into the network and Internet era.
The key question is, will this process continue? As prices fall furtherand miniaturization proceeds, will there be a next generation onDeLong’s list? Or have we come to the end of the diffusion of microcom-puting technology through the economy? Obviously, these are hard ques-tions, and I do not think anyone can know for sure. Having said that, I putmyself in the camp of the relatively more optimistic. Historically, asminiaturization proceeded and prices fell ever lower, firms did find newways to use that power in entirely new and unforeseen ways thatenhanced efficiency. And my best guess is that that process still has a sig-nificant way to run.
General discussion: Martin Baily observed that, in his 1972 Brookingspaper, Nordhaus had concluded that shift effects were more importantthan within-industry effects in explaining the productivity slowdown thencoming into view. But, in the years that followed, within-industry effectsbecame important. Before 1973, productivity growth was recorded inboth the manufacturing and the services sectors, but productivity growth
260 Brookings Papers on Economic Activity, 2:2002
13. Jorgenson (2001).14. DeLong (forthcoming).
1017-04 BPEA/Nordhaus 12/30/02 15:01 Page 260

in services came to a halt after that. Available data show that only sincethe mid-1990s has productivity growth in the services sector revived, butdata problems cloud these observations. The revival in productivitygrowth in the services sector coincided with the application of new pricedeflators to industries in that sector. It is unclear how much of theobserved growth is simply due to this data improvement, and whether thisimprovement would be detected in earlier years if one could backcastthese deflators. Baily also raised the possibility that economists workingon this data improvement might have looked too eagerly for ways todetect productivity gains in the services sector.
Addressing Nordhaus’s focus on labor productivity rather than totalfactor productivity, Baily noted that capital input is poorly measured, par-ticularly at the individual industry level, and so total factor productivityestimates are correspondingly mismeasured. Moreover, the timing and thecausal link between information technology investment and productivitygrowth are uncertain. In the late 1990s productivity increased at the sametime that firms were adding more computers. But firms may have beenadding computers because profits were high and growth was rapid.
Looking ahead, Baily noted that much of the investment in informationtechnology may not have yet paid off. If that is the case, it promises pro-ductivity growth in the coming years from technology already purchasedin the late 1990s. Gregory Mankiw observed, on the other hand, that theserial correlation of productivity growth is low, and therefore one shouldhave little confidence that the faster productivity growth of recent yearscan be projected into the future. Mankiw also noted that the pickup inU.S. productivity growth in the second half of the 1990s was not mirroredin other advanced economies. This contrasted with the preceding produc-tivity slowdown, which appeared everywhere. He wondered why thistime was different and what it implied about the United States and theother countries. Robert Gordon mentioned that comparisons of Europeanand U.S. productivity performance in the late 1990s are hampered byinconsistent data. Most of the acceleration in total factor productivity inthe United States achieved by the IT industry (evident in Sichel’s decom-position) is dependent on the use of a hedonic price deflator for computersand semiconductors, but some of the large European countries, such asGermany, use inaccurate deflators that show little or no price decline forIT equipment. When U.S. deflators for this equipment are substituted forthe inaccurate European deflators, the growth rate of European productiv-
William D. Nordhaus 261
1017-04 BPEA/Nordhaus 12/30/02 15:01 Page 261

ity in the late 1990s is boosted by 0.2 to 0.3 percentage point a year, butthis is not nearly enough to close the puzzling gap between American andEuropean performance.
Bradford DeLong noted some unusual features of the recent record.Capital deepening has been modest in 2001 and 2002 because of the highdepreciation rates for IT capital acquired at the end of the 1990s. Yet mea-sured total factor productivity and labor productivity have continued togrow rapidly. Unlike in typical previous recoveries, when rapid produc-tivity gains were accompanied by rapid increases in hours worked, in thecurrent recovery strong productivity growth has coincided with a substan-tial fall in hours worked. DeLong concluded that we need to better under-stand the behavior of productivity at the beginning of an economicexpansion and how it is related to Okun’s Law and to the behavior oflabor hours.
Baily noted that Nordhaus’s decomposition of productivity growthincludes a shift effect, so that labor productivity growth in the economy asa whole is augmented if employment moves from industries with low toindustries with high average labor productivity. He argued that althoughthe algebra of the calculation is correct, the interpretation can be mislead-ing. After adjusting for differences in worker quality, average labor pro-ductivity is maximized in an economy if the marginal product of labor isequalized in all activities. (In a market economy this requires perfectcompetition and the equalization of quality-adjusted wages.) An efficienteconomy will not be one in which average labor productivities are equal-ized across industries, because capital intensity and technology vary byindustry. The movement of workers among industries is a fundamentalcause of increased aggregate labor productivity only to the extent that itincreases overall efficiency, and that in turn depends on marginal produc-tivities, not average productivities. To sustain higher average productiv-ity, capital must move along with the labor, and the additional capital canbe seen as the source of the improved aggregate labor productivity.
262 Brookings Papers on Economic Activity, 2:2002
1017-04 BPEA/Nordhaus 12/30/02 15:01 Page 262

References
Baily, Martin N. 1982. “The Productivity Growth Slowdown by Industry.”BPEA, 2:1982, 423–54.
Basu, Susanto, and John G. Fernald. 1995. “Are Apparent Productive Spillovers aFigment of Specification Error?” Journal of Monetary Economics 36(1): 165–88.
Baumol, William J. 1967. “Macroeconomics of Unbalanced Growth: TheAnatomy of Urban Crisis.” American Economic Review 57(3): 415–26.
Baumol, William J., Sue Anne Batey Blackman, and Edward N. Wolff. 1985.“Unbalanced Growth Revisited: Asymptotic Stagnancy and New Evidence.”American Economic Review 75(4): 806–17.
DeLong, J. Bradford. Forthcoming. “Productivity Growth in the 2000s.” In NBERMacroeconomics Annual, edited by Ben S. Bernanke and Kenneth Rogoff.MIT Press.
Denison, Edward F. 1967. Why Growth Rates Differ. Brookings.———. 1980. Accounting for Slower Growth: The United States in the 1970s.
Brookings.Foster, Lucia, John Haltiwanger, and Cornell J. Krizan. 2002. “The Link between
Aggregate and Micro Productivity Growth: Evidence from Retail Trade.”Working Paper 9120. Cambridge, Mass.: National Bureau of EconomicResearch (August).
Goldman Sachs. 2002. “Rest in Peace New Economy, It Was Fun While ItLasted.” New York (August 14).
Gordon, Robert J. 1993. “The Jobless Recovery: Does It Signal a New Era ofProductivity-Led Growth?” BPEA, 1:1993, 271–316.
———. 2000. “Does the ‘New Economy’ Measure up to the Great Inventions ofthe Past?” Journal of Economic Perspectives 14(4): 49–74.
———. 2001. “Did the Productivity Revival Spill Over from Manufacturing toServices? Conflicting Evidence from Four Data Sources.” Paper presented atthe NBER Summer Institute, Cambridge, Mass., July.
———. 2002. “Technology and Economic Performance: The United States.” InTechnological Innovation and Economic Performance, edited by Benn Steil,David G. Victor, and Richard R. Nelson. Princeton University Press.
Griliches, Zvi. 1994. “Productivity, R&D, and the Data Constraint.” AmericanEconomic Review 84(1): 1–23.
Jorgenson, Dale W. 2001. “Information Technology and the U.S. Economy.”American Economic Review 90(1): 1–32.
Jorgenson, Dale W., Mun S. Ho, and Kevin J. Stiroh. 2002. “Projecting Produc-tivity Growth: Lessons from the U.S. Growth Resurgence.” Federal ReserveBank of Atlanta Economic Review, Third Quarter, pp. 1–13.
Jorgenson, Dale W., and Kevin J. Stiroh. 2000a. “Raising the Speed Limit: U.S.Economic Growth in the Information Age.” BPEA, 1:2000, 125–211.
William D. Nordhaus 263
1017-04 BPEA/Nordhaus 12/30/02 15:01 Page 263

———. 2000b. “U.S. Economic Growth at the Industry Level.” American Eco-nomic Review 90(2): 161–67.
Landefeld, J. Steven, and Robert P. Parker. 1997. “BEA’s Chain Indexes, TimeSeries, and Measures of Long-Term Economic Growth.” Survey of CurrentBusiness 77(5): 58–68.
Martin, Bill. 2001. “American Potential.” UBS Asset Management (May).www.phillipsdrew.com/research/american_potential.pdf. Accessed March 26,2002.
Nordhaus, William D. 1972. “The Recent Productivity Slowdown.” BPEA,3:1972, 493–536.
———. 2000. “New Data and Output Concepts for Understanding ProductivityTrends.” Unpublished paper. Available at www.econ.yale.edu/~nordhaus/homepage/writings_and_presentations_on_th.htm (November 6).
———. 2002. “Alternative Methods for Measuring Productivity Growth(Revised).” Unpublished paper. Available at www.econ.yale.edu/~nordhaus/homepage/writings_and_presentations_on_th.htm (June 20).
Oliner, Stephen, and Daniel E. Sichel. 2000. “The Resurgence of Growth in theLate 1990s: Is Information Technology the Story?” Journal of Economic Per-spectives 14(4): 3–22.
———. 2002. “Information Technology and Productivity: Where Are We Nowand Where Are We Going?” Federal Reserve Bank of Atlanta EconomicReview, Third Quarter, pp. 15–44.
Sichel, Daniel E. 2001. “Productivity in the Communications Sector: AnOverview.” Unpublished paper. Federal Reserve Board (February).
Stiroh, Kevin J. Forthcoming. “Information Technology and the U.S. Productiv-ity Revival: What Do the Industry Data Say?” American Economic Review.
Triplett, Jack E. 1992. “Economic Concepts for Economic Classifications.” Sur-vey of Current Business 72 (April): 49–52.
Triplett, Jack E., and Barry P. Bosworth. 2002. “ ‘Baumol’s Disease’ Has BeenCured: IT and Multifactor Productivity in U.S. Services Industries.” Paper pre-pared for the Texas A&M Conference on “The New Economy: How New?How Resilient?” Texas A&M University, College Station, Tex., April 19.
U.S. Department of Commerce. 2000. Digital Economy 2000. Washington(June). Available at www.esa.doc.gov/508/esa/DigitalEconomy.htm.
van Ark, Bart, R. Inklaar, and Robert H. McGuckin. 2002. “‘Changing Gear’:Productivity, IT and Service Industries: Europe and the United States.” Paperpresented to the Brookings Workshop on Services Industry Productivity,Washington, May 17.
Whelan, Karl. 2001. “A Two-Sector Approach to Modeling U.S. NIPA Data.”Federal Reserve Board Finance and Economics Discussion Series Paper2001-4. Washington: Federal Reserve Board (April).
264 Brookings Papers on Economic Activity, 2:2002
1017-04 BPEA/Nordhaus 12/30/02 15:01 Page 264

Yuskavage, Robert E. 2000. “Priorities for Industry Accounts at BEA.” Paperprepared for the meeting of the Bureau of Economic Analysis Advisory Com-mittee, Washington, November 17. Available at www.bea.gov/bea/about/advisory.htm.
———. 2002. “Gross Domestic Product by Industry: A Progress Report onAccelerated Estimates.” Survey of Current Business 82(6): 19–27.
William D. Nordhaus 265
1017-04 BPEA/Nordhaus 12/30/02 15:01 Page 265

1017-04 BPEA/Nordhaus 12/30/02 15:01 Page 266