
Redefining prosperity, resource productivity, economic growth

PRODUCTIVITY AND PROSPERITY IN QUEBEC
2013 OVERVIEW
20
13
OV
ER
VIE
WPR
OD
UC
TIV
ITY
AN
D PR
OSPER
ITY
IN Q
UEB
EC

EditorRobert Gagné Director, Centre for Productivity and Prosperity
ContributorsJonathan Deslauriers, Project DirectorJonathan Paré, professional researcher
Production Co-ordinatorLiette D’Amours
English translationTerry KnowlesPamela Ireland
Revision of original French textJosée BolducLouise Letendre
Computer graphicsBrigitte Ayotte, Ayograph
Productivity and Prosperity in Quebec – 2013 Overview is an initiative of the HEC Montréal Centre for Productivity and Prosperity
The HEC Montréal Centre for Productivity and Prosperity, created in 2009, has a twofold mission. First of all, it is devoted to research on productivity and prosperity, mainly in Quebec and in Canada as a whole. The Centre then shares its research findings, making them widely accessible and, in the end, educating people about productivity and prosperity.
For more information on the Centre or for additional copies of this study, visit www.hec.ca/cpp or write us, at [email protected]. MAILING ADDRESS:Centre for Productivity and Prosperity HEC Montréal 3000 chemin de la Côte-Sainte-Catherine Montreal, Quebec, Canada H3T 2A7 Telephone: (514) 340-6449
Legal deposit, 1st quarter 2014ISBN: 978-2-924208-14-4 (printed version)ISBN: 978-2-924208-11-3 (PDF version)Legal deposit – Bibliothèque et Archives nationales du Québec, 2014Legal deposit – Library and Archives Canada, 2014
This publication was produced with financial support from the Ministère des Finances du Québec. Cette publication est aussi disponible en français, à www.hec.ca/cpp.
© 2014 Centre for Productivity and Prosperity, HEC Montréal
This document was printed with plant-based ink on 100% recycled post-consumer fibre, produced with biogas energy. The paper is also EcoLogo and Processed chlorine free certified.
Cover photo: © iStockPhoto/temmuz can arsiray

PRODUCTIVITY AND PROSPERITY IN QUEBEC
2013 OVERVIEW


5PRODUCTIVITY AND PROSPERITY IN QUEBEC | 2013 OVERVIEW 5
TABLE OF CONTENTS
INTRODUCTION 7
SECTION 1THE STANDARD OF LIVING: WHERE DOES IT COME FROM? WHAT IS IT FOR? 8What explains the standard of living? 14What is the standard of living used for? 19
SECTION 2PUBLIC SPENDING AND TAXATION: WHERE DOES QUEBEC STAND? 26Public spending 28Factors behind the growth in the size of the public sector 31The size of the Quebec public sector : an international comparison 38Taxation 43The structure of taxation 49The impact of tax on economic growth 52
SECTION 3EXAMINING INVESTMENT IN QUEBEC 54Investment in Quebec: status report 57The components of private non-residential investment in Quebec 62Does Quebec attract its fair share of Canadian investment? 68
SECTION 4INEQUALITY: HOW MUCH CAN WE DO? 72Inequality in other countries 74Trends in inequality 79The role of redistribution 80
CONCLUSION 89

6
Through detailed analyses, the 2013 Overview answers a number of critical questions: Is Quebec living beyond its means? Can the province be both prosperous and egalitarian? Can the welfare state thrive without jeopardizing its economy?
PRODUCTIVITY AND PROSPERITY IN QUEBEC | 2013 OVERVIEW

7
INTRODUCTIONWe are very proud to present this fifth edition of Productivity and Prosperity in Quebec. This year’s four-part Overview, in keeping with its raison d’être, examines current trends in productivity and the standard of living in Quebec and across Canada, and suggests concrete steps for improving our economic performance.
We begin this year’s Overview with a detailed diagnosis of Quebec’s productivity and standard of living. In our analysis of data from the past 30 years, we will compare the situation here with that in other Canadian provinces and some twenty OECD countries. This section examines trends in the standard of living as measured by per capita gross domestic product (GDP) and in its main determinants, i.e. labour productivity, work intensity and the employment rate. In the second part of section 1, we try to understand how Quebec’s standard of living influences the province’s spending: household consumption, consumption by public administrations and investment. We will not only be shedding light on how our economy is managed, but also responding to a question that has often been asked in recent years: Is Quebec living beyond its means?
Section 2, with the same goal of better understanding our economic situation and offering alternatives for improving it, presents a detailed examination of how public spending has grown in Quebec and identifies the underlying factors. Since we cannot have a welfare state without relying on taxation, we then evaluate the tax burden in Quebec and the impact on our economy of the different tax tools used by the government.
To complete this spending portrait, Section 3 presents a comparative analysis of another essential component of the economy: investment. Given Quebec’s significant productivity gap, we look more specifically at the form of investment that generates the most direct productivity gains, i.e. private non-residential investment. We compare Quebec’s situation with that of a number of OECD countries recognized for their strong economic performance, and with the other Canadian provinces. Section 3 also weighs in on another debate sporadically reactivated by the political class in Quebec, about whether our province attracts its fair share of private investment within Canada.
Lastly, we conclude this 2013 Overview with a discussion of another sensitive question in the eyes of many Quebeckers: Can Quebec be both prosperous and egalitarian, in a North American economy? We offer an analysis of income inequality in Quebec and the government’s role in income redistribution. This shows, in particular, why it is neither desirable nor necessary to tax Quebeckers more heavily in order to further reduce such inequality.
Although Productivity and Prosperity in Quebec has thus far been the main initiative of the HEC Montréal Centre for Productivity and Prosperity (CPP), it is certainly not the only one. Last fall, in co-operation with La Presse, we introduced the very first ranking of Quebec municipalities. At the same time, the CPP is also conducting research into a number of aspects of productivity and the standard of living in Quebec and the rest of Canada, their trends and their determinants. All our studies are published and available free of charge on our website, at www.hec.ca/cpp.
In closing, we should note that any readers interested in the details of data and calculation methods used in this Overview can click on the links beneath the tables and figures. This information is also available in a methodological appendix available on our website.
PRODUCTIVITY AND PROSPERITY IN QUEBEC | 2013 OVERVIEW

section 1
THE STANDARD OF LIVING: WHERE DOES IT COME FROM? WHAT IS IT FOR?

Gross domestic product (GDP) measures the total revenue generated by an economy. It corresponds to the value, at market prices, of all the final goods and services produced in an economy over a given period. It is worth repeating this definition, since it specifies that GDP actually measures the wealth produced by a society. This wealth is then distributed among citizens (employment and investment income, etc.) and the state, which collects some portion in taxes to allow it to fulfil its mission of redistributing wealth and pay for public services. In this sense, per capita GDP is a useful measurement of a society’s standard of living, since it indicates the average wealth produced per inhabitant. Per capita GDP thus points to potential in terms of revenue for individuals and the state. It can be considered the budgetary constraint on a society.
Consequently, when we compare per capita GDP in Quebec with that in the other provinces or in many OECD countries, it is clear that Quebec’s economic performance has been worrisome for a good number of years. In this section we will mainly endeavour to isolate the factors influencing the standard of living and the possibilities it offers. We will begin by describing the current standard of living in Quebec and past trends.
What was the standard of living in Quebec in 2012? Figure 1 illustrates the province’s international ranking in this regard. In this case per capita GDP is expressed at purchasing power parity, i.e. by considering the differences in the cost of living among the 20 selected OECD countries.1 The standard of living in each country is converted into Canadian dollars using an exchange rate that compensates for the differences in prices from one country to another.
9
1 The OECD countries used in our analysis were chosen mainly according to what historical data was available, since our study covers the years from 1981-2012. The OECD has 34 member countries, i.e. the 20 selected countries plus Austria, Chile, the Czech Republic, Estonia, Greece, Hungary, Israel, Luxembourg, Mexico, Poland, Portugal, Slovakia, Slovenia and Turkey.
PRODUCTIVITY AND PROSPERITY IN QUEBEC | 2013 OVERVIEW

10 PRODUCTIVITY AND PROSPERITY IN QUEBEC | 2013 OVERVIEW
FIGURE 1STANDARD OF LIVING AT PURCHASING POWER PARITY QUEBEC, ONTARIO AND SELECTED OECD COUNTRIES (2012)
(Per capita gross domestic product in 2012 Canadian dollars)
0 10,000 20,000 30,000 40,000 50,000 60,000 70,000 80,000 90,000
Denmark
Norway
Sweden
Finland
Belgium
Switzerland
Iceland
Quebec
France
Netherlands
Germany
Ireland
Spain
South Korea
Canada
Japan
New Zealand
Australia
Italy
United Kingdom
Ontario
United States
80,521
65,916
63,414
55,223
53,459
52,929
52,771
52,177
51,739
50,588
50,580
49,940
49,153
46,962
46,087
45,937
44,468
44,428
43,168
40,655
39,455
39,354
37,784
OECD average (20 countries)
Source: http://statcpp.hec.ca/2013overview/FIG1.xlsx
With per capita GDP of $44,428, Quebec trails most of the 20 OECD countries in our sample. More specifically, the province falls below both the Canadian average ($52,177 per capita) and the average of the selected OECD countries ($50,588 per capita). In fact, Quebec surpasses only Japan, Italy, New Zealand, Spain and South Korea in this ranking. The United States, with per capita GDP of $63,414, has a standard of living 43% higher than in Quebec, meaning $18,986 more per capita. Norway holds first place, with a standard of living equivalent to $80,521 per capita. This is hardly surprising, since close to one-third of that country’s GDP comes from oil resources. Some countries that share common features with Quebec do much better in this ranking, however: Sweden ($52,771 per capita), Denmark ($51,739 per capita) and Finland ($46,962 per capita). All these countries have small economies in which the government is a major player. In global terms, then, Quebec’s standard of living lags behind that of other countries, sometimes substantially, including that of Canada as a whole.

11PRODUCTIVITY AND PROSPERITY IN QUEBEC | 2013 OVERVIEW
More specifically, the standard of living gap between Canada and Quebec is $7,749 per capita. This means that Canadians as a whole have a standard of living 17% higher than Quebeckers. Figure 2 illustrates Quebec’s standard of living performance in the Canadian context.
FIGURE 2STANDARD OF LIVING, CANADA AS A WHOLE AND THE PROVINCES (2012)
(Per capita gross domestic product in 2012 Canadian dollars)
0 10,000 20,000 30,000 40,000 50,000 60,000 70,000 80,000 90,000
Quebec
Ontario
Alberta
Canada
British Columbia
Newfoundland and Labrador
Nova Scotia
Manitoba
Saskatchewan
New Brunswick
Prince Edward Island
80,516
72,159
65,964
52,177
49,940
47,591
45,971
44,428
41,726
40,473
37,966
Source: http://statcpp.hec.ca/2013overview/FIG2.xlsx
First of all, an analysis of this figure shows that, in terms of standard of living, Quebec leads only the Maritime provinces, where the smallest gap is $2,702 per capita or 6% (New Brunswick) and the largest one is $6,462 per capita or 17% (Prince Edward Island). The standard of living in Ontario, the province that Quebec likes to compare itself with, is 12% higher than in Quebec, or $5,512 more per capita. Note also that Quebec is outpaced by Alberta ($80,516 per capita), Saskatchewan ($72,159 per capita) and Newfoundland and Labrador ($65,964 per capita), provinces where the high standard of living can be attributed mainly to natural resource extraction.

12 PRODUCTIVITY AND PROSPERITY IN QUEBEC | 2013 OVERVIEW
Note also that Quebec’s current performance is inextricably tied to historical trends in its standard of living. To illustrate this point, Figure 3 shows trends in per capita GDP in Quebec, Ontario, Canada as a whole and the average of the selected OECD countries for the period between 1981 and 2012. When compared over time in this way, per capita GDP is adjusted for inflation. Per capita GDP for each year is expressed in 2012 Canadian dollars.
FIGURE 3TRENDS IN STANDARD OF LIVING AT PURCHASING POWER PARITY QUEBEC, ONTARIO, CANADA AS A WHOLE AND AVERAGE OF 20 SELECTED OECD COUNTRIES (1981-2012)
(Per capita gross domestic product in 2012 Canadian dollars)
20,000
25,000
30,000
35,000
40,000
45,000
50,000
55,000
Quebec Ontario Canada OECD average (20 countries)
1989
1990
1991
1992
1993
1994
1995
1996
1981
1982
1983
1984
1985
1986
1987
1988
1997
1998
1999
2000
2001
2002
2003
2004
2005
2006
2007
2008
2009
2010
2011
2012
Source: http://statcpp.hec.ca/2013overview/FIG3.xlsx
First of all, this figure tells us that in 1981 the per capita standard of living in Quebec was $4,936 lower than in Ontario. The gap spread slightly from 1981 to 2012, reaching $5,512 per capita in 2012. However, the standard of living in Quebec grew at a slightly higher rate (average of 1.29% per year) than in Ontario (1.17%), with the result that the relative gap between the two provinces shrank during this period. In 1981, the standard of living in Ontario was about 17% higher than in Quebec, as compared with 12% at present. Over the past 30 years, Quebec has been very gradually catching up with Ontario.

13PRODUCTIVITY AND PROSPERITY IN QUEBEC | 2013 OVERVIEW
Now, if we compare the standard of living in Quebec with that in Canada as a whole, we can see that the gap between the province and the country has gradually widened over the past three decades. This can be explained by the slightly higher rate of growth in the standard of living in Canada (1.30% on average per year). Quebec’s shortfall of $5,096 per capita in 1981 worsened further, to $7,749 per capita in 2012. In relative terms, however, Canada now has a standard of living 17% higher than Quebec, or about the same difference as in 1981.
Lastly, our analysis shows that the average standard of living in the 20 selected OECD countries was similar to that in Quebec in 1981. Over the past 30 years, however, the rate of growth in the standard of living in these countries, on average 1.73% per year, has been much higher than in Quebec. As a result, the average standard of living in these countries was 1.14 times greater than in Quebec in 2012. From a difference of just $154 per capita in Quebec’s favour in 1981, the standard of living gap stood at $6,159 in 2012, but this time to Quebec’s disadvantage.
In light of this analysis, we can see that Quebec’s poorer standard of living performance, in comparison with the average of all Canadian provinces and of the selected OECD countries, stems from a shortfall observed as far back as the early 1980s, combined with slower growth over the past 30 years (with the exception of Ontario).
Over the past 30 years, the rate of growth in the standard of living in the 20 OECD countries selected for our study has been much higher than in Quebec.

14 PRODUCTIVITY AND PROSPERITY IN QUEBEC | 2013 OVERVIEW
WHAT EXPLAINS THE STANDARD OF LIVING?This last observation raises the question of the causes of Quebec’s poor standard of living performance. First we need to look at the standard of living as a product of its main components, as shown in Diagram 1. Multiplying three main factors gives an economy’s standard of living. They are labour productivity, i.e. GDP per hour worked, work intensity, i.e. hours worked per job and, lastly, the overall employment rate,2 i.e. the number of jobs as a proportion of the total population.
DIAGRAM 1STANDARD OF LIVING: THE THREE BASIC DETERMINANTS
STANDARD OF LIVING
LABOUR PRODUCTIVITY
WORK INTENSITY
OVERALL EMPLOYMENT RATE
GDP=
GDPx
Hours workedx
Number of jobs
Total population Hours worked Number of jobs Total population
Table 1 shows the composition of the standard of living in Quebec and in the 20 selected OECD countries in 2012, illustrating the important role of labour productivity in determining the standard of living. It shows how Quebec lags far behind, as its labour productivity is below the average in Canada and many other OECD countries.
2 The overall employment rate is obtained by multiplying the demographic profile (population ages 15 and up / total population) by the employment rate (number of jobs / population ages 15 and up).

15PRODUCTIVITY AND PROSPERITY IN QUEBEC | 2013 OVERVIEW
TABLE 1COMPOSITION OF THE STANDARD OF LIVING AT PURCHASING POWER PARITY, SELECTED OECD COUNTRIES AND QUEBEC (2012)
(Gross domestic product in 2012 Canadian dollars and ranking)
Standard of livingLabour
productivityWork intensity
Overall employment rate
GDP/ total pop. Rank
GDP/ hours
workedRank
Hours worked/ No. jobs
Rank No. jobs/ total pop. Rank
Norway 80,521 1 = 106.24 1 x 1,418 19 x 53% 2
Switzerland 65,916 2 = 67.55 9 x 1,619 14 x 60% 1
United States 63,414 3 = 72.62 7 x 1,848 2 x 47% 14
Australia 55,223 4 = 65.37 11 x 1,685 8 x 50% 7
Ireland 53,459 5 = 87.30 2 x 1,529 16 x 40% 19
Netherlands 52,929 6 = 73.79 4 x 1,384 21 x 52% 4
Sweden 52,771 7 = 66.86 10 x 1,621 13 x 49% 11
Canada 52,177 8 = 59.56 14 x 1,711 6 x 51% 5
Denmark 51,739 9 = 73.02 5 x 1,430 18 x 50% 7
Germany 50,580 10 = 71.47 8 x 1,393 20 x 51% 5
Belgium 49,153 11 = 75.82 3 x 1,574 15 x 41% 17
Finland 46,962 12 = 60.06 13 x 1,679 9 x 47% 14
Iceland 46,087 13 = 51.14 18 x 1,710 7 x 53% 2
United Kingdom 45,937 14 = 59.51 15 x 1,654 11 x 47% 14
France 44,468 15 = 72.97 6 x 1,479 17 x 41% 17
Quebec 44,428 16 = 54.95 17 x 1,646 12 x 49% 11
Japan 43,168 17 = 49.17 19 x 1,745 4 x 50% 7
Italy 40,655 18 = 57.30 16 x 1,752 3 x 40% 19
New Zealand 39,455 19 = 45.32 20 x 1,739 5 x 50% 7
Spain 39,354 20 = 61.33 12 x 1,666 10 x 39% 21
South Korea 37,784 21 = 35.40 21 x 2,163 1 x 49% 11
Source: http://statcpp.hec.ca/2013overview/TAB1.xlsx
Overall, this analysis shows us that the top-ranked countries in terms of standard of living have a very productive workforce. This is the case especially for Norway and Ireland, which stand 1st ($106.24/h) and 2nd ($87.30/h) in our labour productivity ranking. Moreover, of the 10 countries with the best standards of living in our sample, only Australia (11th position) and Canada (14th position) are not also in the top 10 for labour productivity.
16 PRODUCTIVITY AND PROSPERITY IN QUEBEC | 2013 OVERVIEW
This exercise also shows that the other two standard of living components – work intensity and employment rate – are actually less important. On the one hand, Norway, Switzerland and Ireland, even though they are all very successful when it comes to their standard of living, have low work intensity. Norway even comes in 19th out of 21, with just 1,418 hours worked per job. On the other hand, some of the strongest performing countries have either high or low overall employment rates. At the top of the ranking, for instance, is Switzerland, sitting in 2nd place in terms of standard of living, with an overall employment rate of 60%, earning it top position in this respect. The United States, meanwhile, is 3rd for standard of living despite a lower employment rate (47%), giving it 14th position.
Lastly, when we look more closely at those countries with the lowest standard of living, like New Zealand and Japan, we can see that despite high work intensity and a high overall employment rate, their standard of living remains low (20th and 19th, respectively). This situation is due mainly to their lower level of labour productivity. All in all, countries with a high standard of living owe it mainly to their high labour productivity.
With an overall employment rate of 49% (11th place) and work intensity of 1,646 hours worked per job (12th place), there is only one component left to explain Quebec’s 16th place finish in terms of standard of living: labour productivity. And in this respect, Quebec’s performance is not very inspiring, with a low $54.95 per hour worked (17th position).
The case of Sweden allows a direct comparison with Quebec. Its work intensity (1,621 hours worked per job) is just 25 hours less per job than Quebec and its overall employment rate (49%) is the same as in Quebec. So why is Sweden’s standard of living 19% higher than Quebec’s? What explains this discrepancy of $8,342 per capita? The only possible explanation is the province’s lower labour productivity. And indeed, Sweden’s labour productivity exceeds that in Quebec by 22%, or the equivalent of $11.91 per hour worked.
In Canada as a whole, the composition of the standard of living is intriguing. The low labour productivity (14th place) is strongly offset by good performance in terms of work intensity (6th place) and the overall employment rate (5th place), explaining its 8th place for standard of living. Nonetheless, its weak labour productivity holds Canada back from reaching the top of the standard of living ranking.
Table 2 shows a similar analysis of the Canadian context, and bears out the conclusions regarding the role of labour productivity.

17PRODUCTIVITY AND PROSPERITY IN QUEBEC | 2013 OVERVIEW
TABLE 2COMPOSITION OF THE STANDARD OF LIVING, CANADA AS A WHOLE AND PROVINCES (2012)
(Gross domestic product in 2012 Canadian dollars and ranking)
Standard of livingLabour
productivityWork intensity
Overall employment rate
GDP/ total pop. Rank
GDP/ hours
workedRank
Hours worked/ No. jobs
Rank No. jobs/ total pop. Rank
Alberta 80,516 1 = 77.27 3 x 1,827 1 x 57% 1
Saskatchewan 72,159 2 = 79.38 2 x 1,773 4 x 51% 3
Newfoundland and Labrador
65,964 3 = 82.49 1 x 1,820 2 x 44% 10
Canada 52,177 – = 59.56 – x 1,711 – x 51% –
Ontario 49,940 4 = 56.91 4 x 1,713 6 x 51% 3
British Columbia 47,591 5 = 55.89 5 x 1,670 9 x 51% 3
Manitoba 45,971 6 = 51.75 7 x 1,695 8 x 52% 2
Quebec 44,428 7 = 54.95 6 x 1,646 10 x 49% 6
New Brunswick 41,726 8 = 49.41 8 x 1,776 3 x 48% 9
Nova Scotia 40,473 9 = 47.91 9 x 1,712 7 x 49% 6
Prince Edward Island 37,966 10 = 43.77 10 x 1,758 5 x 49% 6
Source: http://statcpp.hec.ca/2013overview/TAB2.xlsx
Note, first of all, that work intensity alone does not appear to be sufficient to increase the standard of living. For instance, work intensity in New Brunswick and Prince Edward Island is similar to that in Saskatchewan, but does not result in the same standard of living. The same applies for the employment rate, which is fairly similar from one province to the next (with the exception of Alberta and Newfoundland and Labrador). So once again, labour productivity seems to be the main factor underlying the standard of living performance of Canadian provinces. Quebec ranks 7th in this respect, besting only the Maritime provinces. When it comes to labour productivity, it is no surprise to see that Quebec sits in 6th place, slightly ahead of Manitoba. The Maritime provinces come in at the bottom of the list.
Note that in Alberta, Saskatchewan and Newfoundland and Labrador the three standard of living components are all at the top of the ranking, with the exception of the overall employment rate in Newfoundland and Labrador (last place), where just 44% of the population holds a job. In terms of labour productivity, Alberta (3rd place) is ahead of its closest rival, Ontario (4th place), by $20.36 per hour worked, or 36%. It is not surprising to see that the standard of living in Alberta, Saskatchewan and Newfoundland and Labrador far exceeds that of other Canadians.

18 PRODUCTIVITY AND PROSPERITY IN QUEBEC | 2013 OVERVIEW
Figure 4 shows trends in labour productivity in Quebec from 1981 to 2012 and compares them with Ontario, Canada and the average of the selected OECD countries. This lets us examine Quebec’s performance as it compares with the rest of Canada and on the international scene.
FIGURE 4TRENDS IN LABOUR PRODUCTIVITY AT PURCHASING POWER PARITY, QUEBEC, ONTARIO, CANADA AND AVERAGE OF 20 SELECTED OECD COUNTRIES (1981-2012)
(Gross domestic product per hour worked in 2012 Canadian dollars)
30
35
40
45
50
55
60
65
70
Quebec Ontario Canada OECD average (20 countries)
1989
1990
1991
1992
1993
1994
1995
1996
1981
1982
1983
1984
1985
1986
1987
1988
1997
1998
1999
2000
2001
2002
2003
2004
2005
2006
2007
2008
2009
2010
2011
2012
Source: http://statcpp.hec.ca/2013overview/FIG4.xlsx
These data show that in 1981 Quebec had a GDP per hour worked of $39.57, and so was slightly less productive than Canada as a whole ($41.64) and slightly more productive than Ontario ($38.77) and the average of the 20 selected OECD countries ($37.98). Over the past 30 years, however, these countries have seen their labour productivity grow by about 1.78% per year, far outpacing Ontario (1.25%), Canada (1.16%) and, more specifically, Quebec (1.07%). Consequently, labour productivity in these OECD countries in 2012 was 19% higher than in Quebec. On the other hand, labour productivity in Ontario and Canada was 4% and 8% higher, respectively, than in Quebec in 2012.
All in all, then, the anemic labour productivity growth in Quebec between 1981 and 2012, considering the major role this determinant plays in standard of living growth, explains Quebec’s current underperformance in this respect. Clearly, a less productive Quebec must be satisfied with a lower standard of living than in many OECD countries and Canadian provinces.

19PRODUCTIVITY AND PROSPERITY IN QUEBEC | 2013 OVERVIEW
WHAT IS THE STANDARD OF LIVING USED FOR?What does the standard of living mean for an economy? The answer is simple: it makes three kinds of spending possible for a society: household consumer spending, consumption expenditures by public administrations3 and private and public investment.
Figure 5 shows how Quebec uses its standard of living, in comparison with the 20 selected OECD countries. Figure 6 provides a similar analysis, in the Canadian context. Expenditures are shown in dollars per capita to simplify the comparison with the standard of living, which is also measured in dollars per capita.
FIGURE 5COMPOSITION OF THE STANDARD OF LIVING AT PURCHASING POWER PARITY USING THE EXPENDITURE APPROACH QUEBEC AND SELECTED OECD COUNTRIES (2012)
(Per capita gross domestic product in 2012 Canadian dollars)
0
10,000
20,000
30,000
40,000
50,000
60,000
70,000
80,000
90,000
Household spending Cons. exp. pub. adm. Investment Standard of living
Nor
way
Switz
erla
nd
Uni
ted
Stat
es
Aus
tral
ia
Irela
nd
Net
herla
nds
Swed
en
Can
ada
Den
mar
k
Ger
man
y
Belg
ium
Finl
and
Icel
and
Uni
ted
King
dom
Fran
ce
Que
bec
Japa
n
Italy
New
Zea
land
Spai
n
Sout
h Ko
rea
Source: http://statcpp.hec.ca/2013overview/FIG5.xlsx
3 Consumption expenditures by public administrations comprise purchases of goods and services, wages and benefits for employees of public administrations and the consumed portion of the fixed assets of public administrations.

20 PRODUCTIVITY AND PROSPERITY IN QUEBEC | 2013 OVERVIEW
FIGURE 6COMPOSITION OF THE STANDARD OF LIVING USING THE EXPENDITURE APPROACH, CANADA AND PROVINCES (2012)
(Per capita gross domestic product in 2012 Canadian dollars)
Can
ada
New
foun
dlan
d an
d La
brad
or
Sask
atch
ewan
New
Bru
nsw
ick
Que
bec
Nov
a Sc
otia
Prin
ce E
dwar
d Isl
and
Briti
sh C
olum
bia
Ont
ario
Alb
erta
Man
itoba
0
10,000
20,000
30,000
40,000
50,000
60,000
70,000
80,000
90,000
Household spending Cons. exp. pub. admin. Investment Standard of living
Source: http://statcpp.hec.ca/2013overview/FIG6.xlsx
This figure tells us that in 2012 Quebec households spent $26,331 per capita; with consumption expen-ditures by public administrations of $10,723 per capita and investment spending of $10,827 per capita, we arrive at a total of $47,881 per capita.
However, this total ($47,881 per capita) exceeds the standard of living in Quebec in 2012 ($44,428 per capita). Thus there is a shortfall of $3,453 per capita, representing 8% of the standard of living. This gap between the standard of living and overall per capita spending comes from the difference between the value of exports and imports, known as the balance of trade.
An economy’s overall spending includes the consumption of domestic goods and services (contributing to growth in the standard of living) and foreign goods and services (imports). Exports are domestic goods and services sold abroad. They also help to increase the standard of living. The difference between the value of exports and the value of imports therefore corresponds by definition to the difference between the value of what an economy spends and what it produces.

21PRODUCTIVITY AND PROSPERITY IN QUEBEC | 2013 OVERVIEW
When the value of exports exceeds the value of imports, the balance of trade is positive, and the economy is saving (total per capita spending is less than the standard of living). If the value of imports exceeds the value of exports, however, the balance of trade becomes negative, and the economy becomes indebted (total per capita spending is more than the standard of living).
Figures 5 and 6 show that Quebec had a trade deficit in 2012. In other words, the value of the goods and services exported by the province was less than the value of its imports, explaining why its overall per capita spending exceeded its standard of living. The Canadian economy was also in a debt situation, but to a lesser extent, with a trade deficit of $1,039 per capita, equivalent to 2% of the standard of living. Many OECD countries (United States, Australia, Finland, United Kingdom, France, Japan, New Zealand) and many Canadian provinces (Ontario, British Columbia, Manitoba, the Maritimes) are in much the same situation as Quebec and Canada as a whole.
Other countries, however, have overall per capita spending below their standard of living: Norway, for instance, with overall spending representing 87% of its standard of living. The exploitation of petroleum resources there allows the country to export goods worth far more than its imports. This performance gives it a per capita balance of trade of $10,642, corresponding to 13% of its standard of living. In Canada, only those provinces whose economies depend heavily on natural resources are also in a surplus situation. Overall spending in Alberta, Saskatchewan and Newfoundland and Labrador represents 89%, 88% and 96% of their standard of living, respectively, owing to their trade surpluses.
In comparison with OECD countries showing a negative balance of trade, however, Quebec is in a different situation as concerns its debt. The province’s trade deficit is 62% higher in absolute terms, or close to $1,317 per capita more than the next in line, the United States. This gap is all the more daunting in that Quebec’s standard of living is clearly lower than that of its southern neighbour. Quebec’s balance of trade represents about 8% of its standard of living as opposed to 3% in the United States and just 2% in Canada as a whole.
In the Canadian context, Quebec is not the only province to rely so heavily on debt in order to meet its collective needs. The Maritime provinces spend much more than Quebec, despite their lower standard of living. They import goods and services worth far more than their exports, hence their strongly negative balance of trade equivalent to $10,339 per capita for Prince Edward Island (27% of its standard of living), $10,435 for Nova Scotia (26%) and $6,846 for New Brunswick (16%). The situation is similar in British Columbia and Manitoba, but to a lesser extent, with 2012 trade deficits representing 11% and 13% of their respective standards of living. Lastly, although Ontario is also running a trade deficit, its situation seems less worrisome than for Quebec.

22 PRODUCTIVITY AND PROSPERITY IN QUEBEC | 2013 OVERVIEW
FIGURE 7COMPOSITION OF THE TRADE BALANCE CANADA AND PROVINCES (2012)
(In 2012 Canadian dollars per capita)
– 40,000
– 30,000
– 20,000
– 10,000
0
10,000
20,000
30,000
40,000
Can
ada
New
foun
dlan
d an
d La
brad
or
Sask
atch
ewan
New
Bru
nsw
ick
Que
bec
Nov
a Sc
otia
Prin
ce E
dwar
d Isl
and
Briti
sh C
olum
bia
Ont
ario
Alb
erta
Man
itoba
Interprovincial trade balance
International exports International imports
Trade balance
Source: http://statcpp.hec.ca/2013overview/FIG7.xlsx
As Figure 7 shows, however, a non-negligible portion of the balance of trade of the Maritime provinces, British Columbia and Manitoba comes from an interprovincial trade deficit. In Quebec’s case this balance is almost zero. For instance, despite a large trade deficit ($10,339 per capita), Prince Edward Island exports goods and services internationally of a value only $1,005 per capita less than its imports, or the equivalent of 10% of its balance of trade. The remainder (90%) comes from its interprovincial trade deficit. In other words, despite high overall indebtedness, the province is not so much in debt to other countries, but rather to other provinces. The same situation applies in New Brunswick, British Columbia, Nova Scotia and Manitoba, where 29%, 49%, 56% and 86% of the balance of trade is attributable to interprovincial trade. This analysis shows that Quebec’s debt toward foreign markets has no equivalent, even in Canada (with the exception of Nova Scotia and New Brunswick), despite certain provinces’ deeper indebtedness.

23PRODUCTIVITY AND PROSPERITY IN QUEBEC | 2013 OVERVIEW
Figure 8 shows trends in the standard of living in Quebec and overall per capita spending from 1981 to 2012. First of all, the exercise shows that the standard of living, just like the province’s overall spending, grew during this period.
FIGURE 8COMPOSITION OF THE STANDARD OF LIVING USING THE EXPENDITURE APPROACH, QUEBEC (1981-2012)
(Per capita gross domestic product in 2012 Canadian dollars)
0
5,000
10,000
15,000
20,000
25,000
30,000
35,000
40,000
45,000
50,000
1989
1990
1991
1992
1993
1994
1995
1996
1981
1982
1983
1984
1985
1986
1987
1988
1997
1998
1999
2000
2001
2002
2003
2004
2005
2006
2007
2008
2009
2010
2011
2012
Household spending Cons. exp. pub. adm. Investment Standard of living
Source: http://statcpp.hec.ca/2013overview/FIG8.xlsx
In more concrete terms, the analysis shows us that the $14,523 per capita increase in the standard of living in Quebec between 1981 and 2012 led to additional household spending of $9,438 per capita, consumption expenditures by public administrations of $2,997 per capita and additional public and private investment of $4,842 per capita. In other words, it was mainly household spending that benefited from the growth in the standard of living in Quebec. The increase in household spending represents 65% of the growth in the standard of living, followed by investment expenditures (33%) and consumption expenditures by public administrations (21%).
Figure 8 also shows that in Quebec overall per capita spending grew more than the standard of living during this period. Since 2002, the gap between overall per capita spending and the standard of living has continued to widen and finally set a new record in 2012. We have to examine the balance of trade to find an explanation for this phenomenon.
Figure 9 illustrates Quebec’s current situation, characterized by a deteriorating balance of trade.

24 PRODUCTIVITY AND PROSPERITY IN QUEBEC | 2013 OVERVIEW
FIGURE 9COMPOSITION OF THE TRADE BALANCE, QUEBEC (1981-2012)
(In 2012 Canadian dollars per capita)
– 18,000
– 14,000
– 10,000
– 6,000
– 2,000
2,000
6,000
10,000
14,000
18,000
Interprovincial trade balance
International exports International imports
Trade balance
1989
1990
1991
1992
1993
1994
1995
1996
1981
1982
1983
1984
1985
1986
1987
1988
1997
1998
1999
2000
2001
2002
2003
2004
2005
2006
2007
2008
2009
2010
2011
2012
Source: http://statcpp.hec.ca/2013overview/FIG9.xlsx
The deterioration in the balance of trade since 2001 is attributable mainly to a substantial decline in the value of Quebec exports. Between 2001 and 2012, the value of exports fell from $16,346 to $11,444 per capita, for a decline of $4,902 or 30% in the space of 11 years. This decline in the value of exports, combined with 10.5% growth in the standard of living over this period, drove the proportion of exports in the GDP from 41% in 2001 to just 26% today.
At the same time, the value of imports fluctuated with successive periods of growth and decline, to reach $15,033 per capita in 2012, equivalent to an increase of just 1.2% since 2001, or $184 per capita. Nonetheless, even though imports remained fairly stable during this period, the growth in the standard of living led to a slight reduction in the proportion of imports in the GDP, down from 37% in 2001 to 34% in 2012.
The balance of trade, meanwhile, fell from a surplus of $1,301 per capita in 2001 to a deficit of $3,453 per capita in 2012. A glance at previous years shows that the declining balance of trade in the early 1980s quickly stabilized, which does not seem to be the case at present. The situation that Quebec has experienced over the past 30 years is unique.

25PRODUCTIVITY AND PROSPERITY IN QUEBEC | 2013 OVERVIEW
In short, the growth in the standard of living in Quebec has made it possible for household spending, consumption expenditures by public administrations and investment spending to rise. However, a portion of the increase in overall spending in Quebec in recent years is attributable to debt and not to any improvement in its economic performance. The decline in exports, the main factor in the deteriorating balance of trade, is part of this problem. Since 2002, Quebec has been living beyond its means and depending to a large extent on debt, which has risen over time, to finance its overall spending.
To conclude, Quebec has fallen behind in terms of its standard of living since the early 1980s. This decline has become more serious in the past three decades, such that in 2012 the province, with per capita GDP of $44,428, is worse off than most of the selected OECD countries and the other Canadian provinces. The anemic growth of labour productivity in Quebec over this same period is certainly the main cause of this underperformance. Just as for the standard of living, labour productivity in Quebec lags behind that of many OECD countries and the rest of Canada. Quebeckers, with a GDP per hour worked of $54.95, are less productive and hence collectively have fewer financial resources available for household consumer spending, consumption expenditures by public administrations and public and private investment. Since Quebec does not collectively generate enough wealth, the province must go into debt to meet all its collective needs, and has been doing so to an increasing extent since the early 2000s. The decline in exports in recent years is part of this problem. Quebec, with a worrisome economic performance, is thus living beyond its means.
Between 2001 and 2012, the value of Quebec exports fell from $16,346 to $11,444 per capita, for a decline of 30% in the space of 11 years.

section 2
PUBLIC SPENDING AND TAXATION: WHERE DOES QUEBEC STAND?

We saw in the previous section how the standard of living affects household consumption, consumption expenditures by public administrations and investment. In 2012, consumption expenditures by public administrations in Quebec accounted for approximately 24% of its GDP and thus a large share of overall spending in the economy.
As is the case in many countries, the Quebec government intervenes in numerous spheres of activity. In addition to such traditional sectors as education, health, protection and social services, the government has continued to extend its reach since the 1960s, shaping today’s welfare state.
An in-depth analysis of public spending4 makes it possible to show the extent of the contribution by the public sector in Quebec and isolate the factors responsible for the way it has grown over the years. Since governments must collect sufficient revenue to finance their spending, a detailed study of public spending thus requires an analysis of taxation, their main tool for this purpose. In conducting this exercise, we measured the tax burden in Quebec and the extent to which the various levels of government use the different taxation tools available to them.
27
4 In this section, “public spending” includes consumption expenditures by public administrations (education, health, social services, transportation, culture, environment, communications, labour and other), debt service (interest and repayment of principal) and transfers to individuals and businesses by all three levels of government, i.e. municipal, provincial and federal administrations.
PRODUCTIVITY AND PROSPERITY IN QUEBEC | 2013 OVERVIEW

28 PRODUCTIVITY AND PROSPERITY IN QUEBEC | 2013 OVERVIEW
PUBLIC SPENDINGWe combined two indicators in order to adequately weigh the relative size of the public sector – public spending as a percentage of GDP and per capita public spending. On the one hand, spending as a percentage of GDP shows the relationship between the level of public spending and the financial capacity of an economy (measured by its GDP). On the other hand, per capita spending makes it possible to directly compare the overall cost of public services.
Figure 10 compares public spending in Quebec in 2009 with that in Ontario and Canada as a whole. A brief glance at the figure reveals that, regardless of the indicator used, public spending in Quebec is higher. More specifically, it shows that public spending as a percentage of GDP was 25% higher in Quebec than in Ontario and 22% higher than in Canada as a whole. At the same time, per capita public spending in Quebec was 9% higher than in Ontario and 10% higher than in Canada as a whole. In other words, Quebec must use a proportionally greater share of its GDP (25% or 22%) in order to be able to spend more per capita (9% or 10% more)
FIGURE 10PUBLIC SPENDING IN QUEBEC COMPARED WITH ONTARIO AND CANADA AS A WHOLE (2009)
(Ontario and Canada = 100)
100
105
110
115
120
125
130
Ontario Canada
Public spending as a percentage of GDP Per capita public spending
Source: http://statcpp.hec.ca/2013overview/FIG10.xlsx
Figures 11 and 12 show changes in these two indicators from 1981 to 2009, and make it possible to track trends in public spending in Quebec, Ontario and Canada as a whole.

29PRODUCTIVITY AND PROSPERITY IN QUEBEC | 2013 OVERVIEW
FIGURE 11PER CAPITA PUBLIC SPENDING IN QUEBEC, ONTARIO AND CANADA AS A WHOLE (1981-2009)
(In 2002 Canadian dollars)
Quebec Ontario Canada
9,000
10,000
11,000
12,000
13,000
14,000
15,000
16,000
17,000
1989
1990
1991
1992
1993
1994
1995
1996
1981
1982
1983
1984
1985
1986
1987
1988
1997
1998
1999
2000
2001
2002
2003
2004
2005
2006
2007
2008
2009
Source: http://statcpp.hec.ca/2013overview/FIG11.xlsx
Figure 11 looks only at per capita public spending. From 1981 to 2009, per capita public spending in Quebec increased from $11,523 to $16,139, up by $4,616 or 40% over close to thirty years. This exercise also tells us that per capita public spending in Quebec has risen sharply in recent years. The per capita figure climbed by slightly over $2,806 from 1997 to 2009, accounting for about 60% of the increase since 1981.
Per capita spending also rose markedly in Ontario and Canada as a whole from 1981 to 2009. In Ontario, per capita public spending was up from $9,500 to $14,847, for an increase of $5,347 or about 56%. Across Canada, over the same period, per capita public spending went from $9,925 to $14,690, representing a $4,765 increase or about 48%.

30 PRODUCTIVITY AND PROSPERITY IN QUEBEC | 2013 OVERVIEW
FIGURE 12PUBLIC SPENDING AS A PERCENTAGE OF GDP IN QUEBEC, ONTARIO AND CANADA AS A WHOLE (1981-2009)
(In percentages)
10
20
30
40
50
60
Quebec Ontario Canada
1989
1990
1991
1992
1993
1994
1995
1996
1981
1982
1983
1984
1985
1986
1987
1988
1997
1998
1999
2000
2001
2002
2003
2004
2005
2006
2007
2008
2009
Source: http://statcpp.hec.ca/2013overview/FIG12.xlsx
As shown in Figure 12, this same spending expressed as a percentage of GDP in Quebec has stayed relatively stable, around 45%, since the early 2000s. The recent stability of this indicator contrasts with the wide fluctuations in earlier decades, most likely caused by the successive recessions in the 1980s and 1990s.
Public spending as a percentage of GDP in Ontario and Canada as a whole has kept pace with that in Quebec, albeit at lower levels. After peaking during the recession in the early 1990s, public spending as a percentage of GDP declined before finally stabilizing in the 2000s. Over the latter period, these figures held steady around 33% in Ontario and 36% in Canada as a whole.
Examined together, the stability in public spending expressed as a percentage of GDP and the growth in per capita public spending from 1997 to 2009 show that the public administrations in Quebec, Ontario and Canada as a whole took advantage of the increase in the financial capacity (GDP) of their respective economies to finance certain additional expenditures.
All in all, public administrations in Quebec do spend more than their Ontario and cross-Canadian counterparts, however. Coupled with the fact that Quebec is less wealthy overall, this means that its public spending necessarily accounts for a larger share of its financial capacity. This phenomenon has been evident since the 1980s and continues today.

31PRODUCTIVITY AND PROSPERITY IN QUEBEC | 2013 OVERVIEW
FACTORS BEHIND THE GROWTH IN THE SIZE OF THE PUBLIC SECTORTo better understand the situation, we will try to trace the factors responsible for the current size of the Quebec public sector. To do so, we must identify the public spending attributable to each of the three levels of government5 in order to determine their relative shares of public spending in Quebec.
To start with, Figure 13 shows public spending by each level of government in Quebec, Ontario and Canada as a whole in 2009.
FIGURE 13PUBLIC SPENDING BY LEVEL OF GOVERNMENT QUEBEC, ONTARIO AND CANADA AS A WHOLE (2009)
(In 2002 Canadian dollars per capita)
0
2,000
4,000
6,000
8,000
10,000
12,000
Quebec Ontario Canada
Federal Provincial Municipal Provincial and municipal
Source: http://statcpp.hec.ca/2013overview/FIG13.xlsx
5 This ranking focuses exclusively on per capita public spending and intentionally ignores differences resulting from gaps in wealth as measured by GDP. Accordingly, this places the emphasis on the volume of public spending by each level of government.

32 PRODUCTIVITY AND PROSPERITY IN QUEBEC | 2013 OVERVIEW
This analysis shows that provincial public spending in Quebec, equivalent to $8,501 per capita, is $2,123 (33%) higher than in Ontario and $1,479 (21%) higher than in Canada as a whole. On the other hand, municipal and federal spending in Canadian provinces on average is similar to that in Quebec. In other words, only provincial spending, which is higher in Quebec, can explain the gap observed between Quebec and Canada as a whole in terms of public spending.
When we compare Quebec and Ontario, we find that only federal spending is similar in both cases. A different distribution of powers and responsibilities between the municipal and provincial administrations may explain the persistent gap between provincial spending in Ontario and Quebec. For instance, social services in Ontario fall partly under municipal jurisdiction.6
However, the gap between provincial spending in Quebec and Ontario (+$2,123 per capita) is only partially offset by the gap in municipal spending (-$658 per capita). Close to 70% of the additional spending by the provincial administration in Quebec cannot be explained by a different distribution of municipal and provincial powers and responsibilities. Only the level of provincial public spending in Quebec, which is high as compared with Ontario and Canada as a whole, can justify the size of its public sector.
To what can we attribute this higher spending in Quebec? One of the hypotheses put forward is the ageing population, increasing pressure on provincial finances by considerably raising health care costs and social services spending. However, although this phenomenon clearly does increase provincial government spending, the ageing population is not a problem unique to Quebec – this is an issue in every Canadian province.
In fact, as we can see, the exceptionally high level of provincial spending7 in Quebec comes essentially from a more marked increase in spending on certain budgetary items. In other words, this increase can be attributed primarily to the wider range of public services offered by the Quebec government.
Two factors can explain an increase in public spending over a given period. The first is population growth. In this case, there is a “structural” increase in public spending, which rises so as to accommodate the growing population, i.e. to maintain a similar level of public services per capita. The second factor is a possible expansion of the goods and services offered to the public. In the latter case, we speak of a “discretionary” increase in public spending, because it occurs when public administrations decide to increase the average volume of public goods and services offered per capita.
Table 3 provides a breakdown of the increase in municipal and provincial spending between 1989 and 2009 according to these two sources of growth in public spending.
6 For instance, for 2009-2010, municipal administrations in Ontario were responsible for approximately 20% of all residential spaces for the elderly, as compared with less than 1% for the provincial government, whereas most publicly owned residential spaces in Quebec fall under provincial jurisdiction.
7 In the rest of this section, provincial and municipal spending are lumped together in order to avoid any problems in comparisons that might arise because of a different distribution of municipal and provincial powers and responsibilities. In addition, because of limited accessibility of data, the analysis covers the period from 1989 to 2009.

33PRODUCTIVITY AND PROSPERITY IN QUEBEC | 2013 OVERVIEW
TABLE 3SOURCES OF THE GROWTH IN MUNICIPAL AND PROVINCIAL GOVERNMENT SPENDING QUEBEC, ONTARIO AND CANADIAN AVERAGE (1989-2009)
Structural increase in spending
Discretionary increase in spending Total
Quebec 19.5% 80.5% 100%
Ontario 34.4% 65.6% 100%
Canadian average 36.7% 63.3% 100%
Source: http://statcpp.hec.ca/2013overview/TAB3.xlsx
In Quebec, 80.5% of the increase in municipal and provincial spending from 1989 to 2009 was attributable to an expansion of public services, while 19.5% of the increase could be explained by population growth. In Ontario, over the same period, slightly more than 65% of the increase in municipal and provincial spending was due to a discretionary rise in spending, while the Canadian average was about 63%. In other words, the increase in spending in Quebec was more attributable to a desire on the part of the provincial and municipal administrations to expand their public services than it was in Ontario and in Canada as a whole.
Over the past two decades, Quebec deliberately chose to expand the public services it offers, with an emphasis on certain services in particular. Table 4 breaks down the increase in provincial and municipal spending by main budgetary item under provincial and municipal jurisdiction (transportation and communications, health, social services, education, debt service and other) so as to identify those items responsible for the increase in spending observed since the late 1980s.
TABLE 4SOURCES OF THE GROWTH IN PER CAPITA SPENDING BY MUNICIPAL AND PROVINCIAL ADMINISTRATIONS QUEBEC, ONTARIO AND CANADIAN AVERAGE (1989-2009)
Quebec Ontario Canada
Transportation and communications 9.2% 3.4% 7.1%
Health 28.6% 38.8% 36.4%
Social services 25.6% 10.4% 13.9%
Education 15.4% 22.5% 21.4%
Debt service 3.1% 5.8% 0.6%
Other 18.1% 19.3% 20.5%
Total 100% 100% 100%
Source: http://statcpp.hec.ca/2013overview/TAB4.xlsx

34 PRODUCTIVITY AND PROSPERITY IN QUEBEC | 2013 OVERVIEW
Whether in Quebec, Ontario or Canada as a whole, health, social services and education are the three main items responsible for the growth in provincial and municipal spending over the past two decades. What distinguishes Quebec from Ontario and Canada as a whole, however, is the relative contribution of these items to the increase in spending. First of all, the increase in spending on education added only 15.4% to the overall growth in provincial and municipal spending in Quebec, as compared with 22.5% in Ontario and 21.4% for the Canadian average. Secondly, the increase in health care spending accounted for 28.6% of the total increase in Quebec, also less than in Ontario (38.8%) and the Canadian average (36.4%). On the other hand, the increase in social services spending in Quebec explains 25.6% of the growth in provincial and municipal spending, a level 2.5 times higher than in Ontario (10.4%) and 1.8 times higher than the Canadian average (13.9%).
The analysis presented in Figure 14 makes it possible to determine whether the increase in social services spending in Quebec is attributable to a catch-up effect or merely reflects a distinctive administrative feature in the province. This can be done by comparing social services spending from 1989 to 2009 in Quebec, Ontario and Canada as a whole.
FIGURE 14PUBLIC SOCIAL SERVICES SPENDING BY MUNICIPAL AND PROVINCIAL ADMINISTRATIONS QUEBEC, ONTARIO AND CANADA AS A WHOLE (1989 AND 2009)
(In 2002 Canadian dollars per capita)
0
500
1,000
1,500
2,000
2,500
3,000
Quebec Ontario Canada
1989 2009
Source: http://statcpp.hec.ca/2013overview/FIG14.xlsx

35PRODUCTIVITY AND PROSPERITY IN QUEBEC | 2013 OVERVIEW
Figure 14 shows us, first of all, that in 1989 social services spending by municipal and provincial administrations in Quebec was already higher than in Ontario and Canada as a whole. Quebec spent $1,695 per capita on social services at the time, or about 44% more than Ontario ($1,174 per capita) and approximately 37% more than the Canadian average ($1,236 per capita).
The exercise also reveals that from 1989 to 2009 per capita social services spending in Quebec grew by more than 60%, as compared with 17% in Ontario and 29% in Canada as a whole. It is no surprise, then, that the gaps observed in 1989 were even wider by 2009. This means that per capita social services spending by municipal and provincial administrations in Quebec stood at $2,746 in 2009, or $1,372 more than in Ontario (almost double) and $1,157 more than the Canadian average (73% more). And it shows that this is by no means a case of Quebec catching up – indeed, the opposite is true. Social services spending in Quebec (constantly rising over the past two decades as compared with that in Ontario and the rest of Canada) is thus another unique feature that can explain the size of its public sector.
Figure 15, which shows trends in the different components of social services spending,8 indicates that the wide gap is mainly due to the increase in spending on the Other social services item.
8 This budgetary item includes social assistance expenditures, compensation for automobile and work accident victims, pension benefits for government employees, expenditures related to accommodation for the elderly and people with physical or psychological limitations, expenditures relating to support for households with dependent children, and childcare expenditures.
From 1989 to 2009, per capita social services spending in Quebec grew by more than 60%, as compared with 17% in Ontario and 29% in Canada as a whole.

36 PRODUCTIVITY AND PROSPERITY IN QUEBEC | 2013 OVERVIEW
FIGURE 15TRENDS IN SOCIAL SERVICES PUBLIC SPENDING IN QUEBEC BY MAIN BUDGETARY ITEM (1989-2009)
(In 2002 Canadian dollars per capita)
1989
1990
1991
1992
1993
1994
1995
1996
1997
1998
1999
2000
2001
2002
2003
2004
2005
2006
2007
2008
2009
Social assistanceWorkers' compensation benefitsEmployee pension fund benefits and changes in assetsPayments to automobile accident victimsOther social services
0
500
1,000
1,500
2,000
2,500
3,000
Source: http://statcpp.hec.ca/2013overview/FIG15.xlsx
In 1989, the Other social services budgetary item stood at less than $500 per capita, or slightly less than 30% of all social services expenditures. By 2009, spending on this item had risen to $1,240 per capita, or almost 45% of all social services spending. In the space of twenty years, then, spending in the Other social services category grew to make up a much larger share of total social services spending, not only because it was up by about 150%, but also because spending in other categories remained relatively stable, with the exception of the Employee pension fund benefits and changes in assets category. The latter category had risen to slightly more than $700 per capita by 2009, up by about $180 per capita, or 30%, since 1989.

37PRODUCTIVITY AND PROSPERITY IN QUEBEC | 2013 OVERVIEW
Another observation that can be made is that most of the increase in spending in the Other social services category is quite recent. These costs practically doubled between 2004 and 2009. This boom can be explained essentially by the fact that this category includes a broad range of social services related to families, and accommodation for elderly individuals and those with physical and psychological limitations. The ageing population, parental leave and the increase in the number of subsidized daycare spaces therefore appear to be the main factors responsible for this large increase in social services spending in Quebec.
Thus we can say that the larger size of the public sector in Quebec as compared with Ontario and Canada as a whole is attributable to a desire in recent years on the part of the provincial government to expand the public services it offers, particularly in the area of social services.
The ageing population, parental leave and the increase in the number of subsidized daycare spaces appear to be the main factors responsible for this large increase in social services spending in Quebec.
38 PRODUCTIVITY AND PROSPERITY IN QUEBEC | 2013 OVERVIEW
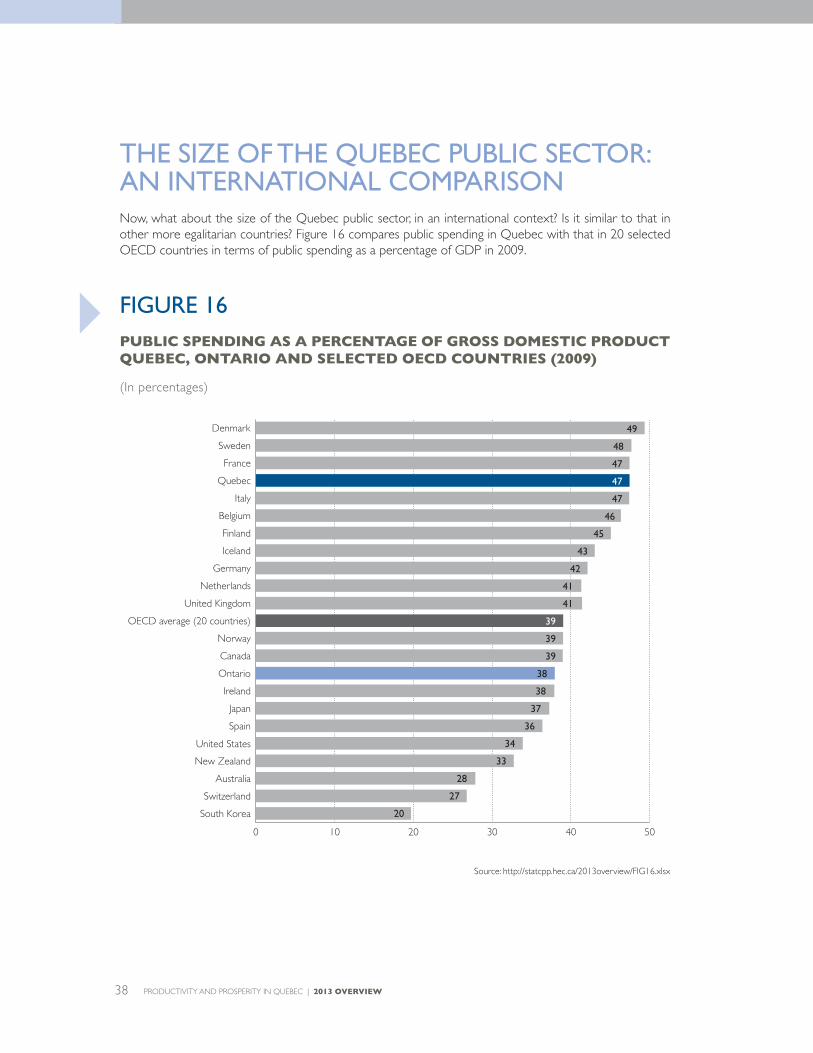
THE SIZE OF THE QUEBEC PUBLIC SECTOR: AN INTERNATIONAL COMPARISONNow, what about the size of the Quebec public sector, in an international context? Is it similar to that in other more egalitarian countries? Figure 16 compares public spending in Quebec with that in 20 selected OECD countries in terms of public spending as a percentage of GDP in 2009.
FIGURE 16PUBLIC SPENDING AS A PERCENTAGE OF GROSS DOMESTIC PRODUCT QUEBEC, ONTARIO AND SELECTED OECD COUNTRIES (2009)
(In percentages)
0 10 20 30 40 50
Denmark
Norway
Sweden
Finland
Belgium
Switzerland
Iceland
Quebec
France
Netherlands
Germany
Ireland
Spain
South Korea
Canada
Japan
New Zealand
Australia
Italy
United Kingdom
Ontario
United States
49
48
47
47
47
46
45
43
42
41
41
39
39
39
38
38
37
36
34
33
28
27
20
OECD average (20 countries)
Source: http://statcpp.hec.ca/2013overview/FIG16.xlsx

39PRODUCTIVITY AND PROSPERITY IN QUEBEC | 2013 OVERVIEW
Quebec, where public spending accounts for 47% of its GDP, ranks fourth, not far behind Denmark (49%) and Sweden (48%) and tied with France and Italy. This means that Quebec, even compared with many OECD countries, appears to have an especially large public sector. Public spending accounts for an even larger share of Quebec’s GDP than for Finland (45%), the Netherlands (41%) and Norway (39%), although they are all known for considerable government intervention in their economies. Overall, public spending as a percentage of GDP in Quebec is 1.2 times higher than the average for all the countries in our sample (39%).
In addition, Figure 16 shows that the Quebec government spends more, relative to its GDP, than the Canadian average (39%) and the United States (34%). In other words, public spending as a percentage of GDP in Quebec is 1.2 times higher than the Canadian average and 1.4 times higher than in the United States.
Although public spending accounts for a large share of Quebec’s GDP, Figure 17 does show that the level of per capita public spending in Quebec is lower than might be suggested by the figures expressing public spending as a percentage of GDP.
Public spending accounts for an even larger share of Quebec’s GDP than for Finland (45%), the Netherlands (41%) and Norway (39%), although they are all known for considerable government intervention in their economies.

40 PRODUCTIVITY AND PROSPERITY IN QUEBEC | 2013 OVERVIEW
FIGURE 17PUBLIC SPENDING AT PURCHASING POWER PARITY QUEBEC, ONTARIO AND SELECTED OECD COUNTRIES (2009)
(In 2009 Canadian dollars per capita)
0 5,000 10,000 15,000 20,000 25,000 30,000
25,533
22,658
21,304
20,334
20,314
19,263
19,227
19,212
19,073
18,422
18,132
17,997
17,927
17,521
17,521
17,206
16,891
14,940
14,130
13,940
13,582
11,828
6,304
Denmark
Norway
Sweden
Finland
Belgium
Switzerland
Iceland
Quebec
France
Netherlands
Germany
Ireland
Spain
South Korea
Canada
Japan
New Zealand
Australia
Italy
United Kingdom
Ontario
United States
OECD average (20 countries)
Source: http://statcpp.hec.ca/2013overview/FIG17.xlsx
Figure 17 shows that per capita public spending in Quebec, standing at $18,422, is lower than in Norway ($25,533), Denmark ($22,658), Sweden ($21,304), the Netherlands ($20,314), France ($19,227) and Finland ($19,212). It is higher in the United States ($19,073), in particular because of high military spending. Public spending in Quebec is about 5% higher (or $901 per capita) than the average for the 20 selected OECD countries and the Canadian average. Lastly, note that public spending in Quebec is also higher than in Italy ($18,132).

41PRODUCTIVITY AND PROSPERITY IN QUEBEC | 2013 OVERVIEW
This means that, when compared with many OECD countries, the portrait of public spending in Quebec is not as clear as it is in the Canadian context, where public spending as a percentage of GDP and per capita public spending are both higher.
To better understand the relative weight of the Quebec public sector from an international perspective, Figure 18 presents both of these indicators. More specifically, this figure explains the sources of the gap between the selected OECD countries and Quebec in terms of public spending as a percentage of GDP. Remember that the relative weight of public spending as a percentage of GDP in Quebec is one of the highest in our sample.
FIGURE 18GAP OBSERVED BETWEEN PUBLIC SPENDING AS A PERCENTAGE OF GROSS DOMESTIC PRODUCT (GDP) IN QUEBEC AND SELECTED OECD COUNTRIES (2009)
(In percentage points)
– 40
– 30
– 20
– 10
0
10
20
Sout
h Ko
rea
Switz
erla
nd
Aus
tral
ia
New
Zea
land
Uni
ted
Stat
es
Spai
n
Japa
n
Irela
nd
Can
ada
Nor
way
Uni
ted
King
dom
Net
herla
nds
Ger
man
y
Icel
and
Finl
and
Belg
ium
Italy
Fran
ce
Swed
en
Den
mar
k
OEC
D a
vg(2
0 co
untr
ies)
Gap attributable to per capita spendingGap attributable to per capita GDPGap in spending as a percentage of GDP, relative to Quebec
Source: http://statcpp.hec.ca/2013overview/FIG18.xlsx

42 PRODUCTIVITY AND PROSPERITY IN QUEBEC | 2013 OVERVIEW
First of all, this analysis shows that Quebec has a much larger public sector than the OECD average. Accordingly, public spending as a percentage of GDP is 8 percentage points higher in Quebec than the average of the selected OECD countries (represented by squares on the figure). This gap can be explained by Quebec’s higher per capita public spending (blue vertical line) and its lower standard of living (per capita GDP) (grey vertical line). Switzerland, Australia, Ireland, Canada, the United Kingdom and Germany are all in a similar situation. All these countries have lower public spending than Quebec and higher standards of living, which means that they devote a lesser share of their GDP to public spending.
Nevertheless, public spending as a percentage of GDP in Quebec is similar to that in Denmark and Sweden, although per capita public spending is far higher in those two countries. Because Quebec has a lower standard of living, its public sector uses a similar share of the economy’s financial resources to pay for its public spending.
There is a wide standard of living gap between Quebec and the United States, so much so that although Quebec public spending may be at a lower level than in the US, it represents a far larger proportion of its GDP. A full 13 percentage points separate the two in terms of public spending as a percentage of GDP. Much the same situation prevails for Finland, Iceland, the Netherlands and Norway.
Overall, what distinguishes the size of the Quebec public sector from the Canadian average is Quebec’s higher level of public spending, despite its more limited financial resources. The same is true when the size of the Quebec public sector is contrasted with the OECD average. Compared with the other countries in our sample, the level of public spending in Quebec is certainly not the highest but, given its more limited financial resources, public spending accounts for a larger share of its economy. Given the apparent disparity between Quebec’s collective wealth and its level of public spending, at least as compared with many OECD countries, we can conclude that, even when compared with a broader sample, Quebec stands out because of its large public sector. We can therefore expect the extent to which public administrations in Quebec have to use taxation in order to finance their spending to strongly reflect these conclusions.

43PRODUCTIVITY AND PROSPERITY IN QUEBEC | 2013 OVERVIEW
TAXATIONJust as for public spending, two indicators are used to describe taxation in the economy: total tax revenue as a percentage of GDP and total per capita tax revenue. On the one hand, total tax revenue as a percentage of GDP, also referred to here as the tax load, represents the percentage of the overall tax base (all revenue available in an economy as measured by GDP) that the government collects through taxation. This indicator reflects the pressure exerted by taxes on the entire economy or the extent of taxation. On the other hand, per capita tax revenue reflects the overall tax burden on an economy regardless of its size.
Our taxation analysis starts with Figure 19, which compares, for 2009, total tax revenue as a percentage of GDP in Quebec, Ontario and the 20 OECD countries selected for this analysis.
Compared with neighbouring economies, Quebec has a much higher tax load – 1.11 times higher than Ontario, 1.15 times higher than the Canadian average and 1.61 times higher than the United States.

44 PRODUCTIVITY AND PROSPERITY IN QUEBEC | 2013 OVERVIEW
FIGURE 19TOTAL TAX REVENUE AS A PERCENTAGE OF GDP QUEBEC, ONTARIO AND SELECTED OECD COUNTRIES (2009)
(In percentages)
0 5 10 15 20 25 30 35 40 45 50
Denmark
Norway
Sweden
Finland
Belgium
Switzerland
Iceland
Quebec
France
Netherlands
Germany
Ireland
Spain
South Korea
Canada
Japan
New Zealand
Australia
Italy
United Kingdom
Ontario
United States
37.5
38.2
37.3
33.9
33.7
31.4
33.8
32.5
30.9
28.7
27.6
27.1
25.8
25.5
23.2
42.0
42.5
42.8
43.0
43.1
46.6
47.8
Source: http://statcpp.hec.ca/2013overview/FIG19.xlsx
This figure shows that in 2009 the total tax revenue of public administrations in Quebec stood at approximately $114 billion and represented 37.5% of the province’s GDP, putting it in 9th place in this ranking. Remember that Quebec public spending represented 47% of its GDP – in other words, other sources of revenue (user fees, for instance) account for a non-negligible share of its public finances. It is not surprising, given the size of their public sectors, that the Scandinavian countries – Denmark (47.8%), Sweden (46.6%), Finland (42.8%) and Norway (42.0%) – and the Netherlands (38.2%) have high taxes. Finally, compared with neighbouring economies, Quebec has a much higher tax load – 1.11 times higher than Ontario (33.7%), about 1.15 times higher than the Canadian average (32.5%) and about 1.61 times higher than the United States (23.2%).

45PRODUCTIVITY AND PROSPERITY IN QUEBEC | 2013 OVERVIEW
Figure 20 presents another picture of taxation in Quebec, however, examining it from the perspective of total per capita tax revenue.
FIGURE 20PER CAPITA TAX REVENUE AT PURCHASING POWER PARITY QUEBEC, ONTARIO AND SELECTED OECD COUNTRIES (2009)
(In 2009 Canadian dollars)
0 5,000 10,000 15,000 20,000 25,000 30,000
Denmark
Norway
Sweden
Finland
Belgium
Switzerland
Iceland
Quebec
France
Netherlands
Germany
Ireland
Spain
South Korea
Canada
Japan
New Zealand
Australia
Italy
United Kingdom
Ontario
United States
16,039
16,627
15,937
15,168
14,743
14,087
15,006
14,608
13,108
13,076
12,572
11,850
11,358
10,286
8,168
17,208
18,263
18,799
18,906
20,803
21,936
27,598
Source: http://statcpp.hec.ca/2013overview/FIG20.xlsx
With per capita tax revenue of $14,608, Quebec ranks 14th, just behind Ontario ($15,006) and Canada as a whole ($14,743). In comparison with the United States, taxes are high in Quebec, i.e. $1,532 (12%) more per capita. Lastly, it can be seen that the overall tax burden in the Scandinavian countries is particularly heavy, at least as compared with Quebec. For instance, it is $27,598 per capita in Norway, or almost double that in Quebec. In Denmark, Sweden and Finland, it is $7,328, $6,195 and $3,656 higher than in Quebec.

46 PRODUCTIVITY AND PROSPERITY IN QUEBEC | 2013 OVERVIEW
Considered jointly, these two indicators sometimes give a clouded picture of reliance on taxation. Per capita tax revenue in Quebec as compared with that in certain OECD countries does not seem to adequately reflect its tax load. Figure 21 illustrates taxation in Quebec by decomposing the gap between the tax load in Quebec and the selected OECD countries.
Generally speaking, the approach in this figure assumes that two factors determine the tax load. On the one hand, it depends on per capita tax revenue. In other words, the higher the per capita tax revenue, the more pressure taxation puts on the economy. On the other hand, a society that generates plenty of wealth will be able to offset this load. An economy with a higher standard of living will have a lower tax load than other countries with the same per capita tax revenue.
When we use this approach for comparison purposes, as in Figure 21, it gives rise to some very interesting observations. Before continuing with this analysis, however, we will use Quebec’s situation relative to Germany as a means of explaining this figure. In keeping with what we saw in Figure 19, the tax load in Quebec (37.5% of GDP) is almost identical to that in Germany (37.3% of GDP). The gap, represented in this case by a blue square, is 0. If we refer to Figure 20, though, we can see that per capita tax revenue is higher in Germany ($15,937) than in Quebec ($14,608). In other words, the tax load in the two economies is identical, despite higher overall tax revenue in Germany. This apparent distortion between the tax load and relative per capita tax revenue is explained by Germany’s higher standard of living. In graphic terms, we can see that the effect of tax revenue (blue line) is greater than zero, which illustrates the higher per capita tax revenue in Germany. On the other hand, the effect of relative wealth is negative (grey line), indicating that the standard of living in Germany is higher. Considered together, these two effects cancel each other out, so that in the end the tax load in these two economies is identical. In other words, the effect of Germany’s higher taxation is offset by its greater wealth.
Now, if we look at Figure 21 as a whole, we can see that countries with a heavier tax load than in Quebec are all on the right-hand side, while those where the tax load is lighter are on the left-hand side.
It can immediately be seen that there is a common denominator among those countries where the tax load is heavier than in Quebec. While, on the one hand, per capita tax revenue is higher in all cases, they all have higher standards of living than Quebec. In other words, they enjoy a higher standard of living that offsets the effect of their higher per capita tax revenue. On the other hand, it is no surprise to see that those countries where the tax load is lighter than in Quebec almost always have lower per capita tax revenue. For instance, the United States has lower per capita tax revenue than Quebec and a higher standard of living. Taken together, these two effects mean that the tax load is much lighter there than in Quebec.

47PRODUCTIVITY AND PROSPERITY IN QUEBEC | 2013 OVERVIEW
FIGURE 21GAP BETWEEN THE TAX LOAD AS A PERCENTAGE OF GDP IN QUEBEC AND IN THE 20 SELECTED OECD COUNTRIES (2009)
(In percentage points)
– 25
– 20
– 15
– 10
– 5
0
5
10
15
20
25
30
Uni
ted
Stat
es
Sout
h Ko
rea
Aus
tral
ia
Japa
n
Irela
nd
Switz
erla
nd
Spai
n
New
Zea
land
Can
ada
Uni
ted
King
dom
Icel
and
Ger
man
y
Net
herla
nds
Nor
way
Fran
ce
Finl
and
Italy
Belg
ium
Swed
en
Den
mar
k
Effect of tax revenue (per capita)Effect of relative wealth (per capita GDP)Relative gap in tax load
Source: http://statcpp.hec.ca/2013overview/FIG21.xlsx
Figure 22 shows a similar analysis, but this time comparing Quebec with the other provinces and Canada as a whole. Quebec’s low standard of living contributes to a large extent to the relative gap in the tax load with the other Canadian provinces. In 2009, it was mainly the effect of relative wealth that explained this gap with the large Canadian provinces. In other words, the tax load is heavier in Quebec not necessarily because per capita tax revenue is higher, but because Quebec is poorer. This observation is even clearer when Quebec is compared with Canada overall: it can be seen that the effect of wealth explains almost all of the relative gap in the tax load, with the effect of per capita tax revenue very close to zero.
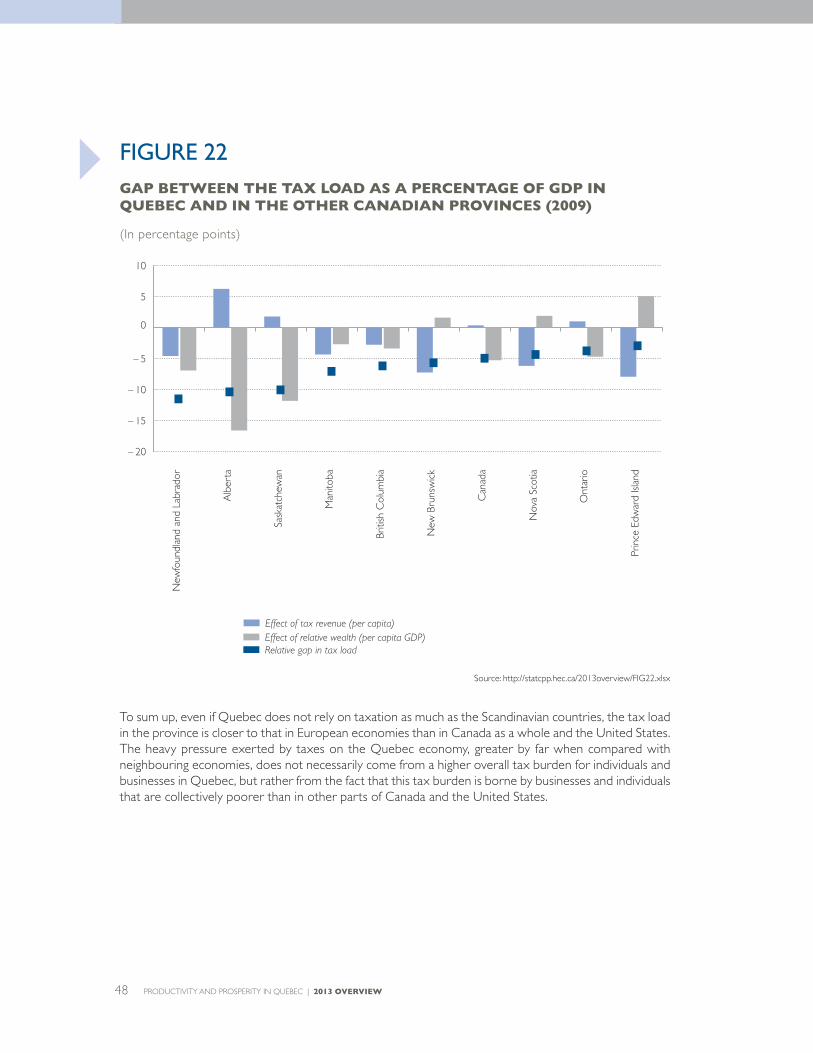
48 PRODUCTIVITY AND PROSPERITY IN QUEBEC | 2013 OVERVIEW
FIGURE 22GAP BETWEEN THE TAX LOAD AS A PERCENTAGE OF GDP IN QUEBEC AND IN THE OTHER CANADIAN PROVINCES (2009)
(In percentage points)
– 20
– 15
– 10
– 5
0
5
10
Can
ada
New
foun
dlan
d an
d La
brad
or
Sask
atch
ewan
New
Bru
nsw
ick
Nov
a Sc
otia
Prin
ce E
dwar
d Isl
and
Briti
sh C
olum
bia
Ont
ario
Alb
erta
Man
itoba
Effect of tax revenue (per capita)Effect of relative wealth (per capita GDP)Relative gap in tax load
Source: http://statcpp.hec.ca/2013overview/FIG22.xlsx
To sum up, even if Quebec does not rely on taxation as much as the Scandinavian countries, the tax load in the province is closer to that in European economies than in Canada as a whole and the United States. The heavy pressure exerted by taxes on the Quebec economy, greater by far when compared with neighbouring economies, does not necessarily come from a higher overall tax burden for individuals and businesses in Quebec, but rather from the fact that this tax burden is borne by businesses and individuals that are collectively poorer than in other parts of Canada and the United States.

49PRODUCTIVITY AND PROSPERITY IN QUEBEC | 2013 OVERVIEW
THE STRUCTURE OF TAXATIONIn comparison with its neighbours, Quebec taxes its citizens much more heavily. But how is that taxation structured? The government collects its tax revenue by means of many tax tools, all acknowledged to hamper economic growth, but to different degrees – as the analysis by the OECD explains (see The impact of tax on economic growth, p. 52). Figure 23 gives an idea of the extent to which Quebec, Ontario and the 20 selected OECD countries each use these tax tools to collect the tax revenue they need to pay for their public spending.
FIGURE 23TAXATION STRUCTURE BY MAIN TAX TOOLS QUEBEC, ONTARIO AND SELECTED OECD COUNTRIES (2009)
(In percentages)
0 20 40 60 80 100
Denmark
Norway
Sweden
Finland
Belgium
Switzerland
Iceland
Quebec
France
Netherlands
Germany
Ireland
Spain
South Korea
Canada
Japan
New Zealand
Australia
Italy
United Kingdom
Ontario
United States
Personal income tax Consumption taxes
Corporate income tax
Payroll taxes
Property taxes Other
Source: http://statcpp.hec.ca/2013overview/FIG23.xlsx

50 PRODUCTIVITY AND PROSPERITY IN QUEBEC | 2013 OVERVIEW
Taxes in Quebec are structured in much the same way as in neighbouring economies. However, the Quebec government, like its Ontario and Canadian counterparts, collects more of its tax revenue from consumption taxes (18.8%) than does the United States (12.6%). In addition, property taxes, very common in North American economies, account for 9.5% of Quebec’s tax revenue, or slightly less than the average in Canada as a whole (10.3%), Ontario (11.8%) and the United States (13.5%).
In comparison with certain European countries recognized for their economic performance, Quebec relies to a greater extent on the tax tools considered the most harmful to economic growth. For instance, in Quebec, 43.3% of government tax revenue comes from income tax, specifically personal income tax (34.2%) and corporate income tax (9.1%). In comparison, income tax represents 36% of tax revenue in Finland, 35% in Sweden and 28% in the Netherlands. Some countries are exceptions, like Denmark (55% of government tax revenue comes from personal income tax) and Norway (21% of government tax revenue comes from corporate income tax). However, all these countries have one thing in common: high consumption taxes. In fact, consumption taxes account for over one-quarter of government tax revenue in these countries (up to 29% in Denmark) as opposed to just 18.8% in Quebec.
It must be admitted that the weight and structure of taxation in Quebec are not ideal. The tax revenue collected by the government represents a large share of Quebec’s tax base, and while that share is similar to the proportion collected in European economies, it remains much higher than that in neighbouring economies. In addition, Quebec makes more use of the tax tools considered among the most harmful to economic growth. The province has two ways to remedy this situation: either change its taxation structure, which currently hinders its economic growth, or reduce the tax load to a level comparable with that in neighbouring economies, without changing its structure.
Restructuring its taxation, with the main goal of replacing income tax with other, less-harmful tools such as consumption and property taxes, may appear to be the best option for Quebec. But we have seen that the province has little room to manoeuvre if it wishes to undertake this kind of restructuring. Relying too heavily on any one tax tool, even if it does less to impede economic growth, can harm an economy’s tax competitiveness. Quebec cannot afford to have a taxation structure too different from the North American norm if it is not to jeopardize its future growth.
Given that Quebec’s taxation structure is currently similar to that in Ontario, the rest of Canada and the United States, the only possible avenue seems to be to reduce the tax load to a level comparable with the rest of North America, by reducing the amount of tax levied.

51PRODUCTIVITY AND PROSPERITY IN QUEBEC | 2013 OVERVIEW
So what can we conclude from this section? We have seen that the rising expenditures by the provincial government and, more specifically, social services spending over the past few decades, represent the main cause of the current size of the Quebec public sector, which is larger than elsewhere in Canada. This situation is not only because the Quebec government spends more, but also because the province has more limited financial capacity. This observation is confirmed when one looks at many OECD countries where public spending exceeds that in Quebec but the standard of living is also much higher and can bear these costs. This is the case in particular for Norway, Belgium, the Netherlands, the United States, Iceland and Finland. The Quebec government is not the most spendthrift, but given the size of its economy, public spending eats up a large share of its GDP.
And since Quebec taxes like a North American government and spends like a European one, it is no surprise to find that taxation weighs heavily on its economy. Note that the overall tax burden borne by businesses and individuals in Quebec is not necessarily higher than elsewhere. It is rather Quebec’s low standard of living that results in the heavy tax pressure on its entire economy. In addition to maintaining a tax load far heavier than in neighbouring economies, but comparable with that in European economies, the Quebec government is making widespread use of the tax tools recognized as the most harmful to economic growth (income tax) to raise its tax revenue. In this context, the status quo is untenable.
However, since Quebec’s tax structure is similar to that of its neighbouring economies, it would be difficult for the province to reform its taxation by replacing income taxes with other, less-harmful tax tools – consumption and property taxes – without damaging the tax competitiveness of its economy.
In light of this analysis, the conclusion is clear: the Quebec government has few options if it wants the province to continue to be socially egalitarian without jeopardizing its economic growth. Only by reducing its tax load can it prevent taxation from stifling its development. And if, in the meantime, Quebec wishes to maintain the current level of public spending, it seems inevitable that it will have to rely more on user fees for public services.

52
THE IMPACT OF TAX ON ECONOMIC GROWTHIn its analysis entitled Tax and Economic Growth,9 the OECD ranks tax tools according to their impact on productivity and economic growth. The study identifies corporate income tax as being the most harmful, followed by personal income tax, consumption taxes and finally property taxes. Although each of these tax tools has an adverse impact on economic growth, heavier reliance on some of them, such as consumption and property taxes, makes it possible to limit the damage.
An analysis by the Quebec Department of Finance, measuring the long-term impact of higher taxes on real GDP, supports this conclusion. As the figure below suggests, a $1 billion increase in corporate income tax results in a $0.89 billion reduction in real GDP over the long term. This reduction is $0.76 billion if the increase applies to personal income tax, $0.41 billion if it applies to user fees for public services and just $0.28 billion if it is realized through consumption taxes.
FIGURE 24LONG-TERM IMPACT ON QUEBEC GDP OF A $1 BILLION INCREASE IN TAXES AND USER FEES
(In $billions)
– 0.89
– 0.76
– 0.41
– 0.28
Corporate income tax Personal income tax User fees Consumption taxes– 1.0
– 0.8
– 0.6
– 0.4
– 0.2
0.0
Source: http://statcpp.hec.ca/2013overview/FIG24.xlsx
9 Johansson, A. et al. (2008), Tax and Economic Growth, OECD Economics Department Working Papers, No. 620, OECD editions.
PRODUCTIVITY AND PROSPERITY IN QUEBEC | 2013 OVERVIEW

53
According to these analyses, a reliance on income taxes has a negative long-term effect on the economy, because these tax tools, unlike consumption tax and property taxes, penalize the sources of productivity and economic growth. Corporate income tax reduces the return on investment, and personal income tax negatively affects workers’ behaviour. In other words, these forms of income tax discourage businesses from investing and workers from working.
According to analyses by the OECD and the Quebec Department of Finance, a reliance on income tax has a negative long-term effect on the economy, because these tax tools, unlike consumption taxes and property taxes, penalize the sources of productivity and economic growth.
PRODUCTIVITY AND PROSPERITY IN QUEBEC | 2013 OVERVIEW

section 3
EXAMINING INVESTMENT IN QUEBEC

This third section looks at investment,10 another important component of overall spending in an economy. By way of example, investment spending in Quebec in 2012 represented approximately 24% of the province’s gross domestic product.
As Diagram 2 shows, investment spending in Quebec, estimated at $80.4 billion in 2012, came mainly from the business sector. Private-sector investment accounted for over three-quarters (76%) of total investment spending, while public-sector investment made up 23% of the total. The other, essentially negligible amount, slightly less than 1% of total investment spending in Quebec, came from non-profit institutions serving households.
We also see that close to half of all private investment, i.e. 34% of the total, went to construction and major renovation of dwellings (investment spending on residential structures). The remaining private investment was split between spending on non-residential structures (20%) and spending on machinery and equipment (22%). Investment spending on non-residential structures includes construction and major renovation of industrial, commercial and institutional buildings and other infrastructure financed by the private sector, such as roads and energy infrastructure. Investment spending on machinery and equipment includes “capital expenditures on durable, tangible goods with an expected service life of one year or more,”11 such as industrial machinery, agricultural machinery, furniture, office equipment, software, transportation equipment, telecommunications equipment, etc.
55
10 In this section, we use gross fixed capital formation to measure investment.11 Statistics Canada. National Economic Accounts Glossary. http://www.statcan.gc.ca/nea-cen/gloss/index-eng.htm
PRODUCTIVITY AND PROSPERITY IN QUEBEC | 2013 OVERVIEW
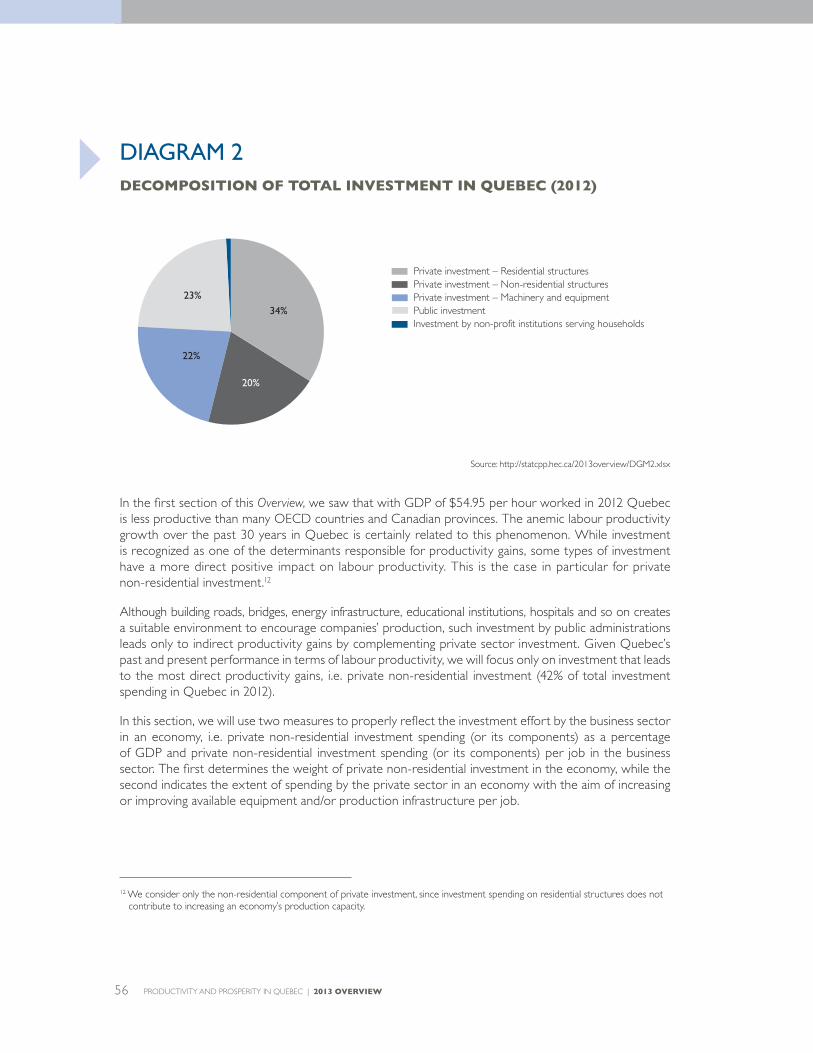
56 PRODUCTIVITY AND PROSPERITY IN QUEBEC | 2013 OVERVIEW
DIAGRAM 2DECOMPOSITION OF TOTAL INVESTMENT IN QUEBEC (2012)
34%
20%
22%
23%
Private investment – Residential structuresPrivate investment – Non-residential structuresPrivate investment – Machinery and equipmentPublic investmentInvestment by non-profit institutions serving households
Source: http://statcpp.hec.ca/2013overview/DGM2.xlsx
In the first section of this Overview, we saw that with GDP of $54.95 per hour worked in 2012 Quebec is less productive than many OECD countries and Canadian provinces. The anemic labour productivity growth over the past 30 years in Quebec is certainly related to this phenomenon. While investment is recognized as one of the determinants responsible for productivity gains, some types of investment have a more direct positive impact on labour productivity. This is the case in particular for private non-residential investment.12
Although building roads, bridges, energy infrastructure, educational institutions, hospitals and so on creates a suitable environment to encourage companies’ production, such investment by public administrations leads only to indirect productivity gains by complementing private sector investment. Given Quebec’s past and present performance in terms of labour productivity, we will focus only on investment that leads to the most direct productivity gains, i.e. private non-residential investment (42% of total investment spending in Quebec in 2012).
In this section, we will use two measures to properly reflect the investment effort by the business sector in an economy, i.e. private non-residential investment spending (or its components) as a percentage of GDP and private non-residential investment spending (or its components) per job in the business sector. The first determines the weight of private non-residential investment in the economy, while the second indicates the extent of spending by the private sector in an economy with the aim of increasing or improving available equipment and/or production infrastructure per job.
12 We consider only the non-residential component of private investment, since investment spending on residential structures does not contribute to increasing an economy’s production capacity.
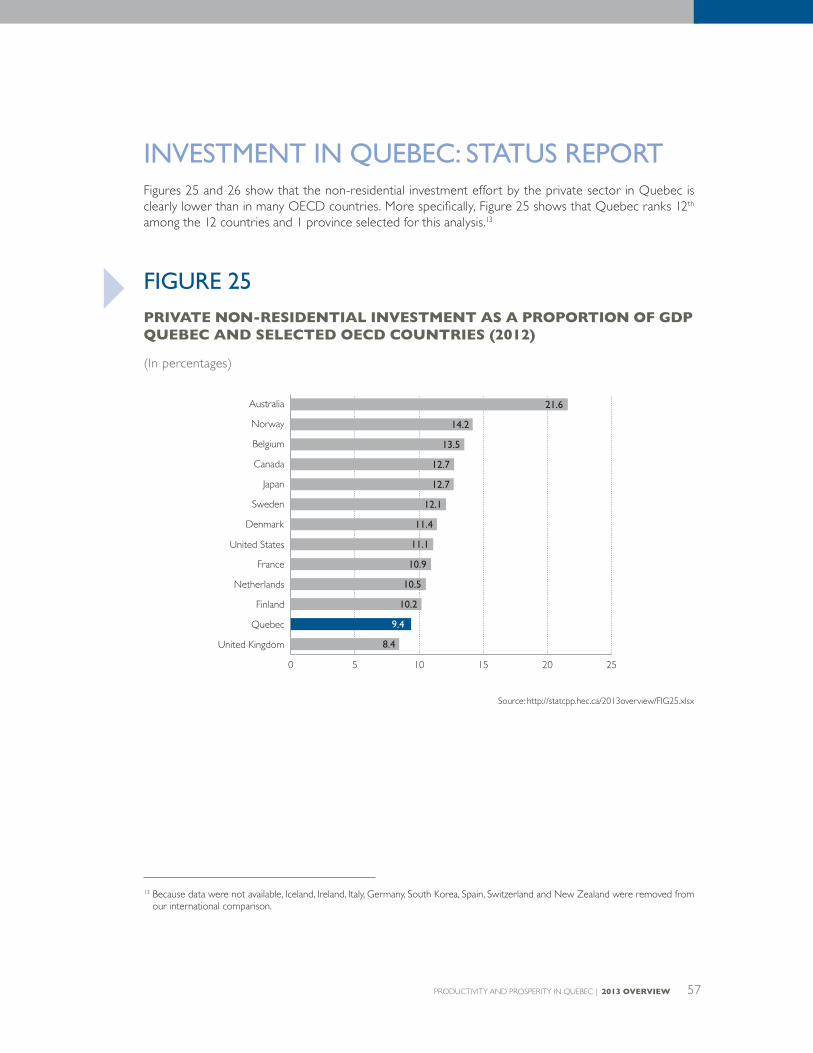
57PRODUCTIVITY AND PROSPERITY IN QUEBEC | 2013 OVERVIEW
INVESTMENT IN QUEBEC: STATUS REPORTFigures 25 and 26 show that the non-residential investment effort by the private sector in Quebec is clearly lower than in many OECD countries. More specifically, Figure 25 shows that Quebec ranks 12th among the 12 countries and 1 province selected for this analysis.13
FIGURE 25PRIVATE NON-RESIDENTIAL INVESTMENT AS A PROPORTION OF GDP QUEBEC AND SELECTED OECD COUNTRIES (2012)
(In percentages)
0 5 10 15 20 25
21.6
14.2
13.5
12.7
12.7
12.1
11.4
11.1
10.9
10.5
10.2
9.4
8.4
Denmark
Norway
Sweden
Finland
Belgium
Quebec
France
Netherlands
Canada
Australia
United Kingdom
United States
Japan
Source: http://statcpp.hec.ca/2013overview/FIG25.xlsx
13 Because data were not available, Iceland, Ireland, Italy, Germany, South Korea, Spain, Switzerland and New Zealand were removed from our international comparison.

58 PRODUCTIVITY AND PROSPERITY IN QUEBEC | 2013 OVERVIEW
This figure shows that in 2012 the business sector in Quebec invested $33.55 billion in non-residential structures and in machinery and equipment, for the equivalent of 9.4% of GDP. This low non-residential private investment as a proportion of GDP places Quebec near the bottom of the list, just ahead of the United Kingdom (8.4%). All the other selected countries lead the province, in Australia’s case by more than double (21.6%). The weight of private non-residential investment in the Canadian economy (12.7%) is 1.36 times higher than in Quebec. This means that, with the exception of the United Kingdom, all these countries invested more as a proportion of their GDP than Quebec in 2012, regardless of their labour productivity.
Figure 26, which ranks Quebec and the selected OECD countries by private non-residential investment per job, confirms that the private sector in the province lags in terms of investment.
FIGURE 26PRIVATE NON-RESIDENTIAL INVESTMENT PER JOB AT PURCHASING POWER PARITY QUEBEC AND SELECTED OECD COUNTRIES (2012)
(In 2012 Canadian dollars per job)
0 5,000 10,000 15,000 20,000 25,000 30,000 35,000
10,456
10,736
12,150
12,197
14,325
15,188
16,349
16,897
18,202
18,405
19,791
26,718
32,335
Denmark
Norway
Sweden
Finland
Belgium
Quebec
France
Netherlands
Canada
Australia
United Kingdom
United States
Japan
Source: http://statcpp.hec.ca/2013overview/FIG26.xlsx

59PRODUCTIVITY AND PROSPERITY IN QUEBEC | 2013 OVERVIEW
Quebec is in the same position as in the previous figure, with private non-residential investment of $10,736 per job. In this ranking, the province once again leads only the United Kingdom (at $10,456 per job), by $280 or 2.7%. This analysis shows not only that Quebec trails the others in our ranking but lags quite far behind the countries ahead of it. For example, the Netherlands, just one position ahead of Quebec, reported private non-residential investment spending 13% higher, for a total of $12,150 per job. Measured per job, private non-residential investment in Australia and Norway in fact is more than twice as high as in Quebec. Finally, private non-residential investment in Canada as a whole amounts to $16,349 per job, or 52% higher than in Quebec.
In other words, whether private non-residential investment is measured as a proportion of GDP or per job, Quebec stands out for the weak investment effort by its private sector, at least in comparison with the selected OECD countries.
Figures 27 and 28 illustrate a similar analysis in comparison with the rest of Canada. In addition, the figures show trends in these two investment indicators in Quebec, Ontario, on average in Canada and on average in the Canadian provinces where natural resource extraction (natural gas and oil) is the main industry, i.e. Alberta, Saskatchewan and Newfoundland and Labrador.
Overall, Figure 27 shows that private non-residential investment as a proportion of GDP fell throughout Canada between 1981 and 2012. Nonetheless, since 1992 this kind of investment has climbed, on average, in Alberta, Saskatchewan and Newfoundland and Labrador and on average in Canada, while in Quebec, and mainly in Ontario, the weight of private non-residential investment continued to shrink – from 11.8% to 9.4% in Quebec, representing a 20% decline over this period. At the same time, it shrank by 32% in Ontario, by 19% in Canada as a whole and by 3% in the three selected provinces. The less marked decline in investment in Quebec than in Ontario between 1981 and 2012 suggests that the relative situation in Quebec was improving. Indeed, in 2012, the proportion of private non-residential investment in GDP in Quebec was even ahead of that in Ontario (8.4%), but still far behind that in Canada as a whole (12.7%) and in Alberta, Saskatchewan and Newfoundland and Labrador (23.1%).
Internationally, Quebec stands out because of the low investment effort by its private sector.

60 PRODUCTIVITY AND PROSPERITY IN QUEBEC | 2013 OVERVIEW
FIGURE 27PRIVATE NON-RESIDENTIAL INVESTMENT AS A PROPORTION OF GDP QUEBEC, ONTARIO, ALBERTA-SASKATCHEWAN-NEWFOUNDLAND AND LABRADOR AND CANADA AS A WHOLE (1981-2012)
(In percentages)
6
8
10
12
14
16
18
20
22
24
26
Quebec Ontario CanadaAlberta–Saskatchewan–Newfoundland and Labrador
1989
1990
1991
1992
1993
1994
1995
1996
1981
1982
1983
1984
1985
1986
1987
1988
1997
1998
1999
2000
2001
2002
2003
2004
2005
2006
2007
2008
2009
2010
2011
2012
Source: http://statcpp.hec.ca/2013overview/FIG27.xlsx
Figure 28 shows that, despite an overall reduction in the weight of private non-residential investment in its economy over the past 30 years, Quebec saw a slight improvement in the level of private non-residential investment between 198414 and 2012: up from $9,530 per job in 1984 to $10,736 in 2012, for 13% growth over three decades. In other words, the private sector in Quebec is now investing $1,206 more per job in production equipment and infrastructure than it was 30 years ago. The same applies for Ontario, with 10.7% growth over this period, reaching a level of $10,083 per job in private non-residential investment in 2012, slightly lower than in Quebec. Nonetheless, there was a strong advance over this same period in private non-residential investment per job on average in Canada (37%) and on average in Alberta, Saskatchewan and Newfoundland and Labrador (95%). As a result, the level of private non-residential investment per job in Quebec remains lower than that in Canada and the three selected provinces. In 2012, it stood at $16,349 per job in Canada (52% more than in Quebec) and $41,120 (more than triple) on average in Alberta, Saskatchewan and Newfoundland and Labrador.
14 The employment data series do not start until 1984.

61PRODUCTIVITY AND PROSPERITY IN QUEBEC | 2013 OVERVIEW
FIGURE 28PRIVATE NON-RESIDENTIAL INVESTMENT PER JOB QUEBEC, ONTARIO, ALBERTA-SASKATCHEWAN-NEWFOUNDLAND AND LABRADOR AND CANADA AS A WHOLE (1984-2012)
(In 2012 Canadian dollars)
7,50010,00012,50015,00017,50020,00022,50025,00027,50030,00032,50035,00037,50040,00042,500
Quebec Ontario CanadaAlberta–Saskatchewan–Newfoundland and Labrador
1989
1990
1991
1992
1993
1994
1995
1996
1984
1985
1986
1987
1988
1997
1998
1999
2000
2001
2002
2003
2004
2005
2006
2007
2008
2009
2010
2011
2012
Source: http://statcpp.hec.ca/2013overview/FIG28.xlsx
Although the weight of private non-residential investment in the Quebec economy has fallen over the past 30 years, in 2012 Quebec firms invested more in production equipment and infrastructure per job than they did in 1984. This additional amount proves negligible, however, when compared with that in Canada as a whole or in Alberta, Saskatchewan and Newfoundland and Labrador. The investment effort by the private sector in Canada and on average in the three selected provinces remains greater than in Quebec, while investment in Quebec and Ontario remains similar.
62 PRODUCTIVITY AND PROSPERITY IN QUEBEC | 2013 OVERVIEW
THE COMPONENTS OF PRIVATE NON-RESIDENTIAL INVESTMENT IN QUEBECAs we mentioned earlier, private non-residential investment includes investment spending on non-residential structures and investment spending on machinery and equipment. These two components stimulate economic growth through productivity gains, but to varying degrees. Although non-residential structures (industrial, commercial and institutional buildings and other infrastructure) are necessary for proper business operations, better and more buildings lead only to limited productivity gains. Rather, it is the improvement and increase in available production equipment (measured by investment in machinery and equipment), such as industrial machinery, office equipment, software, transportation equipment, etc., that leads to direct improvement in workers’ output and hence in labour productivity.
We will continue our analysis of private non-residential investment by distinguishing between these two types of investment. First of all, with the help of Figures 29 and 30, we will examine private investment in non-residential structures.
A closer look at Figure 29 shows that private investment in non-residential structures fell everywhere in Canada between 1981 and the early 1990s and then rose until 2012. However, although private investment in non-residential structures as a proportion of GDP more than doubled on average over this period in Alberta, Saskatchewan and Newfoundland and Labrador and almost doubled on average in Canada as a whole, there was a much smaller improvement in Quebec. More specifically, private investment in non-residential structures as a proportion of GDP in Quebec rose by 20% between 1992 and 2012 to reach 4.5%, or 1.6 times less than in Canada (7.2%) and 3.6 times less than in the three selected provinces (16.2%). Despite this increase, Quebec was unable to make up the ground lost in the 1980s, and so private investment in non-residential structures as a proportion of Quebec’s GDP is lower now than in 1981 (5.4%). The same observation applies for the business sector in Ontario, which in 2012 was still investing less in non-residential structures as a proportion of GDP than in Quebec.

63PRODUCTIVITY AND PROSPERITY IN QUEBEC | 2013 OVERVIEW
FIGURE 29PRIVATE INVESTMENT IN NON-RESIDENTIAL STRUCTURES AS A PROPORTION OF GDP – QUEBEC, ONTARIO, ALBERTA-SASKATCHEWAN-NEWFOUNDLAND AND LABRADOR AND CANADA AS A WHOLE (1981-2012)
(In percentages)
0
2
4
6
8
10
12
14
16
18
Quebec Ontario CanadaAlberta–Saskatchewan–Newfoundland and Labrador
1989
1990
1991
1992
1993
1994
1995
1996
1981
1982
1983
1984
1985
1986
1987
1988
1997
1998
1999
2000
2001
2002
2003
2004
2005
2006
2007
2008
2009
2010
2011
2012
Source: http://statcpp.hec.ca/2013overview/FIG29.xlsx
Trends in this form of investment as a proportion of GDP, as described earlier, led to an overall increase in private investment in non-residential structures throughout Canada from 1984 to 2012, as Figure 30 shows. Private investment in non-residential structures in Quebec rose from $3,694 per job in 1984 to $5,103 per job in 2012, for a 38% increase. The faster growth observed on average in Canada (59%) and on average in Alberta, Saskatchewan and Newfoundland and Labrador (more than double), combined with a lower level per job in Quebec in 1984, widened the gap at Quebec’s expense over this period. As a result, in 2012, private investment in non-residential structures in Quebec was 1.8 times lower than in Canada ($9,284 per job) and 5.7 times lower than in the other three selected Canadian provinces ($28,903 per job). The slower growth of this kind of investment in Ontario (12%), combined with the province’s lacklustre performance since 1984, explains its current position behind Quebec. In 2012, private investment in non-residential structures in Quebec was 1.34 times greater than in Ontario ($3,805 per job).

64 PRODUCTIVITY AND PROSPERITY IN QUEBEC | 2013 OVERVIEW
FIGURE 30PRIVATE INVESTMENT IN NON-RESIDENTIAL STRUCTURES PER JOB QUEBEC, ONTARIO, ALBERTA-SASKATCHEWAN-NEWFOUNDLAND AND LABRADOR AND CANADA AS A WHOLE (1984-2012)
(In 2012 Canadian dollars)
0
5,000
10,000
15,000
20,000
25,000
30,000
35,000
Quebec Ontario CanadaAlberta–Saskatchewan–Newfoundland and Labrador
1989
1990
1991
1992
1993
1994
1995
1996
1984
1985
1986
1987
1988
1997
1998
1999
2000
2001
2002
2003
2004
2005
2006
2007
2008
2009
2010
2011
2012
Source: http://statcpp.hec.ca/2013overview/FIG30.xlsx
Despite a decrease in the weight of private investment in non-residential structures in the Quebec economy, this type of investment still grew per job over the past 30 years. Nevertheless, the investment effort by the business sector in non-residential structures in Quebec remains lower than in Canada as a whole and in the three other selected provinces, albeit slightly higher than in Ontario.
The following figures illustrate trends in private investment in machinery and equipment, recognized as the type of investment that stimulates labour productivity to a greater extent, and more directly. Figure 31 depicts trends in private investment in machinery and equipment as a proportion of GDP between 1981 and 2012.
The exercise shows that in Quebec private investment in machinery and equipment represented 6.4% of its GDP in 1981, or about 1.2 times less than in Ontario (7.8%) and Canada as a whole (7.9%) and about 1.4 times less, on average, than in Alberta, Saskatchewan and Newfoundland and Labrador (8.9%). In subsequent years, and up until the late 1990s, the many large fluctuations observed throughout Canada caused the gap between Quebec and the rest of Canada to shrink somewhat. This change in the weight of private investment in machinery and equipment in the Quebec economy led to an overall 27% increase, reaching a new peak of 8.2% in 1999.

65PRODUCTIVITY AND PROSPERITY IN QUEBEC | 2013 OVERVIEW
FIGURE 31PRIVATE INVESTMENT IN MACHINERY AND EQUIPMENT AS A PROPORTION OF GDP – QUEBEC, ONTARIO, ALBERTA-SASKATCHEWAN-NEWFOUNDLAND AND LABRADOR AND CANADA AS A WHOLE (1981-2012)
(In percentages)
0
2
4
6
8
10
Quebec Ontario CanadaAlberta–Saskatchewan–Newfoundland and Labrador
1989
1990
1991
1992
1993
1994
1995
1996
1981
1982
1983
1984
1985
1986
1987
1988
1997
1998
1999
2000
2001
2002
2003
2004
2005
2006
2007
2008
2009
2010
2011
2012
Source: http://statcpp.hec.ca/2013overview/FIG31.xlsx
Since 1999, however, the weight of private investment in machinery and equipment in the Quebec economy has been plummeting. In a dozen years, it fell by 40%, so that by 2012 private investment in machinery and equipment represented only 4.9% of GDP. Although less pronounced than in Quebec, there was also a substantial downward trend elsewhere in Canada after 1999. As a result, in 2012, the weight of private investment in machinery and equipment as a proportion of GDP was 5.2% in Ontario, 5.5% for Canada as a whole and 6.9% for Alberta, Saskatchewan and Newfoundland and Labrador.
When measured on a per-job basis, as Figure 32 shows, private investment in machinery and equipment rose in the 1980s and 1990s in Quebec. Overall, between 1984 and 1999, this type of investment climbed by 51%, peaking at $8,796 per job in 1999. Over this same period, however, there was more growth in Ontario (58%), Canada as a whole (53%) and on average in the selected Canadian provinces (77%). As a result, in 1999, private investment in machinery and equipment was slightly higher in Ontario ($9,030 per job) and Canada as a whole ($9,316 per job) and much greater in Alberta, Saskatchewan and Newfoundland and Labrador ($13,969 per job).

66 PRODUCTIVITY AND PROSPERITY IN QUEBEC | 2013 OVERVIEW
FIGURE 32PRIVATE INVESTMENT IN MACHINERY AND EQUIPMENT PER JOB QUEBEC, ONTARIO, ALBERTA-SASKATCHEWAN-NEWFOUNDLAND AND LABRADOR AND CANADA AS A WHOLE (1984-2012)
(In 2012 Canadian dollars)
2,500
5,000
7,500
10,000
12,500
15,000
17,500
Quebec Ontario CanadaAlberta–Saskatchewan–Newfoundland and Labrador
1989
1990
1991
1992
1993
1994
1995
1996
1984
1985
1986
1987
1988
1997
1998
1999
2000
2001
2002
2003
2004
2005
2006
2007
2008
2009
2010
2011
2012
Source: http://statcpp.hec.ca/2013overview/FIG32.xlsx
Private investment in machinery and equipment is plummeting in Quebec. Between 1999 and 2012, the province reported a decline of $3,163 per job, or 36%.

67PRODUCTIVITY AND PROSPERITY IN QUEBEC | 2013 OVERVIEW
Nevertheless, Figure 32 also shows that private investment in machinery and equipment per job fell sharply in Quebec after 1999. Between 1999 and 2012, the province recorded a decline corresponding to $3,163 per job, or 36%. This means that in 2012 Quebec companies invested about $5,633 per job in machinery and equipment, or less than in 1984. Although the reduction in this type of investment after 1999 was not limited to Quebec, the decline in this province was the most dramatic. More specifically, private investment in machinery and equipment declined by 30% in Ontario (-$2,752 per job), 24% in Canada as a whole (-$2,252 per job) and 13% in Alberta, Saskatchewan and Newfoundland and Labrador (-$1,753 per job). Quebec’s performance, already lagging in 1999, worsened during this period such that by 2012 private investment in machinery and equipment in Quebec was approximately 1.1 times lower than in Ontario ($6,278 per job), 1.3 times lower than in Canada as a whole ($7,064 per job) and 2.2 times lower than the average in Alberta, Saskatchewan and Newfoundland and Labrador ($12,217 per job).
On a more positive note, there was a significant upswing in the level of private investment in machinery and equipment in Quebec between 2011 and 2012. This growth (6.4%) was greater than elsewhere in Canada (1.7%). Only time will tell whether this is the beginning of a long-term trend or just an isolated annual phenomenon. In any case, it is too early to talk about Quebec catching up to Ontario and the Canadian average. In light of this analysis, we can see that the investment effort by the private sector in Quebec is lower than elsewhere in Canada, both for non-residential structures (with the exception of Ontario) and machinery and equipment. The drastic decline in investment by the business sector in machinery and equipment in Quebec in recent years is particularly worrisome, since this is the type of investment with the most direct impact on labour productivity. When compared with their counterparts elsewhere in Canada, Quebec firms have invested less and less in this area in recent years, and this may prove damaging to the provincial economy.

68 PRODUCTIVITY AND PROSPERITY IN QUEBEC | 2013 OVERVIEW
DOES QUEBEC ATTRACT ITS FAIR SHARE OF CANADIAN INVESTMENT?It is often said that Quebec attracts less than its fair share of Canadian non-residential private investment or, in other words, less than its share given its weight in Canadian GDP. Some observers consider this the province’s major weakness when it comes to investment. Figure 33, which simultaneously tracks Quebec’s relative share of Canadian private non-residential investment and Canadian gross domestic product from 1981 to 2012, illustrates this situation.
FIGURE 33RELATIVE WEIGHT OF QUEBEC IN CANADIAN PRIVATE NON-RESIDENTIAL INVESTMENT AND GROSS DOMESTIC PRODUCT (1981-2012)
(In percentages)
Weight in private non-residential investment Weight in GDP
1989
1990
1991
1992
1993
1994
1995
1996
1981
1982
1983
1984
1985
1986
1987
1988
1997
1998
1999
2000
2001
2002
2003
2004
2005
2006
2007
2008
2009
2010
2011
2012
10
15
20
25
30
35
40
45
Source: http://statcpp.hec.ca/2013overview/FIG33.xlsx
The first observation is that since the early 1990s Quebec’s relative share of Canadian private non-residential investment has been falling at a faster rate than its weight in the Canadian economy. In 1993, for instance, Quebec attracted 21.8% of Canadian private non-residential investment, or almost its fair share in proportion to its weight in the Canadian economy (22.5%). By 2012, the province’s share of Canadian private non-residential investment had dropped to 14.5%, much less than its share of Canadian GDP (19.7%). In other words, Quebec’s relative share in this respect currently represents only 74% of its weight in the Canadian economy.
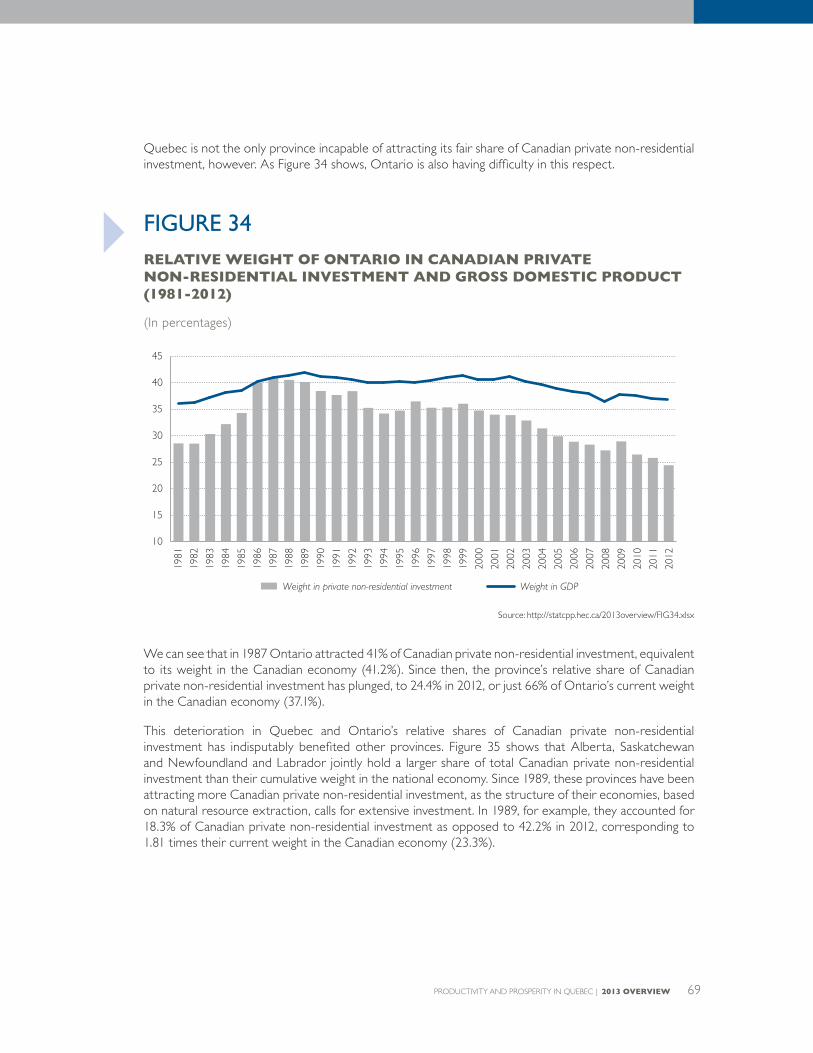
69PRODUCTIVITY AND PROSPERITY IN QUEBEC | 2013 OVERVIEW
Quebec is not the only province incapable of attracting its fair share of Canadian private non-residential investment, however. As Figure 34 shows, Ontario is also having difficulty in this respect.
FIGURE 34RELATIVE WEIGHT OF ONTARIO IN CANADIAN PRIVATE NON-RESIDENTIAL INVESTMENT AND GROSS DOMESTIC PRODUCT (1981-2012)
(In percentages)
Weight in private non-residential investment Weight in GDP
1989
1990
1991
1992
1993
1994
1995
1996
1981
1982
1983
1984
1985
1986
1987
1988
1997
1998
1999
2000
2001
2002
2003
2004
2005
2006
2007
2008
2009
2010
2011
2012
10
15
20
25
30
35
40
45
Source: http://statcpp.hec.ca/2013overview/FIG34.xlsx
We can see that in 1987 Ontario attracted 41% of Canadian private non-residential investment, equivalent to its weight in the Canadian economy (41.2%). Since then, the province’s relative share of Canadian private non-residential investment has plunged, to 24.4% in 2012, or just 66% of Ontario’s current weight in the Canadian economy (37.1%).
This deterioration in Quebec and Ontario’s relative shares of Canadian private non-residential investment has indisputably benefited other provinces. Figure 35 shows that Alberta, Saskatchewan and Newfoundland and Labrador jointly hold a larger share of total Canadian private non-residential investment than their cumulative weight in the national economy. Since 1989, these provinces have been attracting more Canadian private non-residential investment, as the structure of their economies, based on natural resource extraction, calls for extensive investment. In 1989, for example, they accounted for 18.3% of Canadian private non-residential investment as opposed to 42.2% in 2012, corresponding to 1.81 times their current weight in the Canadian economy (23.3%).

70 PRODUCTIVITY AND PROSPERITY IN QUEBEC | 2013 OVERVIEW
FIGURE 35RELATIVE WEIGHT OF NEWFOUNDLAND AND LABRADOR, SASKATCHEWAN AND ALBERTA IN CANADIAN PRIVATE NON-RESIDENTIAL INVESTMENT AND GROSS DOMESTIC PRODUCT (1981-2012)
(In percentages)
Weight in private non-residential investment Weight in GDP
1989
1990
1991
1992
1993
1994
1995
1996
1981
1982
1983
1984
1985
1986
1987
1988
1997
1998
1999
2000
2001
2002
2003
2004
2005
2006
2007
2008
2009
2010
2011
2012
10
15
20
25
30
35
40
45
Source: http://statcpp.hec.ca/2013overview/FIG35.xlsx
All in all, Quebec’s inability to attract its fair share of Canadian private non-residential investment is not a valid argument to explain its poor economic performance. This indicator penalizes provinces where production is primarily in non-investment-intensive sectors. The great disparity in the structure of the Canadian provinces’ economies clearly benefits those where natural resource extraction is the main industry, since it calls for extensive investment. Consequently Alberta, Saskatchewan and Newfoundland and Labrador naturally attract a larger share of total Canadian private non-residential investment, to the detriment of Quebec and Ontario. Moreover, although Ontario is not attracting its fair share of Canadian private non-residential investment, just like Quebec, it is still outperforming Quebec. The non-residential investment effort by the business sector actually gives a more accurate picture of the situation in Quebec in terms of investment.

71PRODUCTIVITY AND PROSPERITY IN QUEBEC | 2013 OVERVIEW
Although lower investment by Quebec businesses in non-residential structures than by businesses in Canada as a whole (with the exception of Ontario) certainly limits productivity gains and economic growth, the drastic plunge in private investment in machinery and equipment is of even greater concern. In recent years, Quebec firms have reduced their spending per job on machinery and equipment, with negative repercussions on the quality and quantity of production equipment for workers’ use and indirectly on workforce training and the spread of technological innovations – all essential determinants of labour productivity. The situation is all the more serious in that Quebec businesses are currently investing less in machinery and equipment than their counterparts in Ontario, a similar economy. If it is to remain competitive, Quebec must consider these conclusions carefully. More than ever, it must find a way to encourage businesses to invest more in better equipment. For this is how it can ensure its economic growth and close its longstanding productivity gap.
It seems more crucial than ever to find a way to encourage Quebec businesses to invest more in better equipment. For this is how it can ensure its economic growth and close its longstanding productivity gap.

section 4
INEQUALITY: HOW MUCH CAN WE DO?

A society’s income-distribution inequality depends on the initial distribution of income, of course, but also on the redistribution mechanisms established by governments. These can take different forms, such as income tax (whereby the government reduces the initial income of certain households through taxation) and transfers to individuals (whereby the government increases the initial income of certain households through certain public expenditures). But the government’s intervention in redistribution, in that it involves the funding of transfers to individuals through taxation, can have a harmful impact on an economy’s performance in terms of the standard of living and labour productivity.
Accordingly, we will begin this section by trying to establish a link between inequality in the final distribution of income and economic performance, in terms of productivity and the standard of living, as described in the first section of this Overview. Our analysis shows that, contrary to popular belief, there seems to be no direct link between income inequality and economic performance. In other words, it seems that it is entirely possible to make Quebec a society that is both prosperous and egalitarian.
We will then continue with an analysis of the level of inequality in Quebec and the role of government redistribution in reducing the inequality observed before income tax and transfers. This exercise shows us that, in Quebec, raising taxes to finance an additional reduction in inequality is neither necessary, since the existing redistribution mechanisms already reach their objective by keeping inequality low, nor desirable, given the heavy tax burden on its economy as compared with the economies of its neighbours.
There are several ways of evaluating income-distribution inequality in a society. For our analysis, we used the relationship between the average household income of the highest quintile (the 20% of households with the highest income) and the lowest quintile (the 20% of households with the lowest income).15 This lets us quantify how much more money the wealthiest households have than the poorest ones. To evaluate inequality, we are interested in the final distribution of income, i.e. how much is left to households after deducting the income tax levied by governments and adding the transfers made. In other words, this is the actual income available to households for spending and saving.
73
15 Statistics Canada notes that “in order to take into account the economies of scale present in larger households, the household after-tax income is transformed to express the household after-tax income per adult equivalent. All the persons of the population are ranked from lowest to highest by the value of their adjusted household after-tax income. Then, the ranked population is divided into five groups of equal numbers of units, called quintiles.” (CANSIM, table 202-0707)
PRODUCTIVITY AND PROSPERITY IN QUEBEC | 2013 OVERVIEW

74 PRODUCTIVITY AND PROSPERITY IN QUEBEC | 2013 OVERVIEW
INEQUALITY IN OTHER COUNTRIESWe will start this analysis with an international comparison of inequality in income distribution after income tax and transfers. Figure 36 shows this comparison between Quebec and the 20 selected OECD countries for 2010.
According to Figure 36, in 2010 the richest households in Quebec had an average income 4.7 times higher than the poorest households. When we compare this inequality with that in the 20 selected OECD countries, Quebec falls in the middle of the ranking. Of the countries that are more egalitarian than Quebec, many are known for their high degree of economic intervention. This is the case in particular for northern European countries – the Scandinavian countries and the Netherlands, all distinguished from Quebec by their low inequality. Thus the average income gap between the wealthiest and the poorest households is wider in Quebec than in the Netherlands (4.3), Sweden (4.0), Norway (3.7), Finland (3.7) and Denmark (3.6). At the other end of the ranking, a number of OECD countries, almost all known for their governments’ generally more limited intervention, have greater inequality than Quebec, including Canada as a whole, with a rate of 5.4. This is also the case for Ireland (5.4), the United Kingdom (5.6), Australia (5.7) and Japan (6.2). Finally, the exercise shows that the United States has by far the greatest inequality rate in our sample, at 7.9, more than double that of Iceland (3.5), the country with the least inequality. Unlike its immediately neighbouring jurisdictions, Quebec has less inequality and is closer to those countries recognized as being more egalitarian. Clearly, the amount of government intervention in Quebec’s economy plays a role in this respect.
A society may have both low inequality and a high standard of living. The opposite is also true.

75PRODUCTIVITY AND PROSPERITY IN QUEBEC | 2013 OVERVIEW
FIGURE 36INEQUALITY IN SELECTED OECD COUNTRIES AND QUEBEC AFTER INCOME TAX AND TRANSFERS (2010)
(Total income of richest 20% / poorest 20%)
0
1
2
3
4
5
6
7
8
Icel
and
Den
mar
k
Finl
and
Nor
way
Belg
ium
Swed
en
Ger
man
y
Net
herla
nds
Fran
ce
Switz
erla
nd
Que
bec
New
Zea
land
Can
ada
Irela
nd Italy
Uni
ted
King
dom
Aus
tral
ia
Sout
h Ko
rea
Japa
n
Spai
n
Uni
ted
Stat
es
3.5 3.6 3.7 3.73.9 4.0
4.3 4.3 4.5 4.6 4.75.1
5.4 5.4 5.6 5.6 5.7 5.76.2
6.6
7.9
Source: http://statcpp.hec.ca/2013overview/FIG36.xlsx
Now that we know that the redistribution mechanisms needed to keep inequality low call for extensive government intervention in the economy, in the form of income tax and transfers, can Quebec’s use of such mechanisms influence its current economic performance in terms of the standard of living and labour productivity? In other words, are a relatively low standard of living and labour productivity the price to be paid to maintain low inequality?
Figures 37 and 38, which compare the level of inequality in the final distribution of income with the standard of living and labour productivity for Quebec and all the selected OECD countries, answer these questions. They show these countries’ performance in terms of the standard of living, labour productivity and inequality compared with those in Quebec (normalized to 100).
A glance at Figure 37 clearly shows that low inequality does not always coincide with a low standard of living.

76 PRODUCTIVITY AND PROSPERITY IN QUEBEC | 2013 OVERVIEW
FIGURE 37STANDARD OF LIVING AND INCOME-DISTRIBUTION INEQUALITY AFTER INCOME TAX AND TRANSFERS (2010)
(Quebec = 100)
0
50
100
150
200
Sout
h Ko
rea
New
Zea
land
Spai
n
Italy
Japa
n
Que
bec
Fran
ce
Uni
ted
King
dom
Icel
and
Finl
and
Ger
man
y
Belg
ium
Swed
en
Can
ada
Irela
nd
Den
mar
k
Net
herla
nds
Aus
tral
ia
Uni
ted
Stat
es
Switz
erla
nd
Nor
way
Standard of living Inequality
Source: http://statcpp.hec.ca/2013overview/FIG37.xlsx
Although some countries, like Australia and the United States, have a high standard of living along with high inequality, other equally (if not more) prosperous countries have low inequality. This is the case in particular for Norway and Switzerland, which have both the highest standards of living among the countries in our sample and inequality lower than or equal to Quebec. The Netherlands, Denmark, Sweden, Belgium, Germany, Finland, Iceland and France all have less inequality than Quebec, but higher standards of living. Yet although the standard of living in Canada as a whole, the United Kingdom and Ireland is higher than in Quebec, these countries have greater inequality in their final income distributions. On the other end of the scale it can be seen that some countries, like South Korea, New Zealand, Spain, Italy and Japan, all have more unequal final income distributions than Quebec, despite having among the lowest standards of living of the countries in our sample. Our analysis demonstrates that it is impossible to establish any kind of link between inequality in final income distribution and the standard of living. Hence a society may have both low inequality and a high standard of living. The opposite is also true.

77PRODUCTIVITY AND PROSPERITY IN QUEBEC | 2013 OVERVIEW
Figure 38, like the previous figure, shows that low inequality does not necessarily mean low labour productivity – quite the contrary.
FIGURE 38LABOUR PRODUCTIVITY AND INCOME-DISTRIBUTION INEQUALITY AFTER INCOME TAX AND TRANSFERS (2010)
(Quebec = 100)
0
50
100
150
200
Sout
h Ko
rea
New
Zea
land
Japa
n
Icel
and
Que
bec
Italy
Uni
ted
King
dom
Spai
n
Can
ada
Finl
and
Aus
tral
ia
Swed
en
Switz
erla
nd
Den
mar
k
Ger
man
y
Uni
ted
Stat
es
Fran
ce
Net
herla
nds
Belg
ium
Irela
nd
Nor
way
Labour productivity Inequality
Source: http://statcpp.hec.ca/2013overview/FIG38.xlsx
Indeed, internationally, labour productivity does not seem to suffer from low inequality, for the countries with the highest labour productivity – Sweden, Switzerland, Denmark, Germany, France, the Netherlands, Belgium and Norway – almost all have lower inequality than Quebec. At the other end of the scale, all ten of the countries with the poorest labour productivity have inequality greater than Quebec, with the exception of Iceland and Finland.

78 PRODUCTIVITY AND PROSPERITY IN QUEBEC | 2013 OVERVIEW
In light of this analysis, it seems that maintaining low inequality in a society’s final income distribution is not incompatible with the desire for economic success. The redistribution mechanisms commonly associated with a high level of government intervention do not appear to impede economic performance. The Scandinavian countries, the Netherlands and France, to name only those countries, are good examples in this regard. Hence it does not seem to be contradictory for Quebec to strive to improve its standard of living through productivity gains while seeking to maintain or reduce persistent inequality in its income distribution. However, we cannot ignore Quebec’s immediate environment when it comes to taxation. Quebec’s lower inequality in comparison with its neighbouring economies implies greater recourse to redistribution mechanisms. This is not surprising since, as we saw in the second part of this Overview, Quebec is known among North American economies for its government’s marked economic intervention, in terms of both public spending and taxation. Quebec’s use of taxation, already fairly high in comparison with its neighbouring economies, may well harm the province’s tax competitiveness and hence its economic performance. Thus it would be advisable for Quebec not to stray too far from practices in its immediate environment.
Quebec’s use of taxation, already fairly high in comparison with its neighbouring economies, could harm the province’s tax competitiveness and hence its economic performance. Thus it would be advisable for Quebec not to stray too far from practices elsewhere in North America.

79PRODUCTIVITY AND PROSPERITY IN QUEBEC | 2013 OVERVIEW
TRENDS IN INEQUALITYIt is often said that income inequality is growing constantly in Quebec. In this case, reducing inequality (to keep it at a target rate) through greater income redistribution efforts by the government could be a laudable objective for the province, even though it already ranks well in terms of inequality, at least compared with its neighbours. When we look at Figure 39, however, which traces trends in income distribution inequality after income tax and transfers in Quebec, Ontario and Canada as a whole from 1981 to 2011, we see that it contradicts this first statement.
FIGURE 39INEQUALITY IN QUEBEC, ONTARIO AND CANADA AS A WHOLE AFTER INCOME TAX AND TRANSFERS (1981-2011)
(Total income of richest 20% / poorest 20%)
3.0
3.5
4.0
4.5
5.0
5.5
6.0
Quebec Ontario Canada
1989
1990
1991
1992
1993
1994
1995
1996
1981
1982
1983
1984
1985
1986
1987
1988
1997
1998
1999
2000
2001
2002
2003
2004
2005
2006
2007
2008
2009
2010
2011
Source: http://statcpp.hec.ca/2013overview/FIG39.xlsx
The figure shows that, contrary to popular belief, the extent of inequality in Quebec’s final income distribution has remained fairly stable. It grew by only 3% between 1981 and 2011. In other words, the average income of the richest households in 1981 was 4.43 times higher than that of the poorest households, as opposed to 4.56 times in 2011, for an increase of 3% in the inequality rate. Over this same period, inequality after income tax and transfers shot up by 22% in Ontario and 12% on average across Canada. Yet since 2004 there has been a considerable reduction of inequality in Ontario (-11%) and on average in Canada (– 6%). Quebec is no exception, although the reduction has been less marked (-2%). Nevertheless, the inequality rate observed in Quebec (about 4.6) remains far below that in Ontario (about 5.5) and the Canadian average (about 5.3), as was the case throughout almost all of this period.

80 PRODUCTIVITY AND PROSPERITY IN QUEBEC | 2013 OVERVIEW
THE ROLE OF REDISTRIBUTIONAt first glance, everything suggests that the large-scale redistribution mechanisms established in Quebec since 1981 have been the main cause of keeping the inequality rate at about 4.6, lower than in Ontario and Canada as a whole. Thus it is worth analyzing the extent and effectiveness of the government’s performance in achieving its mission of redistribution, aimed primarily at correcting inequality in the initial distribution of income, i.e. before income tax and transfers. To do so, we will begin by comparing inequality before and after income tax and transfers to identify the importance of the role played by government redistribution in efforts to reduce inequality. Second, we will compare the growth of household income before and after income tax and transfers in all quintiles, to determine who actually benefits from government redistribution efforts.
While the final distribution of income shows that inequality in Quebec remained fairly stable between 1981 and 2011, Figure 40, which traces trends in inequality before income tax and transfers in Quebec, Ontario and Canada as a whole over the period from 1981 to 2011, shows that this was not the case for the initial distribution.
FIGURE 40INEQUALITY IN QUEBEC, ONTARIO AND CANADA AS A WHOLE BEFORE INCOME TAX AND TRANSFERS (1981-2011)
(Total income of richest 20% / poorest 20%)
6
7
8
9
10
11
12
13
14
15
16
Quebec Ontario Canada
1989
1990
1991
1992
1993
1994
1995
1996
1981
1982
1983
1984
1985
1986
1987
1988
1997
1998
1999
2000
2001
2002
2003
2004
2005
2006
2007
2008
2009
2010
2011
Source: http://statcpp.hec.ca/2013overview/FIG40.xlsx

81PRODUCTIVITY AND PROSPERITY IN QUEBEC | 2013 OVERVIEW
We see, in particular, that in Quebec inequality before income tax and transfers was subject to frequent and large fluctuations that led to a 42% increase in inequality between 1981 and 2011. In other words, the gap between average income before income tax and transfers among the richest and poorest households widened by 42% over the past 30 years, from a rate of 9.6 to 13.7. Although inequality before income tax and transfers followed much the same trend across Canada, it grew more rapidly in Ontario (83%) and in Canada on average (45%). Still, inequality before income tax and transfers in Ontario and Canada as a whole remained lower than in Quebec throughout almost this entire period.
When we analyze trends in inequality before and after income tax and transfers, we can see the impact of the redistribution mechanisms implemented by Quebec since the early 1980s to reduce inequality among households.
If we compare the situation in Quebec with that in the rest of Canada, we can see that, although inequality before income tax and transfers rose throughout Canada between 1981 and 2011, only in Quebec was inequality relatively stable in the final income distribution (about 4.6). This observation is all the more striking when we look at Canada as a whole: the increase in inequality before income tax and transfers during this period was similar to that in Quebec. This exercise proves then that in Quebec income redistribution made it possible to maintain inequality levels during this period, despite the many large fluctuations in inequality before income tax and transfers; in Ontario and Canada as a whole, redistribution efforts were insufficient to contain this upward trend.
This analysis also shows us that despite greater inequality before income tax and transfers in Quebec over almost the entire period, the redistribution mechanisms in place since the 1980s have made this province more egalitarian than Ontario and Canada as a whole.
Thus the role of government income redistribution efforts to reduce inequality between 1981 and 2011 was greater in Quebec than in Ontario and on average in Canada, with the result that by 2011 Quebec was more egalitarian. Figure 41, which simultaneously compares inequality before and after income tax and transfers across Canada in 2011, allows us to determine the impact of redistribution mechanisms now in place in Quebec.

82 PRODUCTIVITY AND PROSPERITY IN QUEBEC | 2013 OVERVIEW
FIGURE 41INEQUALITY ACROSS CANADA BEFORE AND AFTER INCOME TAX AND TRANSFERS (2011)
(Total income of richest 20% / poorest 20%)
0
2
4
6
8
10
12
14
16
18
20
Can
ada
New
foun
dlan
d an
d La
brad
or
Sask
atch
ewan
New
Bru
nsw
ick
Nov
a Sc
otia
Que
bec
Prin
ce E
dwar
d Isl
and
Briti
sh C
olum
bia
Ont
ario
Alb
erta
Man
itoba
10.5 10.7 10.911.3 12.3 12.3 12.6
13.2 13.5 13.7
18.5
Inequality across Canada Before Taxes and Transfers
0
1
2
3
4
5
6
7
Can
ada
New
foun
dlan
d an
d La
brad
or
Sask
atch
ewan
New
Bru
nsw
ick
Nov
a Sc
otia
Que
bec
Prin
ce E
dwar
d Isl
and
Briti
sh C
olum
bia
Ont
ario
Alb
erta
Man
itoba
4.3
Inequality across Canada After Taxes and Transfers
4.3 4.4 4.64.8 4.9 4.9 5.2 5.2 5.5
5.7
Source: http://statcpp.hec.ca/2013overview/FIG41.xlsx

83PRODUCTIVITY AND PROSPERITY IN QUEBEC | 2013 OVERVIEW
Initial income distribution before income tax and transfers in Quebec is such that the province has the second-greatest inequality in Canada, after Newfoundland and Labrador. Before redistribution by the Quebec government, the average household income in the highest quintile is 13.7 times higher than household income in the lowest quintile, representing a rate slightly higher than that in Ontario (13.5) and the Canadian average (13.2). Note, however, that Newfoundland and Labrador is by far the least egalitarian Canadian province before government income redistribution. The richest households in that province have average income before income tax and transfers equivalent to 18.5 times that of the poorest households, for an inequality rate 1.4 times higher than that in Quebec and 1.8 times that in Manitoba (10.5), the Canadian province with the most egalitarian initial income distribution.
Government income redistribution, which generally favours the poorest households at the expense of the wealthiest, nevertheless makes it possible to reduce this inequality across Canada, and particularly in Quebec and in Newfoundland and Labrador. As evidence, after income tax and transfers, the wealthiest Quebec households have an average income 4.6 times higher than the poorest ones, or three times less than before redistribution. This reduction of inequality, thanks to government redistribution, is the greatest in Canada after Newfoundland and Labrador, where the inequality rate drops from 18.5 to 4.9, or 3.8 times less than before redistribution. In Quebec, redistribution is so successful that only Prince Edward Island (4.3), New Brunswick (4.3) and Nova Scotia (4.4) are more egalitarian. After income tax and transfers, inequality in Quebec is even lower than in Ontario (5.2) and the Canadian average (5.2).
In other words, government intervention in income redistribution considerably reduces inequality in Quebec and makes it one of the most egalitarian provinces. In addition, the redistribution mechanisms established since 1981 by the Quebec government made it possible to maintain this level of inequality throughout almost the entire period from 1981 to 2011. Nonetheless, even if the redistribution mechanisms adopted by Quebec do achieve their objectives, we have not yet determined whether they act effectively on the income distribution of all households. In other words, does the low inequality observed in Quebec actually reflect the enrichment of poorer households, or a general impoverishment of society? Figure 42 sheds new light on this analysis, illustrating the growth in average household income of each quintile in Quebec, Ontario and Canada as a whole over the past 30 years.

84 PRODUCTIVITY AND PROSPERITY IN QUEBEC | 2013 OVERVIEW
FIGURE 42INCOME GROWTH BEFORE AND AFTER INCOME TAX AND TRANSFERS PER QUINTILE IN QUEBEC, ONTARIO AND CANADA AS A WHOLE (1981-2011)
(1981 = 100, in 2011 Canadian dollars)
020406080
100120140160
Lowest quintile Second quintile Third quintile Fourth quintile Highest quintile
102
131
106
127 119129 124 129
144 135
Before taxes and transfers After taxes and transfers
Quebec
020406080
100120140160
82
118101
123 117129 128
134151 145
Ontario
Lowest quintile Second quintile Third quintile Fourth quintile Highest quintile
Before taxes and transfers After taxes and transfers
0
20
40
60
80
100
120
140
160
103
128108
126 120 130 127132 149 143
Canada
Lowest quintile Second quintile Third quintile Fourth quintile Highest quintile
Before taxes and transfers After taxes and transfers
Source: http://statcpp.hec.ca/2013overview/FIG42.xlsx

85PRODUCTIVITY AND PROSPERITY IN QUEBEC | 2013 OVERVIEW
A glance at this figure shows that the average initial income of wealthy households in Quebec increased more quickly toward the top of the distribution, in the third quintile (19%), fourth quintile (24%) and highest quintile (44%). These incomes grew more rapidly in Ontario, however (except for households in the third quintile), and in Canada as a whole. In fact, between 1981 and 2011, the average household income in the highest quintile rose by 44% in Quebec, by 51% in Ontario and by 49% in Canada as a whole. Note also that in 1981 the average household income of the highest quintile in Quebec was already lower than in Ontario and Canada; during this period, these households in Quebec became poorer in comparison with their counterparts elsewhere in Canada. The same applies for the households in the third and fourth quintiles.
The exercise also shows that the average income of poor households in Quebec changed little over the past 30 years, more specifically rising by just 2% for those in the lowest quintile. Overall, the average income of these households remained where it had been in 1981. Across Canada, much the same situation applied for these households, which saw their average income rise by 3%. In Ontario, the households in the lowest quintile saw their average income plummet during this period, by 18%. The average income of Ontario households in the second quintile, meanwhile, remained about the same between 1981 and 2011, growing by just 1%. In Quebec and across Canada, although the average household income of this quintile rose by 6% and 8% respectively, these increases were not comparable with those of households in the third and fourth quintiles and the highest quintile. In the end, one rather disturbing observation emerges: over the past 30 years, at least before redistribution, households in Quebec remained the least well off in Canada, although they did make up some ground in comparison with Ontario.
Despite the fact that it was almost exclusively households in the upper levels of the distribution before income tax and transfers that grew richer everywhere in Canada, less affluent households in Quebec did see their disposable income grow at a similar rate to wealthier households. Over the past 30 years, the poorest households in Quebec, after redistribution, enjoyed slightly higher growth in their average income (31%) than those in the second (27%), third (29%) and fourth quintiles (29%), and marginally lower than the wealthiest households (35%). Generally speaking, then, redistribution in Quebec made it possible to limit growth in the gaps in disposable income among households.
Elsewhere in Canada, although all households saw growth in their disposable income, this enrichment went more to those in the upper quintiles. After income tax and transfers, it was the richest Ontario households that benefited the most. As evidence, the growth in average household income in the lowest quintile was 18%, while for those in the highest quintile it was 45%. Despite redistribution, then, the gaps in income after income tax and transfers have widened since 1981. Across Canada, even though growth in average income before income tax and transfers of all households between 1981 and 2011 was similar to that in Quebec, government intervention in income redistribution also benefited the wealthiest. The big winners were households in the highest quintile (43%), while households in the other quintiles enjoyed less (albeit similar) growth in their average income: for the lowest quintile, 28%, second quintile, 26%, third quintile, 30% and fourth quintile, 32%.

86 PRODUCTIVITY AND PROSPERITY IN QUEBEC | 2013 OVERVIEW
This means that Quebec was a more egalitarian society throughout almost the entire period from 1981 to 2011, mainly because the redistribution mechanisms in place made it possible to redistribute disposable income in a more egalitarian way than elsewhere in Canada. Yet even after government redistribution, all Quebec households – both rich and poor – remained poorer than Ontario households and those in Canada as a whole.
In conclusion, although at first glance there is nothing to show that the low inequality in Quebec is responsible for its economic performance, the province cannot hope to become a more egalitarian society without paying the price. Given the heavy tax pressure on the Quebec economy as compared with its neighbours, reducing inequality through greater government redistribution of income is quite simply not desirable. This is all the more true in that such a change appears unnecessary, since the redistribution mechanisms already in place are effective and do already meet their objectives.
Government income redistribution in Quebec mainly benefits those households with the lowest income (unlike the case elsewhere in Canada) and makes it possible to considerably reduce inequality in the initial distribution of income, as well as limiting the many substantial fluctuations. As a result, over the past three decades, thanks to the established redistribution mechanisms, inequality in Quebec has remained lower than in many OECD countries and many Canadian provinces. The situation in Quebec in terms of inequality thus falls somewhere between the low inequality in northern European countries (and the resulting higher taxes) and the high inequality in neighbouring economies.
In light of this analysis, it seems hazardous to strive to further reduce inequality in Quebec – especially since to achieve this feat the province would have to tax its residents and businesses even more, although they are already among the most heavily taxed in Canada. Yet this is what the Quebec government did in its latest budget, by increasing the progressive nature of personal income tax by adding another tax bracket and increasing the marginal taxation rate on the highest incomes. Everything suggests that these measures will not have the desired effects. To the contrary, by increasing the tax burden, Quebec is at risk of further impoverishing itself to the point that it lacks the means to fulfil its ambitions.

87PRODUCTIVITY AND PROSPERITY IN QUEBEC | 2013 OVERVIEW 87
In light of this analysis, it seems hazardous to strive to further reduce inequality in Quebec – especially since to achieve this feat the province would have to tax its residents and businesses even more, although they are already among the most heavily taxed in Canada.

8888
This Outlook shows that Quebec no longer has the means to fulfil its ambitions. Only by reducing its tax burden can it prevent taxation from stifling its growth. And if, in the meantime, the province wishes to maintain its current level of public spending, it seems inevitable that it will have to rely more on user fees for public services.
PRODUCTIVITY AND PROSPERITY IN QUEBEC | 2013 OVERVIEW

89PRODUCTIVITY AND PROSPERITY IN QUEBEC | 2013 OVERVIEW
CONCLUSIONThis year’s annual Overview paints a worrisome picture. Far from improving, Quebec’s relative performance has been declining for the past 30 years. This disappointing performance can be attributed mainly to Quebec’s anemic labour productivity over this period. As a result, the standard of living in this province in 2012 was lower than that of many OECD countries and Canadian provinces.
Quebeckers, with GDP per hour worked of $54.95, are currently less productive than a good number of their Canadian and international counterparts, and so have fewer financial resources to meet their collective needs. Since the early 2000s, households, companies and public administrations in Quebec have been consuming goods and services worth more than what they produce. This leads to the sorry conclusion that Quebec is now living beyond its means.
When we look more closely at public spending and the tax burden, it quickly becomes clear that the pressure on the Quebec economy is particularly heavy. To avoid further jeopardizing its economic growth, the province must halt the expansion of its public sector, so as to limit the pressure of taxation on its economy. And if Quebec wishes to remain a socially egalitarian society, it will have to rely more on user fees for public services. Such a move will take some political courage, since it is generally unpopular with Quebeckers.
Another of our analyses confirms this conclusion and shows that it would be hazardous for Quebec to strive to further reduce social inequality. To do so, the Quebec government would be obliged to increase the tax burden on citizens and businesses, already among the most heavily taxed in the country. Over time, this measure could further impoverish Quebec, to the point that the province would lack the means to achieve its ambitions.
Also worrisome is the revelation in Productivity and Prosperity in Quebec – 2013 Overview that Quebec firms are investing less in machinery and equipment than their counterparts elsewhere in Canada. Worse still, there has actually been a marked decline in such investment in Quebec since 1999. The level of investment in machinery and equipment fell by $3,163 per job, a 36% drop. Yet it is exactly this kind of investment that has the greatest impact on labour productivity.
If Quebec is to remain in the race, it has every interest in finding a way to encourage its businesses to invest more in better equipment. For this is how we can ensure our economic growth and close the productivity gap that has been widening for too many years.


Rédacteur en chefRobert Gagné Directeur du Centre sur la productivité et la prospérité
CollaborateursJonathan Deslauriers, directeur de projetJonathan Paré, professionnel de recherche
Coordonnatrice de productionLiette D’Amours
RéviseuresJosée BolducLouise Letendre
InfographeBrigitte Ayotte, Ayograph
Productivité et prospérité au Québec – Bilan 2013 est une initiative du Centre sur la productivité et la prospérité de HEC Montréal
Créé en 2009, le Centre sur la productivité et la prospérité de HEC Montréal mène une double mission. Il se consacre d’abord à la recherche sur la productivité et la prospérité en ayant comme principaux sujets d’étude le Québec et le Canada. Ensuite, il veille à faire connaître les résultats obtenus en organisant des activités de transfert, de vulgarisation et, ultimement, d’éducation.
Pour en apprendre davantage sur le Centre ou pour obtenir des exemplaires de ce document, visitez le www.hec.ca/cpp ou écrivez-nous, à [email protected]. ADRESSE DE CORRESPONDANCE :Centre sur la productivité et la prospérité HEC Montréal 3000, chemin de la Côte-Sainte-Catherine Montréal (Québec) Canada H3T 2A7 Téléphone : 514 340-6449
Dépôt légal : 1e trimestre 2014ISBN : 978-2-924208-09-0 (version imprimée)ISBN : 978-2-924208-10-6 (version PDf)Dépôt légal – Bibliothèque et Archives nationales du Québec, 2014Dépôt légal – Bibliothèque et Archives Canada, 2014
Cette publication a bénéficié du soutien financier du ministère des Finances du Québec. This publication is also available in English at www.hec.ca/cpp.
© 2014 Centre sur la productivité et la prospérité, HEC Montréal
Ce document a été imprimé avec des encres végétales, sur du papier recyclé 100 % postconsommation fabriqué à partir d’énergie biogaz. Ce papier est également certifié ÉcoLogo et Procédé sans chlore.
Photos de la couverture : © iStockPhoto/temmuz can arsiray

PRODUCTIVITÉ ET PROSPÉRITÉ AU QUÉBEC
BILAN 2013
BIL
AN
20
13
PRO
DU
CT
IVIT
É ET
PR
OSP
ÉRIT
É A
U Q
UÉB
EC