PRODUCTION OF FOAMS, FIBERS AND PITCHES USING A …
84
1 PRODUCTION OF FOAMS, FIBERS AND PITCHES USING A COAL EXTRACTION PROCESS DE-FC26-01NT41359 FINAL REPORT Period of Performance: October 1, 2001 to October 31, 2003 Revised 18 June 2004 Principal Investigator: Dady Dadyburjor Additional Authors: Chong Chen, Elliot B. Kennel, Liviu Magean Peter G. Stansberry, Alfred H. Stiller, John W. Zondlo West Virginia University Department of Chemical Engineering College of Engineering and Mineral Resources PO Box 6102 Morgantown WV 26506-6102 Sponsored by: U.S. Department of Energy National Energy Technology Laboratory 626 Cochran Mills Road PO Box 10940 Pittsburgh PA 15236-0940 Project Monitor: John Stipanovich
Transcript of PRODUCTION OF FOAMS, FIBERS AND PITCHES USING A …

1
PRODUCTION OF FOAMS, FIBERS AND PITCHES USING A COAL EXTRACTION PROCESS
DE-FC26-01NT41359
FINAL REPORT
Period of Performance: October 1, 2001 to October 31, 2003
Revised 18 June 2004
Principal Investigator: Dady Dadyburjor
Additional Authors:
Chong Chen, Elliot B. Kennel, Liviu Magean Peter G. Stansberry, Alfred H. Stiller, John W. Zondlo
West Virginia University
Department of Chemical Engineering College of Engineering and Mineral Resources
PO Box 6102 Morgantown WV 26506-6102
Sponsored by:
U.S. Department of Energy National Energy Technology Laboratory
626 Cochran Mills Road PO Box 10940
Pittsburgh PA 15236-0940
Project Monitor: John Stipanovich

2
ABSTRACT
Project Title: Production of Foams, Fibers and Pitches using a Coal Extraction Process NETL Contract Number: DE-FC26-01NT41359 Principal Investigator: Dady Dadyburjor NETL Project Manager: John Stipanovich This Department of Energy National Energy Technology Laboratory sponsored project developed processes for converting coal feedstocks to carbon products, including coal-derived pitch, coke foams and fibers based on solvent extraction processes. A key technology is the use of hydrogenation accomplished at elevated temperatures and pressures to obtain a synthetic coal pitch. Hydrogenation, or partial direct liquefaction of coal, is used to modify the properties of raw coal such that a molten synthetic pitch can be obtained. The amount of hydrogen required to produce a synthetic pitch is about an order of magnitude less than the amount required to produce synthetic crude oil. Hence the conditions for synthetic pitch production consume very little hydrogen and can be accomplished at substantially lower pressure. In the molten state, hot filtration or centrifugation can be used to separate dissolved coal chemicals from mineral matter and insolubles (inertinite), resulting in the production of a purified hydrocarbon pitch. Alternatively, if hydrogenation is not used, aromatic hydrocarbon liquids appropriate for use as precursors to carbon products can obtained by dissolving coal in a solvent. As in the case for partial direct liquefaction pitches, undissolved coal is removed via hot filtration or centrifugation. Excess solvent is boiled off and recovered. The resultant solid material, referred to as Solvent Extracted Carbon Ore or SECO, has been used successfully to produce artificial graphite and carbon foam.

3
DISCLAIMER
This Final Report was prepared with the support of the US Department of Energy under award DE-FC26-01NT41359. However, any opinions, findings, conclusions or recommendations expressed herein are those of the authors and do not necessarily reflect the views of the DOE.

4
TABLE OF CONTENTS
TABLE OF CONTENTS 4 LIST OF FIGURES 5 LIST OF TABLES 7
1.0. EXECUTIVE SUMMARY 8 1.1 Background 8 1.2 Summary of Key Accomplishments 9
2.0. RESEARCH PROJECTS 11 2.1 Synthetic Pitch 11 2.1.1 Facilities for Coal Hydrotreatment 14 2.1.2 Safety Considerations in the Construction of the Hydrotreatment Facility 17 2.1.3 Solvent Extraction Pilot Plant Modifications 18 2.1.4 SECO Process Development 21 2.1.5 Rationale for Coal Hydrotreatment 22 2.1.6 Anisotropic Pitch Protocol 24 2.1.7 Mesophase Pitch Protocol 24 2.1.8 Methodologies for Tailoring Pitch Properties 25 2.1.9 Coal Selection and Specification. 33 2.1.10 Use of Solvent Blends to Enhance Coal Extraction 36 2.1.11 Ultrasonic Milling 39 2.1.12 Process Economics 40 2.2 Coal Derived Carbon Foam 45 2.2.1 Foaming Protocols 46 2.3. Carbon Fibers from Coal 62
3.0 SUMMARY OF LABORATORY CAPABILITIES 69
3.1. FIBER SPINNING LAB (ROOM 128 – NRCCE) 70 3.1.1 Extruder/Fiber Spinner 70 3.1.2 Thermo Gravimetric Analyzer (TGA) 71 3.1.3 Box Furnace 72 3.1.4 Elemental Analyzer 73 3.1.5 Proximate Analyzer 74
3.2. COAL-DERIVED MATERIALS LAB (ROOM G23 – NRCCE) 76 3.2.1 Instron Load Frame 76 3.2.2 Dilatometer 77 3.2.4 Optical Microscope 79
3.3. CHROMATOGRAPHY LAB (ROOM G30 – NRCCE) 80 3.3.1 Gas Chromatograph for Simulated Distillation 80 3.3.2 Gas Chromatograph/Mass Spectrometer (GC/MS) 81 3.3.3 Flame Ionization Detector (FID) Gas Chromatograph (GC) 82
4.0 REFERENCES 83
5
LIST OF FIGURES Figure 1. Tetralin to Naphthalene conversion by donation of four protons..................... 11 Figure 2. Process Diagram for Hydrogenated Synpitch Production. ............................... 15 Figure 3. The Aerospace Engineering Propulsion Laboratory ....................................... 16 Figure 4. The 10 gallon reactor located in the upper facility, prior to installation. ......... 16 Figure 5. Passive as well as forced ventilation capability was installed ......................... 17 Figure 6. Explosion proof motors and pumps are used throughout ................................. 18 Figure 7. Block Diagram for Solvent Extraction Process. ............................................... 19 Figure 8. A Ceramic-lined Continuously Stirred Tank Reactor (CSTR) ........................ 20 Figure 9. Re-Designed Solvent Extraction Pilot Plant, in Operational Status. ............... 20 Figure 10. 1- liter autoclave used in air blowing experiments.......................................... 26 Figure 11. Diagram of Ring Stand Setup. ........................................................................ 29 Figure 12. Soxhlet apparatus setup. ................................................................................. 30 Figure 13. Softening point of three different pitches as a function of air-blowing time. 30 Figure 14. Coke Yield of three pitches as a function of air blowing time. ...................... 31 Figure 15. Pyridine Insoluble content of three pitches as a function of air-blowing. ...... 31 Figure 16. Van Krevelen Plot Characteristic Curves. ...................................................... 32 Figure 17. Van Krevelen Plots of the 3 pitches, .............................................................. 33 Figure 18. Dilatation of coal vs. vitrinite reflectance. ................................................... 35 Figure 19. Plasticity of coal vs. vitrinite reflectance. ...................................................... 35 Figure 20. Yield of NMP-soluble extract vs. vitrinite reflectance................................... 36 Figure 21. Vapor Pressure versus Temperature for n-methyl pyrrolidone. .................... 38 Figure 22. Flask Under Vacuum. ..................................................................................... 38 Figure 23. Concentration of large coal particles (212-355 microns) ............................... 39 Figure 24. Generalized direct coal liquefaction scheme. ................................................. 41 Figure 25. Block flow diagram of the SRC-I process...................................................... 42 Figure 26. Simplified Block Flow Diagram of the EDS Process. ................................... 43 Figure 27. 8 inch diameter Synpitch-Derived Foam sample. .......................................... 46 Figure 28. Scanning Electron Micrograph of Carbon Foam. .......................................... 46 Figure 29. High Pressure Autoclave ................................................................................ 47 Figure 30. Carbon Foam Samples.................................................................................... 48 Figure 31. Close-up of higher density, higher strength material. .................................... 48 Figure 32. Dilatometer used for coal swelling trials. ....................................................... 49 Figure 33. Correlation of Foam Density with Dilatometer Measurements. ................... 50 Figure 34. Parametric Effect of Oxidation Time on Dilatation. .................................... 52 Figure 35. Parametric Effect of Oxidation Time on Fluidity. .......................................... 53 Figure 36. Stress vs. Strain Plot for carbon foam derived from Powellton Coal ........... 58 Figure 37. Compressive strength measurement .............................................................. 59 Figure 38. Hydrogenated pitch derived foam sample 1 crush strength .......................... 60 Figure 39. Hydrogenated pitch derived foam sample 2 crush strength ........................... 61 Figure 40. Hydrogenated pitch derived foam sample 1 crush Energy ............................. 61 Figure 41. Hydrogenated pitch derived foam sample 2 Crush Energy............................ 62 Figure 42. A Wayne fiber spinner and take-up reel were used to spin fiber ................... 64 Figure 43. Take-up reel device. ....................................................................................... 64 Figure 44. SECO-derived fibers were successfully spun and stabilized ......................... 65 Figure 45. SEM photomicrograph of Synpitch-Derived Carbon Fibers .......................... 66

6
Figure 46. SEM photomicrograph showing a WVU Synpitch-Derived Carbon ............ 66 Figure 47. SEM photomicrograph of a Synpitch-Derived Carbon Fiber, showing holes.67 Figure 48. SEM photomicrograph showing two holes ................................................... 67 Figure 49. SEM photomicrograph of a highly irregular Synpitch-derived carbon fiber. 68 Figure 50. Fiber Spinner and Take-up Reel. ................................................................... 70 Figure 51. TGA Overview. .............................................................................................. 71 Figure 52. Box Furnace.................................................................................................... 72 Figure 53. Elemental Analyzer. ....................................................................................... 73 Figure 54. Proximate Analyzer ........................................................................................ 74 Figure 55. UV/Vis Spectrophotometer ............................................................................ 75 Figure 56. Load Frame..................................................................................................... 76 Figure 57. Mechanical Dilatometer. ................................................................................ 77 Figure 58. Nuclear Magnetic Resonance Spectrometer................................................... 78 Figure 59. Optical Microscope......................................................................................... 79 Figure 60. Gas Chromatograph. ....................................................................................... 80 Figure 61. GC/MS System. .............................................................................................. 81

7
LIST OF TABLES Table 1. Characteristics of Some Commercial Pitches. ................................................... 12 Table 2. Properties of Binder Pitches used in Anode Manufacture. ................................ 13 Table 3. Typical Anode-Grade Calcined Petroleum Coke Target Values. ...................... 13 Table 4. Heats Of Vaporization Of Candidate Antisolvents............................................ 21 Table 5. Hydrocarbon Sources......................................................................................... 23 Table 6. Summary of Properties During Processing Steps of.......................................... 25 Table 7. Experimental Process Conditions Matrix. ......................................................... 27 Table 8. Yield of NMP-soluble extracts from select bituminous coals. .......................... 34 Table 9. Conversion of a bituminous coal in various solvents. ....................................... 37 Table 10. Conversion of Bituminous Coal in Solvent Solutions with Tetralin. .............. 37 Table 11. Vacuum filtration through 1.6µm filter ........................................................... 40 Table 12. Analyses of coal and petroleum crude (wt% moisture free)., .......................... 41 Table 13. Typical Conditions and Product Yields for Direct Coal Liquefaction. ........... 42 Table 14. Comparison of Extraction Characteristics ....................................................... 44 Table 15. Overall Material Balances for the SRC-I and EDS Processes. ........................ 44 Table 16. Cost Factors for the SRC-I Process (M$/yr, 2002 Dollars). ............................ 45 Table 17. Enthalpy Parameters Used in Energy Balance................................................. 45 Table 18. Effect of Particle Size on Foaming Behavior .................................................. 51 Table 19. Characteristics of carbon foam made from Powellton coal............................. 51 Table 20. Characteristics of Carbon Foam Made from Lower War Eagle coal .............. 52 Table 21. Modification of Coal Properties from Solvent Washing. ................................ 53 Table 22. Effect of Heating Rate on Foaming Behavior ................................................. 54 Table 23. Summary of Compression Results................................................................... 55 Table 24. Tensile Properties of Foam.............................................................................. 56 Table 25. Flexural Properties of Foam ........................................................................... 56 Table 26. Compression Test Results for Carbon Foam................................................... 58 Table 27. Mechanical Properties of Pitch Fibers (Bowers) ............................................. 68

8
1.0. EXECUTIVE SUMMARY This effort, sponsored by the Department of Energy National Energy Technology Laboratory, focused on the development of coal-derived pitch, foams and fibers based on solvent extraction processes. A key technology is the use of hydrogenation accomplished at elevated temperatures and pressures to obtain a synthetic coal pitch. Hydrogenation, or partial direct liquefaction of coal, has been investigated as a means to produce synthetic crude oil.1 A milder hydrogenation, at lower temperature and pressure, is sufficient to modify the properties of raw coal such that a molten synthetic pitch can be obtained. In the molten state, hot filtration or centrifugation can be used to separate dissolved coal chemicals from mineral matter and insolubles (inertinite). Alternatively, if hydrogenation is not used, aromatic hydrocarbon liquids appropriate for use as precursors to carbon products can obtained by dissolving coal in a solvent. As in the case for partial direct liquefaction pitches, undissolved coal is removed via hot filtration or centrifugation. Excess solvent is boiled off and recovered. The resultant solid material, referred to as Solvent Extracted Carbon Ore or SECO, has been used successfully to produce artificial graphite and carbon foam. 1.1 Background The national interest is supported by new technology for producing carbon products. Among the factors addressed by this project are the following: a. The United States currently imports over 60% of its crude oil from foreign sources. Thus, at current demand levels, there is a lack of a completely domestic supply of this crucial energy and materials resource. Although much of the oil is consumed for energy purposes, petroleum is also used for carbon products, including pitches, cokes, fibers, and to a much lower extent, carbon foams. The major direct consumer of carbon is the aluminum industry, which consumes over eight million tons per year of carbon worldwide in order to smelt aluminum. Another million tons per year is consumed by the steel industry in the form of graphite electrodes. If more of these materials can be supplied by coal feedstocks, less petroleum crude oil will be required. This is the basic rationale for pursuing research and development activities on the use of coal feedstocks for carbon products. b. Coke batteries, used for the production of metallurgical grade coke for use as a fuel in blast furnaces, are another supplier of pitches which can be used for carbon products. Coal tar pitch is produced from condensing the hydrocarbons that are released during the coking process. However, mainly because of environmental concerns from coking, American industry is decommissioning coke plants and thus is the supply of coal tar pitch has declined over the past ten years. Accordingly, increasing amounts of coal tar pitch and derived products are being imported from overseas sources. In many cases, overseas sources have fewer environmental restrictions than domestic coke producers and are thus able to undercut American industry. Thus means are needed to either extend the

9
production of coal tar via blending with other agents, or to develop processes which are both environmentally friendly and economical.
c. The diminishing supply of high quality domestic carbon pitch and coke has had a negative effect on metals production, especially in the case of aluminum. In 2003, the Aluminum Association reported the US production rate of aluminum was 2.7 Million tons, compared to 3.9 million tons in 2000. Though not the only factor, rising costs and diminishing quality of carbon have contributed to the slowdown. d. The coal mining industry has also suffered in recent years, particula rly in states such as West Virginia which produce bituminous coal with moderate sulfur content. Demand has diminished for bituminous coal as utility companies have increasingly sought low-sulfur hard coals. New processes which seek to utilize coal as a chemical feedstock offer the potential for increasing the nation’s ability to utilize coal resources. e. The chemical industry in West Virginia and other coal mining states has also been eroded, partly in response to the stagnant coal mining situation. For these reasons, it is clear that the development of carbon products using coal-derived feedstocks is a vital undertaking, supporting a number of diverse national interests. 1.2 Summary of Key Accomplishments This project resulted in several key accomplishments. a. Methods for producing Synthetic Pitch (Synpitch) from coal using a modified hydrogen donor solvent technique were investigated, and mass balances were achieved for several new protocols. This process used industrial byproduct solvents to dissolve coal, with centrifugation and hot filtration used to separate insolubles from the resultant solution. Thus, the use more expensive solvents such as tetralin was avoided, while achieving comparable performance. b. A unique capability to perform mild hydrogenation of coal products was developed by modifying an existing facility at the Evansdale Campus at West Virginia University. This facility is now referred to as the Hydrotreater Facility. A mild hydrogenation refers to the addition of about 1 – 3 mass percent hydrogen to coal mixtures via hydrogen donor solvent reactions at temperatures less than about 500 oC and pressures less than 500 psi. This was accomplished by installing pressurized autoclaves. More severe hydrogenation conditions, in which up to 10 weight percent hydrogen is added at pressures of a few thousand psi, are also achievable on-site. c. The Solvent Extraction Pilot Plant, located in the high bay facility in the National Research Center for Coal and Energy, was rebuilt with ceramic, stainless steel and chrome plated components in order to avoid contamination from carbon steel, which tended to rust. Iron oxide in the final product is equivalent to ash or other impurities,

10
thus defeating the purpose of solvent extraction. Accordingly, replacing all components in the solvent extraction system with corrosion resistant versions was required in order to reduce the presence of iron oxide in the system. Upon completion, ash content was found to have been reduced from over two mass percent to less than a half mass percent or even lower. c. An economical protocol was developed for carbon foam production. This was accomplished by controlling the properties of carbon foam precursor material such as fluidity, viscosity and softening temperature, so that foaming was successfully accomplished at ambient pressure. This obviated the need for a high pressure autoclave. d. Carbon fibers were successfully spun from synthetic coal derived pitches as well as blends of coal derived materials with petroleum pitch. Mechanical properties of these fibers were similar to fibers spun from conventional isotropic pitches.

11
2.0. RESEARCH PROJECTS 2.1 Synthetic Pitch Hydrogenation is an important tool for increasing the hydrogen content and ultimately producing aromatic pitches suitable for anode components. Although the hydrogenation itself actually increases the aliphatic content to a small degree, it has been shown that hydrogenating hydrocarbon liquids to even a few tenths of weight percent results in increased ability to chemically digest and dissolve coal. The additional dissolved coal results in increased aromaticity of the synthesized pitch. The technology for hydrogenation of synthetic pitches is essentially a spin-off of direct coal liquefaction, which was originally developed decades earlier as a means for producing synthetic gasoline and diesel fuel. In 1913, Friedrich Bergius, a German chemist, developed a process he called destructive hydrogenation, which later came to be known as direct liquefaction. Bergius liquefied coal by reacting it with hydrogen at high temperature and pressure, a feat for which he was ultimately awarded the 1931 Nobel Prize.2 Direct coal liquefaction is essentially a hydrocracking process, in which coal C–C bonds are thermally split at 450 °C in the presence of a solvent, a heterogeneous iron oxide catalyst and hydrogen under pressures of >30 MPa.3 The recycle solvent is the medium which transfers hydrogen to coal radicals by processes referred to as hydrogen donation and hydrogen shuttling. Tetralin is a commonly-used donor solvent, which can donate four hydrogens, thus becoming converted to naphthalene. The donor solvent reaction, then seeks to transfer these hydrogens to an acceptor medium such as coal or some other hydrocarbon solid or liquid.
HHCHC 48101210 +→
Figure 1. Tetralin to Naphthalene conversion by donation of four protons.
The conversion of tetralin to naphthalene can be reversed in the presence of hydrogen overpressure and elevated temperature, often with catalytic assistance. In this way, the solvent can be reversibly cycled.4 Two of Bergius's contemporaries, Franz Fischer and Hans Tropsch, deve loped the first indirect coal- liquefaction process. The Fischer-Tropsch process uses a mixture of carbon monoxide and hydrogen produced from coal, and then recombines them under the influence of a catalyst to synthesize a variety of liquids.

12
Experience teaches that direct coal liquefaction is generally not competitive with petroleum distillation processes for the production of fuel substitutes, or at least not with today’s crude oil prices, which at the time of this writing are in excess of 30 dollars per barrel. However, the prospects are significantly brighter for synthetic pitch (Synpitch) development, because the amount of hydrogenation required for attractive pitches is in the range of 3-5%, versus 8-12% for synthetic fuels. This reduced level of hydrogenation is often referred to as a mild hydrogenation and can be carried out at significantly lower pressure and temperature than a severe hydrogenation. For example, a mild hydrogenation can be carried out at less than 500 psi whereas severe hydrogenation conditions typically are carried out at over 1000 psi. 5 Conversely, the economic value of pitch is about the same as crude oil ($200 per ton = $30 per barrel). This provides the rationale for adapting hydrogenation processes for carbon products, rather than limiting them to synthetic fuels applications. A technique related to hydrogenation is the production of solvent extracted coal ore (SECO), which is made by separating the soluble coal fractions from the insoluble coal fractions. Solvent extraction is accomplished by using a solvent to partially dissolve pulverized coal, and separating the liquid and solid phases via a process such as filtration or centrifugation. Since the hydrogen donor solvent technique for hydrogenation inherently results in a coal solution, the hydrogen donor solvent is usually also used for the extraction. Thus, undissolved solids, including inorganic mineral matter, are removed via centrifugation. By evaporating or otherwise separating the solvent and solute, a solid organic material is obtained which has unique properties for producing carbon products (see Table 1).6
Table 1. Characteristics of Some Commercial Pitches.7
The largest application for carbon products is anodes for the aluminum industry. State of the art anodes are composed of ground petroleum coke and a coal tar pitch (referred to as a binder pitch). The coke and binder pitch are mixed and then baked at 1200 oC to 1400 oC to form a solid carbon mass which can be used as an anode. Representative target values are shown in Tables 2 and 3.

13
Table 2. Properties of Binder Pitches used in Anode Manufacture. Coal Tar Pitch Petroleum
Pitch Type A Pitch General Pitch
Softening Pt, °C 115.3 120.9 108-115 108-115 Toluene Insol wt% 24.42 4.05 22 min 24 min Quinoline Insol wt%
7.9 0.26 8-17 8-17
Coking Value, wt%
55.2 50.5 52 min 53 min
Ash Content, wt% 0.12 0.02 5 max 5 max Specific Gravity 1.31 1.23 1.30 min 1.30 min Sulfur, wt% 0.6 2.81 0.8 max 0.7 max Viscosity, cP 140°C 28700 27600 -- -- 160°C 2880 2520 3000 max 3000 max 180°C 560 467 -- -- 200°C 167 135 -- -- 220°C 86 53 -- -- Metals, PPM Calcium 17 3 100 max 100 max Chlorine 22 18 -- -- Iron 147 15 250 max 250 max Lead 42 -- 150 max 150 max Nickel 4 4 -- -- Phosphorous -- 0 -- -- Potassium 17 1 -- -- Silicon 274 118 600 max 600 max Sodium 25 -- 250 max 250 max Vanadium 3 4 200 max 200 max Zinc 70 -- 100 max 100 max
Table 3. Typical Anode-Grade Calcined Petroleum Coke Target Values.
Item Specification, wt% Sulfur 3.0 max Silicon 0.02 max
Iron 0.03 max Nickel 0.04 max
Vanadium 0.045 max Ash 0.5 max
Volatile Matter 0.5 max Moisture 0.5 max
Bulk Density 0.80 g/cm3 min Real Density 2.03 g/cm3 min

14
2.1.1 Facilities for Coal Hydrotreatment
Partial liquefaction (mild hydrogenation) processes using hydrogen donor solvents to digest and dissolve coal can result in synthetic pitch. Processes such as the Exxon donor solvent process have been developed using relatively expensive solvents such as tetralin/naphthalene. However, very low cost hydrocarbon sources such as carbon black base, as well as other coal or petroleum distillates are also effective. Hydrogenation of the solvent appears to enhance the ability of the oil to digest and subsequently dissolve coal. This is interpreted as increasing the ability of coal liquids to chemically attack and break down the large cross-linked molecules comprising coal, thus allowing more coal to be combined with hydrocarbon solvent feedstocks. Although the hydrogenation reaction itself results in a slight increase in aliphatic or parafinic content, the addition of dissolved coal can result in increased aromatic content for the product overall. Thus, by properly selecting the feedstock material(s) and applying appropriate post-hydrogenation treatment, the properties of the Synpitch can be tailored to meet the requirements for specific industrial applications. Although ~100 gram quantities of Synpitches can be produced in the laboratory, the nature of pitch development favors larger production quantities. Hence, an essential step in the development and practical evaluation of Synpitches is the ability to produce batch quantities of several pounds. Figure 2 is a schematic of the hydrotreating process implemented at the WVU site. Three separate facilities are used to produce the final pitch. The first facility is located on the 3rd floor of the Engineering Research Building. In this facility, a five gallon reactor is used to mildly hydrotreat solvents at temperatures between 325°C and 350°C at a hydrogen pressure of 500 psi. A catalyst of Ni, Mo, and Al2O3 is used to facilitate the reaction. The hydrotreated solvent is then transported to the hydotreatment facility (Figure 3).
The hydrotreater facility is laid out in two levels. A vertical design was chosen to facilitate flow of liquids via gravity. At the upper level, a heated medium-pressure 10-gallon feed tank is used to form a slurry of hydrotreated solvent, untreated solvent, and coal (Figure 4). The slurry is preheated to 250°C to 350°C before its introduction to the feed pump.
The feed pump conveys the reactants continuously into a high-pressure 1-gallon autoclave which is used to partially liquefy the coal by transferring hydrogen from the solvent to the coal. Following hydrotreating of the coal, the Synpitch precursor in the 1-gallon autoclave is transferred to a let-down vessel for collection and cooling.
This Synpitch precursor is then transported to the Solvent Extraction Pilot Plant (SEPP) located in the High Bay of the National Research Center for Coal and Energy, approximately ¼ mile away. The material is loaded into a continuously-stirred tank reactor and reheated. It is then pumped to a centrifuge to remove suspended solids. The solids contain mineral matter (ash) and unconverted coal. The ash-free Synpitch is then fed to a wiped film evaporator (WFE) or a Ross Mixer. Both devices are used to increase the softening point of the pitch. The WFE evaporates light volatiles (primarily solvent components) from the pitch leaving a pitch that has a higher average molecular weight, and thus a higher softening point. Manipulation of vacuum, temperature, and residence

15
time during the operation of the wiped film evaporator can be optimized to produce Synpitch with specific properties depending on the intended application. The light volatiles can be recycled for use as a solvent in future batches.
The Ross Mixer is used to air blow the pitch. Blowing air through the heated pitch results in oxidation and cross- linking of the pitch, raising the softening point. By varying the temperature, air flow rate, and residence time, the pitch properties can be tailored to a specific application. In this case there is no solvent recycling required.
Feed tank for Coal and Carrier Solvent
Let - Down Vessel
Pump
Liquefaction Reactor
Feed Pump
Exit Pump
H eated Lines
Heated Lines
Hydrogen Tank
CSTR
Solid Byproduct
NMP
Wiped Film Evaporator Centrifuge
SYNPITCH
NMP
55 gal drum
55 gal drum
NMP +Other Feeds
Figure 2. Process Diagram for Hydrogenated Synpitch Production.

16
Figure 3. The Aerospace Engineering Propulsion Laboratory was selected to house the Hydrotreater Facility, located a short distance away from the Engineering Research Building and National Research Center for Coal and Energy at the WVU Evansdale Campus. The upper section of the building was constructed to house the 10 gallon reactor unit.
Figure 4. The 10 gallon reactor located in the upper facility, prior to installation.

17
2.1.2 Safety Considerations in the Construction of the Hydrotreatment Facility
Special care was given to safety considerations because of the presence of
hydrogen gas and flammable solvents. In retrospect, the presence of even a minor amount of hydrogen gas was a substantial facilities concern because of the need to operate within electrical safety codes. Non-sparking electrical motors, non-sparking wall outlets and special ground-fault isolations were among the constraints.8 Water pipes in the facility had to be separately grounded so that they can not act as a spark source in case of an electrical ground fault. Originally consideration was given to collocating the Hydrotreating Facility in the High Bay with the Solvent Extraction Pilot Plant (SEPP). However, this plan was scrapped early on because it was realized that the wiring in the entire high-bay facility would have to be replaced in order to meet the requirements for a hydrogen-rated facility. Thus, the hydrotreating facility was created as a stand alone unit. The facility walls and doors were rated to withstand unintentional explosions. A control room is located outside the room containing the reactor, permitting operators to control the apparatus remotely. In addition, venting and blow-out panels were installed in the upper section (Figure 5). Explosion proof motors were also installed (Figure 6). However, cost limitations prevented completely wiring the facility to meet explosion proof requirements. This is the reason that the hydrotreatment of the solvent is currently being preformed on the 3rd floor of the Engineering Research Building. However, when additional funding is available, the wiring can be updated and the hydrotreatment can be reduced to a single step process.
Figure 5. Passive as well as forced ventilation capability was installed in the upper section. Because of the thermal load requirement, a totally passive system was not possible.

18
Figure 6. Explosion proof motors and pumps are used throughout the Hydrogenation Facility.
2.1.3 Solvent Extraction Pilot Plant Modifications In addition to constructing the Hydrotreating Facility, substantial modifications were preformed to enhance the capabilities of the Solvent Extraction Pilot Plant (SEPP), originally built in 1998 in the High Bay Facility of the National Research Center for Coal and Energy (NRCCE). The Solvent Extraction Pilot Plant was originally conceived as a method of producing an ash-free coal derivative which could be used as a feedstock material for cokes, artificial graphite, carbon foam and other carbon materials. Figure 7 illustrates the basic process. A carbonaceous feedstock, such as crushed coal, is blended with an aprotic dipolar solvent such as N-methyl pyrrolidone (NMP) in a Continuously Stirred Tank Reactor (CSTR). A typical protocol calls for 10 kg of raw coal in 100 liters of solution at 200oC. The resultant slurry must be pumped to a centrifuge which separates the dissolved portion from undissolved coal solids. The byproduct coal solids are suitable for gasification, or could possibly be incorporated in a product such as asphalt. The soluble portion of the coal is typically about 70% or 7 kg of the feed material, depending on the type of coal selected. The soluble portion of the coal, solvent extracted coal ore (SECO), is obtained by evaporating the solvent in a Ross mixer, a heated planetary mixing system. The evaporated solvent is then condensed and retained for use in subsequent batches. Because each batch produces only about 7 kg of solid material, several batches are partially dried in the Ross mixer before the material is final dried.

19
CSTR
Centrifuge
Ross Mixer/Dryer
Rotary Evaporator
Drying Oven
Drying Oven
Undissolved Solids
NMP
NMP
Solvent-Extracted Carbon Ore (SECO)
Crushed Coal
Figure 7. Block Diagram for Solvent Extraction Process.
Several hundred pounds of SECO were produced in the SEPP before late 2002. Unfortunately, increasingly higher levels of ash were observed in the SECO, reaching a level of about 2%. SECO produced in laboratory quantities demonstrated ash levels less than 0.5% and often less than 0.1%. Analysis of the ash from the Pilot Plant SECO indicated that most of it was iron oxide. Although iron oxide could conceivably be obtained from pyrite, it was thought that the iron oxide was probably being picked up in the plumbing of the Pilot Plant itself. Much of the Pilot Plant, including the CSTR, was fabricated using carbon steel. Thus, under the combined action of chemical attack and moderately high temperature (200oC), corrosion occurred, resulting in the iron oxide present in the final product. Therefore, the Pilot Plant was disassembled and the carbon steel components were replaced with stainless steel, chrome plated or ceramic- lined versions. While the Pilot Plant was disassembled, several other modifications were also undertaken to improve the system.
The original CSTR proved to have a significant amount of corrosion and was replaced with a ceramic- lined model that is not susceptible to corrosion. The new CSTR holds 50 gallons (60% larger than the previous reactor) and was donated to the project by Alcoa (see Figure 8. Alcoa had also donated a number of other items supporting this project, including a calcining furnace, centrifuge, as well as an autoclave, laboratory centrifuge and other laboratory equipment). The level of the CSTR was raised and an OSHA-compliant platform with steps to access it was added. This design results in the inlet of the reactor being at the highest point in the system and the outlet of the process being the lowest point in the system. Thus the working medium flow is assisted by

20
gravity, avoiding alternate up-down flow patterns (and choke points) which were present in the previous design. Larger, stainless steel, pipes were incorporated into the modified designs, and the number of bends was minimized in order to reduce clogging problems. The pumps had not experience clogging or corrosion problems, so they were not modified. New "pigs" (spill containment units and load-spreading plates) were obtained because the original ones had deformed under continuous stress. The new pigs have twice the load rating and the stands for the major pieces of equipment were redesigned to better distribute mechanical loads. The holding tanks fabricated from carbon steel were chrome-plated at Swanson Plating Company in Morgantown, WV. A wiped film evaporator (WFE), donated by the Pfaudler Corporation, was also installed in parallel to the Ross mixer for the recovery of liquid products such as heated pitches.
Figure 8. A Ceramic-lined Continuously Stirred Tank Reactor (CSTR) was fitted to new mounting structure and stand.
Figure 9. Re-Designed Solvent Extraction Pilot Plant, in Operational Status.

21
2.1.4 SECO Process Development Production of solvent extracted coal ore (SECO) has been demonstrated on both the laboratory and pilot scale. In order for SECO to become a viable industrial product, the production rate must be maximized and the energy input must be minimized. The process step which currently limits the production rate and requires the greatest amount of energy is the final drying step carried out in the Ross mixer. During the drying operation, the viscosity of the SECO solution increases dramatically, reaching a consistency similar to taffy. The wiper blade on the Ross wipes a film of this thickened SECO solution against the heated wall. The NMP evaporates from the film and is drawn out to a condenser. The planetary motion of the gears then folds the dried film back into the SECO solution where it is remixed. As a consequence, the taffy- like SECO solution gets thicker and thicker. The efficiency is very low for this process and removal of the NMP requires a long time. With the current process, the Ross mixer is limited to drying three pounds of dry weight of SECO per hour. Thus, more efficient methods of separating the SECO from the solvent were investigated. One option for separating the SECO from the solvent is to use some type of antisolvent that results in precipitation of the SECO from the solution. Several possible antisolvents include water, methanol, ethanol, toluene, and hexane. Upon addition of the antisolvent the SECO can be separated from the solvent-antisolvent mixture by centrifugation. The antisolvent can then be separated from the solvent using the wiped film evaporator. In order to maximize efficiency of the process, the antisolvent should have a boiling point and a heat of vaporization lower than that of the solvent (NMP). Table 4 lists some potential antisolvents, their boiling points, and their heat of vaporizations. The strength of the antisolvent effect must also be considered. For example, water is one of the stronger antisolvents and requires approximately 200 liter to precipitate the SECO from 100 liters of an NMP/SECO solution. Weaker antisolvents would require even larger quantities of antisolvent relative to the solvent. Water was found to be among the most efficient antisolvents. However, because of the high heat of vaporization of the water, more energy was required to evaporate the water than was required to evaporate the initial solvent. Another potential problem is the possibility of a plasticization reaction which might change the operating conditions or characteristics of the finished product. Because of these concerns, it appears that precipitation of SECO using an antisolvent does not provide advantages over the traditional method of boiling off the solvent.
Table 4. Heats Of Vaporization Of Candidate Antisolvents
Substance Boiling Point, oC Heat of Vaporization, kJ/kg
Water 100 2260 Methanol 65 1076 NMP 204 510 Ethanol 78 855 Toluene 111 363 Hexane 65 335
22
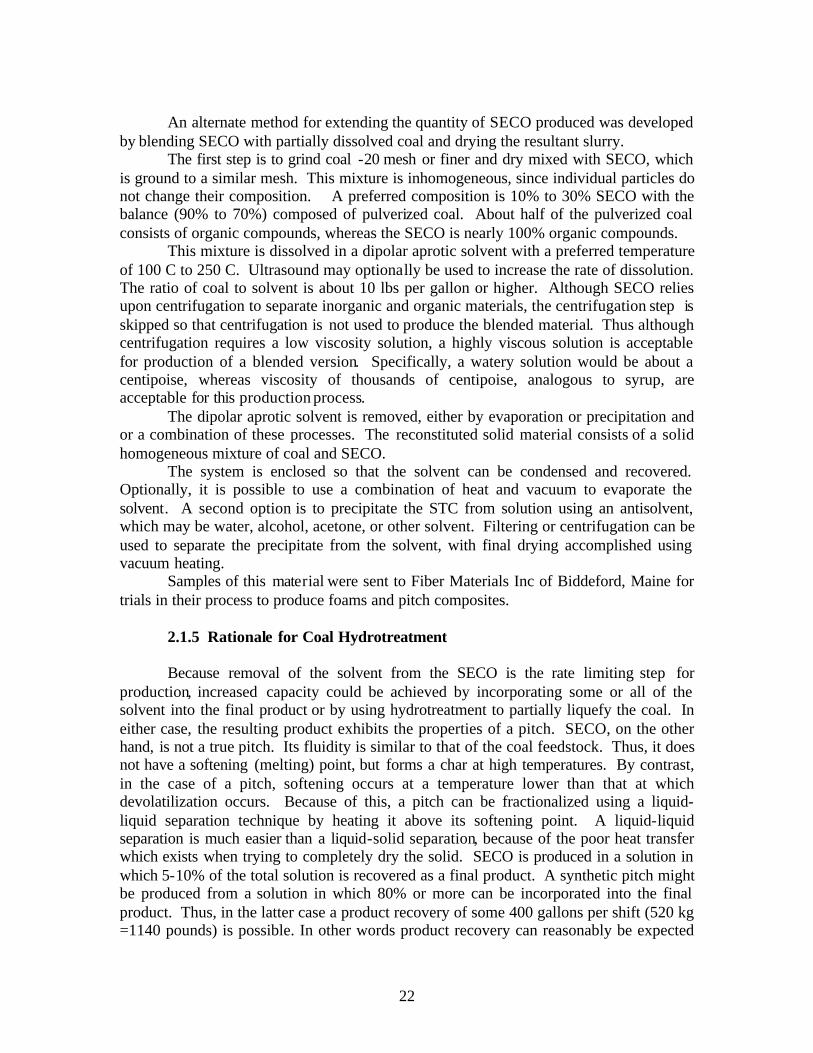
An alternate method for extending the quantity of SECO produced was developed
by blending SECO with partially dissolved coal and drying the resultant slurry. The first step is to grind coal -20 mesh or finer and dry mixed with SECO, which is ground to a similar mesh. This mixture is inhomogeneous, since individual particles do not change their composition. A preferred composition is 10% to 30% SECO with the balance (90% to 70%) composed of pulverized coal. About half of the pulverized coal consists of organic compounds, whereas the SECO is nearly 100% organic compounds. This mixture is dissolved in a dipolar aprotic solvent with a preferred temperature of 100 C to 250 C. Ultrasound may optionally be used to increase the rate of dissolution. The ratio of coal to solvent is about 10 lbs per gallon or higher. Although SECO relies upon centrifugation to separate inorganic and organic materials, the centrifugation step is skipped so that centrifugation is not used to produce the blended material. Thus although centrifugation requires a low viscosity solution, a highly viscous solution is acceptable for production of a blended version. Specifically, a watery solution would be about a centipoise, whereas viscosity of thousands of centipoise, analogous to syrup, are acceptable for this production process. The dipolar aprotic solvent is removed, either by evaporation or precipitation and or a combination of these processes. The reconstituted solid material consists of a solid homogeneous mixture of coal and SECO. The system is enclosed so that the solvent can be condensed and recovered. Optionally, it is possible to use a combination of heat and vacuum to evaporate the solvent. A second option is to precipitate the STC from solution using an antisolvent, which may be water, alcohol, acetone, or other solvent. Filtering or centrifugation can be used to separate the precipitate from the solvent, with final drying accomplished using vacuum heating. Samples of this material were sent to Fiber Materials Inc of Biddeford, Maine for trials in their process to produce foams and pitch composites.
2.1.5 Rationale for Coal Hydrotreatment Because removal of the solvent from the SECO is the rate limiting step for production, increased capacity could be achieved by incorporating some or all of the solvent into the final product or by using hydrotreatment to partially liquefy the coal. In either case, the resulting product exhibits the properties of a pitch. SECO, on the other hand, is not a true pitch. Its fluidity is similar to that of the coal feedstock. Thus, it does not have a softening (melting) point, but forms a char at high temperatures. By contrast, in the case of a pitch, softening occurs at a temperature lower than that at which devolatilization occurs. Because of this, a pitch can be fractionalized using a liquid-liquid separation technique by heating it above its softening point. A liquid-liquid separation is much easier than a liquid-solid separation, because of the poor heat transfer which exists when trying to completely dry the solid. SECO is produced in a solution in which 5-10% of the total solution is recovered as a final product. A synthetic pitch might be produced from a solution in which 80% or more can be incorporated into the final product. Thus, in the latter case a product recovery of some 400 gallons per shift (520 kg =1140 pounds) is possible. In other words product recovery can reasonably be expected

23
to be 100 times higher for a pitch than for SECO or other solid phase precipitates. This strongly militates in favor of creating pitches rather than solid phase precipitates whenever practical. Another advantage of producing a synthetic pitch, instead of SECO, is that pitch with specific properties is currently used in large quantities by a variety of industries. The main industrially produced pitches come from the petroleum refining industry (petroleum pitch) and metallurgical coking industry (coal tar pitch). During processing, crude oil is distilled into three major fractions, referred to as the light, middle, and heavy fraction. The heavy fraction is then distilled further to yield heavy oils and a solid residue. The leftover solid residue in the bottom of the still is petroleum pitch. Coal tar pitch is produced as a byproduct of metallurgical coking using coal. The coal is heated in the absence of air, resulting in devolitalization of low molecular weight hydrocarbons and other trapped gases and vapors. Condensing volatiles results in the formation of coal tar. The coal tar is then distilled to remove all of the lighter products and heavy oils, and the remaining product is called coal tar pitch.
There are three primary areas that must be considered in the development of Synpitch: the level of hydrotreatment, the type of solvent, and the quantity of solvent retained. Table 5 lists the costs of some common hydrocarbon sources along with some of the characteristics of the material. NMP is not listed because it is too expensive unless all of the solvent is recovered. From this table it is clear that the addition of coal is desirable in that coal is one of the least expensive components. The level of hydrotreatment determines the amount of coal that can be dissolved into a given quantity of solvent. Although the relationship between solubility and hydrogenation level is not a linear one, in general increasing the level of hydrotreatment increases the amount of coal that can be included in the final product. On the other hand, increased hydrotreatment also increases the cost. The type of solvent determines the amount of coal that dissolves at a given level of hydrotreatment. The type of solvent and the quantity retained also influences the ultimate properties of the pitch.
Table 5. Hydrocarbon Sources
Property Binder Pitch
Petro-Pitch
Decant Oil
Carbon Black Base Oil
Tire Rubber
Coal
Cost per ton $200 $125 $100 $120 $4 $30 Mettler softening , oC 105-115 125 Liquid Liquid Solid Solid
Density 1.3 1.25 1.0 1.0 1.5 1.3 Toluene Insol, % 25-35 25 0 100 100 100
Quinoline Insol, % 8-20 0 0 0 100 0 Beta Resin content, % 15-20 25 0 0 0 100
Coking Value, % 50 50 2 4 50 70 Aromatic Content High Med Med High Low High
Sulfur Content <0.5 2 1.5 0.1 2.0** 0.1 **Sulfur is liberated from rubber in the form of gas, so the content of sulfur in the final product would be lower than this number.

24
2.1.6 Anisotropic Pitch Protocol Typically, Synpitch is an isotropic pitch, but it can be transformed into an anisotropic pitch by the following protocol. Anisotropic pitch is needed for applications such as the manufacture of graphite or the spinning of carbon fibers. The isotropic pitch is composed of molecules with a wide molecular weight distribution. In preparation for conversion into fluid mesophase, the smaller and lower boiling point substances, which interfere with mesophase growth and coalescence, must be removed. This is accomplished by agitated, vacuum distillation at temperatures above 200 C. Care must be exercised to assure that mesophase is not formed during this stage, since this type of mesophase could be viscous and not conducive to fiber spinning. Samples of pitch are withdrawn periodically and examined under polarized light microscopy to determine optically whether mesophase is present. Based on previous experience, the amount of the lighter components removed during this step approaches nearly 70 wt% of the original feed. The distillation proceeds until the mesophase-free pitch has achieved a Mettler softening point temperature of over 180 C. The pitch is then dissolved in NMP and hot-pressure filtered to make sure that entrained coal solids and any other particulates acquired during the previous work-up steps are removed. The pitch is then thermally treated under careful conditions to promote the transformation to mesophase. By judicious selection of temperature, pressure, and process time, the growth and development of fluid mesophase can be accomplished. 2.1.7 Mesophase Pitch Protocol
Highly anisotropic pitch, such as a mesophase pitch, can result in the formation of
graphite upon heat treatment. In pitch form, molecular order occurs as liquid crystals of carbonaceous mesophase. Slow thermal treatment and higher temperatures can result in an increased number of these crystals that start to join together into a bulk mesophase. In the fiber industry mesophase pitches are mainly used for high performance carbon fibers (HPCF) with high modulus, high thermal conductivity and low electrical resistivity.
Production of low-cost, high-quality mesophase pitch remains a key goal for the materials community, with significant implications for producers of carbon and graphite foams. Isotropic pitch can be converted to anisotropic pitch through thermochemical processing, as described above. The resultant coal pitches are then partially converted into mesophase upon further heat treatment at atmospheric pressure in a reactor equipped with an anchor stirrer to provide agitation and a blanket of inert gas to prevent oxidation. 9,10 The mesophase-containing coal pitches are then subjected to an additional hydrogenation. Each mesophase pitch is placed into a hand-fashioned glass ampoule and sealed with a flame while under a vacuum to minimize exposure to oxygen. The ampoules were placed in a high- temperature centrifuge to separate mesophase from surrounding isotropic phase. If centrifugation and filtration are not effective at separating the mesophase and the isotropic phase, a second hydrogenation may be necessary in order

25
to lower the softening point of the isotropic phase such that the mesophase can be removed by centrifugation. The mesophase content can then be easily determined by simple weighing after physical removal from the isotropic phase. Conventional sample preparation and polishing techniques are employed for reflected, polarized light microscopy in order to estimate the content of mesophase in the pitches before centrifugation as well as to determine when nearly complete separation of the phases occurs. The starting isotropic pitch, mesophase-containing pitch, and each separated phase are characterized for insolubility in pyridine (PI) and toluene (TI) by Soxhlet extraction. The results are summarized in Table 6.
Table 6. Summary of Properties During Processing Steps of
Coal-Derived Synthetic Mesophase Pitch. Condition Density PI, wt% TI, wt% Mettler
Softening, oC Prior to Heat Treatment
1.244 0 52 231
After Hydrogenation
1.235 66 88 346
After Second Hydrogenation and Centrifugation
1.344 67 94 356
As mentioned previously, the hydrogenation steps required for the production of
mesophase pitch can be considered “mild hydrogenation”, and are accomplished at much lower temperature and pressure than “severe hydrogenation” required for direct liquefaction processes to produce synthetic crude oil.
2.1.8 Methodologies for Tailoring Pitch Properties
Additional tailoring of the softening point, viscosity, coke yield and other
properties can be accomplished by thermochemical treatments to outgas low molecular weight volatiles. An air-blowing technique was demonstrated as a means to tailor the softening point of pitches. This is useful for fiber spinning as well as carbon composite fabrication. Air blowing experiments were performed on three different pitches: petroleum pitch, coal tar pitch, and hydrogenated pitch. Ashland A240 petroleum pitch, Koppers Coal Tar Pitch, and WVU Synpitch were used in the air blowing experiments. Koppers coal tar pitch and the Synpitch were processed to ensure that both starting materials were free of ash and quinoline insolubles (QI). Ashland A240 petroleum pitch required no additional processing since it was received in an ash-free, QI-free condition from the Ashland-Marathon plant in Findlay, OH. The coal tar pitch was produced by Koppers Inc and contained quinoline insolubles. Approximately 1 kg of coal tar pitch was placed in a 10- liter flask and dissolved in three to four liters of N-methyl pyrrolidone (NMP). The flask was rotated in

26
a hot oil bath at 100°C for one hour using a rotary evaporator. The solution was removed from the rotary evaporator and allowed to cool. The cooled mixture was portioned into 500 mL centrifuging containers. Equal amounts were counterweighted evenly in a centrifuge. After centrifuging at 4000 rpm for 1 hr, the liquid was decanted into a container, and then pressure filtered at 15-20 psi using P8 filter paper. The filtrate was then rotary evaporated in a 10- liter flask to remove the NMP from the coal tar pitch. The flask was removed from the rotary evaporator and the pitch was cooled down using dry ice. Then the pitch was chipped out very carefully, making sure that the flask was not broken. After placing the coal tar pitch into containers and into the vacuum oven at ~170°C overnight using nitrogen purge to remove the remaining solvent, the resulting coal tar pitch material was QI-free and ready for air blowing. The hydrogenated pitch (Synpitch) used was made at West Virginia University using the Marfork Eagle Seam Coal. The Marfork Coal was ground to approximately 20 mesh. It was then vacuum dried at a temperature of approximately 75°C with a nitrogen purge. Seven and a half liters of tetralin was combined with 3 kg of coal in a five gallon autoclave reactor. The reactor was bolted down using a torque wrench to 150 ft- lb and purged with hydrogen for approximately 5 minutes and then pressurized to 500 psi. The reactor was heated up to 450°C for 1.5 hr and cooled to ambient temperature. The mixture was removed from the reactor and added to a 10- liter flask in batches. The flasks were placed on a rotary evaporator and spun in a hot oil bath at a temperature of 80°C to remove the hydrogenating solvent. During the hydrogenation of coal, some of the tetralin was converted into naphthalene. Because the naphthalene has a higher sublimation temperature than tetralin, it can solidify in the condenser. Thus, a heat gun was used to eliminate clogging due to naphthalene. After condensation and flow of the solvent was no longer noticeable, the temperature was then increased to 120°C to remove any remaining solvent. Synthetic coal pitch (Synpitch) was treated with the same protocol as coal tar pitch to remove insolubles. The air blowing of the three pitches was accomplished in a 1-liter autoclave. The reactor can be seen below in Figure 10.
Stirrer
Thermowell
Air Blowing Tube
Pitch
Flowmeter
AIR
Distillate tube
Distillate container
Figure 10. 1- liter autoclave used in air blowing experiments.

27
A Riteflow 150 mm flowmeter controlled the amount of air that was blown into the pitch. The air blowing tube was placed into the pitch next to the stirrer to ensure good mixing of air into the pitch. The thermocouple in the thermowell monitored the temperature of the pitch to make certain the heater kept the reactor at the desired temperature. The distillate tube allowed the air and any light fractions to escape. A distillate container and 300 grams of pitch were weighed and the pitch was placed into a heated 1-liter autoclave. The air flow rate was set at approximately 1182 mL/min. This assured the airflow in the air tube was unobstructed. Upon melting of the pitch in the autoclave, the lid was placed onto the reactor body and bolted down tightly using an impact hammer. The stirrer was then set at a speed of 750 rpm. The reaction took place for various times and temperatures of 250°C, 275°C, and 300°C. Table 7 shows the reaction times at the three temperatures. At the end of the reaction, the stirrer was stopped and the bolts on the reactor were loosened. The reactor top was taken off and set aside while the reactor was quenched. After the reactor was cooled, the contents were chipped out and weighed along with any distillate that was in the container. The result was an air blown pitch is ready for characterization. The reactor was cleaned after each run.
Table 7. Experimental Process Conditions Matrix. Time (hr) Ashland A240 Pitch Koppers Coal Tar Pitch WVU Synpitch
9 8 3 24 16 5 30 24 -
250°C
45 30 - 9 5 2 17 10 5 24 15 -
275°C
28 21 - 6 3 1 8 5 2 14 8 3
300°C
18 10 4 Properties of these pitches were measured before and after air blowing. Measured properties included Mettler softening point, density, ash content, Conradson carbon, viscosity, pyridine extractability and elemental analysis. Softening point was measured using a Mettler FP80 HT according to ASTM D3104-99. Density was measured using an AccuPyc 1330 pycnometer according to ASTM 320-98. Since the reactor was quenched quickly after the reaction ended, the pitch solidified quickly and air entrapment was a problem. To resolve this problem 5-10 grams

28
of the air blown pitch was added to a crucible. The pitch was annealed at 100°C over the softening point for 20 minutes if the softening point was less than 200°C or 30 minutes if the softening point was over 200°C. This allowed for the air in the pitch to escape so that an accurate density could be taken. Ash content was measured using ASTM D2415-98. The Conradson Carbon test was done using ASTM D189 to estimate coke yield. The heating rate used was 11.5 min. on high heat, 13 min. on medium heat and 7 min. on very high heat. For comparison an internally developed WVU Coke test was also used to determining coke yield. First, small crucibles were taken and heated to a red glow and set in a desiccator to ensure there is no moisture on the crucibles before weighing. The crucibles were weighed, recorded, and zeroed. After this 0.4 – 0.6 grams of pitch was added to the crucible and recorded. Then a large crucible was filled halfway with coke breeze. A lid was put on the small crucible and set on top of the coke breeze followed by adding more coke breeze to the top of the small crucible until it was fully covered. A lid was placed on the large crucible and set in a programmable furnace. The heating rate used was 5°C/mm up to 600°C and held there for 120 minutes. Then the sample was allowed to cool to room temperature and weighed. The coke yield is then
%100*%
−
=PW
CWBCWACY
where CWA = weight of the crucible with the sample after coking, CWB = weight of the crucible and PW = pitch weight.
Viscosity was measured using a Brookfield DV-III Rheometer according to ASTM standards.
A pyridine extraction was performed to determine the amount of pyridine insoluble material present. One hundred milliliters of pyridine was added to a 500 mL beaker with a magnetic stirrer on a hot plate. An approximately 3 gram sample of pitch was weighed and added to the pyridine. The mixture was heated to the point of pyridine starting to condense on the sides of the beaker and held for approximately ten minutes on that setting. A watchglass set on top of the beaker helped in condensing the pyridine and prohibiting it from boiling off. After heating the solution, the hot plate was turned off while allowing it to continue stirring. The weight of the 250 mL round bottom flask, two boiling chips and thimble was recorded. The two boiling chips were added to the flask. The flask was clamped onto the bottom of a ringstand and a small funnel was placed into the top of the flask. The thimble was placed in this funnel and another funnel was placed on a ring support above the thimble. The bottom of the second funnel was barely inserted into the top of the thimble. The experimental setup is illustrated in Figure 11. The mixture of pyridine was taken off the hotplate when cooled enough to touch. A magnetic bar was used to remove the stirrer and rinsed off with pyridine. The solution was poured into the top funnel making sure that the thimble below did not overflow. The thimble was drained into the flask and more solution was added to the thimble to keep it full until the beaker was empty. The beaker was rinsed out with pyridine into the thimble and the thimble was allowed to drain completely. The funnel was rinsed off and removed from the ringstand with care taken to avoid knocking over the thimble. A soxhlet apparatus was obtained and a small crucible was placed upside down in the bottom of the soxhlet.

29
Ring Clamp
Ringstand
Ring Support
Funnel
Thimble
250 mL Flask
Figure 11. Diagram of Ring Stand Setup.
Using a forceps, the thimble was placed on top of the crucible in the soxhlet. The bottom funnel was rinsed with pyridine making certain there was no remaining solution left on it. The flask was removed from the ringstand and placed onto the bottom of the soxhlet. The flask was set onto a heating mantle and the soxhlet was attached to a condenser. A Variac was used to heat the mantle up to where the pyridine was condensing on the inside of the soxhlet. Figure 12 shows the experimental setup. The soxhlet was run overnight or until the solution in the soxhlet was clear. The heating mantle was then switched off and the flask and soxhlet was left to cool. When cooled, the soxhlet was tilted over until the solution was sucked into the flask, making sure that solution from inside the thimble was not spilt out. When the thimble was completely drained, it was removed and placed in a beaker to dry. The solution was rinsed out of the soxhlet into the flask and the solvent was removed using a rotary evaporator at 160°C. The flask and thimble were then dried in a vacuum oven at approximately 110°C. The flask and thimble were weighed and the pyridine insoluble yield (%PI) was calculated using Equation 2,
%100*%
−
=PW
TWTAWPI
where TAW is the weight of thimble and residue after drying in vacuum oven, TW is the weight of the thimble alone, and PW is the weight of the starting pitch. The elemental analyzer was used to characterize the composition of the pitches in accordance with ASTM procedures.
30
Condenser
Soxhlet
Thimble
Crucible
Flask Heating Mantle
Figure 12. Soxhlet apparatus setup.
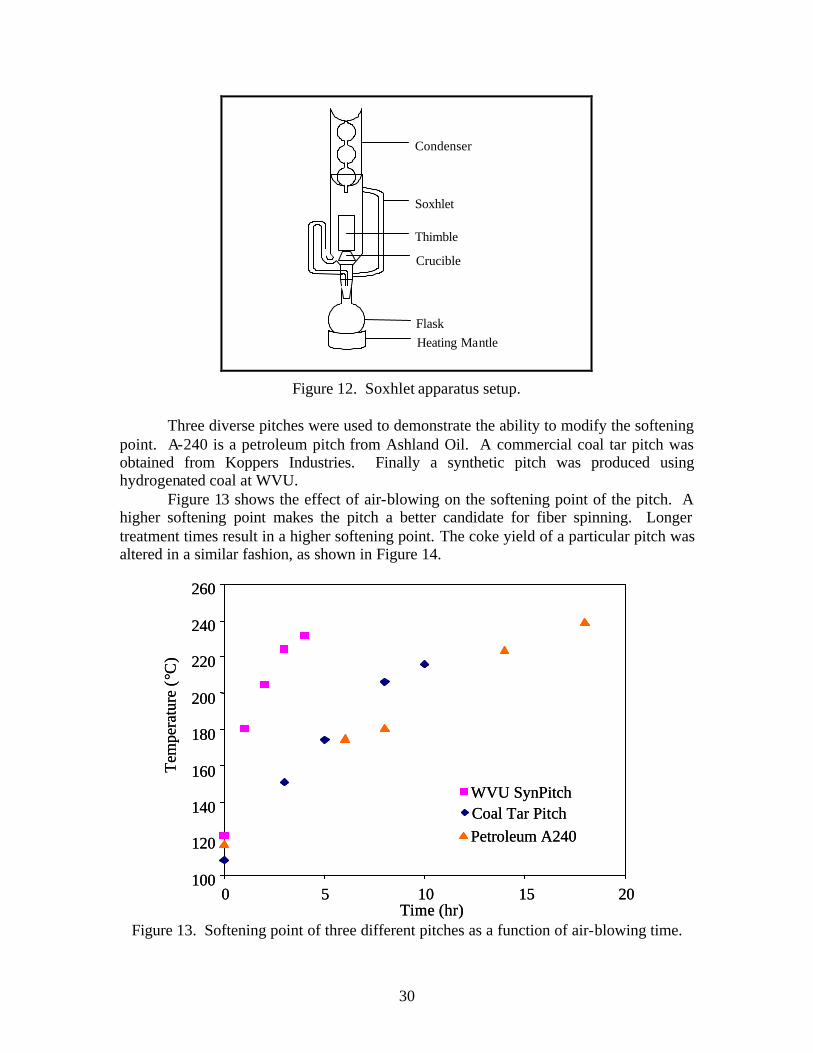
Three diverse pitches were used to demonstrate the ability to modify the softening
point. A-240 is a petroleum pitch from Ashland Oil. A commercial coal tar pitch was obtained from Koppers Industries. Finally a synthetic pitch was produced using hydrogenated coal at WVU.
Figure 13 shows the effect of air-blowing on the softening point of the pitch. A higher softening point makes the pitch a better candidate for fiber spinning. Longer treatment times result in a higher softening point. The coke yield of a particular pitch was altered in a similar fashion, as shown in Figure 14.
100
120
140
160
180
200
220
240
260
0 5 10 15 20Time (hr)
Tem
pera
ture
(°C
)
Petroleum A240Coal Tar PitchWVU SynPitch
100
120
140
160
180
200
220
240
260
0 5 10 15 20Time (hr)
Tem
pera
ture
(°C
)
Petroleum A240Coal Tar PitchWVU SynPitch
Figure 13. Softening point of three different pitches as a function of air-blowing time.

31
50
55
60
65
70
75
80
0 5 10 15 20Time (hr)
Wei
ght P
erce
nt
Petroleum A240Coal Tar PitchWVU SynPitch
50
55
60
65
70
75
80
0 5 10 15 20Time (hr)
Wei
ght P
erce
nt
Petroleum A240Petroleum A240Coal Tar PitchWVU SynPitchWVU SynPitch
Figure 14. Coke Yield of three pitches as a function of air blowing time.
The solids content of pitches can play a vital role in determining for what end use
the pitch is suitable. One measure of this is the pyridine insoluble content (PI). The pitch undergoes a typical extraction, only using Pyridine rather than the usual solvents (Toluene, THF, etc.). As the PI increases, the solids content also tends to increase concomitantly. This is due to more and more of the compounds in the pitch becoming larger and more poly-aromatic. Again, the treatment method used in this series of experiments shows an ability to increase the PI of a particular pitch, as shown in Figure 15.
0
10
20
30
40
50
60
0 5 10 15 20Time (hr)
% P
I
Petroleum A240Coal Tar PitchWVU SynPitch
0
10
20
30
40
50
60
0 5 10 15 20Time (hr)
% P
I
Petroleum A240Coal Tar PitchWVU SynPitch
Figure 15. Pyridine Insoluble content of three pitches as a function of air-blowing time.
Van Krevelin plots provide insight into the behavior of pitches during air blowing. Briefly, from the time-dependent elemental analysis of each of the three pitches, the ratio of hydrogen to carbon is plotted on the ordinate and the ratio of oxygen

32
to carbon is plotted on the abscissa. Thus, as the sample loses mass, the competing processes of dehydroxylation, dealkylation and combined dealkylation-plus-dehydroxylation result in different characteristic paths. Specifically, during dehydroxylation, the sample characteristic will move from right to left; during dealkylation the characteristic will shift downward and to the right, and when both processes occur simultaneously, the plot will shift downward and to the left. Conversely, by examining the time dependent behavior of the sample, it is possible to make a judgment concerning the processes which are occurring in the sample.
0.8
0.9
1
1.1
1.2
1.3
1.4
1.5
1.6
1.7
0 0.1 0.2 0.3 0.4 0.5 0.6Atomic O/C Ratio
Ato
mic
H/C
Rat
io
DealkylationDehydroxylationDealkyl & Dehyrox
Dealkylation
Dehydroxylation
Dealkylation & Dehydroxylation
0.8
0.9
1
1.1
1.2
1.3
1.4
1.5
1.6
1.7
0 0.1 0.2 0.3 0.4 0.5 0.6Atomic O/C Ratio
Ato
mic
H/C
Rat
io
DealkylationDehydroxylationDealkyl & Dehyrox
Dealkylation
Dehydroxylation
Dealkylation & Dehydroxylation
Figure 16. Van Krevelen Plot Characteristic Curves.
Accordingly, Van Krevelen plots were developed for the Ashland-Marathon 240 petroleum pitch, Koppers coal tar pitch and WVU coal-derived Synpitch. The plo ts for all three pitches are shown in Figure 17. One might expect that all three pitches would exhibit similar behavior. However, this is not the case.
As can be seen from Figure 17, the three pitches exhibit three different types of reaction mechanisms when processed. The petroleum pitch exhibits behavior characteristic of dealkylation. The coal tar pitch exhibits behavior characteristic of dehydroxylation. The WVU Synpitch goes through both processes of dealkylation and dehydroxylation. Surprisingly, then, each pitch behaved differently during air-blowing. Using our processing technique, these pitches can easily be tailored to meet the specifications for the ideal applications.

33
0.45
0.50
0.55
0.60
0.65
0.70
0.75
0.80
0.002 0.007 0.012 0.017 0.022 0.027O/C Atomic Ratio
H/C
Ato
mic
Rat
io
Petroleum Pitch A240
Coal Tar Pitch
WVU Synpitch
0.45
0.50
0.55
0.60
0.65
0.70
0.75
0.80
0.002 0.007 0.012 0.017 0.022 0.027O/C Atomic Ratio
H/C
Ato
mic
Rat
io
Petroleum Pitch A240
Coal Tar Pitch
WVU Synpitch
Figure 17. Van Krevelen Plots of the 3 pitches, showing the different effects of air-blowing upon each pitch. 2.1.9 Coal Selection and Specification. It is well known that the rank and type of a coal feed material have a profound affect on extraction efficiency and product quality. For qualification and scoping purposes, a total of eight bituminous coals were extracted at 202 oC, the normal boiling point of the solvent N-methyl pyrrolidone (NMP). The coals examined are identified as Lower War Eagle, Hotchkiss, Glennies Creek, Bellbird, Panther Eagle, Pax Eagle, Marfork Eagle Seam, and Powellton/Cedar Grove Seam.
About a kilogram of each coal was ground individually in a Holmes hammer mill to about 20 Tyler mesh top size. The coals were then dried overnight in a vacuum oven at 110°C while maintaining a slow purge of nitrogen gas to remove excess moisture. The dried coal was added to NMP (50 grams coal to 500mL NMP, 1:10 ratio) while stirring in conventional laboratory glassware and brought to the normal boiling point of NMP (202°C) for 30 minutes. The mixture was cooled to about 80°C, transferred to a centrifuge bottle, and centrifuged for 30 minutes at 2000 g’s. The supernatant liquid was vacuum filtered through Fisherbrand G6 glass filter (1.6µm particle retention). The insoluble coal residue was washed from the centrifuge bottle and again extracted with boiling NMP, centrifuged, and the supernatant liquid filtered. The filtrate, containing NMP and soluble coal extract, was concentrated by removal of NMP in a rotary evaporation apparatus. Both insoluble coal residue and soluble coal extract were dried in a vacuum oven for 24 hours at 170°C under a slow purge of nitrogen gas before weighing to determine extraction yield. All mass balances were nearly, or slightly higher than 100%. The yield is defined as

34
coaldry
extract
mm
=η x 100%
where mextract is the mass of extracted coal and mdry coal is the mass of dry coal before extraction. The Glennies Creek and Bellbird coals had very low extraction efficiency, making the solutions difficult to centrifuge and filter. Thus using Glennies Creek coal, the coal to solvent ratio was reduced to 10 grams of coal in 500mL of NMP (1:50 ratio). This modification to the extraction procedure allowed the products to be more easily obtained. Table 8 below summarizes the yield of NMP-soluble extracts obtained from the raw coals.
Table 8. Yield of NMP-soluble extracts from select bituminous coals. Coal Sample Yield of Extract, wt% Lower War Eagle 46.2 Hotchkiss 5.1 Glennies Creek 27.8 Bellbird Not Determined Panther Eagle 25.3 Pax Eagle 43.6 Marfork Eagle Seam 43.0 Powellton/Cedar Grove Seam 47.7 Kingwood Coal 71.7
The extraction efficiencies are quite variable pointing to the importance of determining coal characteristics amenable to solvent extraction. To this end, conventional coal testing procedures were undertaken in seeking relationships among coal constitution, solvent extraction, and its effects on swelling and plasticity. Samples of coals were examined petrographically for vitrinite reflectance using established practices. Also, the coals were subjected to dilatometry and plastometry following established ASTM protocols. Figures 18 and 19 show how vitrinite reflectance relates to dilatometry and plastometry, respectively. Figure 20 shows the relation between vitrinite reflectance and extraction yield in NMP. For the coals examined, there is a clear correspondence of the thermoplastic behavior of the coal to extraction yield. The results indicate that either test can be used as a simple guide in the selection of coals for solvent extraction.

35
0
50
100
150
200
250
300
350
0.6 0.8 1 1.2 1.4 1.6 1.8
Coal Vitrinite Reflectance
Dila
tom
etry
, %E
xpan
sion
Figure 18. Dilatation of coal vs. vitrinite reflectance.
0
5000
10000
15000
20000
25000
30000
35000
0.6 0.8 1 1.2 1.4 1.6 1.8
Coal Vitrinite Reflectance
Gie
sele
r Pla
stom
etry
, DD
PM
Figure 19. Plasticity of coal vs. vitrinite reflectance.

36
0
10
20
30
40
50
60
0.6 0.8 1 1.2 1.4 1.6 1.8
Coal Vitrinite Reflectance
Ext
ract
Yie
ld, %
daf
Figure 20. Yield of NMP-soluble extract vs. vitrinite reflectance.
2.1.10 Use of Solvent Blends to Enhance Coal Extraction As an illustrative example of the synergistic effects of co-extraction and hydrogen donation, bituminous coal was extracted with a variety of solvents, including donor solvents. Then a second set of experiments was preformed using a blend of solvents, which resulted in improved extraction efficiency. In these experiments the solvent-to-coal mass ratio was held constant at 2:1. Hydrogen gas pressure was not applied. After charging the reaction vessel with coal and solvent, the reactor was immersed in a fluidized sand bath heater and agitated vertically at 500rpm through a stroke of 2.5 inches at 450°C for one hour. After this period the reactor was quenched in water to room temperature and then vented slowly. The solvent extraction efficiency of the coal was determined by measuring the solubility of the products in tetrahydrofuran (THF), a solvent commonly employed by those familiar with the characterization of coal extracts and liquids. Solvent extraction efficiency is the percentage difference in weight between the coal charged to the reactor and the dry residue insoluble in THF, as shown in Table 9. A series of hydrocarbon products was used as solvents for coal extraction. These hydrocarbon products include two tar fractions from byproduct metallurgical coke making: methyl-naphthalene distillates and Carbon Black Base (CBB) oil. A portion of CBB oil was air blown to increase its softening point temperature from a room-temperature paste to 92.3°C. This was done to determine whether crosslinking the solvent prior to coal extraction would have a desirable effect on conversion. A solvent of known high-hydrogen-donating ability in coal extraction, tetralin, was used to compare the extraction efficiency of the hydrocarbon products used as solvents.

37
Table 9. Conversion of a bituminous coal in various solvents. Solvent % Coal Dissolved Tetralin 56.2 Methyl-Naphthalene Distillates 22.0 Carbon Black Base Oil 19.5 Air-Blown Carbon Black Base Oil 39.0 Tar 36.8 Petroleum Asphalt 43.0 Next tetralin was blended with solvents listed in Table 10, such that the blend consisted of a 1:1 mass ratio of tetralin:solvent. Reaction conditions and product workup are identical to those described previously. The methyl-naphthalene distillates, Carbon Black Base oil and petroleum asphalt blends actually show an enhanced conversion compared to pure tetralin, illustrating the synergistic effect of combining solvents.
Table 10. Conversion of Bituminous Coal in Solvent Solutions with Tetralin. Solvent % Coal Conversion Tetralin (pure) 56.2 Methyl-Naphthalene Distillates 63.9 Carbon Black Base Oil 65.5 Air-Blown Carbon Black Base Oil 46.2 Tar 53.8 Petroleum Asphalt 59.6 It was hypothesized that coal dissolution is a function of the pressure inside the pores of the coal relative to the pressure of the atmosphere surrounding the solvent as the solute dissolves. To test this hypothesis, an extraction run under vacuum was performed. The Clausius Clayperon equation was used to predict the vapor pressure of NMP at unknown points, using two known vapor pressures at 20°C and 202°C. Figure 21 is a graph of the vapor pressure of NMP as a function of temperature. Thus, NMP produces a vapor pressure of approximately 37mm Hg at 110°C. An Erlenmeyer flask was connected to house vacuum (approximately 40mm Hg) and submerged in a sand bath at 115°C, as illustrated in Figure 22. Initial results suggest that there was no significant change in yield when the dissolution was run under vacuum. This could be because the solubility limit of coal extract is NMP is reached, because the vapor pressure of NMP at 115°C is not high enough to drive out coal particles surrounded by NMP, or because the process is not diffusion controlled.

38
0
50
100
150
200
250
300
350
400
450
500
550
600
650
700
750
800
0 20 40 60 80 100 120 140 160 180 200 220
Temperature (°C)
Vap
or
Pre
ssu
re (m
m H
g)
Figure 21. Vapor Pressure versus Temperature for n-methyl pyrrolidone.
Figure 22. Flask Under Vacuum.
UV-VIS spectroscopy data was used to measure the concentration of dissolved coal after reactions between coal and NMP in 10cc test tubes at different temperatures. The UV-VIS spectrophotometer measures absorbance as a function of wavelength above 250 nm. The shape of the absorbance spectrum for all coal samples are qualitatively the same. Thus, only one absorbance point is necessary to estimate the concentration of coal-NMP solutions using Beer’s Law, i.e.,

39
A = εbc ,
where A is absorbance, a dimensionless quanity, ε is the molar absorptivity, in units of liters per gram per centimeter, b is the path length in centimeters and c is the concentration in solution, in units of milligrams per liter. Accordingly, the measurement reference wavelength was chosen at 275 nm. The concentration of coal in solution is plotted as a function of reaction time and temperature in an NMP solvent bath.
Figure 23. Concentration of large coal particles (212-355 microns) as a function of time.
2.1.11 Ultrasonic Milling Data from Sonic Research Inc, Bridgeport CT, show that ultrasonic milling can be effective as a means of dispersing coal in various solvents. Earlier (Dec 2002), attempts were made to use an ultrasonic horn to assist the dissolution of coal in n-methyl pyrrolidone (NMP). This failed due to clogging of the ultrasonic device. A second device, referred to by the trade name Roto-MillTM, was trialed. A 4” Roto-MillTM, with smooth stainless steel rotor and stator was prepared along with the materials to be processed. These were an 8 pound bucket of MNP and 114 grams of coal powder. The NMP was poured into an open steel container and heated to 100 oC. Once the desired temperature was reached, pulverized Bakerstown coal (~200 mesh) was mixed in using a benchtop propeller mixer. After blending for approximately 5 minutes, the mixture was poured into a bucket and then poured into the mill’s funnel. At this time the mill was turned on with the gap setting at 0.10 mm. An 8 ounce sample was obtained and the gap was reduced to 0.05 and another sample was pulled. A gap setting of 0.01 was attempted, but the flow was practically stopped. Thus, the gap setting was increased to 0.025 and another sample was obtained. The final setting was 0.075. Table 11 summarizes the results. It is shown that 5 minutes at 100 oC provides adequate dissolution of the coal using the Roto-MillTM. This is comparable to 20-30
0 10 20 30
40 50 60 70
0 5 10 15 20 25 Time (minutes)
Con
cent
ratio
n (g
ram
/lite
r NM
P)
140°C 170°C 185°C 200°C

40
minutes at 200 oC using the existing Continuously Stirred Tank Reactor (CSTR). Thus strong consideration should be given to a Roto-MillTM or other type of mixing device to augment the capabilities of the CSTR now in use.
Table 11. Vacuum filtration through 1.6µm filter Test # Gap
Size Concentration g coal/100ml NMP
Dissolved fraction wt%
Filtration Rate
Ash Content Filtrate Wt%
Ash Content Insoluble wt%
2136-1 0.10 0.98 32.3 Good 0.24 6.4 2136-1 0.075 0.74 40.9 Good 0.84 6.6 2136-1 0.05 0.99 33.3 Slow 0.23 6.3 2136-1 0.025 1.18 28.9 Very
Slow 0.30 5.2
2.1.12 Process Economics In this section, relevant data and publications related to the Solvent Refined Coal-I (SRC-I) and the Exxon Donor Solvent (EDS) direct coal liquefaction processes are summarized. These two processes were selected because they are considered to be candidates for near term large scale production. Relative to petroleum crude, coal is deficient in hydrogen and contains considerably more heteroatoms and ash-forming minerals as shown in Table 12. In the past, several pilot plant or commercial-scale processes have been developed in order to convert coal into distillate hydrocarbons or a form capable of becoming fluid through the addition of hydrogen while at the same time facilitating the removal of heteroatoms and minerals.11,12 Direct liquefaction of coal is one such conversion process, in which the addition of hydrogen primarily occurs either from the gas phase and, or, through solvent donors under conditions of elevated pressure and temperature. The addition of 1 to 2 wt% hydrogen produces a low-ash room-temperature solid with softening point temperatures approximately with the range of 130 to 225 °C. Increasing the hydrogenation to 3 to 4 wt% generates a product that primarily is a heavy liquid at room temperature. On the other hand, as much as 8 to 15 wt% hydrogenation of coal is required to produce a predominately distillate product slate. Traditionally, direct coal liquefaction technologies have been targeted to the production of synthetic crude oil and fuels but not feedstocks for carbon-based industries. The former require considerable severe coal hydrogenation while the latter do not.13

41
Table 12. Analyses of coal and petroleum crude (wt% moisture free).14,15 Illinois Bituminous Coal Texas Petroleum Crude Carbon 71.5 84.9 Hydrogen 4.5 10.8 Sulfur 3.6 1.6 Oxygen 5.9 2.1 Nitrogen 1.2 0.5 Ash 13.3 0.1 Total 100.0 100.0
Although there are differences among the various direct coal liquefaction process designs, there is also enough similarity that a generalized flow scheme can be put together, as shown in Figure 24. The essential process elements common in direct coal liquefaction entail mixing crushed coal with a solvent to form a slurry. Solvent composition is critical to the successful plant operation, product distribution, and high coal conversion.14 Added metal-based catalytic agents are also beneficial.15 The slurry is pumped into the reactor, not necessarily but usually under hydrogen pressure, and heated at temperatures above 350°C. After reaction the products are separated into gases, liquids, pitch or residuum, and mineral- laden bottoms.
Liquefaction
Solvent
Coal
Hydrogen
Product Separation
Gases
Liquids
Bottoms Processing Ash
Figure 24. Generalized direct coal liquefaction scheme.
Table 13 provides some of the operating conditions and products from direct coal liquefaction processes that had reached large-production scale. Note that increasing pressure, temperature, and reaction time result in greater hydrogen utilization, more gas and liquids production, and less residuum formation. Figure 25 is a block flow diagram for the SRC-I process. In a one-step process, coal is dissolved in a solvent that donates hydrogen without the aid of added catalysts.

42
Table 13. Typical Conditions and Product Yields for Direct Coal Liquefaction. 16
Yield mass % daf coal
Process Pressure, psig
Temperature, °C
Residence Time, h
Hydrogen Used
HC Gas Liquids Residuum
SRC I 1,700 440 0.4 2.3 7 17 60 EDS 1,450 450 0.7 4.3 7 39 42
SRC II 1,800 460 1.0 4.8 18 41 28 Farben, 1st Stage
10,000
480
--
10.3
20.5
66.8
--
Net 2nd Stage
4,350 400 -- 14.5 25.9 61.4 --
SRC = solvent refined coal; EDS = Exxon donor solvent; all coals bituminous
Coal Preparation
Slurrying &
Pumping
Coa l Dissolution
Hydrogen Recovery
Fractionation Vapor/Liquid Separation
Acid Gas Removal
Solvent Recovery
Solids Separation
Air Separation
Claus & Tar Gas
Units
Product Solidification
Gasification Shift Conversion
Acid Gas Removal
Raw Coal
Crushed Coal
Reaction Product
Recycle Hydrogen
Fuel Gas
Sulfur
Oxygen
Make Up Hydrogen
Light Liquid
Process Solvent
Liquid Products
Mixed Liquids
SRC
SRC
Residue Solids
Product Slu rry
Wash Solvent
Figure 25. Block flow diagram of the SRC-I process.
The hydrogenation conditions are comparatively mild and the principal product is an essentially ash-free, pitch- like material (residuum or SRC) low in sulfur. The product can be used directly as a low-sulfur boiler fuel or can be upgraded by catalytic

43
hydrocracking to distillates in a separate second stage. Alternatively, the SRC can be converted to quality anode coke. Figure 26 is a block flow diagram of the Exxon Donor Solvent direct coal liquefaction process. The key feature of EDS is the removal of a portion of the 200 - 425°C distillate fractions for use as recycle solvents. The recycle solvent is first hydrogenated catalytically in a separate fixed-bed reactor prior to mixing with the coal. This configuration maintained a high proportion of donor solvent molecules in the liquefaction reactor ensuring high coal conversion and providing considerable latitude in operating conditions such that a variety of different coals could be processed.
Coal Feed Slurry Mixer
Slurry Preheater
Coal Dissolution
Vapor/Liquid Separation
Gas Separation
Atmospheric Distillation
Vacuum Distillation
Coker
Gasifier Catalytic Solvent
Hydrogenation
Steam Oxygen
Steam Air
Bottoms
Recycle Solvent
H 2
H 2
Light Distillate
Heavy Distillate
HC Gas
Figure 26. Simplified Block Flow Diagram of the EDS Process.
The SRC-I process has a high yield of pitch- like extract, while the EDS process is of interest because of its ability to maintain high solvent activity. 17,18 In addition, the EDS operating conditions could be changed to maximize pitch, reduce light hydrocarbons and hydrogen consumption, though the results and data presented were for optimum distillate yield. Table 14 compares gross product yields and thermal efficiencies.

44
Table 14. Comparison of Extraction Characteristics Description SRC-I, Case 119 EDS20
Hydrocarbon Yield, wt % Gases (C1– C4) 7.05 Naphtha (C5– 177C) 5.09 Fuel Oil (177-454C) 61.44 Resid (SRC 454+C) 11.94 Gases (C1– C3) 7.0 Liquids (C4– 540C) 37.2 Resid (SRC 540+C) 40.1 Total Hydrocarbon Yield, wt. % 85.52 84.3 Hydrogen Consumed, wt. % 2.30 4.3 Process Thermal Efficiency, % 73 63 Table 15 provides overall material balances for the two liquefaction processes. Both conversion systems are based on 30,000t/d of bituminous coal to the plant’s reactor. Gray and Tomlinson’s estimates were used for the EDS bituminous coal conversion case. Since their results are reported on a moisture-and-ash-free basis, the results were converted to a t/d basis by assuming that a bituminous coal containing 8 wt% ash was used. Note the results for the EDS process in Table 15 do not exactly correspond with those in Table 16 because the source data and assumptions differ slightly.
Table 15. Overall Material Balances for the SRC-I and EDS Processes. Process Description
SRC-I EDS
Feedstock, t/d Coal to Reactor 30,000 30,000 Coal to Gasifier/Steam 2,825 2,500 Total Coal Consumed 32,825 32,500 Products, t/d Fuel Gas (C1-C4) -- 3,260 Naphtha+Fuel Oil 15,326 Naphtha (C5– 177C) 1,368 Fuel Oil (177-454C) 3,210 Resid (SRC 454+C) 15,824 8,478 Sulfur 956 -- Total Products 21,358 27,064
Tables 8 and 9 summarize the operating costs and selling prices for the SRC-I and EDS direct coal liquefaction processes, respectively, based on Phillips et al.’s estimates

45
for SRC-I and Gray and Tomlinson’s analysis of the EDS study. The EDS process produces 2.8 Bbl coal liquids/ton coal and 3.9 Bbl coal liquids/ton coal liquids.
Table 16. Cost Factors for the SRC-I Process (M$/yr, 2002 Dollars). Description Cost Coal @ $79.05/ton (32.8 kt/d) 856 Other Variable Costs Filter Aid @ $420/ton 44.5 Chems and Lubes 29.6 Power @ 25 mills/KWH 130.9 Labor Related 46.9 Maintenance (4% Deprec. Inv.) 185.2 SUBTOTAL 1,293 Capital Charges @ 16% 738.5 TOTAL 2,031.5 Net Products (Mtons/yr) 7.05 Product Price ($/ton) 288
Table 17. Enthalpy Parameters Used in Energy Balance Chemical Specific Enthalpy
Naphtha (C5 – 177C) 19,175 Btu/lb Fuel Oil (177 – 454C) 17,428 Btu/lb Residuum/SRC (454 + C) 15,800 Btu/lb Coal 12,802 Btu/lb 2.2 Coal Derived Carbon Foam Carbon foams are porous forms of solid carbon that can be made from a variety of feedstocks. Potential feedstocks include SECO, hydrotreated coal (H-coal), Synpitch, coal, and coal tar pitch. Significant progress has been made in developing protocols to produce foam using these materials. Of particular note was the development of a procedure for making foam at atmospheric pressure. Controlling the density of the foam was also an important area of work. Carbon foam is of interest because of its unique mechanical properties, particularly its ability to absorb energy as it is crushed. Figure 27 shows a foam sample made from Synpitch and Figure 28 is a scanning electron micrograph showing the porous nature of a carbon foam sample.

46
Figure 27. 8 inch diameter Synpitch-Derived Foam sample.
Figure 28. Scanning Electron Micrograph of Carbon Foam.
2.2.1 Foaming Protocols A typical foaming run begins with grinding the feedstock to a powder of about 50 to 100 mesh. The foaming precursor can be blended with a reinforcement material which may include carbon nanofibers, conventional carbon fibers or other fibers.21 The foaming material is placed in a mold which determines the shape of the material in all directions except for the vertical direction. Foaming occurs in a nitrogen or inert gas pressurized autoclave. The temperature is typically ramped at about 2 oC /min to a peak temperature of 400 to 500 oC with nitrogen pressures of up to 500 psi. As the material is heated, it begins to have at least some fluid characteristics. Pitch-based materials become true fluids while materials such as raw coal and SECO experience a semi-fluid state that is more like a sticky paste. At elevated temperatures, volatile gases begin to be evolved. The volatile gases result in bubbles being formed in the fluid material. The high

47
temperature also results in cross- linking of the carbon chains. This results in the fluid becoming more and more viscous until it finally becomes a solid. This is called carbonization. As a result, the foamed structure is locked in place; the material can not become fluid again. This foam is called green foam and is relatively weak, particularly for the feedstocks that do not reach a true fluid state before carbonizing. After removing the samples from the molds, they are then calcined at 1000 oC to 1200 oC at ambient pressure in nitrogen or some other inert gas. Calcining can be accomplished in laboratory furnaces, or using a special calcining furnace donated by Alcoa. This completes the devolatilization as well as cross-linking processes, resulting in substantially improved mechanical properties.
One significant drawback of the traditional foaming process is the high pressure needed during the foaming phase. The requirement for a high pressure autoclave (Figure 29) is not an issue for laboratory work but would significantly increase the cost of producing the foam on an industrial scale. Furthermore, it limits the ultimate size of the foamed piece because of the massive hoop stresses that develop in a large autoclave. It was observed that changes in the pressure during foaming resulted in changes in the density of the foam. As the pressure decreased, the density of the foam also decreased, as a result of the evolved gas volume being larger (think ideal gas law). Thus, by controlling the amount of gas that is evolved and by controlling the fluidity of the precursor, high quality foam could be made at practically any pressure, even atmospheric pressure. Figures 30 and 31 show the progression of enhancements that has been made in making mechanically robust foam at atmospheric pressure. Producing foam at atmospheric pressure results in major cost savings over the high pressure approach because no autoclave is needed and the process can be converted to a continuous process from a batch process.
Figure 29. High Pressure Autoclave

48
Figure 30. Carbon Foam Samples. The figure of merit was increased from left to right, corresponding with improved mechanical integrity. The sample on the left is the weakest and in fact crumbled in the test crucible.
Figure 31. Close-up of higher density, higher strength material.
2.2.2 Control of Foam Density The ability to control the density of the foam is critical to being able to produce robust foam at atmospheric pressure. Dilatation and fluidity are two properties of the foam precursor that have a significant impact on the density of the resultant foam. Figure 32 shows a photo of the apparatus used for the dilatometry studies. Figure 33 shows the

49
relationship between dilatation and foam density. Fluidity is measured using a Gieseler plastometer. This device uses a stirrer to which a constant torque is applied. As the temperature of the sample is changed, the number of dial divisions per minute (DDPM) through which a stirrer can be turned is recorded. Several approaches have been found to control the density of the foam. Two methods are physical in nature: blending of feedstocks and regulating partic le size. Two methods are chemical in nature, air oxidation and solvent washing. One method is process dependent: heating rate during foaming.
Figure 32. Dilatometer used for coal swelling trials.

50
0.15
0.2
0.25
0.3
0.35
0.4
0.45
0.5
0 50 100 150 200 250
Dilatation, %
Den
sity
of U
ncal
cine
d fo
am, g
/cm
3
50-100 mesh 100-200 mesh
Figure 33. Correlation of Foam Density with Dilatometer Measurements.
Blending of coals with different properties was shown to be an effective technique for varying fluidity and dilatation. Powellton coal ground to 50-100 mesh produces a high dilatation at ambient pressure, resulting in very low density foam that has little structural integrity. Powellton coal also exhibits high Gieseler fluidity (about 30,000 dial divisions per minute) at ambient pressure and 450 oC temperature. Conversely, Lower War Eagle coal exhibits zero fluidity at the same conditions and thus does not produce a porous foam at all, but rather remains in powdered form. By blending Powellton coal and Lower War Eagle in a 1:1 ratio by mass, a Gieseler fluidity of 166 dial divisions per minute was obtained. The resultant foam had a density of 0.71. The particle size of the feed stock also has an effect on the foaming behavior. The density of foam made from WVGS13421 SECO with different particle size was compared, see Table 18. Somewhat surprisingly, it was found that the finer particles tend to produce lower density foam. It would seem that the particle size would not affect the foam density, because coal softening and melting should not depend on the particle dimensions. However, in reality WVGS13421 SECO is not very fluid. The maximum fluidity as measured by Gieseler Plastometer testing is only about ~100 dial divisions per minute. Thus finer particles may release the light fractions more quickly, resulting in the release of more “bubbling agent” into the system. If so, this might result in more foaming and thus lower density foam. No correlation was observed between particle size and weight loss during foaming and calcining, as might be expected. Calcining is successful at driving off nearly all volatiles irrespective of the particle size.

51
Table 18. Effect of Particle Size on Foaming Behavior Bulk Density, g/cm3 Weight loss in each step, wt% Sample Particle
size, mesh
Uncalcined Foam
Calcined Foam
Raw material to Uncalcined foam
Uncalcined foam to calcined foam
Total Volume change,
,uncalcined
calcined
VV
% WVGS13421 SECO
50-100 0.35 0.48 21.9 12.9 32.0 61.0
WVGS13421 SECO
100-200 0.28 0.38 21.5 13.4 32.0 60.0
Partial air oxidation has been shown to be a suitable method for controlling
sample swelling, density and fluidity during coking, thus enabling the synthesis of carbon foam at atmospheric pressure. Typically, oxidation is accomplished by heating a ground coal sample to a temperature of 100 to 150oC in air and holding it at temperature for one to five hours. Tables 10 and 11 show the characteristics of carbon foam made from Powellton and Lower War Eagle coals when the coal was subjected to various levels of oxidation. As the oxidation time and temperature increased, the density of the foam also increased. The underlying cause for this increase in density can be seen in Figures 34 and 35. Figure 34 shows the effect of oxidation on the dilatation. Longer oxidation periods decreased the dilatation which in indicates the density of the foam should increase. Figure 35 shows the effect of oxidation on the fluidity of the sample. Longer oxidation periods decreased the maximum fluidity and also increased the temperature at which the maximum fluidity occurred. Studies were made to determine the chemical structure change of the coal during air oxidation. TGA results indicate only a 1% weight increase from oxidation of Powellton coal at 135°C for 5hr. The only chemical structure change during this oxidation observed by FTIR is the introduction of hydroxyl groups. These OH groups may cause a series of reactions in the foaming step, including formation of carbonyl and dewatering to form ether bond which may be a key to decreasing the fluidity and dilatation.
Table 19. Characteristics of carbon foam made from Powellton coal Bulk Density, g/cm3 Weight loss in each steps, wt% Oxidation
time, hr @135°C
Particle size, mesh
Uncalcined Foam
Calcined Foam
Raw material to uncalcined foam
Uncalcined foam to calcined
Total Volume change,
,uncalcined
calcined
VV
% 1.7 50-100 0.16 0.22 26.0 8.6 32.4 63.2
2 50-100 0.18 0.25 26.1 8.1 32.1 60.3 4 50-100 0.20 0.30 26.0 9.7 33.2 59.1
4.5 50-100 0.24 0.36 25.0 10.0 32.5 59.0 5 50-100 0.27 0.40 25.0 10.9 33.2 57.6
1 100-200 0.25 Sample broke 19.1 10.7 27.8 2 100-200 0.29 0.41 18.8 11.9 28.5 58.9 3 100-200 0.37 0.47 18.0 12.6 28.3 66.0 4 100-200 0.38 0.47 18.9 13.0 29.4 67.9 5 100-200 0.46 0.58 19.9 13.2 30.5 67.6

52
Table 20. Characteristics of Carbon Foam Made from Lower War Eagle coal
Bulk Density, g/cm3 Weight loss in each steps, wt% Oxidation temperature and time
Particle size, mesh
Uncalcined Foam
Carbon Foam
Raw material to Uncalcined foam
Uncalcined foam to carbon foam
Total Volume change,
,uncalcined
calcined
VV
% 115°C-40min
100-200 0.28 0.37 17.7 11.1 67.5
130°C-40min
100-200 0.47 0.61 16.8 13.2 32.1 65.9
-50
0
50
100
150
200
250
300
380 400 420 440 460 480
Temperature, °C
Dila
tatio
n, %
POW-raw
POW-O-135°C-120min
POW-O-135°C-240min
POW-O-135°C-270min
POW-O-135°-300min
Figure 34. Parametric Effect of Oxidation Time on Dilatation. The particle size was 50-100 mesh.

53
0
200
400
600
800
1000
1200
1400
1600
1800
400 420 440 460 480 500
Ro
tati
on
rat
e, D
DP
M
POW-O-135°C-2hr
POW-O-135°C-3hr
POW-O-135°C-4hr POW-O-135°C-5hr
Termperature, oC
Figure 35. Parametric Effect of Oxidation Time on Fluidity. Solvent washing was also shown to reduce fluidity and improve the characteristics of carbon foam. Bakerstown coal was ground to 100-200 mesh and soaked in n-methyl pyrrolidone for one hour at 202oC. The solvent was removed and the coal was air dried. The effect on coal properties is shown in Table 21. Using NMP-treated Bakerstown coal, a foam sample was produced with density of 0.41.
Table 21. Modification of Coal Properties from Solvent Washing. Samples Dilatation,
% Max
Fluidity, DDPM
Softening Point,
oC
Resolidification Temperature,
oC
Plastic range,
oC Bakerstown raw coal
277 11612 @443°C
396 487 91
Bakerstown, NMP-Treated
110 417 @ 450 oC
411 474 63
The heating rate during foaming has a significant effect on the final foam properties. Higher heating rates appear to result in lower density foam as seen in Table 22. When a slower heating rate is used, more of the volatile gases have an opportunity to leave the foam before carbonization occurs. Smaller quantities of gas translate into a higher density foam sample.

54
Table 22. Effect of Heating Rate on Foaming Behavior Density, g/cm3 Weight loss in each step, wt% Sample Particle
size, mesh
Heating rate, °C/min
Un-calcined Foam
Calcined Foam
Raw material to uncalcined foam
Un-calcined foam to calcined
Total Volume change,
,uncalcined
calcined
VV
% WVGS13421 SECO
50-100 1 0.35 0.48 21.9 12.9 32.0 61.0
WVGS13421 SECO
50-100 2 0.24 0.36 23.9 12.2 33.2 58.0
Oxidized Powellton raw coal(5hr)
50-100 1 0.33 0.53 19.8 12.1 29.5 54.6
Oxidized Powellton raw coal(5hr)
50-100 2 0.27 0.40 25.0 10.4 33.2 57.6
2.2.3 Mechanical Properties of Carbon Foam
Enhancing the mechanical properties of the foam are very important for expanding the potential fields of application for the material. Typical metrics such as compressive strength, flexural strength and tensile strength are important as with any potential structural material. Another metric that is equally important is the crush energy of the carbon foam. This is a key material property in analyzing the attractiveness of carbon foam for applications such as crash protection, blast protection, armor and lightweight structures. Foam does not fail like most other materials. During compression testing, the sample continues to resist compression after the initial rupture strength of the sample is reached. This happens because the sample is made up of many small cells that each have a unique rupture strength. Thus each cell must be ruptured individually, thus absorbing significant quantities of energy. The total energy required to crush the sample is the area under the stress-strain curve,
∫ ε= SALdE ,
where S is the strength, A is the unit normal area, L is the original thickness of the sample, and ε is the normalized strain. The crush energy per unit volume is
ε=≡ SdVdE
EV ,
and the crush strength per unit mass is
ρε=
ρ≡ S
dVdE
Em
,

55
where ρ is the apparent density. For foam with an apparent density of 500 kg/m3, and compressive strength of 35 MPa and maximum achievable compressive strain of 0.7, the approximate specific crush energy is 50 kJ/kg. The actual specific crush energy likely depends upon the energy delivery rate, as well as geometry. The state of the art for mechanical property enhancement is still defined by work performed by Alig et al. in a DOD-sponsored Phase I SBIR. 22 Tables 23, 24 and 25 summarize typical mechanical properties which were attained through these methods. Compression tests were conducted with the use of a modified Instron rheometer. Relatively small samples (0.5 in2 × 0.5 in. tall) were necessary due to the high strength of the foam and instrument limitations. Nanofiber reinforcement was added using carbon nanofibers supplied by Applied Sciences Inc. Nanofibers are carbon filaments with diameters ranging from 50-200 nm and lengths about 100 microns.23 Two different processes were used for de-bulking the fibers. A low-shear wet processing method was employed at ASI, and a high-shear wet processing method was used at the Littleford Day Company of Florence, KY. The results suggest that higher compression strength and modulus resulted from the fiber- loaded samples, though additional data would be useful to confirm this trend.
Table 23. Summary of Compression Results.24 co c1 Density Compressive
Modulus Compressive
Strength %mass %mass g/cc MPa (kpsi) MPa (kpsi)
Control 0.0 0.491 361 (52.3) 19.8 (2.87) 0.0 0.479
Low-Shear Dry 0.5 0.665 0.497 472 (68.4) 20.2 (2.93) 1.0 1.327 0.485 456 (66.1) 17.4 (2.52) 2.0 2.657 0.511 3.0 3.877 0.556 384 (55.7) 21.4 (3.10) 4.0 5.035 0.583 440 (63.8) 21.7 (3.15)
Low-Shear Wet 3.0 3.817 0.581 446 (64.7) 33.1 (4.80)
High-Shear Dry 0.5 0.697 0.499 481 (69.7) 23.8 (3.45) 1.0 1.327 0.497 487 (70.6) 23.5 (3.41) 2.0 2.599 0.509 321 (46.5) 21.8 (3.16) 3.0 3.862 0.523 501 (72.6) 26.4 (3.83) 4.0 5.065 0.531 5.0 6.212 0.551 426 (61.8) 25.4 (3.68) 6.0 7.406 0.577 487 (70.6) 23.2 (3.36)
High-Shear Wet 3.0 3.829 0.507 448 (65.0) 34.7 (5.03)

56
Table 24. Tensile Properties of Foam25 Sample Width
(in) Thickness (in)
Load at Peak (lbs)
Stress at Peak kPa (psi)
Tensile Modulus, MPa (ksi)
Strain at Peak (%)
Control 0.4059 0.2517 14.16 957 (138.6)
321 (46.5) 0.30
LDN-1 0.4034 0.2533 30.75 2076 (300.9)
695 (100.7 ) 0.87
LDN-3 0.4140 0.2439 20.27 1385 (200.7)
802.5 (116.3) 0.19
Table 25. Flexural Properties of Foam26 Sample Width,
in Thickness, in
Load at Peak, lbs
Displacement at Yield, in.
Stress at Peak, kPa (psi)
Flexural Modulus MPa (ksi)
Control 0.5605 0.2539 12.53 0.0069 3589 (520.2)
433 (62.8 )
P1-1 0.6501 0.2509 36.35 0.0033 9183 (1331.0)
1864 (270.2)
LD-1 0.5260 0.2438 16.05 0.0038 5314 (770.2)
962 (139.4)
LDN-2 0.5393 0.2389 18.73 0.0035 6300 (913.0)
1260 (182.6)
During compression testing, it was obvious that the samples continue to resist compression even after initial failure had occurred. However, because the samples were not constrained radially, the actual cross section of the fractured sample could not be reliably estimated and as a consequence, it was difficult to obtain a meaningful estimate of the strain-dependent force required to completely compress the foam samples.
To remedy this difficulty, a piston assembly was constructed out of stainless steel in order to control the sample cross-section during compression testing. This provides a one dimensional volume change as the samples are compressed. A uniform sample is expected to demonstrate near-constant stress as it is compressed from its initial volume to its final packed state, in which essentially all void-space has been removed.
First, a hollow, stainless steel cylinder was turned with an inside diameter of 1.00 in. Next, a 3.00 in long solid plunger and a 0.50 in long solid plug were both made with an outside diameter of 1.00 in. The plug is employed as a false bottom for the sample chamber cavity to ensure the crushed sample can be removed.
The foam samples were cut out using a regular 1.25 in carbide-tip hole-saw on a stationary drill press. This results in a specimen with 1 in OD, a tight fit for the sample cylinder. Once the samples are cut out, the ends are cut parallel using a diamond-impregnated blade on a wet tile saw. The cut samples are set aside to dry before they are tested.
A dry sample is placed in the sample cylinder, between the plug and the plunger. The sample chamber is centered on the lower platen of the Instron load frame. The upper

57
platen is lowered to a point where it simply touches the top of the plunger of the sample chamber. The Instron test is then accomplished.
The purpose of using the sample chamber is to gather data that can yield the total energy absorbed by each foam sample. The total energy absorbed per unit volume is found by integrating the area under the Stress vs. Strain plot. Integration was carried out using the Newton-Cotes closed integration formula known as the trapezoidal rule where:
nni xxx −= +1
21++
= nni
yyy
1001
∑=
i
ii yxA
The total area A is calculated by the summation of the products of each individual
piece of area. The individual pieces are defined as the product of xi and yi. The term, xi, is defined as the difference between two consecutive data points of strain (%), where the yi term is the arithmetic mean of two consecutive data points of stress (MPa). The area under the plot is the total energy absorbed per unit volume expressed in MJ/m3, and dividing the total energy by the sample density results in specific energy (kJ/kg). Stress vs. Strain plots varied slightly for each crushed foam sample. Most of the samples gave yield stress results between 1 and 6 MPa. However, samples produced from Powellton Extract 2 gave the best results in every category. Compression tests produced a smooth, uniform plot, the highest yield stress, as well the most energy absorbed as shown in Figure 36. Table 1 shows the properties of interest measured for each sample that was tested, with the energy absorbed normalized by weight by dividing each specimen by its apparent density. It is important to note that each type of sample was only tested once; therefore, no statistical data can be reported.

58
Figure 36. Stress vs. Strain Plot for carbon foam derived from Powellton Coal Extract 2. The flat plateau is an indication that the sample has approximately uniform strength throughout its volume.
Table 26. Compression Test Results for Carbon Foam
Specimen
Density (g/cm3)
Energy Absorbed
(kJ/kg)
Young’s Modulus (MPa)
Yield Stress
(MPa) Kingwood Coal 0.32 5.2 193 2.9 Hydrogenated Coal 0.36 7.4 212 2.8 Petroleum Pitch 0.34 8.5 172 4.0 Lower War Eagle Coal 0.33 9.4 252 5.6 Bakerstown Coal 1 0.36 12.9 148 8.1 Bakerstown Coal 2 0.40 16.6 264 10.0 Bakerstown Coal 3 0.38 9.9 131 5.6 Powellton Extract 1 0.25 7.4 100 1.7 Powellton Extract 2 0.31 34.8 470 18.7 Mitsubishi Pitch 0.34 6.5 71 1.6
In addition to the foam feedstock material, pore structure, size, and distribution
are suspected to be key contributors to the strength of the foams. The Powellton Coal Extract 2 sample was found to be the only sample that contained mostly closed-cell pores, which is likely to explain why its strength and modulus are much higher than those of the other samples tested. This sample also contained a very uniform pore distribution as opposed to other samples which exhibit different sized pores throughout.
0
2
4
6
8
10
12
14
16
18
20
0 10 20 30 40 50 60 70
Strain (%)
Stre
ss (M
Pa)

59
The best mechanical properties were obtained from SECO produced from Powellton coal. This may reflect the superior characteristics of this feedstock, but in addition, it was noted that very fine porosity was obtained from this sample. When similar porosity and density can be regularly reproduced throughout different samples, it will be possible to compare feedstock contribution to carbon foam properties. At present, however, processing irregularity remains a significant variable. Nevertheless, the results suggest that SECO-derived foams offer enhanced mechanical properties compared to raw coal or pitch feedstocks. Compression yield strength is not a complete figure of merit measurement trials have been carried out on several pieces of carbon foam, using a piston to contain the foam while it is tested on the Instron machine. This permits continuous measurement of the strength of the foam sample as it is crushed. Theoretically, perfectly uniform foam would be expected to have a sharp initial rise, followed by a constant stress as the sample is compressed from its original volume to about 30% of its original volume (i.e., 70% compressive strain). At this point the stress should abruptly rise as full compression is reached. This approximate behavior is illustrated in Figure 37.
0
0.5
1
1.5
2
2.5
3
3.5
4
4.5
5
0 10 20 30 40 50 60 70 80
Comp. strain (%)
Co
mp
. str
ess
(MP
a)
Figure 37. Compressive strength measurement, following the model of a uniform, brittle foam.
Other samples, especially high density samples made from hydrogenated pitch have a ramp increase in strength as it is crushed, often in a nearly linear ramp. This behavior is shown in Figure 38. This may be due to the variation in the size and strength of the pores in the sample. If so, the weaker pores are presumably crushed first, with stronger pores being crushed only at higher strains if at all.

60
If this notion is correct, the slope of the ramp should yield information about pore size and strength distributions. In addition, this would be beneficial from the standpoint of impact protection. That is, the foam can offer increasing resistance as it is crushed, resulting in a smoother deceleration of impact. The data indicate excellent crush strength and crush energy from carbon foam fabricated from hydrogenated Synpitch. The more aromatic Synpitch was expected to be able to form stronger bonds upon cross- linking and calcining. This is borne out by the findings shown below in Figures 38-43. Sample 1 had an apparent density of 0.310 g/cm3 and Sample 2 had an apparent density of 0.346 g/cm3. This is lower than typical protocols which produce an apparent density of about 0.5 g/cm3. Figure 40 illustrates the total energy absorption as Sample 1 was compressed.
0
2
4
6
8
10
12
14
16
18
20
0 10 20 30 40 50 60 70 80
Compressive Strain (%)
Com
pres
sive
Str
ess
(MP
a)
Figure 38. Hydrogenated pitch derived foam sample 1 crush strength as a function of strain.

61
0
2
4
6
8
10
12
14
16
0 10 20 30 40 50 60 70 80
Compressive strain (%)
Co
mp
resi
ve S
tres
s (M
Pa)
Figure 39. Hydrogenated pitch derived foam sample 2 crush strength as a function of strain.
0
1
2
3
4
5
6
7
8
9
0 10 20 30 40 50 60 70 80
Normalized Compressive Strain, Percent
Sp
ecif
ic C
rush
En
erg
y, k
J/kg
Figure 40. Hydrogenated pitch derived foam sample 1 crush Energy as a function of Strain.

62
0
1
2
3
4
5
6
7
8
0 10 20 30 40 50 60 70 80
Normalized Compressive Strain, Percent
Sp
ecif
ic C
rush
En
erg
y kJ
/kg
Figure 41. Hydrogenated pitch derived foam sample 2 Crush Energy as a function of Strain.
2.3. Carbon Fibers from Coal The purpose of this task is to produce carbon fibers using coal-derived feedstocks. Efforts on this task were augmented by an additional grant from the University/NETL Student Partnership Program, which sponsored efforts by student assistant James R. Bowers, who carried out fiber spinning and mechanical property characterization. Pitch development for fiber spinning was carried out under the current effort, DE-FC26-01NT41359. Carbon fibers have been spun from coal pitches for decades. At first glance, it would seem that this is a perfect application for coal-derived pitch, given the low price of such pitches, and the large markets for carbon fiber, which are now used in markets ranging from sporting goods to aerospace. However, serious obstacles remain. First and foremost polyacrylonitrile (PAN) derived carbon fiber remains the industry favorite for most structural applications. Briefly, processes for manufacturing PAN derived fibers begin with a solution of PAN copolymer in a highly polar solvent such as sodium thiocyanate or dimethylacetamide. This solution is extruded through a multihole spinneret and precipitated in a liquid bath to form multifilament fibers as a continuous tow, which is collected on a takeup reel. Then the fibers are stabilized by heating in air to temperatures ranging from 240 oC to 300 oC. Lastly, the stabilized, crosslinked fibers are heat-treated in an inert gas environment at a temperature in excess of 1100 oC. This drives off the non-carbon elements, yielding a carbon fiber. The result is a continuous multifilament yarn. PAN-derived fibers currently have sold for as little as $10 per pound. Currently 90% of all commercial carbon fibers
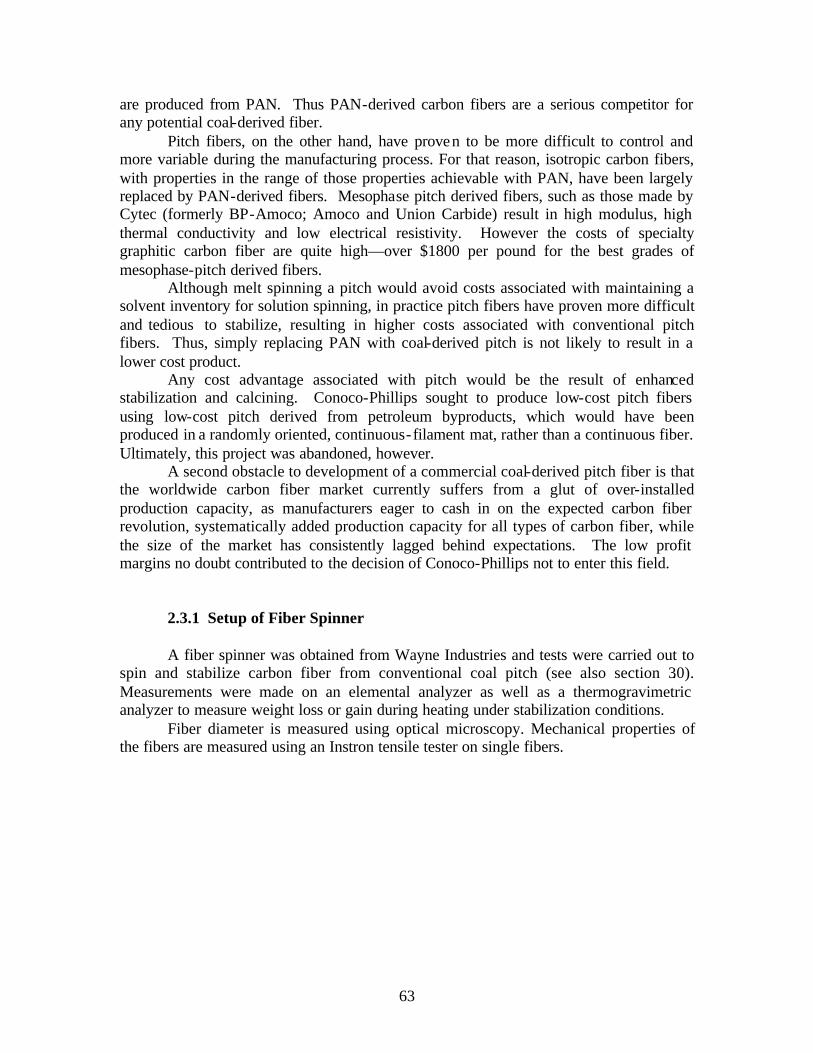
63
are produced from PAN. Thus PAN-derived carbon fibers are a serious competitor for any potential coal-derived fiber. Pitch fibers, on the other hand, have proven to be more difficult to control and more variable during the manufacturing process. For that reason, isotropic carbon fibers, with properties in the range of those properties achievable with PAN, have been largely replaced by PAN-derived fibers. Mesophase pitch derived fibers, such as those made by Cytec (formerly BP-Amoco; Amoco and Union Carbide) result in high modulus, high thermal conductivity and low electrical resistivity. However the costs of specialty graphitic carbon fiber are quite high—over $1800 per pound for the best grades of mesophase-pitch derived fibers. Although melt spinning a pitch would avoid costs associated with maintaining a solvent inventory for solution spinning, in practice pitch fibers have proven more difficult and tedious to stabilize, resulting in higher costs associated with conventional pitch fibers. Thus, simply replacing PAN with coal-derived pitch is not likely to result in a lower cost product. Any cost advantage associated with pitch would be the result of enhanced stabilization and calcining. Conoco-Phillips sought to produce low-cost pitch fibers using low-cost pitch derived from petroleum byproducts, which would have been produced in a randomly oriented, continuous-filament mat, rather than a continuous fiber. Ultimately, this project was abandoned, however. A second obstacle to development of a commercial coal-derived pitch fiber is that the worldwide carbon fiber market currently suffers from a glut of over-installed production capacity, as manufacturers eager to cash in on the expected carbon fiber revolution, systematically added production capacity for all types of carbon fiber, while the size of the market has consistently lagged behind expectations. The low profit margins no doubt contributed to the decision of Conoco-Phillips not to enter this field. 2.3.1 Setup of Fiber Spinner A fiber spinner was obtained from Wayne Industries and tests were carried out to spin and stabilize carbon fiber from conventional coal pitch (see also section 3.0). Measurements were made on an elemental analyzer as well as a thermogravimetric analyzer to measure weight loss or gain during heating under stabilization conditions. Fiber diameter is measured using optical microscopy. Mechanical properties of the fibers are measured using an Instron tensile tester on single fibers.

64
Figure 42. A Wayne fiber spinner and take-up reel were used to spin fiber from coal-derived pitches.
Figure 43. Take-up reel device.
As noted previously, Solvent Extracted Carbon Ore (SECO) is not a true pitch, since as it is heated, it devolatilizes before softening. Thus SECO can not be used to spin fibers.

65
Accordingly a new process was developed for modifying SECO to permit it to be spun into fibers. This was accomplished by blending SECO with petroleum pitch. Technical advantages sought include high cross- linking reactivity of SECO which could permit stabilization to occur more readily than in conventional coal tar pitches. In addition, improved mechanical properties were sought, based on the expectation that high molecular weight, high aromaticity and high cross linking reactivity would improve atomic scale bonding during calcining.
Figure 44. SECO-derived fibers were successfully spun and stabilized for the first time ever.
SEM photomicrographs were made of carbon fibers spun from a mixture of 10% SECO (Bakerstown coal) and Ashland A-240 petroleum pitch. Normally, Ashland A-240 is not an acceptable candidate pitch for spinning fibers because it is too volatile to be stabilized. It was hoped that the under-volatile SECO would compensate for the volatility of the Ashland A-240 pitch. Fibers were successfully obtained, but as shown below large defects were present, including voids. The voids are likely formed during stabilization, and may be due to devolatilization of Ashland A-240. Finally Table 26 lists the diameter, tensile strength and modulus of commercial PAN and pitch fibers along with the corresponding values for fibers from coal-derived precursors.

66
Figure 45. SEM photomicrograph of Synpitch-Derived Carbon Fibers, showing defects and irregular surfaces.
Figure 46. SEM photomicrograph showing a WVU Synpitch-Derived Carbon Fiber. Note the irregular grooves on the surface.

67
Figure 47. SEM photomicrograph of a Synpitch-Derived Carbon Fiber, showing holes.
Figure 48. SEM photomicrograph showing two holes in a Synpitch-Derived Carbon Fiber.
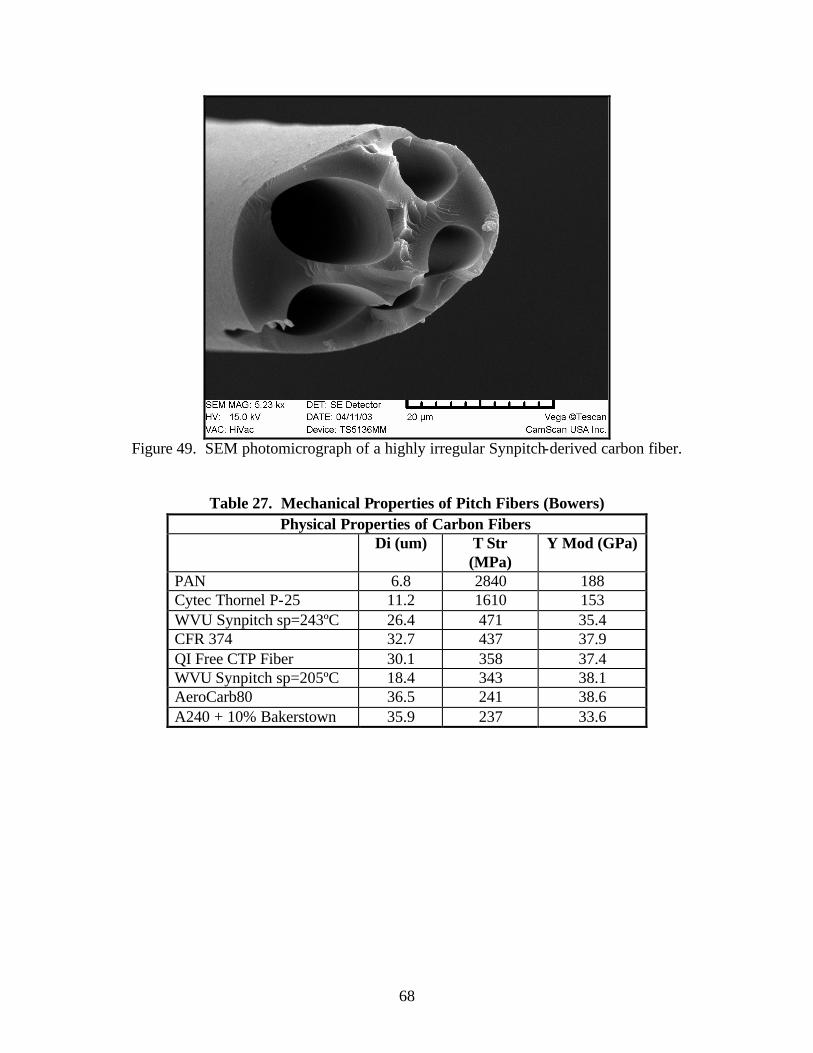
68
Figure 49. SEM photomicrograph of a highly irregular Synpitch-derived carbon fiber.
Table 27. Mechanical Properties of Pitch Fibers (Bowers) Physical Properties of Carbon Fibers
Di (um) T Str (MPa)
Y Mod (GPa)
PAN 6.8 2840 188 Cytec Thornel P-25 11.2 1610 153 WVU Synpitch sp=243ºC 26.4 471 35.4 CFR 374 32.7 437 37.9 QI Free CTP Fiber 30.1 358 37.4 WVU Synpitch sp=205ºC 18.4 343 38.1 AeroCarb80 36.5 241 38.6 A240 + 10% Bakerstown 35.9 237 33.6
69
3.0 Summary of Laboratory Capabilities The following is an updated presentation of the capabilities of the Chemical Engineering Department’s newly established Analytical Laboratory, using equipment described below has been purchased via DE-FC26-01NT41359 as well as other sponsored research. The National Research Center for Coal and Energy (NRCCE) contributed laboratory space in the building during the summer of 2002. The installation and basic training for the new equipment has been completed. All the necessary approvals for the operation of each instrument have been secured, based on a procedure established with the administration of the NRCCE. The approval process requested the submission of Laboratory Space Requests and Chemical Hygiene Plans for each instrument, including all relevant Material Safety Data Sheets.

70
3.1. Fiber Spinning Lab (Room 128 – NRCCE) 3.1.1 Extruder/Fiber Spinner
Figure 50. Fiber Spinner and Take-up Reel.
The extruder/fiber spinner is a laboratory/pilot level instrument, manufactured by Wayne Machine & Die Co. of Totowa, NJ. It has five heating areas, with independent adjustable temperature controls and displays. The extruder has a ½ inch diameter screw, with the option of using a smaller size (or different design) screw for limited material runs. The instrument uses a hardened double reduction helical gearbox and has ceramic heaters with high temperature capacity and extended life. Constant temperature at the bottom of the feeder area is required during normal operation. This is provided with the help of a Neslab water bath circulator. The instrument is operated from a separate 220 VAC fused line, capable of 30A service. Standard laboratory air-conditioning is sufficient for normal operation. The extruder is used to generate various diameter carbon fibers from a variety of experimental coal and petroleum-derived pitches. The optimum stabilization parameters for the resulting fibers are determined with the thermo-gravimetric analyzer, described below.

71
3.1.2 Thermo Gravimetric Analyzer (TGA)
Figure 51. TGA Overview.
The two main components of the TGA are the balance and the furnace. The balance is designed to operate at pressures, from 10-5 Torr to 1500 psi and has a maximum capacity of 100 g and sensitivity rated at 1 µg. The balance is designed to automatically compensate for weight changes in the sample. The samples are loaded in a round bucket quartz container. The Furnace operates to the same pressure specifications as the balance. At ambient pressure, it is designed for operation to 1100°C. At 1000 psi, the furnace is designed to operate to 1000°C. The furnace vessel is sealed to the pressure balance with a joint coupling ring. A rigid tripod with a top plate and leveling screws provides support for the system (balance and furnace) and, together with the elevator, facilitates the connection between the two main components. A main console interfaces all the connections for the system. The flow of the gases required during the experiments is digitally controlled by a flow controller with three channels, independently adjustable. House air at 100 psi is needed for the flow control system. The TGA software is operated from a dedicated computer. The software allows for the establishment of detailed temperature profiles and helps in monitoring and recording any related weight changes in the sample.

72
3.1.3 Box Furnace
Figure 52. Box Furnace.
The Isotemp 750 Series Muffle Furnace Model 126 is a programmable furnace, capable of storing up to four 24-step (ramp and soak) programs. It provides microprocessor temperature control at operating temperatures from 50 to 1125°C. The furnace is a single unit construction. The status of the instrument is monitored through a digital display, located on the front panel. The instrument uses 230 VAC +/- 10%. The maximum current requirement is listed at 4600 Watts. A local exhaust system for the furnace was built and is connected to the laboratory’s main fume cabinet. The furnace is used primarily for the in-situ stabilization of carbon fibers. Most of the samples under investigation are generated in the same area, using the fiber extruder/spinner. The stabilization requirements for the fibers are determined with the TGA described above.

73
3.1.4 Elemental Analyzer
Figure 53. Elemental Analyzer.
The elemental analyzer is a Flash EA 1112 instrument, manufactured by ThermoQuest. The main unit is a single structure, subdivided into two sections: the analytical section and the control section. The analytical section comprises two furnaces, the thermal conductivity detector, the separation columns, the adsorption filters, the specific reactors required by each configuration, and the auto-sampler. The control section consists of the pneumatic and the electronic compartments. The status of the instrument is monitored through a synoptic panel, located on the front of the main unit. The instrument is fully controlled by a computer, through a dedicated software program. This program is also used for data acquisition, data handling and interpretation of the results. A Mettler-Toledo MX/UMX electronic balance is used for the precise determination of the samples’ weight down to ± 1 µgram. Helium (carrier gas) and Oxygen (oxidizing gas) are required for the normal operation of the instrument. The instrument uses 230 VAC +/- 10%. The main unit maximum current requirement is listed as less than 7A. Standard laboratory air-conditioning is sufficient for normal operation. The elemental analyzer is used for the quantitative determination of carbon, nitrogen, hydrogen, and sulfur, with high accuracy and sensitivity. Specific standards with precisely determined ratios of the elements under investigation are required. The current set-up is well suited for evaluation of solid samples. A procedure for the analysis of liquid samples has also been established. A new reactor has been added recently, making the quantitative determination of oxygen possible. In the past, the oxygen evaluation was done by difference only.

74
3.1.5 Proximate Analyzer
Figure 54. Proximate Analyzer
This instrument is a TGA 701 Thermo-Gravimetric analyzer manufactured by LECO and designed for the sequential analysis of moisture, volatiles and ash content. Like any TGA, the instrument measures the weight loss of a sample as a function of a temperature program in a controlled atmosphere. With the help of a multiple sample furnace, the instrument allows for the analysis of up to 19 samples simultaneously. The Balance has a maximum capacity of 5 g (minimum sample size is 0.5 g) and a sensitivity listed at 1 µg. The samples (up to 19) are loaded in ceramic crucibles, provided with covers for specific ASTM requirements. The Oven is designed for operation up to 1000°C (minimum oven temperature is ambient). House air at 40 psi is needed for the pneumatic system. The Proximate analyzer is operated from a dedicated computer. The software allows for the establishment of detailed temperature profiles and helps in monitoring and recording any related weight changes in each sample.

75
3.1.6 UV/Vis Spectrometer
Figure 55. UV/Vis Spectrophotometer
The UV/Vis Spectrophotometer is a Lambda 35 instrument manufactured by Perkin Elmer. It allows fast scanning in the ultra-violet, visible and near infrared areas if the spectrum (190 – 1100 nm). The instrument is a double beam spectrophotometer, with variable bandwidth (0.5, 1.0, 2.0 and 4.0 nm) and scan speeds up to 2880 nm/min. The instrument’s operation and data collection and interpretation are controlled from a dedicated computer, through its own software programs (UV WinLab and UV WinLab Explorer). The light sources are Deuterium and Tungsten. The modes of operation include Scanning, Wavelength Program, Timedrive, Quant and Scanning Quant operations. The instrument allows routine UV/Vis testing of liquid or soluble samples and provides information on the sample’s behavior (absorption and/or transmission) throughout the areas of the spectrum under investigation. UV/Vis spectroscopy is used for investigations of pitches as well as solvents, both in hydrogenated and unhydrogenated states.

76
3.2. Coal-Derived Materials Lab (Room G23 – NRCCE) 3.2.1 Instron Load Frame
Figure 56. Load Frame.
The table-top load frame model 5869 manufactured by Instron is a state of the art instrument for testing a wide range of materials in tension or compression. It can also be used for the standard three-point bend-test. The load frame tests the materials under investigation by applying a tensile or compressive load on the specimen between the rigid frame and the moving crosshead. Currently, there are three load cells with ranges from 10N to 50kN. A supply of house air is required during normal operation. A dedicated software program runs on the system computer and provides direct user interface. The instrument is operated from a separate fused 110VAC line, capable of 30A service. Standard laboratory air-conditioning is sufficient for normal operation. The Instron is used to measure strength and modulus of carbon foam, carbon fibers. Rigs exist for compression, tensile and flexural conditions.

77
3.2.2 Dilatometer
Figure 57. Mechanical Dilatometer.
The dilatometer 402C is manufactured by Netzsch. This main section of the instrument is a horizontal pushrod dilatometer connected to a furnace able to generate temperatures up to 1600°C. A TA System Controller 414/4 microprocessor system is used for temperature programming/control, temperature linearization and data acquisition. Power is supplied to the dilatometer by an independent unit. The instrument is fully controlled by a computer through a dedicated software program, which is also used for data acquisition, data handling and interpretation of the results. To prevent thermal effects during evaluations, a Thermo NESLAB water bath is connected to the measuring unit. For measurements under vacuum conditions, a Pfeiffer two-stage rotary vane pump is used to control the vacuum in the sample chamber inside the furnace. Ultra High Purity nitrogen gas is required for purging of the instrument. The power unit for this instrument uses 230 VAC +/- 10%. Standard laboratory air-conditioning is sufficient for normal operation. The dilatometer is used for the thermo-mechanical evaluation of samples (graphite, carbon foams, etc.) in static or dynamic atmosphere, as well as in a vacuum. The dilatometer is used to measure swell of carbon foams during foaming, as well as thermal expansion coefficient of carbon solid materials.

78
2.3 Nuclear Magnetic Resonance Spectrometer (NMR)
Figure 58. Nuclear Magnetic Resonance Spectrometer.
The Varian EM-360 NMR spectrometer is a solid-state instrument that uses a permanent magnet to provide a field strength of 14.092 kG and a corresponding field frequency of 60MHz. The instrument is contained in two units: the newly installed Eft-60 spectrometer from Anasazi Instruments (replacing the electronics console) and the magnet assembly. The data acquisition system and data interpretation are handled by a dedicated software program, also provided by Anasazi Instruments. The permanent magnet is housed in a separate unit. It is temperature-controlled and temperature compensated for field stability and requires no cooling. A constant supply of house air is required for normal operation. The instrument is operated from a standard 115V line, capable of 10A service. Standard laboratory air-conditioning is sufficient for normal operation. The instrument is capable of providing basic proton NMR and is used for the determination of the structural composition of liquids and soluble chemical compounds, e.g. the aromatic to aliphatic ratio of pitches, solvent mixtures and related products.

79
3.2.4 Optical Microscope
Figure 59. Optical Microscope
The instrument is an Axiostar Plus optical microscope manufactured by Zeiss. It is a transmitted light microscope with a modular design that can be adapted to a large variety of applications. The microscope has a binocular phototube with two 10X eyepieces, equipped with a digital image camera and four objectives with the range of magnification from 5X to 100X. It has a micrometer stage and standard format reticule. A dedicated software program allows for image storage and analysis. In its present configuration, the image analyzer makes possible precise measurements of the carbon fiber diameters as small as 10µm, with a resolution better than 0.5µm. The microscope is used primarily for carbon fiber size evaluation and morphology studies.

80
3.3. Chromatography Lab (Room G30 – NRCCE) 3.3.1 Gas Chromatograph for Simulated Distillation
Figure 60. Gas Chromatograph.
This instrument is a Varian 3800 gas chromatograph equipped with a flame ionization detector (FID). The FID is used as a general detector for the analysis of most organic samples, exhibiting a good sensitivity, large linear response and low noise. In the simulated distillation set-up, the instrument uses a high temperature capillary column, capable to accept temperatures up to 450°C. A CP8410 auto- injector is used for sample introduction. All operations, from sample injection to data handling and reporting, are controlled by a dedicated SimDist software program (STAR SD). The Simulated Distillation analysis is used to determine the boiling range distribution of various hydrocarbon mixtures. Samples are analyzed by temperature programmed gas chromatography on a column where the individual hydrocarbons are separated in order of their boiling points. Calibration is performed according to appropriate ASTM methods. The carrier gas required is ultra high purity helium. Hydrogen and air are also required for normal operation. The instrument requires a standard 115 VAC line, capable of 12A service. Standard laboratory air-conditioning is sufficient for normal operation.

81
3.3.2 Gas Chromatograph/Mass Spectrometer (GC/MS)
Figure 61. GC/MS System.
The gas chromatograph/mass spectrometer tandem is manufactured by Varian Analytical Instruments. The gas chromatograph section is a CP-3800 with a thermal conductivity detector (TCD) and a split/splitless injector. A device for the introduction of solids (CDS Pyroprobe 1000) is also available. Once separated by the gas chromatograph’s column, the sample is analyzed by the mass spectrometer section (Saturn 2200). The mass range extends from 10 to 650 amu, with 10% unit mass resolution. The transfer line temperature is independently controlled, with a maximum of 350°C. The vacuum level required in the manifold (10-5 Torr) is provided by a Varian V-70 turbo-molecular pump. The samples under investigation (up to 21) are introduced with a CP8410 auto- injector. All operations, from sample injection to data handling and reporting, are controlled by the software program. The carrie r gas required is ultra high purity helium. The instrument requires a standard 115 VAC line, capable of 12A service. Standard laboratory air-conditioning is sufficient for normal operation. The GC/MS tandem is used for the investigation and characterization of coal pitches and other related compounds.

82
3.3.3 Flame Ionization Detector (FID) Gas Chromatograph (GC)
The instrument is a Varian 3900 flame ionization detector (FID) gas chromatograph. The FID is used as a general detector for the analysis of most organic samples, exhibiting a good sensitivity, large linear response and low noise. In the current setup, the instrument uses a capillary column and a split/splitless injector. A CP8410 auto-injector is used for all sample introductions. All operations, from sample injection to data handling and reporting, are controlled by the software program. The carrier gas required is ultra high purity helium. Hydrogen and air are also required for normal operation. The instrument requires a standard 115 VAC line, capable of 12A service. Standard laboratory air-conditioning is sufficient for normal operation. The gas chromatograph is used to provide analysis of unknown mixtures of organic components, through separation and ident ification of their individual components.

83
4.0 References 1 Coal Liquefaction—A Research Needs Assessment Technical Background, February 1989, DOE/ER-400 DE-AC01-87ER30110. 2 Energia, Vol 8, No. 3, 1997. 3 The Research Group of Matthias W. Haenel, Max-Planck-Institut für Kohlenforschung, http://www.mpi-muelheim.mpg.de , http://www.mpi-muelheim.mpg.de/kofo/institut/arbeitsbereiche/haenel/english/haenel_forsch2_e.html . 4 B. Bockrath et al., Studies of Dispersed MoS Catalysts for Coal Liquefaction, Proceedings, 1997 Coal Liquefaction & Solid Fuels Contractors Review Conference, 1997. 5 University of Kentucky., “Advanced Direct Liquefaction Concepts for PETC Generic Units” Quarterly Technical Progress Report, June 1997, DOE/PC/91040-84. 6 J. W. Zondlo et al., US Patent #5,955,375, September 21, 1999. 7 “Final Technical Report--Coal Based Nuclear Graphites for the New Production Gas Cooled Reactor. Task 1: Development of Coal-Derived Isotropic Coke and Nuclear Graphite. West Virginia University, 1994. 8 Reliant Electric, Application Solution, Selecting Explosion-Proof Motors And Variable-Frequency Drive Controllers For Hazardous Environmental Applications, Publication D-7736 – September 2000. 9 P. G. Stansberry et al., “The Production of Coal-Derived Mesophase Pitch,” Proceedings of the 1995 American Chemical Society Carbon Conference. 10 P. M. Khandare et al., “Kinetics of Mesophase Formation from Petroleum and Coal Derived Pitches,”” Proceedings of the 1995 American Chemical Society Carbon Conference. 11 Ronald F. Probstein and R. Edwin Hicks, “Synthetic Fuels,” McGraw-Hill Book Company, New York, 1982. 12 W. R. K. Wu and H. H. Storch, “Hydrogenation of Coal and Tar,” U.S. Bureau of Mines Bulletin No. 633, 1968. 13 J. Owen, “Liquefaction of Coal,” in Coal and Modern Coal Processing, G. J. Pitt and G. R. Millward, Eds., Academic Press, London, 1979.

84
14 . S. A. Alpert and R. H. Wolk, “Chemistry of Coal Utilization”, Second Supplementary Volume, M. A. Elliott, Ed., John Wiley & Sons, New York, p. 1923, 1981. 15. Bernard S. lee, “Synfuels From Coal,” AIChE Monograph Series No. 14, Vol. 78, 1982. 16 . F. J. Derbyshire and D. Gray, “Coal Liquefaction,” in Ullmann’s Encyclopedia of Industrial Chemistry, 5th edition, Vol. A7, pp 197-243, 1986. 17 D. Garg and E. N. Givens, “Relative Activity of Transition Metal Catalysts in Coal Liquefaction,” Fuel Proc. Tech. 8, pp 123-134, 1984. 18 . W. N. Mitchell, K. L. Trachte, and S. Zaczepinski, “Performance of Low Rank Coals in the Exxon Donor Solvent Process,” Ind. Eng. Chem. Product Res. Dev. 18, pp 311-314, 1979. 19 E. M. Phillips, A. R. Kuhns, C. A. Johnson, T. C. Carson, K. E. Hastings, J. D. Potts, and J. Caspers, “A Comparative Study of Coal Liquefaction Performance and Economics for Solvent Refined Coal-Based Processes,” in Coal Processing Technology, Vol. VI, pp.193-208, AIChE, New York, 1980. 20 Probstein and Hicks, op cit. 21. A. H. Stiller et al., “Method of making a reinforced carbon foam material and related product,” US Patent 6,183,854, February 6, 2001. 22. R. L. Alig et al., Office of Naval Research Contract No.N00014-97-C-0374 Phase I Final Report. 23. G. G. Tibbetts et al., Science and Applications of Nanotubes 2000, edited by D. Tomanek and R. J. Enbody Kluver/Plenum, NY, 2000, pp.35. 24. R. L. Alig et al., op cit. 25. R. L. Alig et al., ibid. 26. R. L. Alig et al., ibid.