PRODUCTION OF BIOENERGY FROM INDUSTRIAL AND AGRICULTURAL WASTEWATER
36
BTC 505 ENVIRONMENTAL B IOTECHNOLOG Y PRODUCTION OF BIOENERGY FROM INDUSTRIAL AND AGRICULTURAL WASTEWATER BRAC University Department of Mathematics and Natural Sciences Submitted to: Professor Naiyyum Choudhury Course Teacher Department of M.N.S. BRAC University Mohakhali, Dhaka Submitted by: Md. Waliullah Wali ID # 15276002 Department of M.N.S. BRAC University Mohakhali, Dhaka Submission date: 04/08/ 2016
-
Upload
waliullah-wali -
Category
Education
-
view
225 -
download
4
Transcript of PRODUCTION OF BIOENERGY FROM INDUSTRIAL AND AGRICULTURAL WASTEWATER

BTC 505
ENVIRONMENTAL
BIOTECHNOLOGY
PRODUCTION OF BIOENERGY FROM
INDUSTRIAL AND AGRICULTURAL
WASTEWATER
BRAC University Department of Mathematics and Natural Sciences
Submitted to:
Professor Naiyyum Choudhury
Course Teacher
Department of M.N.S.
BRAC University
Mohakhali, Dhaka
Submitted by:
Md. Waliullah Wali
ID # 15276002
Department of M.N.S.
BRAC University
Mohakhali, Dhaka
Submission date: 04/08/2016
1 | P a g e
Table of Contents
Abtract.................................................................................................................................................................................... 3
Introduction........................................................................................................................................................................ 3
Types of water pollution ............................................................................................................................................. 5
1. Nutrients Pollution............................................................................................................................................... 5
2. Surface water pollution ..................................................................................................................................... 5
3. Oxygen Depleting .................................................................................................................................................. 5
4. Ground water pollution..................................................................................................................................... 5
5. Microbiological ....................................................................................................................................................... 5
6. Suspended Matter ................................................................................................................................................. 6
7. Chemical Water Pollution ................................................................................................................................ 6
8. Oil Spillage ................................................................................................................................................................. 6
Source of Water Pollution:......................................................................................................................................... 6
1. Industrial Waste and Effluent........................................................................................................................ 7
2. Solid Waste and Sewage Disposal ............................................................................................................... 8
3. Inadequate Sanitary Facilities ....................................................................................................................... 9
4. Arsenic Contamination of Ground Water............................................................................................... 9
5. Underground storage and tube leakages............................................................................................. 10
Effects of Water Pollution ....................................................................................................................................... 11
1. Death of aquatic (water) animals............................................................................................................. 11
2. Disruption of food-chains ............................................................................................................................. 11
3. Diseases.................................................................................................................................................................... 12
4. Destruction of ecosystems............................................................................................................................ 12
5. Human Health....................................................................................................................................................... 12
6. Economic cost....................................................................................................................................................... 13

2 | P a g e
Present wastewater management ..................................................................................................................... 13
1. Preventive practices ......................................................................................................................................... 13
2. Capture the wastewater immediately ................................................................................................... 13
3. Treatment ............................................................................................................................................................... 13
4. Recycle and re-use water:............................................................................................................................. 14
5. Education, Awareness, Advocacy and Stewardship: .................................................................... 14
Production of Bioenergy from Industrial And Agricultural Waste water ................................. 15
1. Production of Biological methane............................................................................................................ 15
2. Biological hydrogen production ............................................................................................................... 18
3. Biological electricity production............................................................................................................... 22
4. Biological chemical production ................................................................................................................. 26
Conclusion......................................................................................................................................................................... 29
References ........................................................................................................................................................................ 29

3 | P a g e
Abtract
Water pollution is the contamination of water bodies, very often by human activities.
Water can be polluted by various ways; Industry and agriculture are the main source of
water pollution. At present polluted water cause very harmful effect to the environment.
However, treatment of water reduces some portion of this harmful effect, but this might
involve high cost. As a results many industries in our country does not abide by the
rules of Government environmental policy and through their waste water into the river.
The discharge of wastewater into the environment poses a serious threat. This results
environment pollution and causes harmful effect on animal lived in water (e.g. fish) as
well as for human beings. But it is also a huge opportunity for ecological health, social
wellbeing and green employment. If, high value product is obtained from this polluted
industrial waste water, then it might be used by the Industries and environment will be
less toxic. These studies show some useful application of industrial waste water to get
high value products and services.
Introduction
Water pollution is a serious problem in Bangladesh as well as all over the world. It has
become a major concern in the last few decades. It is the byproduct of the development
of civilization and in fact a price for the progress [2]. The dumping of municipal wastes,
hospital wastes and toxic environmental discharges from mostly industries pollute both
surface and ground water sources [1]. Water pollution creates serious health hazard for
peoples.
Industrial wastewater is one of the important pollution sources in the pollution of the
water environment [1][2]. During the last century a huge amount of industrial wastewater
was discharged into rivers, lakes and coastal areas. This resulted in serious pollution
problems in the water environment and caused negative effects to the eco-system and
human’s life. [1]

4 | P a g e
Figure A: River water polluted by Industrial wastes.
There are many types of industrial wastewater based on different industries and
contaminants; each sector produces its own particular combination of pollutants. Like
the various characteristics of industrial wastewater, the treatment of industrial
wastewater must be designed specifically for the particular type of effluent produced. [1]
Water is considered polluted when it is altered from the natural state in its physical
condition, and chemical and microbiological composition, so that it becomes unsuitable
or less suitable for any safe and beneficial consumption. The term contamination is used
synonymously with pollution. The signs of water pollution are obvious: bad taste;
offensive odors from lakes, rivers and sea beaches; unchecked growth of aquatic weeds
in water bodies; decrease in number of aquatic animals in surface water bodies; oil and
grease floating on water surfaces; coloration of water; etc. Besides th ese obvious signs,
there are other kinds of pollution, which are not so visible. [3]
Wastewater is a huge resource for valuable products that if harnessed properly [4]. Also,
it can bring a lot of health and economic benefits, increase food production, reduce
poverty, enhance fishing, rural and urban livelihoods.

5 | P a g e
Types of water pollution
There are many types of water pollution because water comes from many sources [4].
Here are a few types of water pollution:
1. Nutrients Pollution
Some wastewater, fertilizers and sewage contain high levels of nutrients. If they end up
in water bodies, they encourage algae and weed growth in the water. This will make the
water undrinkable, and even clog filters. Too much algae will also use up all the oxygen
in the water and other water organisms in the water will die out of oxygen starvation.
2. Surface water pollution
Surface water includes natural water found on the earth's surface, like rivers, lakes,
lagoons and oceans. Hazardous substances coming into contact with this surface water,
dissolving or mixing physically with the water can be called surface water pollution.
3. Oxygen Depleting
Water bodies have micro-organisms. These include aerobic and anaerobic organisms.
When too much biodegradable matter (things that easily decay) end up in water, it
encourages more microorganism growth, and they use up more oxygen in the water. If
oxygen is depleted, aerobic organisms die, and anaerobic organisms grow more to
produce harmful toxins such as ammonia and sulfides.
4. Ground water pollution
When humans apply pesticides and chemicals to soils, they are washed deep into the
ground by rainwater. This gets to underground water, causing pollution
underground. This means when we dig wells and bore holes to get water from
underground, it needs to be checked for ground water pollution.
5. Microbiological
In many communities in the world, people drink untreated water (straight from a river
or stream). Sometimes there is natural pollution caused by microorganisms like viruses,
bacteria and protozoa. This natural pollution can cause fishes and other water life to die.
They can also cause serious illness to humans who drink from such waters.
6 | P a g e
6. Suspended Matter
Some pollutants (substances, particles and chemicals) do not easily dissolve in water.
This kind of material is called particulate matter. Some suspended pollutants later settle
under the water body. This can harm and even kill aquatic organisms that live at the
bottom of water bodies.
7. Chemical Water Pollution
Many industries and farmers work with chemicals that end up in water. This is common
with Point-source Pollution. These include chemicals that are used to control weeds,
insects and pests. Metals and solvents from industries can pollute water bodies. These
are poisonous to many forms of aquatic life and may slow their development, make
them infertile and kill them.
8. Oil Spillage
Oil spills usually have only a localized effect on wildlife but can spread for miles. The oil
can cause the death to many fish and get stuck to the feathers of seabirds causing them
to lose their ability to fly.
In BP Oil spill in 2010; Over 1,000 animals (birds, turtles, mammals) were reported
dead, including many already on the endangered species list. Of the animals affected by
the spill, only about 6% have been reported cleaned, but many biologists and other
scientists predict they will die too from the stress caused by the pollution.
Source of Water Pollution
Water pollution is more prone in case of Bangladesh. Industrial wastewater is one of
the important pollution sources in the pollution of the water environment. During the
last century a huge amount of industrial wastewater was discharged into rivers, lakes
and coastal areas. This resulted in serious pollution problems in the water environment
and caused negative effects to the eco-system and human’s life.

7 | P a g e
Figure B: The schematic diagram of river pollution around Dhaka City from
different pollution sources. [5]
1. Industrial Waste and Effluent
The main industrial areas of Bangladesh are at Dhaka, Chittagong, Khulna, and Bogra
districts. The mostly contributing industries for water pollution are pulp and paper,
pharmaceuticals, metal processing, food industry, fertilizer, pesticides, dyeing and
painting, textile, tannery etc. More than 200 rivers of Bangladesh directly or indirectly
receive a large quantity of untreated industrial wastes and effluent [6]. Everyday
approximately 700 tanneries of Dhaka city are discharging about 16,000 cubic meters of
toxic wastes [6][7]. The Department of Environment (DOE) has listed 1,176 factories that
cause pollution throughout the country. [8][9]
8 | P a g e
Water pollution percentage of most five industrial sectors of Bangladesh in the year
2001 is shown below:
Table-A: Water Pollution Percentage of most Five Industrial Sectors of
Bangladesh in the Year 2001. [Source-9]
2. Solid Waste and Sewage Disposal
The indiscriminate discharge of solid waste, domestic and hospital sewage are the
major source of water pollution in Bangladesh. About 4,000 to 4,500 tons of solid
wastes are generated daily and only half of the generated wastes are disposed of in low
lying areas or into river water [7]. These solid wastes are associated with the problems
of littering on roads, spilling around the bins, clogging of drains, indiscriminate
dumping on vacant plots and cause serious environmental pollution [8]. More than 500
hospitals and clinics of Dhaka city generate and release hazardous and toxic wastes
without any treatment [10] [11]. The generated solid waste of six famous hospitals / clinics
of Dhaka city is shown below:
Figure C: Industrial waste water discharged in river.
9 | P a g e
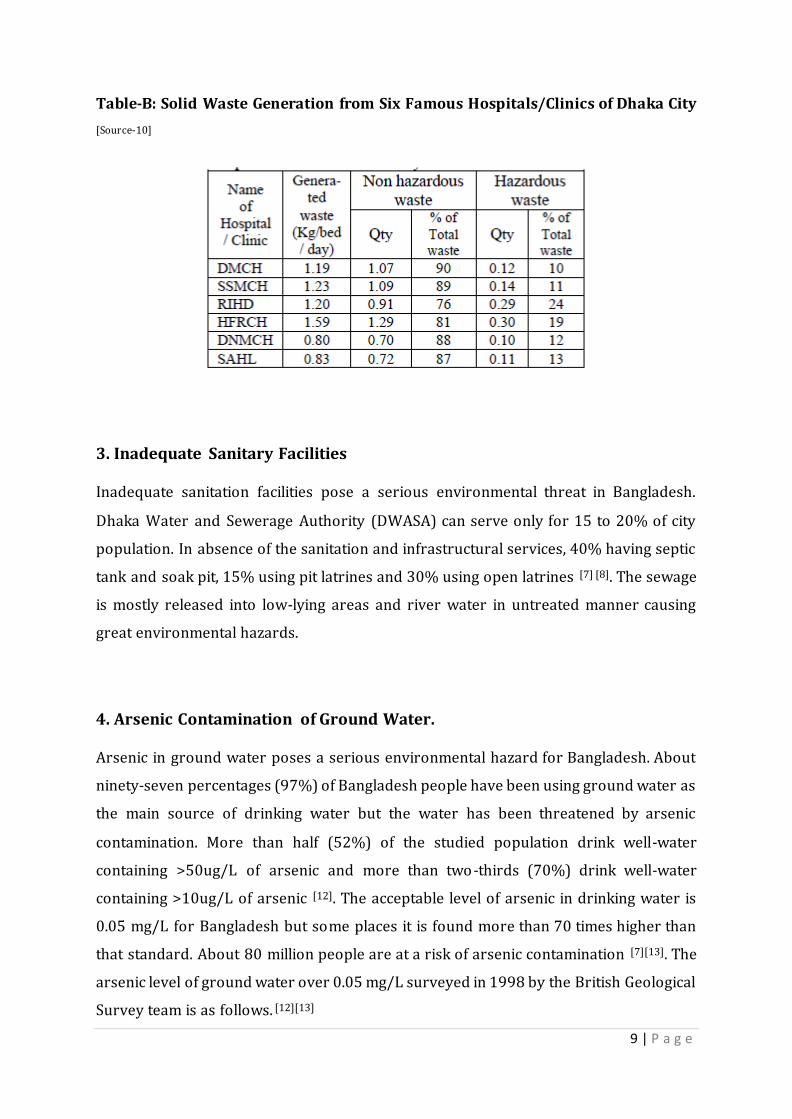
Table-B: Solid Waste Generation from Six Famous Hospitals/Clinics of Dhaka City
[Source-10]
3. Inadequate Sanitary Facilities
Inadequate sanitation facilities pose a serious environmental threat in Bangladesh.
Dhaka Water and Sewerage Authority (DWASA) can serve only for 15 to 20% of city
population. In absence of the sanitation and infrastructural services, 40% having septic
tank and soak pit, 15% using pit latrines and 30% using open latrines [7] [8]. The sewage
is mostly released into low-lying areas and river water in untreated manner causing
great environmental hazards.
4. Arsenic Contamination of Ground Water.
Arsenic in ground water poses a serious environmental hazard for Bangladesh. About
ninety-seven percentages (97%) of Bangladesh people have been using ground water as
the main source of drinking water but the water has been threatened by arsenic
contamination. More than half (52%) of the studied population drink well-water
containing >50ug/L of arsenic and more than two-thirds (70%) drink well-water
containing >10ug/L of arsenic [12]. The acceptable level of arsenic in drinking water is
0.05 mg/L for Bangladesh but some places it is found more than 70 times higher than
that standard. About 80 million people are at a risk of arsenic contamination [7][13]. The
arsenic level of ground water over 0.05 mg/L surveyed in 1998 by the British Geological
Survey team is as follows. [12][13]

10 | P a g e
Table-C: Percentage of Ground Waters Surveyed in 1998by the British Geological
Survey Team with Arsenic Levels over the Limit. [Source-12]
5. Underground storage and tube leakages
Many liquid products (petroleum products) are stored in metal and steel tubes
underground. Other sewage systems run in underground tubes. Over time, they rust and
begin to leak. If that happens, they contaminate the soils, and the liquids in them end up
in many nearby water bodies. [4]
11 | P a g e
Effects of Water Pollution
The effects of water pollution are varied and depend on what chemicals are dumped
and in which locations. Many water bodies near urban areas (cities and towns) are
highly polluted. This is the result of both garbage dumped by individuals and dangerous
chemicals legally or illegally dumped by manufacturing industries, health centers,
schools and market places.
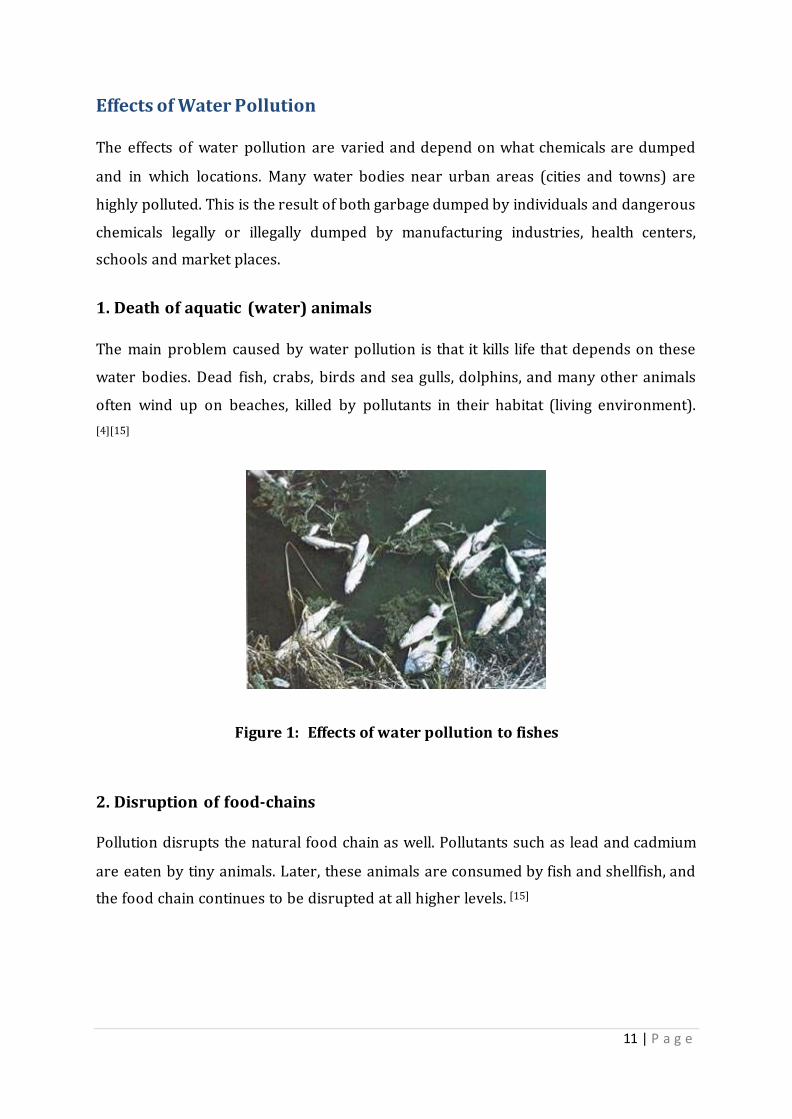
1. Death of aquatic (water) animals
The main problem caused by water pollution is that it kills life that depends on these
water bodies. Dead fish, crabs, birds and sea gulls, dolphins, and many other animals
often wind up on beaches, killed by pollutants in their habitat (living environment).
[4][15]
Figure 1: Effects of water pollution to fishes
2. Disruption of food-chains
Pollution disrupts the natural food chain as well. Pollutants such as lead and cadmium
are eaten by tiny animals. Later, these animals are consumed by fish and shellfish, and
the food chain continues to be disrupted at all higher levels. [15]

12 | P a g e
3. Diseases
Eventually, humans are affected by this process as well. People can get diseases such as
hepatitis by eating seafood that has been poisoned. In many poor nations, there is
always outbreak of cholera and diseases as a result of poor drinking water treatment
from contaminated waters. [4] [15]
4. Destruction of ecosystems
Ecosystems (the interaction of living things in a place, depending on each other for life)
can be severely changed or destroyed by water pollution. Many areas are now being
affected by careless human pollution, and this pollution is coming back to hurt humans
in many ways. [4]
5. Human Health
We all drink water that comes from a source: this may be a lake or local river. In
countries that have poor screening and purification practices, people often get water-
borne disease outbreaks such as cholera and tuberculosis. Every year, there are an
estimated 3–5 million cholera cases and 100,000–120,000 deaths due to cholera. (WHO
estimates that only 5–10% of cases are officially reported.) [4]
In developed countries, even where there are better purification methods, people still
suffer from the health effects of water pollution. Take toxins emitted by algae growth for
instance: this can cause stomach aches and rashes. Excess nitrogen in drinking water
also pose serious risks to infants.

13 | P a g e
6. Economic cost
From the above it is evident that there are some real financial implications that will
result from water pollution. It can cost a lot more to purify drinking water that takes its
source from nutrient polluted water bodies. Fishing stock is affected negatively when
there is a depletion of oxygen. Consumers are also weary of fish from these sources and
tend to stay away from them, costing fisheries to lose revenue. In places where there are
water activities or sports, lots of money is spent to clean up the water from algae
blooms and the like. [16]
Present wastewater management
Smart waste water management is key to poverty reduction. It will sustain ecosystem
services; improve food security, health and ultimately the economy.
Good wastewater management efforts will enforce existing policies and introduce new
and relevant policies, funding, legislation, encourage voluntary agreements, engage
private and public sectors and expand education on the issue.
These five areas must be emphasized:
1. Preventive practices:
Laws, policies and advocacy should be designed to encourage all stakeholders to reduce
the generation of wastewater [4]. This will reduce the volume of wastewater that we
have to eventually deal with.
2. Capture the wastewater immediately:
Appropriate technology and practices must be laid to capture wastewater straight from
its source and directed to the right places for treatment. This part will involve
significant investment, but the long-term benefits will be worth it. It may involve laying
different underground pipes to carry different types of wastewater.
3. Treatment:
In many rural dwellings all over the world, the sun, vegetation, soils and bacteria are
able to take care of wastewater naturally if discharged into the environment with little
or no treatment. It is possible because the volumes are very small. In urban centers the

14 | P a g e
amounts of wastewater produced is staggering and simply impossible for nature to take
care of. This is why we need to treat wastewater using appropriate and relevant
technology before discharging into the environment. [4]
4. Recycle and re-use water:
This involves the use of physical, biological and chemical principles to remove
contaminants from wastewater. The type of wastewater will determine the kind of
principle to apply. Water recycle, reuse and reclaim are often used to mean the same
thing. An example is water that is used over and over again for cooling purposes in an
energy plant. Another example is to capture gray water and reused for landscaping,
construction and concrete mixing purposes. [4]
5. Education, Awareness, Advocacy and Stewardship:
Stakeholders should provide a friendly background for the development of new ideas
and technologies to managing the issue. Each person and all groups of people should be
adequately informed about the threat and the need to reduce wastewater and welcome
the potential in managing them with socially and culturally appropriate methods and
technology. [16]
15 | P a g e
PRODUCTION OF BIOENERGY FROM INDUSTRIAL AND
AGRICULTURAL WASTEWATER
Instate of current situation, the waste water can be used to produce low value as
well as high value products. The various types and services from industrial and
agricultural wastewater are given bellow-
1. Production of Biological methane
Biological methane can be produced from organic material in industrial and agricultural
wastewater. Methanogenic anaerobic digestion of organic material in wastewater
(Table 1, reaction 11) has been performed for about a century and is advantageous over
aerobic active sludge systems because of its high organic removal rates, low energy-
input requirement, energy production (i.e. methane), and low sludge production. The
food web of anaerobic digestion is reasonably well understood (Box1). An important
breakthrough was made ~30 years ago, with the development of the up flow anaerobic
sludge blanket [UASB] reactor [17], which efficiently retains the complex microbial
consortium without the need for immobilization on a carrier material (for example, as a
biofilm) by formation of biological granules (i.e. granulation; self-immobilization) with
good settling characteristics. The mean cell residence time, that is, the average time a
typical microbial cell remains in the reactor, of UASBs is much longer than the hydraulic
residence time (the average time the wastewater remains in the reactor), due to this
self-immobilization process. Performance depends on the mean cell residence time and
reactor volume depends on the hydraulic residence time, therefore, UASBs can
efficiently convert wastewater organic compounds into methane in small ‘high -rate’
reactors. Approximately 60% of the thousands of anaerobic full scale treatment
facilities worldwide are now based on the UASB design concept, treating a diverse ra nge
of industrial wastewaters [18][19]. It was originally thought that a continuous up flow
hydraulic pattern was required for granulation, but this phenomenon was recently
observed in a continuously-fed horizontal-flow bioreactor that incorporated a migrating
blanket within a compartmentalized reactor (a multivessel; aerobic migrating blanket
reactor [AMBR]) [20]. Due to the AMBR’s inherent dynamic conditions, the organic
removal rates are higher than those in UASB reactors [24][22]. A significant limitation of
16 | P a g e
UASB reactors is the interference of suspended solids in the incoming wastewater with
granulation and reactor performance [23]. Hence, other high-rate systems, such as the
anaerobic sequencing batch reactor (ASBR), were developed to better handle high -
suspended solids in wastewater.
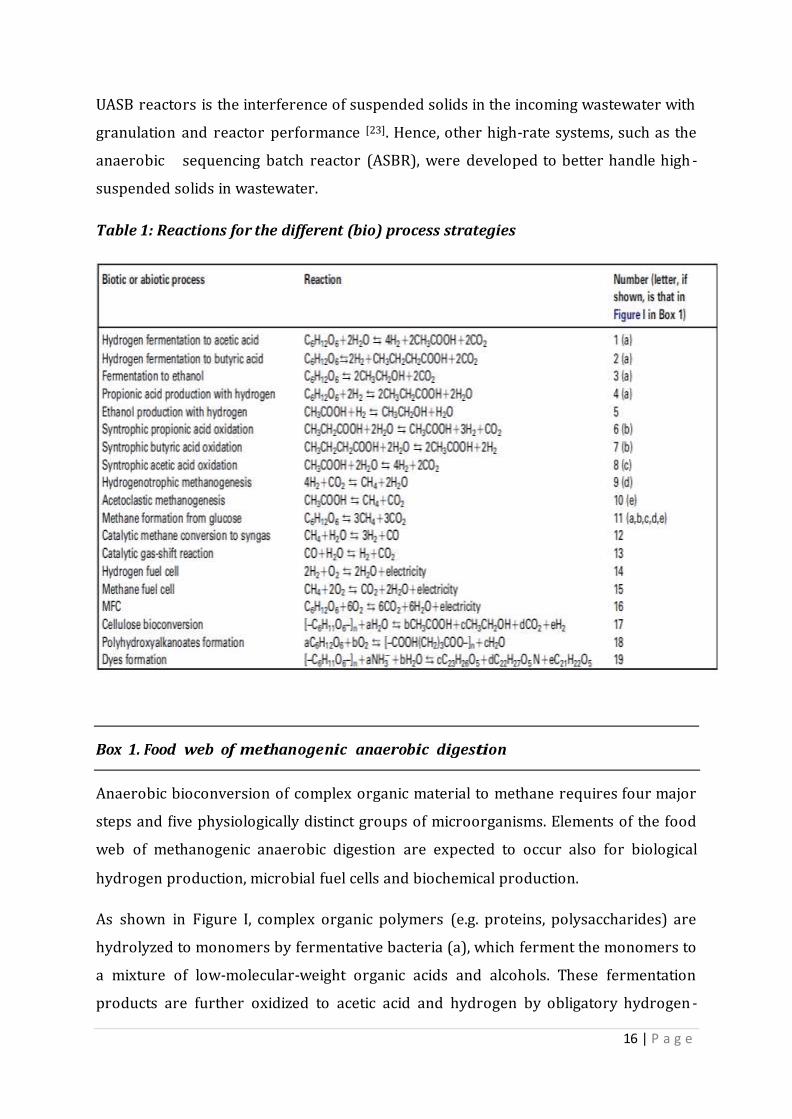
Table 1: Reactions for the different (bio) process strategies
Box 1. Food web of methanogenic anaerobic digestion
Anaerobic bioconversion of complex organic material to methane requires four major
steps and five physiologically distinct groups of microorganisms. Elements of the food
web of methanogenic anaerobic digestion are expected to occur also for biological
hydrogen production, microbial fuel cells and biochemical production.
As shown in Figure I, complex organic polymers (e.g. proteins, polysaccharides) are
hydrolyzed to monomers by fermentative bacteria (a), which ferment the monomers to
a mixture of low-molecular-weight organic acids and alcohols. These fermentation
products are further oxidized to acetic acid and hydrogen by obligatory hydrogen -
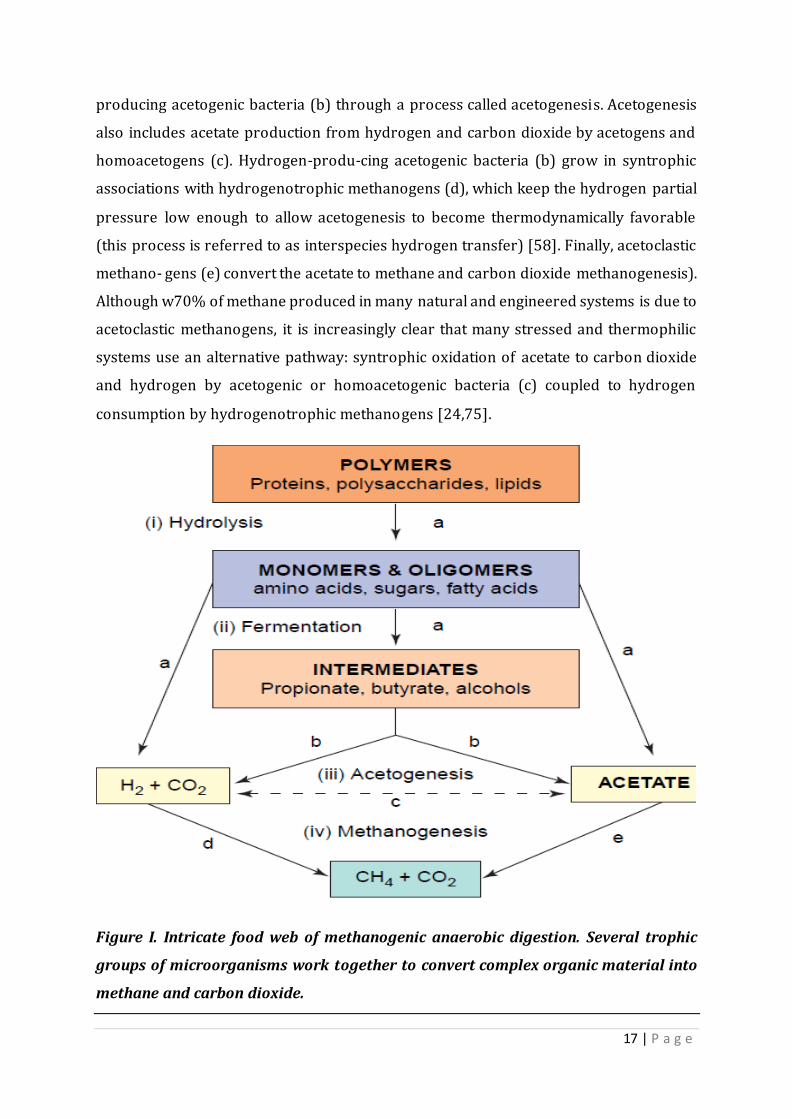
17 | P a g e
producing acetogenic bacteria (b) through a process called acetogenesis. Acetogenesis
also includes acetate production from hydrogen and carbon dioxide by acetogens and
homoacetogens (c). Hydrogen-produ-cing acetogenic bacteria (b) grow in syntrophic
associations with hydrogenotrophic methanogens (d), which keep the hydrogen partial
pressure low enough to allow acetogenesis to become thermodynamically favorable
(this process is referred to as interspecies hydrogen transfer) [58]. Finally, acetoclastic
methano- gens (e) convert the acetate to methane and carbon dioxide methanogenesis).
Although w70% of methane produced in many natural and engineered systems is due to
acetoclastic methanogens, it is increasingly clear that many stressed and thermophilic
systems use an alternative pathway: syntrophic oxidation of acetate to carbon dioxide
and hydrogen by acetogenic or homoacetogenic bacteria (c) coupled to hydrogen
consumption by hydrogenotrophic methanogens [24,75].
Figure I. Intricate food web of methanogenic anaerobic digestion. Several trophic
groups of microorganisms work together to convert complex organic material into
methane and carbon dioxide.

18 | P a g e
ASBRs are single-vessel bioreactors that operate in a four-step cycle: (i) wastewater is
fed into the reactor with settled biomass; (ii) wastewater and biomass are mixed
intermittently; (iii) biomass is settled and; (iv) effluent is withdrawn from the reactor.
ASBRs are particularly useful for agricultural waste, and it has recently been scaled up
for on-farm treatment of dilute swine waste [24].
The methane that is produced by anaerobic digestion has traditionally been used as a
fuel source, usually, for on-site heating or electricity production. Recently, methane has
also been converted to other useful products, such as methanol for use in production of
biodiesel, for example, by production of syngas (a mixture of hydrogen and carbon
monoxide; Table 1, reactions 12 and 13) in downstream chemical processes [25].
Production of syngas requires the removal of impurities, such as hydrogen sulfide, in
the digester biogas, which can poison the catalyst. In addition, direct conversion of
methane to electricity in solid-oxide fuel cells after a single-step anaerobic digester
might soon become feasible (Table 1, reaction 15) [26].
2. Biological hydrogen production
Much recent interest has been expressed in the biological production of hydrogen from
wastewater by dark fermentation, due to its potential importance in our economy [27–
28]. Biological hydrogen production shares many common features with methanogenic
anaerobic digestion, especially the relative ease with which the two gaseous products
can be separated from the treated wastewater. The mixed communities involved in both
bioprocesses share some common elements but with one important difference:
successful biological hydrogen production requires inhibition of hydrogen-using
microorganisms, such as homo-acetogens (see Figure I in Box 1, group c) and
methanogens (see Figure I in Box 1, group d). Inhibition is commonly accomplished by
heat treatment of the inoculum to kill all microorganisms except for spore-forming
fermenting bacteria (for example, species from the families Clostridiaceae,
Streptococcaceae, Sporolactobacillaceae, Lachnospiraceae, and
Thermoanaerobacteriacea [31-33]) (see Figure Ia in Box 1). Other methods that have
been used include the operation of reactors at high dilution rates[18]or low pH[35].
Considerable effort has been devoted to optimizing operational environmental

19 | P a g e
conditions to maximize hydro-gen production (examples of optimization efforts are
given in Table 2). Conceptually, important efforts are those that prevent consumption of
hydrogen by, for example, propionic acid-producing bacteria, ethanol-producing
bacteria, and homoacetogens (Table 1, reaction 4, reaction 5, and the reverse of reaction
8, respectively); and those that channel more reducing equivalents towards reduction of
protons by hydrogenases (see Box 2). Operating bio-reactors at low hydrogen partial
pressure, perhaps by sparging with nitrogen gas to strip hydrogen from the solution as
fast as it is produced [35][36], accomplishes both efforts simultaneously.
Unfortunately, optimization of bio hydrogen production focuses on a relatively small
fraction of the total hydrogen equivalents that are present in wastewater. For example,
optimization of hydrogen production from related hexoses, at best, results in
production of four moles of hydrogen per mole of hexose, because two moles of acetate
are also formed (Table 1, reaction 1). Complete oxidation to carbon dioxide and
hydrogen, however, would produce 12 moles of hydrogen per mole hexose (reaction 1
plus reaction 8 in Table 1). Actual yields are even lower than the four moles of hydrogen
that are theoretically possible, typically ranging from !1 to w2.5 moles hydrogen per
mole hexose (Table 2). When butyric acid is produced as a major fermentation product,
only two moles of hydrogen can be produced (Table 1, reaction 2). Hydrogen yield is
even lower when more reduced organic compounds, such as lactic acid, propionic acid,
and ethanol, are produced as fermentation products, because these represent end
products of metabolic pathways that bypass the major hydrogen-producing reaction in
carbohydrate fermentations (Table 1, reaction 3). Thermodynamic limitations for
hydrogen production are explained in Box 2.
It appears that, even under optimized conditions, one cannot expect to recover more
than w15% of the electron equivalents in a high-carbohydrate wastewater as hydro-
gen, thus, it is not surprising that several research groups are considering implementing
two-step processes, involving biohydrogen production followed by methanogenic
anaerobic digestion to increase the energy yield of the overall process [37]. As
described previously, methanogenic anaerobic digestion is a mature, reliable technology
that has been demonstrated in thousands of full-scale facilities worldwide. Catalytic
conversion of methane to hydrogen gas is also a well-developed and reliable process
(Table 1, reactions 12 and 13) [25]. Therefore, direct biological production of hydrogen

20 | P a g e
through dark fermentation appears to be restricted to a pre-treatment step in a larger
bioenergy or biochemical production concept. Another anticipated disadvantage of
large-scale hydrogen production that needs to be addressed during scale -up is the
escape of hydrogen through large plastic enclosures and thin metal sheets that might
occur due to the high diffusivity of hydrogen.
Box 2. Physiological limitations for biological production of hydrogen
Hydrogen production from organic substrates is limited by the thermodynamics of the
hydrogenase reaction, which involves the enzyme-catalyzed transfer of electrons from
an intracellular electron carrier molecule to protons. Unfortunately, protons are poor
electron acceptors (E’ H2=414 mV); so, the electron donor must be a strong reducing
agent. Ferredoxin is a low-potential (Eo Fd =400 mV, depending on source) iron-sulfur
protein that is capable of reducing protons to hydrogen [60]. Another important
intracellular electron carrier, NADH, has a higher redox potential (Eo NADH=320 mV). The
ability of reduced ferredoxin and NADH to reduce protons is determined by the redox
potential of the net reaction under actual conditions. Assuming the intracellular
concentrations of the oxidized and reduced forms of ferredoxin and NADH are about
equal, hydrogen production becomes thermodynamically unfavorable at hydrogen
partial pressures greater than:
Where, EoX is the redox potential of the electron donor, F is Faraday’s constant, R is the
ideal gas constant, and T is the absolute temperature. For ferredoxin, hydrogen
production can continue as long as the hydrogen partial pressure is less than~ 0.3 atm
(3104 Pa); for NADH, the partial pressure of hydrogen must be less than ~6 10-4 atm
(60 Pa). Note that these values assume equal concentrations of the oxidized and
reduced forms of the electron donors. Higher hydrogen partial pressures can be
achieved if the ratio of reduced ferredoxin to oxidized ferredoxin is greater than one.
The free energy change of the pyruvate-ferredoxin oxido reductase reaction (Go’ =
-2.1 kcal/mole) is sufficient to allow the reaction to proceed with more than a tenfold

21 | P a g e
excess of products over reactants. Hence, the frequent observation of more than 30%
hydrogen in reactor headspace is not unexpected.
In most systems for biological production of hydrogen, all of the observed hydrogen can
be attributed to electrons derived from a single reaction: oxidative decarboxylation of
pyruvate by pyruvate: ferredoxin oxidoreductase (Figure II). Hexoses can be
metabolized to pyruvate through several pathways, often involving the Embden-
Meyerhoff- Parnas (i.e. glycolysis) or the Entner-Doudoroff pathways. Both of these
pathways produce two moles of pyruvate and two moles of NADH for every mole o f
hexose that is transformed [76]. Therefore, hexose metabolism by bacteria that contain
pyruvate:ferredoxin oxidoreductase can result in formation of 2 moles of hydrogen per
mole of hexose. If the hydrogen partial pressure is sufficiently low (<60 Pa), the N ADH
that is produced may also be used to generate hydrogen (at best, an additional 2 moles
of hydrogen per mole of hexose), but most of the NADH will probably be oxidized
through other fermentation pathways, such as butyrate fermentation (Figure II, step 4 ).
Some fermentation products (e.g. ethanol and lactate) represent the operation of
alternative pathways for pyruvate metabolism that compete with pyruvate: ferredoxin
oxidoreductase. As such, they will usually be associated with systems that produce less
than two moles of hydrogen per mole of hexose.

22 | P a g e
Figure II. Effect of hydrogen partial pressure on biological production of hydrogen.
(a) Oxidation of NADH by production of hydrogen is thermodynamically favorable
only when the hydrogen partial pressure is less than 60 Pa, otherwise; (b) other
fermentation products must be formed. Reactions [(a) and (b)]: 1, glucose
metabolism through glycolysis or the Entner-Doudoroff pathway; 2, oxidative
decarboxylation of pyruvate by pyruvate: ferredoxin oxidoreductase; 3, formation of
hydrogen by hydrogenase; 4, butyrate fermentation.
3. Biological electricity production
Microbial fuel cells (MFCs) have also been suggested as an alternative to follow
biohydrogen production in a two-step treatment process [38]. Many researchers,
however, have successfully generated electricity biologically in a single-step process
(Table 1, reaction 16) [39–42]. Figure 1 shows a generic schematic of how an MFC
works. In principle, MFCs are similar to hydrogen fuel cells, which channel protons from
an anode compartment to a cathode compartment through an electrolyte
membrane (i.e. electronically insulated proton-exchange membrane) with electrons
23 | P a g e
going in the same direction via a conductive wire. A hydrogen fuel cell oxidizes
hydrogen to electrons and protons on the anode and reduces oxygen to water on the
cathode (Table 1, reaction 14). Gas-permeable noble metals are used as electro-catalysts
on the anode and cathode sides [39]. In an MFC, conversely, anaerobic microorganisms
oxidize organic material in the anode chamber and they transfer the derived reducing
equivalents (electrons) to an electrode rather than to an electron-acceptor molecule.
Several mechanisms have been described by which electrons can be transferred to
metals or electrodes. For example, the dissimulator metal-reducing bacterium (DMRB)
Geobacter spp. makes direct physical contact with solid electron acceptors and uses
periplasmic c-type cytochrome proteins as the metal reeducates [44][45]; hence, these
organisms must grow as a biofilm on the electrode surface [46]. Other types of DMRB,
such as Shewanella spp., can transfer electrons to solid acceptors through e ither direct
contact or by production of soluble quinones that act as electron-shuttling compounds
[47][48]. For organisms of this type, direct contact with the electrode surface is not
required.
In addition to microorganisms that can transfer electrons to the anode, the presence of
other organisms appears to benefit MFC performance. One research group found that a
mixed culture generated a current that was sixfold higher than that generated by a pure
culture [49].

24 | P a g e
Table 2. Maximum hydrogen yields achieved from organic material by a mixed
culture performing dark fermentation during optimization efforts-
Figure 1. Schematic of a dual-chamber microbial fuel cell (MFC). Anaerobic
microorganisms oxidize organic material in the anode chamber. Some
microorganisms attach to the electrode as a biofilm and the electrons are
transferred directly to the electrode and then through a wire to the cathode where
the electrons reduce oxygen to water. Protons are transferred in the same direction
through a proton-exchange membrane. Mixing is required in the anode chamber,
whereas aeration is required in the cathode chamber.

25 | P a g e
Hence, the microbial communities that develop in the anode chamber may have a
similar function asthose found in methanogenic anaerobic digesters, except that micro-
organisms that can transfer electrons to the electrode surface replace methan ogens.
Rabaey and co-workers [39] referred to such microbial communities as adapted
Aeromonadaceae, and Comamonadaceae were able to transfer electrons to electrodes
[40,42,46,49–54]. The major limitations to implementation of MFCs for treatment of
wastewater are that their power density is still relatively low and the technology is only
in the laboratory phase. Based on the potential difference, DE, ano dophilic consortia.
Anodophilic bacteria from between the electron donor and acceptor, a
maximum different evolutionary lineages from the families of Geobacteraceae,
Desulfuromonaceae, Alteromonadaceae, potential of w1 V can be expected in MFCs,
which is not much greater than the 0.7 V that is currently being Enterobacteriaceae,
Pasteurellaceae, Clostridiaceae, produced [55]. However, by linking several MFCs
together, the voltage can be increased. Currents and power densities, however, are
lower than what is theoretically possible, and system performance varies considerably
(Table 3).
Table 3. Maximum power densities achieved in MFCs using various substrates
during optimization efforts
[a- Expressed as power density, which is power per unit area of anode electrode surface.]
The maximum power density reported in the literature (3600 mW/m2) was observed
in a dualchamber fuel-cell treating glucose with an adapted anaerobic consortium in the
26 | P a g e
anode chamber and a continuously aerated cathode chamber containing an electrolyte
solution that was formulated to improve oxygen transfer to the cathode. Costs were
minimized by using plain graphite electrodes without exogenous electron shuttles and a
commercially available exchange membrane [Ultrexe ion-exchange membrane [55].
Further improvement in power density is required, and the rates of electron transport
to the anode electrode are thought to be a major limiting factor [39]. Optimization of
MFCs involves investigation of a variety of aspects of their operation, as given in Table3.
For wastewater treatment in MFCs to be feasible, the construction and operating costs
must be reduced [39][56]. The requirement for expensive noble metals in electrodes,
and soluble or electrode-bound electron shuttles are two important cost elements that
are being addressed by current researchers [39,55,56]. Single-chamber MFCs with air as
the cathode chamber circumvents the cost of aeration [55,56]. In addition, the rate of
electron transport must be improved; this may be achieved by selecting a well-adapted
anodophilic microbial community and optimizing the MFC operating conditions.
Optimization can be conducted in a systematic fashion only when the mechanisms of
electron transfer from microorganism to electrode are better understood. Even when
optimization is achieved, it remains to be seen whether reactor size can be small enough
to make direct bioelectricity production by MFCs economically viable.
4. Biological chemical production
A major limitation to wider application of the bioenergy technologies described in the
previous sections is the relative low cost of the current non-renewable energy sources.
Government subsidies, or a direct local need to save on energy costs (for example,
biogas that is used directly on-site as a fuel), are necessary to make those processes
economically viable. In addition, although bioenergy production may reduce the cost of
wastewater treatment, it cannot entirely satisfy the energy demand of our society.
Therefore, the production of high-value chemicals from organic material in wastewater
might be more feasible than bioenergy production [57]. Industrial wastes can become
inexpensive raw materials for integrated fermentation processes [58–60]. High-
carbohydrate wastewaters that are unsuitable for animal or human feeding are
particularly appropriate for conversion to valuable products in pure-culture or co-
culture processes (e.g. Table 1, reactions 17–19). It is the cost efficiency of the
27 | P a g e
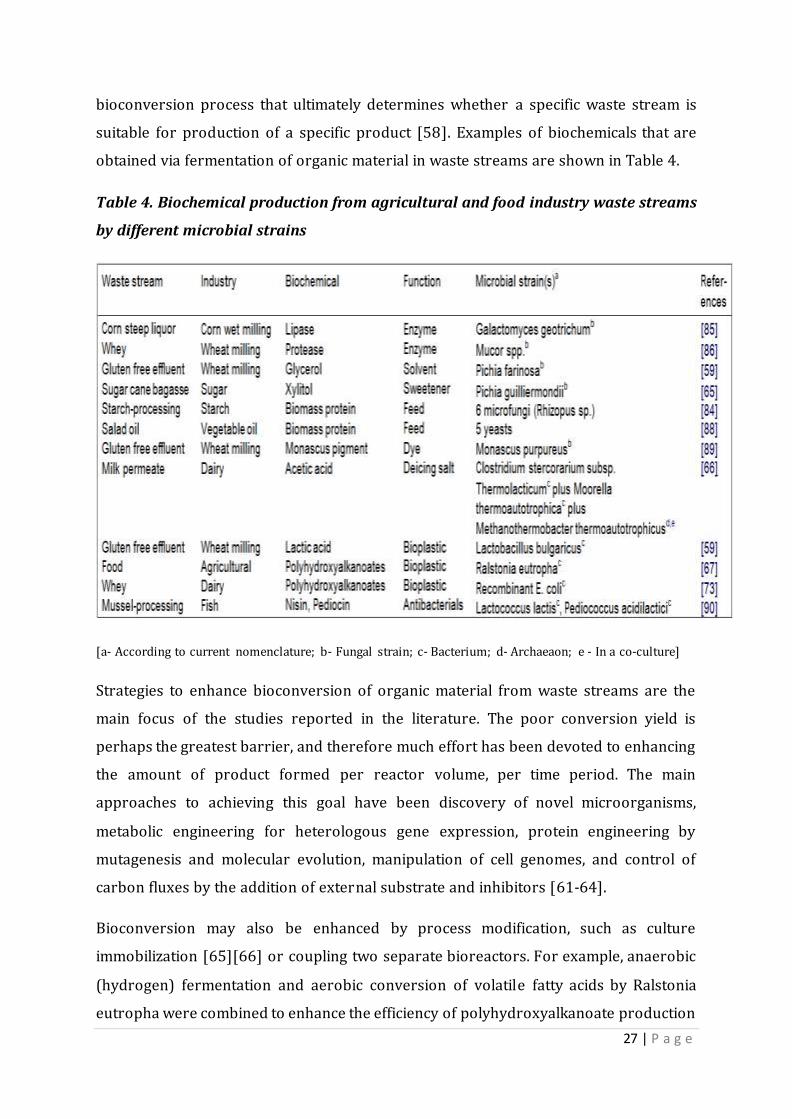
bioconversion process that ultimately determines whether a specific waste stream is
suitable for production of a specific product [58]. Examples of biochemicals that are
obtained via fermentation of organic material in waste streams are shown in Table 4.
Table 4. Biochemical production from agricultural and food industry waste streams
by different microbial strains
[a- According to current nomenclature; b- Fungal strain; c- Bacterium; d- Archaeaon; e - In a co-culture]
Strategies to enhance bioconversion of organic material from waste streams are the
main focus of the studies reported in the literature. The poor conversion yield is
perhaps the greatest barrier, and therefore much effort has been devoted to enhancing
the amount of product formed per reactor volume, per time period. The main
approaches to achieving this goal have been discovery of novel microorganisms,
metabolic engineering for heterologous gene expression, protein engineering by
mutagenesis and molecular evolution, manipulation of cell genomes, and control of
carbon fluxes by the addition of external substrate and inhibitors [61-64].
Bioconversion may also be enhanced by process modification, such as culture
immobilization [65][66] or coupling two separate bioreactors. For example, anaerobic
(hydrogen) fermentation and aerobic conversion of volatile fatty acids by Ralstonia
eutropha were combined to enhance the efficiency of polyhydroxyalkanoate production

28 | P a g e
from food wastes [67]. Another promising strategy for increasing waste bioconversion
rates is the use of co-cultures of pure microbial strains in a single process.
Within this strategy, one species performs most of the complex nutrient hydrolysis, and,
in turn, provides its metabolic byproducts to the second species, which forms the
desired product [68]. This study achieved high acetic acid yields during bioconversion
of milk permeate by combining cells of Clostridium thermolacticum, Moorella
thermoautotrophica, and Methanothermobacter thermoautotrophicus in a consortium.
Addition of the hydrogenotrophic methanogen decreased the hydrogen partial pre ssure,
which increased the acetic acid production. Another potential advantage of co -cultures
is that they might be less sensitive than single cultures to changes in composition of
industrial and agricultural wastewaters (i.e. the wastewater may contain multiple
organic compounds, the relative concentrations of which may change on a diurnal
cycle). Stability in biological waste treatment systems has been linked to increased
biodiversity of the microbial community [69] and to an increased ability of the
community to use alternative removal pathways for the same substrate [70]. In
bioconversion of agricultural and food wastes to valuable chemicals, separation and
purification of the products from the bulk liquid represents the highest percentage of
the manufacturing cost. Therefore, the economic feasibility of reusing wastes will
strongly depend on the downstream processing efficiency. In recent years, considerable
advances have been achieved in biomolecule purification technologies; one of the key
goals is to achieve more selective, more efficient, and shorter separation routes [71]. For
example, a single-step direct lactic acid separation from fermentation broths has been
successfully implemented using anionic fluidized-bed columns [72]. Supercritical fluid
technology (i.e. the use of a fluid at a temperature and pressure that are greater than its
critical levels) has also proven to be a useful tool for achieving separation of compounds
directly from cultures, and is an attractive option because separation is u sually
performed at ambient temperatures using non-toxic, non-flammable solvents, while
achieving product crystallization [73].

29 | P a g e
Conclusion
Water pollution is serious problem that will be threatened for our environment. Dealing
with water pollution is something that everyone (including governments and local
councils) needs to get involved with. Instate of current situation, the waste water can be
used to produce low value as well as high value products and services. If we harnessed
properly, these waste water will made a huge resources for us and can bring a lot of
health and economic benefits, increase food production, reduce poverty, rural and
urban livelihoods and made safe environment for all.
References
1. Point Sources of Pollution: Local Effects and its Control – Vol. I - Industrial
Wastewater-Types, Amounts and Effects - Hanchang SHI.
2. Water care, Au. Water Pollution Fact, Sheet 1 PDF
3. Water Pollution available at- http://forum.bsdi-bd.org/index.php?topic=3361.0
4. What is Water Pollution for children available at http://eschooltoday.com/pollution/
water-pollution/types-of-water-pollution.html?
5. Alteration of Water Pollution Level with the Seasonal Changes in_Mean Daily
Discharge in Three Main Rivers around Dhaka City Bangladesh/figure; available at-
https://www.researchgate.net/publication/279190756
6. Md Mahbubur Rahman, “Environmental Pollution in Dhaka City and Its Effects on
Public Health”, 2003.
7. Bangladesh Bureau of Statistics (BBS), Statistical Yearbook of Bangladesh 2001,
Ministry of Planning, Dhaka 2002.
8. Khan Morshed Ali, “Toxic Trap - Thousands Exposed to Stagnant Tannery Waste”, The
Daily Star, 16 July 2002.
9. Islam Faisal, “Industrial Pollution in Bangladesh”, The World Bank Dhaka office, 2001 .
10. M Shehab Ullah, “A study of hospital waste management in Dhaka city”, 1999.
11. Tariq Bin Yousuf, “Solid Waste and Sewerage Disposal of Dhaka”, 1998.
12. Allan H Smith, Elena O Lingas & Mahfuzar Rahman on “Contamination of drinking-
water by arsenic in Bangladesh: a public health emergency”, 1998.

30 | P a g e
13. A survey report by British Geological Team on “Percentage of Ground Waters with
Arsenic Levels over the Limit”, Bangladesh, 1998.
14. Facts about the BP Oil Spill, Facts about nutrient pollution, EPA, EPA-840-F12-003
May 2012; available at- http://enviropol.com/index.php/effects-of-water-pollution
15. Lee, C.C., Y.B. Chiua and C.H. Sun. 2010. The environmental Kuznetns curve
hypothesis for water pollution: Do regions matter? Energy Policy Volume 38, Issue 1,
January 2010, Pages 12-23
16. Hernández-Sancho, F., M. Molinos-Senantea and R. Sala-Garrido. 2010. Economic
valuation of environmental benefits from wastewater treatment processes: An
empirical approach for Spain Science of The Total Environment Volume 408, Issue 4, 15
January 2010, Pages 953-957
17. Lettinga, G. et al. (1980) Use of the upflow sludge blanket (USB) reactor concept for
biological wastewater treatment, especially for anaerobic treatment. Biotechnol. Bioeng.
22, 699–734
18. Jantsch, T.G. et al. (2002) Anaerobic biodegradation of spent sulphite liquor in a
UASB reactor. Bioresour. Technol. 84, 15–20
19. Karim, K. and Gupta, S.K. (2003) Continuous biotransformation and removal of
nitrophenols under denitrifying conditions. Water Res. 37, 2953–2959
20. Angenent, L.T. et al. (2004) Formation of granules and Methanosaeta fibres in an
anaerobic migrating blanket reactor (AMBR). Environ. Microbiol. 6, 315–322
21. Angenent, L.T. and Sung, S. (2001) Development of anaerobic migrating blanket
reactor (AMBR), a novel anaerobic treatment system. Water Res. 35, 1739–1747
22. Angenent, L.T. et al. (2002) Microbial community structure and activity in a
compartmentalized, anaerobic bioreactor. Water Environ. Res. 74, 450–461
23. Kalogo, Y. and Verstraete, W. (1999) Development of anaerobic sludge bed (ASB)
reactor technologies for domestic wastewater treatment: motives and perspectives.
World J. Microbiol. Biotechnol. 15, 523–534
24. Angenent, L.T. et al. (2002) Methanogenic population dynamics during startup of a
full-scale anaerobic sequencing batch reactor treating swine waste. Water Res. 36,
4648–4654
25. Witt, P.M. and Schmidt, L.D. (1996) Effect of flow rate on the partial oxidation of
methane and ethane. J. Catal. 163, 465–475

31 | P a g e
26. Tao, S. and Irvine, J.T. (2003) A redox-stable efficient anode for solid-oxide fuel cells.
Nat. Mater. 2, 320–323
27. Logan, B.E. et al. (2002) Biological hydrogen production measured in batch
anaerobic respirometers. Environ. Sci. Technol. 36, 2530–2535
28. Yokoi, H. et al. (2002) Microbial production of hydrogen from starch-manufacturing
wastes. Biomass Bioenergy 22, 389–395
29. Yu, H. et al. (2002) Hydrogen production from rice winery wastewater in an upflow
anaerobic reactor by using mixed anaerobic cultures. Int. J. Hydrogen Energy 27, 1359–
1365
30. Zhang, T. et al. (2003) Biohydrogen production from starch in wastewater under
thermophilic condition. J. Environ. Manage. 69, 149–156
31. Ueno, Y. et al. (2001) Microbial community in anaerobic hydrogen-producing
microflora enriched from sludge compost. Appl. Microbiol. Biotechnol. 57, 555–562
32. Fang, H.H. et al. (2002) Characterization of a hydrogen-producing granular sludge.
Biotechnol. Bioeng. 78, 44–52
33. Fang, H.H. et al. (2002) Microbial diversity of a mesophilic hydrogen-producing
sludge. Appl. Microbiol. Biotechnol. 58, 112–118
34. Chen, C.C. et al. (2001) Kinetics of hydrogen production with continuous anaerobic
cultures utilizing sucrose as the limiting substrate. Appl. Microbiol. Biotechnol. 56–64
35. Oh, S.E. et al. (2003) The relative effectiveness of pH control and heat treatment for
enhancing biohydrogen gas production. Environ. Sci. Technol. 37, 5186–5190
36. Hussy, I. et al. (2003) Continuous fermentative hydrogen production from a wheat
starch co-product by mixed microflora. Biotechnol. Bioeng. 84, 619–626
37. Ginkel, S.V. et al. (2001) Biohydrogen production as a function of pH and substrate
concentration. Environ. Sci. Technol. 35, 4726–4730
38. Logan, B.E. (2004) Extracting hydrogen and electricity from renew-able resources: a
roadmap for establishing sustainable processes. Environ. Sci. Technol. 38, 160A–167A
39. Rabaey, K. et al. (2003) A microbial fuel cell capable of converting glucose to
electricity at high rate and efficiency. Biotechnol. Lett. 25, 1531–1535
40. Park, H.S. et al. (2001) A novel electrochemically active and Fe (III)-reducing
bacterium phylogenetically related to Clostridium butyr-icum isolated from a microbial
fuel cell. Anaerobe 7, 297–306
32 | P a g e
41. Kim, B.H. et al. (2003) Enrichment of microbial community generat-ing electricity
using a fuel-cell-type electrochemical cell. Appl. Microbiol. Biotechnol. 63, 672–681
42. Chaudhuri, S.K. and Lovley, D.R. (2003) Electricity generation by direct oxidation of
glucose in mediatorless microbial fuel cells. Nat. Biotechnol. 21, 1229–1232
43. Hoogers, G. (2002) Fuel cell components and their impact on performance. In Fuel
Cell Technology Handbook (Hoogers, G. ed.), pp. 414–427, CRC Press
44. Nevin, K.P. and Lovley, D.R. (2000) Lack of production of electron-shuttling
compounds or solubilization of Fe(III) during reduction of insoluble Fe(III) oxide by
Geobacter metallireducens. Appl. Environ. Microbiol. 66, 2248–2251
45. Magnuson, T.S. et al. (2001) Isolation, characterization and gene sequence analysis
of a membrane-associated 89 kDa Fe(III) reducing cytochrome c from Geobacter
sulfurreducens. Biochem. J. 359, 147–152
46. Bond, D.R. and Lovley, D.R. (2003) Electricity production by Geobacter
sulfurreducens attached to electrodes. Appl. Environ. Microbiol. 69, 1548–1555
47. Nevin, K.P. and Lovley, D.R. (2002) Mechanisms for accessing insoluble Fe(III) oxide
during dissimilatory Fe(III) reduction by Geothrix fermentans. Appl. Environ. Microbiol.
68, 2294–2299
48. Newman, D.K. and Kolter, R. (2000) A role for excreted quinones in extracellular
electron transfer. Nature 405, 94–97
49. Park, D.H. and Zeikus, J.G. (2002) Impact of electrode composition on electricity
generation in a single-compartment fuel cell using Shewanella putrefaciens. Appl.
Microbiol. Biotechnol. 59, 58–61
50. Bond, D.R. et al. (2002) Electrode-reducing microorganisms that harvest energy
from marine sediments. Science 295, 483–485
51. Kim, N. et al. (2000) Effect of initial carbon sources on the performance of microbial
fuel cells containing Proteus vulgaris. Biotechnol. Bioeng. 70, 109–114
52. 36 Park, D.H. and Zeikus, J.G. (2000) Electricity generation in microbial fuel cells
using neutral red as an electronophore. Appl. Environ. Microbiol. 66, 1292–1297
53. Kim, H.J. et al. (2002) A mediator-less microbial fuel cell using a metal reducing
bacterium, Shewanella putrefaciens. Enzyme Microb. Tech-nol. 30, 145–152
54. Pham, C.A. et al. (2003) A novel electrochemically active and Fe(III)-reducing
bacterium phylogenetically related to Aeromonas hydro-phila, isolated from a microbial
fuel cell. FEMS Microbiol. Lett. 223, 129–134
33 | P a g e
55. Park, D.H. and Zeikus, J.G. (2003) Improved fuel cell and electrode designs for
producing electricity from microbial degradation. Biotech-nol. Bioeng. 81, 348–355
56. Liu, H. et al. (2004) Production of electricity during wastewater treatment using a
single chamber microbial fuel cell. Environ. Sci. Technol. 38, 2281–2285
57. Bungay, H.R. (2004) Confessions of a bioenergy advocate. Trends Biotechnol. 22, 67–71
58. Laufenberg, G. et al. (2003) Transformation of vegetable waste into value added
products: (A) the upgrading concept; (B) practical implementations. Bioresour. Technol.
87, 167–198
59. Wang, R. et al. (2002) The application of a generic feedstock from wheat for
microbial fermentations. Biotechnol. Prog. 18, 1033–1038
60. Montgomery, R. (2004) Development of biobased products. Bioresour. Technol. 91,
1–29
61. Bramucci, M.G. and Nagarajan, V. (2000) Industrial wastewater bioreactors: sources
of novel microorganisms for biotechnology. Trends Biotechnol. 18, 501–505
62. Aldor, I.S. and Keasling, J.D. (2003) Process design for microbial plastic factories:
metabolic engineering of polyhydroxyalkanoates. Curr. Opin. Biotechnol. 14, 475–483
63. Park, S.J. et al. (2002) Production of poly(3-hydroxybutyrate) from whey by fed-
batch culture of recombinant Escherichia coli in a pilot-scale fermenter. Biotechnol.
Lett. 24, 185–189
64. van Hoek, P. et al. (2003) Fermentation goes large-scale. Chem. Eng. Prog. 99, 37S–42S
65. Carvalho, W. et al. (2002) Metabolic behavior of immobilized Candida guilliermondii
cells during batch xylitol production from sugarcane bagasse acid hydrolyzate.
Biotechnol. Bioeng. 79, 165–169
66. Huang, Y.L. et al. (2002) Production of carboxylic acids from hydrolyzed corn meal
by immobilized cell fermentation in a fibrous-bed bioreactor. Bioresour.
Technol. 82, 51–59
67. Du, G. and Yu, J. (2002) Green technology for conversion offood scraps to
biodegradable thermoplastic polyhydroxyalkanoates. Environ. Sci. Technol. 36, 5511 –
5516
68. Collet, C. et al. (2003) Improvement of acetate production from lactose by growing
Clostridium thermolacticum in mixed batch culture. J. Appl. Microbiol. 95, 824–831

34 | P a g e
69. Pynaert, K. et al. (2003) Characterization of an autotrophic nitrogen-removing
biofilm from a highly loaded lab-scale rotating biological contactor. Appl. Environ.
Microbiol. 69, 3626–3635
70. Hashsham, S.A. et al. (2000) Parallel processing of substrate correlates with greater
functional stability in methanogenic bio-reactor communities perturbed by glucose.
Appl. Environ. Microbiol. 66, 4050–4057
71. Karumanchi, R.S.M.S. et al. (2000) Field-assisted extraction of cells, particles and
macromolecules. Trends Biotechnol. 20, 72–78
72. 56 Sosa, A.V. et al. (2001) Fluidized bed design parameters affecting novel lactic acid
downstream processing. Biotechnol. Prog. 17, 1079–1083
73. Sarkari, M. et al. (2003) CO2 and fluorinated solvent-based technol-ogies for protein
microparticle precipitation from aqueous solutions. Biotechnol. Prog. 19, 448–454
74. Thauer, R.K. et al. (1977) Energy conservation in chemotrophic anaerobic bacteria.
Bacteriol. Rev. 41, 100–180
75. Schnu¨rer, A. et al. (1999) Mesophilic syntrophic acetate oxidation during methane
formation in biogas reactors. FEMS Microbiol. Ecol. 29, 249–261
76. Gottschalk, G. (1986) Bacterial Metabolism, Springer-Verlag
77. Khanal, S.K. et al. (2004) Biological hydrogen production: effects on pH and
intermediate products. Int. J. Hydrogen Energy 29, 1123–1131
78. Wu, S.Y. et al. (2003) Hydrogen production with immobilized sewage sludge in
three-phase fluidized-bed bioreactors. Biotechnol. Prog. 19, 828–832
79. Chin, H.L. et al. (2003) Fedbatch operation using Clostridium acetobutylicum
suspension culture as biocatalyst for enhancing hydrogen production. Biotechnol. Prog.
19, 383–388
80. Wu, S.Y. et al. (2002) Microbial hydrogen production with immobilized sewage
sludge. Biotechnol. Prog. 18, 921–926
81. Fang, H.H. and Liu, H. (2002) Effect of pH on hydrogen production from glucose by a
mixed culture. Bioresour. Technol. 82, 87–93
82. Chen, C.C. and Lin, C.Y. (2001) Start-up of anaerobic hydrogen producing reactors
seeded with sewage sludge. Acta Biotechnol. 21,371–379
83. Ueno, Y. et al. (2001) Characterization of a microorganism isolated from the effluent
of hydrogen fermentation my microflora. J. Biosci. Bioeng. 92, 397–400

35 | P a g e
84. Mizuno, O. et al. (2000) Enhancement of hydrogen production from glucose by
nitrogen gas sparging. Bioresour. Technol. 73, 59–65
85. Burkert, J.F. et al. (2004) Optimization of extracellular lipase production by
Geotrichum sp. using factorial design. Bioresour. Technol. 91, 77–84
86. Tubesha, Z.A. and Al-Delaimy, K.S. (2003) Rennin-like milk coagulant enzyme
produced by a local isolate of Mucor. Int. J. Dairy Technol. 56, 237–241
87. Jin, B. et al. (1999) Screening and selection of microfungi for microbial biomass
protein production and water reclamation from starch processing wastewater. J. Chem.
Technol. Biotechnol. 74, 106–110
88. Zheng, S.K. et al. (2002) Seed yeast cultivation for salad oil manu-facturing
wastewater treatment. J. Environ. Sci. (China) 14, 39–43
89. Domınguez-Espinosa, R.M. and Webb, C. (2003) Production of monascus pigments in
wheat based substrates. World J. Microbiol. Biotechnol. 19, 329–336
90. Guerra, N.P. and Pastrana, L. (2002) Nisin and pediocin pro -duction on mussel-
processing waste supplemented with glucose and five nitrogen sources. Lett. Appl.
Microbiol. 34, 114–118