Production of activated carbon within the indirect...
56
Production of activated carbon within the indirect gasification process Master’s thesis within the Sustainable Energy Systems programme AMIR SHABANZADEH Department of Energy and Environment Division of Energy Technology CHALMERS UNIVERSITY OF TECHNOLOGY Gothenburg, Sweden 2012 T2012-384
Transcript of Production of activated carbon within the indirect...
Production of activated carbon within the indirect gasification process Master’s thesis within the Sustainable Energy Systems programme
AMIR SHABANZADEH
Department of Energy and Environment
Division of Energy Technology CHALMERS UNIVERSITY OF TECHNOLOGY
Gothenburg, Sweden 2012
T2012-384


I
MASTER’S THESIS
Production of activated carbon within the indirect
gasification process
Master’s thesis within the Sustainable Energy Systems programme (MPSES)
AMIR SHABANZADEH
SUPERVISORS:
Placid Tchoffor Atongka
Kent Davidsson
SP Technical Research Institute of Sweden
EXAMINER
Henrik Thunman
Chalmers University of Technology
Department of Energy and Environment
Division of Energy Technology CHALMERS UNIVERSITY OF TECHNOLOGY
Gothenburg, Sweden 2012
T2012-384

II
Production of activated carbon within the indirect gasification process Master’s thesis within the Sustainable Energy Systems programme
AMIR SHABANZADEH
© Amir Shabanzadeh, 2012
T2012-384
Department of Energy and Environment Division of Energy Technology
Chalmers University of Technology
SE-412 96 Göteborg
Sweden
Telephone: + 46 (0)31-772 1000
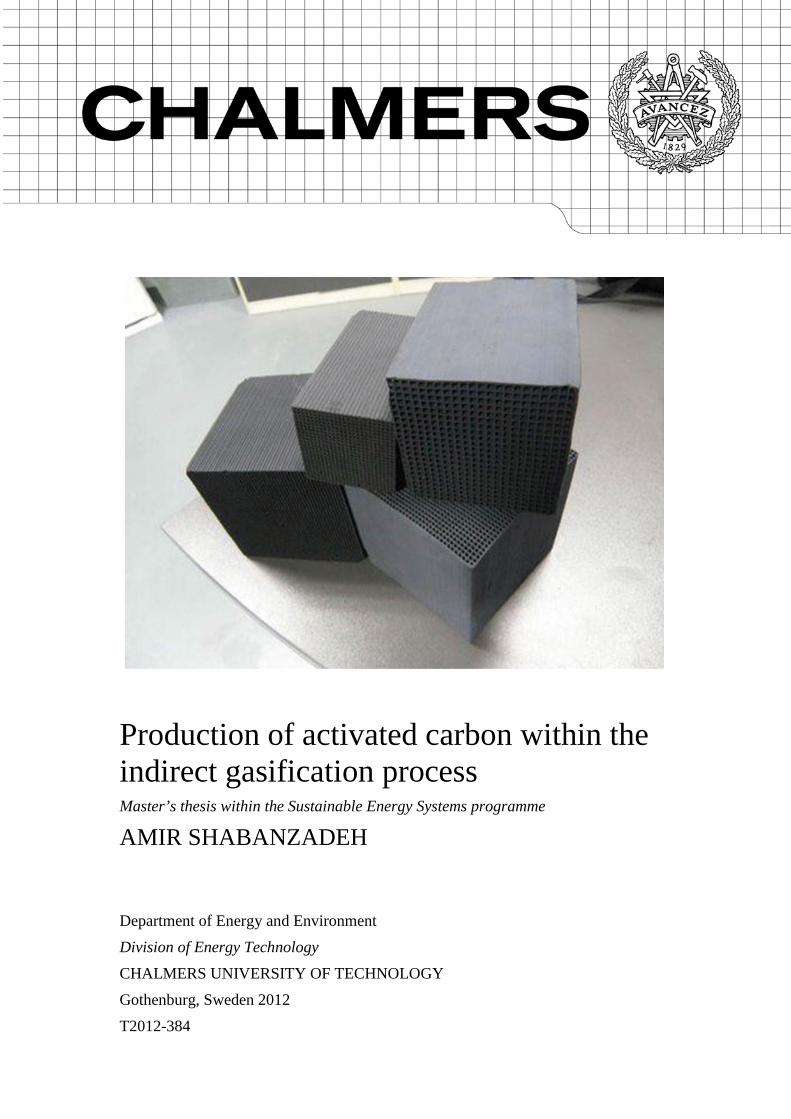
Cover:
Honeycomb Activated carbon, Figure source: http://www.diytrade.com
Chalmers Reproservice
Göteborg, Sweden 2012
T2012-384

III
Abstract Activated carbon is one of the most attractive adsorbent which has a wide area of application. One of these areas of application is in the adsorption of impurities from the product gas resulting from biomass gasification. An impurity such as H2S in the product gas cause poisoning of catalysts used in downstream processes in which the product gas is used. Tars in the product gas condense on cold engine, turbine, and downstream pipelines causing fouling. These impurities should be eliminated before the product gas is subjected to downstream processes. One way of removing or at least decreasing the concentration of these impurities from the product gas is by the use of activated carbon in a fixed bed. The operating conditions under which activated carbon is produced are somewhat similar to those that prevail during the gasification step of indirect gasification. It may thus be cost effective to produce activated carbon within the indirect gasification processes so it can be used for the cleaning system of the product gas. In this work the possibility of the production of activated carbon within the indirect gasification process is investigated.
To evaluate the use of char from a gasification process as activated carbon, samples of char were produced in laboratory scale reactors under gasification conditions using two methods. In the first method called two-steps activation, virgin biomass was first pyrolysis and the resulting char was subsequently activated with steam. During the pyrolysis stage, the temperature was varied from 750 - 900°C and the residence time was fixed at 5 minutes. The char samples obtained during the pyrolysis stage were activated at the same temperatures with steam. The steam flow rate and the residence time were varied to study their effects on the quality and yield of activated carbon. In the second method called one-step activation, the virgin biomass was carbonized and activated simultaneously by gasifying it with steam. The temperature was varied from 750 to 900ºC and residence time was varied from 10 to 25 minutes.
The burn off rates of the carbonization and the activation processes, as well as the char and activated carbon yields were calculated on dry basis. A qualitative analysis of both the samples of char and activated carbon produced was done by: 1- the determination of the BET (Brunaure, Emmett, and Teller) internal pore surface area and volume, 2- structural analysis of the carbon crystals and pore bodies by the SEM (Scan Electron Microscopy).
The results showed that the yield of activated carbon generally decreased as the temperature, residence time, and steam flow rate increased for both the one and two-steps activation methods. In contrast, the total internal surface area and volume of the pores in the samples of activated carbon increased when the operating temperature, residence time and steam flow rate were increased. However, the surface area and volume of the micropores decreased. The amount of the micropore volume is a good indication for the adsorption capacity of the activated carbon. For a fixed temperature, residence time and steam flow rate, there was a marginal increase in the total pore surface area and volume of the samples of activated carbon produced by the two -steps method relative to those in the samples of activated carbon produced by the one-step method. Given that activated carbon is commercially produced mostly by the two-steps method, the comparable total surface area and volume for both the samples of activated carbon produced by the one and two-steps methods suggest that activated carbon can effectively be produced during indirect gasification by the one-step method.

IV
A closer look into the results showed that the samples of activated carbon with the highest total surface area, 1136.4 m2/g and volume, 1.16 cm3/g were produced by the two-steps activation method under the temperature range 850 to 900°C, and a total residence time of 20 minutes. However under the same operating conditions, these samples had the lowest yield, 3.2%, on dry basis. Under the temperature range 750 to 850°C and at a total fixed residence time of 20 minutes, the micropore surface area and volume remained almost the same for all the samples of activated carbon. However there was a slight drop in the micropore surface area of the activated carbon produced at 800ºC relative to those produced at 750 and 850ºC. This was true for all the samples of activated. SEM images of the both the char and activated carbon produced at 800°C showed that while the pore channels of the char are visible and firm, the pore walls of the corresponding activated carbon melted and collapsed against each other closing the pore channels. This may have been due to the melting of some ash components in the pore walls of the activated carbon at this temperature.
The results show that most of the samples of activated carbon produced in this work have good adsorption characteristics to be used as an adsorbent. Given that they were produced under operating conditions similar to those in the indirect gasification process, one can conclude that the production of activated carbon can be integrated into the indirect gasification process. While this has been shown to be technically feasible in this work, further work needs to be done to assess the economic feasibility of this integration.
Keywords: Activated carbon, indirect gasification, biomass, adsorption capacity, pore characteristics.
V
Sammanfattning Aktivt kol (AC) är den mest attraktiva absorbenten och det finns ett stort användningsområde för den, både i gas- och vätskeadsorption. Ett av dessa användningsområden är som adsorbent av föroreningar i produktgasen vid förgasningen av biomassa. En viktig förorening i produktgasen är tjära. Den kondenserbara tjärans avlagringar på gasens pass-väg kan orsaka blockering och korrosion av nedströms utrustningen. Andra föroreningar såsom H2S i produktgasen orsakar förgiftning av katalysatorer som användes vid efterföljande processer där produktgasen används. Dessa föroreningar måste avlägsnas innan de nedströms processer utsätts för gasen. Ett sätt att avlägsna eller åtminstone minska koncentrationen av dessa föroreningar från produkt gasen är genom användning av fast-bädd adsorption i vilken det aktiva kolet används som adsorbent. De operativa förhållanden under vilka aktivt kol produceras är liknar de som råder under indirekt förgasning. Det finns därmed en möjlighet att det kan vara kostnadseffektivt att framställa aktivt kol i de indirekta förgasningsprocesserna som kan användas för rengöring av produktgasens. Denna studie undersöker möjligheten att integrera produktionen av aktivt kol i den indirekta förgasningsprocessen.
Olika prover av aktiverat kol har framställts i reaktorer i laboratorieskala under förgasningsförhållanden med två olika metoder. Den första metoden, kallad Tvåstegsaktivering, blir den ursprungliga biomassan först karboniserad under pyrolys och det kvarvarande kolet aktiveras därefter med ånga. Prover togs fram under pyrolys vid temperaturer mellan 750-900°C och en konstant uppehållstiden på 5 minuter. Koksprodukten som aktiverades därefter med ånga vid samma temperatur som under pyrolysen. Både flödeshastigheten för ångan och uppehållstiden varierades vid aktiveringen för att studera hur det påverkade det aktiva kolet. I den andra metoden som kallas Enstegsaktivering, blir den ursprungliga biomassan aktiverad genom förgasning med ånga. Prover togs fram för förgasningtemperaturer mellan 750 till 900ºC och uppehållstider mellan 10 och 25 minuter.
Burn-Off graden (% massreduktionen på grund av förbränning) för pyrolysen och aktiveringsprocessen, samt den erhållna mängden koks och aktivt kol beräknades på torr basis. En kvalitativ analys av den framställda koksen och det aktiva kolet för båda metoderna gjordes med: 1 - bestämning av BET (Brunaure, Emmett och Teller) inre por yta och volym, 2 - Strukturell analys av kolkristallerna och porer genom SEM (Scan elektronmikroskopi).
Resultaten visade att mängden aktivt kol minskade när temperaturen, uppehållstiden och ångflödet ökade för både En- och Tvåstegsaktiveringsmetoderna. Trenden var den motsatta för den totala inre ytan och volymen hos porerna, som ökade med ökad temperatur, uppehållstid och ångans flödeshastighet. Dock minskade arean och volymen av mikroporerna. Mängden av mikroporsvolym är en god indikation på adsorptionskapaciteten hos det aktiva kolet. För en bestämd temperatur, uppehållstid och ångflödeshastighet var det endast en marginell ökning i area och volym för samtliga porer för proverna av aktivt kol som produceras med Tvåstegsmetoden jämfört med de i proverna av aktivt kol som produceras med Enstegsmetoden. Aktivt kol produceras kommersiellt mestadels med Tvåstegsmetoden. Att porernas totala area och volym för båda proverna av aktivt kol som producerats med En- och Tvåstegmetoden är jämförbara, tyder på att aktivt kol kan produceras effektivt i en indirekt förgasningsprocess med Enstegsmetoden.
VI
En närmare granskning av resultaten visade att prover av aktivt kol med den högsta totala ytan, 1136.4 m2/g, och volymen, 1.16 cm3/g, fås med Tvåstegsaktiveringsmetoden i temperaturintervallet 850 till 900°C med en total uppehållstid på 20 minuter. Under samma driftsförhållanden, hade dock dessa prover det lägsta utbytet, 3.72 %, på torr basis. I temperaturintervallet 750 till 850°C och med en total uppehållstid på 20 minuter, förblir den mikroporösa ytan och volymen ungefär detsamma för alla prover av aktivt kol. Det fanns dock en liten minskning i mikroporernas yta för aktivt kol som produceras vid 800ºC i förhållande till det som produceras i intervallet mellan 750 och 850ºC. Detta gällde för alla prover av aktiverat kol. SEM-bilder av både koks och aktivt kol som producerats vid 800°C visade att medan porkanalerna i det karboniserade materialet (koksen) är synliga och fasta, har porväggarna hos det aktiva kolet producerat vid högre temperatur smält och kollapsat mot varandra och slutit porkanalerna. Detta kan ha berott på att vissa askkomponenter i porväggarna smält vid denna temperatur i det aktiva kolet.
Resultaten visar att de flesta av proverna av aktivt kol som framställts i detta arbete har goda adsorptionsegenskaper. Med tanke på att de producerades under driftsförhållanden liknande dem i den indirekta förgasningsprocessen, ser vi en möjlighet att produktionen av aktivt kol kan integreras i den indirekta förgasningsprocessen. Medan detta har visat sig vara tekniskt möjligt i detta arbete, behövs ytterligare arbete göras för att bedöma den ekonomiska genomförbarheten av denna integration.
Nyckelord: aktivt kol, indirekt förgasning, biomassa, adsorptionskapacitet, porkarakteristika.

VII
Acknowledgments I would like to thank everybody who supported me in this project. First of all, I would like to thank my examiner Henrik Thunman, Professor at Chalmers University of technology for giving me the opportunity to work on this project and for his professional advices.
I would like also to thank my supervisors at SP Dr. Kent Davidsson and Placid Tchoffor Atongka respectively, experts and researchers in combustion engineering at SP (Technical research institute of Sweden), for their guidance. I appreciate your constructive criticism and interesting discussions.
My appreciation also goes to all the engineers and laboratory staff at Chalmers University of Technology and SP Technical Research Institute of Sweden for their contributions to this work.
Finally, I would like to thank my family and my daughters for their support, co-operation and patience during my study period.
VIII
Notations & acronyms AC Activated Carbon
BFB Bubbling fluidized bed
CFB Circulating fluidized bed
HSF High Steam Flow rate [In this work 5.693 ml/min]
LSF Low Steam Flow rate [In this work 1.883 ml/min]
MFV Minimum Fluidizing Velocity
nm 109 m
PSD Pore Size Distribution SEM Scan Electron Microscopy
STP Standard condition for the Temperature and Pressure, the current version of IUPAC's standard is a temperature of 0°C (273.15 K) and an absolute pressure of 100 KPa (0.986 atm)
Å 1010 m
BET Brunaure, Emmett and Teller
BJH Barrett, Joyner, Halenda DR Dubinin-Radushkevich
Langmuir Langmuir
ASTM American Society for Testing Materials DIN (Standard) Deutsches Institute fűr Normung
ISO International Organization for Standardization
IUPAC International Union of Pure and Applied Chemistry
IX
Contents Abstract III
Sammanfattning V
Acknowledgments VII
Notations & acronyms VIII
CONTENTS IX
1 INTRODUCTION 1
2 OBJECTIVE 2
3 BACKGROUND 3
3.1 Activated carbon 3 3.1.1 Applications of the activated carbon 4 3.1.2 Gas/Vapour phase adsorption 4 3.1.3 Liquid phase adsorption 4 3.1.4 Activated carbon as catalyst and catalyst support 5 3.1.5 Classification of the activated carbon 5 3.1.6 Adsorption property 6 3.1.7 Adsorption equilibrium 8 3.1.8 Adsorption isotherms 8 3.1.9 Raw material 9
3.2 Preparation of activated carbon 10 3.2.1 Physical activation 10 3.2.2 Regeneration 12
3.3 Physical properties of AC 13 3.3.1 Methods for the estimation of internal surface area 13 3.3.2 Sorption isotherms 14
4 MATERIALS AND METHODS 20
4.1 Fuel 20
4.2 Experimental set-up 20 4.2.1 Fluidized bed reactor 20 4.2.2 Horizontal tube reactor 21
4.3 Experimental procedure 22 4.3.1 Two steps activation 22 4.3.2 One step activation 23
4.4 Characterization 23
5 RESULTS AND DISCUSSION 25
5.1 Burn Off rate and solid yield 25
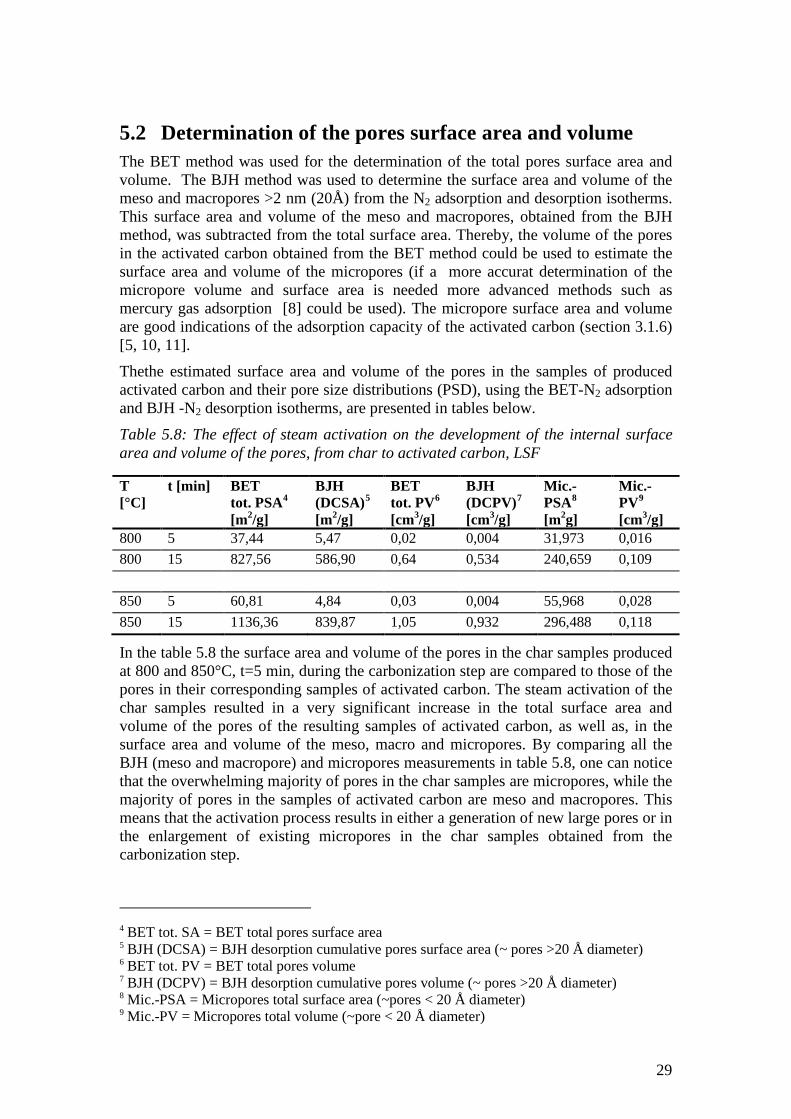
5.2 Determination of the pores surface area and volume 29
X
5.3 Structural analysis by Scan Electron Microscope (SEM) 34
6 CONCLUSION 39
6.1 Further studies 39
REFERENCES 40
1
1 Introduction Direct and indirect gasification of the biomass are some of the most promising processes to produce clean fuel and energy. The product gas from biomass gasification is used as an alternative fuel or feedstock in several different downstream processes. Some of the most common downstream processes in which the product gas from the gasification process is used include:
• Electricity and heat production through the combustion of the product gas in the combustion chamber of a gas turbine.
• Electricity production through the use of hydrogen molecules in the product gas in fuel cells.
• Chemical synthesis to produce high valuable products such as methane gas, DME (Di Methyl Ether) and SNG (synthetic natural gas).
• Catalytic production of high valuable products such as production of pure hydrogen.
The product gas from the gasification process contains some contaminants such as heavy hydrocarbons (tars), ammonia, heavy metals and sulphur species. There are tolerance limits for various impurities in the product used in downstream processes. For example, it is required that the tar concentration of the product gas used in turbines and gas engines should not exceed 100 mg/Nm3 and 40 mg/Nm3, respectively [1, 2]. These limits, therefore, pose a requirement for a gas cleaning process to clean the impurities in the raw product gas before the gas can be used. Larger particles in the hot raw product gas are usually filtered by using cyclones and ceramic filters. Smaller particles and some other impurities such as H2S, alkali halides, etc. require further cleaning processes to remove these impurities before the product gas is used. The clean-up unit is called “guard bed”. Guard beds consist of adsorbents to adsorb small impurities in the product gas. This gas clean-up unit imposes an additional running cost for the process.
Activated carbon is offend used in guard beds to adsorb impurities in the product gas. Activated carbon is the generic term used to describe a family of carbonaceous adsorbents. These adsorbents have a high crystalline form and a large volume fraction of very small pores, which results in a large specific surface area, typically from 500 to 1500 m2/g. Production of chemically activated carbon with high specific surface area up to 3000 m2/g has been reported [3].
Production of the activated carbon requires a considerably amount of energy and steam (steam is the most common activating agent used during the physical activation method). Char and the excess steam from the indirect gasification process can be used to produce the activated carbon required for the guard bed. The produced activated carbon can also be used in other applications. This can thus reduce the total production cost of the gasification process. Investigating the possibility of producing activated carbon during the indirect gasification of biomass is the main objective of this work.
2
2 Objective The objectives of this work are:
I. Study the production of activated carbon by various methods and the effect of operating parameters such as temperature, residence time and steam flow rate on its quality.
II. Study the indirect gasification process with respect to raw materials, operating parameters and harmful substances in the product gas that can be adsorbed by activated carbons.
III. Based on I and II, produce the activated carbon experimentally, investigate the quality of the produced activated carbon and analyse the effect of the operating parameters on its properties.
IV. Based on the investigation from the preceding steps, propose operating parameters during the indirect gasification process that would result in an optimum yield and quality of activated carbon.
3
3 Background 3.1 Activated carbon Activated carbon is a trade name for a carbonaceous adsorbent, which can be manufactured from a variety of carbonaceous material. The most commercial products are made from coconut shell, peat, wood, petroleum residues, sawdust, coal, or lignite. The selection of the raw material to produce activated carbon depends on its end-use or design specifications, since different raw materials will produce activated carbon with different properties.
Activated carbon is characterized by a vast system of pores of molecular size within the carbon particles. Activated carbon consists of non-planar layers of carbon (with some linearly or single bonded carbons). This makes up the entire carbon specimen and explains the existence of porosity and constitution of porosity over the entire carbon specimen.
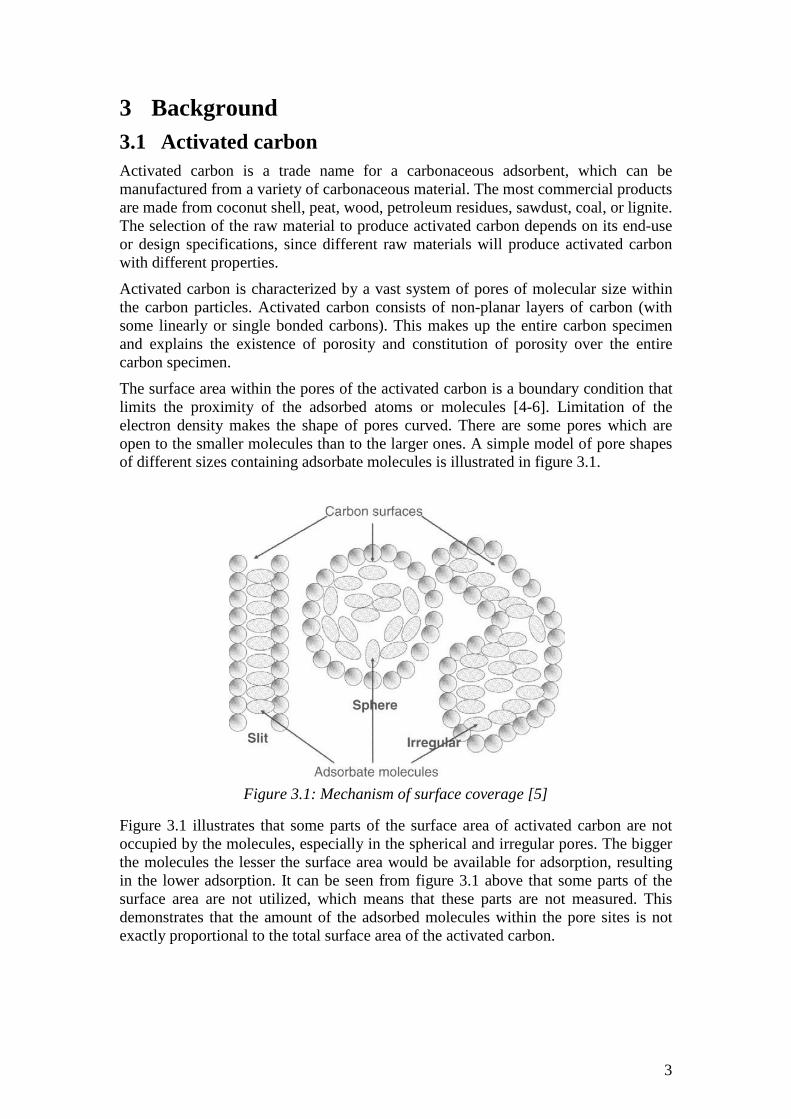
The surface area within the pores of the activated carbon is a boundary condition that limits the proximity of the adsorbed atoms or molecules [4-6]. Limitation of the electron density makes the shape of pores curved. There are some pores which are open to the smaller molecules than to the larger ones. A simple model of pore shapes of different sizes containing adsorbate molecules is illustrated in figure 3.1.
Figure 3.1: Mechanism of surface coverage [5]
Figure 3.1 illustrates that some parts of the surface area of activated carbon are not occupied by the molecules, especially in the spherical and irregular pores. The bigger the molecules the lesser the surface area would be available for adsorption, resulting in the lower adsorption. It can be seen from figure 3.1 above that some parts of the surface area are not utilized, which means that these parts are not measured. This demonstrates that the amount of the adsorbed molecules within the pore sites is not exactly proportional to the total surface area of the activated carbon.
4
3.1.1 Applications of the activated carbon Due to the high degree of reactivity and high adsorption capacity, activated carbon has a very large area of application. The main application areas of the activated carbon are: Gas/vapour phase adsorption, liquid phase adsorption and using the activated carbon as catalyst or as catalyst support.
3.1.2 Gas/Vapour phase adsorption Activated carbon for gas-phase adsorption applications is usually used in the form of hard pellets, fibres, monoliths, cloths and hard granules. These adsorbents have a high adsorption capacity per unit volume.
One of the parameters that have to be considered in gas-phase applications is humidity of the gas. This will reduce the adsorption effectiveness of the activated carbon. It is highly recommended that the relative humidity of the gases to be treated should be lower than 70% [4].
Gas/vapour phase adsorption has a large area of application. Some of these are: purification of the air for immediate use in the inhabited spaces such as residential buildings and offices, prevention of air pollution from the exhaust gases from various industries and power plants and gas purification by adsorption of impurities such as ammonia, H2S, amines, mercury and radioactive iodine.
Some factors that influence the performance of activated carbon in gas/vapour phase are:
• Type of compound to be removed: in general, compounds with a high molecular weight, high boiling point or low vapour pressure and high refractive index can be adsorbed better.
• Temperature: lower temperature causes better adsorption capacity.
• Pressure: higher pressure causes better adsorption capacity.
• Humidity: the lower the humidity the better the adsorption capacity.
• Concentration: higher concentration of the compounds that have to be removed results in the higher consumption of the activated carbon.
3.1.3 Liquid phase adsorption Some examples for adsorption of components in an aqueous system by activated carbons include the removal of the heavy inorganic metal ions such as chromium, mercury, copper, arsenic, uranium, lead or gold from aqueous system in water treatment or industry and power production sites.
Some of the factors that influence the performance of the activated carbon in liquid phase are:
• The type of compound that has to be removed: compounds with high molecular weight and low solubility can be adsorbed better.
• The pH of the waste stream (the stream that has to be filtered): for example, acidic compounds are better removed at lower pH.
5
• The presence of other organic compounds: it causes competition for the available adsorption sites.
• The concentration of the compound to be removed: higher concentration of the compound that has to be removed causes higher consumption of the activated carbon.
3.1.4 Activated carbon as catalyst and catalyst support Besides the adsorption capacity, activated carbons depending on the different functional molecules existing on their pore surfaces can react with different molecules and catalyse a variety of different reactions. The chemistry of functionality and the nature of the graphene layer play roles in the catalytic capability of the activated carbon. For example the amphoteric nature of the graphene layer in the adsorption of anions from aqueous solutions plays the main role in this catalytic reaction process on the active surface of the activated carbon [4].
Carbon has different roles in different reactions. In some reactions, the size and extension of the active surface area and availability of the active site are important parameters. In some other reactions the presence of the carbon-oxygen surface and the nature of the active surfaces play the dominant roles. Catalytic reactions have been classified into different areas: 1- elimination reactions (catalytic elimination of hydrogen halide, etc.), 2- oxidation reactions (catalytic oxidation of H2S, Ferrous Ions, etc.), 3- combination (catalytic combination of hydrogen and bromine or catalytic combination of the phosgene & formaldehyde, etc.) and decomposition reactions (catalytic decomposition of benzoyl peroxide).
Activated carbon can also be used as a catalyst support. It provides a much larger distribution of catalytically active atoms than the atoms on the surface of the corresponding metal. Activated carbons are stable in both acidic and basic media. Metals such as silica and alumina are not as stable as activated carbon, for example alumina can be attacked at very low pH and silica can be dissolved at high pH [7]. An example is the use of activated carbon as a catalyst support for hydrogenation of Cyclohexene.
3.1.5 Classification of the activated carbon Activated carbon materials are usually classified based on their preparation methods or surface characteristics such as effective surface area per gram activated carbon, pore diameter and volume. They can also be classified based on their physical characteristics. Some examples for these classifications are [6]:
1. Powdered activated carbon (PAC). They are formed as powders or fine granules with a size of less than 1.00 mm and the pore diameter is between 15 and 25 µm. That is why they have a small diffusion distance and a large ratio of surface area to volume. They are usually added directly to other processes such as water treatment.
2. Bead activated carbon (BAC). They are made with a size of 0.35-0.80 from petroleum pitch. They have spherical shape, which is suitable for fluidized beds used in water filtration. They have high mechanical strength, low pressure drop and low dust content.
6
3. Granulated activated carbon (GAC). They can either be granulated or extruded. They have relatively larger size of particles compared to the powdered activated carbon. They have smaller external surface area/g and therefore they are suitable for gases and vapours with high diffusion rate. Granulated carbons are used for water treatment, separation of components of flow system and deodorization.
4. Extruded activated carbons. They are made by combining the powdered activated carbon with a binder which fuses together and give them a cylindrical shape with a diameter of 0.8 to 1.30 mm. They have high mechanical strength, low pressure drop and low dust content which make them preferable for gas-phase processes.
5. Impregnated carbon. They are porous carbons containing several types of the cations such as Al, Fe, Zn, Mn, Ca and Li impregnated by inorganic impregnates such as iodine, silver. They have a large area of application both in gas-phase and liquid phase like drinking water treatment and air pollution control.
6. Polymers coated activated carbon. In this process a porous carbon can be coated with a biocompatible polymer to give a permeable and smooth coat without blocking the pores of the carbon. One of the application areas for this kind of AC is for homo-perfusion which is a medical process used to remove toxic substances from a patient's blood.
7. Spherical activated carbon. In this process small spherical balls containing pitch is melted in the presence of tetralin or naphthalene and converted into spheres [6]. Then the naphtha solution extracts naphthalene and creates a porous structure. Subsequently in the presence of an oxidizing agent containing about 30% Oxygen by volume, the spheres are oxidized in the temperature range of 100 and 400°C. Then in the presence of ammonia the spheres are heated to introduce nitrogen into spheres. Finally the spheres are activated by CO2 or steam. The characteristics with the spherical activated carbon are that they adsorb very well SO2 and NO2 and they have a high mechanical strength, which makes them suitable for use in high temperature processes.
3.1.6 Adsorption property The description of the adsorption phenomena requires some definitions. In an adsorption system the solid carbon which adheres molecules on its internal surface area and thus adsorb them, is called an adsorbent. Molecules in the gas/vapour or the solute molecules in the solution which has to be adsorbed within the activated carbon are called adsorptives. The portion of the molecules that are absorbed by the activated carbon is called adsorbate. These expressions will be used in this work frequently.
Adsorption means the adhesion of ions, atoms and molecules of dissolved solids in a liquid-phase or molecules of liquid or gas to the surface of a solid. This results in a higher concentration of the substance in the boundary between the substance and the solid surface than in the bulk of the substance. During the adsorption process a layer (film) of the adsorbate molecules or atoms is created on the surface of the adsorbent. This process is a surface phenomenon, which is caused by surface energy.

7
The fundamental property of carbon adsorbents is that energy is non-uniform on the adsorption space [8, 9]. Activated carbon is a material filled of holes (spaces, voids, and pores), which make it unique. These holes are special, because they are spaces of zero electron density in which adhesive forces adsorb the other molecules.
Atoms at the surface of a solid such as that of activated carbon have imbalanced forces compared to those within the solid. Consequently, foreign molecules are attracted to the surface to improve this imbalance. This makes a monolayer of these adsorbate molecules on the surface of the solid.
First, the adsorbate molecules are transferred through the bulk gas-phase to the surface of the solid and then diffuse onto the internal surfaces of the pores in the solid. However, the adsorbent and the adsorbate molecules have also internal motion as well. The internal motion or frequency of vibration increases with increasing temperature of the adsorption system. This enables both the entering of the adsorbate molecules into the pores, as well as their ejection. The ejected adsorbate molecules are replaced by other adsorbate molecules. At equilibrium, the number of molecules leaving the pores is equal to the molecules entering them. On average an adsorbate molecule moves in and out about 1015 times per second. It is also good to notice that in an activated carbon of approximately 1000 m2/g surface area, there are about 1020 adsorption sites with different potential energy well [4, 5]. That is why the adsorption capacity of an activated carbon depends on the total internal surface area, type and size of its pores. They are the adsorption sites in the surface of micropore channels that stands for the major part of the adsorption, despite that the width of the micropores (width < 2 nm) are smaller than the width of the macropores (width >50 nm) [5, 10, 11].
Activated carbons adsorb a wide variety of substances. Differences in the surface structure make some molecules more easily adsorbed than others. Surface structure of the AC can be affected by different methods of activation. Their adsorption capacity is between 0.6-0.8 cm3/g. The volume of the pores of an activated carbons is generally in the range of 0.1 cm3 to 1.0 cm3/g and the width of the pores ranges from 0.3 to several thousand nm [6]. The internal surface area is generally greater than 400 m2 g-1, it can range between 250 to 2500 m2 [12]. Even production of high surface area MAXORB active carbon with over 3000 m2/g carbon has been reported [3].
Figure 3.2: Schematic picture of the pores inside the activated carbon (figure created
by C. Charles) [12]
8
Due to overlapping of the adsorption potential of opposite walls in micropores there is up to three times more adsorption energies in the micropores than on the nonporous surface of a solid carbon. This results in most of the adsorption occurring in the micropores. At very low relative pressures of the adsorptive, p/p0 < 500 ppm, only the finest micropores are involved the adsorption process. By increasing the concentration of the adsorptive and consequently increasing the relative pressure of the adsorptive, wider pores start to be filled [11].
3.1.7 Adsorption equilibrium Adsorption of the molecules or atoms of the adsorptive in a gas or liquid phase can be classified as chemical and physical adsorptions.
Chemical adsorption or chemisorption is due to the creation of chemical bonds between the adsorbent and the adsorbate molecules. These are mainly covalent bindings. Chemical adsorption is usually an irreversible process.
Physical adsorption or physisorption can be occur when there are some induction of Van der Walls, dipole-dipole or London forces between surface molecules of activated carbon pores and the adsorbate molecules [4, 6].
Carbon atoms are very close to each other as they constitute the surface of the pore site of the activated carbon. This results in the adsorbed molecules being retained within the pores. Physisorption in contrast to the chemisorption is a reversible process. Physical adsorption is a dynamic process in which some adsorbate molecules are transferred from the fluid phase onto the solid surface, while some are released again to the fluid state. When the rates of two processes (adsorption and desorption) are equal, adsorption equilibrium will be obtained.
Adsorption equilibrium for a physical adsorption processes is a function of:
• Partial pressures; adsorption of the adsorptive and consequently adsorption equilibrium is a function of partial pressure of the molecules in the adsorptive (P/P0) at constant temperature. (Here P and P0 are the equilibrium and the saturation pressures of adsorptive molecules at the temperature of adsorption respectively). At constant temperature higher pressure causes higher adsorption and vice versa.
• Temperature; as the physical adsorption process is an exothermic process [4, 6] so by increasing the temperature of the adsorption system at constant pressure adsorption capacity decreases and, on the other hand, by decreasing the temperature adsorption capacity increases.
• Concentration of molecules in the adsorptive phase; experiments show that by increasing the concentration of the adsorptive wider pores [11] the adsorption capacity of activated carbon increase. This will affect the adsorption equilibrium.
3.1.8 Adsorption isotherms In experimental processes adsorption isotherms are commonly used for the determination of the internal surface area of the activated carbon. An Adsorption isotherm is a plot of the amount of adsorbed molecules (x/m mmol/g) against the
9
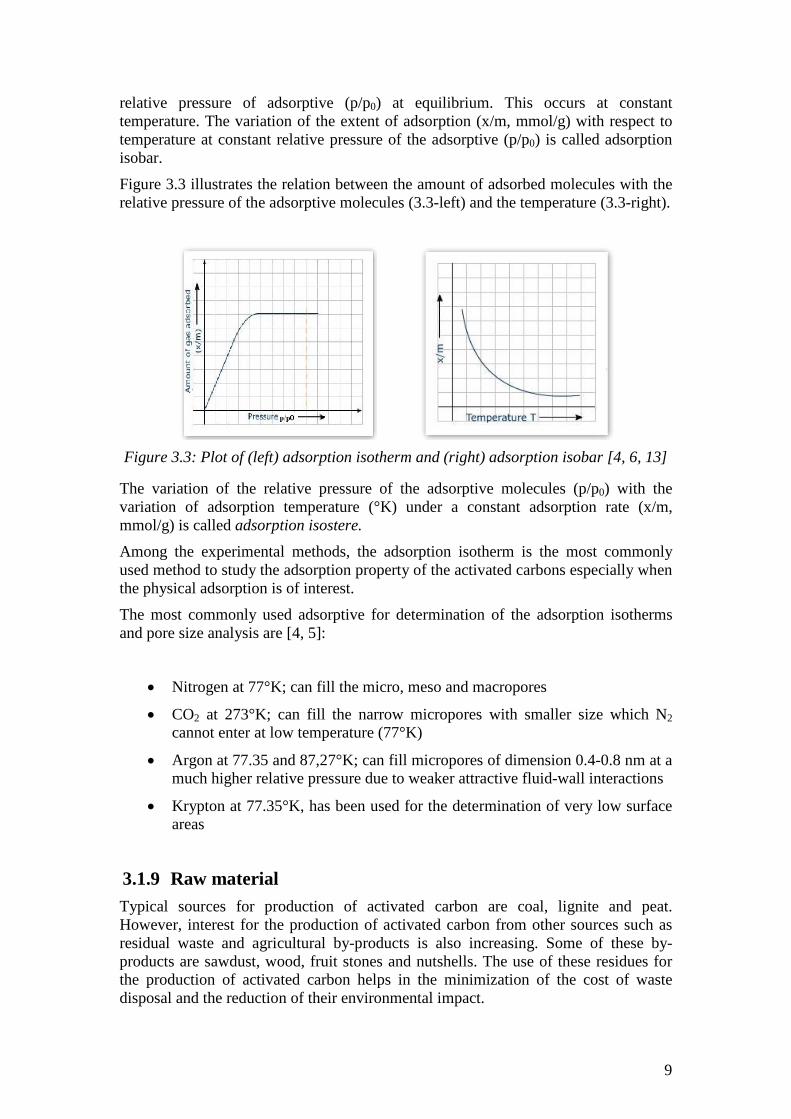
relative pressure of adsorptive (p/p0) at equilibrium. This occurs at constant temperature. The variation of the extent of adsorption (x/m, mmol/g) with respect to temperature at constant relative pressure of the adsorptive (p/p0) is called adsorption isobar.
Figure 3.3 illustrates the relation between the amount of adsorbed molecules with the relative pressure of the adsorptive molecules (3.3-left) and the temperature (3.3-right).
Figure 3.3: Plot of (left) adsorption isotherm and (right) adsorption isobar [4, 6, 13]
The variation of the relative pressure of the adsorptive molecules (p/p0) with the variation of adsorption temperature (°K) under a constant adsorption rate (x/m, mmol/g) is called adsorption isostere. Among the experimental methods, the adsorption isotherm is the most commonly used method to study the adsorption property of the activated carbons especially when the physical adsorption is of interest.
The most commonly used adsorptive for determination of the adsorption isotherms and pore size analysis are [4, 5]:
• Nitrogen at 77°K; can fill the micro, meso and macropores
• CO2 at 273°K; can fill the narrow micropores with smaller size which N2 cannot enter at low temperature (77°K)
• Argon at 77.35 and 87,27°K; can fill micropores of dimension 0.4-0.8 nm at a much higher relative pressure due to weaker attractive fluid-wall interactions
• Krypton at 77.35°K, has been used for the determination of very low surface areas
3.1.9 Raw material Typical sources for production of activated carbon are coal, lignite and peat. However, interest for the production of activated carbon from other sources such as residual waste and agricultural by-products is also increasing. Some of these by-products are sawdust, wood, fruit stones and nutshells. The use of these residues for the production of activated carbon helps in the minimization of the cost of waste disposal and the reduction of their environmental impact.
10
The use of a material for the production of activated carbon depends mainly on its availability, cost and low degradation during the storage time. The raw material also has to be activated easily and should contain a low percentage of inorganic matter to minimize the weight loss during carbonization process. The choice of the raw material also depends on the application of the manufactured activated carbon, kind of the adsorptive molecules and whether it is going to be used for the adsorption in liquid-phase, gas-phase or as a catalyst.
3.2 Preparation of activated carbon Activated carbon is produced from any carbonaceous organic material which contains elemental carbon.
Activation carbon can be produced by two main methods: physical activation and chemical activation.
3.2.1 Physical activation The production of activated carbon by physical activation can be done using two methods. These methods are called one-step activation and two-step activation depending on whether the carbonization and activation processes occur simultaneous or in the separate steps.
3.2.1.1 Two-step activation method This method involves two main steps: 1- carbonization of carbonaceous raw material or pyrolysis, 2- activation or gasification of char or carbonized raw material. In two-steps method carbonization and activation are not carried out simultaneously, but in distinct steps.
3.2.1.1.1 Pyrolysis or carbonization In this step the carbonaceous raw material is heated up in the absence of oxygen. Almost all of the volatile fractions of the raw material leave the material in the form of permanent gases and tar. The residue that contains mostly carbon is called carbonized material or char. Three products are obtained from the decomposition of raw material namely: char, tar and product gas. To maximize the char fraction in this step, the raw material has to be heated with a slow heating rate and the temperature is usually between 400-850°C [14, 15]. Parameters that determine the characteristic of the pores in this step are heating rate, temperature, properties of the raw material and the type of activating agent. Pores characteristic include the total pore volume, pore diameter and pore size distribution. The carbonized material needs further treatment because its adsorption capacity is too low for commercial application. Thus the char needs to be treated to increase the porosity and widened the existing micropores and some mesopores. This further treatment process is called activation.
11
3.2.1.1.2 Activation This is the second step in the production of activated carbon by two steps method. In the physical activation process, oxidizing gases such as steam, carbon dioxide or a mixture of both is used for gasification of the carbonized material or char. Physical activation involves the contact between the char and activating agent followed by reaction between the surface carbons on the pores and the activating agent. These agents extract carbon atoms from the structure of the porous carbon. Steam and CO2 react with surface carbons according to reactions 3.1 and 3.2 below.
C + CO2 → 2CO (+163.18 kJ/mole) (Reaction 3.1)
C + H2O → CO + H2 (+121.33 kJ/mole) (Reaction 3.2)
The result is that the pores are formed. The most important effects of the activation step are: the formation of micropores and mesopores and the increase of the volume and the diameter of existing pores. The residence time can be controlled to have a larger internal surface area as this is an important indication that determines the quality of the activated carbon. Besides the appropriate oxidizing agent, a suitable temperature, usually between 800 to 1100°C [6], has to be applied. This temperature is usually higher than the pyrolysis temperature. This process requires heat, because the reaction of carbon and these oxidizing gases is endothermic. The high temperature of activation causes a water gas shift reaction that is catalyst by the surface of the carbon according to reaction 3.3 below [16]. It increases the hydrogen content of the gasification product at the expense of carbon monoxide.
CO + H2O ↔ CO2 + H2 (- 41KJ/mole) (Reaction 3.3)
This is a pre-step in syngas production in the downstream of a gasifier, where the ratio of hydrogen and carbon monoxide in the product gas is critical. This shift reaction is sensitive to temperature, with the tendency to shift towards reactants as temperature increases based on Le Chatelier's principle.
3.2.1.2 One-Step activation Many studies show that it is possible to produce the activated carbon with physical activation method in one step without pre-carbonization of the raw material [14-19]. One-step activation means that the carbonaceous raw material from the beginning comes in contact with the activation agent, which in most cases is steam or carbon dioxide, so that both carbonization and activation occur simultaneously at the same temperature. Marsh et al [16] used CO2 for the activation of almond shells and olive stones by the one-step or direct activation method from the room temperature to 825-850°C. The results were compared with the activated carbon produced by the two-steps method, pre-carbonization followed by activation with CO2 at 825°C. The result showed that both methods have the same yield and almost similar surface area and volume of micropores. Other studies [14, 15, 17-19] used steam as oxidizing agent for the production of activated carbon in one step. In these studies, the carbonaceous raw material was pyrolyzed at temperatures 500-700°C and 700-800°C under the flow of steam. The results shows that the direct contact and reaction of the raw material with

12
steam or CO2 does not make any considerable differences in the quality of the produced AC as compared to the AC produced by the two-steps method.
3.2.1.3 Chemical activation Chemical activation involves the impregnation of the carbonized material by mixing it with an excess amount of a given chemical, usually in the form of concentrated solution. The commonly used activating agents are: H2SO4, ZnCl2, H3PO4, KOH and NaOH. Other chemicals that can also be used include ferric iron carbonates of alkali metals and potassium sulphide. Impregnation has to be carried out with special care to ensure an intimate contact between the reagent and the precursor. Impregnation results in the dehydration of the carbon skeleton and swelling of the interior canals of the botanic structure followed by the formation of a porous structure. The residence time and the temperature of the operation for this step are important parameters that have to be considered. The chemically impregnated raw material is then pyrolyzed and carbonized in an inert atmosphere. Then the pyrolyzed product is cooled and washed with distilled water or by mild acid to extrude the rest of the activating agent and the agent is recycled. Impregnation (dehydration) is done at a temperature lower than the boiling temperature for the mixture or water. The temperature range for the activation and carbonization step can be up to 1000°C, but is usually between 450 to 600°C, which is much lower than those for physical activation [6, 20]. Chemical activation results in a better development of the porous structure and carbon with higher density. The impregnation process takes up to 24 hours depending on the activating agent, the precursors and the subsequent processes [21].
The most important function of the activating agents in a chemical activation process is the dehydrating of the carbon skeleton that subsequently influences the pyrolytic decomposition of the raw material. The degree of impregnation (ratio of the activating agent to carbonized raw material) is an important factor that determines the quality and the size distribution of the pores. Larger degree of impregnation yields larger pore diameter and larger active surface area in the product.
3.2.2 Regeneration Spent activated carbon is capable of being recycled by using the thermal and chemical reactivation techniques. Physical adsorption or physisorption is the main mechanism by which impurities can be removed from activated carbon. Physical adsorption is a reversible process. This makes the spent activated carbon capable to be regenerated.
Regeneration of activated carbon is based on the fact that carbon is a stable material that is resistant to acidic and basic media and can withstand temperature changes.
Activated carbons used in the chemical adsorption process are not suitable for regeneration because the formation of bonds between the carbon and the adsorbates makes the process non-reversible.
There are several advantages of regeneration. It reduces the environmental impact of the disposal of the spent activated carbon and reserves the landfills. In some other cases the recovery of the adsorbed species is important and the regeneration of the activated carbon makes it possible.
Some common regeneration methods are desorption by hot inert gas, desorption under vacuum and the use of a conventional liquid solvent. The most common method for the recovery of spent activated carbon is by passing a superheated steam flow through
13
the activated carbon bed at a temperature lower than that which was used in the activation process.
3.3 Physical properties of AC Industrial applications always require the determination of the physical properties and adsorption capacity of the activated carbons.
They are many standard testing methods that are in use to determine the physical properties of AC. These methods were developed by some organizations such as, (DIN, 1986) Deutsches Institute fűr Normung, (AWWA, 1990) American Water Works Association, (ASTM, 1992), American Society for Testing Materials and (ISO, 1999) International Organization for Standardization [6, 8, 22].
Some physical properties that are usually used by industrial processes to determine the quality of the activated carbons are:
• Particle size. This property is important because the filterability of the adsorptive flow is directly depending on the size of AC. Furthermore; the rate of adsorption depends inversely on the particle size.
• Mechanical strength. This is a very important property especially for granular AC. When there is a high pressure drop and carbon loses in the system, it is required that the activated carbon should have a high attrition resistance and mechanical strength.
• Real density or helium density. This is the mass of the solid carbon skeleton of the activated carbon, excluding the volume of the voids, (empty spaces between the activated carbon particles) and the pore volume.
• Bulk density. This is the mass per unit volume of the activated carbon in air, which is included the volume of the pores and the empty spaces between the activated carbon particles. This property among others is useful in the determination of the amount of activated carbon needed for a process or determination of the packing volume.
• Apparent density. This is the mass per unit volume of the activated carbon particles including the pore sites and excluding the voids.
Some other properties that are sometimes tested are: ignition temperature and self-ignition temperature, ash content, moisture content and pH value.
3.3.1 Methods for the estimation of internal surface area The amount of the adsorbed molecules that is required to cover the hypothetical surface of the pore sites of a porous solid is called monolayer coverage. However, in practice molecules are adsorbed in multilayer forms. Describing the adsorption process with a mathematical model, which contains the expression for monolayer coverage this, enables the interpretation of the adsorption isotherm. Some of the most accurate and central equations for the characterization of the porosity in solids using
14
sorption isotherms are: Gibbs equation, which is more accurate for multi component systems, Langmuir, Freundlich, Brunauer-Emmett-Teller (BET), Dubinin-Radushkevich (DR) and Barrett, Joyner and Halenda (BJH) equations [5].
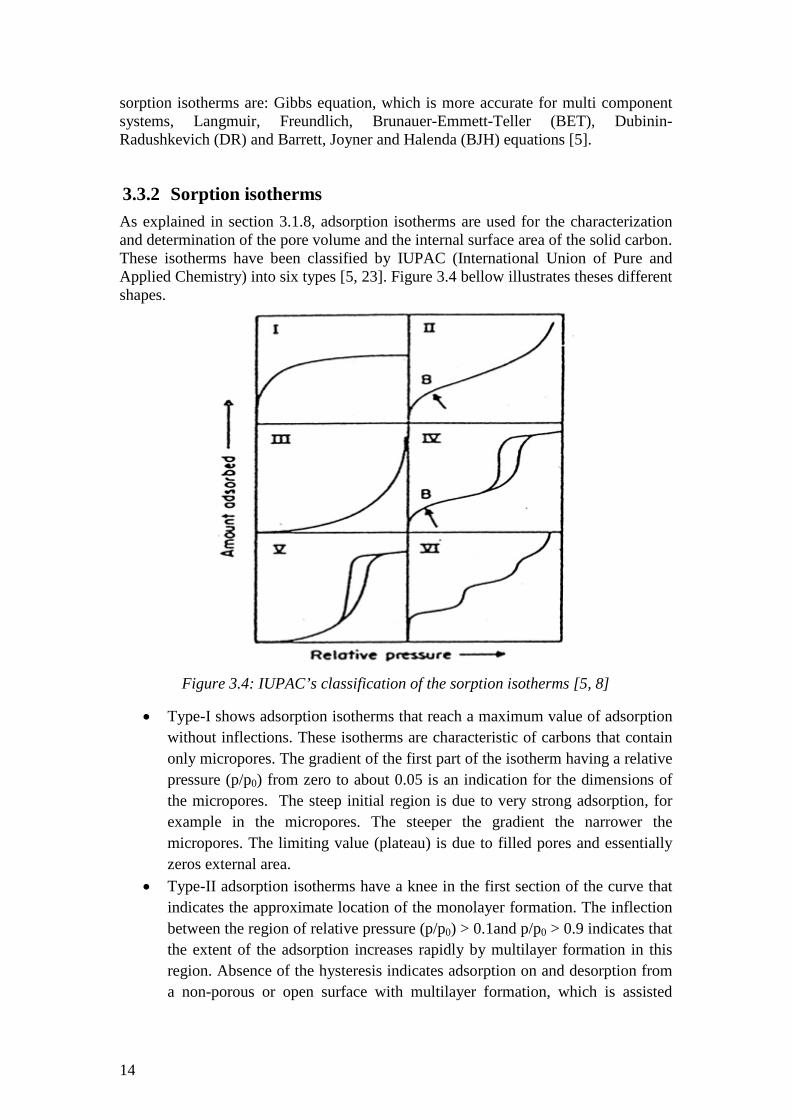
3.3.2 Sorption isotherms As explained in section 3.1.8, adsorption isotherms are used for the characterization and determination of the pore volume and the internal surface area of the solid carbon. These isotherms have been classified by IUPAC (International Union of Pure and Applied Chemistry) into six types [5, 23]. Figure 3.4 bellow illustrates theses different shapes.
Figure 3.4: IUPAC’s classification of the sorption isotherms [5, 8]
• Type-I shows adsorption isotherms that reach a maximum value of adsorption without inflections. These isotherms are characteristic of carbons that contain only micropores. The gradient of the first part of the isotherm having a relative pressure (p/p0) from zero to about 0.05 is an indication for the dimensions of the micropores. The steep initial region is due to very strong adsorption, for example in the micropores. The steeper the gradient the narrower the micropores. The limiting value (plateau) is due to filled pores and essentially zeros external area.
• Type-II adsorption isotherms have a knee in the first section of the curve that indicates the approximate location of the monolayer formation. The inflection between the region of relative pressure (p/p0) > 0.1and p/p0 > 0.9 indicates that the extent of the adsorption increases rapidly by multilayer formation in this region. Absence of the hysteresis indicates adsorption on and desorption from a non-porous or open surface with multilayer formation, which is assisted
15
mostly by the condensation of the adsorptive molecules and not by volume filling.
• Type-III shows adsorption isotherms that are convex. The lack of a knee indicates extremely weak adsorbate-adsorbent interaction as is the case for adsorption on surfaces of organic polymeric systems such as krypton on polymethyl methacrylate. (BET model is not applicable for these isotherms).
• Type-IV isotherms look like the type-II isotherms, but instead of adsorption on open surfaces at high relative pressures (p/p0 >0.9), adsorption takes place in mesopores. The low slope region in the middle of isotherm plot illustrates the first few multilayers. Activated carbons usually do not exhibit a plateau in the high relative pressure region. Hysteresis indicates capillary condensation in meso and macropores as is the case for activated carbon. (BET and BJH models are applicable for these isotherms).
• Type-V represents adsorption isotherms for a low energy, homogeneous solid surface possessing mesopores. The lack of a knee indicates extremely weak adsorbate-adsorbent interaction such as water on black carbon. (BET is not applicable).
• Type-VI represents the adsorption isotherms for surfaces with an extremely homogeneous structure such as pyrolytic graphite that uses methane and argon as adsorbate but not N2.
Hysteresis is indicative of the presence of mesopores. The pore size distribution can be calculated from the adsorption isotherm, as well as, desorption isotherm branches.
3.3.2.1 Equations and methods In this section some of the most common equations used to predict the adsorption isotherms are summarized. These equations or methods are used for describing the pore size distribution and estimation of the internal surface area of the solids as well as activated carbon. Among these methods used to interpret the sorption isotherms the Langmuir, BET, DR and BJH are the central equations for characterization of the porosity in solids. These equations are described below. The method of determination of internal surface area by using the BET equation is explained in detail, because it is used for the characterization of the porosity of the AC produced in this work.
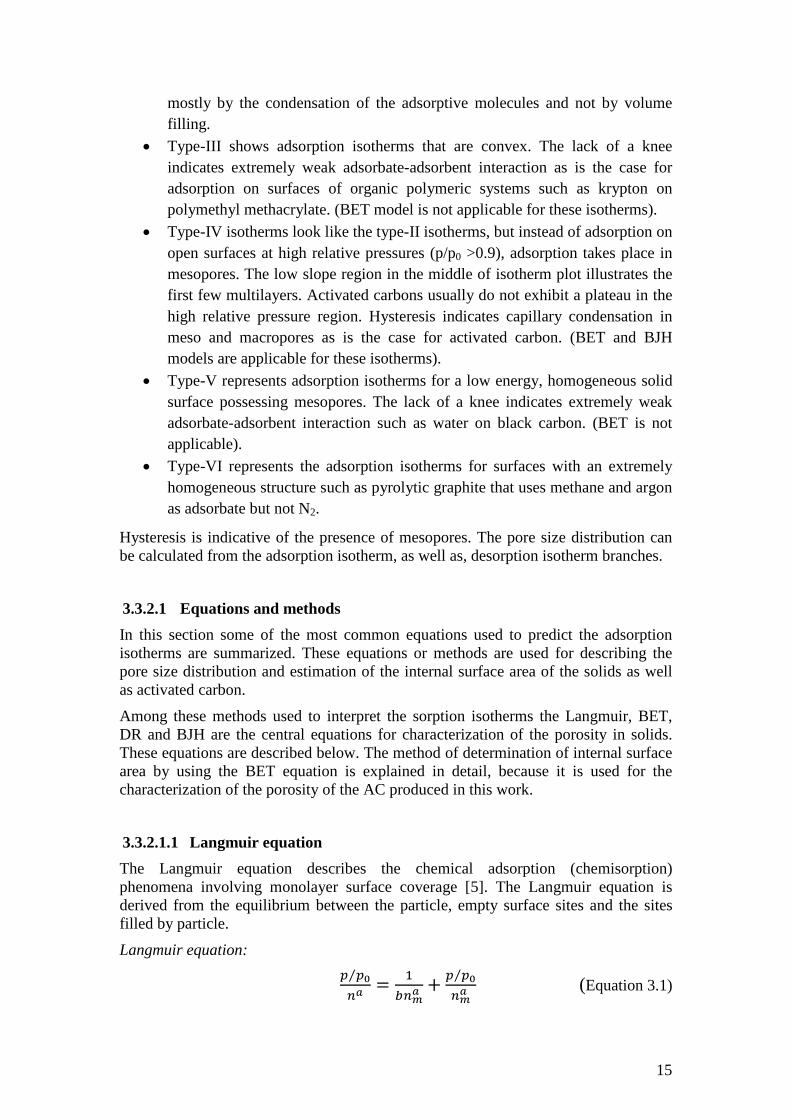
3.3.2.1.1 Langmuir equation The Langmuir equation describes the chemical adsorption (chemisorption) phenomena involving monolayer surface coverage [5]. The Langmuir equation is derived from the equilibrium between the particle, empty surface sites and the sites filled by particle.
Langmuir equation: 𝑝 𝑝0⁄𝑛𝑎
= 1𝑏𝑛𝑚𝑎
+ 𝑝 𝑝0⁄𝑛𝑚𝑎
(Equation 3.1)
16
Here:
p = equilibrium vapour pressure of molecules in adsorptive (Pa)
P0 = saturation vapour pressure (Pa)
na = amount of molecules adsorbed on the adsorbent surface site (mmol/g)
nma = amount of adsorbate which forms a monolayer as a measure of monolayer coverage (mmol/g).
b = a constant which describes the average energy adsorption
A plot of na against P/P0 in equation (3.1) gives the value of 𝐧𝐦𝐚 (monolayer
coverage) (mmol/g).
Basic assumptions for the Langmuir equation are [4-6]:
• The adsorbent has a homogeneous energetic surface; it means that the surface coverage does not have any effect on the heat of adsorption.
• There is just monolayer coverage (adsorption) that happens during the entire adsorption process.
• There is no interaction between the adsorbate molecules with other adsorbate molecules.
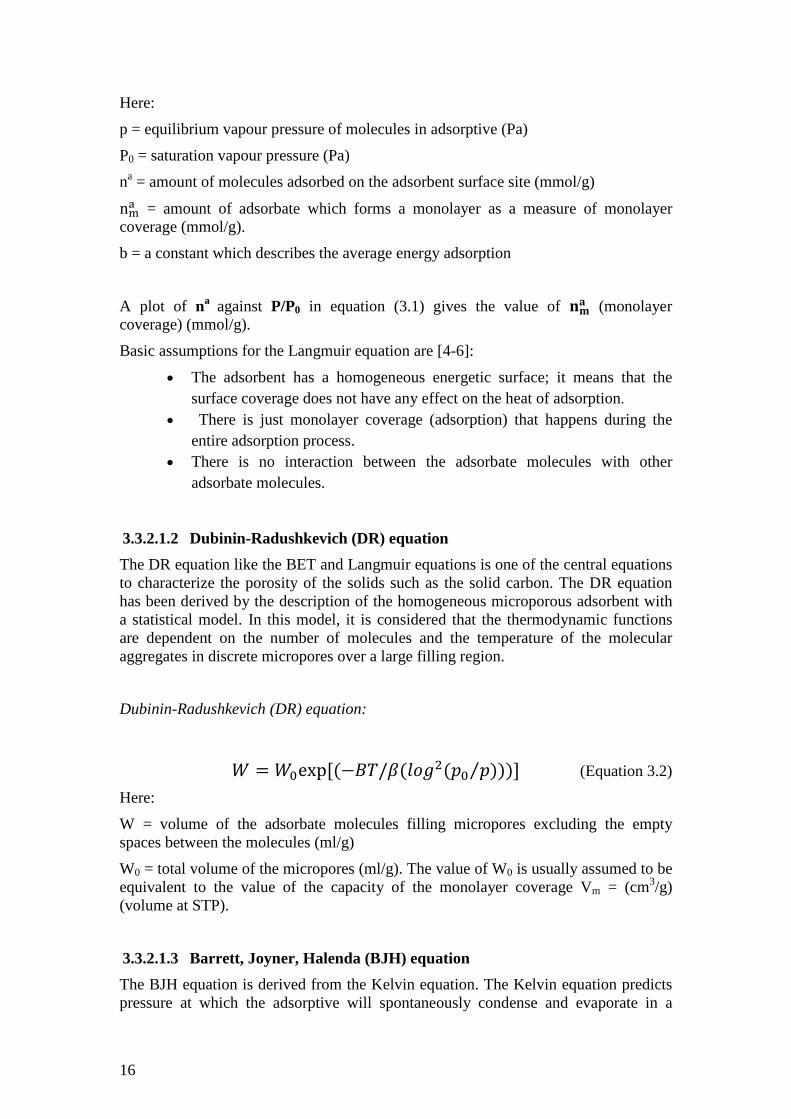
3.3.2.1.2 Dubinin-Radushkevich (DR) equation The DR equation like the BET and Langmuir equations is one of the central equations to characterize the porosity of the solids such as the solid carbon. The DR equation has been derived by the description of the homogeneous microporous adsorbent with a statistical model. In this model, it is considered that the thermodynamic functions are dependent on the number of molecules and the temperature of the molecular aggregates in discrete micropores over a large filling region.
Dubinin-Radushkevich (DR) equation:
𝑊 = 𝑊0exp [(−𝐵𝑇/𝛽(𝑙𝑜𝑔2(𝑝0 𝑝)))]⁄ (Equation 3.2)
Here:
W = volume of the adsorbate molecules filling micropores excluding the empty spaces between the molecules (ml/g)
W0 = total volume of the micropores (ml/g). The value of W0 is usually assumed to be equivalent to the value of the capacity of the monolayer coverage Vm = (cm3/g) (volume at STP).
3.3.2.1.3 Barrett, Joyner, Halenda (BJH) equation The BJH equation is derived from the Kelvin equation. The Kelvin equation predicts pressure at which the adsorptive will spontaneously condense and evaporate in a
17
cylindrical pore of a given size. Condensation occurs in pores that already have some multilayer on the walls. Therefore, the pore size is calculated from the Kelvin equation and the selected statistical thickness (t-curve) equation.
Kelvin equation:
ln 𝑝𝑝0
= 2𝛾𝑣𝑎𝑣𝑟𝑅𝑇
𝑐𝑜𝑠𝜃 (Equation 3.3)
𝑟𝑘 �Å� = 4.15log𝑝0𝑝
cos𝜃 (Equation 3.4)
𝑟𝑝 = 𝑟𝑘 + 𝑡 (Equation 3.5)
Here:
rk = Kelvin radius of the pore, t = thickness of the adsorbed film, and rp = actual radius of the pore
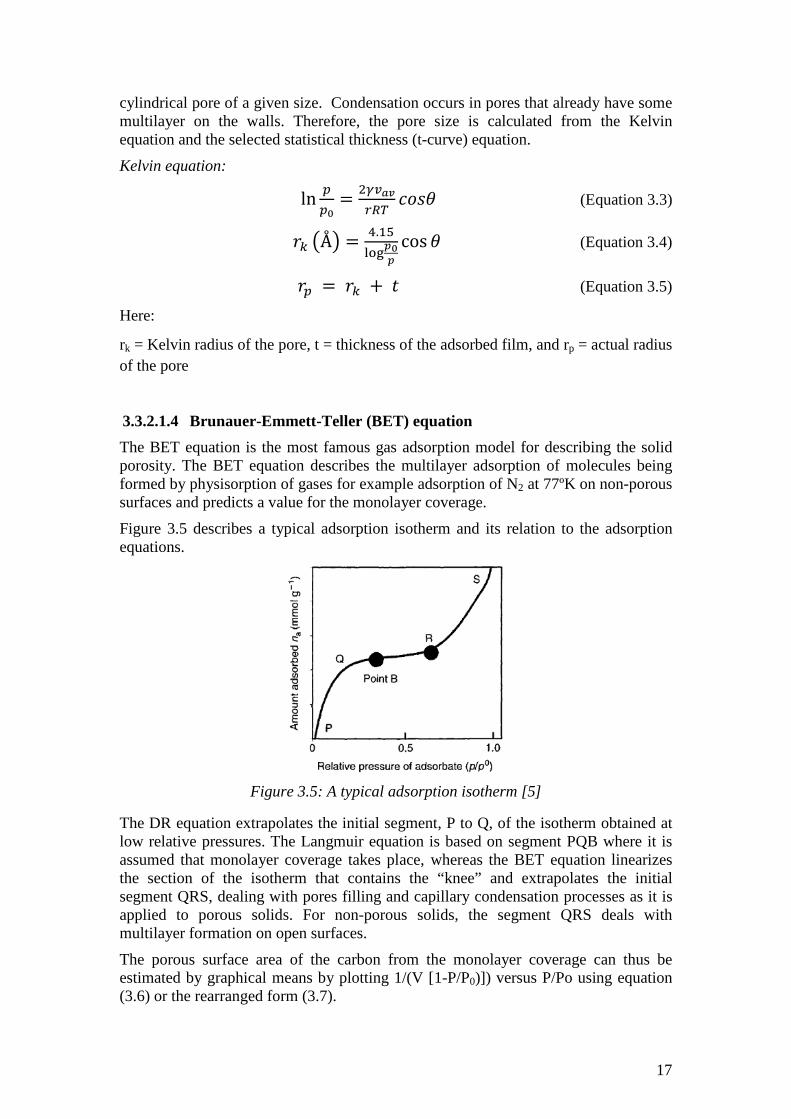
3.3.2.1.4 Brunauer-Emmett-Teller (BET) equation The BET equation is the most famous gas adsorption model for describing the solid porosity. The BET equation describes the multilayer adsorption of molecules being formed by physisorption of gases for example adsorption of N2 at 77ºK on non-porous surfaces and predicts a value for the monolayer coverage.
Figure 3.5 describes a typical adsorption isotherm and its relation to the adsorption equations.
Figure 3.5: A typical adsorption isotherm [5]
The DR equation extrapolates the initial segment, P to Q, of the isotherm obtained at low relative pressures. The Langmuir equation is based on segment PQB where it is assumed that monolayer coverage takes place, whereas the BET equation linearizes the section of the isotherm that contains the “knee” and extrapolates the initial segment QRS, dealing with pores filling and capillary condensation processes as it is applied to porous solids. For non-porous solids, the segment QRS deals with multilayer formation on open surfaces.
The porous surface area of the carbon from the monolayer coverage can thus be estimated by graphical means by plotting 1/(V [1-P/P0)]) versus P/Po using equation (3.6) or the rearranged form (3.7).
18
BET equation: 1
𝑉[𝑝0−𝑝] = 1𝑉𝑚𝑐
+ (𝑐−1)𝑉𝑚𝑐
( 𝑝𝑝0
) (Equation 3.6)
Here:
V = volume of the adsorbed molecules (cm3/g) at STP (standard condition for the temperature and pressure)
Vm = capacity of the monolayer coverage in volume STP (cm3/g)
c = is a BET constant which indicates the energy of the adsorption process and calculated from equation 3.8.
The assumptions taken into account for the BET equation are:
• The internal surface area of the porous carbon (or solid) is similar to the external surface area of the non-porous solid.
• There is no interaction between the adsorption layers. • The gas molecules are adsorbed infinitely on the surface of solid. • The Langmuir theory is applicable on each layer.
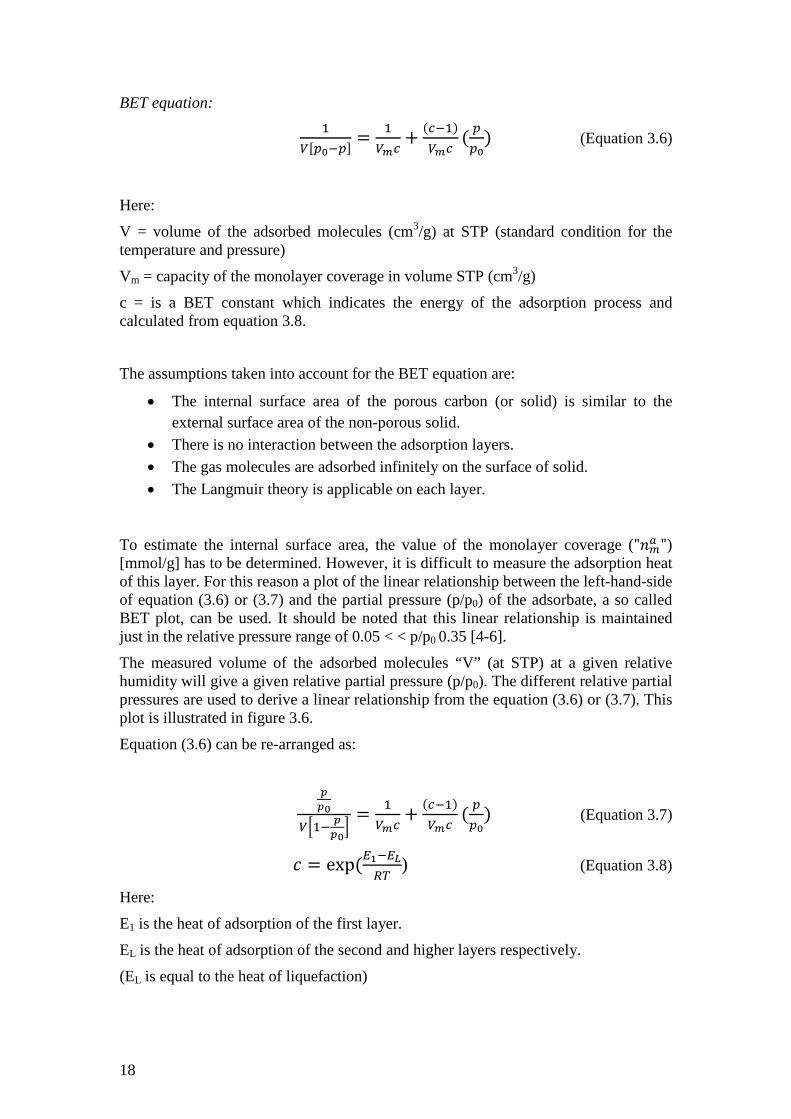
To estimate the internal surface area, the value of the monolayer coverage ("𝑛𝑚𝑎 ") [mmol/g] has to be determined. However, it is difficult to measure the adsorption heat of this layer. For this reason a plot of the linear relationship between the left-hand-side of equation (3.6) or (3.7) and the partial pressure (p/p0) of the adsorbate, a so called BET plot, can be used. It should be noted that this linear relationship is maintained just in the relative pressure range of 0.05 < < p/p0 0.35 [4-6].
The measured volume of the adsorbed molecules “V” (at STP) at a given relative humidity will give a given relative partial pressure (p/p0). The different relative partial pressures are used to derive a linear relationship from the equation (3.6) or (3.7). This plot is illustrated in figure 3.6.
Equation (3.6) can be re-arranged as:
𝑝𝑝0
𝑉�1− 𝑝𝑝0�
= 1𝑉𝑚𝑐
+ (𝑐−1)𝑉𝑚𝑐
( 𝑝𝑝0
) (Equation 3.7)
𝑐 = exp (𝐸1−𝐸𝐿𝑅𝑇
) (Equation 3.8)
Here:
E1 is the heat of adsorption of the first layer.
EL is the heat of adsorption of the second and higher layers respectively.
(EL is equal to the heat of liquefaction)
19
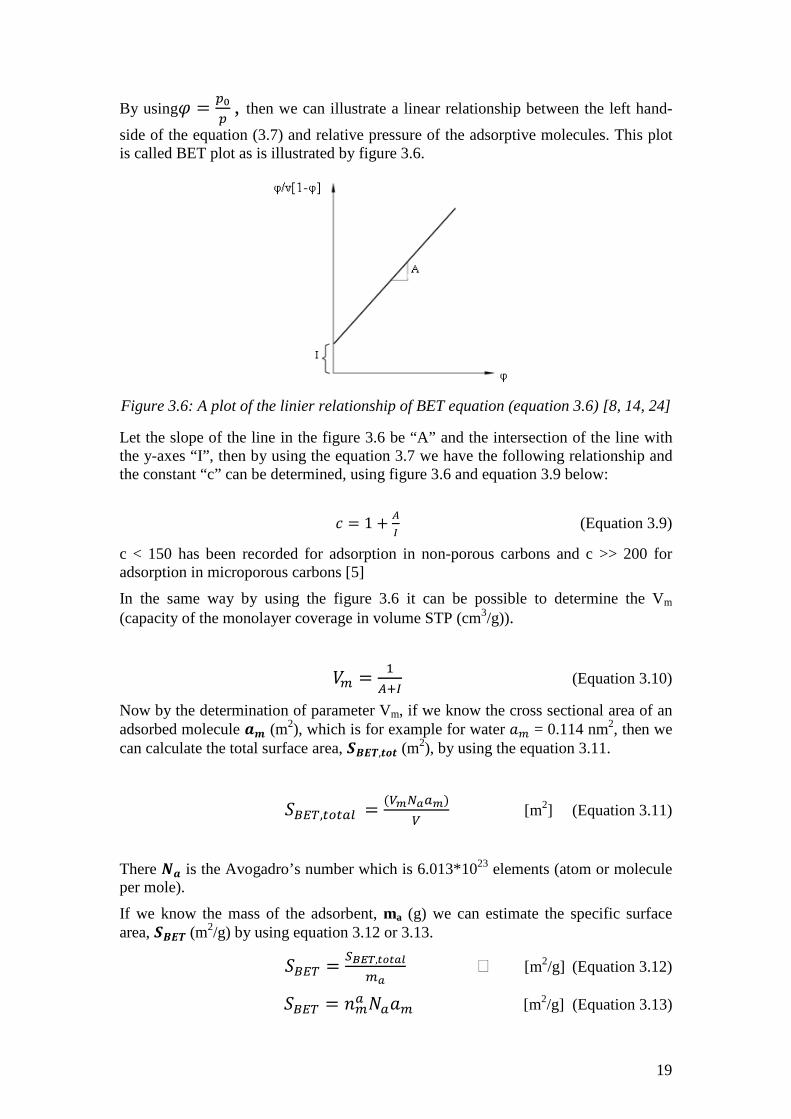
By using𝜑 = 𝑝0𝑝
, then we can illustrate a linear relationship between the left hand-
side of the equation (3.7) and relative pressure of the adsorptive molecules. This plot is called BET plot as is illustrated by figure 3.6.
Figure 3.6: A plot of the linier relationship of BET equation (equation 3.6) [8, 14, 24]
Let the slope of the line in the figure 3.6 be “A” and the intersection of the line with the y-axes “I”, then by using the equation 3.7 we have the following relationship and the constant “c” can be determined, using figure 3.6 and equation 3.9 below:
𝑐 = 1 + 𝐴𝐼 (Equation 3.9)
c < 150 has been recorded for adsorption in non-porous carbons and c >> 200 for adsorption in microporous carbons [5] In the same way by using the figure 3.6 it can be possible to determine the Vm (capacity of the monolayer coverage in volume STP (cm3/g)).
𝑉𝑚 = 1𝐴+𝐼
(Equation 3.10)
Now by the determination of parameter Vm, if we know the cross sectional area of an adsorbed molecule 𝒂𝒎 (m2), which is for example for water 𝑎𝑚 = 0.114 nm2, then we can calculate the total surface area, 𝑺𝑩𝑬𝑻,𝒕𝒐𝒕 (m
2), by using the equation 3.11.
𝑆𝐵𝐸𝑇,𝑡𝑜𝑡𝑎𝑙 = (𝑉𝑚𝑁𝑎𝑎𝑚)𝑉
[m2] (Equation 3.11)
There 𝑵𝒂 is the Avogadro’s number which is 6.013*1023 elements (atom or molecule per mole).
If we know the mass of the adsorbent, ma (g) we can estimate the specific surface area, 𝑺𝑩𝑬𝑻 (m2/g) by using equation 3.12 or 3.13.
𝑆𝐵𝐸𝑇 = 𝑆𝐵𝐸𝑇,𝑡𝑜𝑡𝑎𝑙
𝑚𝑎 [m2/g] (Equation 3.12)
𝑆𝐵𝐸𝑇 = 𝑛𝑚𝑎 𝑁𝑎𝑎𝑚 [m2/g] (Equation 3.13)
20
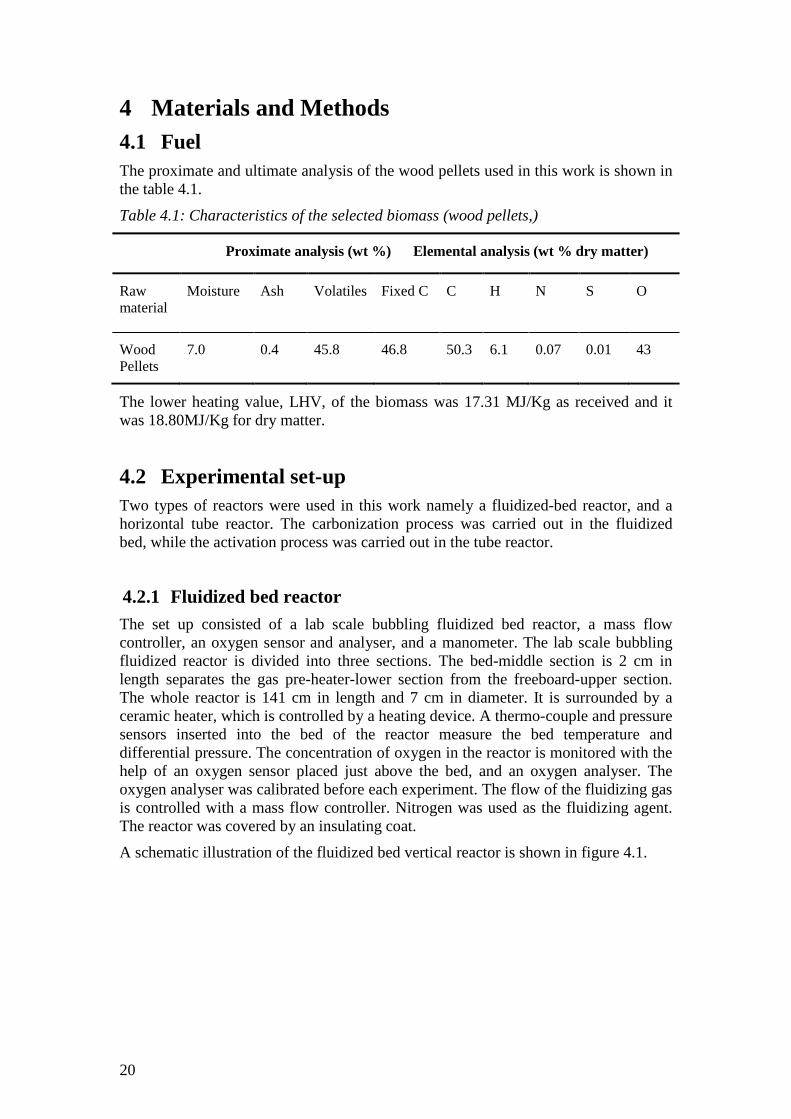
4 Materials and Methods 4.1 Fuel The proximate and ultimate analysis of the wood pellets used in this work is shown in the table 4.1.
Table 4.1: Characteristics of the selected biomass (wood pellets,)
Proximate analysis (wt %) Elemental analysis (wt % dry matter)
Raw material
Moisture Ash
Volatiles Fixed C C H N S O
Wood Pellets
7.0 0.4 45.8 46.8 50.3 6.1 0.07 0.01 43
The lower heating value, LHV, of the biomass was 17.31 MJ/Kg as received and it was 18.80MJ/Kg for dry matter.
4.2 Experimental set-up Two types of reactors were used in this work namely a fluidized-bed reactor, and a horizontal tube reactor. The carbonization process was carried out in the fluidized bed, while the activation process was carried out in the tube reactor.
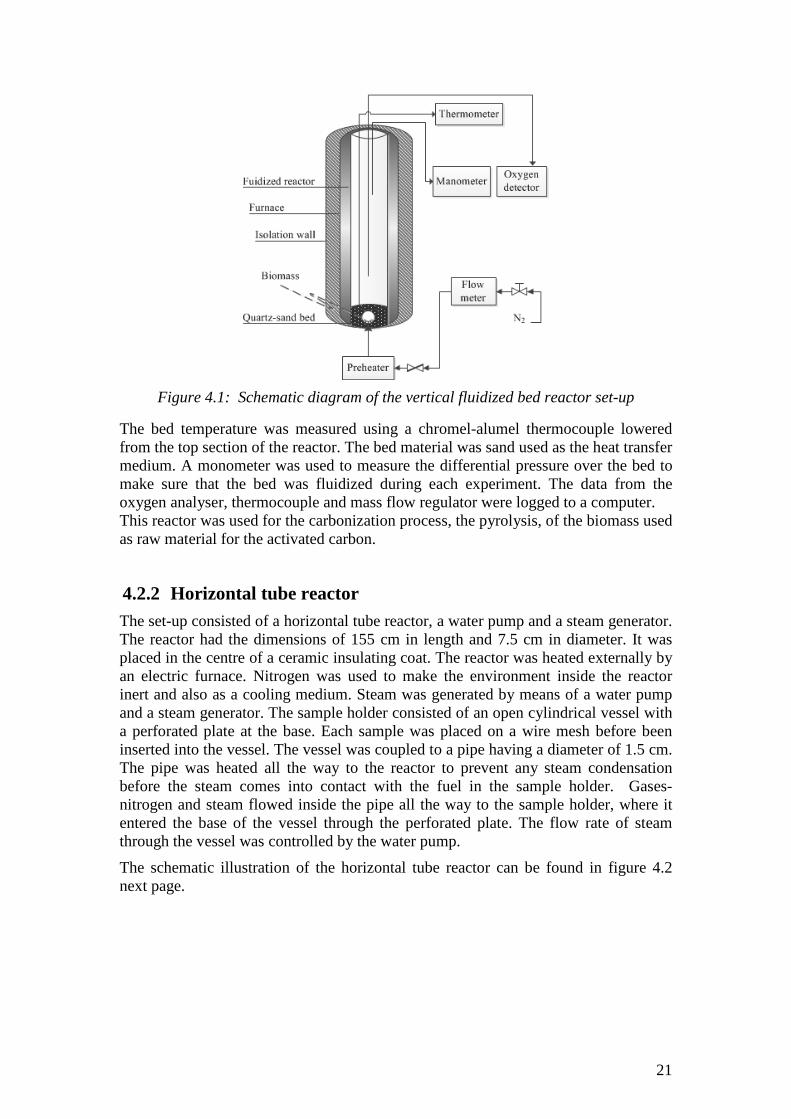
4.2.1 Fluidized bed reactor The set up consisted of a lab scale bubbling fluidized bed reactor, a mass flow controller, an oxygen sensor and analyser, and a manometer. The lab scale bubbling fluidized reactor is divided into three sections. The bed-middle section is 2 cm in length separates the gas pre-heater-lower section from the freeboard-upper section. The whole reactor is 141 cm in length and 7 cm in diameter. It is surrounded by a ceramic heater, which is controlled by a heating device. A thermo-couple and pressure sensors inserted into the bed of the reactor measure the bed temperature and differential pressure. The concentration of oxygen in the reactor is monitored with the help of an oxygen sensor placed just above the bed, and an oxygen analyser. The oxygen analyser was calibrated before each experiment. The flow of the fluidizing gas is controlled with a mass flow controller. Nitrogen was used as the fluidizing agent. The reactor was covered by an insulating coat.
A schematic illustration of the fluidized bed vertical reactor is shown in figure 4.1.
21
Figure 4.1: Schematic diagram of the vertical fluidized bed reactor set-up
The bed temperature was measured using a chromel-alumel thermocouple lowered from the top section of the reactor. The bed material was sand used as the heat transfer medium. A monometer was used to measure the differential pressure over the bed to make sure that the bed was fluidized during each experiment. The data from the oxygen analyser, thermocouple and mass flow regulator were logged to a computer. This reactor was used for the carbonization process, the pyrolysis, of the biomass used as raw material for the activated carbon.
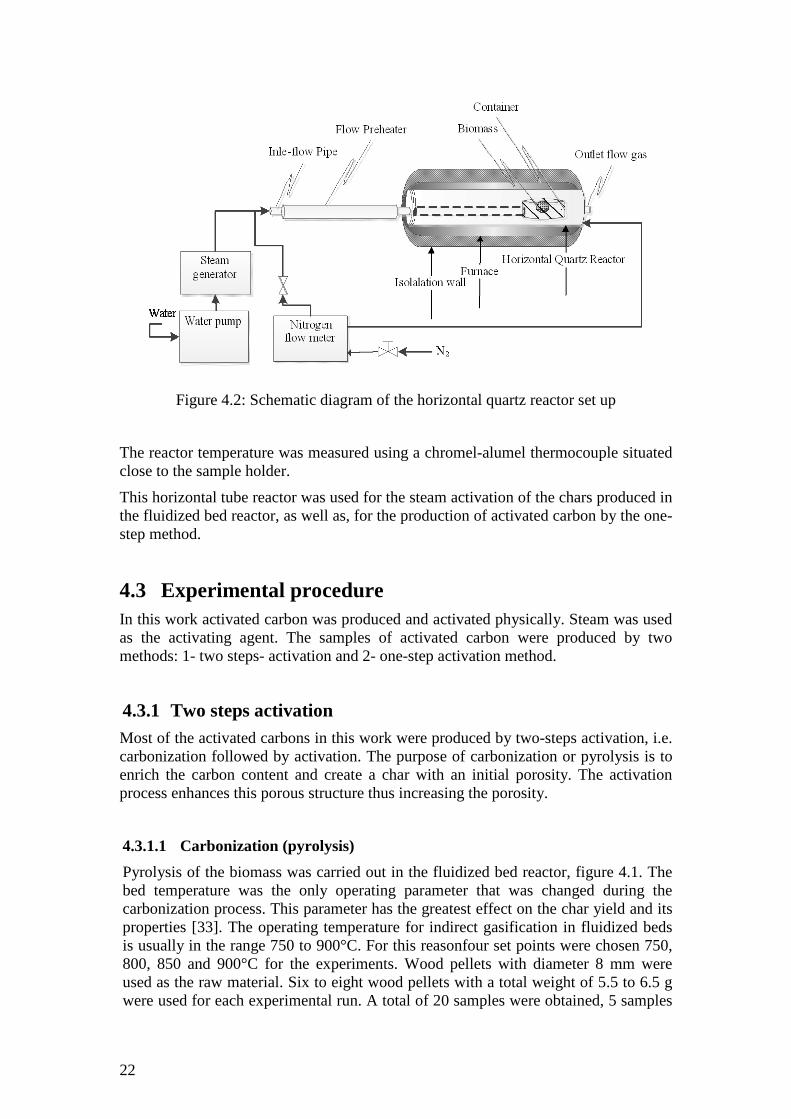
4.2.2 Horizontal tube reactor The set-up consisted of a horizontal tube reactor, a water pump and a steam generator. The reactor had the dimensions of 155 cm in length and 7.5 cm in diameter. It was placed in the centre of a ceramic insulating coat. The reactor was heated externally by an electric furnace. Nitrogen was used to make the environment inside the reactor inert and also as a cooling medium. Steam was generated by means of a water pump and a steam generator. The sample holder consisted of an open cylindrical vessel with a perforated plate at the base. Each sample was placed on a wire mesh before been inserted into the vessel. The vessel was coupled to a pipe having a diameter of 1.5 cm. The pipe was heated all the way to the reactor to prevent any steam condensation before the steam comes into contact with the fuel in the sample holder. Gases-nitrogen and steam flowed inside the pipe all the way to the sample holder, where it entered the base of the vessel through the perforated plate. The flow rate of steam through the vessel was controlled by the water pump.
The schematic illustration of the horizontal tube reactor can be found in figure 4.2 next page.
22
Figure 4.2: Schematic diagram of the horizontal quartz reactor set up
The reactor temperature was measured using a chromel-alumel thermocouple situated close to the sample holder.
This horizontal tube reactor was used for the steam activation of the chars produced in the fluidized bed reactor, as well as, for the production of activated carbon by the one-step method.
4.3 Experimental procedure In this work activated carbon was produced and activated physically. Steam was used as the activating agent. The samples of activated carbon were produced by two methods: 1- two steps- activation and 2- one-step activation method.
4.3.1 Two steps activation Most of the activated carbons in this work were produced by two-steps activation, i.e. carbonization followed by activation. The purpose of carbonization or pyrolysis is to enrich the carbon content and create a char with an initial porosity. The activation process enhances this porous structure thus increasing the porosity.
4.3.1.1 Carbonization (pyrolysis) Pyrolysis of the biomass was carried out in the fluidized bed reactor, figure 4.1. The bed temperature was the only operating parameter that was changed during the carbonization process. This parameter has the greatest effect on the char yield and its properties [33]. The operating temperature for indirect gasification in fluidized beds is usually in the range 750 to 900°C. For this reasonfour set points were chosen 750, 800, 850 and 900°C for the experiments. Wood pellets with diameter 8 mm were used as the raw material. Six to eight wood pellets with a total weight of 5.5 to 6.5 g were used for each experimental run. A total of 20 samples were obtained, 5 samples
23
for each of the 4 temperature settings. Before each experiment, the reactor was heated up to the desired temperature. Nitrogen with a flow rate of 8 l/min was used to fluidize the bed and render the reactor inert. Oxygen content in the reactor was controlled by an oxygen sensor coupled to an oxygen analyser. When the bed temperature and the atmosphere in the reactor were as desired, the sample of wood pellets placed in the sample holder was inserted into the reactor. After 5 minutes in the reactor, the sample holder was removed from the reactor and immediately cooled down with nitrogen. The residence time for all the runs was fixed at 5 minutes. After cooling down, the sample was taken out from the sample holder and weighted. Each set point was repeated five times given a total of 20 experiments.
4.3.1.2 Activation The activation process was conducted in the horizontal tube reactor, figure 4.2. Steam was used as the activating agent and its flow rate was 1.9 ml/min. The steam was produced and supplied by a steam generator and a water pump. The same four temperature set points during the carbonization step were maintained in the activation step. Before each run, the reactor was set up to the desired temperature. Nitrogen was used to flush the reactor and render it inert. A 1.5 l/ min flow of nitrogen was introduced inside the pipe coupled to the sample holder to inert also this part. A given quantity of the char produced in the pyrolysis step was then placed in the sample holder. Steam was thereafter introduced into the pipe coupled to the reactor. When the reactor settings were as desired, the sample holder was introduced into the reactor. During the activation process, the nitrogen flow inside the pipe was reduced to 0.8 l/min. After reaching the desired residence time of 15, 25 and 35 minutes, the sample was removed from the reactor and immediately cooled down with nitrogen. After cooling down, the sample was weighed and saved for further analysis.
4.3.2 One step activation In addition to studying the effect of temperature on the quality of activated carbon produced by the two steps activation method, the effect of steam flow rate on the quality of activated carbon was also studied during the production of activated carbon by the one step method. Relatively low and high steam flow rates were considered. The low steam flow rate was the same as the one used during the two steps activation process 1.9 ml/min while the high steam flow rate was 5.7 ml/min. The same four temperature set points 750, 800, 850 and 900°C, as the ones used during the two step activation process, were applied. Two residence times were used 10 and 15 minutes.
Wood pellets of the same composition and size as those used for the two steps activation process were considered. Samples of about five to six pellets weighing between 6.0 to 6.5 g were considered for each experiment. Each sample was placed in the sample holder as the one used for the two steps activation process. The activation process was carried out in the same way as the activation step of the two steps process.
4.4 Characterization The characterization of the samples of activated carbon and char were done as follows:
24
• Calculation of the burn off, based on the yields of the char and the activated carbon. The following equation was used:
𝜽 = 𝑾𝒊−𝑾𝒇
𝑾𝒊× 𝟏𝟎𝟎 (Equation 4.1)
Where, 𝑤𝑖 is the initial mass of the sample (g), 𝑤𝑓 is the mass of the final products, char or activated carbon (g) and 𝜃 is the burn off (wt%) on dry basis.
• Characterization of the porosity and determination of the internal surface area. The pore size distribution of the activated carbon was measured using a Quanta chrome Autosorb model “TriStar 3000 V6.05 A” at the department of forest industry, Chalmers University of Technology. The BET model was used for the determination of the total internal surface area and volume of the solid pores by using the adsorption isotherms of N2 at 77ºK, while the BJH model was used for determination of the pore size distribution of the pores in the range > 2 nm (20Å) from the N2 adsorption isotherms at 77ºK.
• Structural analysis of the solid products by scan electron microscopy (SEM). An electron scan microscope of type FEI Quanta 200F at the Department of Technical Physics, Chalmers University of Technology was used to study the crystal pore structure of the activated carbon and char.
25
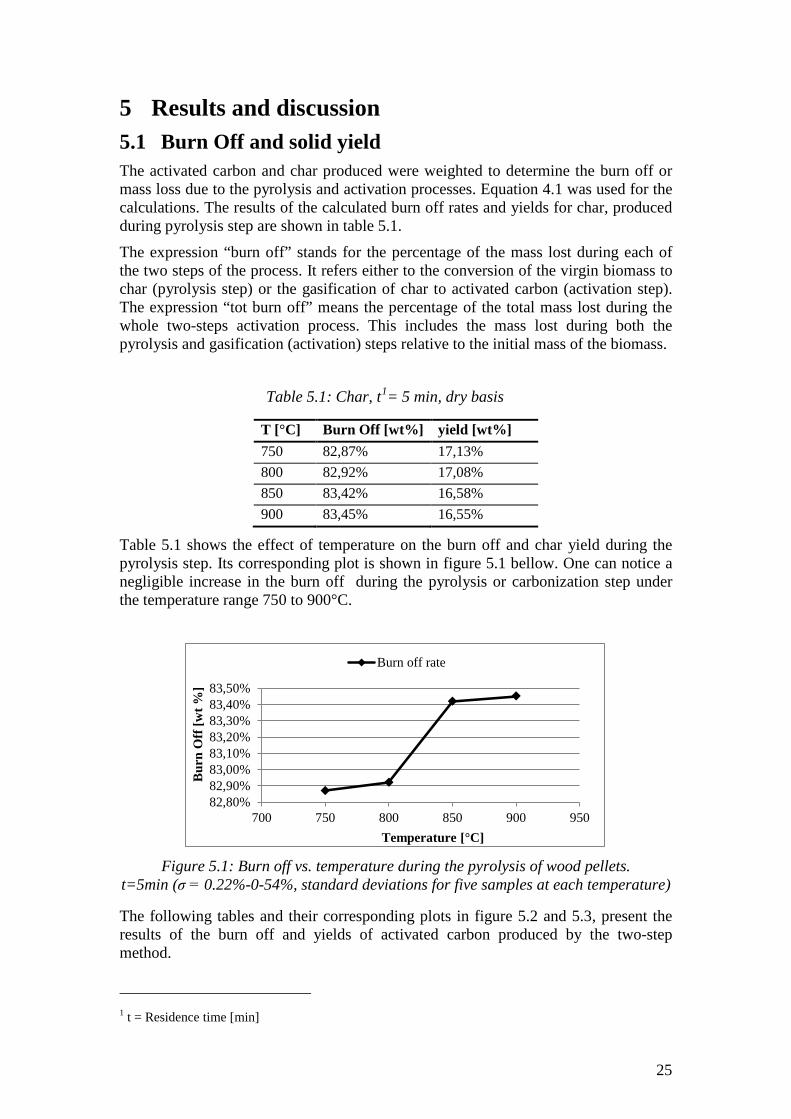
5 Results and discussion 5.1 Burn Off and solid yield The activated carbon and char produced were weighted to determine the burn off or mass loss due to the pyrolysis and activation processes. Equation 4.1 was used for the calculations. The results of the calculated burn off rates and yields for char, produced during pyrolysis step are shown in table 5.1.
The expression “burn off” stands for the percentage of the mass lost during each of the two steps of the process. It refers either to the conversion of the virgin biomass to char (pyrolysis step) or the gasification of char to activated carbon (activation step). The expression “tot burn off” means the percentage of the total mass lost during the whole two-steps activation process. This includes the mass lost during both the pyrolysis and gasification (activation) steps relative to the initial mass of the biomass.
Table 5.1: Char, t1= 5 min, dry basis
T [°C] Burn Off [wt%] yield [wt%] 750 82,87% 17,13% 800 82,92% 17,08% 850 83,42% 16,58% 900 83,45% 16,55%
Table 5.1 shows the effect of temperature on the burn off and char yield during the pyrolysis step. Its corresponding plot is shown in figure 5.1 bellow. One can notice a negligible increase in the burn off during the pyrolysis or carbonization step under the temperature range 750 to 900°C.
Figure 5.1: Burn off vs. temperature during the pyrolysis of wood pellets.
t=5min (σ = 0.22%-0-54%, standard deviations for five samples at each temperature)
The following tables and their corresponding plots in figure 5.2 and 5.3, present the results of the burn off and yields of activated carbon produced by the two-step method.
1 t = Residence time [min]
82,80%82,90%83,00%83,10%83,20%83,30%83,40%83,50%
700 750 800 850 900 950
Bur
n O
ff [w
t %]
Temperature [°C]
Burn off rate
26
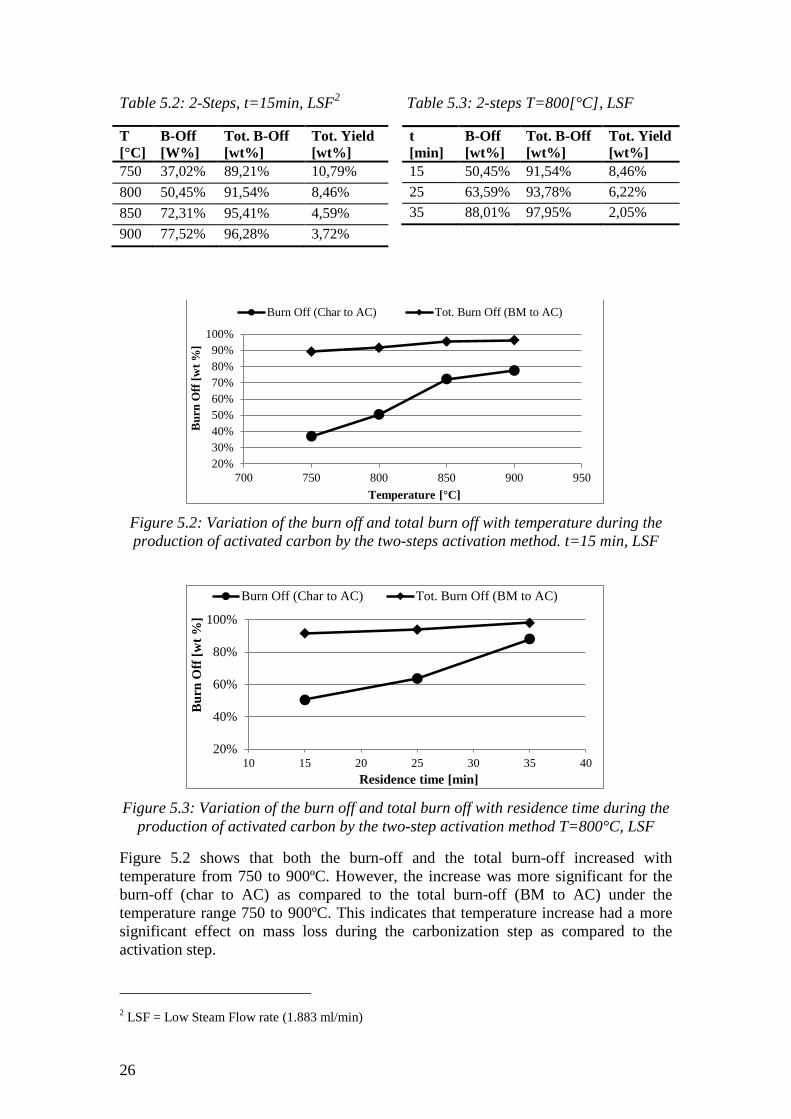
Table 5.2: 2-Steps, t=15min, LSF2 Table 5.3: 2-steps T=800[°C], LSF
T [°C]
B-Off [W%]
Tot. B-Off [wt%]
Tot. Yield [wt%]
750 37,02% 89,21% 10,79% 800 50,45% 91,54% 8,46% 850 72,31% 95,41% 4,59% 900 77,52% 96,28% 3,72%
Figure 5.2: Variation of the burn off and total burn off with temperature during the production of activated carbon by the two-steps activation method. t=15 min, LSF
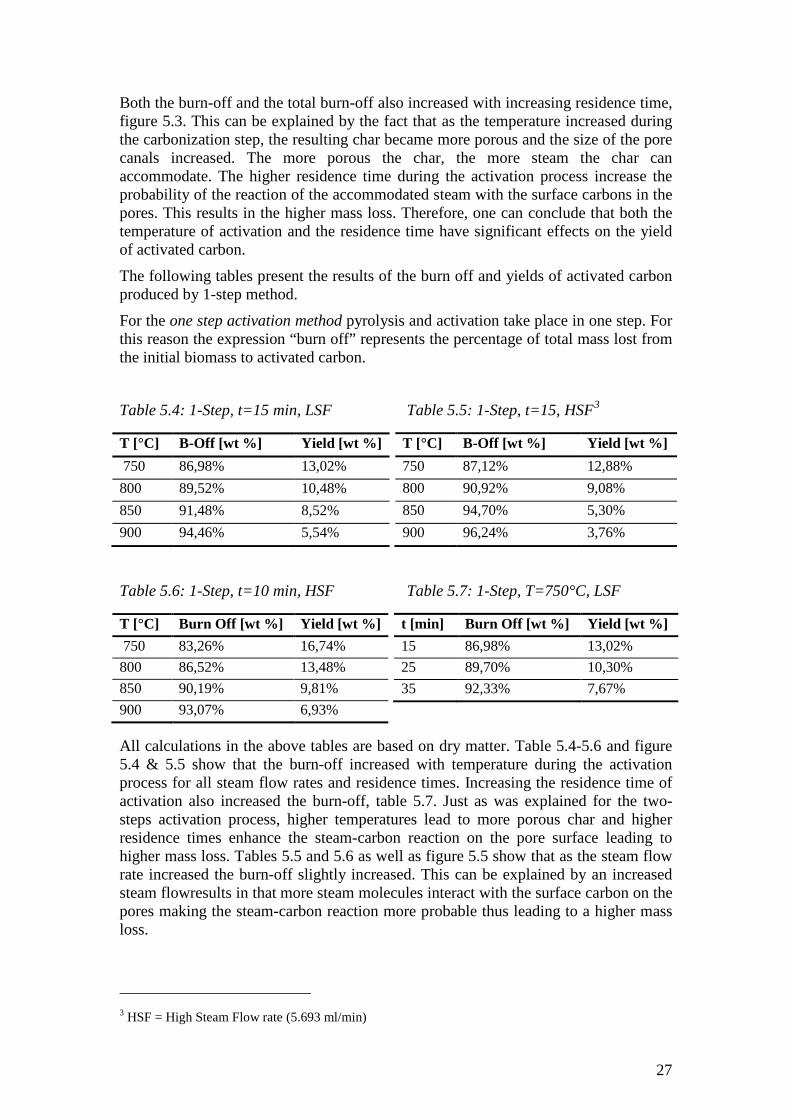
Figure 5.3: Variation of the burn off and total burn off with residence time during the
production of activated carbon by the two-step activation method T=800°C, LSF
Figure 5.2 shows that both the burn-off and the total burn-off increased with temperature from 750 to 900ºC. However, the increase was more significant for the burn-off (char to AC) as compared to the total burn-off (BM to AC) under the temperature range 750 to 900ºC. This indicates that temperature increase had a more significant effect on mass loss during the carbonization step as compared to the activation step.
2 LSF = Low Steam Flow rate (1.883 ml/min)
20%30%40%50%60%70%80%90%
100%
700 750 800 850 900 950
Bur
n O
ff [w
t %]
Temperature [°C]
Burn Off (Char to AC) Tot. Burn Off (BM to AC)
20%
40%
60%
80%
100%
10 15 20 25 30 35 40
Bur
n O
ff [w
t %]
Residence time [min]
Burn Off (Char to AC) Tot. Burn Off (BM to AC)
t [min]
B-Off [wt%]
Tot. B-Off [wt%]
Tot. Yield [wt%]
15 50,45% 91,54% 8,46% 25 63,59% 93,78% 6,22% 35 88,01% 97,95% 2,05%
27
Both the burn-off and the total burn-off also increased with increasing residence time, figure 5.3. This can be explained by the fact that as the temperature increased during the carbonization step, the resulting char became more porous and the size of the pore canals increased. The more porous the char, the more steam the char can accommodate. The higher residence time during the activation process increase the probability of the reaction of the accommodated steam with the surface carbons in the pores. This results in the higher mass loss. Therefore, one can conclude that both the temperature of activation and the residence time have significant effects on the yield of activated carbon.
The following tables present the results of the burn off and yields of activated carbon produced by 1-step method.
For the one step activation method pyrolysis and activation take place in one step. For this reason the expression “burn off” represents the percentage of total mass lost from the initial biomass to activated carbon.
Table 5.4: 1-Step, t=15 min, LSF Table 5.5: 1-Step, t=15, HSF3
T [°C] B-Off [wt %] Yield [wt %] 750 87,12% 12,88% 800 90,92% 9,08% 850 94,70% 5,30% 900 96,24% 3,76%
Table 5.6: 1-Step, t=10 min, HSF Table 5.7: 1-Step, T=750°C, LSF
t [min] Burn Off [wt %] Yield [wt %] 15 86,98% 13,02% 25 89,70% 10,30% 35 92,33% 7,67%
All calculations in the above tables are based on dry matter. Table 5.4-5.6 and figure 5.4 & 5.5 show that the burn-off increased with temperature during the activation process for all steam flow rates and residence times. Increasing the residence time of activation also increased the burn-off, table 5.7. Just as was explained for the two-steps activation process, higher temperatures lead to more porous char and higher residence times enhance the steam-carbon reaction on the pore surface leading to higher mass loss. Tables 5.5 and 5.6 as well as figure 5.5 show that as the steam flow rate increased the burn-off slightly increased. This can be explained by an increased steam flowresults in that more steam molecules interact with the surface carbon on the pores making the steam-carbon reaction more probable thus leading to a higher mass loss.
3 HSF = High Steam Flow rate (5.693 ml/min)
T [°C] B-Off [wt %] Yield [wt %] 750 86,98% 13,02% 800 89,52% 10,48% 850 91,48% 8,52% 900 94,46% 5,54%
T [°C] Burn Off [wt %] Yield [wt %] 750 83,26% 16,74% 800 86,52% 13,48% 850 90,19% 9,81% 900 93,07% 6,93%
28
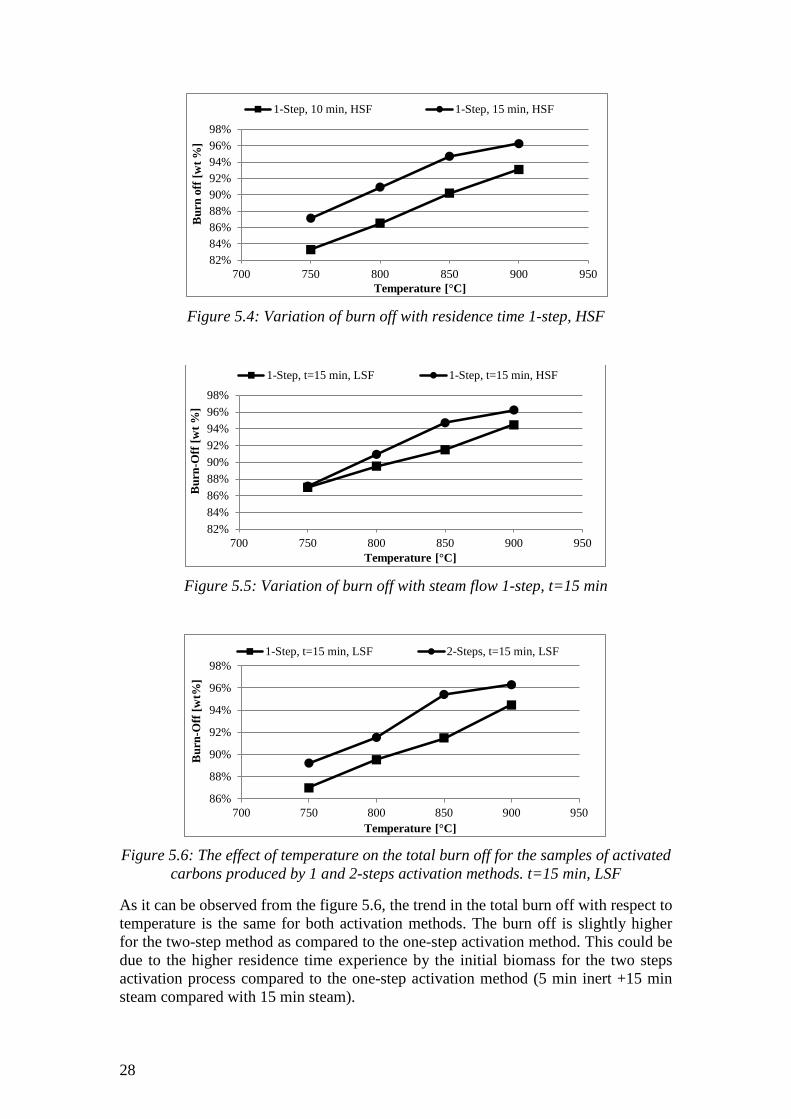
Figure 5.4: Variation of burn off with residence time 1-step, HSF
Figure 5.5: Variation of burn off with steam flow 1-step, t=15 min
Figure 5.6: The effect of temperature on the total burn off for the samples of activated
carbons produced by 1 and 2-steps activation methods. t=15 min, LSF
As it can be observed from the figure 5.6, the trend in the total burn off with respect to temperature is the same for both activation methods. The burn off is slightly higher for the two-step method as compared to the one-step activation method. This could be due to the higher residence time experience by the initial biomass for the two steps activation process compared to the one-step activation method (5 min inert +15 min steam compared with 15 min steam).
82%84%86%88%90%92%94%96%98%
700 750 800 850 900 950
Bur
n of
f [w
t %]
Temperature [°C]
1-Step, 10 min, HSF 1-Step, 15 min, HSF
82%84%86%88%90%92%94%96%98%
700 750 800 850 900 950
Bur
n-O
ff [w
t %]
Temperature [°C]
1-Step, t=15 min, LSF 1-Step, t=15 min, HSF
86%
88%
90%
92%
94%
96%
98%
700 750 800 850 900 950
Bur
n-O
ff [w
t%]
Temperature [°C]
1-Step, t=15 min, LSF 2-Steps, t=15 min, LSF
29
5.2 Determination of the pores surface area and volume The BET method was used for the determination of the total pores surface area and volume. The BJH method was used to determine the surface area and volume of the meso and macropores >2 nm (20Å) from the N2 adsorption and desorption isotherms. This surface area and volume of the meso and macropores, obtained from the BJH method, was subtracted from the total surface area. Thereby, the volume of the pores in the activated carbon obtained from the BET method could be used to estimate the surface area and volume of the micropores (if a more accurat determination of the micropore volume and surface area is needed more advanced methods such as mercury gas adsorption [8] could be used). The micropore surface area and volume are good indications of the adsorption capacity of the activated carbon (section 3.1.6) [5, 10, 11].
Thethe estimated surface area and volume of the pores in the samples of produced activated carbon and their pore size distributions (PSD), using the BET-N2 adsorption and BJH -N2 desorption isotherms, are presented in tables below.
Table 5.8: The effect of steam activation on the development of the internal surface area and volume of the pores, from char to activated carbon, LSF
T [°C]
t [min] BET tot. PSA4 [m2/g]
BJH (DCSA)5 [m2/g]
BET tot. PV6 [cm3/g]
BJH (DCPV)7 [cm3/g]
Mic.-PSA8 [m2g]
Mic.-PV9 [cm3/g]
800 5 37,44 5,47 0,02 0,004 31,973 0,016 800 15 827,56 586,90 0,64 0,534 240,659 0,109 850 5 60,81 4,84 0,03 0,004 55,968 0,028 850 15 1136,36 839,87 1,05 0,932 296,488 0,118
In the table 5.8 the surface area and volume of the pores in the char samples produced at 800 and 850°C, t=5 min, during the carbonization step are compared to those of the pores in their corresponding samples of activated carbon. The steam activation of the char samples resulted in a very significant increase in the total surface area and volume of the pores of the resulting samples of activated carbon, as well as, in the surface area and volume of the meso, macro and micropores. By comparing all the BJH (meso and macropore) and micropores measurements in table 5.8, one can notice that the overwhelming majority of pores in the char samples are micropores, while the majority of pores in the samples of activated carbon are meso and macropores. This means that the activation process results in either a generation of new large pores or in the enlargement of existing micropores in the char samples obtained from the carbonization step.
4 BET tot. SA = BET total pores surface area 5 BJH (DCSA) = BJH desorption cumulative pores surface area (~ pores >20 Å diameter) 6 BET tot. PV = BET total pores volume 7 BJH (DCPV) = BJH desorption cumulative pores volume (~ pores >20 Å diameter) 8 Mic.-PSA = Micropores total surface area (~pores < 20 Å diameter) 9 Mic.-PV = Micropores total volume (~pore < 20 Å diameter)
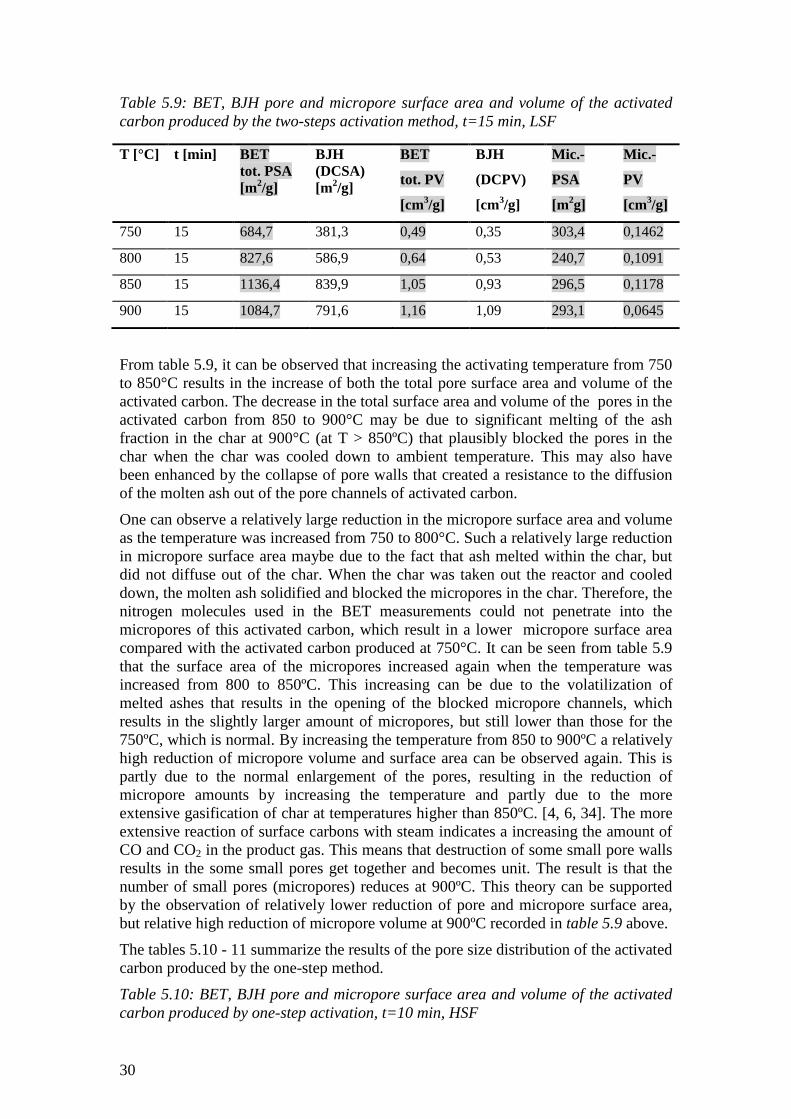
30
Table 5.9: BET, BJH pore and micropore surface area and volume of the activated carbon produced by the two-steps activation method, t=15 min, LSF
T [°C] t [min] BET tot. PSA [m2/g]
BJH (DCSA) [m2/g]
BET
tot. PV
[cm3/g]
BJH
(DCPV)
[cm3/g]
Mic.-
PSA
[m2g]
Mic.-
PV
[cm3/g]
750 15 684,7 381,3 0,49 0,35 303,4 0,1462
800 15 827,6 586,9 0,64 0,53 240,7 0,1091
850 15 1136,4 839,9 1,05 0,93 296,5 0,1178
900 15 1084,7 791,6 1,16 1,09 293,1 0,0645
From table 5.9, it can be observed that increasing the activating temperature from 750 to 850°C results in the increase of both the total pore surface area and volume of the activated carbon. The decrease in the total surface area and volume of the pores in the activated carbon from 850 to 900°C may be due to significant melting of the ash fraction in the char at 900°C (at T > 850ºC) that plausibly blocked the pores in the char when the char was cooled down to ambient temperature. This may also have been enhanced by the collapse of pore walls that created a resistance to the diffusion of the molten ash out of the pore channels of activated carbon.
One can observe a relatively large reduction in the micropore surface area and volume as the temperature was increased from 750 to 800°C. Such a relatively large reduction in micropore surface area maybe due to the fact that ash melted within the char, but did not diffuse out of the char. When the char was taken out the reactor and cooled down, the molten ash solidified and blocked the micropores in the char. Therefore, the nitrogen molecules used in the BET measurements could not penetrate into the micropores of this activated carbon, which result in a lower micropore surface area compared with the activated carbon produced at 750°C. It can be seen from table 5.9 that the surface area of the micropores increased again when the temperature was increased from 800 to 850ºC. This increasing can be due to the volatilization of melted ashes that results in the opening of the blocked micropore channels, which results in the slightly larger amount of micropores, but still lower than those for the 750ºC, which is normal. By increasing the temperature from 850 to 900ºC a relatively high reduction of micropore volume and surface area can be observed again. This is partly due to the normal enlargement of the pores, resulting in the reduction of micropore amounts by increasing the temperature and partly due to the more extensive gasification of char at temperatures higher than 850ºC. [4, 6, 34]. The more extensive reaction of surface carbons with steam indicates a increasing the amount of CO and CO2 in the product gas. This means that destruction of some small pore walls results in the some small pores get together and becomes unit. The result is that the number of small pores (micropores) reduces at 900ºC. This theory can be supported by the observation of relatively lower reduction of pore and micropore surface area, but relative high reduction of micropore volume at 900ºC recorded in table 5.9 above.
The tables 5.10 - 11 summarize the results of the pore size distribution of the activated carbon produced by the one-step method. Table 5.10: BET, BJH pore and micropore surface area and volume of the activated carbon produced by one-step activation, t=10 min, HSF
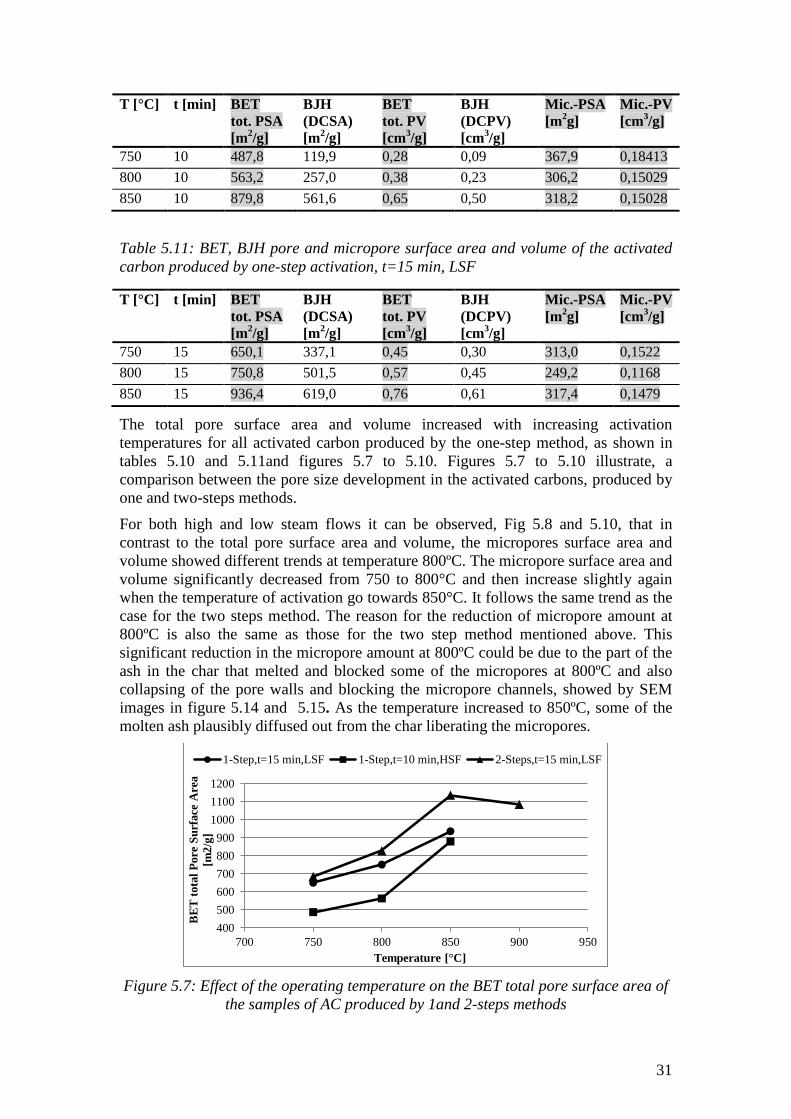
31
T [°C] t [min] BET tot. PSA [m2/g]
BJH (DCSA) [m2/g]
BET tot. PV [cm3/g]
BJH (DCPV) [cm3/g]
Mic.-PSA [m2g]
Mic.-PV [cm3/g]
750 10 487,8 119,9 0,28 0,09 367,9 0,18413 800 10 563,2 257,0 0,38 0,23 306,2 0,15029 850 10 879,8 561,6 0,65 0,50 318,2 0,15028
Table 5.11: BET, BJH pore and micropore surface area and volume of the activated carbon produced by one-step activation, t=15 min, LSF
T [°C] t [min] BET tot. PSA [m2/g]
BJH (DCSA) [m2/g]
BET tot. PV [cm3/g]
BJH (DCPV) [cm3/g]
Mic.-PSA [m2g]
Mic.-PV [cm3/g]
750 15 650,1 337,1 0,45 0,30 313,0 0,1522 800 15 750,8 501,5 0,57 0,45 249,2 0,1168 850 15 936,4 619,0 0,76 0,61 317,4 0,1479
The total pore surface area and volume increased with increasing activation temperatures for all activated carbon produced by the one-step method, as shown in tables 5.10 and 5.11and figures 5.7 to 5.10. Figures 5.7 to 5.10 illustrate, a comparison between the pore size development in the activated carbons, produced by one and two-steps methods.
For both high and low steam flows it can be observed, Fig 5.8 and 5.10, that in contrast to the total pore surface area and volume, the micropores surface area and volume showed different trends at temperature 800ºC. The micropore surface area and volume significantly decreased from 750 to 800°C and then increase slightly again when the temperature of activation go towards 850°C. It follows the same trend as the case for the two steps method. The reason for the reduction of micropore amount at 800ºC is also the same as those for the two step method mentioned above. This significant reduction in the micropore amount at 800ºC could be due to the part of the ash in the char that melted and blocked some of the micropores at 800ºC and also collapsing of the pore walls and blocking the micropore channels, showed by SEM images in figure 5.14 and 5.15. As the temperature increased to 850ºC, some of the molten ash plausibly diffused out from the char liberating the micropores.
Figure 5.7: Effect of the operating temperature on the BET total pore surface area of
the samples of AC produced by 1and 2-steps methods
400500600700800900
100011001200
700 750 800 850 900 950
BE
T to
tal P
ore
Surf
ace
Are
a [m
2/g]
Temperature [°C]
1-Step,t=15 min,LSF 1-Step,t=10 min,HSF 2-Steps,t=15 min,LSF
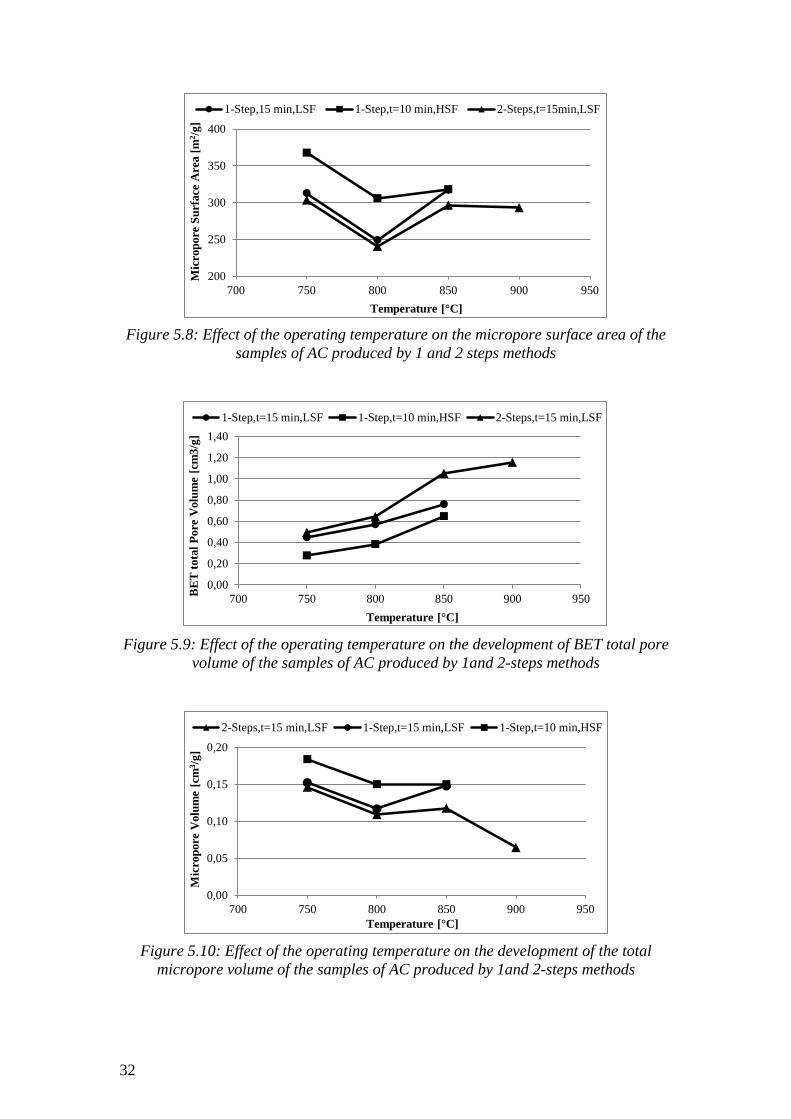
32
Figure 5.8: Effect of the operating temperature on the micropore surface area of the
samples of AC produced by 1 and 2 steps methods
Figure 5.9: Effect of the operating temperature on the development of BET total pore
volume of the samples of AC produced by 1and 2-steps methods
Figure 5.10: Effect of the operating temperature on the development of the total
micropore volume of the samples of AC produced by 1and 2-steps methods
200
250
300
350
400
700 750 800 850 900 950
Mic
ropo
re S
urfa
ce A
rea
[m2 /g
]
Temperature [°C]
1-Step,15 min,LSF 1-Step,t=10 min,HSF 2-Steps,t=15min,LSF
0,00
0,20
0,40
0,60
0,80
1,00
1,20
1,40
700 750 800 850 900 950BE
T to
tal P
ore
Vol
ume
[cm
3/g]
Temperature [°C]
1-Step,t=15 min,LSF 1-Step,t=10 min,HSF 2-Steps,t=15 min,LSF
0,00
0,05
0,10
0,15
0,20
700 750 800 850 900 950
Mic
ropo
re V
olum
e [c
m3 /g
]
Temperature [°C]
2-Steps,t=15 min,LSF 1-Step,t=15 min,LSF 1-Step,t=10 min,HSF
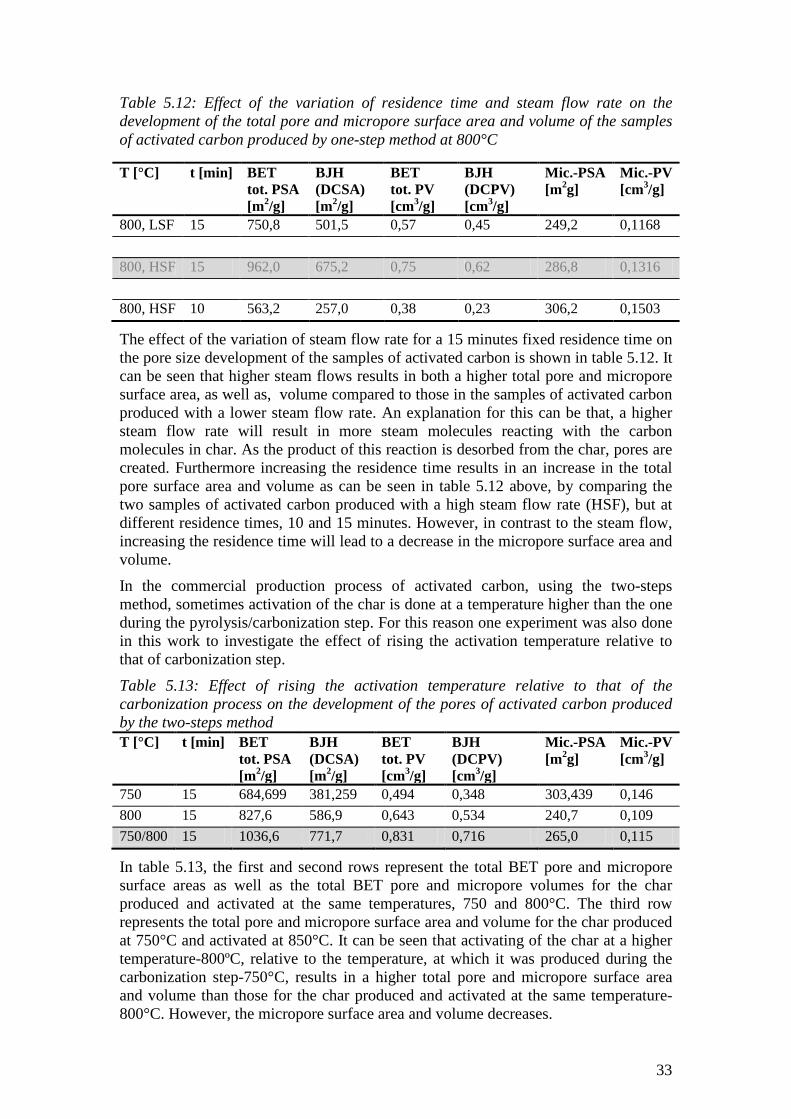
33
Table 5.12: Effect of the variation of residence time and steam flow rate on the development of the total pore and micropore surface area and volume of the samples of activated carbon produced by one-step method at 800°C
T [°C] t [min] BET tot. PSA [m2/g]
BJH (DCSA) [m2/g]
BET tot. PV [cm3/g]
BJH (DCPV) [cm3/g]
Mic.-PSA [m2g]
Mic.-PV [cm3/g]
800, LSF 15 750,8 501,5 0,57 0,45 249,2 0,1168 800, HSF 15 962,0 675,2 0,75 0,62 286,8 0,1316 800, HSF 10 563,2 257,0 0,38 0,23 306,2 0,1503
The effect of the variation of steam flow rate for a 15 minutes fixed residence time on the pore size development of the samples of activated carbon is shown in table 5.12. It can be seen that higher steam flows results in both a higher total pore and micropore surface area, as well as, volume compared to those in the samples of activated carbon produced with a lower steam flow rate. An explanation for this can be that, a higher steam flow rate will result in more steam molecules reacting with the carbon molecules in char. As the product of this reaction is desorbed from the char, pores are created. Furthermore increasing the residence time results in an increase in the total pore surface area and volume as can be seen in table 5.12 above, by comparing the two samples of activated carbon produced with a high steam flow rate (HSF), but at different residence times, 10 and 15 minutes. However, in contrast to the steam flow, increasing the residence time will lead to a decrease in the micropore surface area and volume.
In the commercial production process of activated carbon, using the two-steps method, sometimes activation of the char is done at a temperature higher than the one during the pyrolysis/carbonization step. For this reason one experiment was also done in this work to investigate the effect of rising the activation temperature relative to that of carbonization step.
Table 5.13: Effect of rising the activation temperature relative to that of the carbonization process on the development of the pores of activated carbon produced by the two-steps method T [°C] t [min] BET
tot. PSA [m2/g]
BJH (DCSA) [m2/g]
BET tot. PV [cm3/g]
BJH (DCPV) [cm3/g]
Mic.-PSA [m2g]
Mic.-PV [cm3/g]
750 15 684,699 381,259 0,494 0,348 303,439 0,146 800 15 827,6 586,9 0,643 0,534 240,7 0,109 750/800 15 1036,6 771,7 0,831 0,716 265,0 0,115
In table 5.13, the first and second rows represent the total BET pore and micropore surface areas as well as the total BET pore and micropore volumes for the char produced and activated at the same temperatures, 750 and 800°C. The third row represents the total pore and micropore surface area and volume for the char produced at 750°C and activated at 850°C. It can be seen that activating of the char at a higher temperature-800ºC, relative to the temperature, at which it was produced during the carbonization step-750°C, results in a higher total pore and micropore surface area and volume than those for the char produced and activated at the same temperature-800°C. However, the micropore surface area and volume decreases.
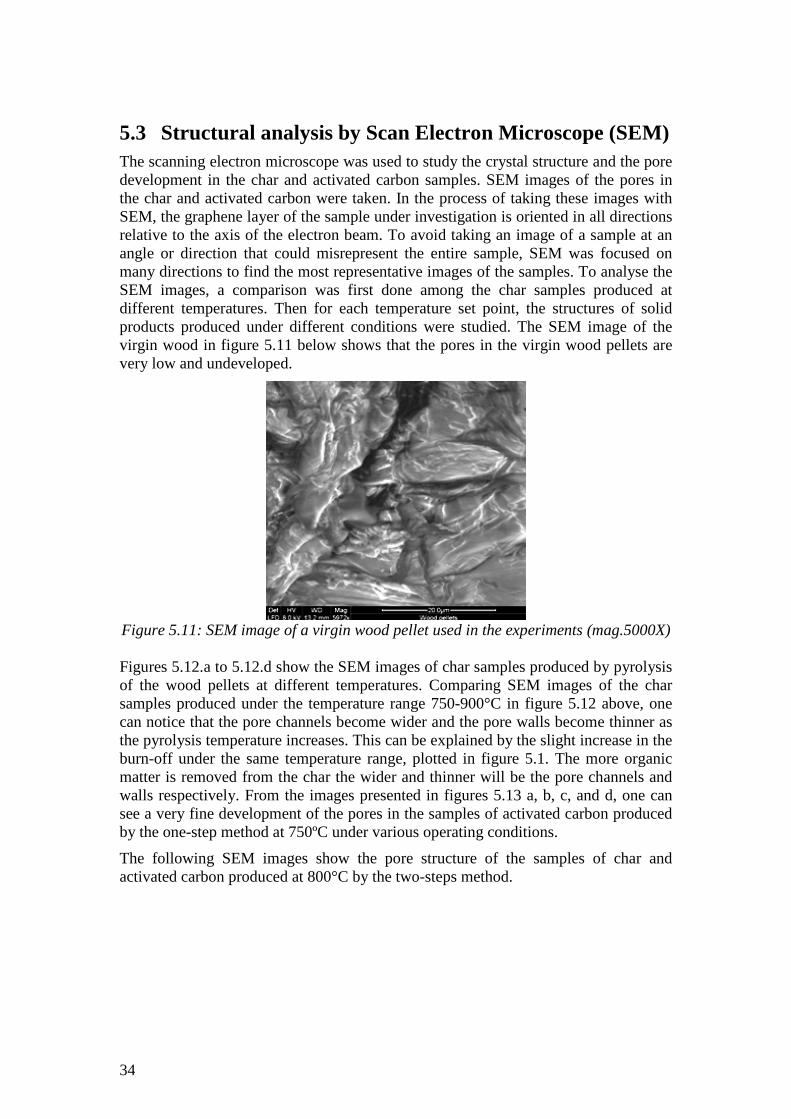
34
5.3 Structural analysis by Scan Electron Microscope (SEM) The scanning electron microscope was used to study the crystal structure and the pore development in the char and activated carbon samples. SEM images of the pores in the char and activated carbon were taken. In the process of taking these images with SEM, the graphene layer of the sample under investigation is oriented in all directions relative to the axis of the electron beam. To avoid taking an image of a sample at an angle or direction that could misrepresent the entire sample, SEM was focused on many directions to find the most representative images of the samples. To analyse the SEM images, a comparison was first done among the char samples produced at different temperatures. Then for each temperature set point, the structures of solid products produced under different conditions were studied. The SEM image of the virgin wood in figure 5.11 below shows that the pores in the virgin wood pellets are very low and undeveloped.
Figure 5.11: SEM image of a virgin wood pellet used in the experiments (mag.5000X) Figures 5.12.a to 5.12.d show the SEM images of char samples produced by pyrolysis of the wood pellets at different temperatures. Comparing SEM images of the char samples produced under the temperature range 750-900°C in figure 5.12 above, one can notice that the pore channels become wider and the pore walls become thinner as the pyrolysis temperature increases. This can be explained by the slight increase in the burn-off under the same temperature range, plotted in figure 5.1. The more organic matter is removed from the char the wider and thinner will be the pore channels and walls respectively. From the images presented in figures 5.13 a, b, c, and d, one can see a very fine development of the pores in the samples of activated carbon produced by the one-step method at 750ºC under various operating conditions.
The following SEM images show the pore structure of the samples of char and activated carbon produced at 800°C by the two-steps method.
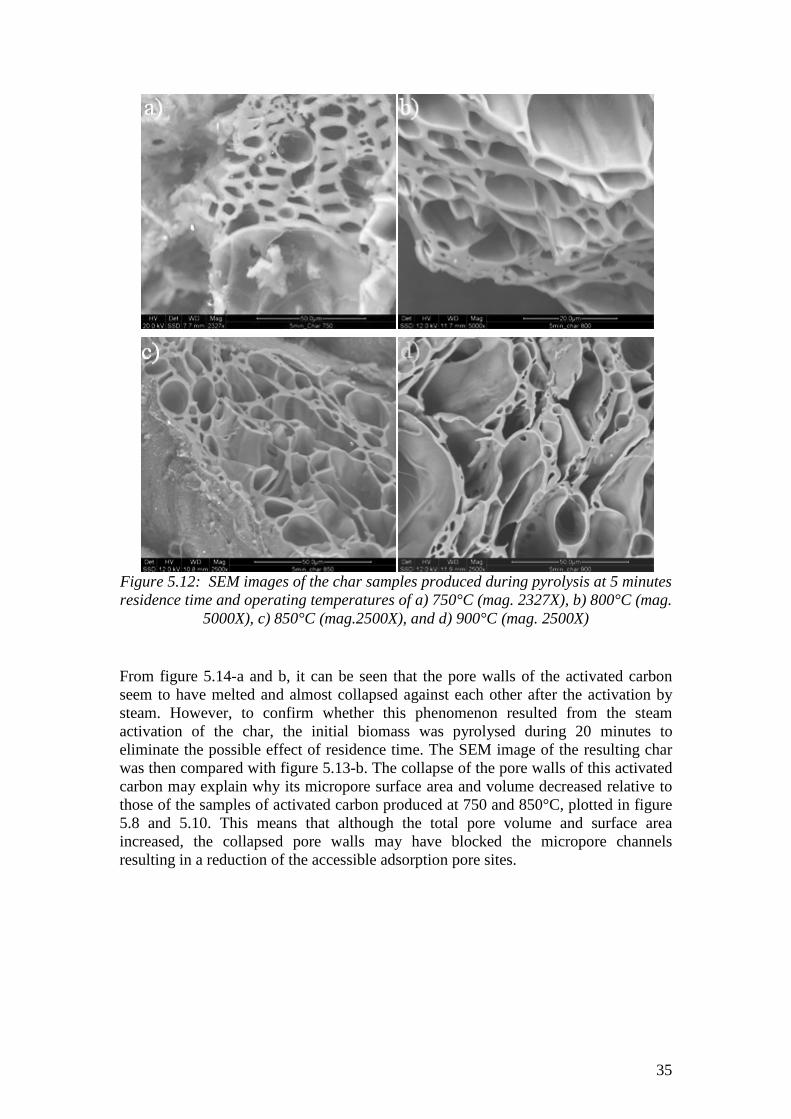
35
Figure 5.12: SEM images of the char samples produced during pyrolysis at 5 minutes residence time and operating temperatures of a) 750°C (mag. 2327X), b) 800°C (mag.
5000X), c) 850°C (mag.2500X), and d) 900°C (mag. 2500X)
From figure 5.14-a and b, it can be seen that the pore walls of the activated carbon seem to have melted and almost collapsed against each other after the activation by steam. However, to confirm whether this phenomenon resulted from the steam activation of the char, the initial biomass was pyrolysed during 20 minutes to eliminate the possible effect of residence time. The SEM image of the resulting char was then compared with figure 5.13-b. The collapse of the pore walls of this activated carbon may explain why its micropore surface area and volume decreased relative to those of the samples of activated carbon produced at 750 and 850°C, plotted in figure 5.8 and 5.10. This means that although the total pore volume and surface area increased, the collapsed pore walls may have blocked the micropore channels resulting in a reduction of the accessible adsorption pore sites.

36
Figure 5.13: SEM images of the activated carbon, produced by one step method at
750°C, a) t=10min, HSF, (mag. 476X), b) t=10min, HSF (mag. 1600X), c) t=15min, LSF (mag. 500X), d) t=15min, LSF mag. 2500X)
Figure 5.14: SEM images of char and activated carbon produced at T=800°C a) char, t=5min (mag.5000X), b) AC, 2-steps method, t=15 min, LSF (mag. 5000X)
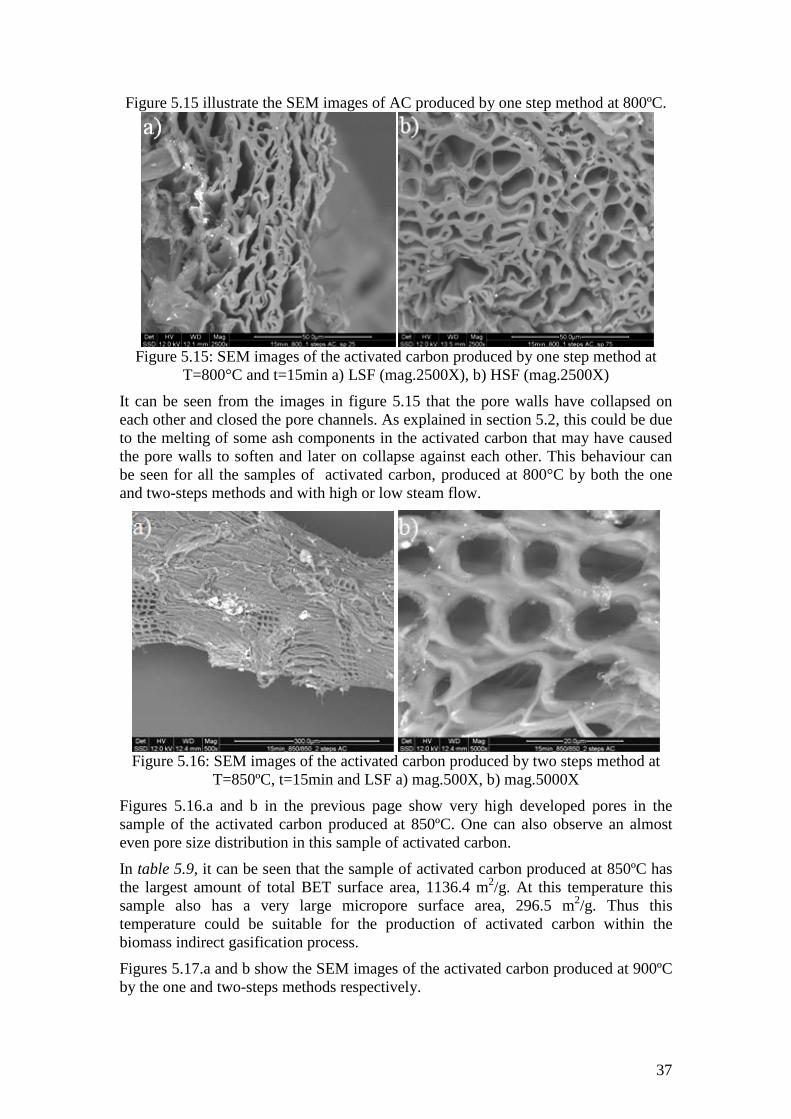
37
Figure 5.15 illustrate the SEM images of AC produced by one step method at 800ºC.
Figure 5.15: SEM images of the activated carbon produced by one step method at
T=800°C and t=15min a) LSF (mag.2500X), b) HSF (mag.2500X)
It can be seen from the images in figure 5.15 that the pore walls have collapsed on each other and closed the pore channels. As explained in section 5.2, this could be due to the melting of some ash components in the activated carbon that may have caused the pore walls to soften and later on collapse against each other. This behaviour can be seen for all the samples of activated carbon, produced at 800°C by both the one and two-steps methods and with high or low steam flow.
Figure 5.16: SEM images of the activated carbon produced by two steps method at
T=850ºC, t=15min and LSF a) mag.500X, b) mag.5000X
Figures 5.16.a and b in the previous page show very high developed pores in the sample of the activated carbon produced at 850ºC. One can also observe an almost even pore size distribution in this sample of activated carbon.
In table 5.9, it can be seen that the sample of activated carbon produced at 850ºC has the largest amount of total BET surface area, 1136.4 m2/g. At this temperature this sample also has a very large micropore surface area, 296.5 m2/g. Thus this temperature could be suitable for the production of activated carbon within the biomass indirect gasification process.
Figures 5.17.a and b show the SEM images of the activated carbon produced at 900ºC by the one and two-steps methods respectively.
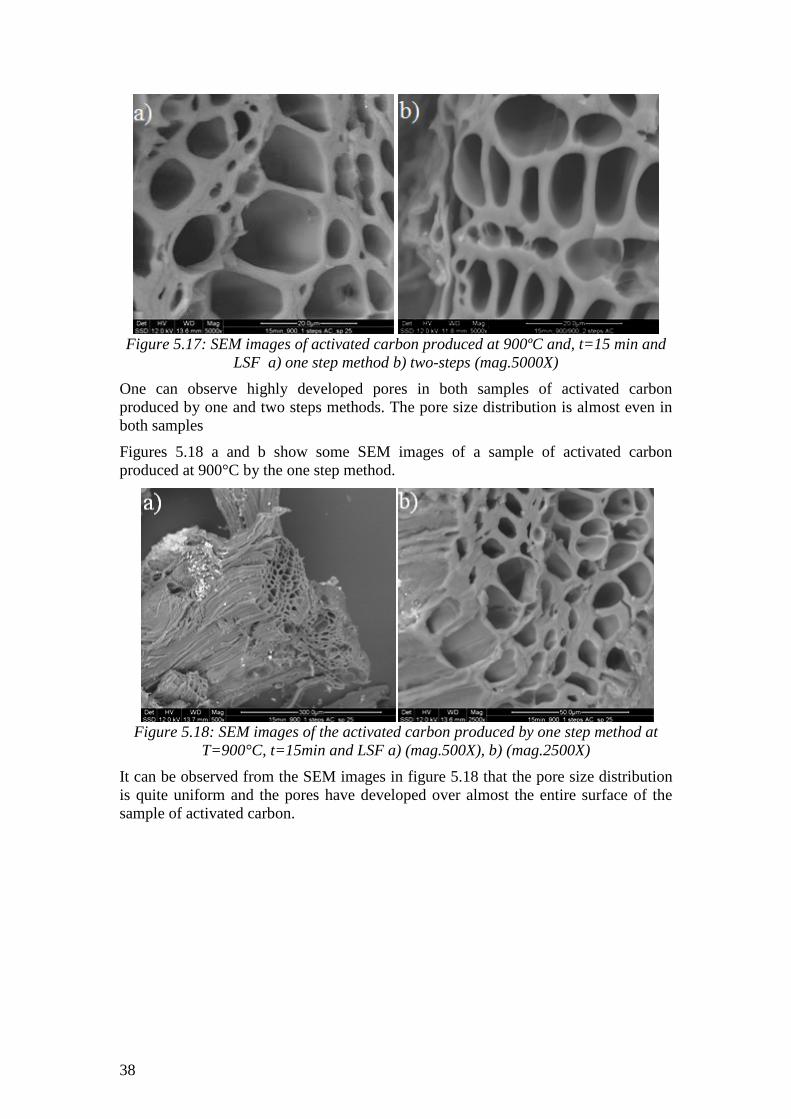
38
Figure 5.17: SEM images of activated carbon produced at 900ºC and, t=15 min and
LSF a) one step method b) two-steps (mag.5000X)
One can observe highly developed pores in both samples of activated carbon produced by one and two steps methods. The pore size distribution is almost even in both samples Figures 5.18 a and b show some SEM images of a sample of activated carbon produced at 900°C by the one step method.
Figure 5.18: SEM images of the activated carbon produced by one step method at
T=900°C, t=15min and LSF a) (mag.500X), b) (mag.2500X)
It can be observed from the SEM images in figure 5.18 that the pore size distribution is quite uniform and the pores have developed over almost the entire surface of the sample of activated carbon.
39
Conclusion The results from this investigation have revealed the following:
• High temperatures, residence times and steam flows lead to high BET total pore surface area and volume of activated carbon. However, they also lead to a low yield of activated carbon and often low amount of micropore.
• The samples of activated carbon with the highest BET total pore surface area, 1136.4 m2/g and highest volume, 1.16 cm3/g were produced in the temperature range 850 to 900°C, for the one and two steps activation methods.
• There was a marginal increase in the BET total pore surface area and volume for the samples of activated produced by the two-step activation method relative to the one-steps activation method in the temperature range 750 to 850°C.
• The micropore surface area and volume remained almost the same for both the one and two-steps methods as the activation temperature increased from 750 to 900°C. However, there was a slight decrease from 750 to 800°C. The SEM images revealed that the pore walls of all samples of activated carbon produced at 800°C melted and collapsed against each other and thereby closing the pore channels.
• The activated carbon was in this work produced under operating conditions similar to those of the indirect gasification process. This activated carbon showed good adsorption characteristics, which impose that it is possible to produce activated carbon within the indirect gasification process.
5.4 Further studies Besides what has been done in this work, it is necessary to do the following to affirm both the technical and economic feasibility of producing activated carbon within the indirect gasification process:
• The micropore volume of the activated carbon should be determined by using a standard method such as the mercury vapour adsorption method. A more precise measurement of the micropore volume among other measurements of surface area and volume of the pores would be a better indication for the adsorption capacity of the activated carbon.
• Further experiments should be carried out in, which give a higher resolution of temperature and of residence time to be able to find the optimal operating conditions.
• The adsorption properties of the char or activated carbon from an operating gasification plant such as the one at Chalmers should be analysed and compared with the results obtained in this work.
• The mechanical strength of the activated carbon should be examined. • An economic analysis should be done to see whether it is beneficial to
integrate the preparation of the activated carbon into the biomass gasification process.
40
References
1. Hasler, P. and T. Nussbaumer, Sampling and analysis of particles and tars from biomass gasifiers. Biomass and Bioenergy, 2000. 18(1): p. 61-66.
2. Nair, S.A., et al., Tar Removal from Biomass Derived Fuel Gas by Pulsed Corona Discharges: Chemical Kinetic Study II. Industrial & Engineering Chemistry Research, 2005. 44(6): p. 1734-1741.
3. Otowa, T., R. Tanibata, and M. Itoh, Production and adsorption characteristics of MAXSORB: High-surface-area active carbon. Gas Separation & Purification, 1993. 7(4): p. 241-245.
4. Harry Marsh, F.R.-R., Activated carbon. Vol. 1. 2006, Amesterdam Boston, London, new york, .... Elsevier. 536.
5. Marsh, H. and F. Rodríguez-Reinoso, Characterization of Activated Carbon, in Activated Carbon2006, Elsevier Science Ltd: Oxford. p. 143-242.
6. Roop Chand Bansal, J.-B.D., Fritz Stoeckli, Active Carbon1988, New York: Marcel Dekker, INC.
7. Auer, E., et al., Carbons as supports for industrial precious metal catalysts. Applied Catalysis A: General, 1998. 173(2): p. 259-271.
8. Marsh, H. and F.R. Reinoso, Activated Carbon. Materials & Mechanical2006: Elsevier Science Ltd. 1-554.
9. Ustinov, E., N. Polyakov, and G. Petukhova, Statistical interpretation of the Dubinin-Radushkevich equation. Russian Chemical Bulletin, 1999. 48(2): p. 261-265.
10. Marsh, H. and F. Rodríguez-Reinoso, Applicability of Activated Carbon, in Activated Carbon2006, Elsevier Science Ltd: Oxford. p. 383-453.
11. Centeno, T.A., G. Marbán, and A.B. Fuertes, Importance of micropore size distribution on adsorption at low adsorbate concentrations. Carbon, 2003. 41(4): p. 843-846.
12. Xu, C., et al., Recent advances in catalysts for hot-gas removal of tar and NH3 from biomass gasification. Fuel, 2010. 89(8): p. 1784-1795.
13. P. Rigby, S., R. S. Fletcher, and S. N. Riley, Characterisation of porous solids using integrated nitrogen sorption and mercury porosimetry. Chemical Engineering Science, 2004. 59(1): p. 41-51.
14. El-Hendawy, A.-N.A., S.E. Samra, and B.S. Girgis, Adsorption characteristics of activated carbons obtained from corncobs. Colloids and Surfaces A: Physicochemical and Engineering Aspects, 2001. 180(3): p. 209-221.
15. Girgis, B.S., S.S. Yunis, and A.M. Soliman, Characteristics of activated carbon from peanut hulls in relation to conditions of preparation. Materials Letters, 2002. 57(1): p. 164-172.
16. Marsh, H. and F. Rodríguez-Reinoso, Activation Processes (Thermal or Physical), in Activated Carbon2006, Elsevier Science Ltd: Oxford. p. 243-321.
17. Fan, M., et al., Steam activation of chars produced from oat hulls and corn stover. Bioresource Technology, 2004. 93(1): p. 103-107.
41
18. Minkova, V., et al., Effect of water vapour and biomass nature on the yield and quality of the pyrolysis products from biomass. Fuel Processing Technology, 2001. 70(1): p. 53-61.
19. Savova, D., et al., Biomass conversion to carbon adsorbents and gas. Biomass and Bioenergy, 2001. 21(2): p. 133-142.
20. Marsh, H. and F. Rodríguez-Reinoso, Activation Processes (Chemical), in Activated Carbon2006, Elsevier Science Ltd: Oxford. p. 322-365.
21. Paraskeva, P., D. Kalderis, and E. Diamadopoulos, Production of activated carbon from agricultural by-products. Journal of Chemical Technology & Biotechnology, 2008. 83(5): p. 581-592.
22. Marsh, H. and F. Rodríguez-Reinoso, Production and Reference Material, in Activated Carbon2006, Elsevier Science Ltd: Oxford. p. 454-508.
23. Lu, G.Q. and X.S. Zhao, Nanoporous Materials - Science and Engineering, World Scientific. p. 317-345.
24. Valmari, T., et al., Field study on ash behavior during circulating fluidized-bed combustion of biomass. 2. Ash deposition and alkali vapor condensation. Energy & Fuels, 1999. 13: p. 390-395.
25. Prabir, B., Chapter 2 - Biomass Characteristics, in Biomass Gasification and Pyrolysis2010, Academic Press: Boston. p. 27-63.
26. Cui, H., et al., Contaminant Estimates and Removal in Product Gas from Biomass Steam Gasification. Energy & Fuels, 2010. 24(2): p. 1222-1233.
27. Basu, P., Biomass Gasification and Pyrolysis JUN-2010, ELSVIER.
28. Ciferno, J.P. and J.J. Marano, Benchmarking Biomass Gasification Technologies for
Fuels, Chemicals and Hydrogen Production, 2002, Prepared for
U.S. Department of Energy
National Energy Technology Laboratory. p. 65.
29. Prabir, B., Chapter 3 - Pyrolysis and Torrefaction, in Biomass Gasification and Pyrolysis2010, Academic Press: Boston. p. 65-96.
30. Prabir, B., Chapter 5 - Gasification Theory and Modeling of Gasifiers, in Biomass Gasification and Pyrolysis2010, Academic Press: Boston. p. 117-165.
31. Prabir, B., Chapter 6 - Design of Biomass Gasifiers, in Biomass Gasification and Pyrolysis2010, Academic Press: Boston. p. 167-228.
32. A project funded by DECC, p.m.b.N.a.c.b.E.T., Review of Technologies for Gasification of Biomass and Wastes
E4tech.
33. Ioannidou, O. and A. Zabaniotou, Agricultural residues as precursors for activated carbon production--A review. Renewable and Sustainable Energy Reviews, 2007. 11(9): p. 1966-2005.
34. Anton Larsson, Martin Seemann, Henrik Thunman, Assessment of the mass and energy flowsin the chalmers gasifier, 2011: Gothenburg.

42