Production Growth Key To - Poten & · PDF fileproduction economics for lighter crude oil and...
32
INSIDE SECTIONS PAGE Monthly Review 4 Direction of Trade 6 Shipping 9 Middle East 12 Asia Pac 13 Med-Africa 14 NW Europe 15 Americas 17 January 2016 Average Monthly Snapshot Source: ICE,Reuters, Poten & Partners PAGE 4 Following OPEC’s early December announcement to maintain production targets, global oil prices have contin- ued to fall, exacerbating production growth concerns. On the other hand, LNG projects startups look poised to increase LPG supply though LNG demand is growing more slowly than expected. Low Oil And LNG Prices To Affect LPG Production, Especially In The US PAGE 12 e Iranian energy market has come under the spotlight since the end of November when 70 oil and gas projects were offered to international companies. e anticipated liſting of international economic sanctions by Q1-2016 has resulted in a flurry of business develop- ment activity in the country with oil and gas at the forefront of talks. Iran Energy Investment Plans To Define Future LPG Supply/ Demand Marker Units Dec-15 M/M Nov-15 Brent $/bbl 38.9 -15.3% 45.9 US/Asia C3 arb $/ton -12 -66 54 US/Eur C3 arb $/ton -13 -29 16 US/Asia C4 arb $/ton -51 -61 10 US/Eur C4 arb $/ton -51 -9 -42 Poten VLGC rate $/ton 67 +3.1% 65 LPG in World Markets PAGE 10 For much of 2015, there was a spotlight on the mid-size or MGC segment as spot equivalent charter rates saw month on month gains through the year. Trade on these vessels was not only bolstered by demand for larger LPG carriers but also by the proliferation of trans-Atlantic and trans-Pacific trade routes that have emerged as a result of increasing exports from the US. MGC Segment Braced For A Challenging Year As Vessel Availability Grows Production Growth Key To Determining US Propane Exports READ MORE F or most of 2015, market participants waited for US propane production to start declining due to the pull back in drilling rig activity. at decrease has yet to come, but supply of propane was flat for most of 2015. e change from a rapidly growing supply to stagnant supply will affect the ability to export. For the following analysis, three scenarios will be explored to determine how the US market may shape up in the next two years. 0.0 0.5 1.0 1.5 2.0 2.5 1/1/2013 1/1/2014 1/1/2015 1/1/2016 1/1/2017 Exports, mm tons Base Low High Propane Export Scenarios
Transcript of Production Growth Key To - Poten & · PDF fileproduction economics for lighter crude oil and...

INSIDE SECTIONS PAGE
Monthly Review 4
Direction of Trade 6
Shipping 9
Middle East 12
Asia Pac 13
Med-Africa 14
NW Europe 15
Americas 17
January 2016
Average Monthly Snapshot
Source: ICE,Reuters, Poten & Partners
PAGE 4
Following OPEC’s early December announcement to maintain production targets, global oil prices have contin-ued to fall, exacerbating production growth concerns. On the other hand, LNG projects startups look poised to increase LPG supply though LNG demand is growing more slowly than expected.
Low Oil And LNG Prices To Affect LPG Production, Especially In The US
PAGE 12
The Iranian energy market has come under the spotlight since the end of November when 70 oil and gas projects were offered to international companies. The anticipated lifting of international economic sanctions by Q1-2016 has resulted in a flurry of business develop-ment activity in the country with oil and gas at the forefront of talks.
Iran Energy Investment Plans To Define Future LPG Supply/Demand
Marker Units Dec-15 M/M Nov-15
Brent $/bbl 38.9 -15.3% 45.9
US/Asia C3 arb $/ton -12 -66 54
US/Eur C3 arb $/ton -13 -29 16
US/Asia C4 arb $/ton -51 -61 10
US/Eur C4 arb $/ton -51 -9 -42
Poten VLGC rate $/ton 67 +3.1% 65
LPG in World Markets
PAGE 10
For much of 2015, there was a spotlight on the mid-size or MGC segment as spot equivalent charter rates saw month on month gains through the year. Trade on these vessels was not only bolstered by demand for larger LPG carriers but also by the proliferation of trans-Atlantic and trans-Pacific trade routes that have emerged as a result of increasing exports from the US.
MGC Segment Braced For A Challenging Year As Vessel Availability Grows
Production Growth Key To Determining US Propane Exports
READ MORE
For most of 2015, market participants waited for US propane production to start declining due to the pull back in drilling rig activity. That decrease has yet to come,
but supply of propane was flat for most of 2015. The change from a rapidly growing supply to stagnant supply will affect the ability to export. For the following analysis, three scenarios will be explored to determine how the US market may shape up in the next two years.
0.0
0.5
1.0
1.5
2.0
2.5
1/1/2013 1/1/2014 1/1/2015 1/1/2016 1/1/2017
Exp
ort
s, m
m t
ons
Base Low High
Propane Export Scenarios

©2016 Poten & Partners2
Table of Contents
EDITORIAL TEAM
HOUSTONKristen Holmquist
EditorTelephone: +1 713-263-3412
Email: [email protected]
Michael PanasTelephone: +1 713-263-3396Email: [email protected]
LONDON
Lauren CervinoTelephone: +44 20 3747 4832
Email: [email protected]
Emma LambTelephone: +44 20 3747 4883
Email: [email protected]
Tom NashTelephone: +44 20 3747 4829
Email: [email protected]
SINGAPORE
Kit Ling WongTelephone: +66 6221 1413Email: [email protected]
SALESStephen Park
Telephone: +44 (20) 3747-4800 Email: [email protected]
SUPPORTTelephone: +1 (212) 230-2000
Email: [email protected]
MONTHLY REVIEW . . . . . . . . . . . . . . . . . . . . . . . . . . . . . . . . . . . . . . . 4Low Oil And LNG Prices To Affect LPG Production, Especially In The US 4
OPEC’s decision to keep existing production targets and LNG expansions to put further pressure on global LPG production.
DIRECTION OF TRADE . . . . . . . . . . . . . . . . . . . . . . . . . . . . . . . . . . . 6
SHIPPING . . . . . . . . . . . . . . . . . . . . . . . . . . . . . . . . . . . . . . . . . . . . . . . 9Shipping Developments . . . . . . . . . . . . . . . . . . . . . . . . . . . . . . . . . . . . . . . . . . . . . 9
MGC Segment Braced For Challenging Year As Vessel Availability Grows 10
Upcoming open vessel availability and a hectic newbuild delivery schedule to herald tougher times for the MGC segment in 2016
MIDDLE EAST . . . . . . . . . . . . . . . . . . . . . . . . . . . . . . . . . . . . . . . . . . 12Iran Energy Investment Plans To Define Future LPG Supply/Demand . 12Uncertainty surrounding LPG production in Iran in the future remains after the lifting of sanctions, but the present still hinges on South Pars developments
ASIA PACIFIC . . . . . . . . . . . . . . . . . . . . . . . . . . . . . . . . . . . . . . . . . . . 13China’s LPG Imports To Surpass Japan . . . . . . . . . . . . . . . . . . . . . . . . . . . . . . . 13In 2015, China’s imports in 2015 will surpass Japan’s as the largest in the world due, in part, to growth in Chinese PDH and large bulk segments.
MED-AFRICA . . . . . . . . . . . . . . . . . . . . . . . . . . . . . . . . . . . . . . . . . . . 14Black Sea Exports Continue to Fall As More LPG Is Pushed To North West Russia For Export . . . . . . . . . . . . . . . . . . . . . . . . . . . . . . . . . . . . . . . . . . . . . . . . . . . 14Exports from the Port of Kerch on the Black Sea have seen a significant reduction in 2015 year to date com-pared to 2014, but what effect has this had on one of the largest importers in the region: Turkey.

©2016 Poten & Partners3
EDITORIAL TEAM
HOUSTONKristen Holmquist
EditorTelephone: +1 713-263-3412
Email: [email protected]
Michael PanasTelephone: +1 713-263-3396Email: [email protected]
LONDON
Lauren CervinoTelephone: +44 20 3747 4832
Email: [email protected]
Emma LambTelephone: +44 20 3747 4883
Email: [email protected]
Tom NashTelephone: +44 20 3747 4829
Email: [email protected]
SINGAPORE
Kit Ling WongTelephone: +66 6221 1413Email: [email protected]
SALESStephen Park
Telephone: +44 (20) 3747-4800 Email: [email protected]
SUPPORTTelephone: +1 (212) 230-2000
Email: [email protected]
NW EUROPE . . . . . . . . . . . . . . . . . . . . . . . . . . . . . . . . . . . . . . . . . . . . 15Ethane Shipping Market Sees New Developments . . . . . . . . . . . . . . . . . . 15
New developments in the ethane shipping market in addition to ethane petrochemical feedstock com-petiveness indicates a strong outlook for the NGL into 2016 and beyond.
AMERICAS . . . . . . . . . . . . . . . . . . . . . . . . . . . . . . . . . . . . . . . . . . . . . 17US Export Capacity To Be Underutilized In 2016. . . . . . . . . . . . . . . . . . . . . . 17With the start-up of Enterprise’s most recent LPG export terminal capacity, total US export capacity is roughly 2.5 million tons per month. Due to the slow growth in US production, however, much of that capacity will remain underutilized in 2016.
APPENDIX . . . . . . . . . . . . . . . . . . . . . . . . . . . . . . . . . . . . . . . . . . . . . . 20

LPG IN WORLD MARKETS | JAN 2016
©2016 Poten & Partners4
MONTHLY REVIEW
Low Oil And LNG Prices To Affect LPG Production, Especially In The USFollowing OPEC’s early December decision to maintain production targets for 2016, crude oil prices have continued to fall. Since the announce-ment, Brent prices have gone down by another 10% and the spread between Brent and WTI prices has all but dis-appeared. In addition, the start-up of new LNG terminals around the world combined with weaker than expected demand may affect global LPG pro-duction. Combined, these two factors are important to watch during 2016 since LPG production is a by-product of both natural gas and natural gas associated from crude oil production.
Crude Oil ImpactCrude oil prices are at their lowest lev-els since December 2008, less than $35 per barrel. These prices occurred in the midst of the financial crisis which led to wide spread drops in all com-modity and stock prices. Excluding that extraordinary circumstance, prices
are at their lowest level since early 2004. Crude oil prices are important to LPG production in areas where gas is recovered associated with crude oil. This is especially true in the US where roughly 50% of LPG production is associated with crude oil production. On the other hand, in OPEC nations, prices are generally not an indication of production since production is set to meet supply targets.
Global crude oil markets are extreme-ly oversupplied. In addition to high onshore inventories, there is ample supply sitting in tankers offshore. According to some estimates, there is more than 100 million barrels in floating storage. To put this number in perspective, daily oil demand for the entire world is roughly 93 million barrels per day, according to OPEC’s monthly statistics.
The graph on the top right of the following page shows the production
of LPG from non-refinery sources (associated and non-associated gas) for the OPEC member countries and other important areas around the world. Supplies that are at risk due to low prices are in parts of the US and, to a lesser extent, South America. Russian supply is likely to continue despite lower oil prices due to the economy’s dependence on oil revenue.
Roughly 43% of total non-refinery sourced LPG production is from OPEC countries. Based on OPEC’s produc-tion targets, this production is expect-ed to grow slightly during the next 12 months. Saudi Arabia alone produces more than 30% of total OPEC produc-tion, making it one of the largest pro-ducing countries in the world. Retail demand for LPG is very small in Saudi Arabia. Petrochemical production, on the other hand, is substantial. Roughly one third of total production from Saudi Arabia is exported.
LPG Produced by OPEC Member States vs . Rest of World

LPG IN WORLD MARKETS | JAN 2016
©2016 Poten & Partners5
Poten’s current forecast does not show substantial growth in Iranian LPG production; however, based on changes in global sanctions follow-ing the deal made in the summer of 2015, there is uncertainty around this figure. Estimates of Iran’s potential for oil production and exports in 2016 vary widely depending on the source. Very conservative estimates point to a lack of existing infrastructure in the country hampering the growth of production. Other estimates show that infrastructure issues will take little time to overcome. It is safe to say that barring any political upheaval, there is high side risk to the current view. The Iranian LPG outlook is discussed in more detail in the Middle East section.
Outside of Iran, there is some growth expected during 2016; however, there is not expected to be any large jump. The United Arab Emirates (UAE) and Qatar, the second and third largest LPG producers in OPEC are expected to have modest increases in produc-tion at roughly 4% increases for each country.
US LPG production, in particular, will be affected by lower crude oil prices. Lower rig counts have led to slower growth in production during 2015. With crude oil prices at their current levels, the slow growth will continue into 2016. US market watchers are still waiting for a decline in produc-tion due to lower drilling rates which has yet to occur. The slower drilling rates should lead to lower production; however, steep declines in activity that started in late 2014 have yet to make crude or natural gas production decline by any appreciable number. This is especially true for LPG where production has been flat to slightly up for most months in 2015. More details on Poten’s outlook for US propane markets in 2016 can be found in the Americas section of this report.
Another important detail emerging in the US is that the law banning oil exports from the US has passed. In fact, the first export shipment of crude oil has lifted from Corpus Christi.
With the ban lifted, US production of crude oil may change. The change in drilling patterns during 2015 is a direct reaction to poor economics due to lower crude oil prices. Allowing exports is not likely to change the WTI price dramatically, and it will not make drilling in most US locations different. However, it has the potential to modify production economics for lighter crude oil and condensates.
The vast majority of US crude oil pro-duced from shale is a light crude oil, some even lighter than WTI crude oil. The majority of US refineries are built to use heavier crude such as that from the Middle East. To incentivize use in refineries, lighter crude oil and con-densate production has been selling at
Global Non-Refinery LPG Production
0
10
20
30
40
50
60
70
80
90
OPECProduction
Russia US Other
MM
ton
s
Iran
UAE
Qatar
Saudi Arabia
Other OPEC
a discount to WTI. The elimination of the export ban could change the inter-nal US pricing dynamics and decrease or eliminate some of the light crude oil discounts, making production in certain plays more economical, lead-ing to increases in production at the expense of other crude oil plays that are less economical. The natural gas associated with these plays is very rich and contains large volumes of liquids. There is a long way to go before these effects could be felt; however, it is im-portant to watch going into 2016.
LNG ImpactCrude oil production changes are im-portant to global LPG production due to the extremely rich associated gas
LNG Export Capacity, Index 2010 = 100
0
20
40
60
80
100
120
140
160
180
2010 2011 2012 2013 2014 2015 2016 2017 2018 2019 2020
Ind
ex, 2
010
= 1
00
LNG Capacity Source: Poten & Partners
Source: Poten & Partners

LPG IN WORLD MARKETS | JAN 2016
©2016 Poten & Partners6
produced with crude. However, natural gas production is also extremely im-portant, especially when it is gas rich in liquids. For most LNG projects, all the LPG is extracted from the natural gas stream and used either domesti-cally in producing nations or put onto the international markets. In 2016 and 2017, nearly 46 MMt/y of liquefaction capacity will come online. Unlike LPG projects, LNG projects have very long lead times making start-up timing more uncertain.
Most of this capacity is starting up in Australia, where some projects, especially those along the Northwest Shelf, are producing liquids-rich gas. One project in particular is obtain-ing gas from a condensate field. The Ichthys project has LNG production capacity of 8.9 MMt/y and is expected to have associated LPG production of 1.6 MMt/y. Other projects will also produce LPG, increasing Australia’s contribution to global LPG trade.
Although LPG production is asso-ciated with some LNG projects in Australia, most new export capacity
will be supported by dryer natural gas such as coal bed methane.
The first US LNG exports are expect-ed in 2016. The Sabine Pass project is expected to start up in early 2016 with LNG export capacity of 9 MMt/y. US LNG export projects differ sub-stantially from typical LNG projects, which are built to use gas supply from a specific production area or field. The US projects will get gas from a grid connecting nearly all regions of the country to various supply sources, demand centers and market hubs. As a result, there is less need in the US to tie projects to specific gas fields (though some long term transporta-tion deals have been set up per LNG financing requirements, there is still flexibility inherent in the US natural gas system). In another change for the LNG business, sales contracts for all US liquefaction project that have made final investment decisions are indexed directly to US natural gas prices rather than to crude oil.
US projects can potentially increase LPG production but much depends on the natural gas supply source. The
most likely candidates are the Eagle Ford in South Texas and the Marcellus in the Northeast US, both liquids-rich plays that could boost LPG produc-tion. However, expected declines in other areas of the country could easily balance out any increases.
The demand side of the LNG equation is also interesting. According to Poten’s most recent Global LNG Outlook, global demand for LNG in 2015 did not grow as much as expected, espe-cially in Asia. And, according to the models, Asian LNG demand in 2016 is expected to grow by only 1% compared with previous estimates of 3%. This slower growth follows weaker-than-ex-pected growth in fourth quarter 2015. Globally, the demand outlook for 2016 is expected to be only 8% compared with a previous outlook of more than 11%.
The slower growth is especially con-cerning given the amount of capacity expected to start up in coming years. The changes in demand growth could also change price and supply profiles and are an important factor to watch in terms of LPG production growth.
Direction of TradeThere was continued concentration of tonnage heading East in December with approximately 900,000 metric tons of LPG moving from producing countries in the west to destinations east of Suez. Ship tracking data shows that just shy of 10 million metric tons of product moved west to east in 2015, a number that explains the increase in ton-mile demand for shipping. Algerian tons found a home in Europe, and US exports to the East were marginally higher when compared to November.
Middle EastSpot activity in the Middle East was fairly muted in December with stub-bornly high freight rates and weak CFR premiums in the Asian market.
As was the case so often through 2015, the Indian charterers were the only participants with any notable spot re-quirements, and rates averaged roughly $2.5 million on a lump sum basis. Indian freight rates tend to be done on a lump sum rather than per ton basis. January CP was set at $345 per ton and $390 per ton for propane and butane respectively.
NW EuropeThere was one recorded VLGC lift-ing in December as the 84,000 cbm Saltram, a Petredec-owned vessel on short term TC to Vitol, loaded a rare cargo out of Stenungsund in Sweden bound for Japan. At the time of writ-ing, she is currently transiting the Gulf
of Aden and is scheduled to arrive in Japan on or around 11 Jan.
North AfricaFrom Algeria, December saw the usual spate of cargo deliveries into the Mediterranean – the VLGCs Djanet and Reggane both called at various ports in Turkey as did the LGC Hassi Messaoud 2 while the Gas Spirit I is currently heading for Egypt. Elsewhere, the LGC Alrar moved north to Flushing after an initial voyage to Lavera. To Asia, only the Yuyo Spirits moved east arriving in China towards the end of December.
DIRECTION OF TRADE

LPG IN WORLD MARKETS | JAN 2016
©2016 Poten & Partners7
West AfricaThere were four VLGCs seen loading at ports in West Africa in December, one less than in November. The Kobai was the only one of the four to have loaded out of Angola, and it is mak-ing for the Far East. Meanwhile, the Corsair, Reimei and Hellas Glory took on product at the Bonny terminal and are all bound for Asia, the latter vessel is scheduled to call at the Port of Raoping in the Chinese province of Guandong.
North AmericaIn December, Poten counts 17 VLGC and LGC cargoes heading from ports in the US to destinations in Asia. To Europe, there were a further 5 large cargoes over the same period. Exports from the US in December totaled a little over 1.9 mm t with the majority of tonnage not heading to Europe or Asia going to Latin America. There were further shipments to Europe and West Africa on the smaller segments including several cargoes to Spain aboard the Clipper Hermes (Gijon), Atlantic Gas (Tarragona) and Celtic Gas (Cartagena). Luanda is expected to receive the 17,900 cbm Cumbria which set off from the Chesapeake terminal while the Balearic Gas moved a cargo from Targa to Jorf Lasfar, Morocco. ($/t) US Europe Far East
Propane vs Naphtha -68 -18
Butane vs Naphtha -58 -8
Propane vs Butane -49 -11 -11
Indicative Arbitrages - December Spot Averages
Spreads ($/t) Propane Butane Freight ($/t)* Propane arb Butane arb
USGC to Europe (ARA) 52 14 65 -13 -51
USGC to Far East 138 99 150 -12 -51
Arab Gulf to Far East 43 27 67 -25 -40
WAF Netbacks
NW Europe 252 263 67
Far East 299 309 105
Indicative Arbitrages - December
*Indicative freight assessment basis VLGC-sized vessels
Large Cargoes US to EuropeName Loaded Loading date Destination
BU SIDRA Nederland 12/3/2015 Terneuzen
DORSET Nederland 12/15/2015 Lavera
COMET Nederland 12/20/2015 Sines
ALBERT Nederland 12/21/2015 Teessport
LUBARA Nederland 12/27/2015 Med
Name Loaded Loading date Destination
LEVANT Enterprise 12/3/2015 Far East
BW MAPLE Targa 12/4/2015 Far East
BW GEMINI Nederland 12/5/2015 Far East
AVANCE Enterprise 12/5/2015 Far East
GRACE RIVER Tampa 12/8/2015 Far East
BW ORION Nederland 12/8/2015 Far East
CONSTITUTION Targa 12/13/2015 Far East
BW PINE Enterprise 12/15/2015 Far East
PAZIFIK Nederland 12/18/2015 Korea
CAPTAIN NICHOLAS ML Targa 12/18/2015 Far East
LETO PROVIDENCE Enterprise 12/19/2015 Far East
CHAPARRAL STS Panama 12/21/2015 Japan
BW HAVIS Enterprise 12/26/2015 Chiba
CRESQUES Enterprise 12/26/2015 Far East
BW SAKURA Enterprise 12/29/2015 Far East
AURORA TAURUS Ferndale 12/30/2015 South Korea
PAMPERO Enterprise 12/31/2015 Far East?
Large Cargoes US to Asia
DIRECTION OF TRADE

LPG IN WORLD MARKETS | JAN 2016
©2016 Poten & Partners8
Spot Contract Prices
October November December
CONTRACT ($/t) Propane Butane Propane Butane Propane Butane
Middle East Saudi Aramco (1) 360 365 395 435 460 475
North Africa Sonatrach (2) 310 375 315 380 355 385
NW Europe North Sea (OPIS) (3) 307 348 311 358 346 336
SPOT ($/t) Propane Butane Propane Butane Propane Butane
October Averages November Averages December Averages
Middle East FOB cargoes 370 379 422 440 361 388
FOB premium -6 -6 1 1 -2 -2
Japan CFR cargoes 446 454 486 494 404 414
CFR premium 69 69 68 67 34 35
West Med CIF cargoes 353 398 368 362 321 331
NW Europe CIF cargoes 350 395 365 359 319 330
USGC Mt Belvieu (c/gal) 45 61 42 62 38 57
Export FOB cargoes 302 336 288 341 266 315
Naphtha ($/t) September Averages October Averages November Averages
Japan 456 453 422
NW Europe 431 419 387
Mt Belvieu (c/gal) 122 122 109
(1) CP for lifting Arabian Gulf and Yanbu. Kuwait (KPC), ADNOC (Abu Dhabi) and QP (Qatar) have established similar FOB prices(2) Prices FOB Bethioua. Skikda prices for propane $5-$7/t higher(3) Source: Oil Price Information Service (OPIS) +1 301 287 2645
DIRECTION OF TRADE

LPG IN WORLD MARKETS | JAN 2016
©2016 Poten & Partners9
Shipping DevelopmentsVLGC Deliveries
Dorian has edged ever closer to com-pletion of its VLGC newbuild program with the delivery of the 84,000 cbm Challenger. The Challenger is Dorian LPG’s 18th newbuilding delivery and will operate in the Helios LPG pool. Early on in December, Latsco also took delivery of the 82,400 cbm Hellas Poseidon – she will operate under Latsco subsidiary Consolidated Marine Management Inc. and is scheduled for a January lifting out of the US Gulf.
NewbuildsDecember was yet another busy month for newbuild activity with a number of options declared and newbuild vessels contracted.
In the VLGC segment, LPG market entrant Cardiff TMS exercised options on two Panamax VLGCs with Hyundai Heavy Industries (HHI) for delivery in Q4 2017. Upon delivery, it is under-stood that both vessels will enter into a 10-year time charter agreement with Clearlake Shipping.
Korean owner SK Gas has also turned to HHI with an order for one firm VLGC and one option for delivery in Q3 2017. A second Korean owner, KSS Line, has signed a contract again with HHI for one 84,000 cbm vessel sched-uled for delivery in Q2 2017 and at a reported cost of $76 million. Having placed separate orders for vessels in July and November, KSS now has a total of four VLGCs on order.
In an intriguing development in the ethane shipping market, Evergas and JHW Engineering & Contracting have entered into an agreement for the construction of four 32,000 cbm ethylene capable vessels to be delivered from Q1 2018 onwards. The vessels, dubbed as INEOS MAX, will be built at a Chinese yard. In a December press release, Evergas also disclose that these latest vessels will release the trans-portation capacity of the company’s
existing Dragon series of 27,500 cbm carriers which will then be made available for trade in the mid-size LNG transportation market. Further to Evergas’ announcement, German company Gaschem has emerged with the news that they will convert a num-ber of their small LPG carriers to carry ethane on behalf of Brazilian petchem
Shipping Freights -December 2015
*Basis two-port discharge**Basis two-port discharge for VLGCs(1) Load port costs for charters acount
LPG Trade RouteVoyage Basis
Ship-Size(thousand cbm)
R/T Time (days)
Freight Assessment($/t)
Import Area Export Area
EAST Actual
Japan Arabian Gulf 75-84 40-42 66-68
Yanbu 75-84 45-47 77-79
Algeria 75-84 62-67 115-117
Korea Arabian Gulf 75-84 38-40 64-66
China (South) Arabian Gulf 75-84 30-34* 59-61
India Arabian Gulf 20-84 10-15 55-61
WEST
Med Arabian Gulf 56-84 36-39** 81-83
(Lavera/Spain) Red Sea (Yanbu) 30-84 21-24** 53-55
Algeria 24-84 7-9* 29-35
North Sea 24-84 17-20* 47-57
Japan (via COGH) USGC 75-84 88-92 149-151
NW Europe USGC 75-84 29-31 64-66
West Med USGC 75-84 39-41 82-84
Japan WC Africa (1) 75-84 71-75 104-106
NW Europe WC Africa (1) 75-84 31-35 66-68
West Med WC Africa (1) 75-84 27-30 64-66
player Braskem. Further information on the Ineos and Gaschem announce-ments can be found in the Northwest Europe section of this report.
Elsewhere, Petredec has committed to two 22,000 cbm semi-refrigerated ves-sels with China’s Jiangnan shipyard for delivery in 2017. In 2014, the company placed an order for four ethylene capa-ble 21,000 cbm vessels with the same yard at a cost reported to be in excess of $220 million.
SHIPPING

LPG IN WORLD MARKETS | JAN 2016
©2016 Poten & Partners10
0
200
400
600
800
1000
1200
1400
Jan Feb Mar Apr May Jun Jul Aug Sep Oct Nov Dec
$/to
n 2013
2014
2015
AcquisitionFollowing mention of Avance Gas’ proposed takeover of Aurora LPG in the November issue of LPG in World Markets, Avance has since had to withdraw its all-share exchange offer after the mid-December acceptance deadline lapsed. The company cited a number of unmet conditions as the reason for failure despite lowering the minimum acceptance threshold from 90% of Aurora shareholders to 29%.
TC Rate $'000/month
Spot AG/Japan ($/t)
1920 66-68
VLGC
82,000 cbm $1,920,000/month
Other FR
57,000 cbm $1,500,000/month
38,000 cbm $1,250,000/month
24,000 cbm $950,000/month
Semi-Ref
20,000 cbm $1,100,000/month
December VLGC (82,000 cbm) Rate Assessments
Short-Term Charter Rate Dec 2015
MGC Segment Braced For A Challenging Year As Vessel Availability GrowsFor much of 2015, there was a spotlight on the mid-size or MGC segment as spot equivalent charter rates saw month on month gains through the year. Trade on these vessels was not only bolstered by demand for larger LPG carriers but also by the proliferation of trans-Atlantic and trans-Pacific trade routes that have emerged as a result of increasing exports from the US. However, returns garnered by vessels within this segment have not gone unnoticed, and the MGC orderbook is now the largest of any LPG segment as a percentage of the current fleet.
In 2015, rates for MGCs averaged approx-imately $1.2 million per calendar month (pcm) on a spot time charter equivalent (TCE) basis – this is $250,000 pcm higher than in 2014 and $360,000 pcm higher than in 2013. With a large proportion of the segment operating under term com-mitments and only 3 newbuild MGCs added to the fleet in 2015, the spot market was tight throughout the year as a result of this low vessel availability. Few spot fixtures were publicly disclosed and with little for market participants to go on, rates have responded accordingly. This has also pushed several ammonia players with MGC tonnage to relet vessels to the market in the midst of growing LPG demand and faltering seaborne ammonia trade.
Aside from the attractive rates returned on these vessels, a second notable factor driving demand growth for the segment
MGC Spot Time Charter Equivalent Rates 2013 - 2015
in 2015 was the emergence of consistent voyages across the Atlantic and to a lesser extent through the Panama Canal and across the Pacific to Asia. Whilst the number of MGC liftings as a percentage of total US liftings remained proportion-ally the same through 2014 and 2015 at approximately 8%, the actual number of liftings grew some 43% year on year. A large proportion of these voyages have been to countries in Latin America, Europe and North and West Africa where US exports are claiming greater mar-ket share. Through Panama, the MGCs Telendos, Anafi and Warisoulx have all
moved cargoes to Korea, the latter of which has been performing consecutive voyages to the East since June 2015. These cargoes have been lifted both out of the US Gulf and the Marcus Hook terminal on the US east coast to Korea.
With the rise of the MGC, interest in contracting newbuild vessels has been widespread. In the third quarter of 2015 alone, there were eight orders placed for mid-size vessels while the total number of vessels added to the orderbook in 2015 stands at 18. Also worthy of note, is the interest from companies with no
SHIPPING
Source: Poten & Partners

LPG IN WORLD MARKETS | JAN 2016
©2016 Poten & Partners11
previous exposure to the LPG market –Thenamaris, Phoenix Energy Navigation and Evalend Shipping who currently op-erate in the container, dry bulk and tanker markets, have a total of eight MGCs on order between them. However, it is Exmar LPG, the largest head owner of the cur-rent MGC fleet, which has the most ships on order today and the company that will extend its influence within this sector. Of the 42 vessels that are on the orderbook, 36% of the fleet is due for delivery in 2016, 61% in 2017 and 2% in 2018.
The extensive orderbook leads to ques-tions over the outlook for the MGC market next year and beyond. Poten anticipates a softer period for the segment from early 2016 onwards as newbuilds begin to trickle into the market and as the open availability list begins to grow. It is important to note that recently concluded term business lies with the newbuild or-ders contracted over the last few months and not with the prior newbuild orders. This is something the market will have to continue to watch as more 38,000 cbm uncommitted newbuilds are expected to be delivered ex-yard during 2016. A number of vessels currently operating in the MGC market will also come off their
current contracts. With just one or two potential candidates for scrapping (the MGC segment remains comparatively young) Poten expects a lengthy list of open vessels to develop.
Poten’s long term outlook for the MGC segment remains comparatively bear-ish against 2015 as the MGC newbuild
schedule clashes with a softening VLGC market. This is despite the burgeoning ethane trade. In the short to medium term, the market has already started to soften and Poten’s current rate estimate for a modern 38,000 cbm vessel on a 12 month TC is approximately $1-1.1 million pcm.
0
5
10
15
20
Exm
ar L
PGB
VBA
Nav
igat
or G
as
East
ern
Paci
ficSh
pg
Then
amar
is
Bak
ri
Byz
antin
eM
ariti
me.
Glo
bal
Uni
ted
Wes
t A
fric
aLP
G
Yara
Switz
erla
nd
Elet
son
Gas
Phoe
nix
Ener
gyN
avig
atio
n
Eval
end
Ship
ping
KSS
Lin
e
Trop
igas
Num
ber
of
vess
els
Current Fleet Orderbook
MGC orderbook December 2015
Shipping FixturesDecember 2015
Vessel Size Charterer Route Rate ($/t or Lump Sum) Comment Loading
VLGCs (‘000 cbm)
Mistral 83/blt 15 AG - Far East RNR LPG Single Voyage 10-12 Dec
Copernicus 84/blt 15 AG - Far East RNR LPG Single Voyage Mid- Dec
Everrich 8 78/blt90 IOC AG - India 1/3 ports LS $2,140,000 LPG Single Voyage 18-19 Dec
Venus Glory 83/blt08 IOC AG - India 1/3 ports LS $2,300,000 LPG Single Voyage 19-21 Dec
Aurora Taurus 82/blt08 Petrogas Ferndale - Chiba RNR LPG Single Voyage 20-Dec
Iris Glory 83/blt 08 Reliance AG - Far East $1.8m lpsm bss AG-Sikka LPG Single Voyage 26-27 Dec
Aquamarine Progress 83/blt 10 Petrobras Escravos - Brazil RNR LPG Single Voyage 26-30 Dec
Hisui 80/blt10 BPCL AG - India 1/3 ports LS $2,500,000 LPG Single Voyage 29-30 Dec
Serjeant 84/blt 15 HPCL AG - India 1/3 ports LS $3,800,000 LPG Single Voyage 30 Dec - 7 Jan
Fountain River 79/blt97 BPCL AG - India 1/3 ports LS $2,360,000 LPG Single Voyage 30-31 Dec
BW TBN Eneos AG- ECI/WCI $67.5 pmt bss Ras Tanura/Chiba LPG Single Voyage Early Jan
BW Kyoto 83/blt10 Vitol AG - Far East $65-70 pmt bss Ras Tanura/Chiba LPG Single Voyage 3-4 Jan
G. Arete 82/blt13 Shell AG - Far East $65-70 pmt bss Ras Tanura/Chiba LPG Single Voyage 4-5 Jan
Chinook 84/blt 15 HPCL AG - India 1/3 ports LS $3,700,000 LPG Single Voyage 4-5 Jan
Cougar 84/blt 15 Gyxis Houston - Chiba RNR LPG Single Voyage 5-6 Jan
Gas Star 84/blt14 Statoil Bethioua - Chiba $115 pmt bss Bethioua/Chiba LPG Single Voyage 5-7 Jan
Source: Poten & Partners
SHIPPING

LPG IN WORLD MARKETS | JAN 2016
©2016 Poten & Partners12
Challenger 84/blt15 IOC AG - India 1/2 ports LS $2,500,000 LPG Single Voyage 7-8 Jan
Constellation 84/blt15 Chevron Escravos - Far East RNR LPG Single Voyage 7-14 Jan
Al Wukir 80/blt08 Statoil USG - options $159pmt LPG Single Voyage 13-14 Jan
Morston 82/blt 13 Statoil Houston - Chiba Around $160 bss Houston/Chiba LPG Single Voyage Mid Jan
Oriental Queen 82/blt 04 BPCL AG - India 1/3 ports LS $2,300,000 LPG Single Voyage 15-16 Jan
British Courage 83/blt06 Repsol USG - Med High $60's pmt bss Houston/Flushing LPG Single Voyage 16-17 Jan
BW TBN SHV USG - Far East High $150's pmt bss Houston/Chiba LPG Single Voyage 20-21 Jan
Fritzi N 82/blt09 IOC AG - India 1/2 ports LS $2,000,000 LPG Single Voyage 23-24 Jan
Cratis or Sub 84/blt15 Glencore USG - Options$150pmt Hou/Chiba, $67pmt Hou/Flushing
LPG Single Voyage 26-27 Jan
Concorde 84/blt 15 Oriental Energy USG - Options RNR LPG Single Voyage 5-7 Feb
Copernicus or Sub 84/blt15 Oriental Energy USG - Options RNR LPG Single Voyage 17-18 Feb
Gas Summit 84/blt14 Itochu USG - Far East $128 pmt bss Houston/Chiba LPG Single Voyage 18-19 Feb
Vessel Size Charterer Route Rate ($/t or Lump Sum) Comment Loading
VLGCs [continued] (‘000 cbm)
LGCs
BW Nice 59/blt03 Petredec RNR Short term TC Early Jan
Maharshi Vamadeva 57/blt91 IOC AG - India 1/2 ports LS $1,800,000 LPG Single Voyage 23-25 Dec
Semi-Refs/Handy-size
Nordic Gas 20.7 Petredec RNR Short term TC
Mathraki 22.0 Vitol North Sea - options RNR LPG Single Voyage 22-24 Dec
Celtic Gas 22.0 Geogas USEC - options RNR LPG Single Voyage 1-5 Jan
Navigator Ceres 22.1 Geogas Bahia Blanca - options RNR LPG Single Voyage 12-15 Dec
Iran Energy Investment Plans To Define Future LPG Supply/DemandThe Iranian energy market has come under the spotlight since the end of November when 70 oil and gas projects were offered to international companies. The anticipated lifting of international economic sanctions by Q1-2016 has resulted in a flurry of business devel-opment activity in the country with oil and gas at the forefront of talks. Iranian authorities are hoping to see roughly $30 billion of investment. According to public sources, a number of European oil and gas companies, including Shell, Total, Lukoil and ENI, have already shown interest.
Although future NGL production levels in Iran will ultimately be defined by the investment activity attracted to the country, the next three to five years of
production will still heavily depend on South Pars developments and how quickly the forthcoming phases of this project will be commissioned.
As of Q4-2015, there are ten phases in operation in South Pars (SP), with six of them producing LPG. Twelve further phases are currently in the development stage (with varying degrees of progress) and are expected to start up production between 2016 and 2021.
• SP Phases 15 & 16 are reportedly near completion and under com-missioning. These two phases could start production in Q1-16.
• SP Phases 17 & 18, are also reportedly under commission
with estimated start up in Q1 or Q2-2016.
• Other phases that are expected to begin operations by 2018/19 are the SP phases 19, 20 and 21 with phases 13 , 22, 23 and 24 being a bit unclear with estimated start up times on or beyond 2020.
The graph on the following page shows Poten’s estimated production scenarios for the South Pars field and how rapid-ly production in the field is forecast to ramp up towards 2020.
In the base case scenario, South Pars incremental LPG production by 2020 is projected to reach 3.0 million metric tons above current production levels. There is a possibility that production will go even higher, increasing by as many as 4.0 million metric tons.
MIDDLE EAST

LPG IN WORLD MARKETS | JAN 2016
©2016 Poten & Partners13
0.0
0.5
1.0
1.5
2.0
2.5
3.0
3.5
4.0
4.5
2016 2017 2018 2019 2020
mm
to
ns, C
hang
e fr
om
201
5
Base High Low
The additional volume that will be directed to the seaborne export mar-ket will be dependent on the growth in domestic demand in the country. Domestic demand in this case will potentially come from all segments including refineries, retail demand and petrochemical markets. Retail markets are expected to grow quite significantly with an estimated year-on-year average growth of 3%-5%. Petchem demand depends on the level of investment in the country; however, the startup timing for forthcoming PDH and steam cracker projects will affect available exports.
Due to the international economic sanctions, the actual annual volume of LPG exports has varied significantly. The most extreme year was 2013 when total estimated exports totaled roughly 1 million metric tons down from the level of about 3 million metric tons the preceding years.
In 2015, actual export volumes of Iranian derived cargo have been challenging to assess. According to Poten estimates, based on shipping data and examination of cargo originating from Iran, the total volume of Iranian seaborne exports between January and December was be-tween 3.8-3.9 million tons. This volume is already significantly higher than 2014, which was estimated at 3.2 million tons, and does not including any potential ad-ditional cargoes towards the second half of December. This hike already high-lights the current activity of the South Pars developments and its potential as seen in the adjacent chart.
All in all, seaborne exports are estimated to grow significantly in the forthcoming years, but the final export volume will be a function of the investment activity in the country, the further development of South Pars and the startup timing of the new petrochemical consuming facilities.
South Pars Incremental LPG Production Forecast Scenarios 2016 - 2020
Iranian LPG Exports 2011 - 2015
0.0
0.5
1.0
1.5
2.0
2.5
3.0
3.5
4.0
4.5
2011 2012 2013 2014 2015*
mm
to
ns
* 2015 Estimate
Source: Poten & Partners
Source: Poten & Partners
China’s LPG Imports To Surpass JapanChina is poised to overtake Japan as the largest LPG importer in the world, accord-ing to the latest import data. Year to date through November, Japan has imported only 9.7 million tons of LPG while China has imported 10.8 million tons. This change is more than a trivial ranking for the best in the business as it indicates the start of a shift in global LPG dynamics.
ChinaThe majority of Chinese growth in 2015 has been from a jump in large bulk demand for both butane and propane in
chemical applications, particularly pet-rochemical demand from new PDH unit start-ups in 2015. LPG imports reached 7.1 million tons in 2014 while in 2015, Chinese LPG imports are on track to reach 11.5 million tons. East China, home to a concentration of PDH units, saw two new PDH units that start-up in 2015. Massive storage capacity also meant that China could afford to absorb more propane when prices were attractive during the first quar-ter of last year.
Both the 750,000 ton per year Yantai Wanhua PDH unit and the 660,000 ton
ASIA PAC
LPG IN WORLD MARKETS | JAN 2016
©2016 Poten & Partners14
per year Yangzijiang PDH unit owned by Oriental Energy started up in 2015. Construction of Hebei Haiwei’s PDH unit was understood to be completed by the fourth quarter of 2015, but commissioning has been delayed due to weak margins.
China could add another three PDH units in 2016; however, these units are expected to run at below operating capacity due to weaker propane to propylene produc-tion margins. China’s Oriental Energy’s 660,000t/y Ningbo PDH unit, China’s Soft Packaging 660,000t/y PDH unit in Fuzhou, and Hebei Haiwei’s 500,000t/y PDH unit are all slated for startup in 2016.
Based on historical import requirements, Japan typically imports up to 1.0 million tons per month during the winter months. December buying was healthy, traders said. Assuming Japan imports another 1 million tons of LPG in December, total LPG imports would still reach 10.9 million tons in 2015, lower the 2014 total of 11.6 million tons.
JapanIn contrast, Japan’s propane market is a very mature one with few shifts in demand over the last several years. Since 2012, de-mand for propane in Japan has increased only 3% overall or roughly 1% per year. Nearly all of the demand increase has been due to increases in use by the petrochem-ical segment. The additional supply has come from imports as domestic produc-tion from refineries has been relatively flat.
Japan’s imports have been steadily falling for the past several years. After peaking in 2012 at 13.2 million tons, imports in 2014 were only 11.6 million tons. This is the result of decreasing demand for propane in the retail market as LNG imports replace the need for propane. The trend continued in 2015 due to continued decreases in de-mand, lower inventories and unfavorable import economics.
Part of the reason for reduced imports in 2015 was a preference by Japanese im-porters to draw down on stocks. Propane stocks for January to November 2015 fell to 12.1 million tons, compared with 12.9 million tons over the same period in 2014.
Total LPG stocks also fell to 19.8 million tons for January to November 2015, com-pared with 20.1 million tons over the same period. Total LPG stocks in 2013 were as high as 24.4 million tons and propane stocks reached 14.6 million tons.
Japan also bought less LPG during the summer as a result of a closed arbitrage. During the summer, the arbitrage window between the Far East and the US and the
Middle East was closed. This was due to a combination of higher than expected US prices and an extremely high shipping rate. In July, Poten’s VLGC rate assessment was extremely high at nearly $130 per ton. Although VLGC rates fell as new vessels entered the market post summer, the bulk of the LPG vessels stayed in Asia-Pacific shipping propane between the Middle East and Asia. Rising competition from the pipeline gas sector (via LNG imports) also played a role in reduced LPG imports.
Japan LPG Stocks
Source: METI
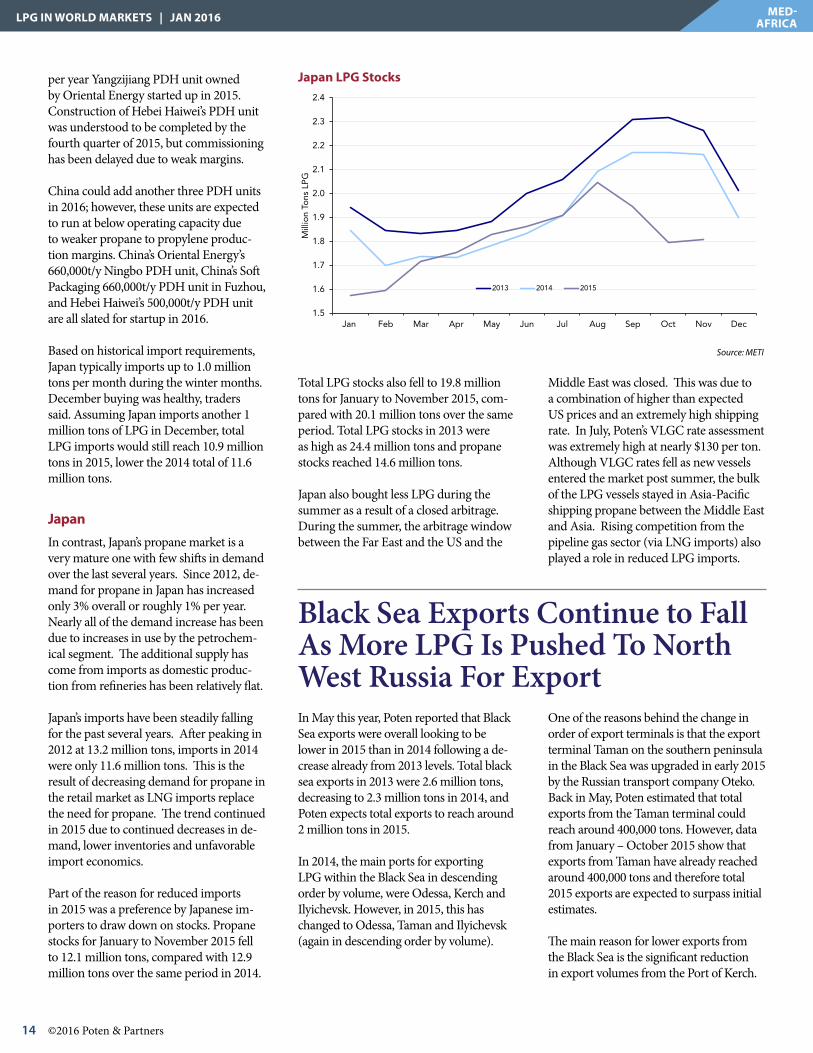
Black Sea Exports Continue to Fall As More LPG Is Pushed To North West Russia For ExportIn May this year, Poten reported that Black Sea exports were overall looking to be lower in 2015 than in 2014 following a de-crease already from 2013 levels. Total black sea exports in 2013 were 2.6 million tons, decreasing to 2.3 million tons in 2014, and Poten expects total exports to reach around 2 million tons in 2015.
In 2014, the main ports for exporting LPG within the Black Sea in descending order by volume, were Odessa, Kerch and Ilyichevsk. However, in 2015, this has changed to Odessa, Taman and Ilyichevsk (again in descending order by volume).
One of the reasons behind the change in order of export terminals is that the export terminal Taman on the southern peninsula in the Black Sea was upgraded in early 2015 by the Russian transport company Oteko. Back in May, Poten estimated that total exports from the Taman terminal could reach around 400,000 tons. However, data from January – October 2015 show that exports from Taman have already reached around 400,000 tons and therefore total 2015 exports are expected to surpass initial estimates.
The main reason for lower exports from the Black Sea is the significant reduction in export volumes from the Port of Kerch.
MED-AFRICA
1.5
1.6
1.7
1.8
1.9
2.0
2.1
2.2
2.3
2.4
Jan Feb Mar Apr May Jun Jul Aug Sep Oct Nov Dec
Mill
ion
Tons
LP
G
2013 2014 2015

LPG IN WORLD MARKETS | JAN 2016
©2016 Poten & Partners15
Main Black Sea LPG exporting ports – 2014 vs 2015
Source: Poten, Reuters
Black Sea LPG Ports
The Port of Kerch, as indicated in the map, is situated on the Crimea peninsula. LPG exported through the Port of Kerch origi-nates either in Russia or Kazakhstan and is transported to the terminal via rail.
One of the reasons for lower export levels from the Port of Kerch could be a result of ongoing political tensions in the area between Russia and Ukraine. Furthermore, it has been suggested that as a way to decrease Russia’s dependence on foreign port infrastructure, more volumes will be exported from Russia via the Ust-Luga terminal in the North West. The Ust-Luga terminal was previously owned by SIBUR, a leading gas processing and Petrochemicals Company, but was recently sold to a consortium of investors with SIBUR remaining terminal operator and providing LPG throughput volumes. With plans to expand the throughput capacity from 1.5 mm t of LPG to 2.4 mm t of LPG by 2017, more volumes could be exported from the North West of Russia as opposed to the Black Sea.
Consequences for lower trade volumes out of the Black Sea mainly affect the Mediterranean’s largest importer, Turkey. According to EPDK, total Black Sea exports to Turkey have decreased by nearly 6%. However, imports to Turkey from Ukraine have decreased over 85%, nearly 200,000 tons in the first three quarters of 2015 com-pared with 2014. As a consequence, Turkey has looked to other sources of LPG, with the US making up most of the volume loss from Ukraine. Total imports from the US to Turkey from January to September 2015 are nearly 7% of total imports.
With political instability continuing between Russia and Ukraine, and with the expansion anticipated in the North West of Russia, we could see lower volumes of LPG being exported from the Port of Kerch and the Black Sea in general, resulting in importers such as Turkey having to contin-ue to source LPG further afield. This may provide an opportunity for Algeria to gain more market share of Turkey’s imports or volumes may continue to rise from the US to Turkey.
Ethane Shipping Market Sees New Developments By the end of December there were two further indications of life in the ethane shipping market, Evergas announced the building of four 32,000 cbm vessels (with the option for a further two). In addition, Trade Winds carried a report that a number of 8,500 cbm GasChem vessels will add regasification facilities so they can be used to deliver ethane to Braskem in Brazil. The ethane vessel order book now totals over one million cubic meters of capacity, suggesting that various shipping groups and charterers alike are maintaining a strong outlook for international ethane trade.
At the same time, it is evident that the current advantages of cracking
imported US ethane in NW Europe over cracking naphtha are much less than they were when the first ethane ships were ordered. Since then, the drop in crude oil prices and the associated drop in naphtha prices has brought naphtha costs more in line with ethane costs. Although ethane costs fell during 2015, additional decreases beyond the current lows are difficult to achieve. The good news for ethane buyers is that the situation in June/July – when it was better to crack European naphtha than imported US ethane – proved to be temporary. Imported US ethane is again giving better theoretical cracking margins than naphtha.
NW EUROPE
Source: Poten & Partners

LPG IN WORLD MARKETS | JAN 2016
©2016 Poten & Partners16
INEOS’s Grangemouth (Scotland) and Rafnes (Norway) ethylene plant facili-ties will be the first to import US ethane from shale gas to Northern Europe to use as feedstock. In the coming years, INEOS plans to import at least 800,000 tons per year of ethane. The initial vol-umes will be sourced from the Marcus Hook terminal (located on the North East coast of the United States) via Sunoco’s Mariner East I Pipeline. The first cargo from the terminal is expected to lift in early-February.
The Copenhagen based shipping group, Evergas, is the first to build vessels specifically to transport US ethane to Europe. Evergas and Sinopacific are in agreement to build eight Dragon class 27,500 cubic meter vessels with the ability to carry LNG, in addition to LPG and liquefied ethane; the vessels can burn LNG, conventional diesel or ethane as fuel. By the beginning of December three of the eight Evergas Dragon Class vessels were transporting LPG on international routes. During this time, Evergas announced that together with JHW Engineering & Contracting they will build four option two INEOS MAX 32,000 cubic meter liquefied ethane and ethylene vessels with a 1Q2018 onwards estimated delivery. The delivery of the MAX vessels are due to release some of the Dragon class vessels to serve the mid-size LNG market, as reported by Evergas.
With the most recent Evergas an-nouncement, the ethane fleet order book including all firm orders is now up to a total capacity of 1,035,500 cubic meters; speculative orders, including the option of two additional Evergas MAX vessels, would add another 489,000 cubic meters of capacity. More than half of the fleet order book is due for delivery in 2016, where approximately 63% of those ves-sels are VLEC size.
Competiveness of imported US ethane as European cracker feed-stock Since the details of INEOS’s ethane plans originally came out, the feedstock envi-ronment has changed. For INEOS and
other European ethylene facilities look-ing to use ethane, the spread between imported US ethane and European naphtha ethylene margins will determine the viability of an imported ethane feed-stock advantage. Two primary factors that could weaken this advantage are ei-ther an increase in US ethane prices and/or a decrease in international naphtha prices. Currently, ethylene plant margins are affected by the second factor. In the future, however, the former may become more important.
To date there is no fungible market for ethane in Europe. Consequently, to de-termine the competiveness of naphtha feedstock to imported US ethane feed-stock Poten has compared two different estimated imported US ethane values on the basis of European naphtha and USGC ethane:
1) Imported ethane, European naphtha basis: Although the exact details of the contracts are not widely known, one possibility is that European companies have bilateral con-tracts which allow them to buy ethane on a naphtha minus basis. Since the exact discount to naphtha is unknown we have assumed a discount of
$100 per ton for the purpose of this analysis.
2) Imported ethane, USGC ethane basis: The calculation is done by taking the Mont Belvieu price of ethane and adding estimated terminal fees and transatlantic freight costs.
The impact of these values on European ethylene plant incremental margins compared to naphtha cracking is illustrated in the chart. (This analysis uses actual weekly European naphtha and Mont Belvieu ethane prices and describes the situation if US ethane had been moving to Europe at that time).
Throughout 2015 the highest margin producing feedstock was imported eth-ane based on the USGC ethane price. The average spread between this feed-stock and European naphtha ethylene margins for FY 2014 was $557 per ton of ethylene, however once the price of crude oil collapsed in winter 2014-2015 the spread significantly decreased. The FY 2015 average spread was less at $218 per ton of ethylene.
Towards the middle of 2015, European naphtha ethylene margins began to track closer to both imported US eth-ane margins, and in June/July briefly
Dedicated Ethane Fleet Outlook
0
250
500
750
1000
2016 2017 2018
tho
usan
d c
ubic
met
ers
Handy-size Mid-size VLEC Source: Poten & Partners
NW EUROPE

LPG IN WORLD MARKETS | JAN 2016
©2016 Poten & Partners17
converged with the “imported ethane, naphtha minus 100 basis” ethylene mar-gins. However, the graph indicates that the spread between both imported US ethane and European naphtha ethylene margins has widened towards the end of 2015. The average spread between “imported ethane, USGC ethane basis” and European naphtha ethylene mar-gins was $267 per ton of ethylene from July to December 2015 ($93 per ton of ethylene higher than the first half of the year).
INEOS has not revealed how its US eth-ane contracts are structured. However it is clear that, whatever basis is used, the advantages of cracking imported US ethane over European naphtha are not as significant as they once were. Advantages in the future will clearly de-pend on the direction of crude oil (and hence naphtha) prices and the develop-ment of Mont Belvieu ethane prices.
In the December 2015 issue of LPG in World Markets, the feature article went into detail on the US ethane market and
the challenges ahead for that business. One of the main conclusions of the report was that with all of the ethane export capacity and steam cracker capacity expected to start up in the US, it is almost certain that ethane prices in the US will increase as consumers work to incentivize additional production.
For export contracts written relative to US ethane prices, the increase in ethane prices will pose an additional challenge to import economics. For those tied to naphtha or other factors, this will be less of a challenge.
Production Growth Key To Determining US Propane ExportsAt the end of 2014, it became clear that the US production market was chang-ing dramatically. With lower crude oil prices came a reduction in drilling rigs and other production related activity. From January 2015 through December 2015, production grew by an estimated 1%. In 2014, production from the start of the year to the end of the year in-creased by 9%. The slower production growth is expected to continue with a weak outlook for both domestic crude oil and natural gas production growth.
One of the main questions that the slower production growth brings is how exports will be affected. If pro-duction is not growing as rapidly, can export contract minimums be met, and what other volumes may be available for export. Although production is
US Propane Base Case Supply, Demand and Exports
0
1
2
3
4
5
6
7
1/1/2013 1/1/2014 1/1/2015 1/1/2016 1/1/2017
Pro
pan
e,
MM
to
ns
per
mo
nth
Total Supply Total Exports Domestic Demand Source: PotenSource: Poten & Partners
AMERICAS
Source: Poten & Partners
European Ethylene Plant Margins
-100
500
1100
Jun-
15
Jul-1
5
Aug
-15
Sep
-15
Oct
-15
No
v-15
Dec
-15
USD
per
to
n et
hyle
ne
NW EuropeNaphtha
Importedethane, USGCethane basis
Importedethane,naphtha minus100 basis

LPG IN WORLD MARKETS | JAN 2016
©2016 Poten & Partners18
AMERICAS
not growing as rapidly as previously forecast inventory levels are extreme-ly high even for this time of year, giving exporters additional supply to work with. However, the market typically reacts strongly to inventory drawdowns by increasing prices. This brings in another factor of internation-al appetite for potentially higher priced product.
In this section, three scenarios will be examined to see how the supply/demand balance for 2016 and 2017 might fare given two different produc-tion profiles and two different export profiles.
Base CasePoten’s base case forecast for sup-ply, exports and domestic demand is shown in the graph. In this scenario, production from gas plants is forecast to grow slightly in 2016 and 2017, going up by roughly 4 percent each year. These increases are consistent with small increases in natural gas production due to growing demand for LNG exports. As discussed in a previous article, given current drilling economics, the additional production is expected to come from liquids rich areas of the Eagle Ford and Marcellus. This outlook also includes an increase in export volumes consistent with con-tract minimums. There is very little change in refinery propane production in the scenario.
In this and all cases, overall domestic demand increases by a small amount except in the case of demand from propane dehydrogenation (PDH). Enterprise and Dow are both expected to start up their PDH units in Q1 2016, increasing demand for propane by 1.67 million tons per year. Formosa’s PDH unit is expected to start up later in 2016 with another 0.66 million tons of propane demand. Ascend Polymer’s PDH unit will be starting in 2017. In total, these four additional units will add 3.5 million tons of propane demand per year or 290 thousand tons per month. In all these cases, propane
Scenario Production Exports Storage
Low +0.6 +1.9 -6.3
Base +2.8 +4.4 -6.2
High +4.5 +6.3 -4.7
Scenario Summary, Changes 2015-2017, MM tons
Source: Poten & Partners
US Propane Storage Level Forecasts
0.0
1.0
2.0
3.0
4.0
5.0
6.0
7.0
8.0
9.0
1/1/2013 1/1/2014 1/1/2015 1/1/2016 1/1/2017
Sto
rag
e, m
m t
ons
Base Low High
Source: Poten & Partners
dehydrogenation units are assumed to run at 90%.
In the base case, propane exports are expected to increase by 20% in 2016 and by 4% in 2017. This growth will be supported by the increased export terminal capacity recently started at Enterprise, an expansion at Sunoco’s Mariner East terminal, and P66’s new terminal expected to start up in Freeport, TX. Even with this rapid growth in export volumes, however, total utilization of the US LPG export terminal capacity will remain low at roughly 75% and 65% in 2016 and 2017, respectively.
In the base case forecast, strong inventory draws are shown for both 2016 and 2017 to support the higher export volumes. If production of LPG does not resume a stronger growth rate in 2018, export volumes will have to decline to keep storage at a reasonable level. Past data indicate that the lowest level of storage since 2011 was 1.96 million metric tons. At the time, that
level was equal to roughly 18 days of supply. At the end of 2017, a storage level of 1.96 million metric tons will be equal to only 10 days of demand, a much tighter balance.
In addition, the base case assumes that substantial inventory draws are physically possible and will not pose any problems with storage, storage de-livery or brine storage systems. In this estimate, monthly storage draw is at the highest level in 1.28 million tons in one month. The previous record was a withdrawal of 1.09 million tons in one month during the polar vortex at the start of 2014.
Low CaseThe low case is a scenario in which production remains flat, growing by only 1% per year (compared to the base case forecast of 4% per year growth). In this case, the draw down on storage is substantial with a more than 3.0 million metric ton decrease in both 2016 and 2017. At the end

LPG IN WORLD MARKETS | JAN 2016
©2016 Poten & Partners19
AMERICAS
of the forecast period, storage is at 1.96 million metric tons, a very low level in terms of daily demand. As is in the base case, the primary driver behind the storage reductions is the increase in export volumes. Unlike the base case, however, exports cannot remain high for both 2016 and 2017. This scenario assumes a 17% increase in exports in 2016 followed by a 5% decrease in exports in 2017. As shown the graph, there is a sharp decrease in exports associated with this scenario.
High CaseThe US Energy Information Agency (EIA) recently released propane production data for October 2010. According to this data, propane pro-duction from gas plats increased by 6% over the previous month, reaching the highest level on record at 2.92 million tons, 0.1 million tons higher than the previous high of 2.82 million tons set in August 2015. This stubbornly high production number goes against all fundamental indicators for the US energy industry, including but not lim-ited to US October natural gas produc-tion, US October crude oil production, and number of rigs in operation for the previous months.
In the base and low case, October’s production number is considered an outlier with production returning to more reasonable levels in November and beyond. The high case, however, does not treat the figure as an outli-er but rather as a foundation for the growth rate in the remainder of the forecast. In this scenario, production in 2016 increases by 9% over 2015 and production in 2017 increases by 4% over 2016. In this scenario, exports are able to grow at a very rapid rate, increasing by 24% in 2016 and another 10% in 2017.
Despite the higher production, storage levels decrease substantially in this outlook as in the other outlooks. Although a storage level of 3.55 mil-lion tons is much more sustainable, export levels such as those forecast for
US Propane Export Forecast
0.0
0.5
1.0
1.5
2.0
2.5
1/1/2013 1/1/2014 1/1/2015 1/1/2016 1/1/2017
Exp
ort
s, m
m t
ons
Base Low High
Source: Poten & Partners
2017 would not be sustainable for the entire year of 2018.
ConclusionThe analysis in this section is very im-portant to understand the overall US propane market in 2016 and beyond. In all three cases, different export levels can be supported, some higher and some lower. In all three scenarios, storage levels decrease going down to more reasonable if not extremely low levels by the end of 2017.
In each case, however, there is a turning point at which export levels can no longer be supported without additional growth in production. For the low case, that turning point comes in the middle of 2017 when overall storage levels start to approach theo-retical minimums. In the base case, the turning point would occur in early 2018 when increases in production would no longer be enough to sustain the high level of exports. In the high case, that turning point would occur in late 2018.
Of course, reaching these turning points could be entirely theoretical depending on how prices react to the
strong storage withdrawals. The US market tends to react strongly to large decreases in overall storage levels on a week to week basis. With most exports tied to Mt. Belvieu prices, the ability to pass on price increases will be limited by international demand for a high-er priced product. At some point, a balance will be struck between export requirements, storage withdrawals and prices.
Overall, however, the fate of the natu-ral gas and crude oil markets remains key to US propane markets. Without the resumption of growth in pro-duction for those products, US LPG markets were eventually hit hard times with higher prices.

LPG IN WORLD MARKETS | JAN 2016
©2016 Poten & Partners20
APPENDIX
Contract Prices
Propane Butane Propane Butane Propane Butane2015Dec 460 475 355 385 345.5 336.0Nov 395 435 315 380 310.5 357.5Oct 360 365 310 375 307.0 347.5Sep 315 345 265 285 239.5 228.0Aug 365 400 295 300 293.0 286.5Jul 395 425 315 350 330.5 349.5Jun 405 440 310 360 311.5 353.5May 465 475 365 420 381.0 407.0Apr 460 470 375 435 399.5 424.5Mar 500 460 405 470 404.5 438.0Feb 450 480 325 340 315.5 297.5Jan 425 470 340 380 338.5 348.02014Dec 550 570 440 515 465.5 518.0
($/t)FOB Contract Prices
OPIS(SAUDI ARAMCO) (SONATRACH)SAUDI ARABIA ALGERIA NORTH SEA

LPG IN WORLD MARKETS | JAN 2016
©2016 Poten & Partners21
Spot Sales
APPENDIX
Location Deal Date Sale Basis Product Loading Dates
Fixed Floating
Middle East 1-4 Dec FOB c3 44,000 t RNR 16-17 Dec
Asia/Pacific Delivery date
Asia/Pacific 1-4 Dec c3 11,000t/c4 11,000t Jan CP + $60s pmt Jan
Asia/Pacific 1-4 Dec c3 44,000t RNR 16-31 Dec
Asia/Pacific 1-4 Dec c3 44,000t $480pmt Jan
Asia/Pacific 7-11 Dec c3 22,000t $460s pmt 1-15 Jan
Asia/Pacific 7-11 Dec c3 33,000t/c4 11,000t Jan CP + $60s pmt 16-31 Jan
Asia/Pacific 7-11 Dec c3 23,000t Jan CP + $40s pmt 16-31 Jan
Asia/Pacific 7-11 Dec c3 22,000-33,000t MOPJ related 1-15 Jan
Japan 14-18 Dec c3 22,000t Jan CP + $20s pmt 16-31 Jan
China 14-18 Dec c3 33,000t/c4 11,000t Jan FEI related 1-15 Jan
Prices shown are approximate, as reported in the market.
Large Cargoes Spot Sales East
December-2015
Price ($/t)
Middle East

LPG IN WORLD MARKETS | JAN 2016
©2016 Poten & Partners22
APPENDIX
Location Deal Date Sale Basis ProductDelivery Dates
Fixed Floating
NWE Large Cargoes
ARA 1-4 Dec CIF c3 20,500t $375 pmt Dec CIF ARA + $2 pmt Mid Dec
Location Deal Date Sale Basis Product Price ($/t)Loading Dates
Med
Lavera 14-18 Dec FOB c4 2,500t $429 pmt RNR End Dec
Lavera 14-18 Dec FOB c4 2,500t $452 pmt RNR End Dec
Notes: Prices shown are approximate, as reported in the market
Spot Sales WestDecember-2015
Price ($/t)

LPG IN WORLD MARKETS | JAN 2016
©2016 Poten & Partners23
Japan: Butane vs Naphtha NW Europe Cracker FeedstockEconomics: Propane vs Naphtha
Mont Belvieu Cracker FeedstockEconomics: Propane vs Alternatives
Mont Belvieu Cracker FeedstockEconomics: Butane vs Alternatives
LPG Values as Petrochemical Feedstock
APPENDIX
350
450
550
650
750
850
D J F M A M J J A S O N D
Pric
e ($
/t)
Butane Cost (spot CFR)
Feedstock Value (vs Naphtha)
Source: Poten & Partners/Argus
250
350
450
550
650
750
850
950
1050
1150
1250
D J F M A M J J A S O N DPr
ice
($/t
)
Propane Cost (spot CIF)
Feedstock Value (vs Naphtha)
Source: Poten & Partners/Argus
40
60
80
100
120
140
160
180
200
D J F M A M J J A S O N D
Pric
e (c
/g)
Butane Cost
Feedstock Value (vs N. Gasoline)
Feedstock Value (vs Ethane)
Source: Poten & Partners/PCW/Argus
30
50
70
90
110
130
150
170
190
D J F M A M J J A S O N D
Pric
e (c
/g)
Propane Cost (Mt. Belvieu)
Feedstock Value (vs Ethane)
Feedstock Value (vs N. Gasoline)
Source: Poten & Partners/PCW/Argus

LPG IN WORLD MARKETS | JAN 2016
©2016 Poten & Partners24
Market Charter-Hire Rates
APPENDIX
0
500
1000
1500
2000
2500
3000
3500
4000
J F M A M J J A S O N D
78,000 cbm size$'000/month
2013 2014 2015
Source: Poten & Partners
0
500
1000
1500
2000
2500
J F M A M J J A S O N D
57,000-59,000 cbm size$'000/month
2013 2014 2015
Source: Poten & Partners

LPG IN WORLD MARKETS | JAN 2016
©2016 Poten & Partners25
Middle East: Propane vs Arab Light
Middle East: Propane vs Arab Light
Middle East: Butane vs Arab Light
Middle East: Butane vs Arab Light
APPENDIX
60%
80%
100%
120%
140%
160%
180%
D J F M A M J J A S O N D
% o
f AL
Crud
e
2014-2015 (CP)
2014-2015 (spot)
Source: OPIS/Reuters
60%
80%
100%
120%
140%
160%
180%
200%
D J F M A M J J A S O N D
% o
f AL
Crud
e
2014-2015 (CP)
2014-2015 (spot)
Source: OPIS/Reuters
60%
80%
100%
120%
140%
160%
180%
200%
J F M A M J J A S O N D
% o
f AL
Crud
e
2014 (CP) 2015 (CP)
Source: OPIS/Reuters
60%
80%
100%
120%
140%
160%
180%
J F M A M J J A S O N D
% o
f AL
Crud
e
2014 (CP) 2015 (CP)
Source: OPIS/Reuters

LPG IN WORLD MARKETS | JAN 2016
©2016 Poten & Partners26
Asia / Pacific
APPENDIX
(a) Abu Dhabi, Dubai and Sharjah. (b) Includes East Timor exports (c) Per Ministry of Finance (d) Excludes strategic stockpile. Average
Import Origin 2014 H1 2015 Jul Aug Sep Oct Nov Dec H2 2015
Saudi Arabia 1,409 729 50 113 42 36 66 308
Iran - - - - - - - 0
Kuwait 1,379 658 64 103 35 44 158 404
Qatar 3,256 1,396 125 147 171 185 205 834
UAE (a) 2,660 1,196 208 103 233 274 181 999
Middle East 8,704 3,980 448 467 481 539 610 2,545 -
Australia (b) 858 340 16 34 65 85 98 299
USA 1,543 1,300 143 189 122 136 199 788
Other Areas 516 334 113 64 25 73 78 353
TOTAL (c) 11,622 5,954 720 754 694 833 985 3,985
Propane 9,131 4,866 573 593 564 680 795 3,204
Butane 2,454 1,087 148 161 130 153 190 781
Japan LPG Imports in 2015('000t)
2014 H1 2015 Jul Aug Sep Oct Nov Dec H2 2015
Import Supply 11,585 5,953 720 754 694 833 985 3,985
Domestic Supply
2,487 1,046 244 260 234 148 126 1,012
TOTAL SUPPLY 14,072 6,999 964 1,014 928 981 1,111 4,997
LESS DEMAND 13,659 6,694 941 851 913 1,008 1,031 4,744
Operable Inventory (d)
823 228 408 559 468 336 360 426
Japan LPG Supply/Demand in 2015
('000t)

LPG IN WORLD MARKETS | JAN 2016
©2016 Poten & Partners27
Japan LPG vs Alternatives CFR Basis
Japan Prices
APPENDIX
Yen/MT $ per ton Y/$ rateOctober 48,120 401 120November 53,460 436 123December 60,210 495 122
Naphtha Butane PremiumOctober 456 454 -2November 453 494 42December 421 414 -7
versus Crude Oil LNGOctober 112% 139%November 131% 141%December 129% 120%
LPG: Average Import Cost (CFR basis)
Butane vs Naphtha: CFR Cost
LPG Price Premium (on BTU basis)
Japan LPG Import Costs
0
2
4
6
8
10
12
14
D J F M A M J J A S O N D$/
mm
BTU
LPG Import Cost
LNG Import Cost
Crude Oil Import Cost
Source: OPIS/Platts/Reuters
80%
85%
90%
95%
100%
105%
110%
115%
120%
D J F M A M J J A S O N D
Pric
e ($
/t)
naphtha-propane ratio
Naphtha-butane ratio
Source: OPIS/Reuters

LPG IN WORLD MARKETS | JAN 2016
©2016 Poten & Partners28
Japan: Operable Propane Inventories Japan: Operable Butane Inventories
Japan: Butane DemandJapan: Propane Demand
APPENDIX
0.0
0.1
0.2
0.3
0.4
0.5
0.6
J F M A M J J A S O N D
Inve
ntor
ies (
mm
t)
2015
2013
2014
Source: RIM Intelligence
0.0
0.1
0.2
0.3
0.4
J F M A M J J A S O N D
Inve
ntor
ies (
mm
t)
2015
2013
2014
Source: RIM Intelligence
0.6
0.7
0.8
0.9
1.0
1.1
1.2
1.3
J F M A M J J A S O N D
Dem
and
(mm
t/m
onth
)
2015
2013
2014
Source: RIM Intelligence
0.0
0.1
0.2
0.3
0.4
0.5
J F M A M J J A S O N D
Dem
and
(mm
t/m
onth
)
2015
2013
2014
Source: RIM Intelligence

LPG IN WORLD MARKETS | JAN 2016
©2016 Poten & Partners29
APPENDIX
2014 H1 2015 Jul Aug Sep Oct Nov Dec H2 2015
South China 55% 48% 38% 44% 40% 40% 45%
East China 36% 39% 47% 46% 45% 45% 41%
North China 10% 13% 15% 10% 15% 15% 14%
Total 7,096 4,995 1,326 1,134 1,102 1,224 990 - 5,777
Korea 89 33 2 4 5 5 2 18
Malaysia 86 88 2 53 0 0 0 55
elsewhere 114 74 22 1 0 13 7 42
Australia 83 38 89 22 45 0 0 156
Middle East
Iran - - - - - - - 0
Kuwait 614 193 57 79 181 68 157 541
Qatar 573 115 195 114 23 161 135 628
Saudi Arabia 356 232 54 84 93 66 70 366
UAE 3,686 2,474 414 588 375 439 459 2,275
USA 757 1,281 344 68 246 414 114 1,185
West Africa 308 259 52 67 87 36 46 288
Elsewhere 428 207 96 55 47 23 0 221
SubTotal 7,096 4,995 1,326 1,134 1102 1224 990 0 5,777
less Exports
to Vietnam 303- -241 -32 -39 -39 -16 -57 -182
to Philippines 413- -196 -32 -27 -28 -46 -58 -191
elsewhere 712- -251 -37 -55 -26 -52 -36 -206
SubTotal 1,427- -688 -101 -120 -93 -114 -151 0 -578
Net Imports 4307 1226 1014 1009 1110 839 0 5,198
Distant Sources (mainly refrig.)
China LPG Imports in 2015
('000t)
Import Destination
Import Origin
Nearby Sources (mainly pressure)

LPG IN WORLD MARKETS | JAN 2016
©2016 Poten & Partners30
NW Europe: Propane vs Naphtha NW Europe: Butane vs Naphtha
NW Europe: Propane vs Naphtha NW Europe: Propane - Naphtha Spread
Europe
APPENDIX
220
320
420
520
620
720
820
920
D J F M A M J J A S O N D
Pric
es ($
/t)
Propane Spot CIF
Propane North SeaContract FOB (OPIS)
Naphtha Spot
Source: OPIS/Argus
220
320
420
520
620
720
820
920
D J F M A M J J A S O N DPr
ices
($/t
)
Butane Spot CIF
Butane North Sea ContractFOB (OPIS)
Naphtha Spot
Source: OPIS/Argus
60%
65%
70%
75%
80%
85%
90%
D J F M A M J J A S O N D
Prop
ane
vs N
apht
ha (%
, wei
ght b
asis
)
Source: OPIS/ArgusSource: OPIS/Argus
-200
-180
-160
-140
-120
-100
-80
-60
-40
-20
0D J F M A M J J A S O N D
Prop
ane
-Nap
htha
(t)
Source: OPIS/Argus

LPG IN WORLD MARKETS | JAN 2016
©2016 Poten & Partners31
Mediterranean: Propane Prices Mediterranean: Butane Prices
APPENDIX
250
350
450
550
650
750
850
D J F M A M J J A S O N D
Pric
es ($
/t)
SP CIF Lavera (Large Cargoes)
Source: OPIS/Argus
250
350
450
550
650
750
850
D J F M A M J J A S O N D
Pric
es ($
/t)
SP CIF Lavera (Large Cargoes)
Source: OPIS/Argus

LPG IN WORLD MARKETS | JAN 2016
©2016 Poten & Partners32
USAUS Propane Inventories US Butane Inventories
US Gulf: LPG Prices US Gulf: Prices vs Crude
APPENDIX
0.5
1.5
2.5
3.5
4.5
5.5
6.5
7.5
8.5
J F M A M J J A S O N D
Inve
ntor
ies (
mm
t)
2014
2015
Source: EIA
0.0
1.0
2.0
3.0
4.0
5.0
6.0
7.0
J F M A M J J A S O N DIn
vent
orie
s (m
m t)
2014
2015
Source: EIA
0
10
20
30
40
50
60
70
80
D J F M A M J J A S O N D
Pric
es (c
/g)
Propane
N-Butane
i-butane
Source: Argus
25%
35%
45%
55%
65%
75%
85%
95%
D J F M A M J J A S O N D
Pric
es (%
WTI
, vol
bas
is)
Propane Butane
Source: Argus/Reuters