Production Efficiency in Ukrainian Agriculture and the ... · PRODUCTION EFFICIENCY IN UKRAINIAN...
25
Production Efficiency in Ukrainian Agriculture and the Process of Economic Reform Lyubov A. Kurkalova and Helen H. Jensen Working Paper 96-WP 167 October 1996 Center for Agricultural and Rural Development Iowa State University Ames, Iowa 50011 Lyubov A. Kurkalova is a CARD graduate research assistant; and Helen H. Jensen is a professor of economics and head of the Food and Nutrition Policy Division, CARD. An earlier version of this paper was presented at the American Agricultural Economics Association meetings, San Antonio, TX, July 1996. We acknowledge assistance from Dr. Peter Sabluk, formerly director of the Ukrainian Agricultural Economics Institute, for the collection and use of the data; S.R. Johnson for advice in interpreting changing conditions in Ukraine’s agricultural sector; and Alicia Carriquiry and Peter Orazem for useful advise at earlier stages of the research. Partial funding for this research came from USDA/OICD under Agreement No. 58-319R-4-009 and USDA/CSREES under Agreement No. 92-38812-7261. Journal Paper No. J-17036 of the Iowa Agriculture and Home Economics Experiment Station, Ames, Iowa. Project No. 2865, and supported by Hatch Act and State of Iowa funds.
-
Upload
nguyenduong -
Category
Documents
-
view
224 -
download
1
Transcript of Production Efficiency in Ukrainian Agriculture and the ... · PRODUCTION EFFICIENCY IN UKRAINIAN...
Production Efficiency in Ukrainian Agriculture and the Process of Economic Reform Lyubov A. Kurkalova and Helen H. Jensen Working Paper 96-WP 167 October 1996 Center for Agricultural and Rural Development Iowa State University Ames, Iowa 50011 Lyubov A. Kurkalova is a CARD graduate research assistant; and Helen H. Jensen is a professor of economics and head of the Food and Nutrition Policy Division, CARD. An earlier version of this paper was presented at the American Agricultural Economics Association meetings, San Antonio, TX, July 1996. We acknowledge assistance from Dr. Peter Sabluk, formerly director of the Ukrainian Agricultural Economics Institute, for the collection and use of the data; S.R. Johnson for advice in interpreting changing conditions in Ukraine’s agricultural sector; and Alicia Carriquiry and Peter Orazem for useful advise at earlier stages of the research. Partial funding for this research came from USDA/OICD under Agreement No. 58-319R-4-009 and USDA/CSREES under Agreement No. 92-38812-7261. Journal Paper No. J-17036 of the Iowa Agriculture and Home Economics Experiment Station, Ames, Iowa. Project No. 2865, and supported by Hatch Act and State of Iowa funds.
Abstract
A representative sample of 49 state and collective farms in Ukraine provides data in physical
units on livestock and crop production and input use for 1989-92. The changes in production
efficiency for beef, pork, dairy, winter wheat, grain, and potato production, investigated using
stochastic frontier methods, show declining technical efficiency in livestock production and especially
low marginal contribution of labor inputs. The number of workers, size of farm, and distance from
nearest city are related to efficiency in agricultural production.
Keywords: technical efficiency, panel data, economies in transition, frontier production function

PRODUCTION EFFICIENCY IN UKRAINIAN AGRICULTURE AND THE PROCESS OF REFORM
The economic reform in the countries of the former Soviet Union (FSU) has been accompanied
by policy uncertainty and structural adjustment as governments have freed prices, introduced private
property, and left production and distribution more to the forces of supply and demand (Csáki, 1990).
In general, the reforms have resulted in an initial sharp decline in production and consumption levels
and in productivity. Adjustments in agriculture have been of particular importance because of the
major roles of food and agricultural subsidies during the planning era and for some countries,
including Ukraine, the agricultural sector had a large share of aggregate output and labor.
Input prices in agriculture have increased sharply compared with output prices (because of both
continuing state control and decreasing food demand) and have resulted in declining output levels and
farm incomes (ERS, 1992). In addition, high nominal interest rates, decreased farm income, and
uncertainties about the pace of the economic restructuring have reduced farm investment.
Governments in the FSU have introduced short-term adjustment policies to stabilize farm income and
food production and longer term initiatives to address issues related to privatization, the presence of
monopolies, monetary and fiscal stabilization, enhancement of trade, and the creation of markets.
There is relatively little empirical work, however, to support the restructuring and development of new
agricultural policies.
There has been considerable work done on applications of frontier methods in agriculture (see
Battese, 1992; Bravo-Ureta and Pinheiro, 1993; Coelli, 1995). However, very little research exists on
the efficiency of agriculture in the formerly planned economies. Data have been limited, especially at
the farm level. Much of the work on efficiency in agriculture has been limited to analysis of highly
aggregated data (Johnson and Brooks, 1983; Koopman, 1989). A few recent studies exist that use
more disaggregated data to study production efficiency (e.g., Brada and King, 1992; Johnson et al.,
1994).
Although the availability of the official state and collective farm (census) data observed at the
individual farm level provides a rich source of information about the process of reform, much of the
input information is inadequate for production analysis; inputs, except for land and labor, are reported
��
��
only in rubles. Because of the complex system of subsidies, bonuses, and other price distortions, there
is considerable error introduced when researchers are forced to rely on these proxies for physical
amounts of inputs. For a better understanding of technical efficiency, additional information on
physical input use by agricultural ouput is required. Also, other variables, such as characteristics of the
farm manager and farm management system, experience of managers and distance from supply and
distribution points, can enhance the understanding of farm production efficiency (Battese and Coelli,
1992; Brock, 1994).
This paper uses farm-level data to evaluate changes in production and input use and investigates
production efficiency in Ukraine�s agriculture. We focus on three livestock products� beef, pork, and
dairy� and three crops�winter wheat, total grain, and potatoes. Data came from a random survey of
49 state and collective farms in Ukraine during 1989-92. We take advantage of the detailed input and
output data reported in physical units to evaluate changes in production efficiency and factors
associated with efficiency in production during this recent period. The detail allows a unique
opportunity to consider changes in Ukraine�s agricultural sector.
�
Data and Farm Structure
A small survey of state and collective farms in Ukraine was conducted in 1992 to initiate a
detailed analysis of agricultural production efficiency. The survey was designed as a random sample
of state and collective farms across agro-climatic zones and was stratified by farm size. The Ukrainian
Institute for Agrarian Economics (UIAE) supervised the administration of the survey. Of the original
80 farms surveyed, data for 49 from two administrative regions, Kyivska oblast and Cherkaska oblast
of the mixed agro-climatic zone (the middle zone), were complete and used for this analysis. (See
UIAE 1993, available from the authors, for more details on the survey.)
Descriptive Statistics
Descriptive farm-level statistics (Table 1) show the 49 farms to be representative of the region.
The average farm size in 1989 was 2,470.7 hectares of agricultural land with 399 farm workers, 342 of
whom were engaged in agricultural production, and 381 pensioners. The changes over the next four
years were rather dramatic, although typical of Ukraine’s agricultural sector. Agricultural land
declined an average of 8.5 percent over the period. There was also a decline in the total number of
��
��
farm and agricultural workers: down 11 percent and 12 percent. The changes in agricultural land and
labor led to an increase of almost 5 percent in the ratio of agricultural land per agricultural worker.
The number of pensioners increased by 2.6 percent over the period.
The restructuring of farms seems mostly due to growth of individual subsidiary plots of state
and collective farm members and to the appearance of independent private farms, which started to
emerge after 1990 (World Bank, 1994; UIAE, 1992). The decrease in the working population on the
farms can be attributed to young people leaving farms and going into cities and retired workers
remaining on the farms. This tendency started long before the break-up of the Soviet Union and is
mentioned, for example, in recent sector reports by the World Bank (1994) and the UIAE (1992). The
UIAE (1992) reports that the rural population of the two administrative regions represented in the data
declined by more than 22 percent from 1970 to 1990.
Productivity Indicators
Tables 2 and 3 show the production and input use in livestock and crop production in the survey
data. Compared with productivity calculations in other countries, Ukraine shows relatively greater
feed use in all areas of livestock than that of European Union countries, although Ukraine was more
efficient than many other FSU countries (World Bank, 1994).
Within Ukraine, farms were provided technological coefficients for input use and output, based
on the scientific norms or recommendations of specialists (UIAE, 1994). These recommendations
targeted higher yields in crop production and higher output per animal in livestock production. There
was no profit/cost efficiency taken into account. We compared the reported numbers to the
technological norms to evaluate average efficiency and quality of the data.
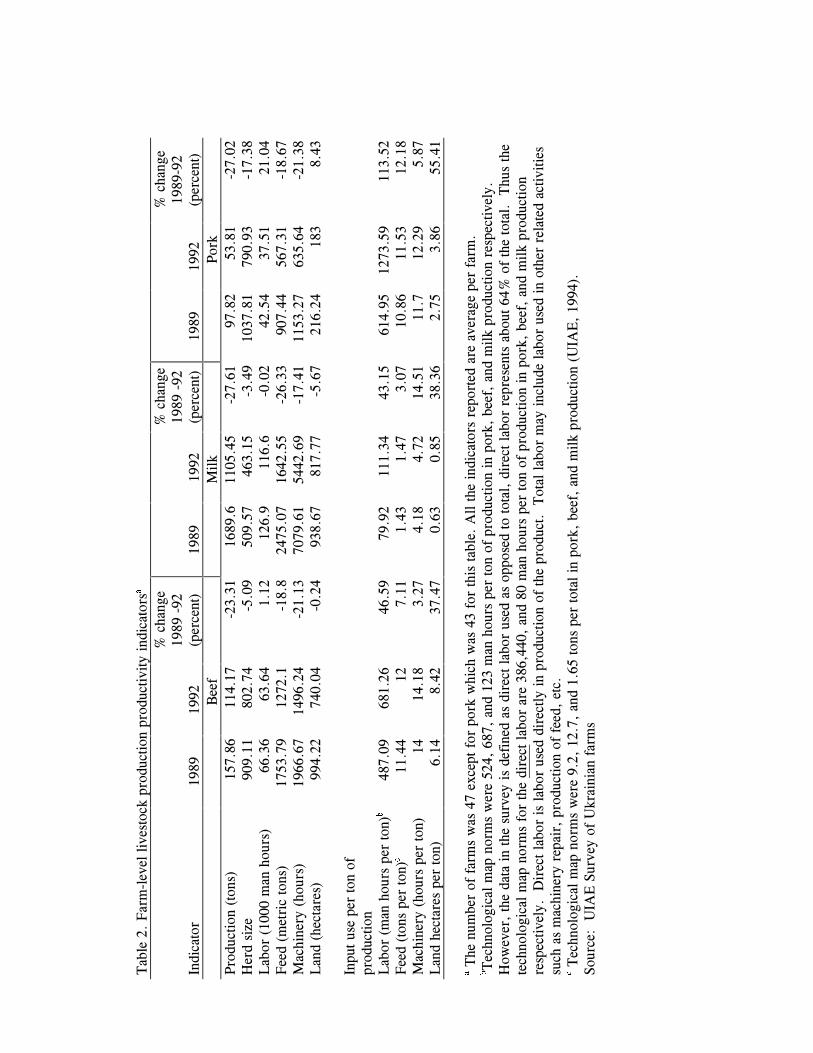
The technological coefficients for livestock are reported in Table 2. For beef, the data from the
surveyed farms showed production declined over the four years by about 23 percent and herd size
decreased by 5 percent. The input use was similar to use reported in aggregate Ukraine data for the
region (World Bank, 1994). The labor and feed use did not differ significantly from the technological
norms (coefficients). The reported labor use in beef production was somewhat higher; however,
reported feed use stayed lower than that prescribed (varying from 11.3 to 12 as opposed to the norm of
12.7 tons/ton of output).
��
��
Pork production declined an average of 27 percent over the four-year period, and this was
accompanied by a large change in the input use rate: herd size, feed, and machinery all declined, and
labor use increased by about 20 percent. These changes are consistent with other unpublished
numbers for Ukraine. The data show that the farms used considerably more labor per ton of
production than technological norms. The farms also used more feed than the technical
recommendations (11 to 12 tons/ton of output, as opposed to 9.2 tons/ton of output as prescribed).
The average decline in milk production was about 27.6 percent and this was accompanied by
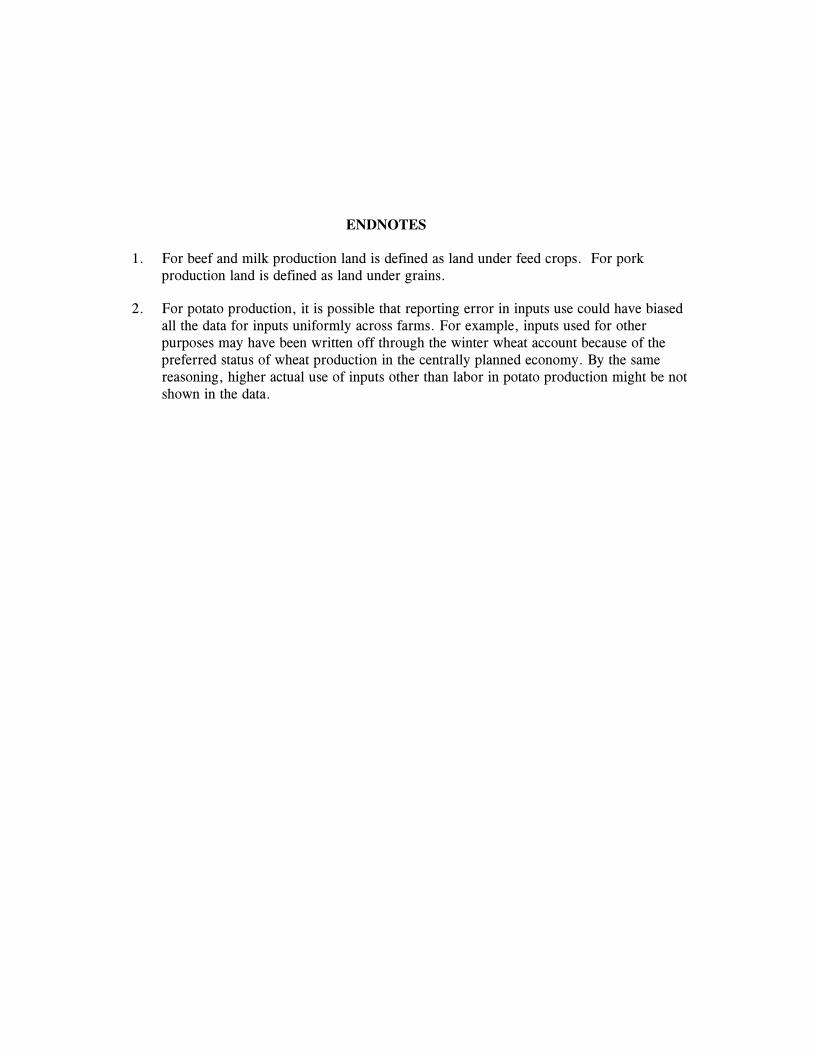
similar declines in feed and machinery and smaller declines in herd size, land,1 and nearly stable labor
use. Labor and feed use followed the same pattern as beef, relative to the norms: labor use was
greater than the technological coefficients and increased by 43 percent over the period; feed use per
ton of production stayed below the norm of 1.65 tons/ton of production.
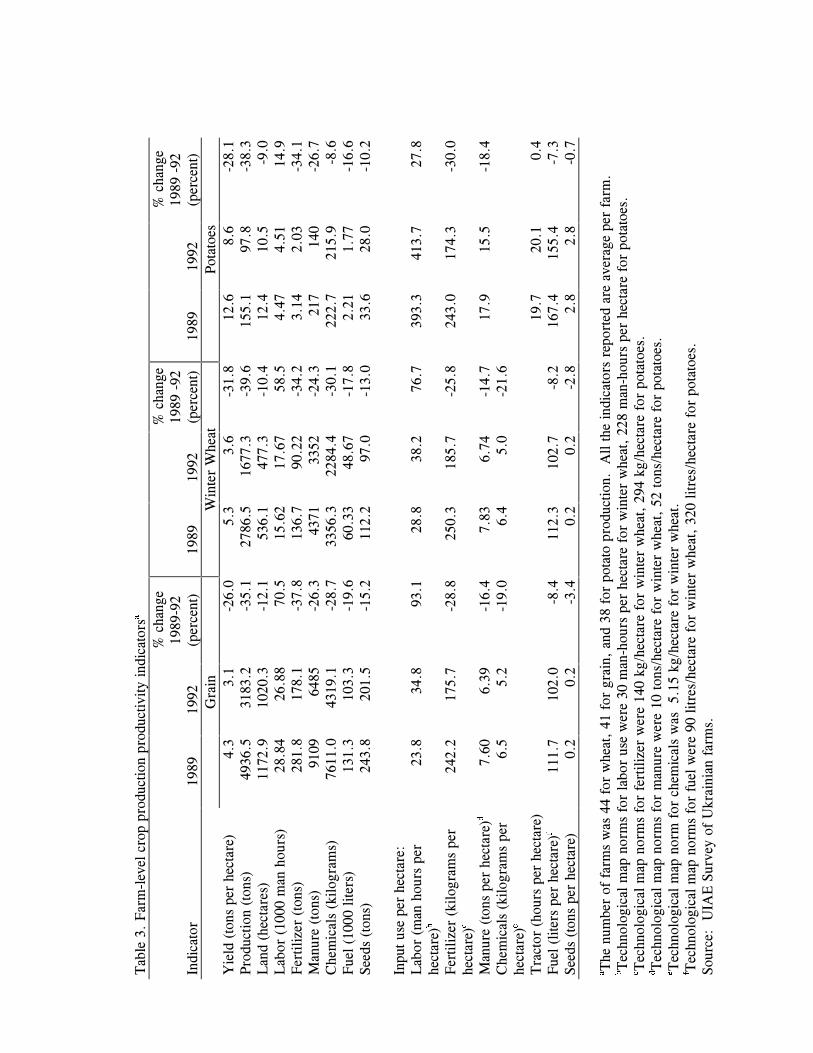
The trends in crop production were similar to those in livestock production as shown in Table 3.
On average, total grain production declined by 35 percent over the four years; however, the area
under grains declined by only 12 percent. The area under grains relative to total agricultural land
remained relatively stable and constituted slightly less than 50 percent of the farms’ total agricultural
land. The greatest decline in inputs application was for fertilizer, down 37.8 percent; chemicals, down
28.7 percent; and manure, down 26.3 percent. Other inputs showed large declines as well. Smaller
declines occurred in application of fuel and seeds. The change in labor use was in the opposite
direction and rather dramatic: total labor application increased by more than 70 percent over the four
years.
Winter wheat constituted slightly less than one-half the area under grains. The trends in
production and input use were very similar to those for total grain: the decline in production of 39.6
percent was accompanied by a moderate decline in land of 10.4 percent, an increase in labor
application, and a decline in other input use, in percentages similar to those for grains.
Changes in potato production followed the same general pattern as for grains: a 38.3 percent
decline in production accompanied by a decline in fertilizer application and smaller declines in other
inputs. Labor use increased by only 14.9 percent.
Technological map coefficients for winter wheat and potatoes were available in input use per
hectare. Labor use per hectare in winter wheat production was below the norm of 30 man-hours per
hectare in 1989 and increased to 38.2 man-hours per hectare in 1992. Fertilizer application has been
��
��
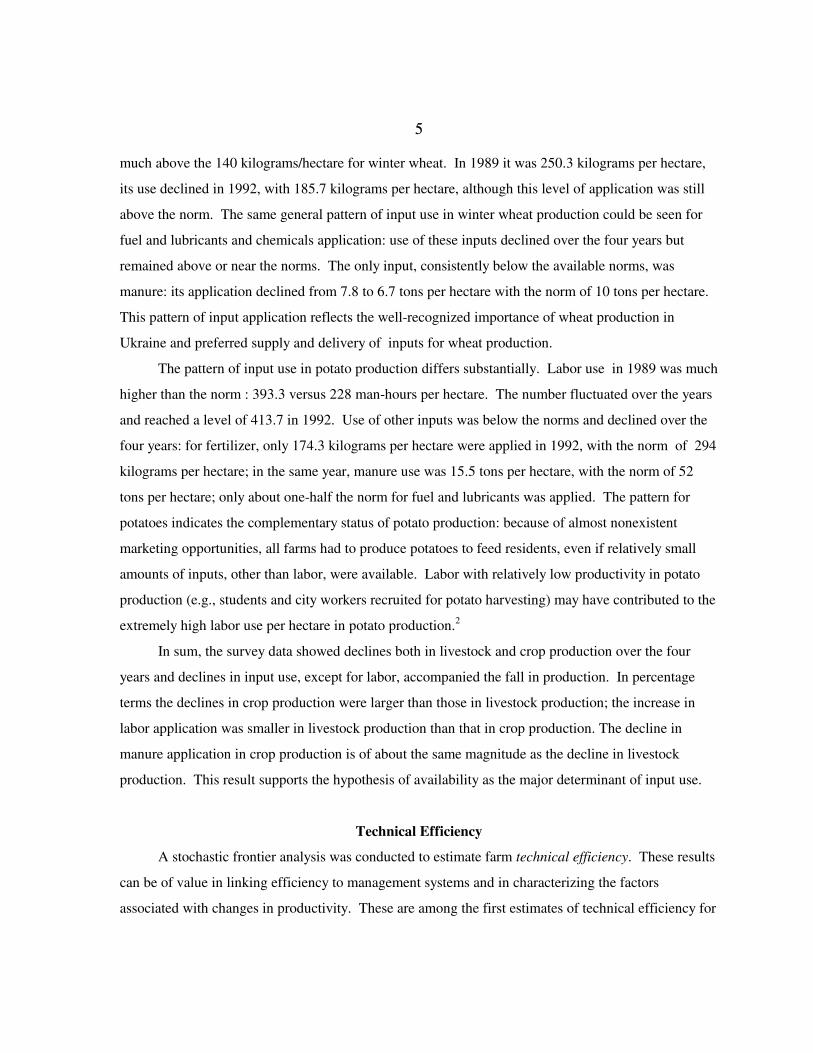
much above the 140 kilograms/hectare for winter wheat. In 1989 it was 250.3 kilograms per hectare,
its use declined in 1992, with 185.7 kilograms per hectare, although this level of application was still
above the norm. The same general pattern of input use in winter wheat production could be seen for
fuel and lubricants and chemicals application: use of these inputs declined over the four years but
remained above or near the norms. The only input, consistently below the available norms, was
manure: its application declined from 7.8 to 6.7 tons per hectare with the norm of 10 tons per hectare.
This pattern of input application reflects the well-recognized importance of wheat production in
Ukraine and preferred supply and delivery of inputs for wheat production.
The pattern of input use in potato production differs substantially. Labor use in 1989 was much
higher than the norm : 393.3 versus 228 man-hours per hectare. The number fluctuated over the years
and reached a level of 413.7 in 1992. Use of other inputs was below the norms and declined over the
four years: for fertilizer, only 174.3 kilograms per hectare were applied in 1992, with the norm of 294
kilograms per hectare; in the same year, manure use was 15.5 tons per hectare, with the norm of 52
tons per hectare; only about one-half the norm for fuel and lubricants was applied. The pattern for
potatoes indicates the complementary status of potato production: because of almost nonexistent
marketing opportunities, all farms had to produce potatoes to feed residents, even if relatively small
amounts of inputs, other than labor, were available. Labor with relatively low productivity in potato
production (e.g., students and city workers recruited for potato harvesting) may have contributed to the
extremely high labor use per hectare in potato production.2
In sum, the survey data showed declines both in livestock and crop production over the four
years and declines in input use, except for labor, accompanied the fall in production. In percentage
terms the declines in crop production were larger than those in livestock production; the increase in
labor application was smaller in livestock production than that in crop production. The decline in
manure application in crop production is of about the same magnitude as the decline in livestock
production. This result supports the hypothesis of availability as the major determinant of input use.
Technical Efficiency
A stochastic frontier analysis was conducted to estimate farm technical efficiency. These results
can be of value in linking efficiency to management systems and in characterizing the factors
associated with changes in productivity. These are among the first estimates of technical efficiency for
��
��
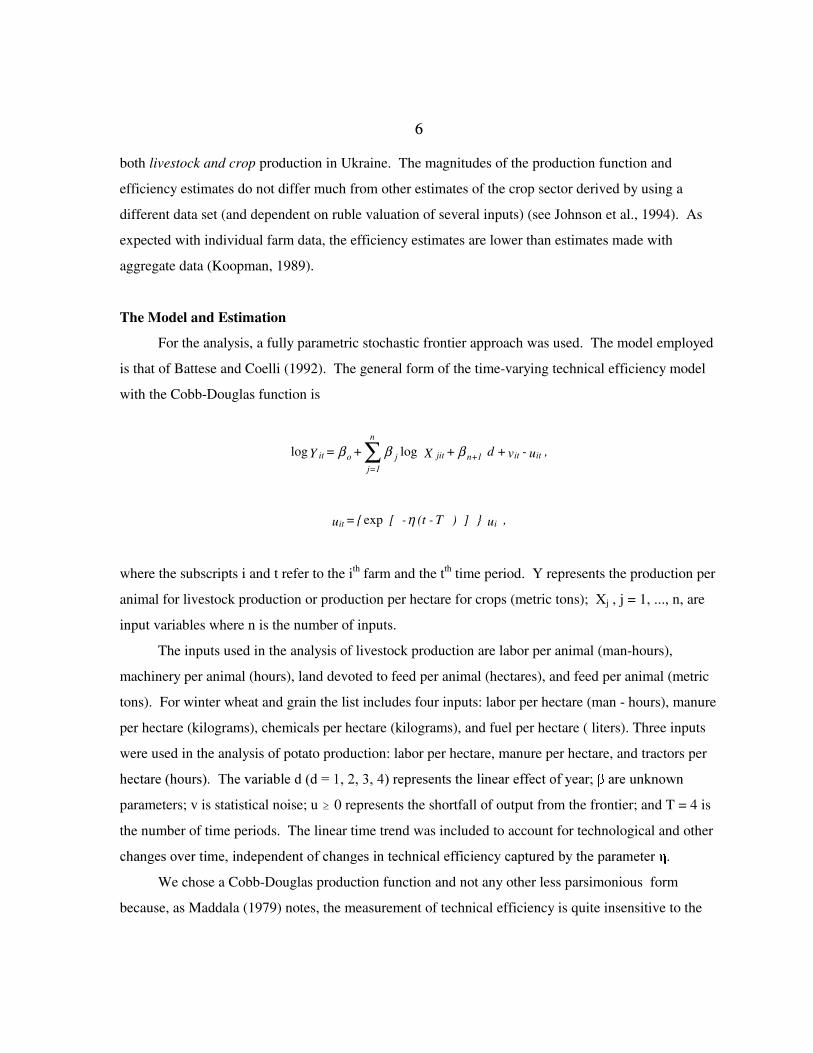
both livestock and crop production in Ukraine. The magnitudes of the production function and
efficiency estimates do not differ much from other estimates of the crop sector derived by using a
different data set (and dependent on ruble valuation of several inputs) (see Johnson et al., 1994). As
expected with individual farm data, the efficiency estimates are lower than estimates made with
aggregate data (Koopman, 1989).
The Model and Estimation
For the analysis, a fully parametric stochastic frontier approach was used. The model employed
is that of Battese and Coelli (1992). The general form of the time-varying technical efficiency model
with the Cobb-Douglas function is
where the subscripts i and t refer to the ith farm and the tth time period. Y represents the production per
animal for livestock production or production per hectare for crops (metric tons); Xj , j = 1, ..., n, are
input variables where n is the number of inputs.
The inputs used in the analysis of livestock production are labor per animal (man-hours),
machinery per animal (hours), land devoted to feed per animal (hectares), and feed per animal (metric
tons). For winter wheat and grain the list includes four inputs: labor per hectare (man - hours), manure
per hectare (kilograms), chemicals per hectare (kilograms), and fuel per hectare ( liters). Three inputs
were used in the analysis of potato production: labor per hectare, manure per hectare, and tractors per
������������� ����������������������������������������������������������������������� �������� ��
parameters; v is statistical noise; u � 0 represents the shortfall of output from the frontier; and T = 4 is
the number of time periods. The linear time trend was included to account for technological and other
����!���������"���������������������!����������������������������������������������"����� ��
We chose a Cobb-Douglas production function and not any other less parsimonious form
because, as Maddala (1979) notes, the measurement of technical efficiency is quite insensitive to the
,u - v + d + X + = Y itit1+njitj
n
1=joit βββ loglog ∑ �
,u } ] ) T - (t - [ { = u iit ηexp �
��
��
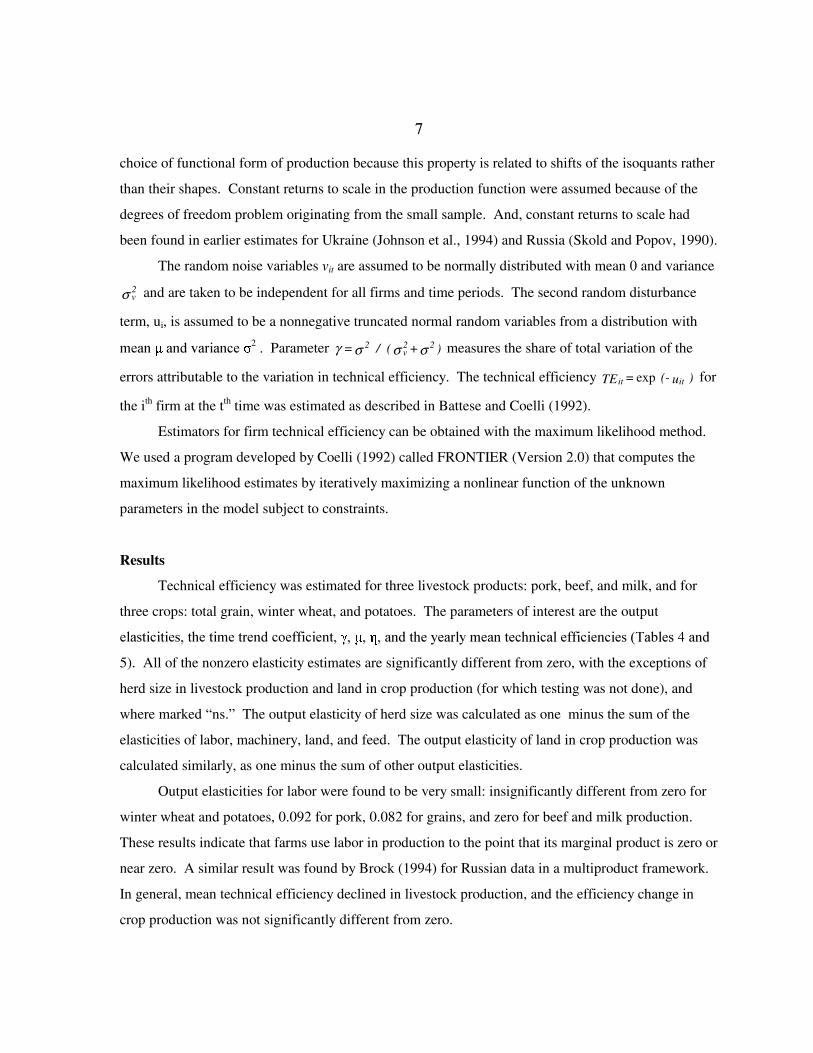
choice of functional form of production because this property is related to shifts of the isoquants rather
than their shapes. Constant returns to scale in the production function were assumed because of the
degrees of freedom problem originating from the small sample. And, constant returns to scale had
been found in earlier estimates for Ukraine (Johnson et al., 1994) and Russia (Skold and Popov, 1990).
The random noise variables vit are assumed to be normally distributed with mean 0 and variance
σ 2v and are taken to be independent for all firms and time periods. The second random disturbance
term, ui, is assumed to be a nonnegative truncated normal random variables from a distribution with
"���� �������������� 2 . Parameter ) + ( / = 22v
2 σσσγ measures the share of total variation of the
errors attributable to the variation in technical efficiency. The technical efficiency ) u (- = TE itit exp for
the ith firm at the tth time was estimated as described in Battese and Coelli (1992).
Estimators for firm technical efficiency can be obtained with the maximum likelihood method.
We used a program developed by Coelli (1992) called FRONTIER (Version 2.0) that computes the
maximum likelihood estimates by iteratively maximizing a nonlinear function of the unknown
parameters in the model subject to constraints.
Results
Technical efficiency was estimated for three livestock products: pork, beef, and milk, and for
three crops: total grain, winter wheat, and potatoes. The parameters of interest are the output
��������������������"�������������������� �� �� �����������������"�����������������������������������������
5). All of the nonzero elasticity estimates are significantly different from zero, with the exceptions of
herd size in livestock production and land in crop production (for which testing was not done), and
where marked “ns.” The output elasticity of herd size was calculated as one minus the sum of the
elasticities of labor, machinery, land, and feed. The output elasticity of land in crop production was
calculated similarly, as one minus the sum of other output elasticities.
Output elasticities for labor were found to be very small: insignificantly different from zero for
winter wheat and potatoes, 0.092 for pork, 0.082 for grains, and zero for beef and milk production.
These results indicate that farms use labor in production to the point that its marginal product is zero or
near zero. A similar result was found by Brock (1994) for Russian data in a multiproduct framework.
In general, mean technical efficiency declined in livestock production, and the efficiency change in
crop production was not significantly different from zero.

��
��
In beef production, the estimated elasticity of machinery was 0.538. The largest decline in input
use was also in machinery: 21.13 percent. The labor elasticity was zero, and feed and land use
elasticities were relatively small. Both the time trend and efficiency change coefficients were negative,
and a joint test that they equal zero was rejected at the 5 percent level. For beef production, mean
technical efficiency steadily declined slightly over the four years from 0.606 in 1989 to 0.599 in 1992.
For milk production, the highest elasticity estimated among inputs was for feed: 0.515. As in
beef production, the labor elasticity was zero and both the time trend and efficiency change
coefficients were negative and jointly significant at the 5 percent level. Mean technical efficiency
declined over the four years from 0.748 in 1989 to 0.714 in 1992.
The estimates for pork production were the most difficult to obtain. There may have been some
problems in the measurement of inputs, especially related to feed use. The data on land and feed use
in pork production were highly correlated; therefore, only feed data were used in estimation. That
means the feed elasticity reported (0.259) captures the effect of both land and feed in production. The
estimated elasticity of 0.647 for machinery is rather high. This may be because the largest decline in
input use was for machinery. The linear time trend coefficient was negative, but the change in
efficiency over time was positive. Testing that the linear time trend and the change in efficiency over
time were both zero was rejected at the 5 percent level. Mean technical efficiency was about 0.34 and
increased from 1989-91, then declined in 1992.
Winter wheat represented an average of 54 percent of total production of grain and utilized
about 44.5 percent of the total land under grain. As expected, the production function estimates for
grain and winter wheat do not differ much. Output elasticities for labor were low, and for winter
wheat, estimated to be not statistically different from zero. The highest elasticity among inputs was for
fuel: 0.484 for grain and 0.356 for winter wheat. This elasticity presumably reflects the contribution of
machinery inputs into production; in fact, for all three crops, data on fuel and machinery utilization (in
hours) were highly correlated. Elasticities for manure and chemicals were similar, in the range of 0.14
to 0.20. In potato production, again the labor elasticity was not statistically different from zero. The
highest output elasticity obtained (though insignificant) was for tractors: 0.213.
The time trend was negative and significantly different from zero for all three crops. The
��������������� ���#����� ���#������������$��������������������������!!�����!����������������� ���
��
�
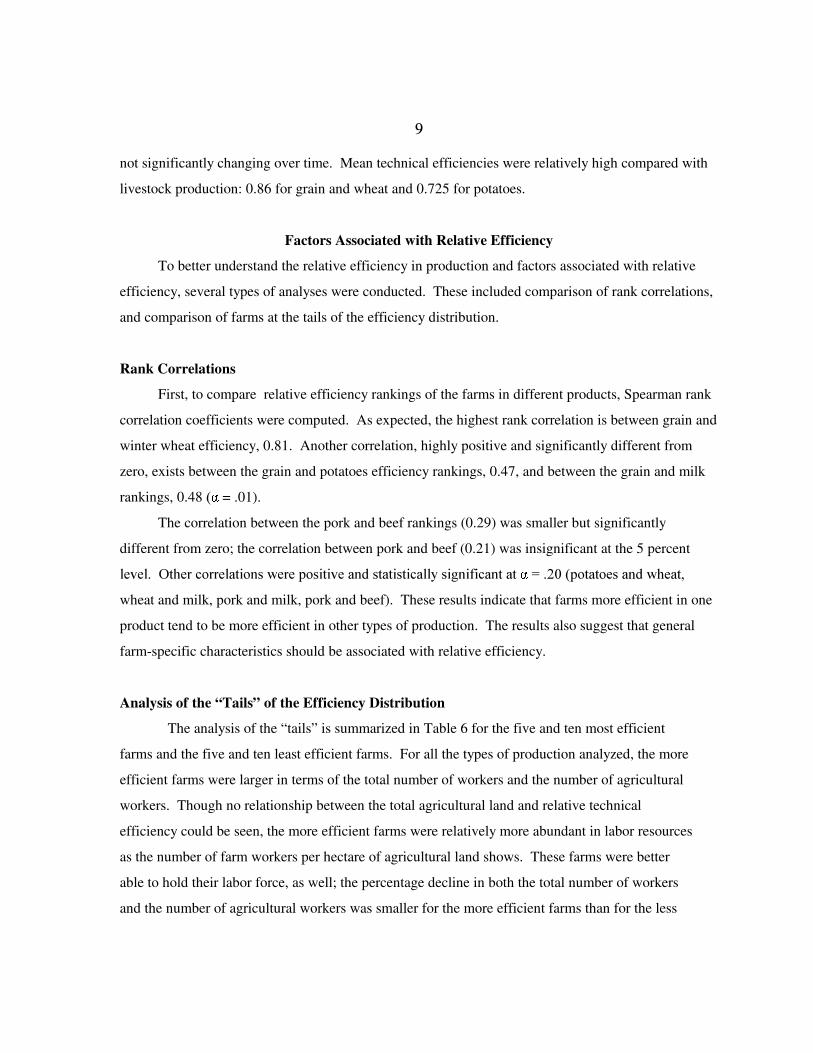
not significantly changing over time. Mean technical efficiencies were relatively high compared with
livestock production: 0.86 for grain and wheat and 0.725 for potatoes.
Factors Associated with Relative Efficiency
To better understand the relative efficiency in production and factors associated with relative
efficiency, several types of analyses were conducted. These included comparison of rank correlations,
and comparison of farms at the tails of the efficiency distribution.
Rank Correlations
First, to compare relative efficiency rankings of the farms in different products, Spearman rank
correlation coefficients were computed. As expected, the highest rank correlation is between grain and
winter wheat efficiency, 0.81. Another correlation, highly positive and significantly different from
zero, exists between the grain and potatoes efficiency rankings, 0.47, and between the grain and milk
rankings, 0.48 � = .01).
The correlation between the pork and beef rankings (0.29) was smaller but significantly
different from zero; the correlation between pork and beef (0.21) was insignificant at the 5 percent
����� ��%���������������� ��������������������������������!������������ ��� �#������������� ������
wheat and milk, pork and milk, pork and beef). These results indicate that farms more efficient in one
product tend to be more efficient in other types of production. The results also suggest that general
farm-specific characteristics should be associated with relative efficiency.
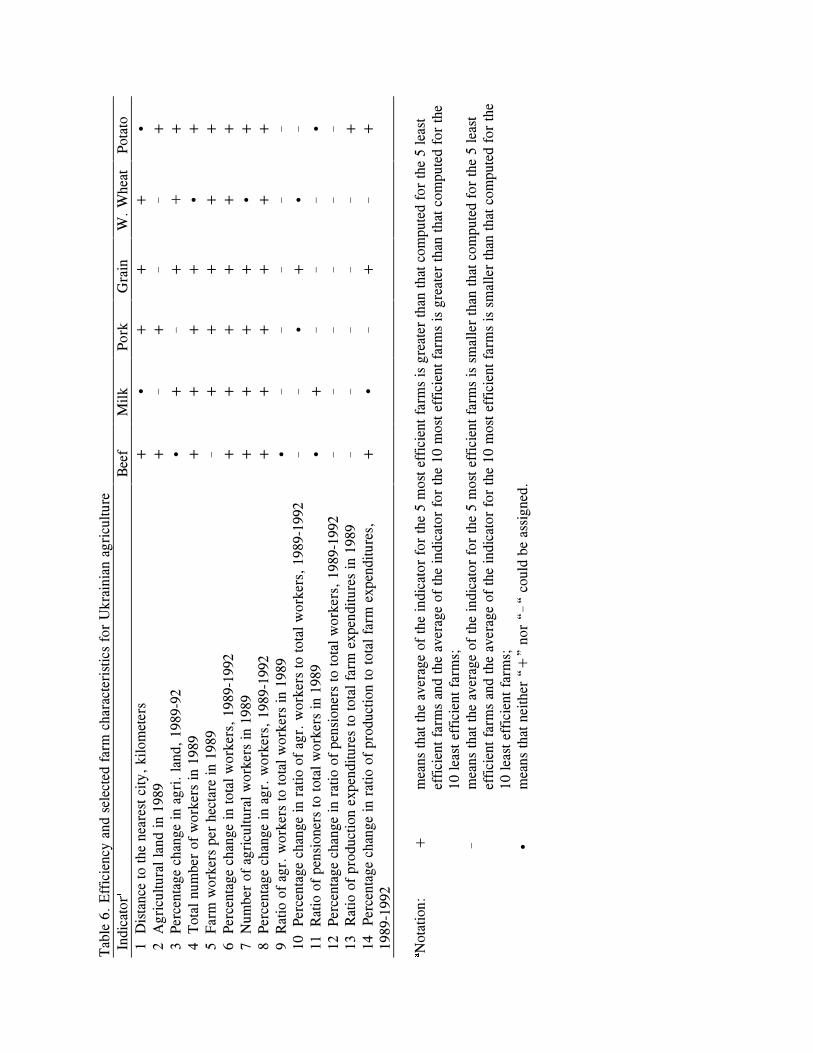
Analysis of the “Tails” of the Efficiency Distribution
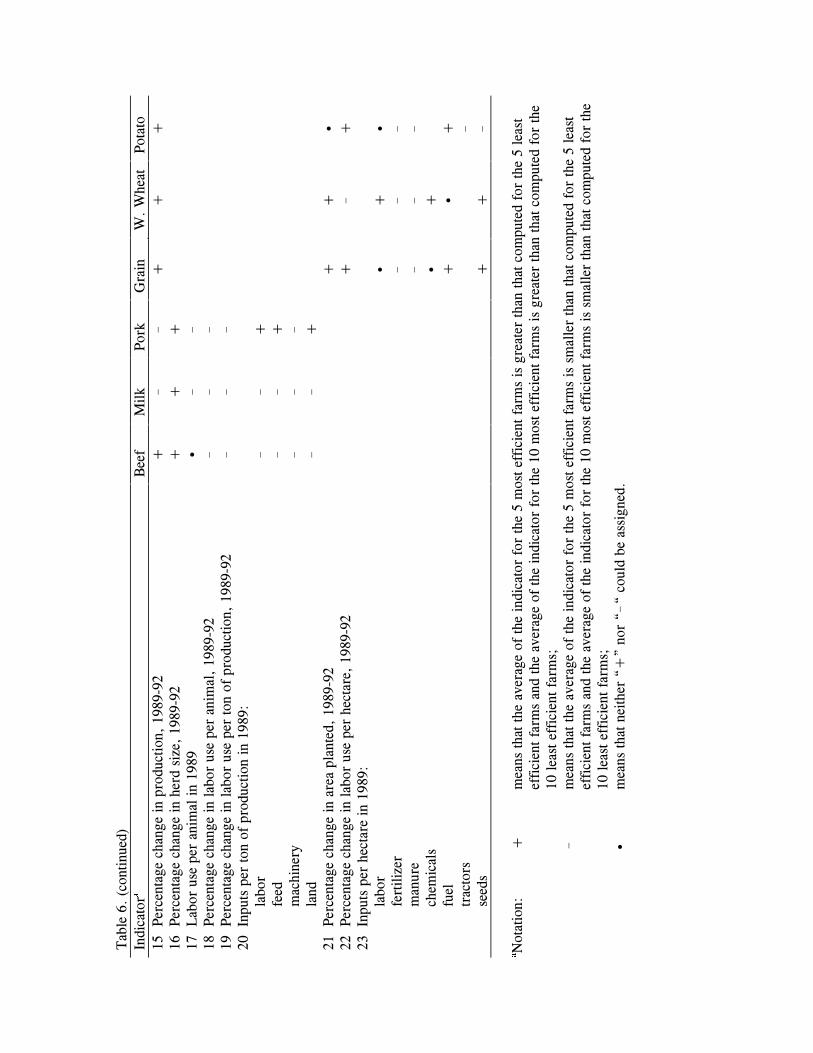
The analysis of the “tails” is summarized in Table 6 for the five and ten most efficient
farms and the five and ten least efficient farms. For all the types of production analyzed, the more
efficient farms were larger in terms of the total number of workers and the number of agricultural
workers. Though no relationship between the total agricultural land and relative technical
efficiency could be seen, the more efficient farms were relatively more abundant in labor resources
as the number of farm workers per hectare of agricultural land shows. These farms were better
able to hold their labor force, as well; the percentage decline in both the total number of workers
and the number of agricultural workers was smaller for the more efficient farms than for the less

��
��
efficient farms. Particularly in grain production, the total number of workers declined by 8 percent
and the number of agricultural workers declined by 3.8 percent for the five most efficient farms.
For the five least efficient farms, total workers declined by 18.6 percent and agricultural workers
by 16.6 percent.
The least efficient farms seemed to have a relatively large number of pensioners compared
with to the number of workers. This ratio, together with another similar characteristic, the ratio of
the number of pensioners to the number of agricultural workers, was negatively related to
efficiency. In sum, the more efficient farms were undergoing smaller changes over the four years
than the less efficient farms. In addition to the decline in workers, the percentage decline in
agricultural land seemed to be smaller, and the percentage increase in the ratio of pensioners to
total workers was smaller for the more efficient farms than that for the less efficient ones.
Analysis of the “tails” of the efficiency distribution also provides an explanation of how
the more efficient farms have managed to keep their working population better than the less
efficient farms. The more efficient farms had a lower share of agricultural workers in the total
number of workers. And, the ratio of production expenditures to total farm expenditures seems to
be smaller for the more efficient farms. What is included in nonproduction expenditures was not
defined, however; nor was there any information on the characteristics of the nonagricultural
workers. These numbers suggest, for example, that the more efficient farms spent more (of both
money and labor) on processing and marketing their production. Alternatively, the more efficient
farms may have provided more social services to the people living on the farms. In any case, the
more efficient farms provided some nonagricultural production jobs and in this way may have
retained working people on the farms. Another variable, the distance from the nearest city, is also
consistent with this explanation. The more efficient farms tend to be located farther from cities.
This advantage in location may have allowed the farms to compete better with cities for workers.
The positive relationship between the distance from a city and relative efficiency might
have another explanation as well. More energetic workers from rural communities located closer
to cities could commute to jobs in these cities, thus lowering the average skill/effort level of the
available agricultural labor on these farms. In addition, the farms located closer to cities had easier
access to the less productive (in agricultural tasks) city workers and students recruited for harvest

��
�
time. In this way, relative efficiency would be related to the distance to city through its effect not
only on the number, but also on the quality of the farm=s productive labor.
The more efficient farms remained more stable in production over the four years: they
experienced smaller percentage declines in area planted and production of crops, and smaller
percentage declines in herd size. The pattern of labor substitution for other inputs differed,
however, between crops and livestock. For livestock, both labor utilization per animal in 1989 and
the percentage increase in labor use per animal were smaller for the more efficient farms than for
the less efficient ones. Labor use per ton of production was smaller in beef and milk production
for the more efficient farms than that for the less efficient ones. Labor use per ton of production
grew for both categories of farms, but grew less rapidly for the more efficient farms. These results
suggest that in livestock production, the more efficient farms exercised relatively more capital-
intensive input use as opposed to the relatively more labor intensive input mixes of the less
efficient farms.
For crops, however, the pattern of comparative input use between less and more efficient
farms differed from that of livestock. In wheat production, high labor utilization per hectare
seemed to be positively related to technical efficiency. In addition, in grain and potato production,
the percentage increase in labor utilization per hectare was higher for the more efficient farms than
that for the less efficient farms.
Use of other inputs can be compared for specific products. For beef, the comparative
analysis shows that the more efficient farms had herds two times larger in size and over the four
year period cut their herd size less than the less efficient farms. Feed use did not vary much across
the farms. The more efficient farms used less machinery, had more land under feed in total, but
used less land per ton of production.
In milk production, the pattern of input use is similar to that for beef: the least efficient
farms used on average twice as much machinery and land and about 1.4 times more feed per ton
produced than the five most efficient farms. Farms did not differ much in average herd size.
The comparison of “tails” in pork production suggests that the more efficient farms were
much larger; they had herd sizes more than four times as large as those of the less efficient farms.
The pattern of input use differed significantly between the more and less efficient farms. The
major difference was in labor use: both types of farms used approximately the same labor per ton
��
��
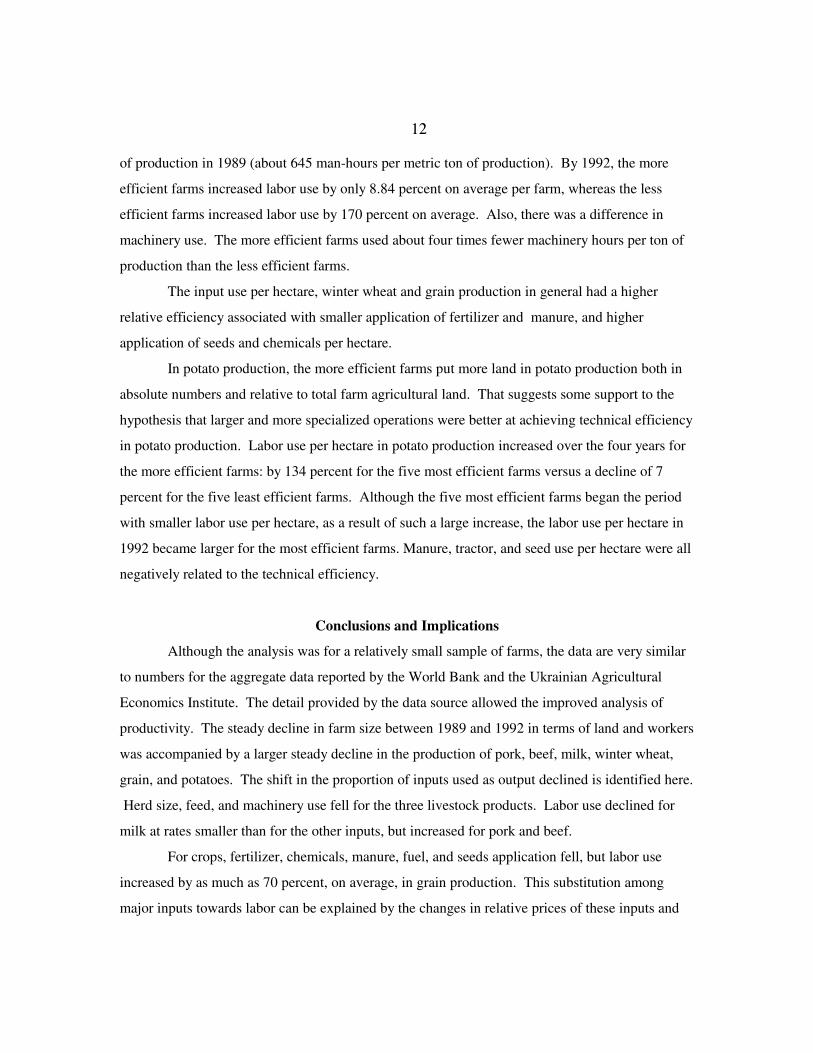
of production in 1989 (about 645 man-hours per metric ton of production). By 1992, the more
efficient farms increased labor use by only 8.84 percent on average per farm, whereas the less
efficient farms increased labor use by 170 percent on average. Also, there was a difference in
machinery use. The more efficient farms used about four times fewer machinery hours per ton of
production than the less efficient farms.
The input use per hectare, winter wheat and grain production in general had a higher
relative efficiency associated with smaller application of fertilizer and manure, and higher
application of seeds and chemicals per hectare.
In potato production, the more efficient farms put more land in potato production both in
absolute numbers and relative to total farm agricultural land. That suggests some support to the
hypothesis that larger and more specialized operations were better at achieving technical efficiency
in potato production. Labor use per hectare in potato production increased over the four years for
the more efficient farms: by 134 percent for the five most efficient farms versus a decline of 7
percent for the five least efficient farms. Although the five most efficient farms began the period
with smaller labor use per hectare, as a result of such a large increase, the labor use per hectare in
1992 became larger for the most efficient farms. Manure, tractor, and seed use per hectare were all
negatively related to the technical efficiency.
Conclusions and Implications
Although the analysis was for a relatively small sample of farms, the data are very similar
to numbers for the aggregate data reported by the World Bank and the Ukrainian Agricultural
Economics Institute. The detail provided by the data source allowed the improved analysis of
productivity. The steady decline in farm size between 1989 and 1992 in terms of land and workers
was accompanied by a larger steady decline in the production of pork, beef, milk, winter wheat,
grain, and potatoes. The shift in the proportion of inputs used as output declined is identified here.
Herd size, feed, and machinery use fell for the three livestock products. Labor use declined for
milk at rates smaller than for the other inputs, but increased for pork and beef.
For crops, fertilizer, chemicals, manure, fuel, and seeds application fell, but labor use
increased by as much as 70 percent, on average, in grain production. This substitution among
major inputs towards labor can be explained by the changes in relative prices of these inputs and

��
��
the relative abundance of labor inputs throughout the period. Although the estimated frontier
production functions are characterized by especially low marginal contribution of labor inputs, the
marginal cost of labor to the farm/firm may have been very low (or near zero) in this period.
Average efficiency declined over the period for beef and milk (and for pork, in 1992). In
livestock production the most efficient farms used relatively less labor and machinery, and tended
to substitute feed and machinery inputs for labor to a lesser extent than was done by the less
efficient farms. In crop production the average efficiency remained stable over the period. In
winter wheat and grain production, the more efficient farms applied relatively less fertilizer,
manure, and more seeds and chemicals. In potato production, the more efficient farms specialized
in potato production and increased labor use over the four years relatively more than the less
efficient farms.
We found that relative efficiency rankings of the farms in different products were in
general positively correlated. And relative technical efficiency seems to be positively related to the
success of the farms in keeping their productive labor on the farms. The more efficient farms lost
fewer workers over the four years, just as they had in the past. One possible way the farms keep
young people from leaving is through the development and provision of nonagricultural jobs on
the farms. There is some evidence that the more efficient farms were located farther from
alternative sources of employment. Whether age and experience of the farm manager affect
relative efficiency is something to be investigated further.
Ukraine=s economic and political environment are still very much in transition, although
the rate of change in input prices appears to be slowing. The results of the analysis of technical
efficiency in selected major agricultural products indicate that the efficiency in livestock,
especially, has fallen during the period and is quite low. At the same time, the more efficient
farms show an ability to substitute among available inputs to achieve their relatively higher level
of output. Also, the more efficient farms seem to better utililize labor, both in agricultural and
nonagricultural activities.
Except for potato production, there is no strong evidence that specialization will improve
productivity in the agricultural sector. In fact, evidence that more efficient farms are efficient in all
of their productive activities suggests that other factors, such as the availability and access to
inputs, distribution channels for output, organization of nonagricultural activities, including

��
��
processing activities, or managerial skill, would contribute to improved productivity in the
agricultural sector. The development of infrastructure to support improved distribution and
availability of inputs is likely to be important to achieving improved efficiency. This would
include investment in roads, processing and distribution services, and continued development of
value adding activities on the farms.

� Tab
le 1
. G
ener
al f
arm
leve
l ind
icat
orsa
Indi
cato
r
Uni
ts o
f M
easu
rem
ent
Num
ber
of
Far
ms
1989
1990
1991
1992
%
cha
nge
1989
-92
Dis
tanc
e to
city
km
49
37.9
(1
8.23
)
Age
of
man
ager
year
s
49
46
.49
(8.2
6)
Exp
erie
nce
of m
anag
er
ye
ars
48
25.0
8 (7
.6)
Agr
icul
tura
l lan
d
hect
ares
49
24
70.7
3 (9
27.7
3)
24
23.6
5 (9
09.3
)
23
11.8
8 (8
31.1
1)
22
37.9
9 (7
99.5
4)
-8
.54
(9.5
) T
otal
far
m w
orke
rs
nu
mbe
r
49
39
9.31
(1
30.1
)
39
0.12
(1
27.9
6)
37
1.88
(1
23.8
7)
34
7.98
(1
24.7
9)
-1
2.86
(9
.85)
A
gric
ultu
ral w
orke
rs
nu
mbe
r
49
34
2.24
(1
08.3
)
32
9.69
(1
06.9
5)
31
6.96
(1
05.6
8)
30
1.45
(1
05.3
3)
-1
1.41
(1
2.59
) R
atio
of
agri
cultu
ral w
orke
rs to
tota
l far
m w
orke
rs
nu
mbe
r
48
0.
854
(0.0
5)
0.
847
(0.0
5)
0.
854
(0.0
5)
0.
869
(0.0
5)
1.
96
(6.2
5)
Agr
icul
tura
l lan
d pe
r ag
ricu
ltura
l wor
ker
he
ctar
es
49
7.33
2 (1
.78)
7.
458
(1.8
1)
7.
374
(1.5
1)
7.
568
(1.6
7)
4.
81
(15.
82)
Sha
re o
f ag
ricu
ltura
l lan
d un
der
grai
ns
nu
mbe
r
44
0.
478
(0.0
5)
0.
478
(0.0
6)
0.
481
(0.0
5)
0.
460
(0.0
6)
-3
.45
(9.9
5)
Pen
sion
ers
nu
mbe
r
49
38
1.27
(1
45.5
3)
38
2.31
(1
47.4
1)
38
7.49
(1
52.2
9)
39
0.24
(1
51.7
7)
2.
58
(10.
68)
Rat
io o
f pe
nsio
ners
to to
tal f
arm
wor
kers
num
ber
49
0.96
4 (0
.22)
0.
989
(0.2
4)
1.
048
(0.2
5)
1.
141
(0.3
0)
19
.02
(17.
62)
Rat
io o
f pe
nsio
ners
to a
gric
ultu
ral w
orke
rs
nu
mbe
r
49
1.
127
(0.2
7)
1.
168
(0.2
7)
1.
231
(0.3
0)
1.
312
(0.3
3)
17
.92
(20.
20)
Rat
io o
f pr
oduc
tion
expe
nditu
res
to to
tal f
arm
ex
pend
iture
s
nu
mbe
r
45
0.
938
(0.0
6)
0.
939
(0.2
1)
0.
898
(0.1
1)
0.
792
(0.1
6)
-1
5.12
(1
9.33
) a A
ll th
e in
dica
tors
rep
orte
d ar
e av
erag
e pe
r fa
rm, t
he n
umbe
rs in
par
enth
eses
are
the
stan
dard
dev
iatio
ns
Sou
rce:
UIA
E S
urve
y of
Ukr
aini
an f
arm
s
� � � �������� ����������������������������
����������
��!��
��� ����
D�
� � " ��� ����
� �
��
� �
��
#��$ %��
�
���
�&����� �'�
� �
��
� �
��
#��$ %��
�
���
�&����� �'�
� �
��
� �
��
#��$ %��
�
���
&����� �'�
�(��)�
*���
�+�
���
+���
�����
�&��
�'�
������
����
������
�����
������
������
�����
�����
�������
,������-��
���
�������
�����
������
������
�����
������
�����
������
. ����&�����
�$��
��'�
������
������
���
����
����
������
������
�����
�����
�����&�
�������� �'�
������
�����
�����
��������
�������
�������
������
������
������
* �$� ��!�&$�
���'�
������
������
�����
������
�������
�����
������
�������
������
. ��&$��� ���'�
�����
�������
������
������
������
������
������
���
�����
��
��
��
��
��
" �����
���������
��)�
����
�����
��
��
��
��
��
. ����&� �$�����������
'E�
�����
���
���
���
���
����
���
���
���
����
��
�����
����
������&�� �������� '
F�
����
��
��
����
����
�����
��
����
����
����
* �$� ��!�&$����������� '�
��
����
����
����
�����
��
���
���
����
����
�. ��$��� ����������
'�
���
�����
���
����
����
�����
���
����
����
�����
���
���
� D��$�� ��
�����)�) ����/ ������0�����)��������/$��$�/
�����)����$����
�����1
����$��� ��� �������������� ��� ��� %������) ��
��E���$
���%
�� ���
�� �����/�������2����2� ������ �$��
���������
��)������
���� �� �����2����)2� �
�����
������
���� ����������
��!���
,�/
����2��$��� � ��
��$�������!������)� ��� ����������
��������� ���������������
� �2��������� ����������� ��� ������
�#��)��$����� �����$����$��
���$ ���%�� ���
�� �����)����$����������
���� ������2���2� �
����� �$��
���������
��)������
���� �� �����2����)2� �
�����
������
���� �
���������
��!���3������� ��������
����������������!
�� ���������� ��)��$
��������������� ���
����� !��
������� ����������
���$������ ���� ����������
���$� ��� �$� ��!���� ��2���������� ��)�)���2������
F����$
���%
�� ���
�� �����/������2����2� �
������� ��������
� ��� ���
��2����)2� ������
������
���� �&4
"152��'��
6�����7��4
"15�6����!��)�4
�� � � �) �����
� � � � � � �
� � � �������� �����������������������
����������
��!��
��� ����
D�
� � " ��� ����
� �
��
� �
��
#��$ %��
�
���
&����� �'�
� �
��
� �
��
#��$ %��
�
���
�&����� �'�
� �
��
� �
��
#��$ %��
�
���
�&����� �'�
�8� � �
9� ����9$� ��
+�� �����
:�����&�� ������$��� ��'�
����
���
������
����
����
�����
����
����
�����
+���
�����
�&��
�'�
������
������
�����
�������
������
�����
����
����
������
. ��&$��� ���'�
����
������
����
�����
������
�����
����
����
����
. ����&�����
�$��
��'�
������
������
�����
�����
�����
�����
�����
����
���
�������-���&�� �'�
�����
����
������
�����
�����
������
����
�����
�����
* ����&��
�'�
��
�����
������
����
�����
������
���
���
������
;$���� ���&����
%� �
�'�
�����
����
������
�������
�������
�����
������
����
�����
�����&����������'�
����
�����
����
������
������
�����
����
����
�����
6�����&��
�'�
������
�����
�����
����
����
�����
�����
�����
�����
��
��
��
��
��
" �����
�������$��� ��7�
��
��
��
��
�. ����&� �$���������
$��� ��'
E�
�����
�����
���
�����
�����
�����
�����
�����
�����
�������-���&����%� �
������
$��� ��'
F�
������
�����
������
������
�����
������
������
�����
������
* ����&�� ������$��� ��'
G�
����
����
������
����
�����
������
���
����
�����
;$���� ���&����
%� �
������
$��� ��'
H�
����
����
����
����
����
�����
��
�
�� �����&$���������$��� ��'�
��
��
��
���
����
����
�����&�����������$��� ��'
I �
���
�����
�����
����
�����
�����
�����
�����
�����
6�����&�� ������$��� ��'�
����
����
�����
����
����
�����
����
����
�����
� D�$�� ��
�����)�) ����/ �����)���/$� �2��
�)���%� � 2� ����
�)������ ������������
���1����$��� ��� �������������� ��� ��� %������) ��
��E���$
���%
�� ���
�� �����)���� ��
������/��������
�$��
�������$��� ���)���/
� ����/$� �2������ �$��
�������$��� ���)������ ������
F���$
���%
�� ���
�� �����)���)������-���/��������%
<$��� ���)���/
� ����/$� �2�����%
<$��� ���)������ ������
G���$ ���%�� ���
�� �����)���� ����/�����
��� �<$��� ���)���/
� ����/$� �2���
��� �<$��� ���)������ ������
H���$ ���%�� ���
�� ����)����$���� ���/ ������
��%<$��� ���)���/� ����/$� ���
I ���$
���%
�� ���
�� �����)���)����/
������������<$��� ���)���/
� ����/$� �2�����������<$��� ���)�����
� ������
6�����7��4
"15�6����!��)�4
�� � � �) �����

�
�� �������6���$ �����)�� ����� �!�����)�������������������� 2�) ���������� ���� � 2�4�� � �2���� (��) *��� +��� 5���� �������))���� ��7� � � ���" ������� ����� ����� ���� ��,������-� ����� ���� ����� ��. ��� � � ���� ��* �$� ��! ����� ����� ����� ��. � ��� ����� � ������ ��� ���� ���� ���������� � ������ ����� ������ µ ���� ����� ��� η ������� ����� ���� γ ����� ������ �����*� ����$ �� ���))���� �!7� � � ���� ����� ����� ����� ��� ������ ����� ������ �� ���� ������ ����� ��� ����� ���� ������ *� ������ � %���$ %���)����$ �� ���))���� �! ���� ����� ���� =�������)�) ����� ��$��� �������!� � �� �� �� ������� ��������6���$ �����)�� ����� �!�����)��������������� 2�) ���������� ���� � 2�4�� � �2������ 8� � �� 9��9$� �� +�� ���5���� �������))���� ��7� � � ���" �������� ������� ������ ������. ���� ������ ����QV� ��QV���. �� ��� ������ ������* ���� ���� ���� ����QV���;$���� ��� ����� ����� ��������� ������ ������ ������ ������ �� �� ����QV����������� �� ����� ����� ������γ� ������ ������ ������*� ����$ �� ���))���� �!� ������ ����� ������=�������)�) ����� ��$��� �������!� �� �� ��� �����
� � �������5))���� �!� �����������) ����$ � �����������)���4�� � � � %����������
" ��� ���D
�(��)�
*���
�+�
���
8� � �
9��9$� ��
+�� ���
��3
��� �������$
�� � ������
��!2������������
��
����
��
��
�����1
%�������� ��� ��� ���
��
��
��
��
��
��
���+���� � %���$ %���
� %�����
�2�����
����
��
��
>�
��
������ �� ��
�����)�/
��������
���
��
��
��
��
����
���� ���/
�����������$��� ����
���
��
��
��
��
��
��
���+���� � %���$ %���
���� ��/
������2�����
��
��
��
��
��
��
���=
�������)� %�������� ��/
��������
���
��
��
��
��
����
���+���� � %���$ %���
� %���/������2�����
��
��
��
��
��
��
��? �����)� %���/
���������
���� ��/
��������
���
����
��
��
��
��
���+�
��� � %���$ %
��� �� �����)� %���/
���������
���� ��/
������2�����
��
��
����
����
��? �����)��� ��� ������
���� ��/
��������
���
����
��
��
��
�����+�
��� � %���$ %
��� �� �����)��� ��� ������
���� ��/
������2�����
��
��
��
��
��
��
��? �����)�����
�����
��0�� �
������������
� ��) ����0�
� ��������� ���
��
��
��
��
��
��
��+���� � %���$ %��� �� �����)����������
������
� ��) ����0�� �������2�
�
�
����
����
��
��
��
� D
=�� ��� 7�
>�
�� ���$
���$
�� ��� %���)��$
��� ��� ����)����$����������
))���� ��) �������%�� �����$
��$
�����
������)����$������ ���
�))���� ��) ���� ���$�� ��� %���)��$
��� ��� ����)����$���
�������
))���� ��) �������%�� �����$
��$
�����
������)����$��
����
����
))���� ��) ���@�
��
��
�� ���$
���$
�� ��� %���)��$
��� ��� ����)����$����������
))���� ��) ��������� ������$ ��$
�����
������)����$������ ���
�))���� ��) ���� ���$�� ��� %���)��$
��� ��� ����)����$���
�������
))���� ��) ��������� ������$ ��$
�����
������)����$��
����
����
))���� ��) ���@�
��
���� ���$
�� ���$���A>B� ���A�
A���������� ���% ����
� � � �������&�� ��
���'�
��
��
��
" ��� ���D
�(��)�
*���
�+�
���
8� � �
9��9$� ��
+�� ���
���+�
��� � %���$ %
��� ������
���� 2�����
>�
��
��
>�
>�
>�
���+�
��� � %���$ %
��� �$������-�2�����
>�
>�
>�
��
����. ������������ �� ���
���
����
��
��
����+�
��� � %���$ %
��� ��
������������ ��
�2�����
��
��
��
��
���+�
��� � %���$ %
��� ��
�������������� ��)������
���� 2�����
��
��
��
��
�����" ��
���������
��)������
���� �� ��7�
��
��
��
����������� ����
��
��
>�
��
�����������)����
��
��
>�
��
������������ �$� ��!�
��
��
��
��
������������ ��
��
��
>�
��
����+�
��� � %���$ %
��� � �� ��� ���2�����
��
�>�
>�
������+�
��� � %���$ %
��� ��
������������$��� ��2�����
��
�>�
��
>�
����" ��
�������$��� ����
��7�
��
��
��
����������� ����
��
���
>�
������������)������-���
��
���
��
��
����������� ����
��
���
��
��
�����������$��
�� ���
��
���
>�
�����������)����
��
�>�
��>�
������������ ������
��
��
���
����������������
��
�>�
>�
��
� D
=�� ��� 7�
>�
�� ���$
���$
�� ��� %���)��$
��� ��� ����)����$����������
))���� ��) �������%�� �����$
��$
�����
������)����$������ ���
�))���� ��) ���� ���$�� ��� %���)��$
��� ��� ����)����$���
�������
))���� ��) �������%�� �����$
��$
�����
������)����$��
����
����
))���� ��) ���@�
��
��
�� ���$
���$
�� ��� %���)��$
��� ��� ����)����$����������
))���� ��) ��������� ������$ ��$
�����
������)����$������ ���
�))���� ��) ���� ���$�� ��� %���)��$
��� ��� ����)����$���
�������
))���� ��) ��������� ������$ ��$
�����
������)����$��
����
����
))���� ��) ���@�
��
���� ���$
�� ���$���A>B� ���A�
A���������� ���% ����
��� ENDNOTES
�� �������)� ���������������� �� �������)� ��� ��� ��� ����)������������������������������ �� �������)� ��� ��� ��� ����%� � ���
��� ������� ������������ 2�����������������$ ��������� %�������� �� ���������������$ ����� ���� ����$��� � �)���� ������ �)����!� ������) ����������0 ����2�� ����������)�����$������������� !�$ ������ �/����� ��))��$���%$��$��/� ����/$� �� ���� ����� �����)��$�����)�������� �����)�/$� ����������� �� ��$���� �� ��!��� ������ ��!��(!��$��� ����� �� � %2�$�%$��� ��� �������)�� �������$����$ �� ����� ���� ������������ ���%$����� ����$�/ �� ��$��� � ���
�� REFERENCES Battese, George E., and T.J.Coelli. “Frontier Production Functions, Technical Efficiency and Panel Data:
With Application to Paddy Farmers in India.” Journal of Productivity Analysis 3(1992):153-69. Battese, George. “Frontier Production Functions and Technical Efficiency: A Survey of Empirical
Applications in Agricultural Economics.” Agricultural Economics 7(1992):185-208. Bauer, Paul W. “Recent Developments in the Econometric Estimation of Frontiers.” Journal of
Econometrics 46(1990):39-56. Brada, Josef C. and Arthur E. King. “Can Improvements in Technical and Allocative Efficiency Ease the
Transition to Capitalism? Evidence from Polish Agriculture.” Unpublished paper. 1992. Bravo-Ureta, B.E. and A.E. Pinheiro. “Efficiency Analysis of Developing Country Agriculture: A
Review of the Frontier Function Literature.” Agricultural Resource Economics Review 22(1993):88-101.
Brock, Gregory T. “Agricultural Productivity in Volgograd Province.” Comparative Economic Studies
36(1994)1: 33-53. Coelli, T.J. “A Computer Program for Frontier Production Function Estimation: FRONTIER Version
2.0” Economic Letters 39(1992):29-32.. _______________. ARecent Developments in Frontier Modelling and Efficiency Measurement.”
Australian Journal of Agricultural Economics 39(1995)3:219-245. Csáki, Csaba. AAgricultural Changes in Eastern Europe at the Beginning of the 1990s.” American
Journal of Agricultural Economics 72(1990):1233-42. Economic Research Service (ERS), U.S. Department of Agriculture. Economic Transition - Agricultural
Report. Vol. V., No. 4. July/August, 1992. Johnson, D.G., and K.M. Brooks. Prospects for Soviet Agriculture in the 1980s. Bloomington, Indiana:
Indiana University Press, 1983. Johnson, S.R., A. Bouzaher, A. Carriquiry, H. Jensen, and P.G. Lakshminarayan. “Production Efficiency
and Agricultural Reform in Ukraine.” American Journal of Agricutural Economics 76(1994):629-635.

��Koopman, R.B. “Efficiency and Growth in Agriculture: A Comparative Study of the Soviet Union,
United States, Canada, and Finland.” Agricultural and Trade Analysis Division, Economic Research Service, USDA Staff Report No. AGES 89-54, 1989.
Maddala, G.S. “A Note on the Form of the Production Function and Productivity.” In Measurement and
Interpretation of Productivity, pp. 309-17. National Research Council. Washington, D.C.: National Academy of Sciences, 1979.
Skold, Karl D. and Victor N. Popov. “Technical Efficiency in Crop Production: An Application to the
Stavropol Region, USSR.” Working Paper 90-WP 64, Center for Agricultural and Rural Development, Iowa State University, 1990.
Ukrainian Institute of Agrarian Economics (UIAE). Ukrainian Agriculture in 1992-Report. Kiev, UIAE,
1992 (in Ukrainian). Ukrainian Institute of Agrarian Economics (UIAE). Methodology of Production Cost and Agricultural
Output Prices Evaluation. Kiev, UIAE, 1994 (in Ukrainian). Ukrainian Institute of Agrarian Economics (UIAE). Description of the Survey and Instrument for the
Collection of Basic Information on Ukrainian Agricultural Enterprises. Mimeo. Kiev, UIAE, 1993 (in Russian).
World Bank (WB). Ukraine: The Agricultural Sector in Transition. World Bank, 1994. �